Embed Size (px)
Citation preview

1
“Sustained growth. Global scale.”March 2007

2
Table of contents
• The Tata Group - overview
• Tata Chemicals - Business overview
• Segment overview• Chemicals, including overview of Brunner Mond
• Fertilisers
• Financial overview

3
An overview of the Tata Group

4
Tata Group – India’s largest and the most respected business group
Chemicals and Fertilisers
Sales:5%
EngineeringSales:31%
EnergySales:8%
Consumer ProductsSales:6%
MaterialsSales:21%
IT and Communications
Sales:19%
ServicesSales:10%
Notes
1 Market cap (approx.) as on March 31, 2006
2 F.Y. 2006 financial data
Market cap1: US$49bn
Revenues2:
US$22bn
PAT2: US$2 billion

5
Tata ChemicalsBusiness Overview
6
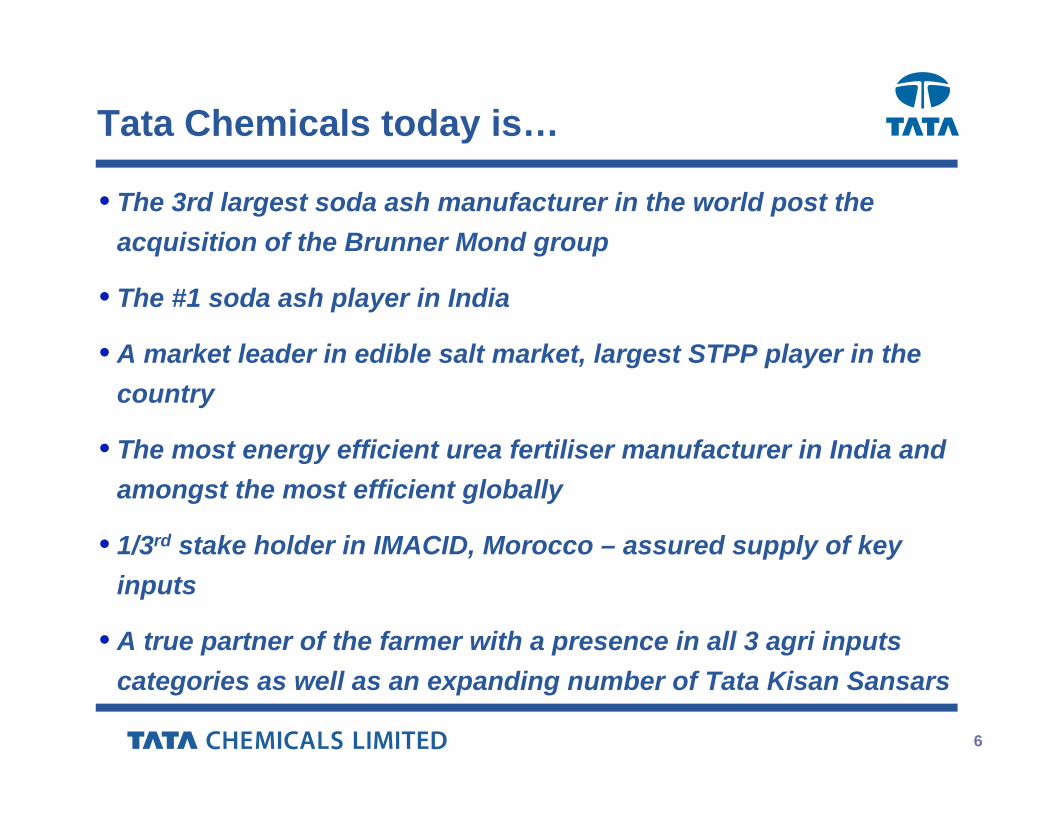
Tata Chemicals today is…
• The 3rd largest soda ash manufacturer in the world post the acquisition of the Brunner Mond group
• The #1 soda ash player in India
• A market leader in edible salt market, largest STPP player in the country
• The most energy efficient urea fertiliser manufacturer in India and amongst the most efficient globally
• 1/3rd stake holder in IMACID, Morocco – assured supply of key inputs
• A true partner of the farmer with a presence in all 3 agri inputs categories as well as an expanding number of Tata Kisan Sansars
7
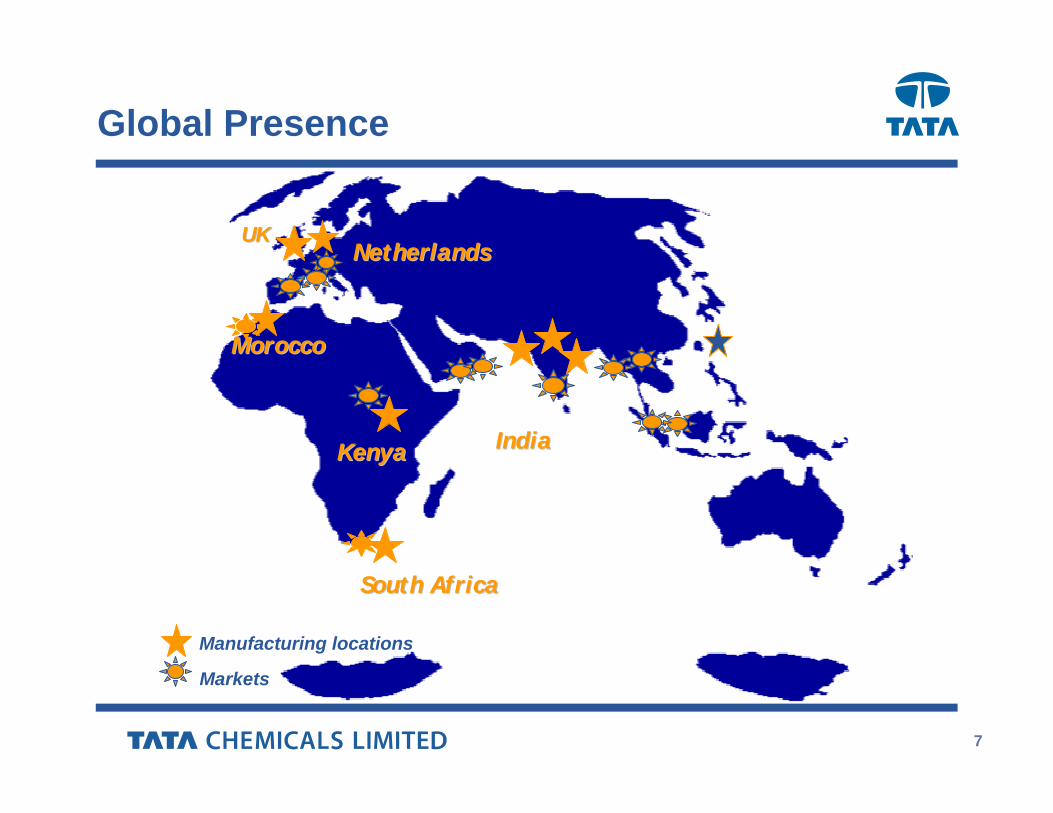
Global Presence
MoroccoMorocco
UKUK
IndiaIndiaKenyaKenya
NetherlandsNetherlands
Manufacturing locations
Markets
South Africa South Africa
8
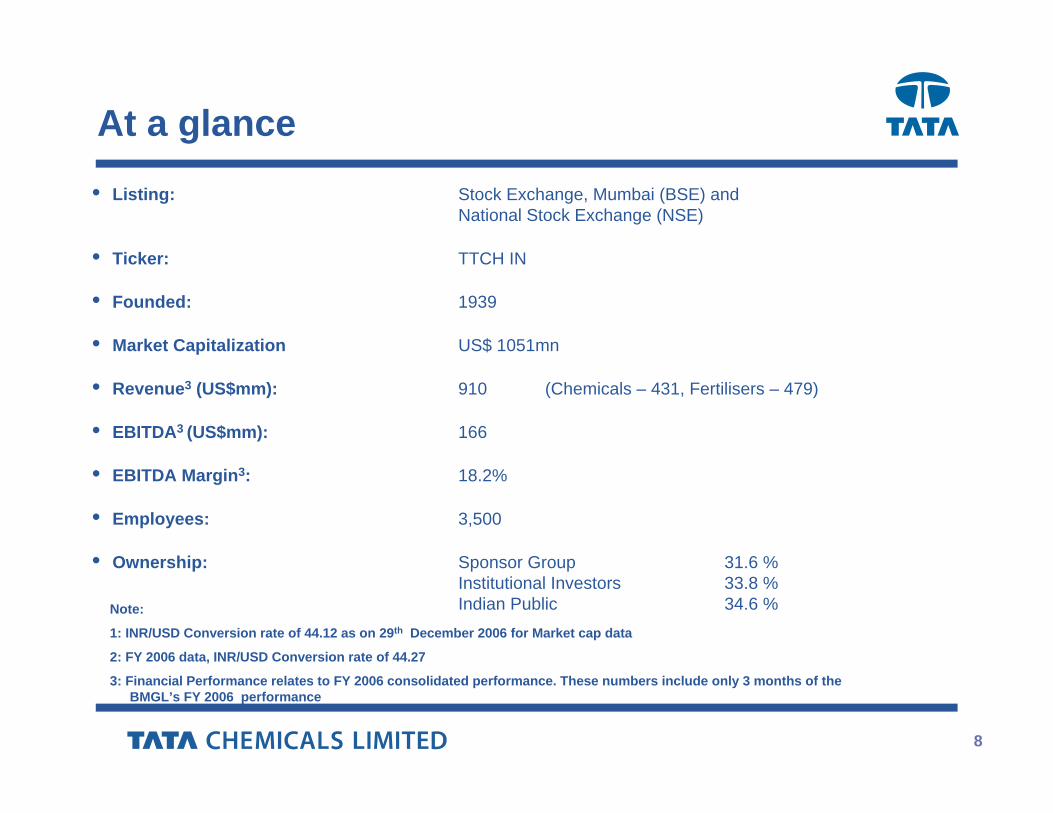
At a glance• Listing: Stock Exchange, Mumbai (BSE) and
National Stock Exchange (NSE)
• Ticker: TTCH IN
• Founded: 1939
• Market Capitalization US$ 1051mn
• Revenue3 (US$mm): 910 (Chemicals – 431, Fertilisers – 479)
• EBITDA3 (US$mm): 166
• EBITDA Margin3: 18.2%
• Employees: 3,500
• Ownership: Sponsor Group 31.6 %Institutional Investors 33.8 %Indian Public 34.6 %Note:
1: INR/USD Conversion rate of 44.12 as on 29th December 2006 for Market cap data
2: FY 2006 data, INR/USD Conversion rate of 44.27
3: Financial Performance relates to FY 2006 consolidated performance. These numbers include only 3 months of the BMGL’s FY 2006 performance

9
Business segments

10
Chemicals - Soda ashRevenue Mix
Chemicals – 54%

11
International Markets
• Global demand at 37 million mt, China - 21% of demand; to grow at 4%pa led by glass
• Synthetic production dominates – 73%
• Increasing natural gas, coal, coke prices & freight rates• Selling prices increasing after seven years of weak prices
Domestic Markets• Domestic demand 2.2 million mt growing at 4-5%
• Demand driven primarily by the float glass segment
• Synthetic soda ash accounts for 100% of domestic production
• Capacity utilisation levels at all-time high
Soda ash industry perspective
Source: British Sulphur Consultants
12
Overview of the Brunner Mond Group

13
Brunner Mond – a transformational acquisition
Major step towards becoming a truly globally competitive company
Resultant synergies will drive Tata Chemicals’ profitabilityResultant synergies will drive Tata Chemicals’ profitability
BMGL – 2nd largest producer in Europe ~1500 customers
Total Soda Ash production capacity ~2.0 mn tons with three plants
• (Before Brunner Mond, soda ash capacity: 0.87mn tons)
• Facilities now in Asia, Europe & Africa, close to high-growth markets
TCL combined turnover to go up ~40%
BMGL – 2nd largest producer in Europe ~1500 customers
Total Soda Ash production capacity ~2.0 mn tons with three plants
• (Before Brunner Mond, soda ash capacity: 0.87mn tons)
• Facilities now in Asia, Europe & Africa, close to high-growth markets
TCL combined turnover to go up ~40%
14
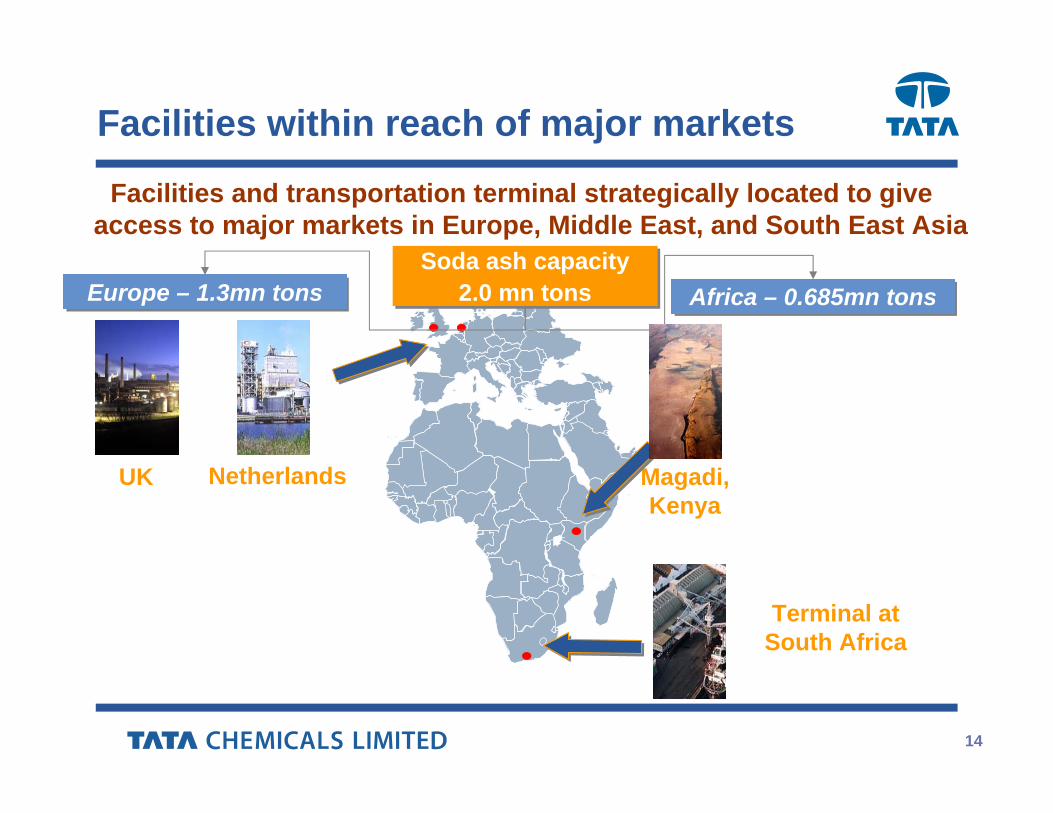
Facilities within reach of major markets
Europe – 1.3mn tons Europe – 1.3mn tons Africa – 0.685mn tons Africa – 0.685mn tons
UK Netherlands Magadi, Kenya
Terminal at South Africa
Soda ash capacity 2.0 mn tons
Soda ash capacity 2.0 mn tons
Facilities and transportation terminal strategically located to give access to major markets in Europe, Middle East, and South East Asia

15
Competitive advantages of Magadi Soda Ash
• Magadi has unique competitive advantages
Close to key growth markets e.g. Middle East and Asia
Self-replenishing proven trona reserve - life of 100 years
Duration - Lease extended for 30 years – upto 2053
Area – 227,000 acres
• Significant cost savings for producing natural soda ash
The use of trona makes Magadi Soda Ash lowest cost producer in the world
Cost of prodn of natural soda ash ~ 50% of synthetic soda ash

16
MIDDLE EAST & AFRICA
OmanUAE
KenyaSouth Africa
NigeriaSaudi Arabia
Morocco
ASIA
IndiaBangladeshSri LankaIndonesiaThailandPakistan
PhilippinesVietnamMalaysia
EUROPE
UKNetherlands
GermanyFranceBelgiumSwedenIrelandNorwayDenmark
TCL-BMGL Combined Markets

17
Working with leading brands
Gujarat Glass
18
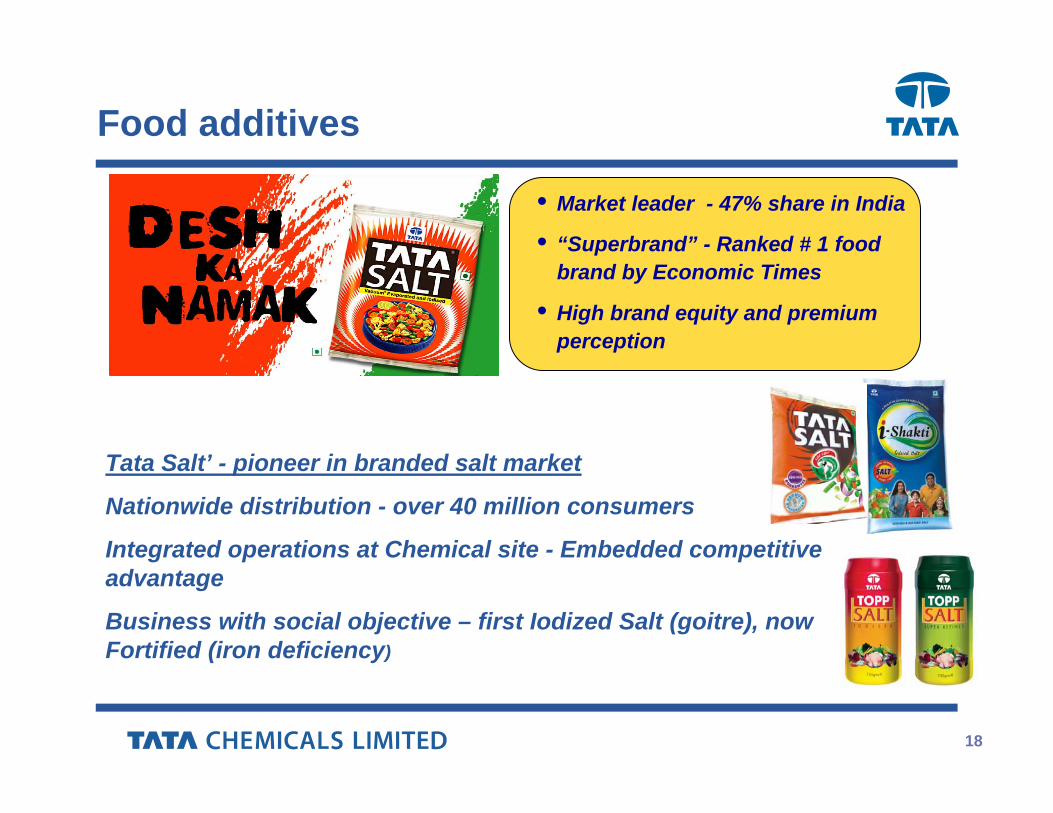
Food additives
• Market leader - 47% share in India
• “Superbrand” - Ranked # 1 food brand by Economic Times
• High brand equity and premium perception
Tata Salt’ - pioneer in branded salt market
Nationwide distribution - over 40 million consumers
Integrated operations at Chemical site - Embedded competitive advantage
Business with social objective – first Iodized Salt (goitre), now Fortified (iron deficiency)
19
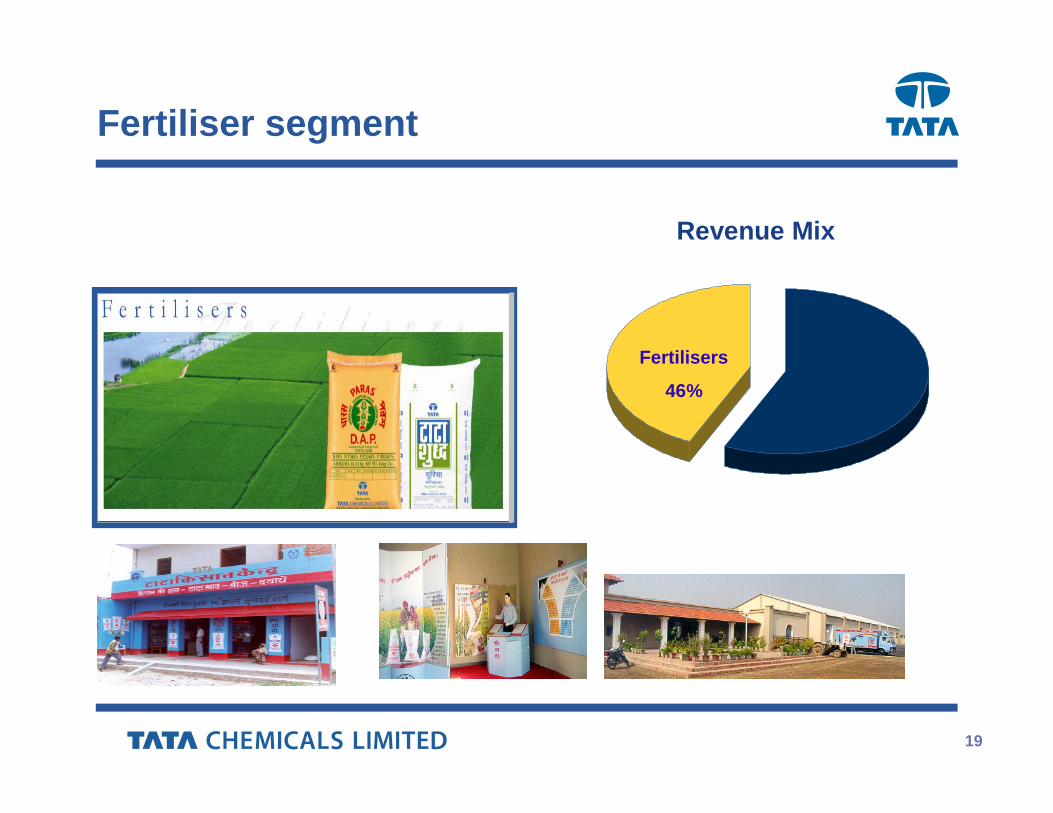
Fertiliser segment
Revenue Mix
Fertilisers
46%

20
The Indian Fertiliser sector
• Consumption skewed towards nitrogenous fertilisers: Urea constitutes 85% of nitrogenous fertiliser consumption and 58% of total consumption
• Recent gas finds create huge opportunity for urea business. Strong medium to long term outlook for DAP
India is the third largest producer and consumer of Fertilisers
Urea policy perspective
• Prices determined by Government
• Feed stock price a pass through• Equal playing field for efficient
and non efficient manufacturers
Phosphatic Policy perspective
• Feedstock prices based on average international prices
• Price announcements often delayed by Government
• Delay in settlement of raw material prices

21
• Leading player in urea and phosphatic fertiliser segments
• Dual feedstock Babrala facility - most efficient in India
• Strategic stake in IMACID, Morocco ensures continuous availability of phosphoric acid
• Presence in high consumption north and east regions
Tata Chemicals’ Fertiliser business
Source of stable revenues in a pre-dominantly government-controlled environment
Baroda(Nikohead office)
INDIABaroda(Nikohead office)
INDIA
Punjab Haryana
Uttar Pradesh
W. Bengal
Jharkhand
Bihar
Baroda(Nikohead office)
INDIABaroda(Nikohead office)
INDIA
Punjab Haryana
Uttar Pradesh
Jharkhand
Bihar
• Tata Kisan Sansars, a one-stopshop for agricultural solutions

22
Tata Kisan Sansar

23
Tata Kisan Sansar (TKS) - creating rural entrepreneurship
• Provide value add services• Create a new distribution channel for agricultural inputs• Improve supply chain efficiencies and provide farm-gate
linkages.. NCDEX• Create market driven R&D solutions• Retailing of fresh agricultural produce – tie up with TOTAL
Produce, Europe’s largest fresh produce Company

24
Financial overview – Standalone*
*Pre Acquisition of the Brunner Mond Group

25
Facilities in India
Babrala - Urea
Haldia – DAP, NPKMithapur – Soda Ash, Cement, Salt
26
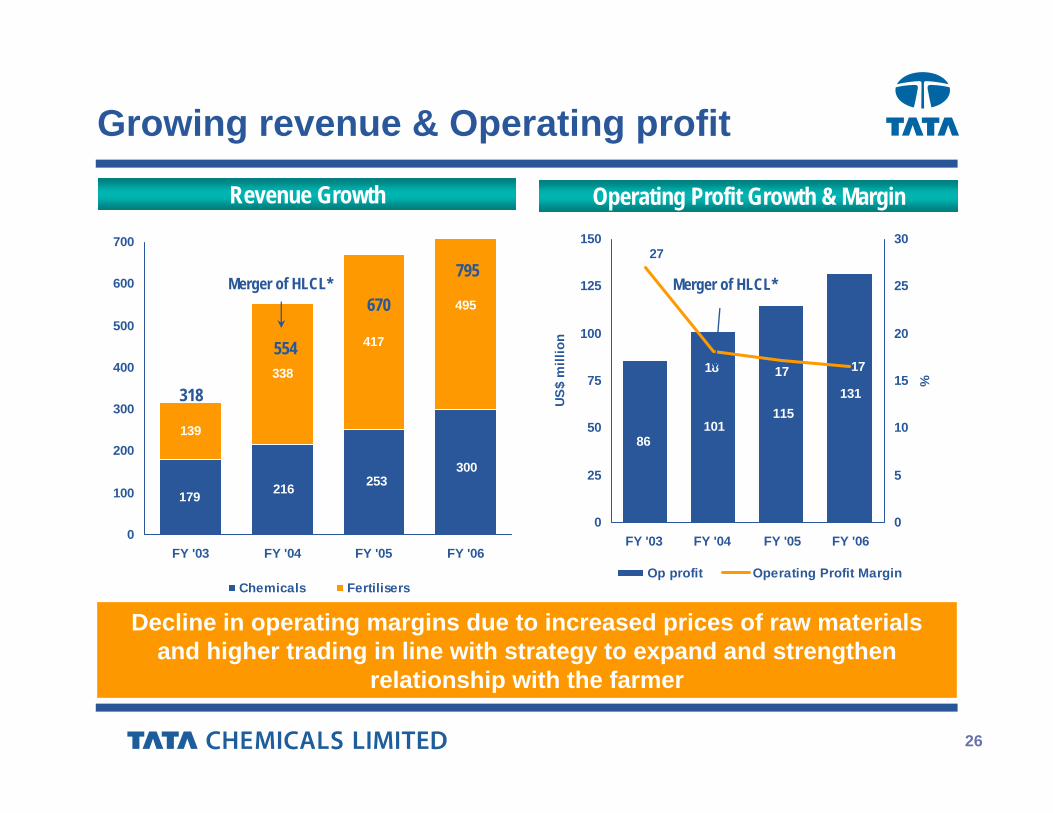
139
338
417
495
253300
179 216
0
100
200
300
400
500
600
700
FY '03 FY '04 FY '05 FY '06
Chemicals Fertilisers
Growing revenue & Operating profit
Revenue Growth Operating Profit Growth & Margin
318
554
670
795Merger of HLCL*
115131
86101
18
27
17 17
0
25
50
75
100
125
150
FY '03 FY '04 FY '05 FY '06US
$ m
illio
n
0
5
10
15
20
25
30
%
Op profit Operating Profit Margin
Merger of HLCL*
* Hind Lever Chemicals LtdDecline in operating margins due to increased prices of raw materials and higher trading in line with strategy to expand and strengthen
relationship with the farmer

27
Debt-Equity Perspective
4.54.4
7.9
9.7
11.7
0
2
4
6
8
10
12
14
FY 02 FY 03 FY 04 FY 05 FY 06
(%)
Reducing interest cost (%)
303 326
457 486
0
100
200
300
400
500
600
700
800
900
FY 2005 FY 2006
USD
mill
ion
Total Debt Shareholder's Equity
FY 2006 Debt Split 2%9%
44%45%
FCCBShort Term LoansTerm LoansCash/ Packing Credit
760 812
Debt : Equity at 0.66 : 1

28
Credit Ratios
3.9 7.4
56
19.4
0.2
0.30.570.36
0
10
20
30
40
50
60
FY03 FY04 FY05 FY06
Interest Coverage ratio Net Debt/Equity
29
Financial overview – Consolidated

30
TBEM 2006
Beyond Boundaries, Brunner Mond …
Babrala India
Haldia India
Morocco Africa
Mithapur India
Brunner Mond, UK –Soda Ash
Brunner Mond, Netherlands – Soda
Ash, Bicarb

31
TBEM 2006Durban SABabrala India
Haldia India
Morocco Africa
Mithapur India
Brunner Mond, Kenya, Lake Magadi - Soda
Ash
Dredge on lake Magadi, Kenya
Brunner Mond …..

32
TBEM 2006Durban SABabrala India
Haldia India
Morocco Africa
Mithapur India
IMACID, Morocco
33
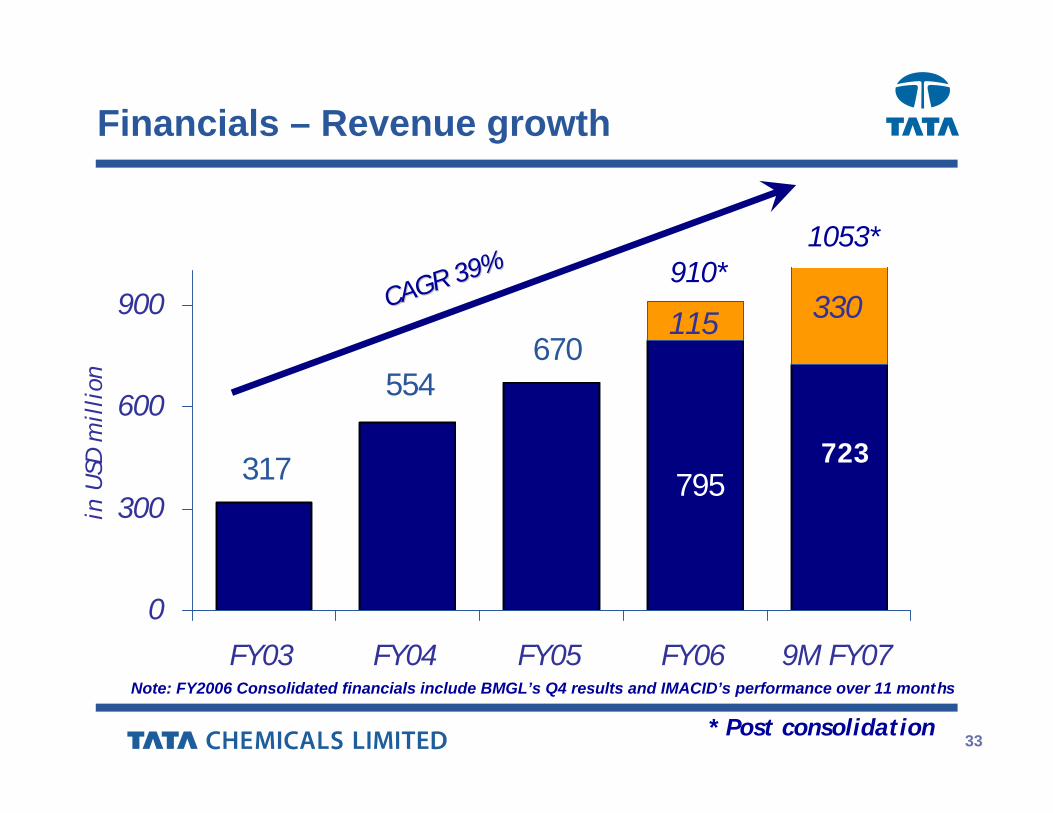
Financials – Revenue growth
330670
795723317
554
115
0
300
600
900
FY03 FY04 FY05 FY06 9M FY07
in U
SD m
illi
on
CAGR 39%CAGR 39% 910*
* Post consolidation
Note: FY2006 Consolidated financials include BMGL’s Q4 results and IMACID’s performance over 11 months
1053*
34
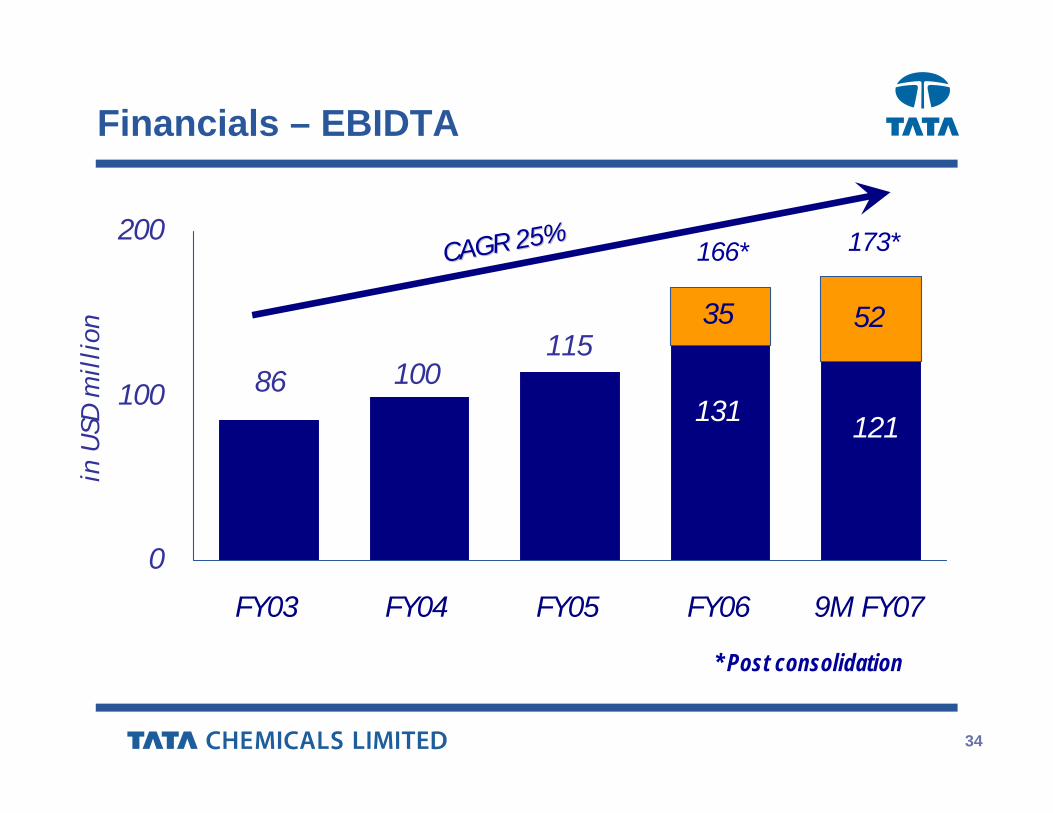
Financials – EBIDTA
52
10086
121131
11535
0
100
200
FY03 FY04 FY05 FY06 9M FY07
in U
SD m
illi
on
166*
* Post consolidation
CAGR 25%CAGR 25% 173*
35
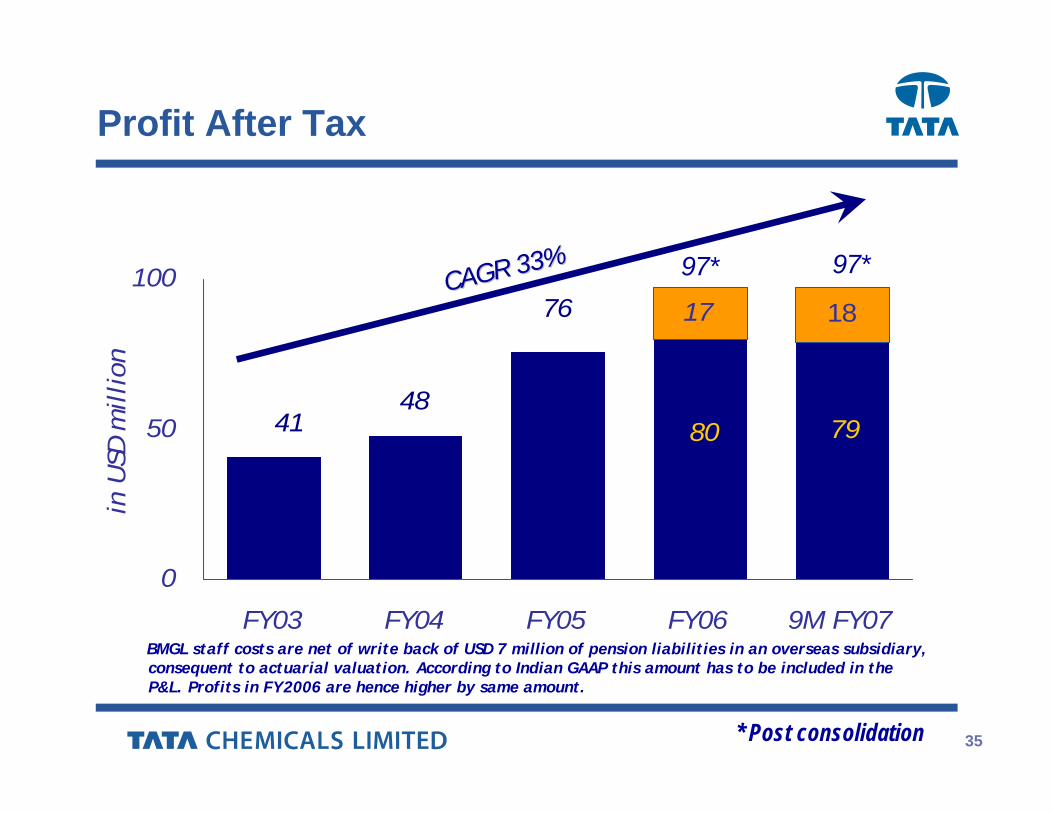
Profit After Tax
1776
80 794148
18
0
50
100
FY03 FY04 FY05 FY06 9M FY07
in U
SD m
illion
97*
* Post consolidation
BMGL staff costs are net of write back of USD 7 million of pension liabilities in an overseas subsidiary, consequent to actuarial valuation. According to Indian GAAP this amount has to be included in the P&L. Profits in FY2006 are hence higher by same amount.
CAGR 33%CAGR 33% 97*

36
Consolidated financials
1 After reducing provision of USD 58.7 mn for the deficit in BMG’s pension liability)
0.45
97
147
192
1035
Consolidated
33
53
330
IMACID / BMGL (Apr to Dec 06)
0.37
79
114
140
723
TCL
9M FY 2007**FY 2006
971680Net Income
0.440.37EPS
20
31
135
IMACID / BMGL (Jan to Mar 06)
125100EBIT
166131EBITDA
910795Sales
ConsolidatedTCL
** Exchange rate of $1=Rs.44.12 as on 29th December 2006

37
Financial ratios
* Post consolidation
7259No. of DaysCash cycle
6564No. of DaysAvg Inventory Turnover
6049No. of DaysAvg Debtors Velocity
2.21.9TimesFixed Asset Turnover
Activity
22.119.4TimesInterest Coverage
0.80.7TimesDebt : Equity Stability
121131115USD MillionEBITDA Cash Generation
21.5TimesMarket to Book Value
35%Dividend Yield
10393INRNetworth per Share
16.319.915.8INREarnings per share
Shareholder Returns
111111%Net Profit Margin
171817%EBITDA Margin Profitability
9M FY 2007*FY 2006*FY 2005UnitCategory

38
Shareholder Returns
7.0
10.9 10.3
19.915.8
5.06.5
5.55.5
7.0
4055
103
201
138
0
4
8
12
16
20
24
FY '02 FY '03 FY '04 FY '05 FY '06
Rs.
per
shar
e
20
40
60
80
100
120
140
160
180
200
220
240
Rs
EPS Dividend Average Market Price
Consistent and healthy dividend payoutConsistent and healthy dividend payout
*
* Post consolidation (Standalone EPS : Rs. 16.41)
39
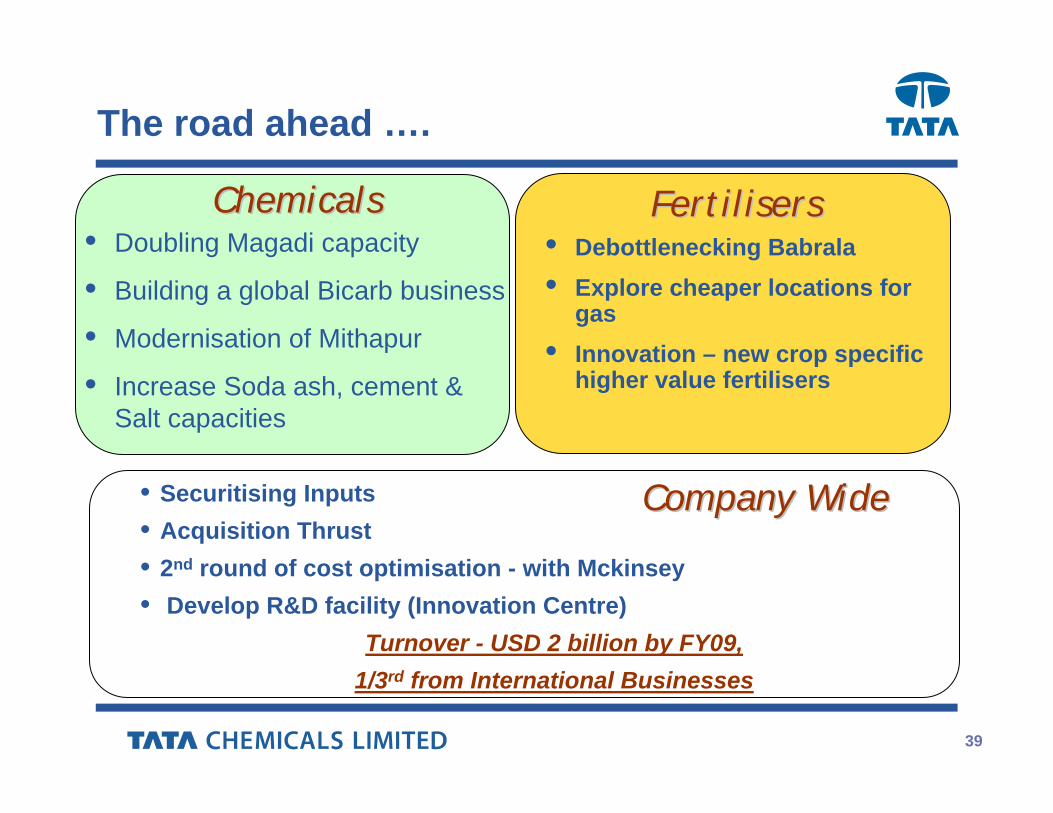
The road ahead ….
• Doubling Magadi capacity
• Building a global Bicarb business
• Modernisation of Mithapur
• Increase Soda ash, cement & Salt capacities
• Debottlenecking Babrala• Explore cheaper locations for
gas • Innovation – new crop specific
higher value fertilisers
FertilisersFertilisers
• Securitising Inputs• Acquisition Thrust• 2nd round of cost optimisation - with Mckinsey• Develop R&D facility (Innovation Centre)
Turnover - USD 2 billion by FY09, 1/3rd from International Businesses
Company WideCompany Wide
ChemicalsChemicals

40
The New Emerging Portfolio
41
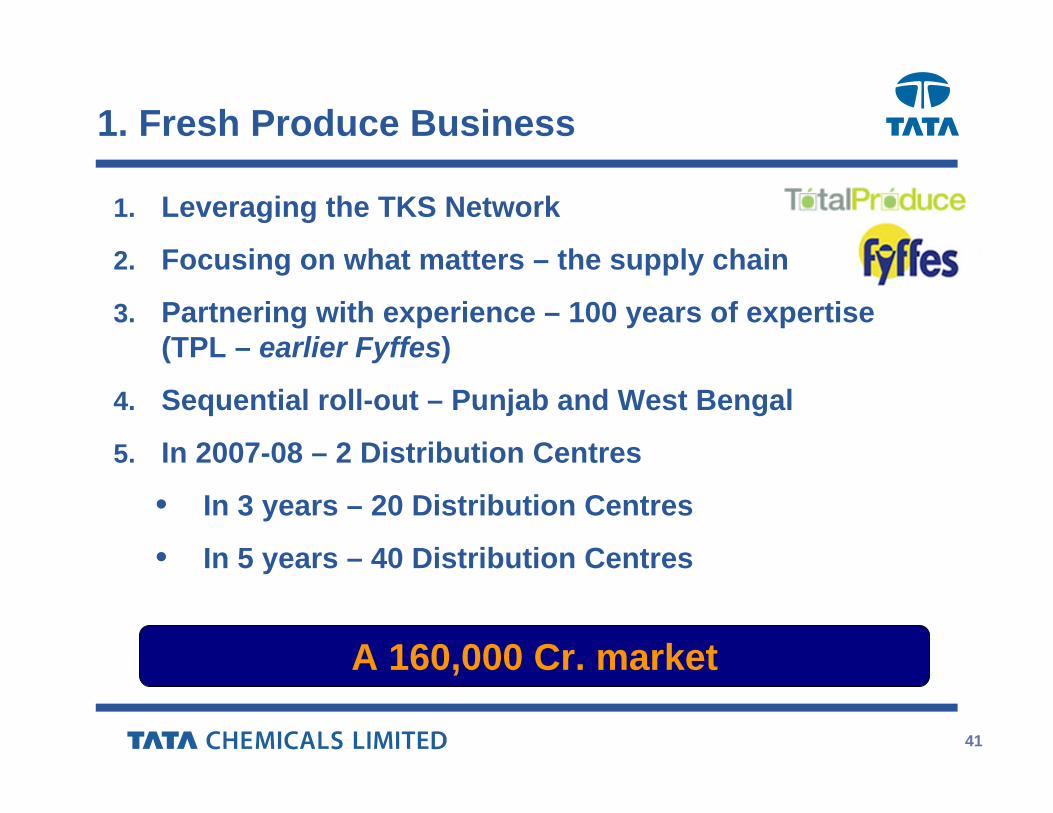
1. Fresh Produce Business
1. Leveraging the TKS Network
2. Focusing on what matters – the supply chain
3. Partnering with experience – 100 years of expertise (TPL – earlier Fyffes)
4. Sequential roll-out – Punjab and West Bengal
5. In 2007-08 – 2 Distribution Centres
• In 3 years – 20 Distribution Centres
• In 5 years – 40 Distribution Centres
A 160,000 Cr. market

42
2. Biofuels
1. Entry into both Bio Diesel and Bio Ethanol
2. Trial cultivation of non-food agricultural feedstock commenced in both cases
3. Dual approach – conventional technology & advanced new technologies (concurrent development)
4. Development of novel technologies is the responsibility of
the Innovation Centre (Pune)
43
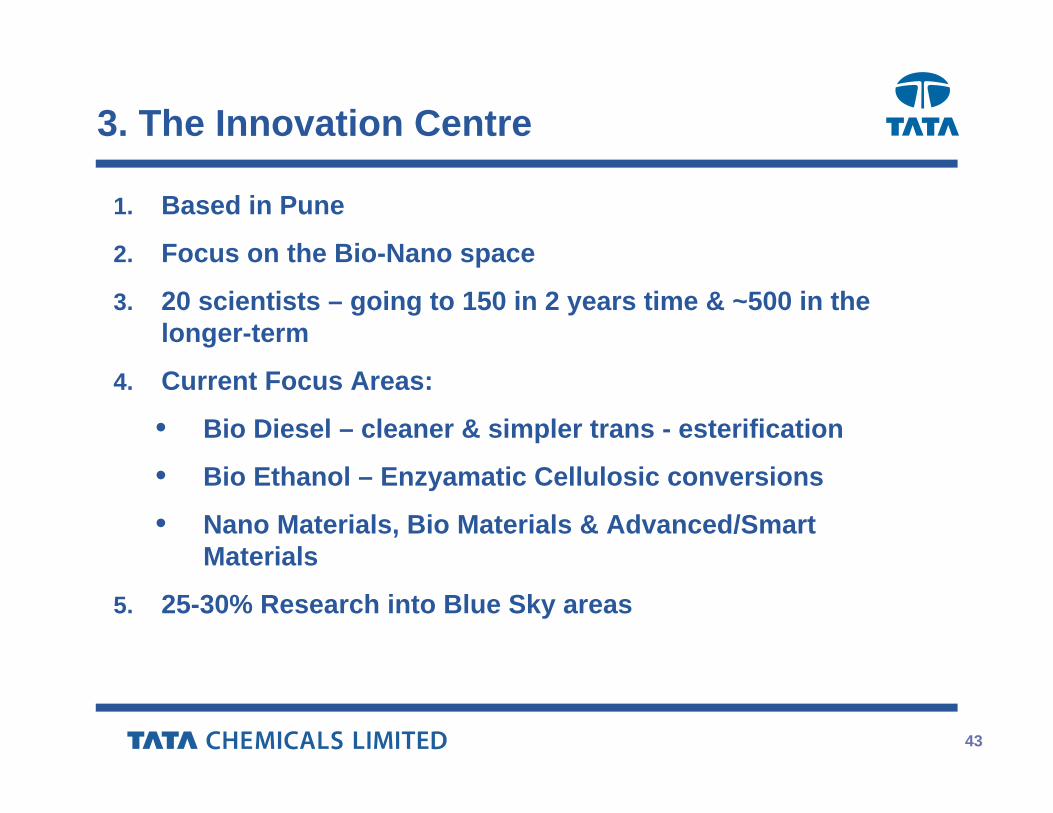
3. The Innovation Centre
1. Based in Pune
2. Focus on the Bio-Nano space
3. 20 scientists – going to 150 in 2 years time & ~500 in the longer-term
4. Current Focus Areas:
• Bio Diesel – cleaner & simpler trans - esterification
• Bio Ethanol – Enzyamatic Cellulosic conversions
• Nano Materials, Bio Materials & Advanced/Smart Materials
5. 25-30% Research into Blue Sky areas

44
Thank you