Embed Size (px)
Citation preview

“Serving Society through Science”


3
Low Cost Resource Base
Potash
Phosphate
Nitrogen
Soda Ash
Salt
Agri Markets
Detergent, Glass (Container & Float)
Edible / Industrial
4
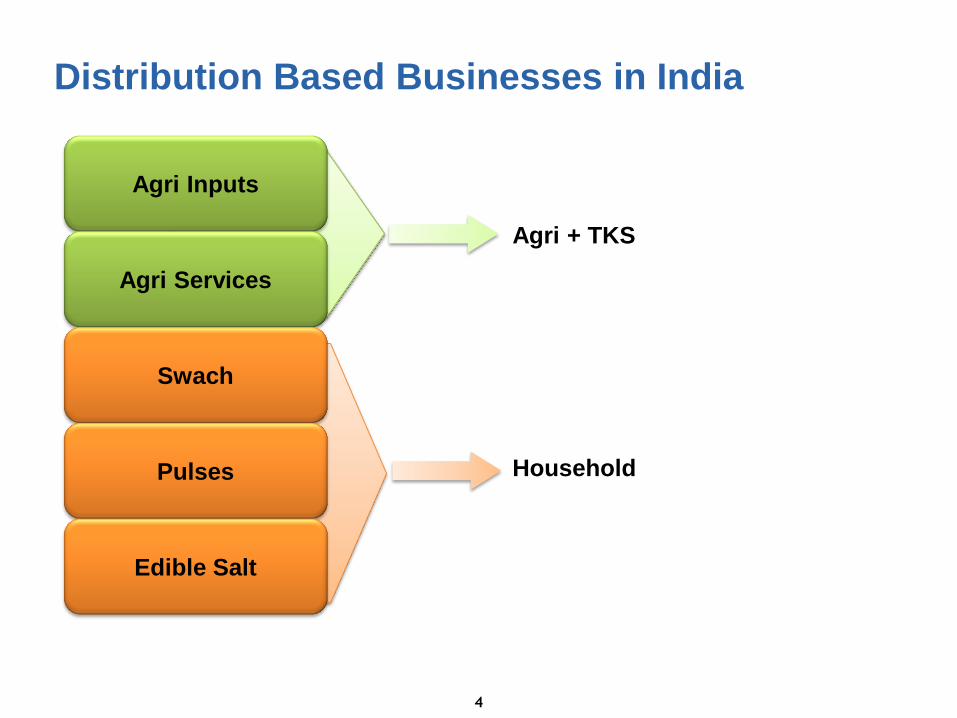
Distribution Based Businesses in India
Agri Inputs
Agri Services
Swach
Pulses
Edible Salt
Agri + TKS
Household

5
Potash
(Trading)
Potash
(Trading) EPM Potash -
Mining
~0.5* mn tn (2017)
DAP in Haldia Phos Acid in
Morocco
IMACID II
DAP linked to Phos
Rock in Morocco
~1.0* mn tn (under evaluation)
Phosphatics
(DAP in Haldia)
Nitrogenous
Fertiliser
(Regulated)
Gabon
(2 lines)
~1.3* mn tn (line 1 - 2014) ~1.3* mn tn (line 2 – under evaluation)
Nitrogenous
Fertiliser
(Regulated)
Soda Ash
Synthetic
(India + UK)
Natural Ash
(USA + Kenya)
Natural Ash
expansion
(USA)
~0.4 mn tn (under evaluation)
Soda Ash India
(Synthetic)
Evolving as a Low Cost Resource Play
Edible Salt
Salt
debottlenecking
(India)
~0.2 mn tn (2012)
Salt India
* Project Capacities

Evolving as a Low Cost Resource Play
6
Higher
Volumes
Investment
in Low Cost
Resources
Margin
Accretion

7
The NATURAL Advantage
Mithapur - Salt Tata Chemicals Magadi – Natural Soda Ash
Tata Chemicals North America – Natural Soda Ash

8
The NATURAL Advantage
Tata Chemicals Europe (British Salt) - Brine IMACID, Morocco – Rock Phosphate
Gabon Fertiliser Unit – low energy cost –
potential to be one of the lowest cost urea
manufacturing facilities in the world

9
Extensive and Efficient Distribution
Rural
Urban
Pesticides
Fertilisers
Specialty & Customised
Fertiliser
TKS
Edible and Industrial
Salt
Swach & Pulses
Pan India network of
2252 distributors and
40,045 retailers
Strong reach to rural
markets 150 districts
across 7 states. 700+
dealers and 1.2 lakhs
villages covered
700+ franchise retail
outlets
Pan India reach to
~6.5 crore
households
through 11.3 lakh
retail outlets

• Fertilisers – Controlled
• Agri Inputs – Non-Controlled
• Salt
• Swach
• Farm Output
Consumer Product
Business
• FMCG Customers (Detergent
& Container Glass)
• Construction and Automobile
(Glass)
Chemicals
Agri Inputs
10
Customer Profile

11
• Fertilisers – Controlled
• Agri Inputs – Non-Controlled
• Salt
• Swach
• Farm Output
Consumer Product
Business
• FMCG Customers (Detergent &
Container Glass)
• Construction and Automobile
(Glass)
Chemicals
Agri Inputs

746
1,108
2010(F) 2014(F)
12
1,077
1,647
2010(F) 2014(F)
Rising Disposable Income
(Per Capita USD) Consumption Growth
(Per Capita USD)
Opportunity for sustainable growth by meeting demand through products
backed by technology and Innovation
Consumption Growth - India
Source: EIU
13
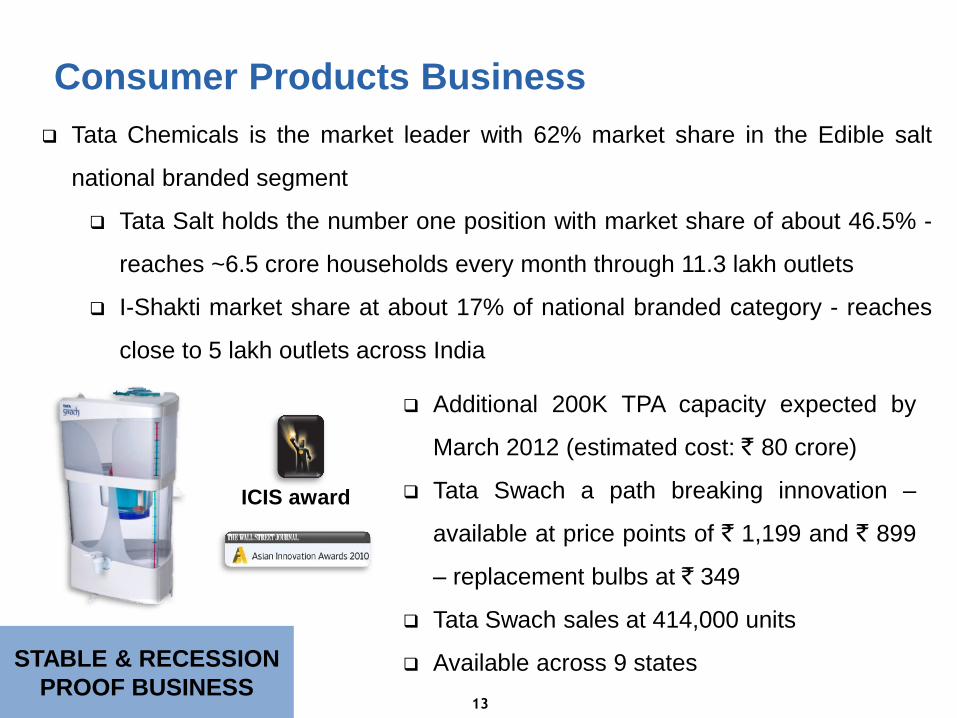
Consumer Products Business
STABLE & RECESSION
PROOF BUSINESS
Tata Chemicals is the market leader with 62% market share in the Edible salt
national branded segment
Tata Salt holds the number one position with market share of about 46.5% -
reaches ~6.5 crore households every month through 11.3 lakh outlets
I-Shakti market share at about 17% of national branded category - reaches
close to 5 lakh outlets across India
Additional 200K TPA capacity expected by
March 2012 (estimated cost: ` 80 crore)
Tata Swach a path breaking innovation –
available at price points of ` 1,199 and ` 899
– replacement bulbs at ` 349
Tata Swach sales at 414,000 units
Available across 9 states
ICIS award

14
Tata Chemicals’ ‘Farm to Fork’ approach
Farm: Strong linkages with the farmer through expansive & well entrenched networks of
Tata Kisan Sansars and Rallis Kutumba (catering to 3 million farmers)
Fork: Established food retail presence through Tata Salt and I Shakti covering a total of
around 1.8 million outlets
Thrust on offering quality and hygienic pulses at an affordable price
Endeavoring to work closely with state governments across the country. Presently working
on the Tamil Nadu government’s Grow More Pulses Program with Rallis
Consumer Products Business – i-Shakti Pulses
India's first National brand of pulses – “i-Shakti dals” -
launched 4 popular varieties of pulses (Chana, Toor, Urad
& Moong)
i-Shakti dals sales at over 1,000 tonnes for FY2011
Currently present in 3 states - to be rolled out to over 12
states during FY2012

• Fertilisers – Controlled
• Agri Inputs – Non-Controlled
• Salt
• Swach
• Farm Output
Consumer Product
Business
• FMCG Customers (Detergent &
Container Glass)
• Construction and Automobile
(Glass)
Chemicals
Agri Inputs
15

16
440
850
2007 2020
Food demand to grow with rising
population and increasing awareness
of nutrition needs
Mil
lio
n m
etr
ic t
on
nes
Food Demand
1.9x
. . . and given competing uses, land
under cultivation cannot
increase significantly
10
0%
= 3
29
mil
lio
n h
ec
tare
s
Source – ICRIER; NSSO, Ministry of Statistics, Mckinsey Study
Permanent Crops:
Growing demand for
fruits & horticulture,
7%
Residential (Rapidly Growing
Population), 19%
Forestry: Environment Regulation,
25%
Arable Land, 49%
At 49%, India has the one of the largest proportion of arable land
Agri Growth Indicators
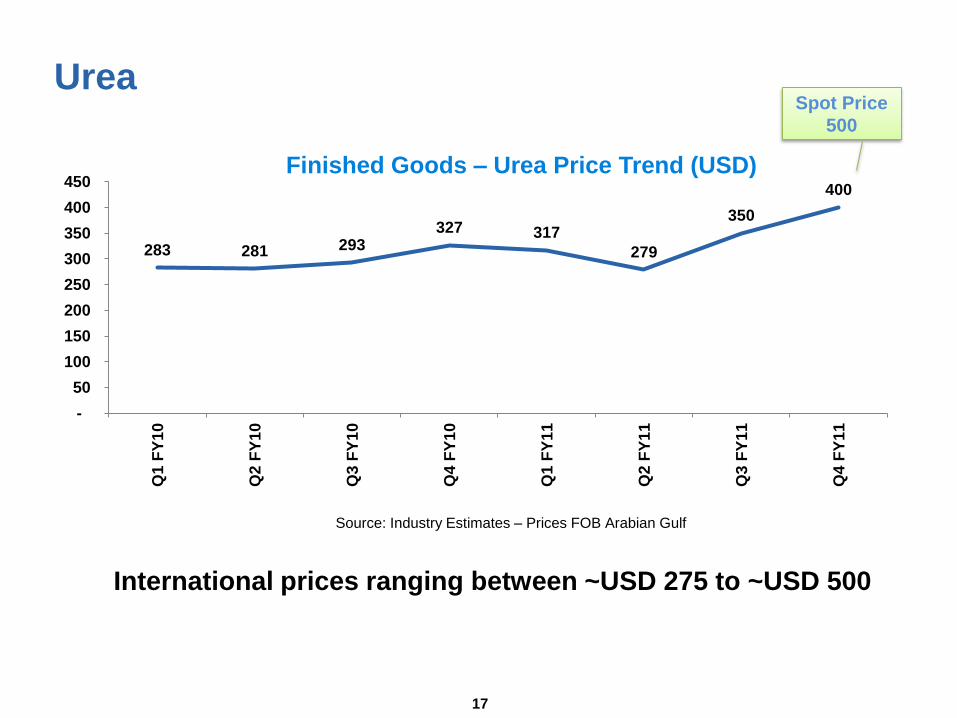
17
International prices ranging between ~USD 275 to ~USD 500
Source: Industry Estimates – Prices FOB Arabian Gulf
283 281 293 327 317
279
350
400
-
50
100
150
200
250
300
350
400
450
Q1 F
Y1
0
Q2 F
Y1
0
Q3 F
Y1
0
Q4 F
Y1
0
Q1 F
Y1
1
Q2 F
Y1
1
Q3 F
Y1
1
Q4 F
Y1
1
Finished Goods – Urea Price Trend (USD)
Urea Spot Price
500

18
Plant operating at full capacity
utilization
Urea de-bottlenecking of
50-100K tonnes under review
STABLE & RECESSION PROOF
BUSINESS
Production & Deliveries
0
100
200
300
400
Q1 F
Y1
0
Q2 F
Y1
0
Q3 F
Y1
0
Q4 F
Y1
0
Q1 F
Y1
1
Q2 F
Y1
1
Q3 F
Y1
1
Q4 F
Y1
1
Production Sales
Urea Production & Sales Volumes
(‘000 MT)
Babrala II – Currently on hold,
awaiting policy clarity on gas
allocation and pricing 0%
10%
20%
30%
40%
50%
8,000
8,500
9,000
9,500
10,000
10,500
11,000
11,500
Q1 F
Y1
0
Q2 F
Y1
0
Q3 F
Y1
0
Q4 F
Y1
0
Q1 F
Y1
1
Q2 F
Y1
1
Q3 F
Y1
1
Q4 F
Y1
1
Realizations Contribution
Urea Realizations (`/ MT)

19
Republic of Gabon (RoG)
RoG Snapshot
An oil rich country in Equatorial
West Africa
Spread across 267,667 kms
Population: 1.5 million
Economy dominated by oil & mining
Third highest GDP in Sub-Saharan
Africa: USD 14,000 (2009 est.)
Sovereign Rating similar to
Philippines: BB- (S&P)

20
Key Investment Highlights
Entered into a competitive fixed price feedstock agreement with RoG to
ultimately set-up 2 streams of 1.3 MTPA Urea - Execution activity at Stream
1 commenced and expected to be commissioned in 36 months
Time schedule for stream 2 execution to be mutually decided by Olam, RoG
& TCL over next 24-36 months
Olam, RoG and TCL to setup a sales and marketing JV for selling entire
output. Olam and TCL to hold equal stake. Up to 25% of the output reserved
for Indian markets (subject to de-canalization in India)
TCL to provide Project Management Consultancy and O&M services
Due diligence on gas reserves underway
21
Funding
Strategic investment of USD 290 million to acquire 25.1% stake in stream 1 to
set-up Greenfield port-based ammonia-urea Fertiliser manufacturing complex
in Republic of Gabon (RoG) - Balance share held by RoG (12%) & Olam
(62.9%)
Funding through:
USD 82 million raised by the preferential share allotment to Tata Sons
Sale of Investments worth USD 68 million over the next three years
Debt funding of USD 140 million

22
Project Highlights
Strategically located
near Gabon’s main
sea port
Leveraging Olam’s
network for developing
local Urea markets at
higher realizations
Potentially a low
cost Urea
manufacturing
facility globally
Expected yearly
EBITDA of USD 300–
350 Million per stream
10 Year Tax holiday
after commencement of
commercial production
and 10% concessional
rate thereafter

23
Technical Advisory Service Agreement with
Notore Chemicals, Nigeria
Notore is in the business of manufacturing Urea and owns a KBR ammonia
plant and a Stamicarbon Urea plant
The Notore plant presently has a capacity of 350,000 metric tonnes (MT) of
Ammonia per annum, 500,000 MT of Urea per annum and 650,000 MT of
blended NPK
There is no investment involved at present by TCL in Notore Chemicals
TCL’s fees are linked to improvement in the output from the plant
performance.
Testimony to TCL’s expertise and capabilities in the Urea business

24
630
509 523 567
758 778 780 830
200
400
600
800
1,000
Q1 F
Y1
0
Q2 F
Y1
0
Q3 F
Y1
0
Q4 F
Y1
0
Q1 F
Y1
1
Q2 F
Y1
1
Q3 F
Y1
1
Q4 F
Y1
1
Phosphoric Acid Price Trend (USD)
DAP prices continue to harden led by
rising input and energy costs
Higher input prices placing strain on
operations
Source: Industry Estimates
DAP & NPK
305 307 313
468 456
496
600 657
200
300
400
500
600
700
800
Q1 F
Y1
0
Q2 F
Y1
0
Q3 F
Y1
0
Q4 F
Y1
0
Q1 F
Y1
1
Q2 F
Y1
1
Q3 F
Y1
1
Q4 F
Y1
1
Finished Goods – DAP Price Trend (USD)
Source: Industry Estimates
Study underway to double phos acid
capacity along with ~ 1 million TPA
DAP capacity
Subsidy rates for DAP and MOP have
been increased to USD 612 and USD
390 respectively
Spot Price
1,050

25
Production & Deliveries
-5%
0%
5%
10%
15%
20%
25%
0
5,000
10,000
15,000
20,000
25,000
30,000
Q1 F
Y1
0
Q2 F
Y1
0
Q3 F
Y1
0
Q4 F
Y1
0
Q1 F
Y1
1
Q2 F
Y1
1
Q3 F
Y1
1
Q4 F
Y1
1
Haldia DAP Realizations & Contribution (`/MT)
Realizations Contribution
0
20
40
60
80
100
Q1 F
Y1
0
Q2 F
Y1
0
Q3 F
Y1
0
Q4 F
Y1
0
Q1 F
Y1
1
Q2 F
Y1
1
Q3 F
Y1
1
Q4 F
Y1
1
Haldia DAP Production & Sales (‘000 MT)
Production Sales
IMACID stake safeguards
assured supply of phosphoric
acid
LOW CAPITAL BUSINESS

-20%
-10%
0%
10%
20%
0
5,000
10,000
15,000
20,000
25,000
30,000
Q1 F
Y1
0
Q2 F
Y1
0
Q3 F
Y1
0
Q4 F
Y1
0
Q1 F
Y1
1
Q2 F
Y1
1
Q3 F
Y1
1
Q4 F
Y1
1
Haldia NPK Realizations & Contribution (`/MT)
Realizations Contribution
0
30
60
90
120
150
Q1 F
Y1
0
Q2 F
Y1
0
Q3 F
Y1
0
Q4 F
Y1
0
Q1 F
Y1
1
Q2 F
Y1
1
Q3 F
Y1
1
Q4 F
Y1
1
Haldia NPK Production & Sales (‘000 MT)
Production Sales
26
Production & Deliveries
Low subsidies combined with
higher input cost hindering
volume growth
LOW CAPITAL BUSINESS
Targeting to expand the
SSP capacity by 50K TPA –
expect completion by March
2012

27
Customized Fertilisers
Customized Fertilisers: Crop & Soil
specific Formula
Production
Production at Babrala has commenced: Capacity 130,000
MT/ year
Marketing
Target Market: - 25 districts of UP
- 5 key crops
Target segments: 66 dealers, 351 star retailers, 197 TKS
Evaluating option of setting up 2 more Customized Fertiliser units

28
Rallis India Strong growth in domestic business driven by value added offering to farmers in the last
four years – despite the setback due to unseasonal rains
Revenues up by 20% at ` 1,047 crore and PAT up by 25% at ` 126 crore for the year
ended March 31, 2011
Acquisition of Metahelix Life Sciences (MHS) offers Rallis a firm footing in the seeds
business
With a strong presence in Rice, Maize, Millet, Cotton and
Vegetables portfolio, the Metahelix presence provides a robust
opportunity to increase presence in agri input segment
Manufacturing presence being strengthened by capacity
expansions in existing units as well as investments in a new
unit at Dahej
The Rallis Kisan Kutumb programme continues to recive focus
with over 50,000 farmers coming into fold

• Fertilisers – Controlled
• Agri Inputs – Non-Controlled
• Salt
• Swach
• Farm Output
Consumer Product
Business
• FMCG Customers (Detergent &
Container Glass)
• Construction and Automobile
(Glass)
Chemicals
Agri Inputs
29

30
46.8 47.7 44.8
49.2 51.3 53.4 55.7 58.2
0
10
20
30
40
50
60
FY
08
FY
09
FY
10
FY
11
FY
12
E
FY
13
E
FY
14
E
FY
15
E
Global Soda Ash Demand (Million Tonne)
Global Soda Ash
Source: Industry Estimates
Global capacity for soda ash (FY2011) is 65 million tonnes
TCL’s soda ash capacity is 70% synthetic and 30% natural
Natural soda ash variable cost is 1/3rd of synthetic soda ash
56.9 58.8 60.8 64.6 66.1 68.9 70.0 70.7
0.0
10.0
20.0
30.0
40.0
50.0
60.0
70.0
80.0
FY
08
FY
09
FY
10
FY
11
FY
12
E
FY
13
E
FY
14
E
FY
15
E
Capacities (Million Tonne)

31
0.00
0.50
1.00
1.50
2.00
2.50
3.002
00
0
20
01
20
02
20
03
20
04
20
05
20
06
20
07
20
08
20
09
20
21
Projected Demand
2000 – 09
CAGR =11.5% Mil
lio
n M
T
2010 – 21
Expected CAGR =11%
Past Indian
Growth
Construction
And Auto
sectors
China growth
Story
Steady growth of 11.5% in domestic glass industry
for last 10 years
Real Estate & Construction, accounting for 85% of
float glass. Demand to grow at 20% CAGR growth
in automobile sector, contributing 15% to demand
China grew by 11% from 1990-2008 - India poised
to mirror this performance
Indian demand
estimated to grow at 11%,
on a conservative
basis
Source: Glassyug 2010, Glassweb and TSMG Analysis, ACMA report
Robust Glass Demand - India

32
67 71 83
95 100 94 104 95
-
30
60
90
120
Q1 F
Y1
0
Q2 F
Y1
0
Q3 F
Y1
0
Q4 F
Y1
0
Q1 F
Y1
1
Q2 F
Y1
1
Q3 F
Y1
1
Q4 F
Y1
1
Coal CFR Price Trend (USD/tonne)
146 153 169 200 204 195
219 254
- 50
100 150 200 250 300
Q1 F
Y1
0
Q2 F
Y1
0
Q3 F
Y1
0
Q4 F
Y1
0
Q1 F
Y1
1
Q2 F
Y1
1
Q3 F
Y1
1
Q4 F
Y1
1
Anthracite CFR Price Trend (USD/tonne)
Source: Industry Estimates
Global Energy Prices Spot Price
120-140
Spot Price
250
293 287 333 415
537 471 467 435
-
150
300
450
600
Q1 F
Y1
0
Q2 F
Y1
0
Q3 F
Y1
0
Q4 F
Y1
0
Q1 F
Y1
1
Q2 F
Y1
1
Q3 F
Y1
1
Q4 F
Y1
1
Coke CFR Price Trend (USD/tonne)
Spot Price
530-550
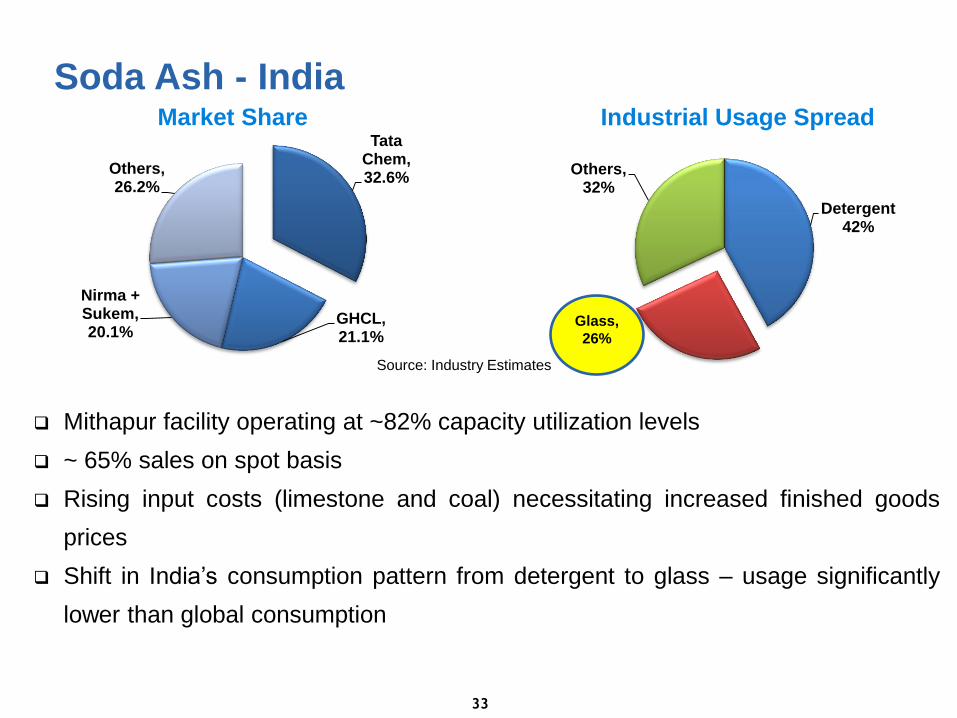
Soda Ash - India
33
Detergent 42%
Others, 32%
Industrial Usage Spread
Source: Industry Estimates
Tata Chem, 32.6%
GHCL, 21.1%
Nirma + Sukem, 20.1%
Others, 26.2%
Market Share
Mithapur facility operating at ~82% capacity utilization levels
~ 65% sales on spot basis
Rising input costs (limestone and coal) necessitating increased finished goods
prices
Shift in India’s consumption pattern from detergent to glass – usage significantly
lower than global consumption
Glass,
26%

0%
20%
40%
60%
0
5,000
10,000
15,000
20,000
Q1 F
Y1
0
Q2 F
Y1
0
Q3 F
Y1
0
Q4 F
Y1
0
Q1 F
Y1
1
Q2 F
Y1
1
Q3 F
Y1
1
Q4 F
Y1
1
Mithapur Realizations & Contribution (`/MT)
Realizations Contribution
0
50
100
150
200
Q1 F
Y1
0
Q2 F
Y1
0
Q3 F
Y1
0
Q4 F
Y1
0
Q1 F
Y1
1
Q2 F
Y1
1
Q3 F
Y1
1
Q4 F
Y1
1
Mithapur Production & Sales (‘000 MT)
Production Sales
34
Production & Deliveries
HIGH CASH
GENERATING
BUSINESS

TCNA - one of the largest Soda Ash players in the US
Currently operating at ~97% capacity utilization levels
Study under progress for increasing capacity
Entire production sold through long term contracts
Complete production sold out for current calendar
~70% production sold domestically while balance exported; mainly to Latin
America 35
Detergent, 10%
Chemicals, 24%
Other use, 12%
Industrial Usage Spread Tata Chem North
America, 24.9%
FMC, 29.1% Solvay,
21.3%
OCI, 17.2%
SVM, 7.5%
Market Share
Source: Industry Estimates
Soda Ash – Tata Chemicals North America (TCNA)
Glass,
54%

0
200
400
600
800
Q1 F
Y1
0
Q2 F
Y1
0
Q3 F
Y1
0
Q4 F
Y1
0
Q1 F
Y1
1
Q2 F
Y1
1
Q3 F
Y1
1
Q4 F
Y1
1
TCNA Production & Sales (‘000 MT)
Prodution Sales
36
Production & Deliveries
0%
20%
40%
60%
0
2,000
4,000
6,000
8,000
10,000Q
1 F
Y1
0
Q2
FY
10
Q3 F
Y1
0
Q4 F
Y1
0
Q1 F
Y1
1
Q2 F
Y1
1
Q3 F
Y1
1
Q4 F
Y1
1
TCNA Realizations & Contribution (`/MT)
Realizations Contribution
HIGH CASH GENERATING –
LOW COST
100,000 MT capacity
addition by FY2012

Soda Ash – Tata Chemicals Europe (TCE)
37
Tata Chem
Europe, 84.0%
ETI, 9.3%
Others, 6.7%
Market Share
Glass, 67%
Detergent16%
Chemical, 10%
Other Use, 7%
Industrial Usage Spread
Glass,
67%
Source: Industry Estimates
Entire production sold in the UK - all sales through long term contracts
Container Glass driving demand
Unit operating at full capacity utilization
Facility has strong tie-up for brine supply at reasonable cost – acquired 100%
stake in British Salt

38
Production & Deliveries
0
50
100
150
200
250
300
Q1 F
Y1
0
Q2 F
Y1
0
Q3 F
Y1
0
Q4 F
Y1
0
Q1 F
Y1
1
Q2 F
Y1
1
Q3 F
Y1
1
Q4 F
Y1
1
TCE Production & Sales (‘000 MT)
Production Sales
0%10%20%30%40%50%60%70%
0
3,000
6,000
9,000
12,000
15,000
Q1 F
Y1
0
Q2 F
Y1
0
Q3 F
Y1
0
Q4 F
Y1
0
Q1 F
Y1
1
Q2 F
Y1
1
Q3 F
Y1
1
Q4 F
Y1
1
TCE Realizations & Contribution (`/MT)
Realizations Contribution
FOCUS ON RETURNING TO
SUSTAINABLE
PROFITABILITY
Extreme climatic
conditions impact TCE
operations

British Salt
39
Tata Chem British Salt,
53.0%
Imports, 5.0%
Ineos Chlor, 42.0%
Market Share
Food, 45%
Detergent16%
Chemical, 10%
General Manufact
uring, 10%
Water Softening
, 6%
Volume by Industry Sector
Source: Industry Estimates
Long-term customer relationships with leading food & chemicals companies
British Salt is also active in the gas storage business

Soda Ash – Tata Chemicals Magadi
40
Source: Industry Estimates
Tata Chem
Magadi, 92.0% Imports,
8.0%
Market Share
Standard Ash plant operating at ~85% capacity utilization levels
Project “Excel” contributes to enhanced production and efficiencies at Pure
Ash Facility – 60% capacity utilization
Rising oil prices however pose challenges
~60% sales on spot basis
Detergent16%
Chemical, 10%
Mining & Metal, 6%
Other Use, 2%
Industrial Usage Spread
Glass,
71%

0%
20%
40%
60%
80%
0
2,000
4,000
6,000
8,000
10,000
12,000
Q1 F
Y1
0
Q2 F
Y1
0
Q3 F
Y1
0
Q4 F
Y1
0
Q1 F
Y1
1
Q2 F
Y1
1
Q3 F
Y1
1
Q4 F
Y1
1
Kenya SAM Realizations & Contribution
(`/MT)
Realizations Contribution
0
25
50
75
100
Q1 F
Y1
0
Q2 F
Y1
0
Q3 F
Y1
0
Q4 F
Y1
0
Q1 F
Y1
1
Q2 F
Y1
1
Q3 F
Y1
1
Q4 F
Y1
1
Kenya SAM UK Production & Sales (‘000 MT)
Production Sales
41
Production & Deliveries
FOCUS ON EXPLOITING
LOW COST ADVANTAGE


43
TCL’s Revenue Contribution
~32% ~68%
India

833
1,119
1,625 1,736 1,773 1,864
0
400
800
1,200
1,600
2,000
FY
06
FY
07
FY
08
FY
09
FY
10
FY
11
EBITDA (` crore)
CAGR Growth*
– 14.3%
4,029
5,804 6,023
12,652
9,448 11,060
0
3,000
6,000
9,000
12,000
15,000F
Y06
FY
07
FY
08
FY
09
FY
10
FY
11
Net Income from Operations (` crore)
44
CAGR Growth* –
18.3%
* Excludes extraordinary items
Financial Trend (Consolidated)
*CAGR Growth* – FY06 – FY11

428 508
964
648 592
653
0
250
500
750
1,000
FY
06
FY
07
FY
08
FY
09
FY
10
FY
11
PAT (` crore)
CAGR Growth*:
7.3%
14.7 18.3
37.9
27.6 25.6 26.1
0
5
10
15
20
25
30
35
40
FY
06
FY
07
FY
08
FY
09
FY
10
FY
11
Diluted EPS (`)
45
Financial Trend (Consolidated)
CAGR Growth*:
10.0%
*CAGR Growth* – FY06 – FY11

46
Dividend Track Record
172 201
247 248 255
296
0
50
100
150
200
250
300
350
FY
06
FY
07
FY
08
FY
09
FY
10
FY
11
Dividends including Dividend Tax (` crore)
45% 41%
23%
51% 55%
61%
0%
10%
20%
30%
40%
50%
60%
70%
FY
06
FY
07
FY
08
FY
09
FY
10
FY
11
Dividend Payout Ratio*
* On a standalone basis

47
FY2011 Financial Highlights
Particulars
(` crore)
FY2011 FY2010
TCL TCE IMACID TCNA Rallis CONS TCL TCE IMACID TCNA Rallis CONS
Net Sales
(Incl. Other
Operating
Income)
6,332 1,682 442 1,818 1,092 11,060 5,476 1,834 370 1,759 341
9,544
Profit from
operations 893 192 53 538 203 1,864 899 306 59 511 63
1,840
PBT (after
exceptional
items)
559 (39) 45 397 184 1,121 588 (76) 34 342 57 933
PAT (after MI
& Share in
Associate)
408 (24) 37 198 63 653 435 (60) 30 184 32
606
• International entities register a growth of 43% in profits

48
FY2011 Performance
9,544 11,060
0
4,000
8,000
12,000
FY11 Net Income from Operations (` crore)
1,840
1,864
1,800
1,840
1,880
FY11 Profit from Operations (` crore)
• Firm markets and stable operating environment across most sites
• Improving demand environment reflected in enhanced realizations

49
FY2011 Performance
606 653
0
110
220
330
440
550
660
FY11 PAT (Post MI) (` crore)
25.61 26.10
-
5.00
10.00
15.00
20.00
25.00
30.00FY11 EPS (diluted & annualized)
(`)
• Strong performance by TCNA partially mitigates impact of increasing input
costs, extreme winter in TCE
• FY2011 Profit from operations includes full year performance of Rallis versus 3
months in FY2010

50 50
Key Ratios (Consolidated)
Particulars As on March 31, 2011 As on March 31, 2010
Net Debt/Equity 0.76 0.81
Net Debt/Total Assets 0.36 0.37
Net Debt/EBITDA 2.34 2.08
EPS (Diluted & annualized) 26.10 25.91
Consolidated Cash and cash equivalents as on March 31, 2011: ` 1,345 crore


52 MEDIUM TERM
Debt Equity 1:1
ROCE 20%
Financial Objectives
Financial
Objectives
Leadership
Innovation
Sustainability
Business
Objectives

53
Living Essentials
Objectives
Leveraging technology and customer relationships to create products for the
masses
Actions
Debottlenecking of additional 200K TPA domestic salt capacity at ` 180 crore
expected by March 2012
Swach Water purifiers – Sales targeted to cross 1 million by FY2012
I Shakti range of pulses – “i-Shakti dals” and 4 popular varieties of pulses
(Chana, Toor, Urad & Moong including Whole Green Moong & Green Chilka)
MEDIUM TERM

54
Industry Essentials
MEDIUM TERM
Objectives
Being the lowest cost Inorganic Chemicals Company in the world
Actions
Debottlenecking of GCIP facility by 100,000 tonnes by March 2012
Study under progress to increase GCIP capacity by 400,000 tonnes
Magadi PAM PEP (Pure Ash, Performance Enhancement Programme)
Initial capex of USD 15 million on engineering and infrastructure for Biofuels
production at Mozambique
Lean Six Sigma being implemented across sites

55
Farm Essentials
Objectives
Strengthen position in the Integrated Agri Input space while leveraging
relationships with farmers to extend across the value chain
Actions
Evaluating option of setting up 2 more Customized Fertiliser units in Haldia
Third DAP train of 300,000 tonnes under examination
Urea de-bottlenecking of 50-100K tonnes under review
Babrala II – Urea doubling project dependent upon gas allocation and price
Study underway to double phos acid capacity along with ~ 1 million TPA DAP
capacity at IMACID, Morocco
SSP debottlenecking at Haldia by 50K TPA at a cost of ~ ` 11 crore – expected
completion by Q4 FY2012
MEDIUM TERM

56
Innovation Focus
TATA Swach:
Low cost water purifier available at price points of ` 749 and ` 499
The Tata Swach bulb, which shuts off water supply after its useful life, is
priced at ` 299 and it can purify upto 3,000 liters of water
TATA Swach is available almost pan India except North Eastern states and
J&K
Biofuels:
Tata Chemicals has a research program for Jatropa in Singapore along
with Toyota and Temasek
Tata Chemicals plans to exploit this technical knowledge and expertise in
developing large-scale bio ethanol project in Mozambique
The consulate minister of Mozambique allocated 16,000 hectares of land
for setting up Bio ethanol plant based from sugarcane