Embed Size (px)
Citation preview
Sustainable use ofEarth’s natural resources
IR presentationQ1-Q2 2017
© Outotec – All rights reserved
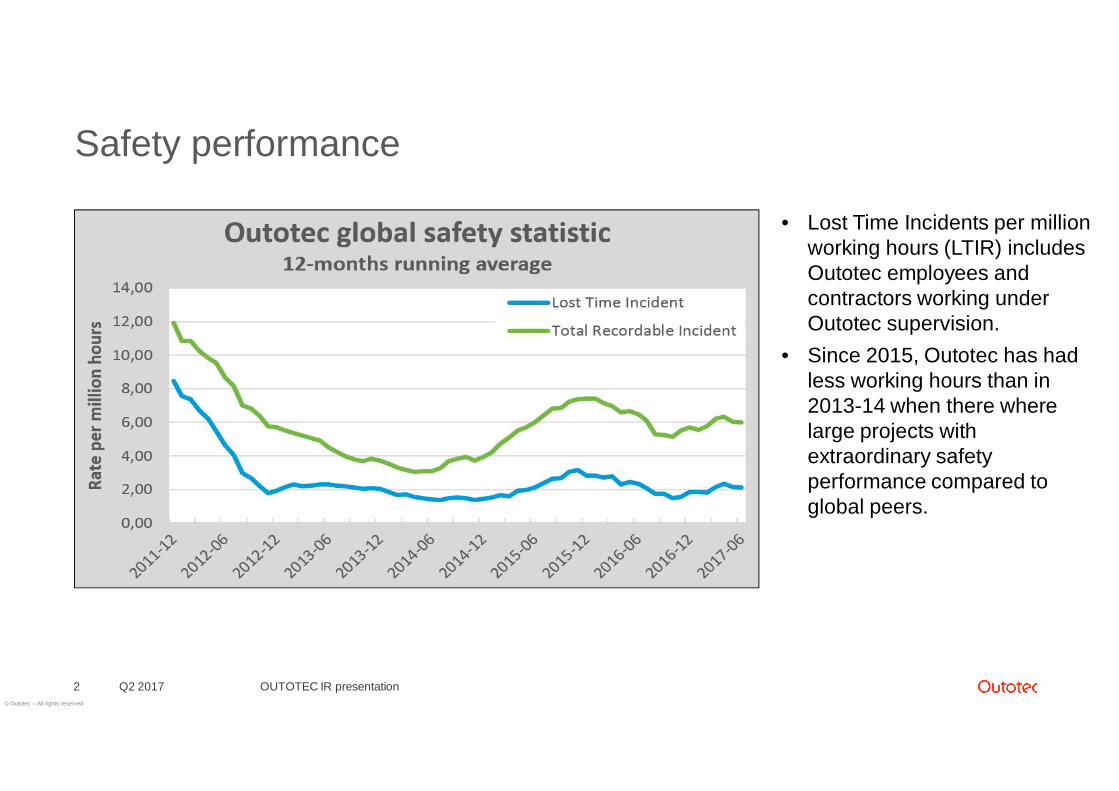
Safety performance
OUTOTEC IR presentation2 Q2 2017
• Lost Time Incidents per millionworking hours (LTIR) includesOutotec employees andcontractors working underOutotec supervision.
• Since 2015, Outotec has hadless working hours than in2013-14 when there wherelarge projects withextraordinary safetyperformance compared toglobal peers.
© Outotec – All rights reserved
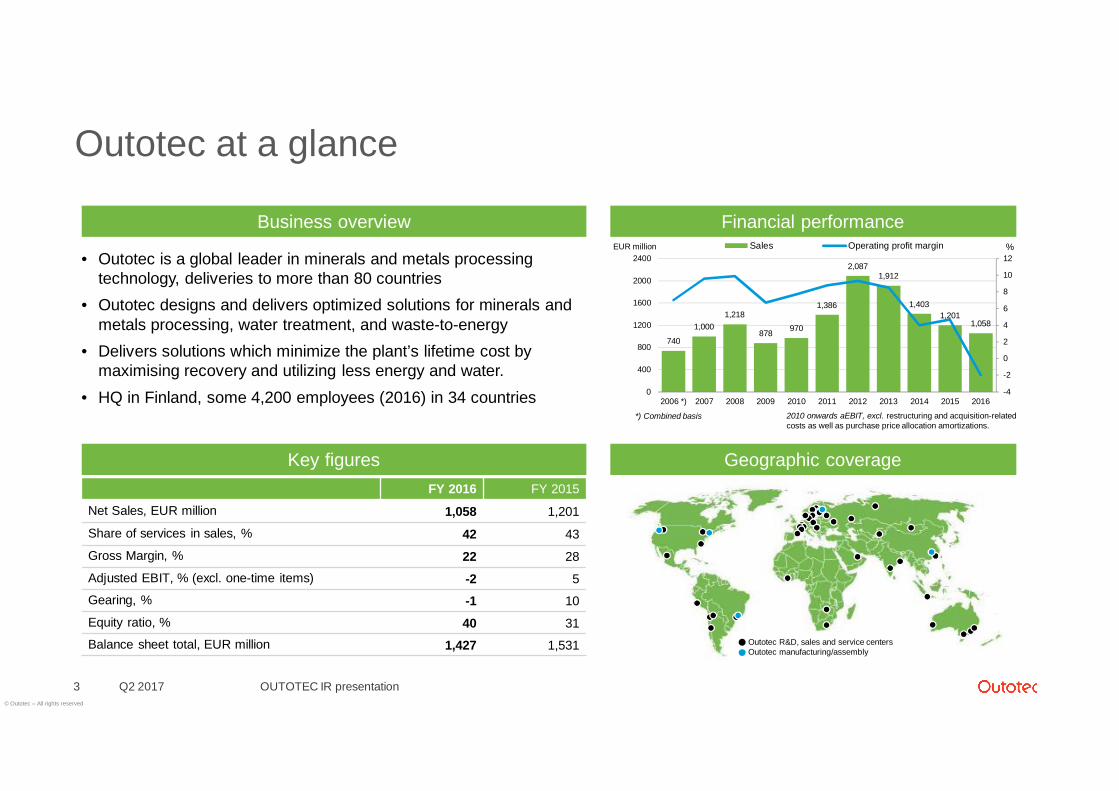
Outotec at a glance
Q2 2017 OUTOTEC IR presentation3
Key figures
Financial performance
Geographic coverage
Business overview
740
1,0001,218
878 970
1,386
2,0871,912
1,4031,201
1,058
-4
-2
0
2
4
6
8
10
12
0
400
800
1200
1600
2000
2400
2006 *) 2007 2008 2009 2010 2011 2012 2013 2014 2015 2016
Sales Operating profit margin
*) Combined basis 2010 onwards aEBIT, excl. restructuring and acquisition-relatedcosts as well as purchase price allocation amortizations.
EUR million %
FY 2016 FY 2015
Net Sales, EUR million 1,058 1,201
Share of services in sales, % 42 43
Gross Margin, % 22 28
Adjusted EBIT, % (excl. one-time items) -2 5Gearing, % -1 10
Equity ratio, % 40 31Balance sheet total, EUR million 1,427 1,531
• Outotec is a global leader in minerals and metals processingtechnology, deliveries to more than 80 countries
• Outotec designs and delivers optimized solutions for minerals andmetals processing, water treatment, and waste-to-energy
• Delivers solutions which minimize the plant’s lifetime cost bymaximising recovery and utilizing less energy and water.
• HQ in Finland, some 4,200 employees (2016) in 34 countries
Outotec R&D, sales and service centersOutotec manufacturing/assembly
© Outotec – All rights reserved
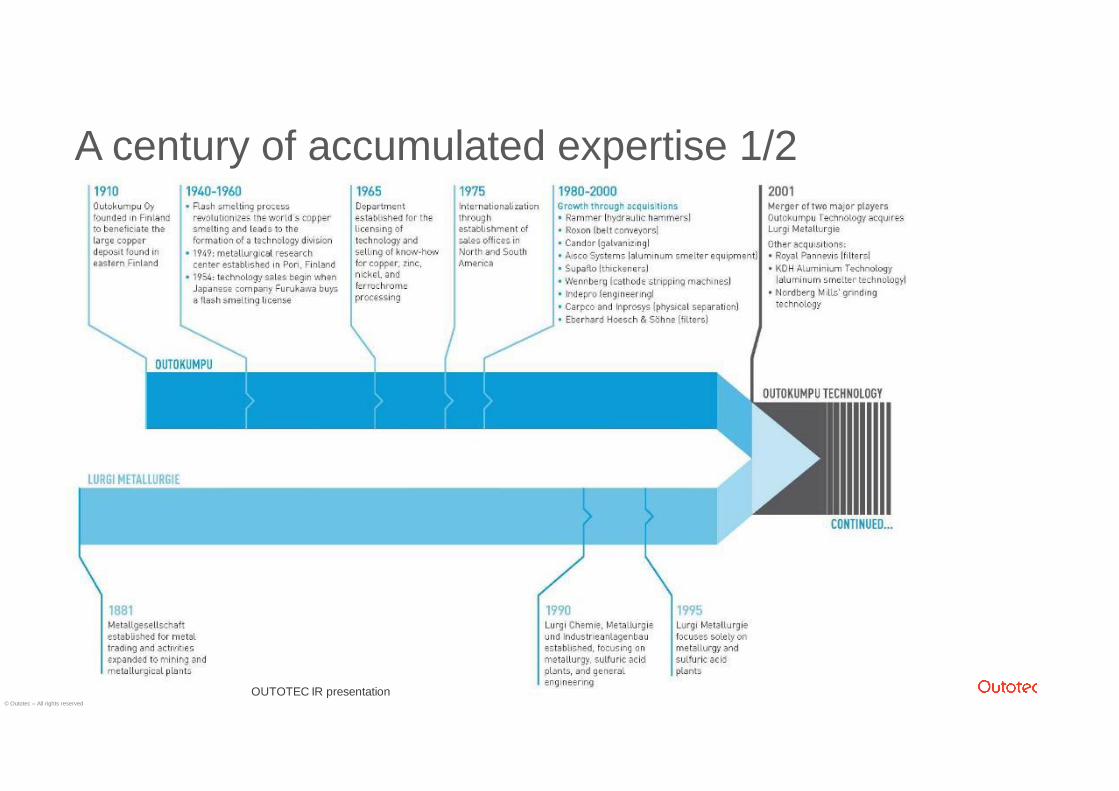
A century of accumulated expertise 1/2
Q2 2017 OUTOTEC IR presentation4 OUTOTEC IR presentation
© Outotec – All rights reserved
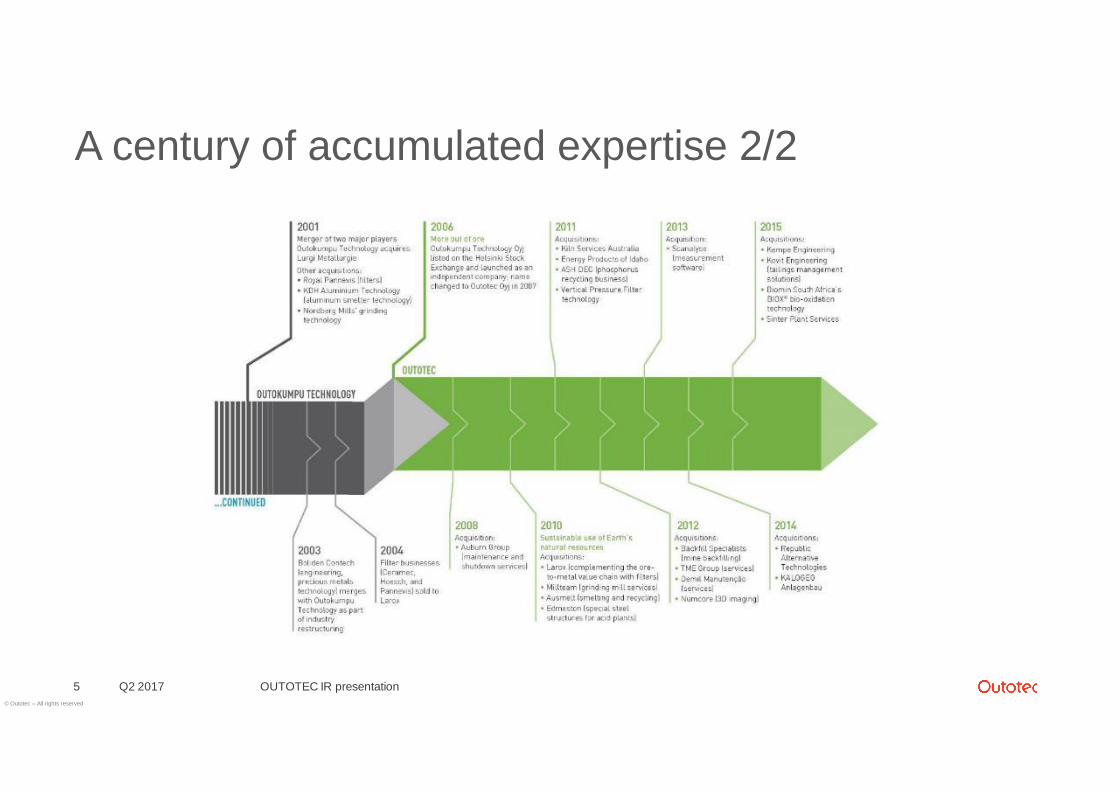
A century of accumulated expertise 2/2
Q2 2017 OUTOTEC IR presentation5
© Outotec – All rights reserved
6
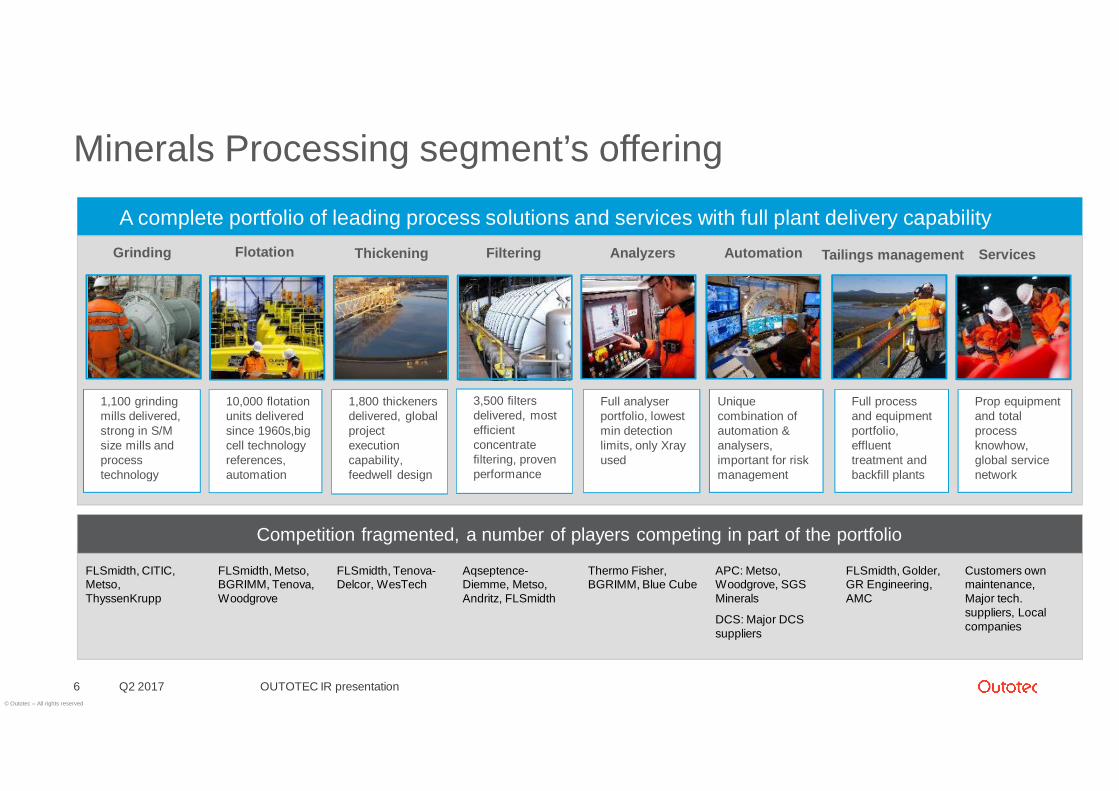
Minerals Processing segment’s offering
A complete portfolio of leading process solutions and services with full plant delivery capability
WaterTechnology
FLSmidth, CITIC,Metso,ThyssenKrupp
FLSmidth, Metso,BGRIMM, Tenova,Woodgrove
FLSmidth, Tenova-Delcor, WesTech
Aqseptence-Diemme, Metso,Andritz, FLSmidth
Thermo Fisher,BGRIMM, Blue Cube
APC: Metso,Woodgrove, SGSMinerals
DCS: Major DCSsuppliers
FLSmidth, Golder,GR Engineering,AMC
Customers ownmaintenance,Major tech.suppliers, Localcompanies
Thickening AnalyzersGrinding Flotation AutomationFiltering ServicesTailings management
1,100 grindingmills delivered,strong in S/Msize mills andprocesstechnology
10,000 flotationunits deliveredsince 1960s,bigcell technologyreferences,automation
1,800 thickenersdelivered, globalprojectexecutioncapability,feedwell design
Full analyserportfolio, lowestmin detectionlimits, only Xrayused
Uniquecombination ofautomation &analysers,important for riskmanagement
Full processand equipmentportfolio,effluenttreatment andbackfill plants
Prop equipmentand totalprocessknowhow,global servicenetwork
3,500 filtersdelivered, mostefficientconcentratefiltering, provenperformance
Competition fragmented, a number of players competing in part of the portfolio
Q2 2017 OUTOTEC IR presentation
© Outotec – All rights reserved
Q2 2017 OUTOTEC IR presentation7
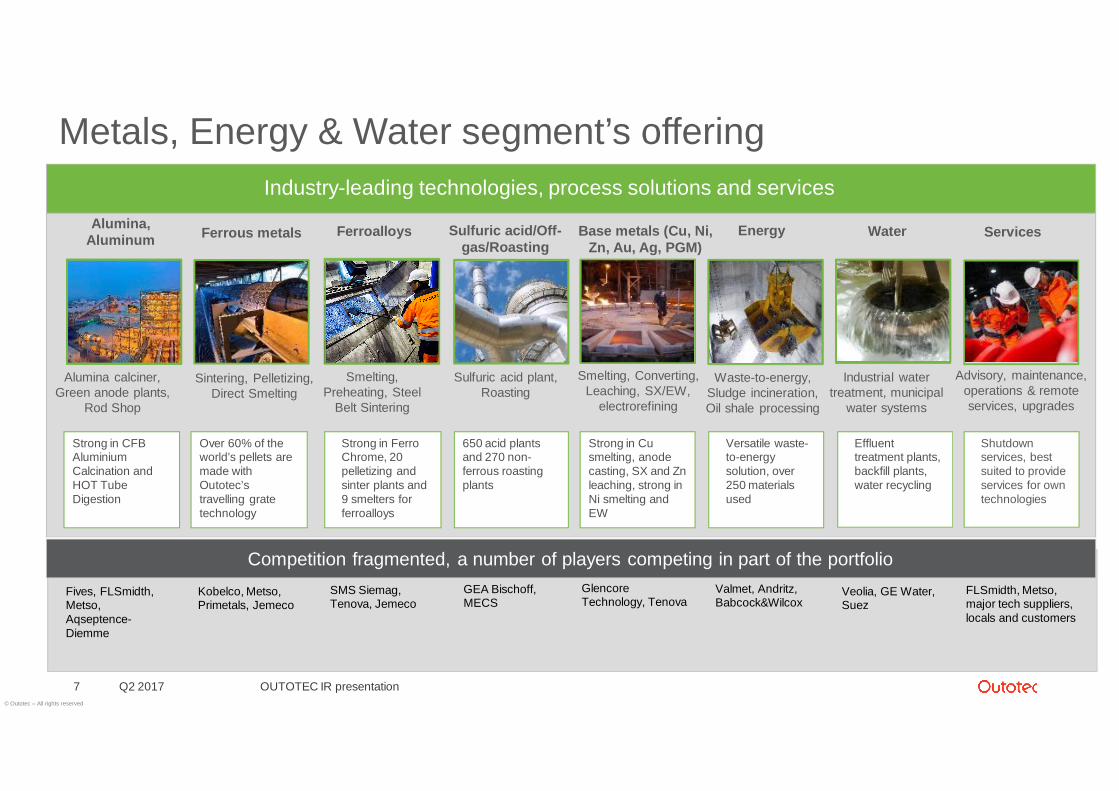
Industry-leading technologies, process solutions and services
Metals, Energy & Water segment’s offering
Ferrous metals Sulfuric acid/Off-gas/Roasting
Fives, FLSmidth,Metso,Aqseptence-Diemme
Kobelco, Metso,Primetals, Jemeco
SMS Siemag,Tenova, Jemeco
GEA Bischoff,MECS
Alumina,Aluminum Base metals (Cu, Ni,
Zn, Au, Ag, PGM)Ferroalloys
GlencoreTechnology, Tenova
Strong in CFBAluminiumCalcination andHOT TubeDigestion
Over 60% of theworld’s pellets aremade withOutotec’stravelling gratetechnology
650 acid plantsand 270 non-ferrous roastingplants
Strong in Cusmelting, anodecasting, SX and Znleaching, strong inNi smelting andEW
Energy Water
Alumina calciner,Green anode plants,
Rod Shop
Sintering, Pelletizing,Direct Smelting
Sulfuric acid plant,Roasting
Smelting, Converting,Leaching, SX/EW,
electrorefining
Smelting,Preheating, Steel
Belt Sintering
Waste-to-energy,Sludge incineration,Oil shale processing
Industrial watertreatment, municipal
water systems
Competition fragmented, a number of players competing in part of the portfolio
Services
Advisory, maintenance,operations & remoteservices, upgrades
Valmet, Andritz,Babcock&Wilcox
Veolia, GE Water,Suez
FLSmidth, Metso,major tech suppliers,locals and customers
Strong in FerroChrome, 20pelletizing andsinter plants and9 smelters forferroalloys
Versatile waste-to-energysolution, over250 materialsused
Effluenttreatment plants,backfill plants,water recycling
Shutdownservices, bestsuited to provideservices for owntechnologies
© Outotec – All rights reserved
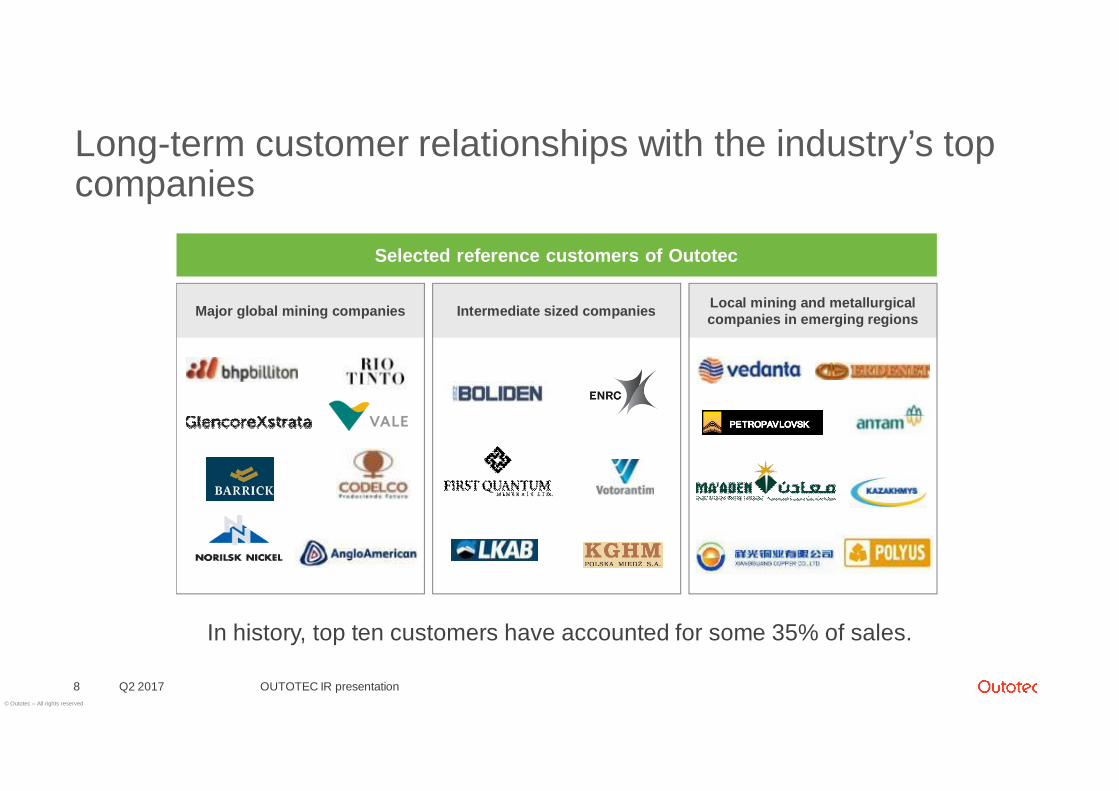
Long-term customer relationships with the industry’s topcompanies
Q2 2017 OUTOTEC IR presentation8
In history, top ten customers have accounted for some 35% of sales.
Major global mining companies Local mining and metallurgicalcompanies in emerging regionsIntermediate sized companies
Selected reference customers of Outotec
© Outotec – All rights reserved
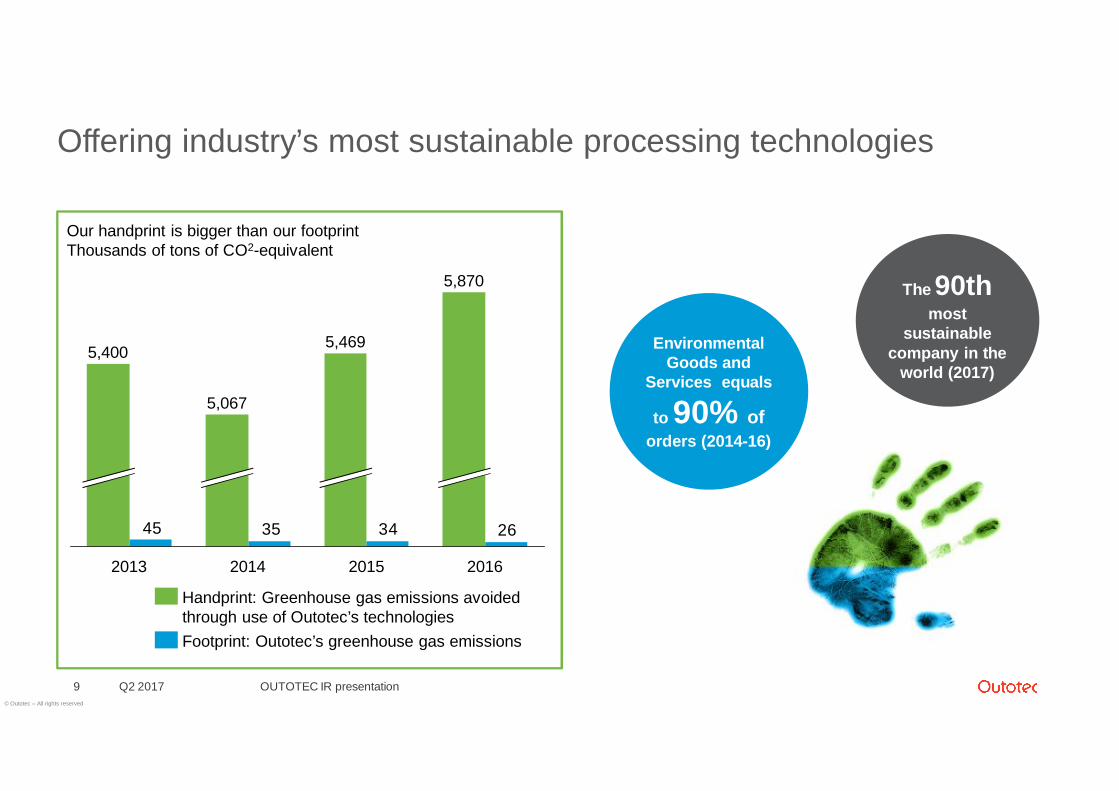
Offering industry’s most sustainable processing technologies
Q2 2017 OUTOTEC IR presentation9
26343545
5,870
2015
5,469
2014
5,067
2013
5,400
2016
Our handprint is bigger than our footprintThousands of tons of CO2-equivalent
Footprint: Outotec’s greenhouse gas emissions
Handprint: Greenhouse gas emissions avoidedthrough use of Outotec’s technologies
The 90thmost
sustainablecompany in the
world (2017)
EnvironmentalGoods and
Services equals
to 90% oforders (2014-16)
© Outotec – All rights reserved
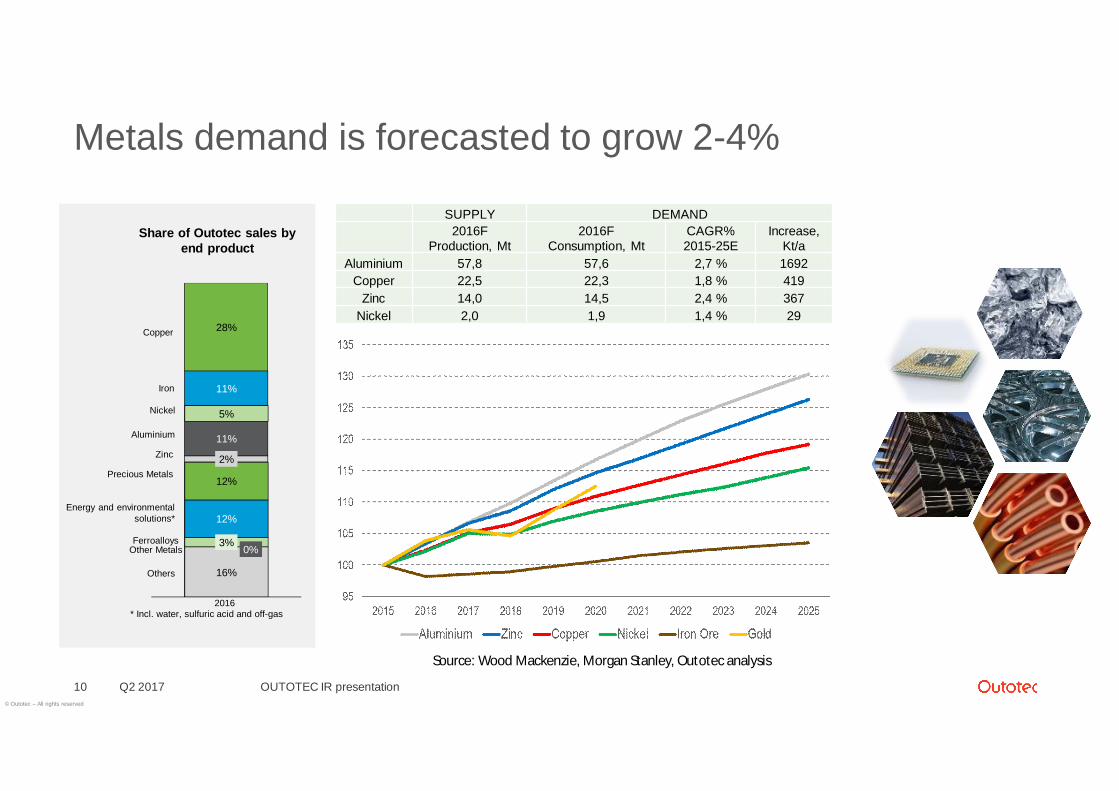
Metals demand is forecasted to grow 2-4%
Q2 2017 OUTOTEC IR presentation10
SUPPLY DEMAND2016F
Production, Mt2016F
Consumption, MtCAGR%2015-25E
Increase,Kt/a
Aluminium 57,8 57,6 2,7 % 1692Copper 22,5 22,3 1,8 % 419
Zinc 14,0 14,5 2,4 % 367Nickel 2,0 1,9 1,4 % 29
Source: Wood Mackenzie, Morgan Stanley, Outotec analysis
Share of Outotec sales byend product
* Incl. water, sulfuric acid and off-gas
16%
0%3%
12%
12%
2%
11%
5%
11%
28%
Others
Copper
Precious Metals
Zinc
Aluminium
Ferroalloys
Iron
Nickel
Other Metals
2016
Energy and environmentalsolutions*
© Outotec – All rights reserved
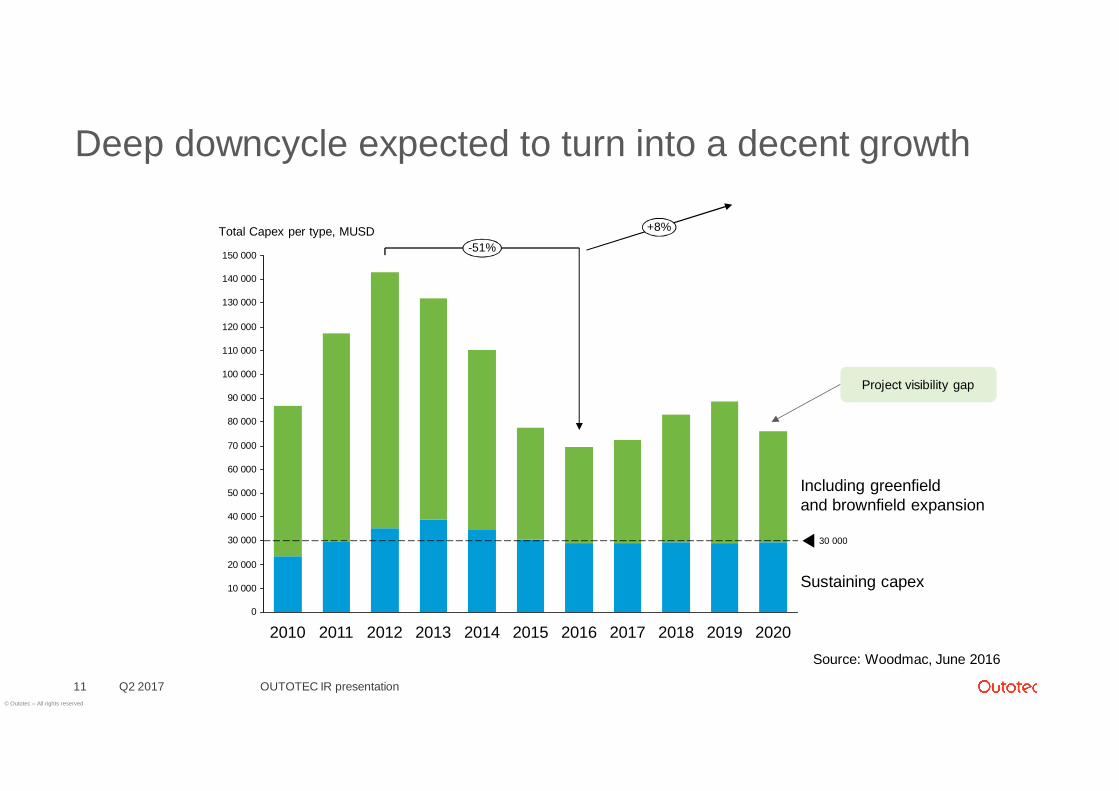
Deep downcycle expected to turn into a decent growth
Q2 2017 OUTOTEC IR presentation11
0
10 000
20 000
30 000
40 000
50 000
60 000
70 000
80 000
90 000
100 000
110 000
120 000
130 000
140 000
150 000
2019 2020201820172016201520142013201220112010
30 000
+8%
-51%
Sustaining capex
Including greenfieldand brownfield expansion
Total Capex per type, MUSD
Project visibility gap
Source: Woodmac, June 2016
© Outotec – All rights reserved
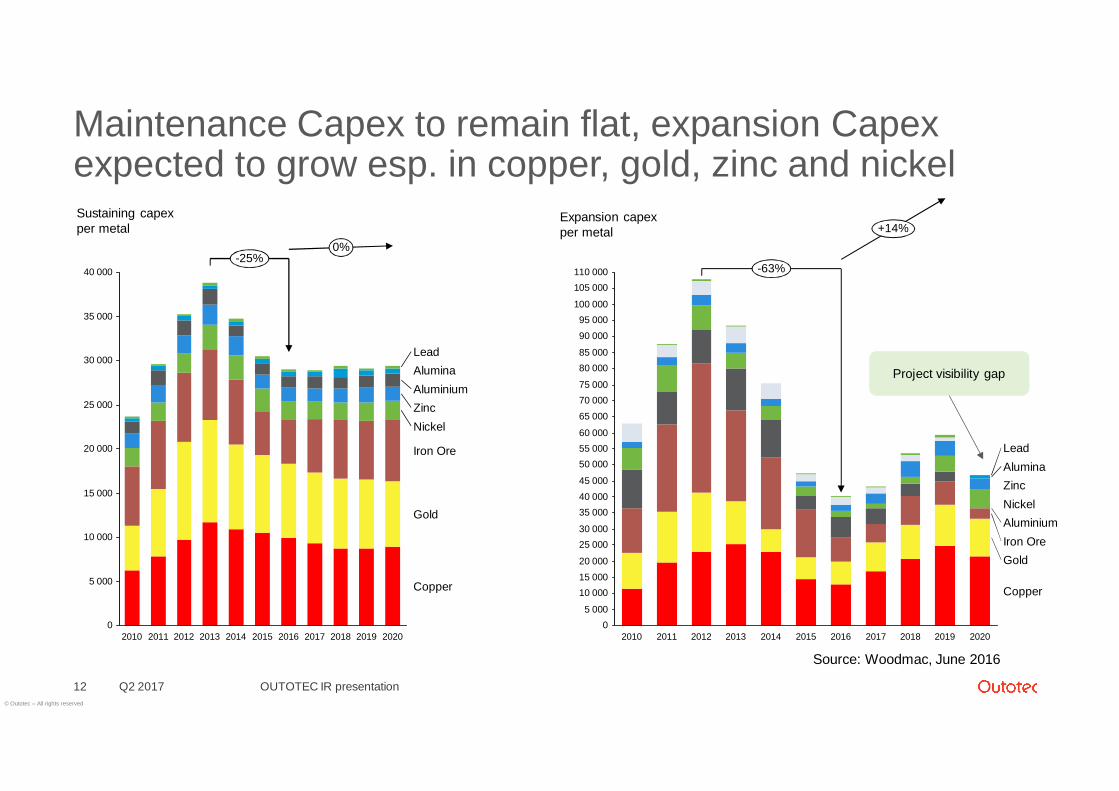
Maintenance Capex to remain flat, expansion Capexexpected to grow esp. in copper, gold, zinc and nickel
Q2 2017 OUTOTEC IR presentation12
0
5 000
10 000
15 000
20 000
25 000
30 000
35 000
40 000
0%-25%
Copper
Gold
Iron Ore
NickelZincAluminiumAluminaLead
202020192018201720162015201420132012201120100
5 000
10 00015 00020 000
25 00030 000
35 00040 00045 000
50 00055 00060 000
65 00070 00075 000
80 00085 000
90 00095 000
100 000
105 000110 000
20152014201320122011 201820172010 2016
+14%
-63%
Copper
GoldIron OreAluminiumNickelZincAluminaLead
20202019
Sustaining capexper metal
Expansion capexper metal
Project visibility gap
Source: Woodmac, June 2016
© Outotec – All rights reserved
Long-term financial targets - Road map to 2020
Q2 2017 OUTOTEC IR presentation13
10%2020
CurrentaEBIT*
aEBIT*
ServicesR&D,Design-to-cost
Bestcostcountrysourcing
Efficiency
Annual averageservice sales growth5-15% (incl. M&A)
Gearing at max 50%
* Excluding restructuring and acquisition-related costs as well as purchase price allocation amortizations.
© Outotec – All rights reserved
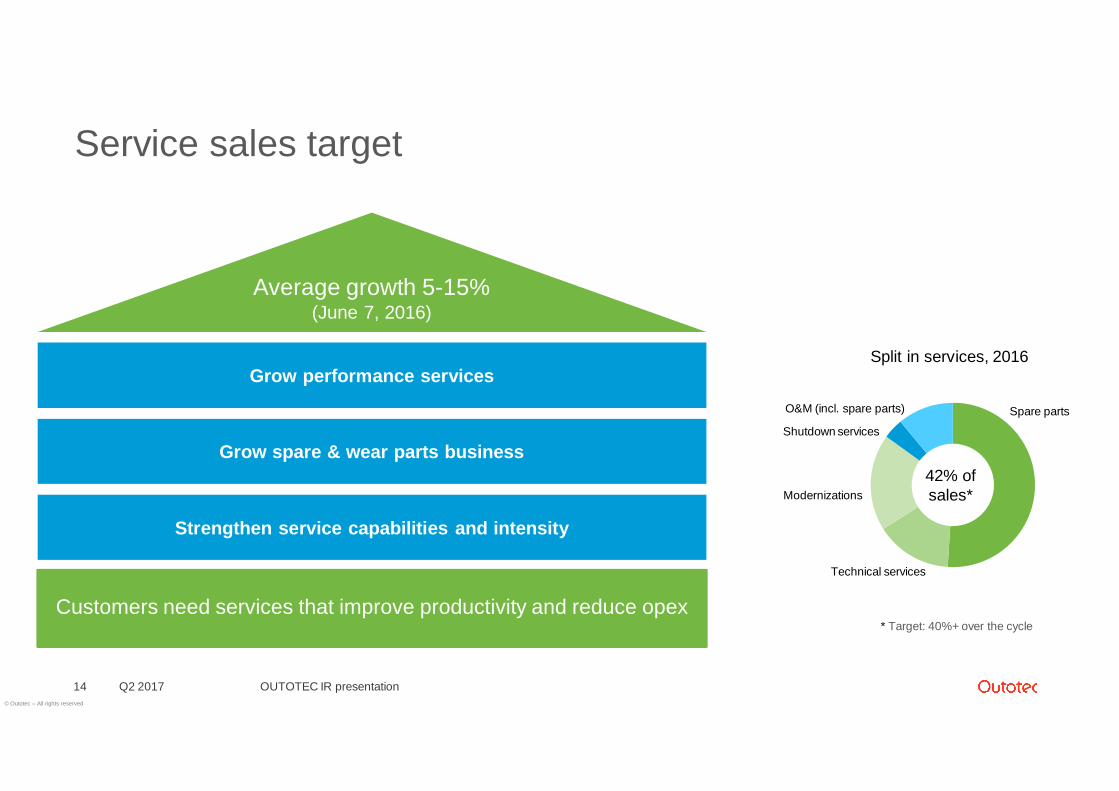
Service sales target
Q2 2017 OUTOTEC IR presentation14
Grow performance services
Grow spare & wear parts business
Strengthen service capabilities and intensity
Customers need services that improve productivity and reduce opex
Average growth 5-15%(June 7, 2016)
Spare parts
Technical services
Modernizations
Shutdown services
O&M (incl. spare parts)
Split in services, 2016
42% ofsales*
* Target: 40%+ over the cycle
© Outotec – All rights reserved
Q2 2017 financial information
Q2 2017 OUTOTEC IR presentation15
© Outotec – All rights reserved
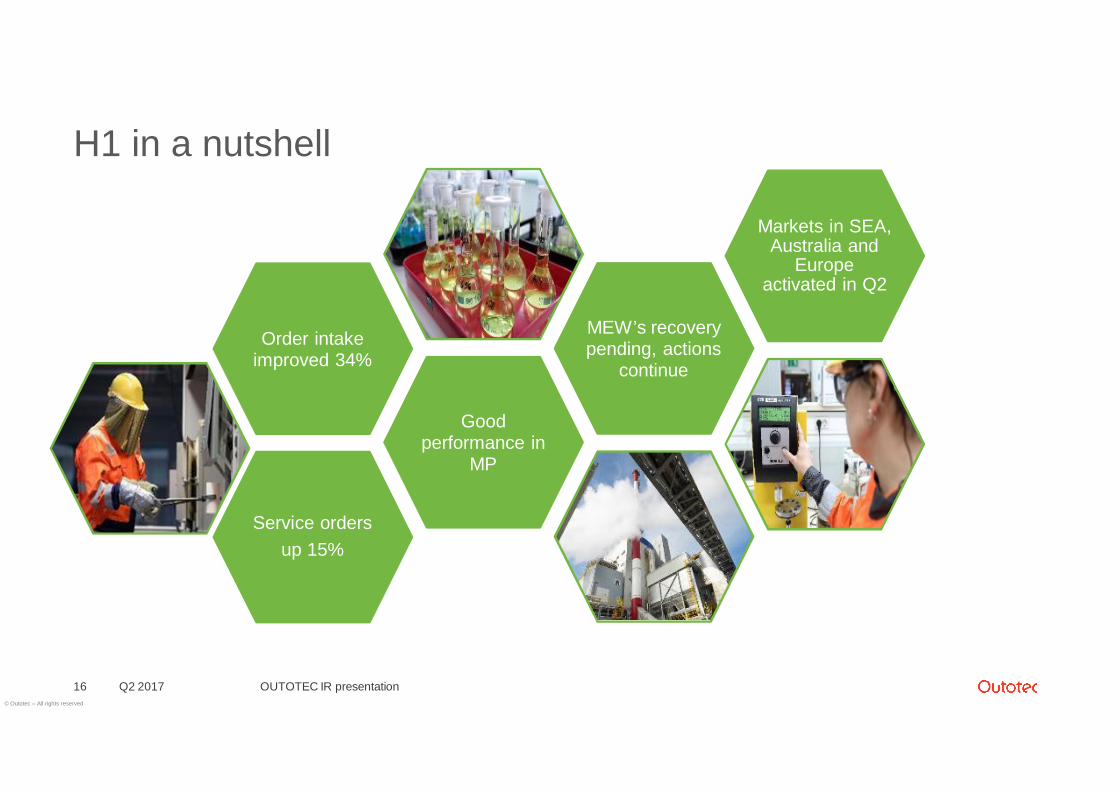
Service ordersup 15%
Goodperformance in
MP
Order intakeimproved 34%
MEW’s recoverypending, actions
continue
Markets in SEA,Australia and
Europeactivated in Q2
H1 in a nutshell
Q2 2017 OUTOTEC IR presentation16
© Outotec – All rights reserved
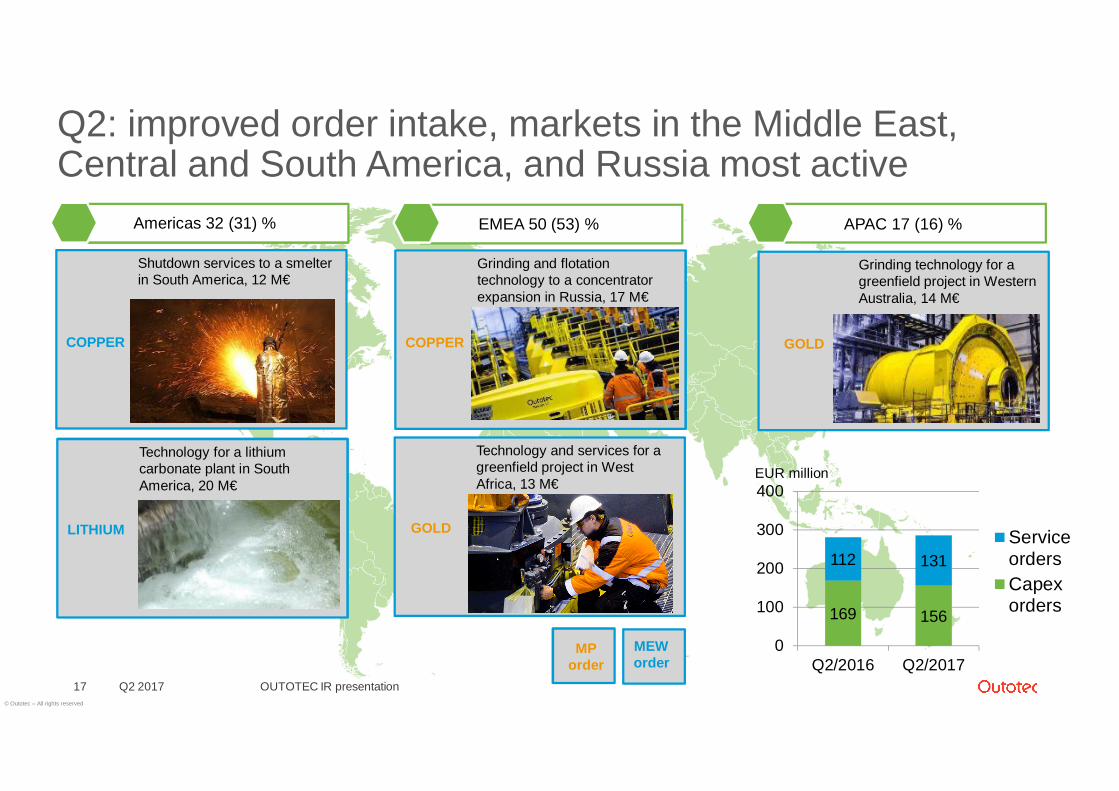
Q2: improved order intake, markets in the Middle East,Central and South America, and Russia most active
Q2 2017 OUTOTEC IR presentation17
Americas 32 (31) %
GOLD
Technology and services for agreenfield project in WestAfrica, 13 M€
COPPER
Shutdown services to a smelterin South America, 12 M€
GOLD
Grinding technology for agreenfield project in WesternAustralia, 14 M€
169 156
112 131
0
100
200
300
400
Q2/2016 Q2/2017
ServiceordersCapexorders
MEWorder
MPorder
EUR million
COPPER
Grinding and flotationtechnology to a concentratorexpansion in Russia, 17 M€
LITHIUM
Technology for a lithiumcarbonate plant in SouthAmerica, 20 M€
EMEA 50 (53) % APAC 17 (16) %
© Outotec – All rights reserved
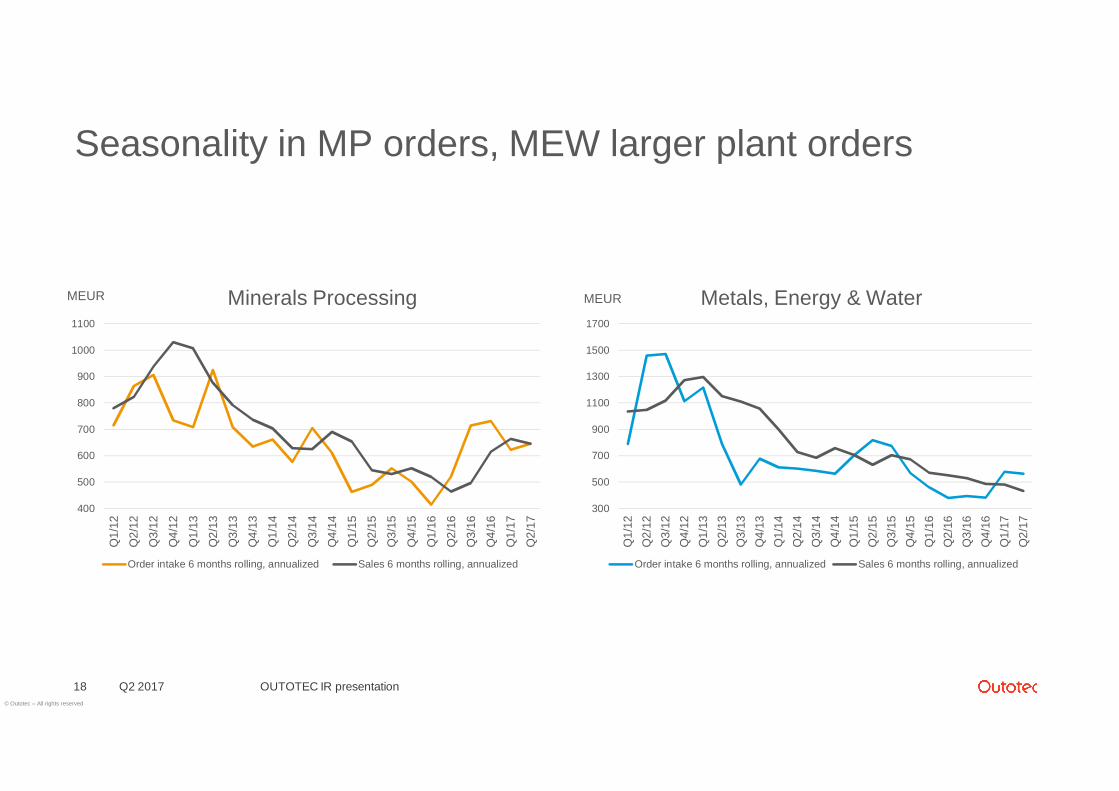
Seasonality in MP orders, MEW larger plant orders
Q2 2017 OUTOTEC IR presentation18
MEUR MEUR
300
500
700
900
1100
1300
1500
1700
Q1/
12Q
2/12
Q3/
12Q
4/12
Q1/
13Q
2/13
Q3/
13Q
4/13
Q1/
14Q
2/14
Q3/
14Q
4/14
Q1/
15Q
2/15
Q3/
15Q
4/15
Q1/
16Q
2/16
Q3/
16Q
4/16
Q1/
17Q
2/17
Metals, Energy & Water
Order intake 6 months rolling, annualized Sales 6 months rolling, annualized
400
500
600
700
800
900
1000
1100
Q1/
12
Q2/
12
Q3/
12
Q4/
12
Q1/
13
Q2/
13
Q3/
13
Q4/
13
Q1/
14
Q2/
14
Q3/
14
Q4/
14
Q1/
15
Q2/
15
Q3/
15
Q4/
15
Q1/
16
Q2/
16
Q3/
16
Q4/
16
Q1/
17
Q2/
17
Minerals Processing
Order intake 6 months rolling, annualized Sales 6 months rolling, annualized
© Outotec – All rights reserved
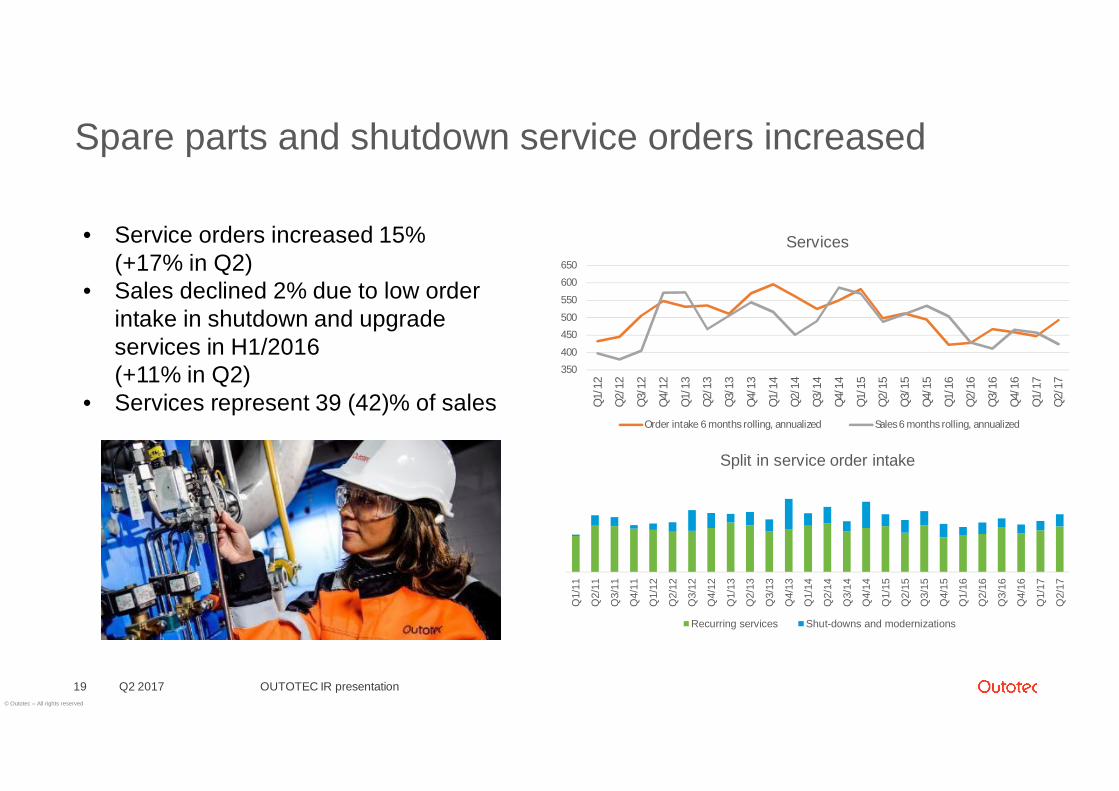
Spare parts and shutdown service orders increased
Q2 2017 OUTOTEC IR presentation19
• Service orders increased 15%(+17% in Q2)
• Sales declined 2% due to low orderintake in shutdown and upgradeservices in H1/2016(+11% in Q2)
• Services represent 39 (42)% of sales350
400
450
500
550
600
650
Q1/
12
Q2/
12
Q3/
12
Q4/
12
Q1/
13
Q2/
13
Q3/
13
Q4/
13
Q1/
14
Q2/
14
Q3/
14
Q4/
14
Q1/
15
Q2/
15
Q3/
15
Q4/
15
Q1/
16
Q2/
16
Q3/
16
Q4/
16
Q1/
17
Q2/
17
Services
Order intake 6 months rolling, annualized Sales 6 months rolling, annualized
Q1/
11
Q2/
11
Q3/
11
Q4/
11
Q1/
12
Q2/
12
Q3/
12
Q4/
12
Q1/
13
Q2/
13
Q3/
13
Q4/
13
Q1/
14
Q2/
14
Q3/
14
Q4/
14
Q1/
15
Q2/
15
Q3/
15
Q4/
15
Q1/
16
Q2/
16
Q3/
16
Q4/
16
Q1/
17
Q2/
17
Split in service order intake
Recurring services Shut-downs and modernizations
© Outotec – All rights reserved
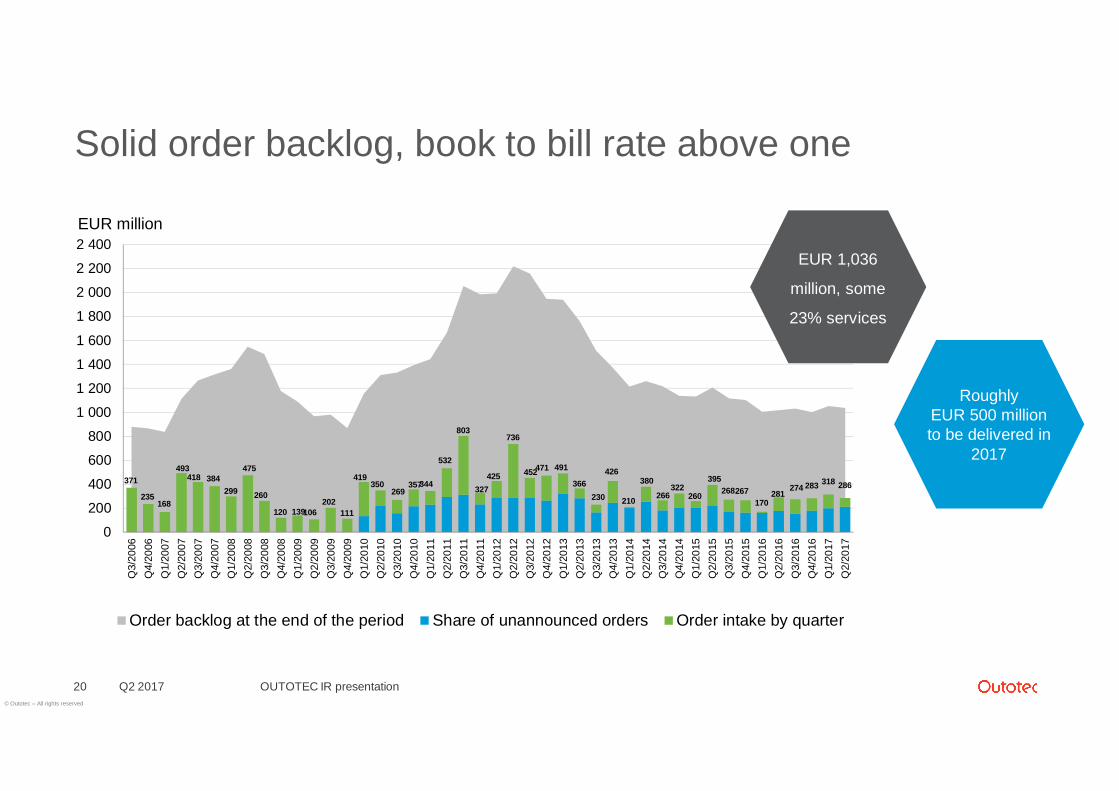
Solid order backlog, book to bill rate above one
Q2 2017 OUTOTEC IR presentation20
EUR million
371
235168
493418 384
299
475
260
120 139106202
111
419350
269357344
532
803
327425
736
452471 491
366230
426
210
380
266322
260
395268267
170281
274 283 318 286
0
200
400
600
800
1 000
1 200
1 400
1 600
1 800
2 000
2 200
2 400
Q3/
2006
Q4/
2006
Q1/
2007
Q2/
2007
Q3/
2007
Q4/
2007
Q1/
2008
Q2/
2008
Q3/
2008
Q4/
2008
Q1/
2009
Q2/
2009
Q3/
2009
Q4/
2009
Q1/
2010
Q2/
2010
Q3/
2010
Q4/
2010
Q1/
2011
Q2/
2011
Q3/
2011
Q4/
2011
Q1/
2012
Q2/
2012
Q3/
2012
Q4/
2012
Q1/
2013
Q2/
2013
Q3/
2013
Q4/
2013
Q1/
2014
Q2/
2014
Q3/
2014
Q4/
2014
Q1/
2015
Q2/
2015
Q3/
2015
Q4/
2015
Q1/
2016
Q2/
2016
Q3/
2016
Q4/
2016
Q1/
2017
Q2/
2017
Order backlog at the end of the period Share of unannounced orders Order intake by quarter
RoughlyEUR 500 millionto be delivered in
2017
EUR 1,036
million, some
23% services
© Outotec – All rights reserved
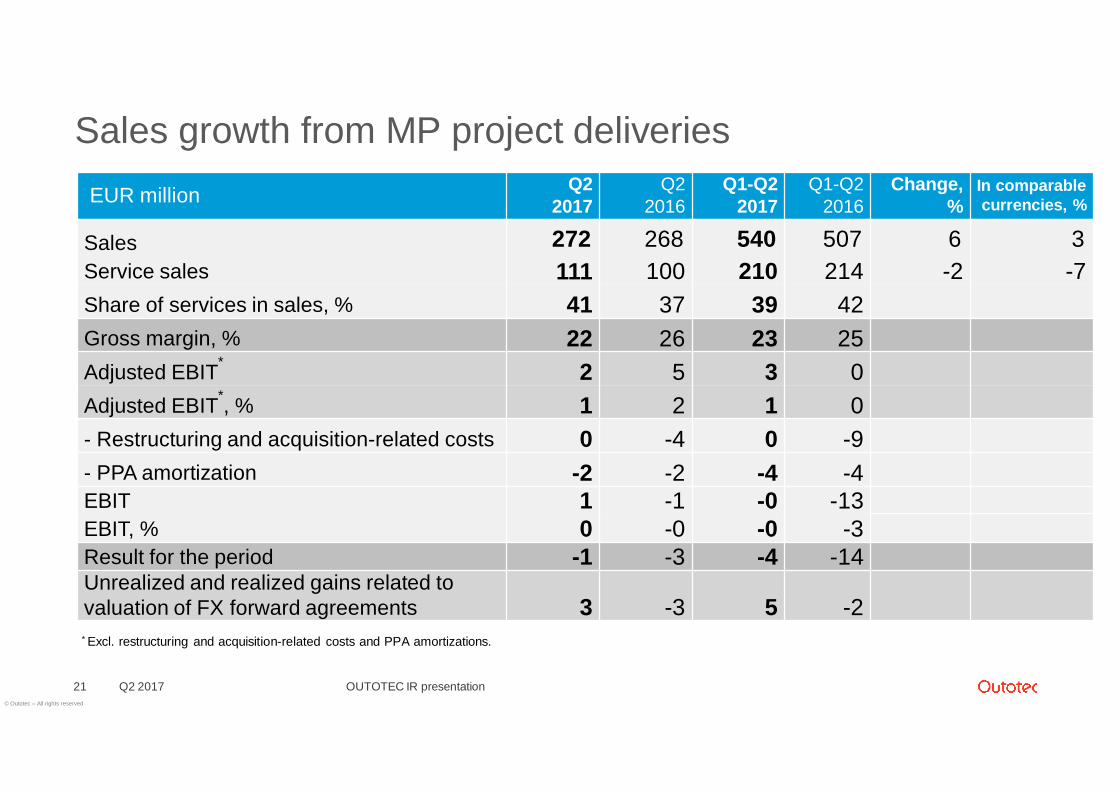
Sales growth from MP project deliveries
Q2 2017 OUTOTEC IR presentation21
EUR million Q22017
Q22016
Q1-Q22017
Q1-Q22016
Change,%
In comparablecurrencies, %
Sales 272 268 540 507 6 3Service sales 111 100 210 214 -2 -7Share of services in sales, % 41 37 39 42Gross margin, % 22 26 23 25Adjusted EBIT* 2 5 3 0Adjusted EBIT*, % 1 2 1 0- Restructuring and acquisition-related costs 0 -4 0 -9- PPA amortization -2 -2 -4 -4EBIT 1 -1 -0 -13EBIT, % 0 -0 -0 -3Result for the period -1 -3 -4 -14Unrealized and realized gains related tovaluation of FX forward agreements 3 -3 5 -2* Excl. restructuring and acquisition-related costs and PPA amortizations.
© Outotec – All rights reserved
3
0
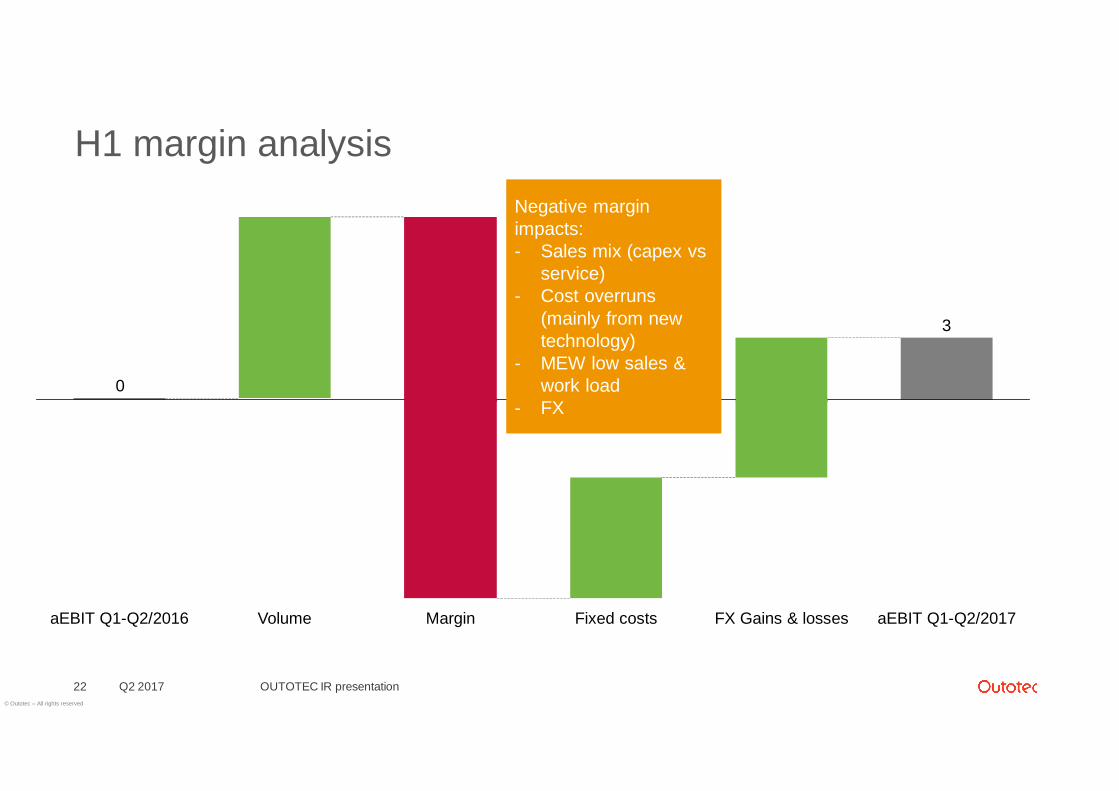
H1 margin analysis
Q2 2017 OUTOTEC IR presentation22
Negative marginimpacts:- Sales mix (capex vs
service)- Cost overruns
(mainly from newtechnology)
- MEW low sales &work load
- FX
FX Gains & losses aEBIT Q1-Q2/2017Fixed costsVolumeaEBIT Q1-Q2/2016 Margin
© Outotec – All rights reserved
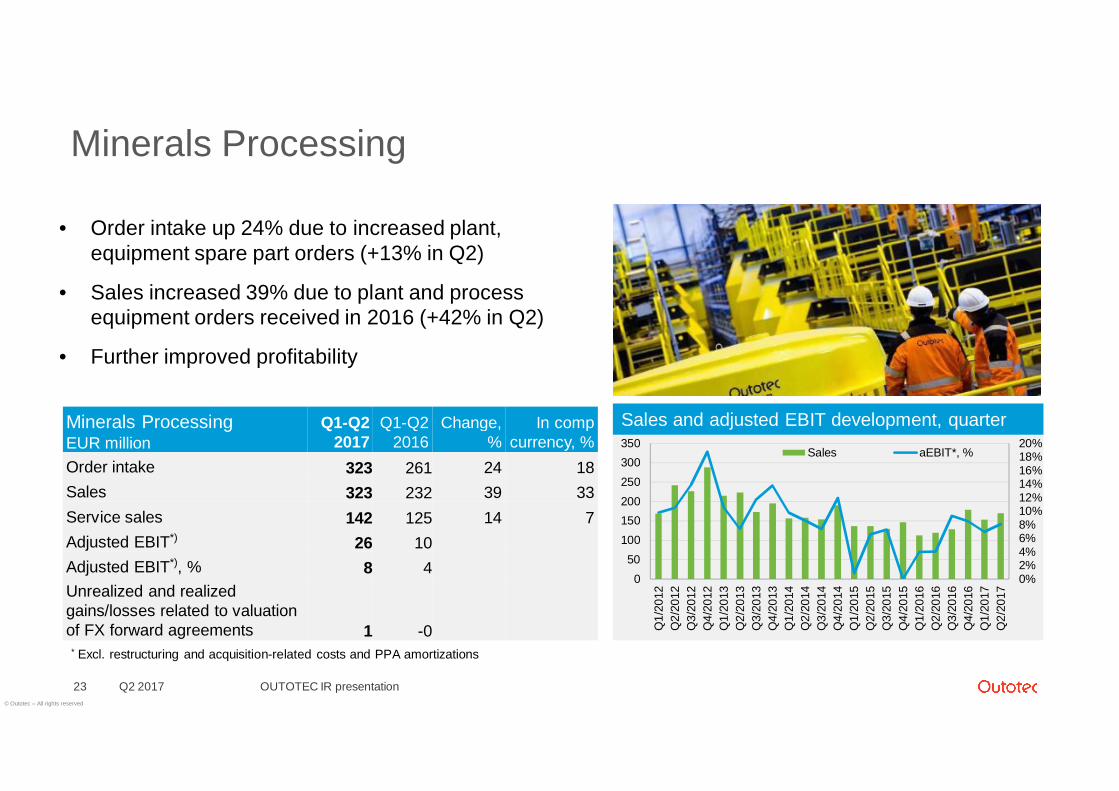
Minerals Processing
Q2 2017 OUTOTEC IR presentation23
0%2%4%6%8%10%12%14%16%18%20%
050
100150200250300350
Q1/
2012
Q2/
2012
Q3/
2012
Q4/
2012
Q1/
2013
Q2/
2013
Q3/
2013
Q4/
2013
Q1/
2014
Q2/
2014
Q3/
2014
Q4/
2014
Q1/
2015
Q2/
2015
Q3/
2015
Q4/
2015
Q1/
2016
Q2/
2016
Q3/
2016
Q4/
2016
Q1/
2017
Q2/
2017
Sales aEBIT*, %
Sales and adjusted EBIT development, quarter
• Order intake up 24% due to increased plant,equipment spare part orders (+13% in Q2)
• Sales increased 39% due to plant and processequipment orders received in 2016 (+42% in Q2)
• Further improved profitability
Minerals ProcessingEUR million
Q1-Q22017
Q1-Q22016
Change,%
In compcurrency, %
Order intake 323 261 24 18Sales 323 232 39 33Service sales 142 125 14 7Adjusted EBIT*) 26 10Adjusted EBIT*), % 8 4Unrealized and realizedgains/losses related to valuationof FX forward agreements 1 -0
* Excl. restructuring and acquisition-related costs and PPA amortizations
© Outotec – All rights reserved
-40%
-30%
-20%
-10%
0%
10%
20%
050
100150200250300350400
Q1/
2012
Q2/
2012
Q3/
2012
Q4/
2012
Q1/
2013
Q2/
2013
Q3/
2013
Q4/
2013
Q1/
2014
Q2/
2014
Q3/
2014
Q4/
2014
Q1/
2015
Q2/
2015
Q3/
2015
Q4/
2015
Q1/
2016
Q2/
2016
Q3/
2016
Q4/
2016
Q1/
2017
Q2/
2017
Sales aEBIT*, %
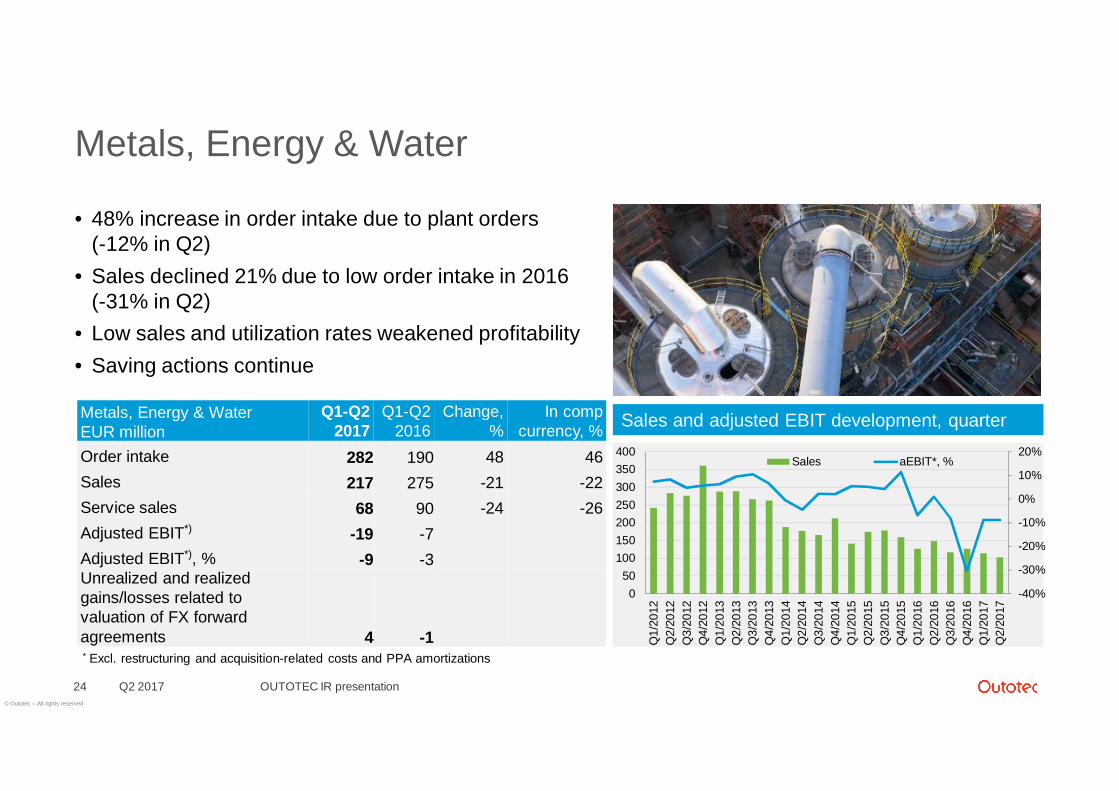
Metals, Energy & Water
• 48% increase in order intake due to plant orders(-12% in Q2)
• Sales declined 21% due to low order intake in 2016(-31% in Q2)
• Low sales and utilization rates weakened profitability• Saving actions continue
Q2 2017 OUTOTEC IR presentation24
Metals, Energy & WaterEUR million
Q1-Q22017
Q1-Q22016
Change,%
In compcurrency, %
Order intake 282 190 48 46Sales 217 275 -21 -22Service sales 68 90 -24 -26Adjusted EBIT*) -19 -7Adjusted EBIT*), % -9 -3Unrealized and realizedgains/losses related tovaluation of FX forwardagreements 4 -1* Excl. restructuring and acquisition-related costs and PPA amortizations
Sales and adjusted EBIT development, quarter
© Outotec – All rights reserved
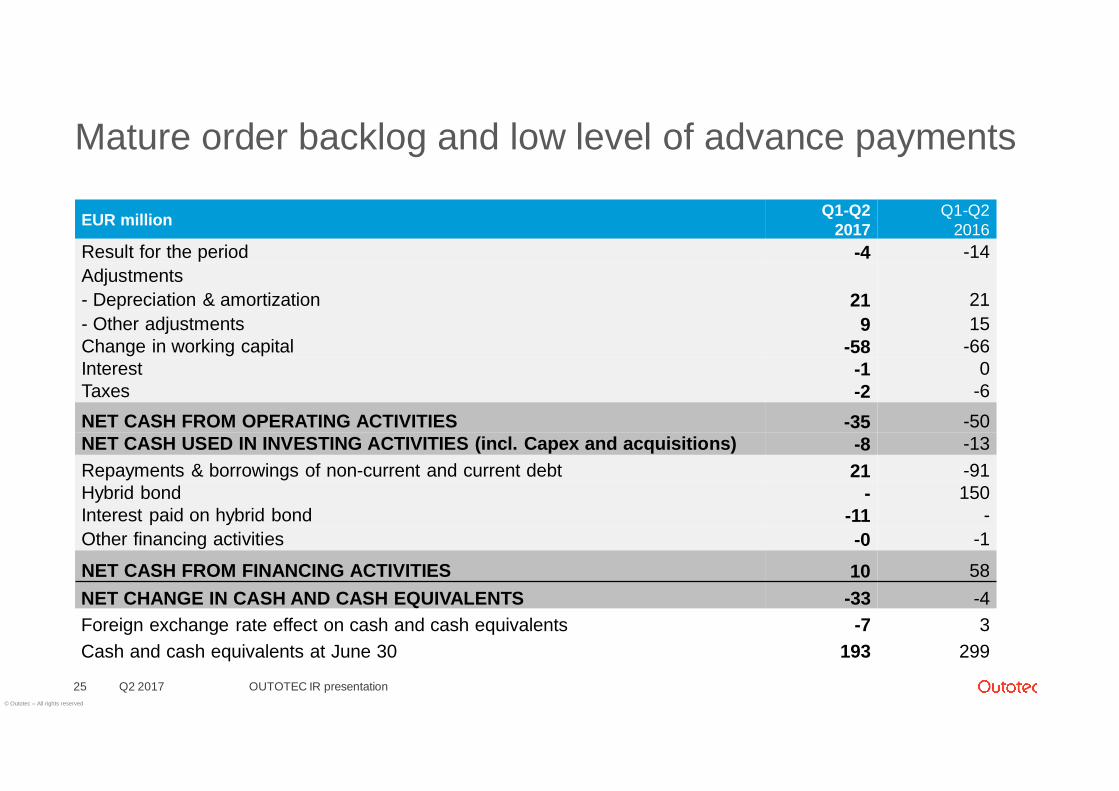
Mature order backlog and low level of advance payments
Q2 2017 OUTOTEC IR presentation25
EUR million Q1-Q22017
Q1-Q22016
Result for the period -4 -14Adjustments- Depreciation & amortization 21 21- Other adjustments 9 15Change in working capital -58 -66Interest -1 0Taxes -2 -6NET CASH FROM OPERATING ACTIVITIES -35 -50NET CASH USED IN INVESTING ACTIVITIES (incl. Capex and acquisitions) -8 -13Repayments & borrowings of non-current and current debt 21 -91Hybrid bond - 150Interest paid on hybrid bond -11 -Other financing activities -0 -1
NET CASH FROM FINANCING ACTIVITIES 10 58NET CHANGE IN CASH AND CASH EQUIVALENTS -33 -4Foreign exchange rate effect on cash and cash equivalents -7 3Cash and cash equivalents at June 30 193 299
© Outotec – All rights reserved
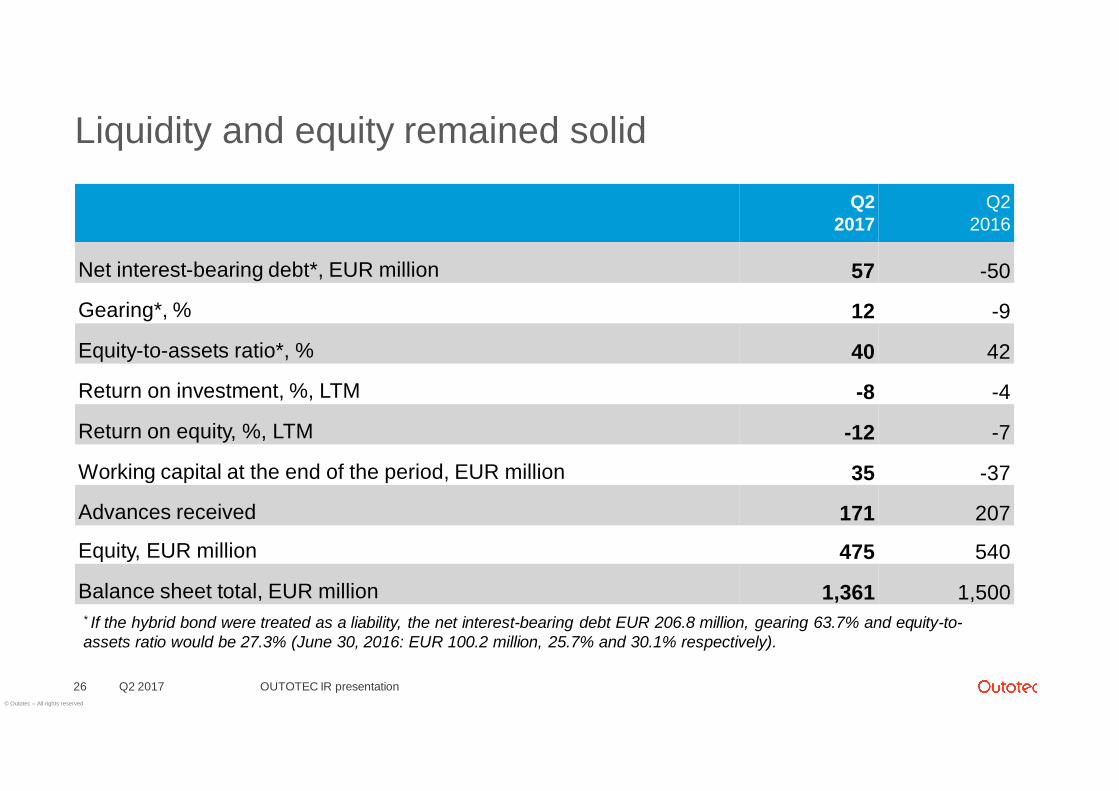
Liquidity and equity remained solid
Q2 2017 OUTOTEC IR presentation26
Q22017
Q22016
Net interest-bearing debt*, EUR million 57 -50
Gearing*, % 12 -9
Equity-to-assets ratio*, % 40 42
Return on investment, %, LTM -8 -4
Return on equity, %, LTM -12 -7
Working capital at the end of the period, EUR million 35 -37
Advances received 171 207
Equity, EUR million 475 540
Balance sheet total, EUR million 1,361 1,500* If the hybrid bond were treated as a liability, the net interest-bearing debt EUR 206.8 million, gearing 63.7% and equity-to-assets ratio would be 27.3% (June 30, 2016: EUR 100.2 million, 25.7% and 30.1% respectively).
© Outotec – All rights reserved
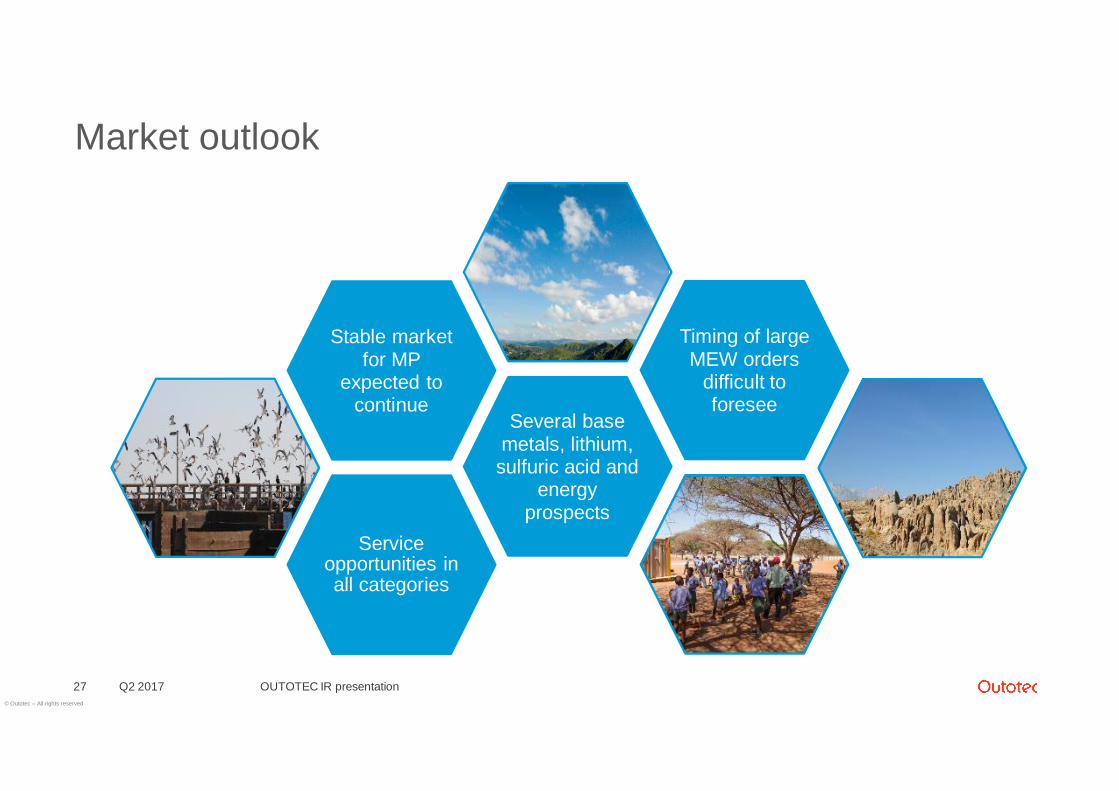
Market outlook
Q2 2017 OUTOTEC IR presentation27
Serviceopportunities inall categories
Several basemetals, lithium,sulfuric acid and
energyprospects
Stable marketfor MP
expected tocontinue
Timing of largeMEW orders
difficult toforesee
© Outotec – All rights reserved
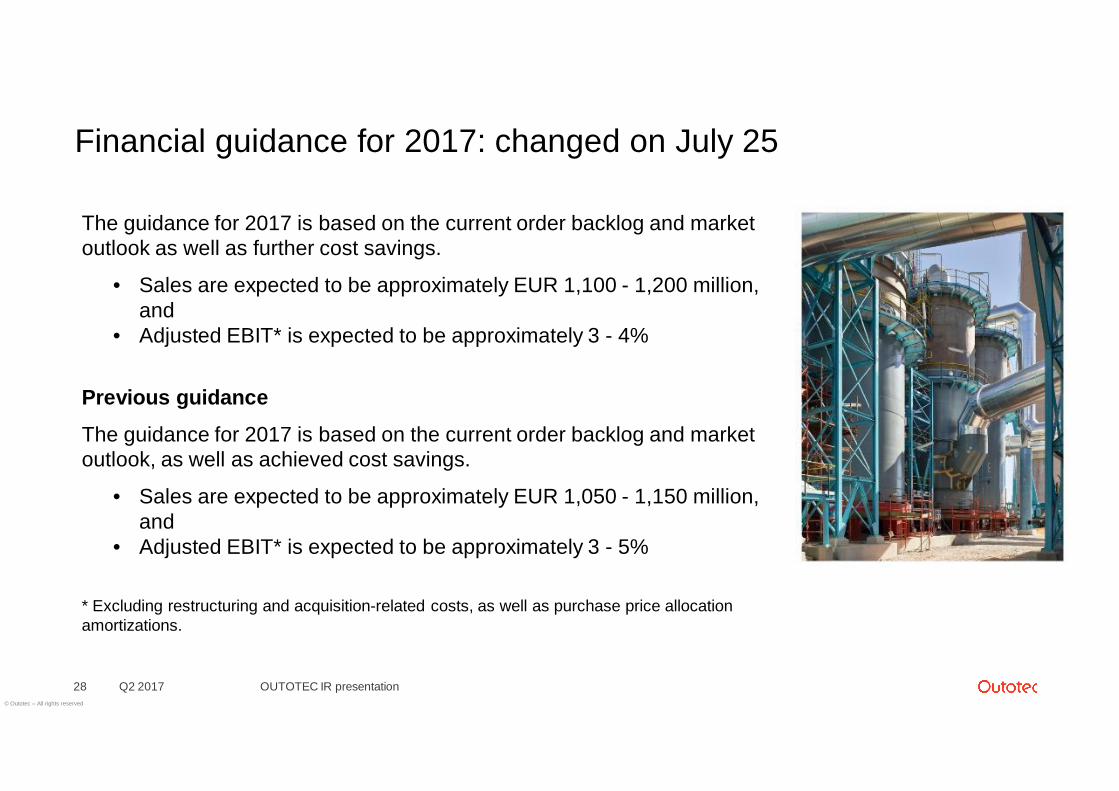
Financial guidance for 2017: changed on July 25
Q2 2017 OUTOTEC IR presentation28
The guidance for 2017 is based on the current order backlog and marketoutlook as well as further cost savings.
• Sales are expected to be approximately EUR 1,100 - 1,200 million,and
• Adjusted EBIT* is expected to be approximately 3 - 4%
Previous guidance
The guidance for 2017 is based on the current order backlog and marketoutlook, as well as achieved cost savings.
• Sales are expected to be approximately EUR 1,050 - 1,150 million,and
• Adjusted EBIT* is expected to be approximately 3 - 5%
* Excluding restructuring and acquisition-related costs, as well as purchase price allocationamortizations.
© Outotec – All rights reserved
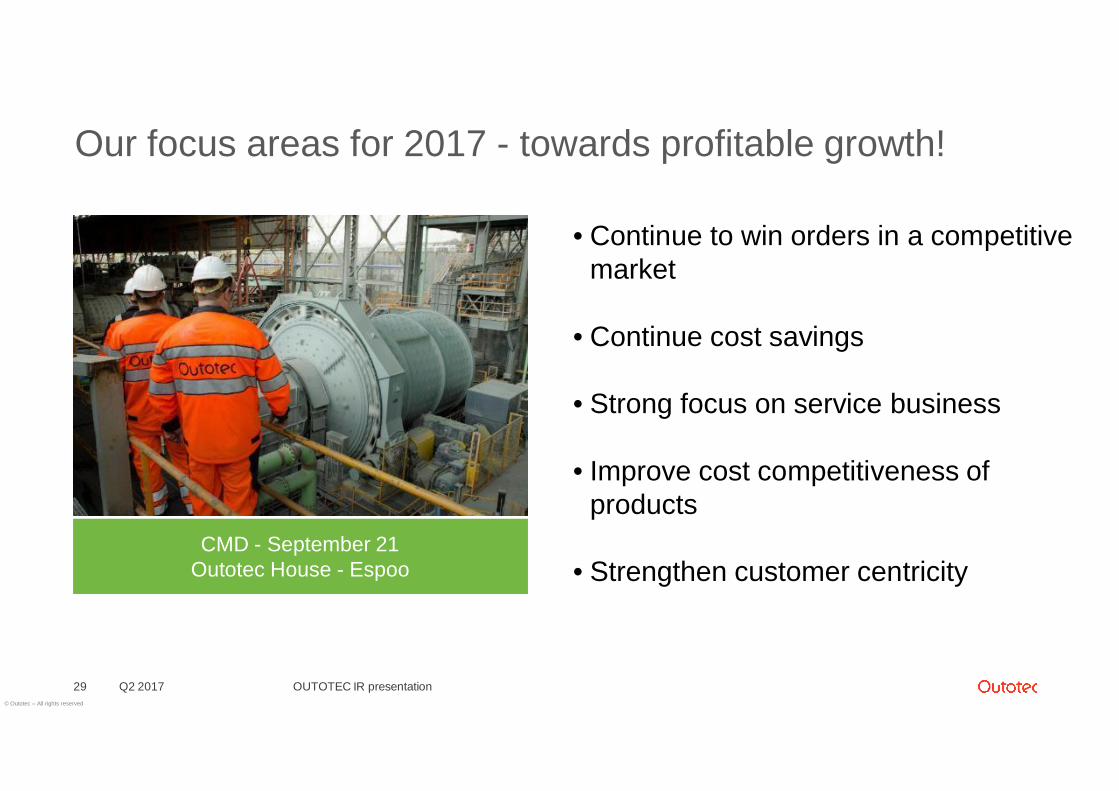
Our focus areas for 2017 - towards profitable growth!
Q2 2017 OUTOTEC IR presentation29
• Continue to win orders in a competitivemarket
• Continue cost savings
• Strong focus on service business
• Improve cost competitiveness ofproducts
• Strengthen customer centricityCMD - September 21
Outotec House - Espoo
© Outotec – All rights reserved
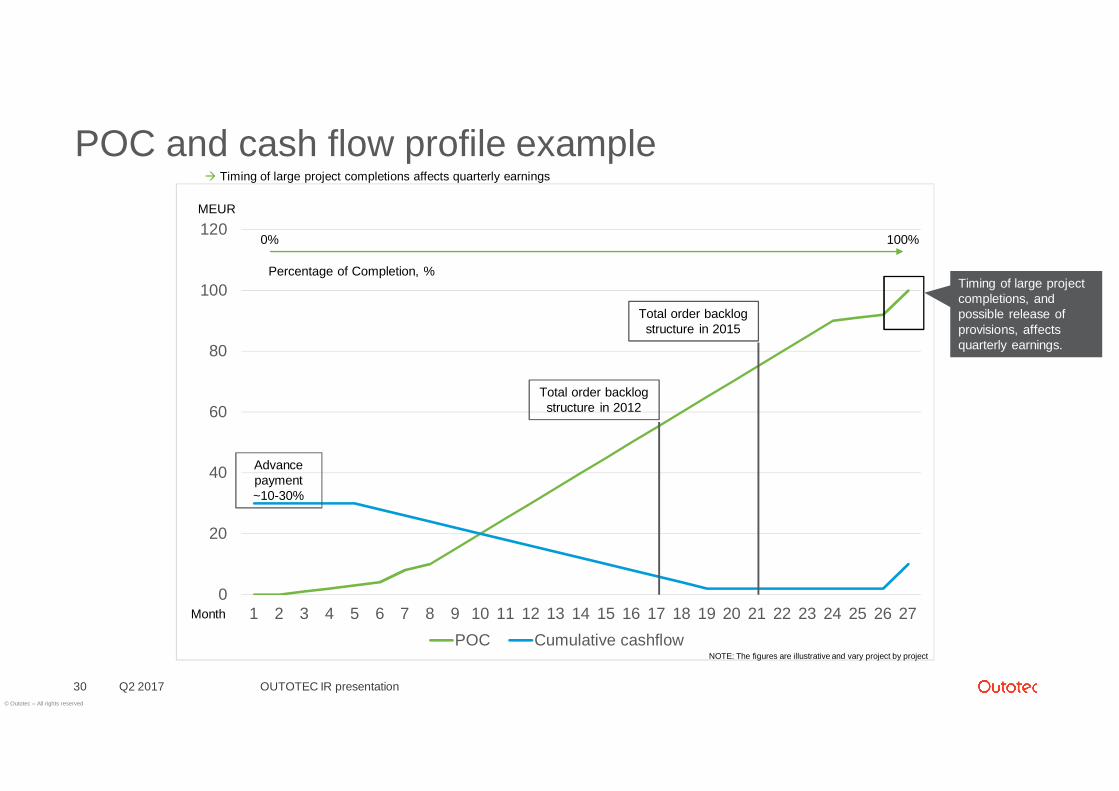
POC and cash flow profile example
Q2 2017 OUTOTEC IR presentation30
0
20
40
60
80
100
120
1 2 3 4 5 6 7 8 9 10 11 12 13 14 15 16 17 18 19 20 21 22 23 24 25 26 27POC Cumulative cashflow
MEUR
Month
Total order backlogstructure in 2012
Total order backlogstructure in 2015
0% 100%
Percentage of Completion, %Timing of large projectcompletions, andpossible release ofprovisions, affectsquarterly earnings.
Advancepayment~10-30%
NOTE: The figures are illustrative and vary project by project
Timing of large project completions affects quarterly earnings
© Outotec – All rights reserved
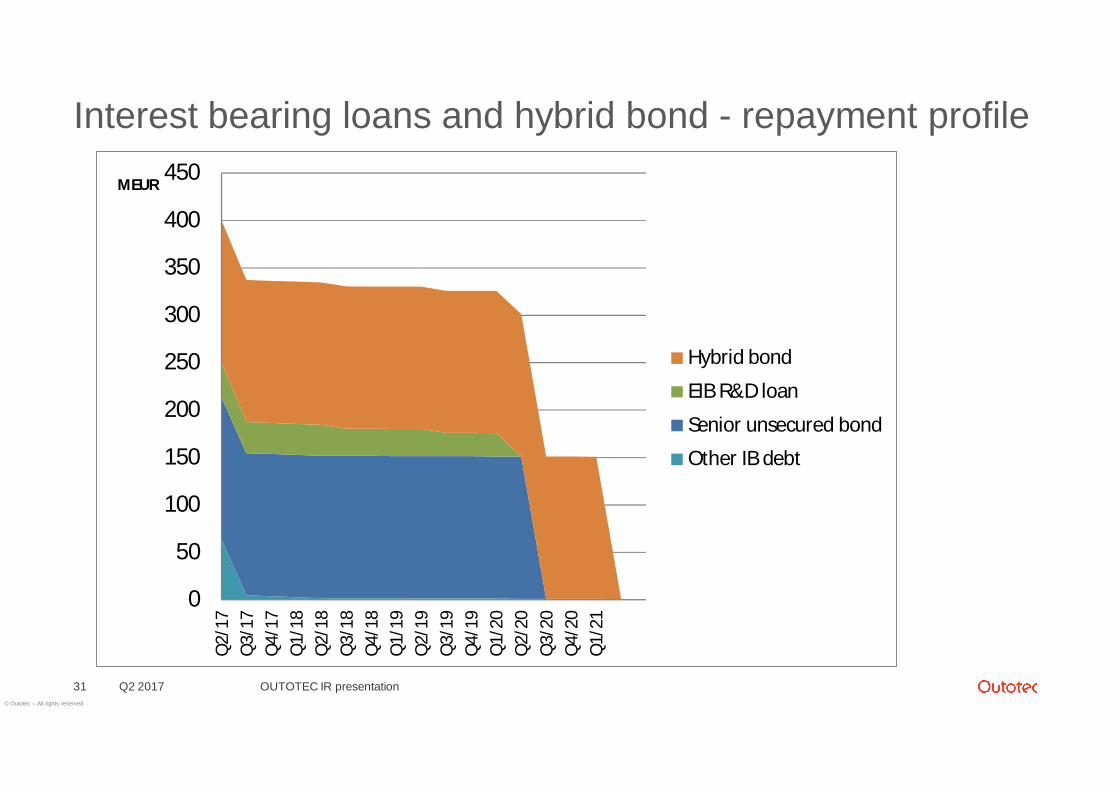
Interest bearing loans and hybrid bond - repayment profile
Q2 201731
0
50
100
150
200
250
300
350
400
450
Q2/
17Q
3/17
Q4/
17Q
1/18
Q2/
18Q
3/18
Q4/
18Q
1/19
Q2/
19Q
3/19
Q4/
19Q
1/20
Q2/
20Q
3/20
Q4/
20Q
1/21
MEUR
Hybrid bond
EIB R&D loan
Senior unsecured bond
Other IB debt
OUTOTEC IR presentation
© Outotec – All rights reserved
Customer solutions
Q2 2017 OUTOTEC IR presentation32
© Outotec – All rights reserved
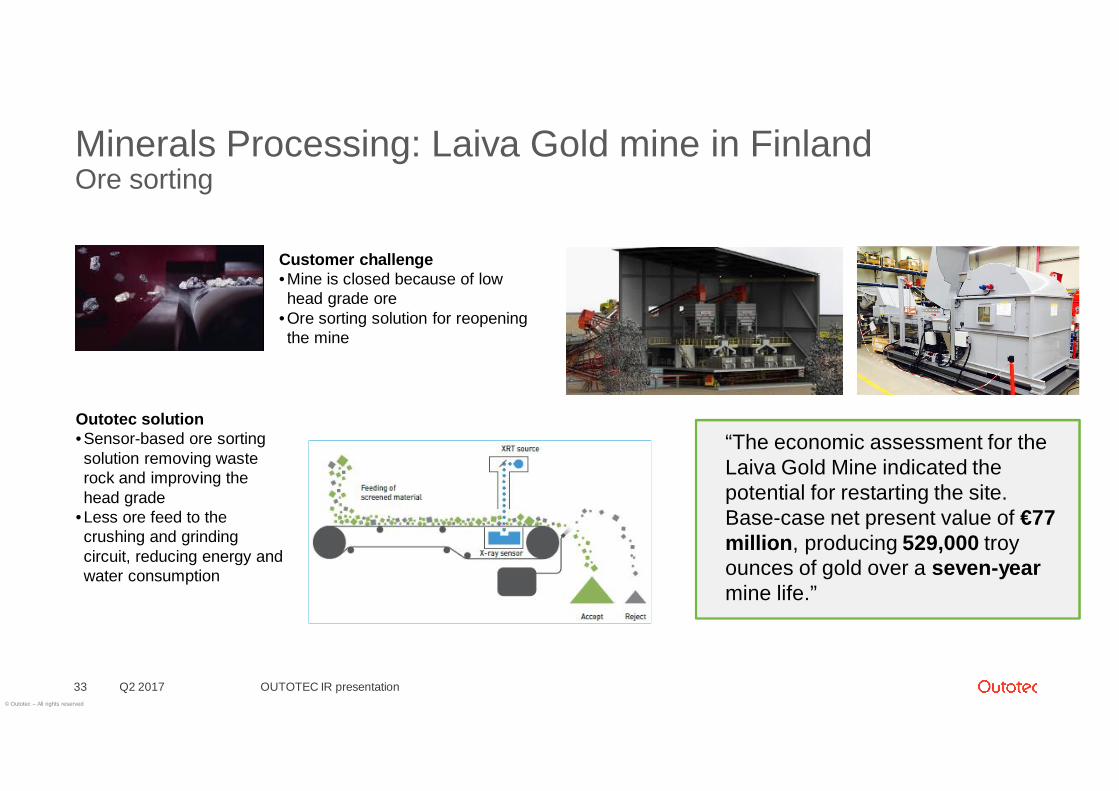
Minerals Processing: Laiva Gold mine in FinlandOre sorting
Q2 2017 OUTOTEC IR presentation33
Outotec solution• Sensor-based ore sortingsolution removing wasterock and improving thehead grade
• Less ore feed to thecrushing and grindingcircuit, reducing energy andwater consumption
Customer challenge• Mine is closed because of lowhead grade ore
• Ore sorting solution for reopeningthe mine
“The economic assessment for theLaiva Gold Mine indicated thepotential for restarting the site.Base-case net present value of €77million, producing 529,000 troyounces of gold over a seven-yearmine life.”
© Outotec – All rights reserved
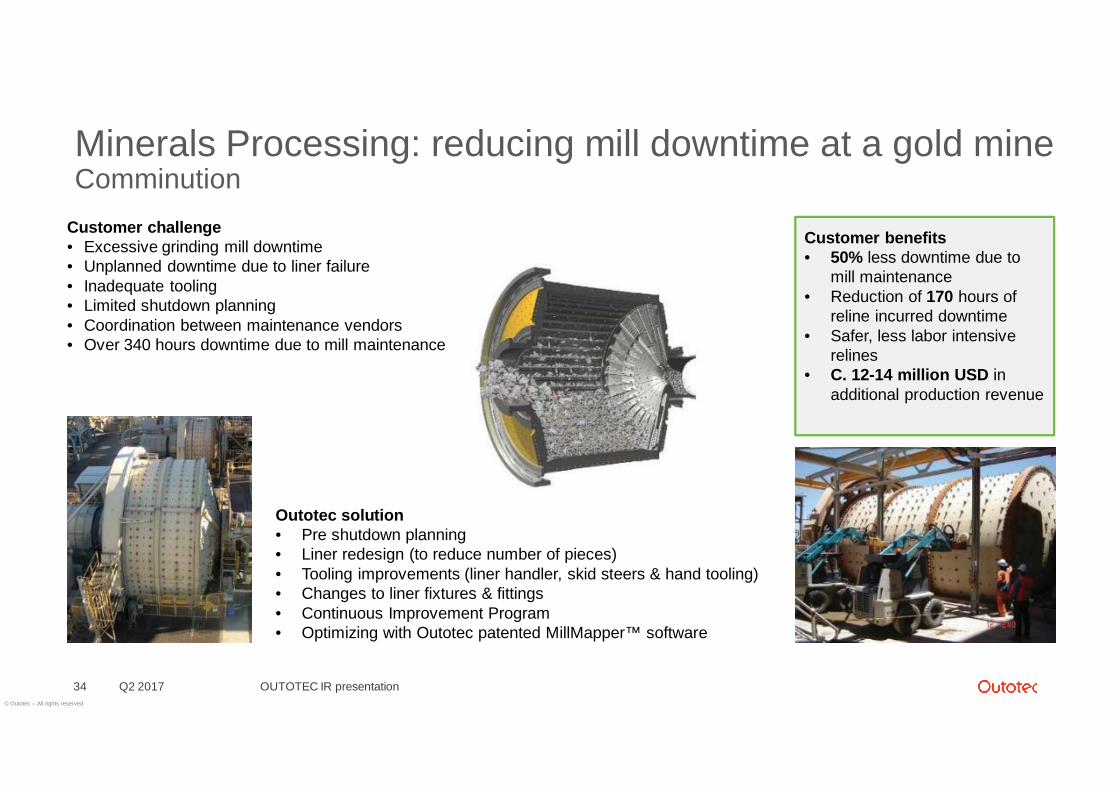
Minerals Processing: reducing mill downtime at a gold mineComminution
Q2 2017 OUTOTEC IR presentation34
Customer challenge• Excessive grinding mill downtime• Unplanned downtime due to liner failure• Inadequate tooling• Limited shutdown planning• Coordination between maintenance vendors• Over 340 hours downtime due to mill maintenance
Outotec solution• Pre shutdown planning• Liner redesign (to reduce number of pieces)• Tooling improvements (liner handler, skid steers & hand tooling)• Changes to liner fixtures & fittings• Continuous Improvement Program• Optimizing with Outotec patented MillMapper™ software
Customer benefits• 50% less downtime due to
mill maintenance• Reduction of 170 hours of
reline incurred downtime• Safer, less labor intensive
relines• C. 12-14 million USD in
additional production revenue
© Outotec – All rights reserved
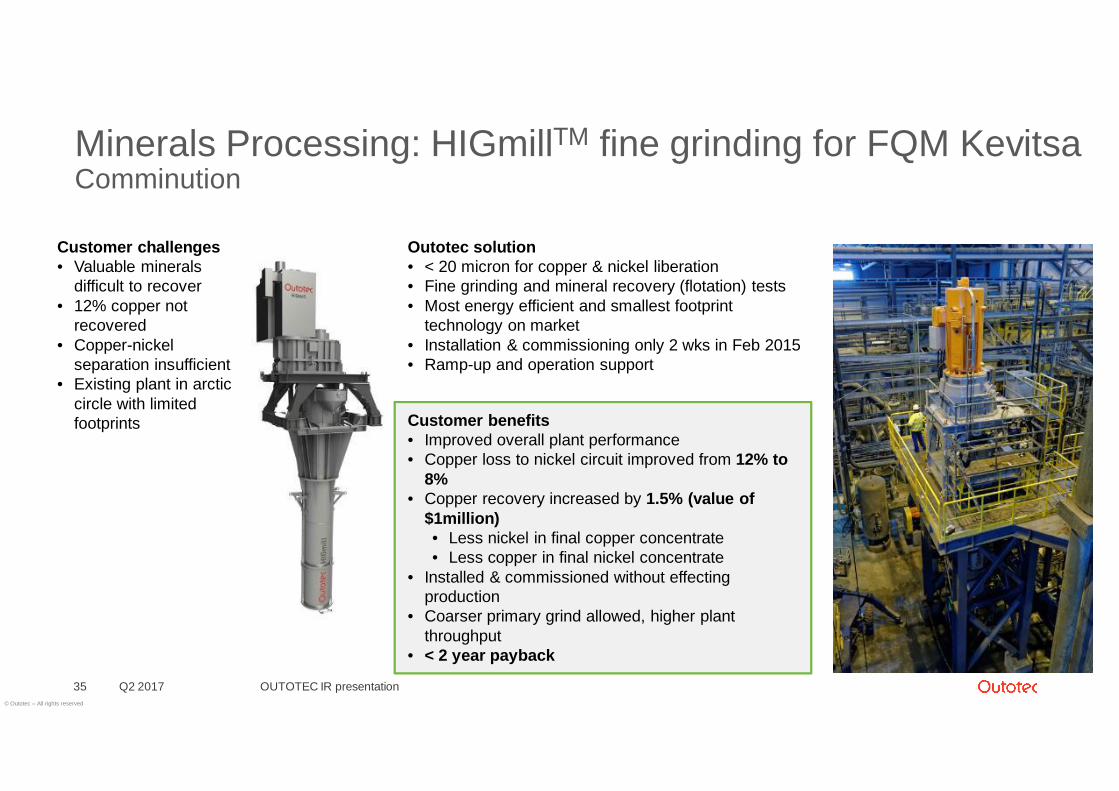
Minerals Processing: HIGmillTM fine grinding for FQM KevitsaComminution
Customer challenges• Valuable minerals
difficult to recover• 12% copper not
recovered• Copper-nickel
separation insufficient• Existing plant in arctic
circle with limitedfootprints
Q2 2017 OUTOTEC IR presentation35
Outotec solution• < 20 micron for copper & nickel liberation• Fine grinding and mineral recovery (flotation) tests• Most energy efficient and smallest footprint
technology on market• Installation & commissioning only 2 wks in Feb 2015• Ramp-up and operation support
Customer benefits• Improved overall plant performance• Copper loss to nickel circuit improved from 12% to
8%• Copper recovery increased by 1.5% (value of
$1million)• Less nickel in final copper concentrate• Less copper in final nickel concentrate
• Installed & commissioned without effectingproduction
• Coarser primary grind allowed, higher plantthroughput
• < 2 year payback
© Outotec – All rights reserved
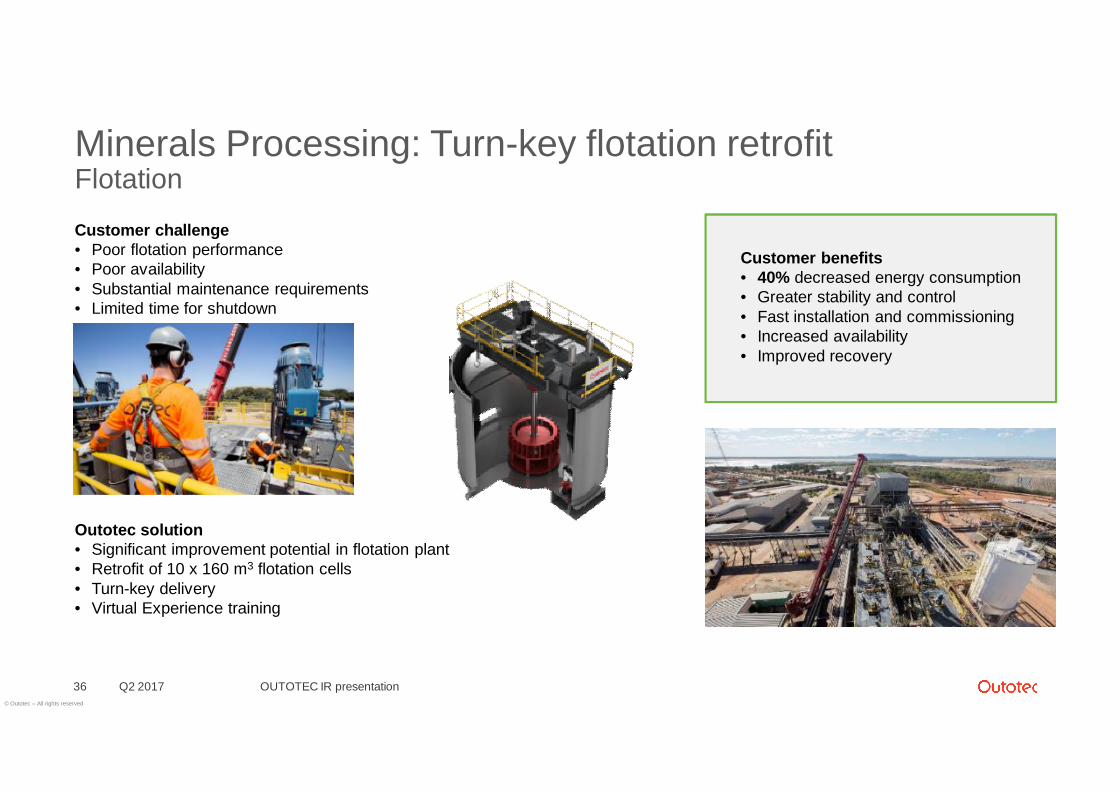
Minerals Processing: Turn-key flotation retrofitFlotation
Customer challenge• Poor flotation performance• Poor availability• Substantial maintenance requirements• Limited time for shutdown
Q2 2017 OUTOTEC IR presentation36
Customer benefits• 40% decreased energy consumption• Greater stability and control• Fast installation and commissioning• Increased availability• Improved recovery
Outotec solution• Significant improvement potential in flotation plant• Retrofit of 10 x 160 m3 flotation cells• Turn-key delivery• Virtual Experience training
© Outotec – All rights reserved
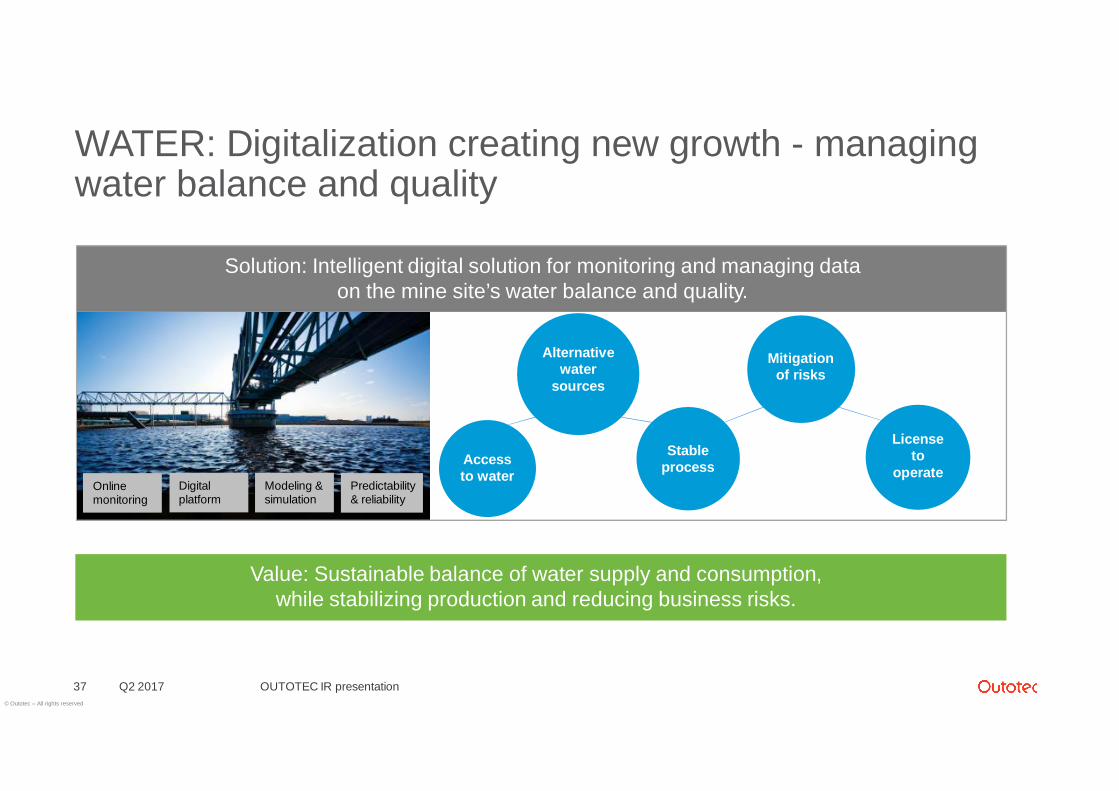
WATER: Digitalization creating new growth - managingwater balance and quality
Q2 2017 OUTOTEC IR presentation37
Solution: Intelligent digital solution for monitoring and managing dataon the mine site’s water balance and quality.
Value: Sustainable balance of water supply and consumption,while stabilizing production and reducing business risks.
Onlinemonitoring
Digitalplatform
Modeling &simulation
Predictability& reliability
Accessto water
Alternativewater
sources
Stableprocess
Mitigationof risks
Licenseto
operate
© Outotec – All rights reserved
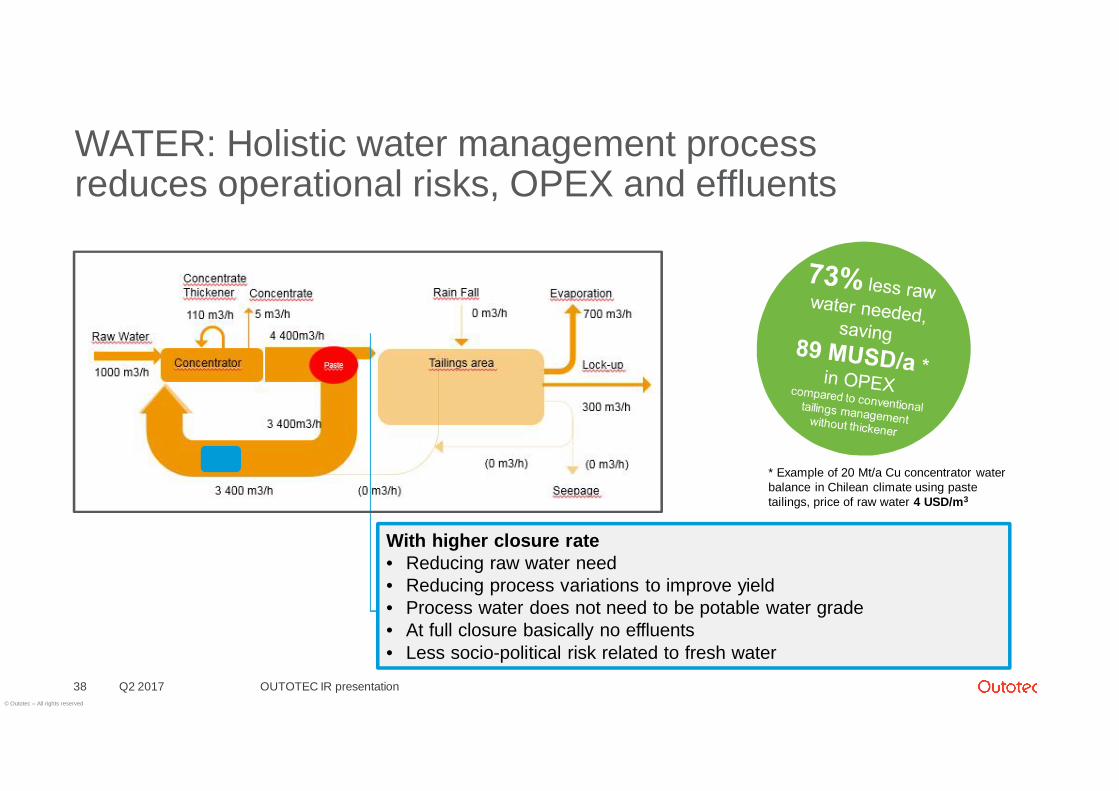
WATER: Holistic water management processreduces operational risks, OPEX and effluents
Q2 201738
With higher closure rate• Reducing raw water need• Reducing process variations to improve yield• Process water does not need to be potable water grade• At full closure basically no effluents• Less socio-political risk related to fresh water
OUTOTEC IR presentation
* Example of 20 Mt/a Cu concentrator waterbalance in Chilean climate using pastetailings, price of raw water 4 USD/m3
© Outotec – All rights reserved
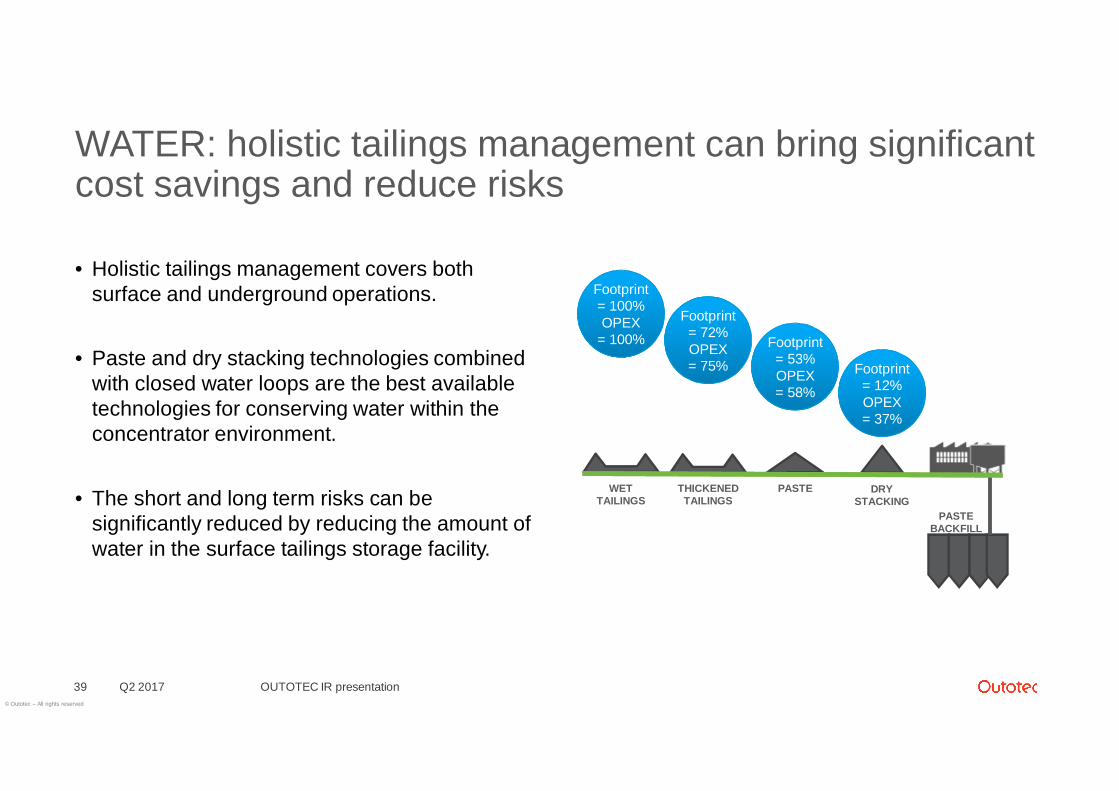
WATER: holistic tailings management can bring significantcost savings and reduce risks
• Holistic tailings management covers bothsurface and underground operations.
• Paste and dry stacking technologies combinedwith closed water loops are the best availabletechnologies for conserving water within theconcentrator environment.
• The short and long term risks can besignificantly reduced by reducing the amount ofwater in the surface tailings storage facility.
Q2 2017 OUTOTEC IR presentation39
PASTEBACKFILL
DRYSTACKING
Footprint= 12%OPEX= 37%
PASTE
Footprint= 53%OPEX= 58%
THICKENEDTAILINGS
Footprint= 72%OPEX= 75%
WETTAILINGS
Footprint= 100%OPEX
= 100%
© Outotec – All rights reserved
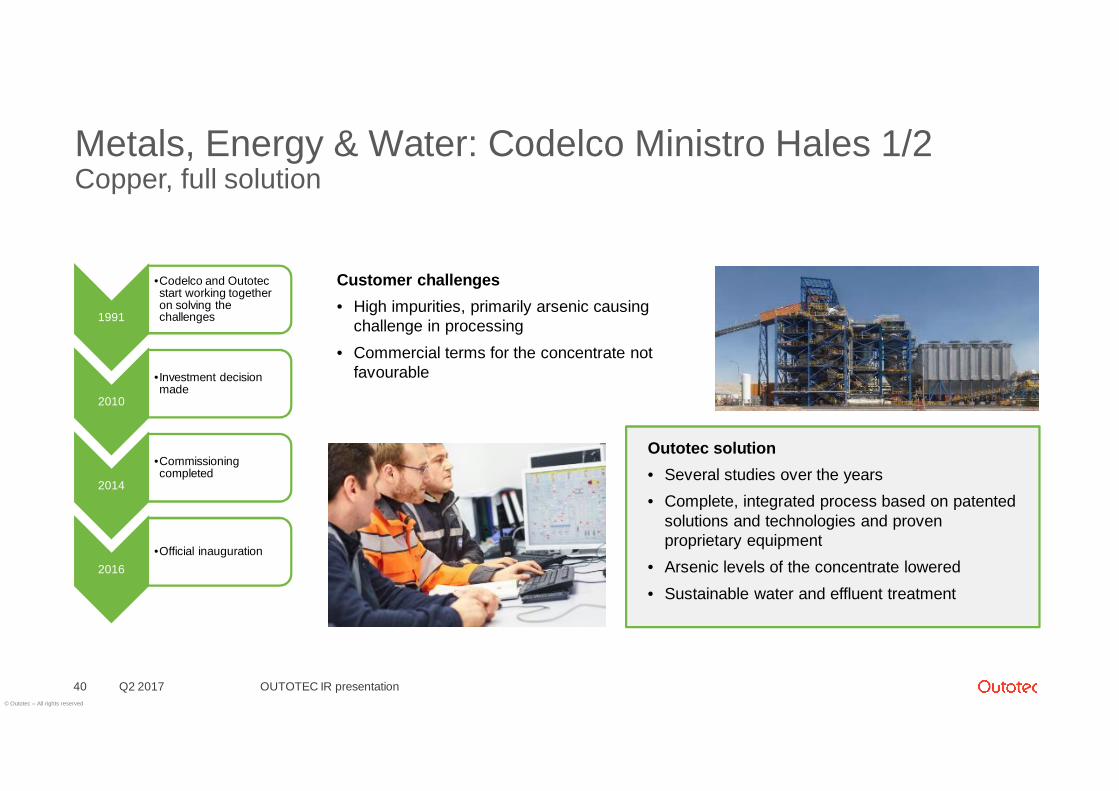
Metals, Energy & Water: Codelco Ministro Hales 1/2Copper, full solution
Q2 201740
Customer challenges• High impurities, primarily arsenic causing
challenge in processing• Commercial terms for the concentrate not
favourable
OUTOTEC IR presentation
Outotec solution• Several studies over the years• Complete, integrated process based on patented
solutions and technologies and provenproprietary equipment
• Arsenic levels of the concentrate lowered• Sustainable water and effluent treatment
1991
•Codelco and Outotecstart working togetheron solving thechallenges
2010
•Investment decisionmade
2014
•Commissioningcompleted
2016•Official inauguration
© Outotec – All rights reserved
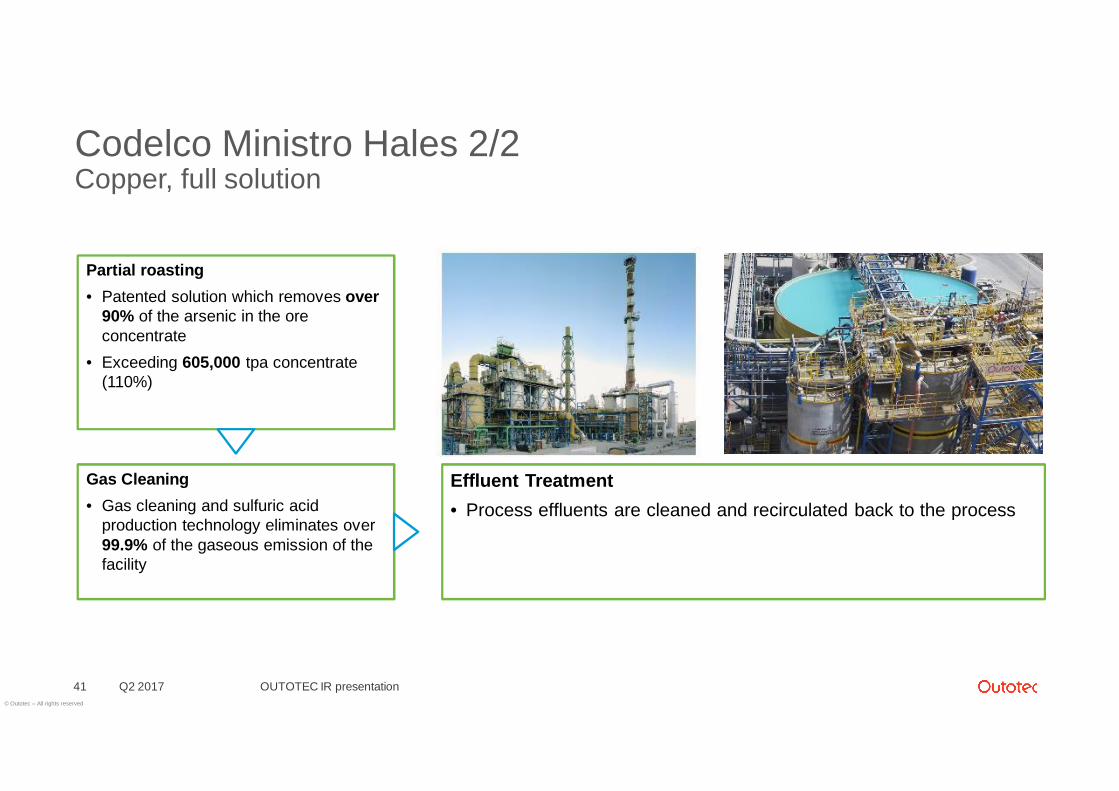
Codelco Ministro Hales 2/2Copper, full solution
Q2 2017 OUTOTEC IR presentation41
Partial roasting• Patented solution which removes over
90% of the arsenic in the oreconcentrate
• Exceeding 605,000 tpa concentrate(110%)
Gas Cleaning• Gas cleaning and sulfuric acid
production technology eliminates over99.9% of the gaseous emission of thefacility
Effluent Treatment• Process effluents are cleaned and recirculated back to the process
© Outotec – All rights reserved
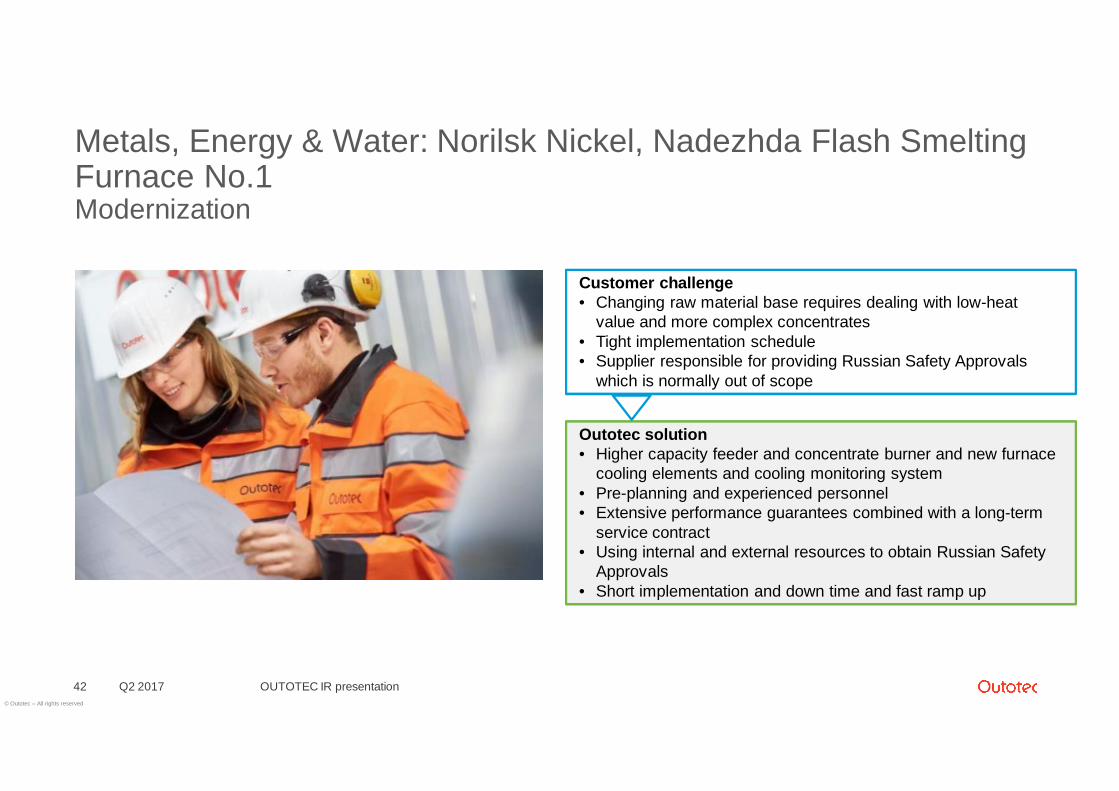
Metals, Energy & Water: Norilsk Nickel, Nadezhda Flash SmeltingFurnace No.1Modernization
Q2 201742 OUTOTEC IR presentation
Customer challenge• Changing raw material base requires dealing with low-heat
value and more complex concentrates• Tight implementation schedule• Supplier responsible for providing Russian Safety Approvals
which is normally out of scope
Outotec solution• Higher capacity feeder and concentrate burner and new furnace
cooling elements and cooling monitoring system• Pre-planning and experienced personnel• Extensive performance guarantees combined with a long-term
service contract• Using internal and external resources to obtain Russian Safety
Approvals• Short implementation and down time and fast ramp up
© Outotec – All rights reserved
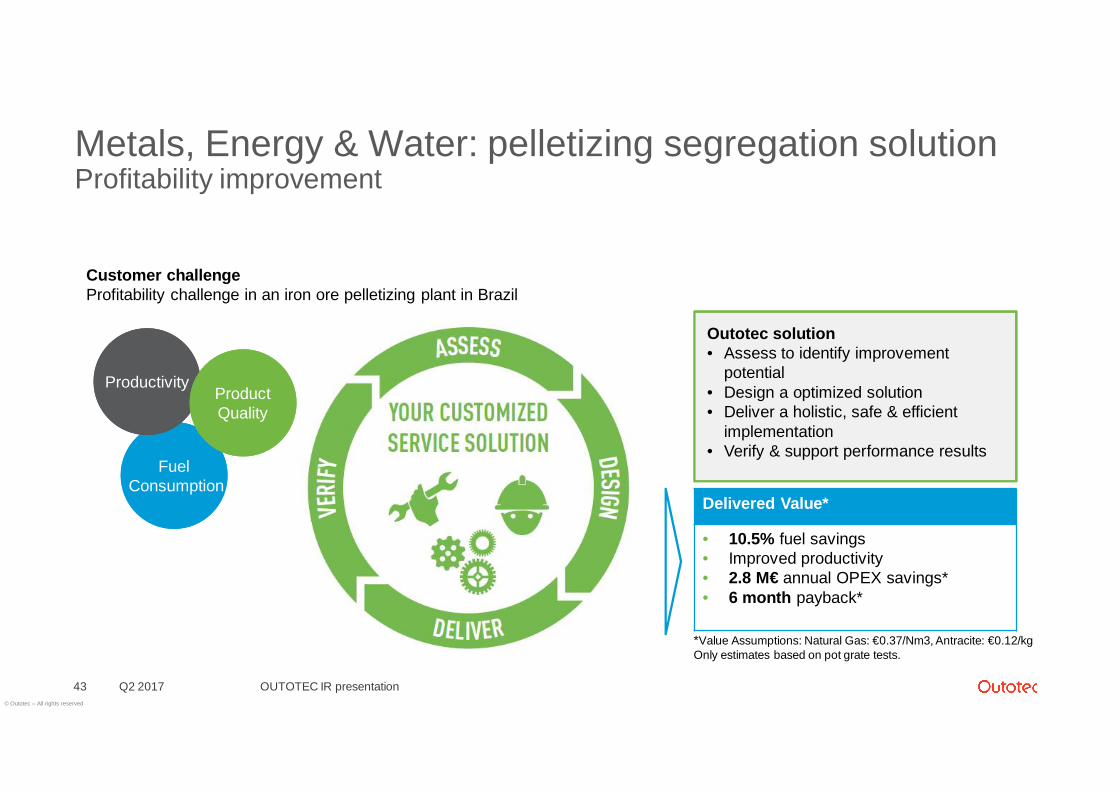
Metals, Energy & Water: pelletizing segregation solutionProfitability improvement
OUTOTEC IR presentationQ2 201743
Customer challengeProfitability challenge in an iron ore pelletizing plant in Brazil
FuelConsumption
FuelConsumption
ProductivityProductivityProductQualityProductQuality
Outotec solution• Assess to identify improvement
potential• Design a optimized solution• Deliver a holistic, safe & efficient
implementation• Verify & support performance results
Delivered Value*
• 10.5% fuel savings• Improved productivity• 2.8 M€ annual OPEX savings*• 6 month payback*
*Value Assumptions: Natural Gas: €0.37/Nm3, Antracite: €0.12/kgOnly estimates based on pot grate tests.
© Outotec – All rights reserved
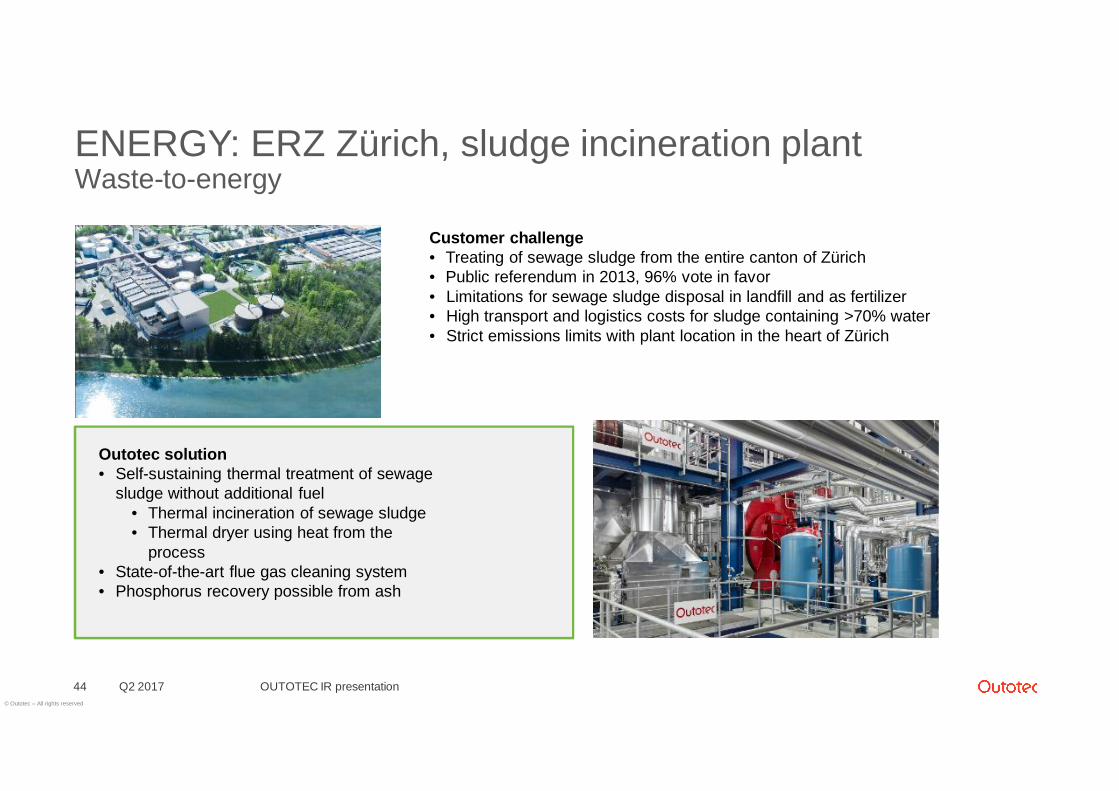
ENERGY: ERZ Zürich, sludge incineration plantWaste-to-energy
Q2 201744
Customer challenge• Treating of sewage sludge from the entire canton of Zürich• Public referendum in 2013, 96% vote in favor• Limitations for sewage sludge disposal in landfill and as fertilizer• High transport and logistics costs for sludge containing >70% water• Strict emissions limits with plant location in the heart of Zürich
OUTOTEC IR presentation
Outotec solution• Self-sustaining thermal treatment of sewage
sludge without additional fuel• Thermal incineration of sewage sludge• Thermal dryer using heat from the
process• State-of-the-art flue gas cleaning system• Phosphorus recovery possible from ash
© Outotec – All rights reserved
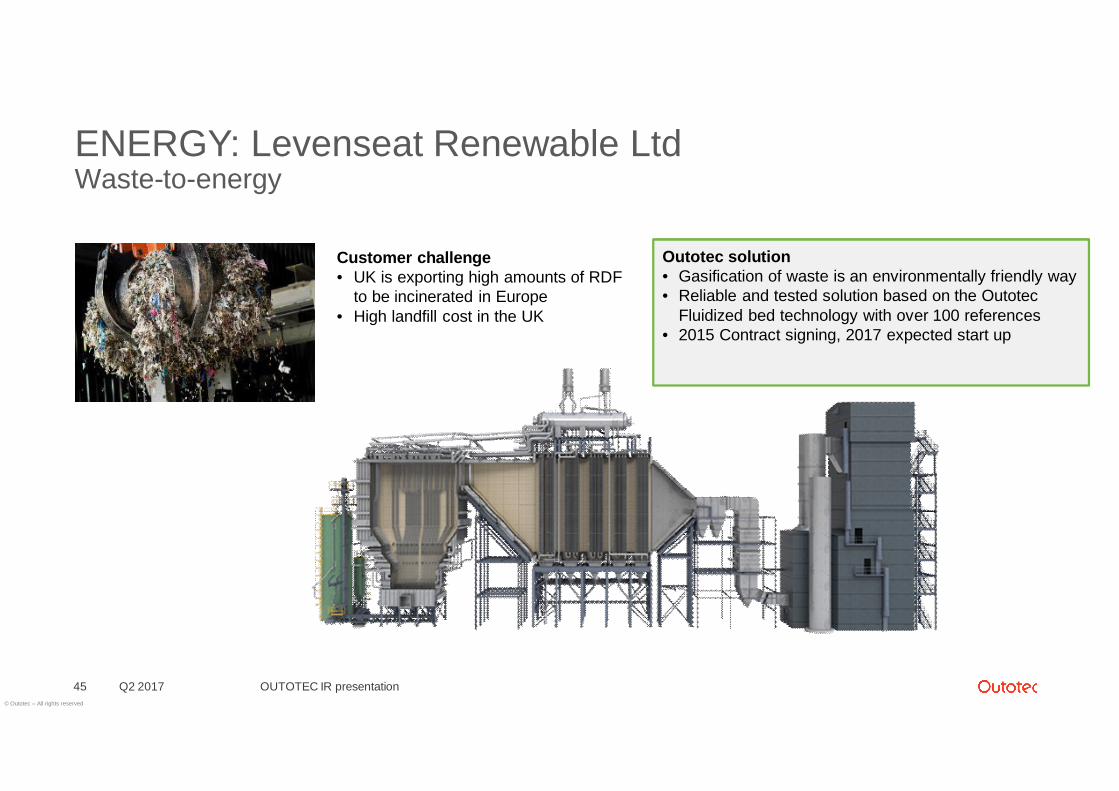
ENERGY: Levenseat Renewable LtdWaste-to-energy
Q2 201745
Customer challenge• UK is exporting high amounts of RDF
to be incinerated in Europe• High landfill cost in the UK
OUTOTEC IR presentation
Outotec solution• Gasification of waste is an environmentally friendly way• Reliable and tested solution based on the Outotec
Fluidized bed technology with over 100 references• 2015 Contract signing, 2017 expected start up
© Outotec – All rights reserved
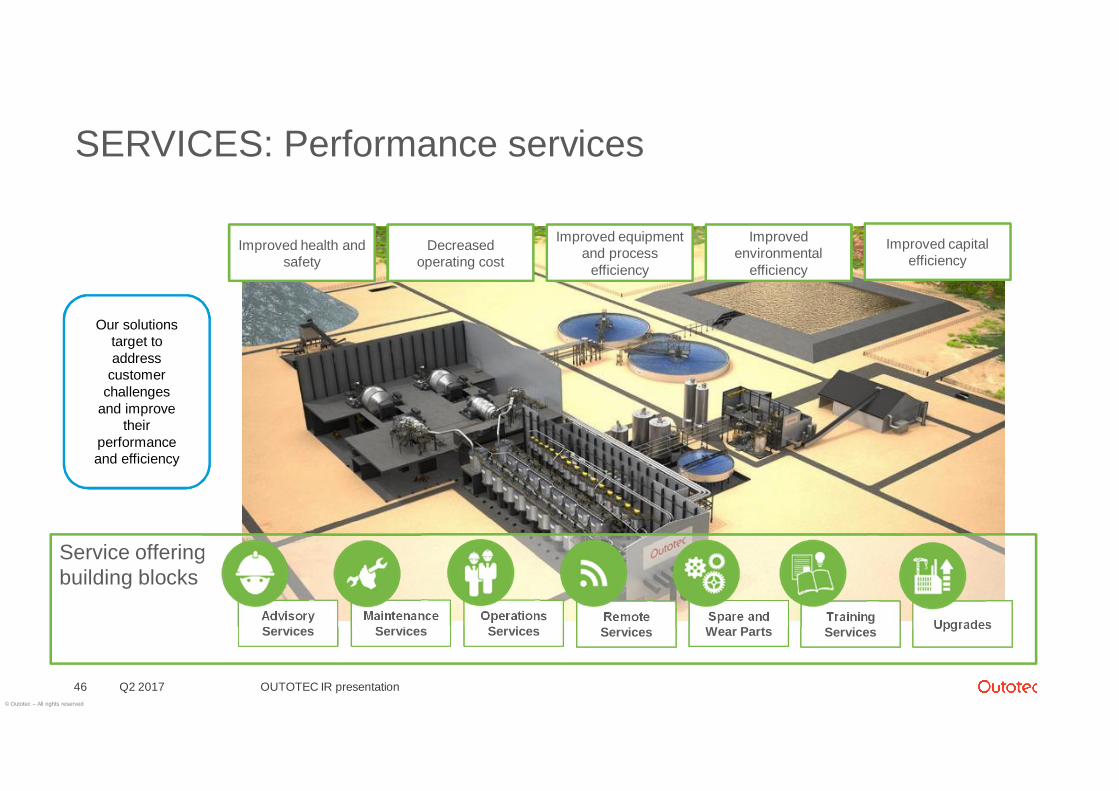
Service offeringbuilding blocks
SERVICES: Performance services
Q2 2017 OUTOTEC IR presentation46
OperationsServices
AdvisoryServices
MaintenanceServices
RemoteServices
TrainingServices
Spare andWear Parts Upgrades
Decreasedoperating cost
Improved health andsafety
Improvedenvironmental
efficiency
Improved capitalefficiency
Improved equipmentand process
efficiency
Our solutionstarget toaddress
customerchallenges
and improvetheir
performanceand efficiency
© Outotec – All rights reserved
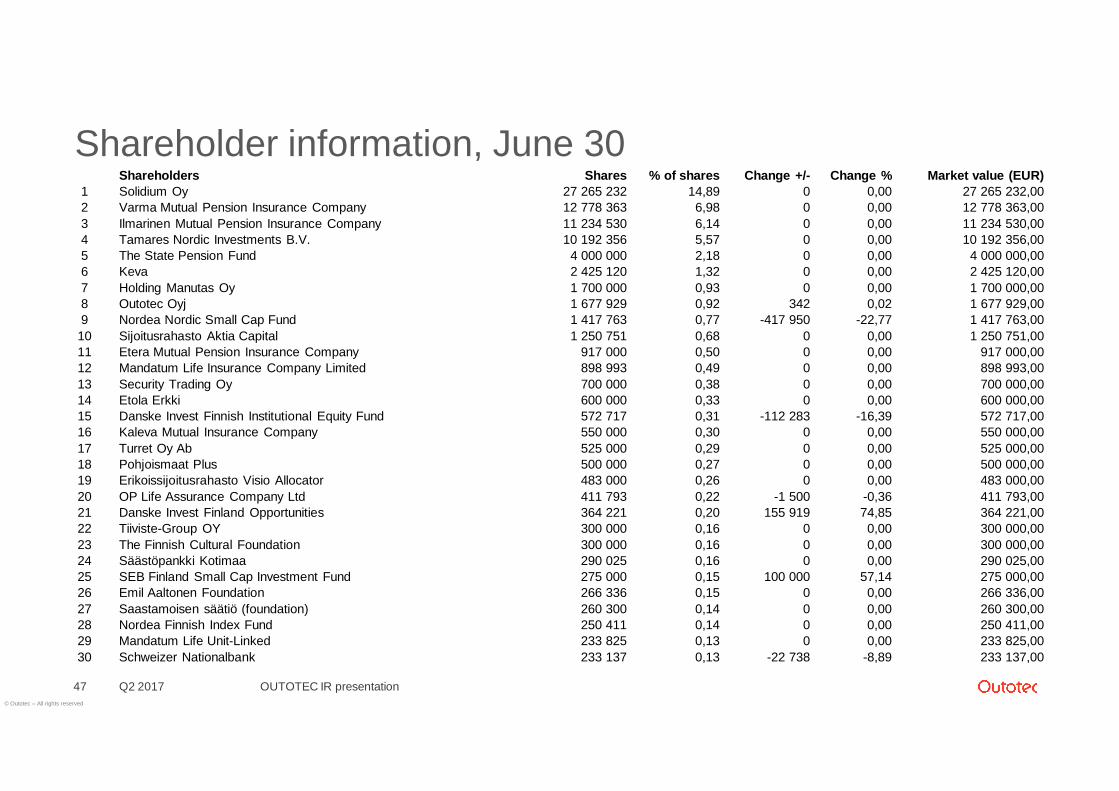
Shareholder information, June 30
Q2 2017 OUTOTEC IR presentation47
Shareholders Shares % of shares Change +/- Change % Market value (EUR)1 Solidium Oy 27 265 232 14,89 0 0,00 27 265 232,002 Varma Mutual Pension Insurance Company 12 778 363 6,98 0 0,00 12 778 363,003 Ilmarinen Mutual Pension Insurance Company 11 234 530 6,14 0 0,00 11 234 530,004 Tamares Nordic Investments B.V. 10 192 356 5,57 0 0,00 10 192 356,005 The State Pension Fund 4 000 000 2,18 0 0,00 4 000 000,006 Keva 2 425 120 1,32 0 0,00 2 425 120,007 Holding Manutas Oy 1 700 000 0,93 0 0,00 1 700 000,008 Outotec Oyj 1 677 929 0,92 342 0,02 1 677 929,009 Nordea Nordic Small Cap Fund 1 417 763 0,77 -417 950 -22,77 1 417 763,0010 Sijoitusrahasto Aktia Capital 1 250 751 0,68 0 0,00 1 250 751,0011 Etera Mutual Pension Insurance Company 917 000 0,50 0 0,00 917 000,0012 Mandatum Life Insurance Company Limited 898 993 0,49 0 0,00 898 993,0013 Security Trading Oy 700 000 0,38 0 0,00 700 000,0014 Etola Erkki 600 000 0,33 0 0,00 600 000,0015 Danske Invest Finnish Institutional Equity Fund 572 717 0,31 -112 283 -16,39 572 717,0016 Kaleva Mutual Insurance Company 550 000 0,30 0 0,00 550 000,0017 Turret Oy Ab 525 000 0,29 0 0,00 525 000,0018 Pohjoismaat Plus 500 000 0,27 0 0,00 500 000,0019 Erikoissijoitusrahasto Visio Allocator 483 000 0,26 0 0,00 483 000,0020 OP Life Assurance Company Ltd 411 793 0,22 -1 500 -0,36 411 793,0021 Danske Invest Finland Opportunities 364 221 0,20 155 919 74,85 364 221,0022 Tiiviste-Group OY 300 000 0,16 0 0,00 300 000,0023 The Finnish Cultural Foundation 300 000 0,16 0 0,00 300 000,0024 Säästöpankki Kotimaa 290 025 0,16 0 0,00 290 025,0025 SEB Finland Small Cap Investment Fund 275 000 0,15 100 000 57,14 275 000,0026 Emil Aaltonen Foundation 266 336 0,15 0 0,00 266 336,0027 Saastamoisen säätiö (foundation) 260 300 0,14 0 0,00 260 300,0028 Nordea Finnish Index Fund 250 411 0,14 0 0,00 250 411,0029 Mandatum Life Unit-Linked 233 825 0,13 0 0,00 233 825,0030 Schweizer Nationalbank 233 137 0,13 -22 738 -8,89 233 137,00
© Outotec – All rights reserved
0
5
10
15
20
25
30
35
40
45
50
2006 2007 2008 2009 2010 2011 2012 2013 2014 2015 2016
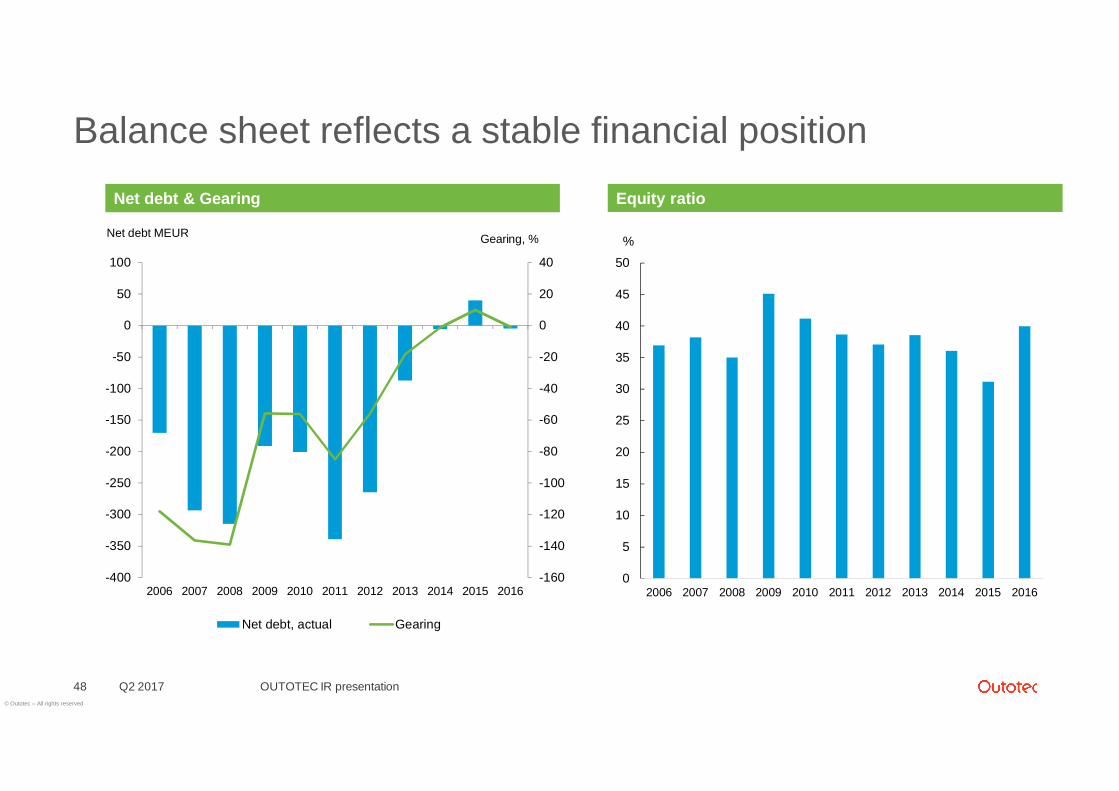
Balance sheet reflects a stable financial position
Q2 2017 OUTOTEC IR presentation48
-160
-140
-120
-100
-80
-60
-40
-20
0
20
40
-400
-350
-300
-250
-200
-150
-100
-50
0
50
100
2006 2007 2008 2009 2010 2011 2012 2013 2014 2015 2016
Gearing, %Net debt MEUR
Net debt, actual Gearing
Net debt & Gearing Equity ratio
%
![WOODGROVE SECONDARY SCHOOL COACH! …...(Caa 27 June 2019) WOODGROVE SECONDARY SCHOOL COACH! (COme to AChieve new Heights!) PROGRAMME 2019 [for 4 Express / 5 Normal (Academic)] When?](https://img.pdfslide.us/doc/110x75/5e53254c6a5c3008ce4dcd65/woodgrove-secondary-school-coach-caa-27-june-2019-woodgrove-secondary-school.jpg)