Embed Size (px)
Citation preview
05/20/2016 1 AMI
Sustainable Remediation of Petroleum Contaminated Sediment in Hot-Mix Asphalt
Mixtures
Anastasios M. Ioannides, Aleef Hassan, Walied Elsaigh (University of Cincinnati)
Abstract
This study explores the possibility of using petroleum contaminated sediment (PCS) as aggregate
replacement in the surface layer of asphalt pavements. The variation in the engineering
properties of asphalt concrete is investigated in laboratory mixes incorporating different
percentages of PCS. Also examined is the use of enhancer filler materials like fly ash. It is
concluded that PCS can be incorporated into hot-mix asphalt satisfying requirements for stability
and flow. In order to conform to air voids requirements, no more than 7.5% of this particular
PCS may be added. It is also found that with the addition of PCS, the amount of asphalt cement
required in the mix is reduced significantly, with concomitant savings. Moreover, 2% of fly ash
can be added to the mix, thereby adding to the sustainable benefits of the process.
1. Introduction
Improper product handling and waste disposal practices in an abandoned canal have resulted in
sediment contamination. Many industries have contributed to this problem. The petroleum
industry is associated with several different organic compounds including polycyclic aromatic
hydrocarbons (PAHs) and benzene, toluene, ethyl benzene, and xylene (BTEX), chemicals that
may pose a risk to human health and the environment. Various technologies have been
developed for the purpose of treating petroleum contaminated sediment (PCS), including
biodegradation (1), soil vapor extraction (2), thermal treatment (3), and cement based
solidification (4). The aim of such efforts is to reduce the contaminant content to within
allowable limits before land disposal of PCS in a landfill.
The main objectives of the present study are to: (a) Assess whether hot-mix asphalt (HMA)
paving mixtures incorporating PCS offer an alternative to conventional materials used in the
surface layer of roads subjected to light-traffic; and (b) Examine suitable filler materials that may
enhance the engineering performance of HMA mixtures containing PCS. Moreover, such a PCS
05/20/2016 2 AMI
treatment protocol could provide a low-cost alternative material for conventional sand in HMA
mixtures.
Previous research has suggested that use of PCS in HMA offers potential environmental benefits.
Clean sand has been partially replaced by up to 35% PCS, contaminated with less than 1%
heating oil or gasoline, to produce HMA mixture that conforms to the New Jersey specifications
regarding the base-course layer under heavy-traffic conditions (5). A study concerned with sand
containing approximately 4.7% of crude oil revealed that 15% PCS can be incorporated without
violating the HMA requirements specified by the Asphalt Institute (6) for secondary road
surfaces or the base-course layer (7). A maximum of 15% PCS, containing an even higher crude
oil rate of 6.8%, was incorporated while still conforming to the Gulf state of Oman’s
specifications regarding HMA mixture for the surface layer of medium-traffic roads (8). These
findings indicate that type and percentage of oil contamination play a major role in determining
the feasible percentage of PCS to be utilized in HMA.
Fly ash is a by-product resulting from coal combustion process. Large quantities are produced
every year in the United States and elsewhere. The literature indicates that fly ash may be used as
a mineral filer, but the degree to which it affects the properties of a HMA mixture is dependent
on its mineral composition and particle size. Additionally, several investigations indicated that
addition of fly ash allows a reduction in the quantity of the asphalt binder required.
2. Materials and Methods
For the purpose of this study, the canal’s raw PCS-water mixture was dewatered and the dry PCS
was incorporated in various tests, including determination of physical properties and contaminant
content. Marshall Mix Design was then performed to evaluate the viability of HMA mixtures
with various amounts of PCS partially replacing clean sand, and with fly ash class F and C
replacing limestone dust. The HMA mixtures discussed here are intended for light-traffic surface
materials, as specified by the Ohio State Department of Transportation (ODOT) (9).
Dewatering
05/20/2016 3 AMI
The PCS-water mixture was first dewatered in order to obtain the dry material to be used in
subsequent tests. Prior to filling a geotextile pillow from TenCate Geosynthetics of Commerce,
GA, we optimized the PCS-water dewatering through a chemical conditioning process to
increase the soil dryness. This chemical conditioning is useful since the addition of polymers
increases the dewatering rate and improves the cleanliness of effluent draining from a geotextile
pillow (10). Rapid dewatering tests were performed to select the most efficient polymer or
combination of polymers. Organic Cationic Flocculant Solve 9222 from WaterSolve LLC was
chosen. Thereafter, PCS-water mixture was mixed with the chosen polymer, poured into the
pillow, and left to dewater for approximately 10 days. The dry material was then taken out of the
pillow and stored at a room temperature for further testing. Visual inspection revealed that
effluent water was relatively clean and, therefore, the chance exists that this water can be
returned to its parent canal. Such a possibility makes geotextiles viable for dewatering the PCS-
water mixture as it will eliminate the need for further treatment to the effluent. In addition,
geotextile pillows provide ease of construction, convenient placement, cost-effectiveness, and
low environmental impacts (11).
Constituent Materials
Visual inspection of a sample of the raw PCS-water mixture indicates a material that is oily and
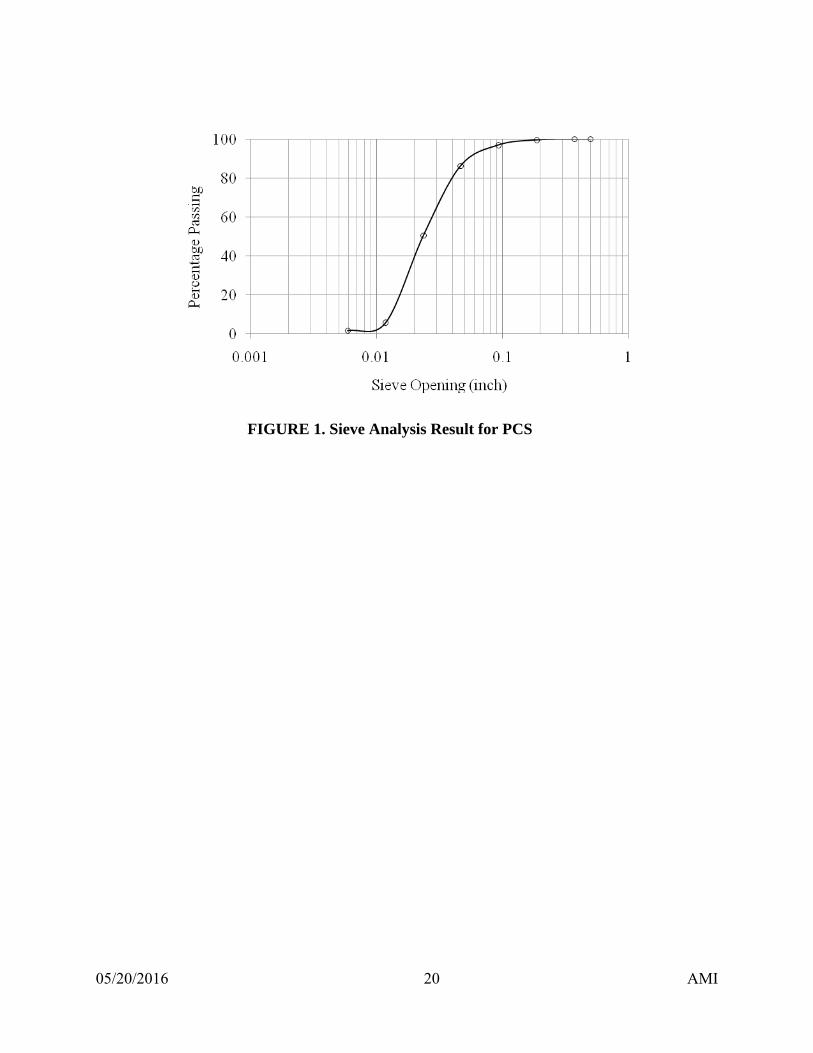
viscous in nature and black in color. Upon dewatering, a sand-like material was obtained, whose
grain size distribution is shown in Fig.1. Accordingly, the PCS is classified as a poorly graded
sand (SP) material, suitable for replacing the fine aggregate portion that passes through the No. 4
sieve. The petroleum associated with the sediment was characterized as a refined medium weight
fuel oil that has undergone biodegradation and weathering. Consequently, nearly all the n-
saturated hydrocarbons have been depleted, leaving many of the branched hydrocarbons and
PAHs, with a high concentration of sulfur compounds. Evidently, petroleum operations have
occurred at this site over several decades. Percentage solids averaged 39.5 percent; moisture
content was 60.5 percent by weight. The total petroleum hydrocarbon (TPH) concentration in the
sediment was 19.3 percent (dry weight). Loss of ignition (LOI at 425°C) averaged 30.1 percent,
with orange fine-grained sand and clay remaining after heating.
05/20/2016 4 AMI
The quantity and leaching levels of contaminants in the PCS samples were also examined.
Approval of a HMA mixture that contains PCS hinges not only on the desired engineering
properties but also on environmental parameters to assure safety. This is crucial for road
pavements, which are exposed to moisture that can cause contaminants to leach into and pollute
both surface and groundwater. A precise regulatory limit on toxicity for PCS acceptability as a
HMA constituent does not seem to exist; instead, restrictions are imposed generally prohibiting
the use of hazardous materials (12). For the purpose of preliminary evaluation, toxicity
characteristic leaching procedure (TCLP) tests were performed on dry PCS. The result showed
that the concentrations of contaminants were below the respective hazardous waste regulatory
limits set by the USEPA, and therefore, the PCS used in this study was considered to be non-
hazardous.
The class C and class F fly ashes that were used as fillers in HMA mixtures were obtained from
an Eastern bituminous source and from the Powder River Basin in Montana, respectively. The
distinction between the two classes of ash is defined in ASTM C618 (13), whose classification
relies on the amount of free lime or calcium oxide in the ash as well as the grade of parent coal.
The physical requirements for mineral fillers in asphalt mixtures are given by AASHTO (14),
according to which 70% to 100% of the material must pass the No. 200 sieve. In addition, the
plasticity index for filler material should not exceed 4.0 and should be free of organic impurities.
Most fly ashes adhere to the specified size range (15) and consist of non-plastic material (16),
making them viable for HMA mixture filler applications. Limestone of three different particle
sizes was provided by Martin Marietta Company of Phillipsburg in Ohio: coarse aggregate with
maximum particle size of 3/8 in., clean sand, and mineral dust. The asphalt binder used in this
investigation was of a performance grading class denoted as PG 64-22 (17), obtained from
Marathon Ashland Petroleum Company. This specific asphalt binder was selected because of the
typical climatic conditions encountered in Ohio.
Marshall Mix Design
The purpose of Marshall mix design is to determine optimum asphalt binder content (OAC),
which in combination with fine and coarse aggregates, as well as dust-like filler material, will
result in the most desirable engineering properties pertinent to strength and stiffness when the
05/20/2016 5 AMI
product is placed in the field as the road surface or in an underlying layer. The adequacy of
mixtures with OAC is tested against minimum criteria that have been established for stability (or
strength), flow (or deformability), and the volume of each of the three components (i.e.,
aggregate solids, asphalt binder liquid, and air). Marshall stability is defined as the maximum
compressive load in lbs, applied at a rate of 2 in. per minute, sustained by a compacted specimen
of standard dimensions and maintained at 140°F. The volume of inter-granular void space, the
space between aggregate particles, in a compacted HMA mixture is referred to as voids in
mineral aggregate (VMA). The VMA includes interstitial air voids (AV), as well as the volume
of the asphalt binder coating the aggregates but not absorbed into the aggregate (18).
Fifteen HMA mixtures were manufactured for the purpose of determining the maximum PCS
content that can be incorporated into HMA mixtures. For each mixture, the asphalt binder
content (AC) was tested at 5%, 6%, 7% and 8%, making four sets per mixture. Regardless of
filler material type used, baseline (control) mixtures were proportioned following the ODOT
specifications for the surface layer under light-traffic conditions (9). The baseline (control)
mixtures contained no PCS and were denoted as Mix L00, Mix F00, and Mix C00, consisting
respectively of limestone dust, class F fly ash and class C fly ash. The rest of the mixtures were
manufactured by altering the baseline mix, partially replacing clean sand with 5%, 7.5%, 10%,
and 15% PCS. Three pill-like specimens and a single loose sample were prepared and tested for
each combination of aggregate and AC, per the minimum requirement ASTM D6926 (19). The
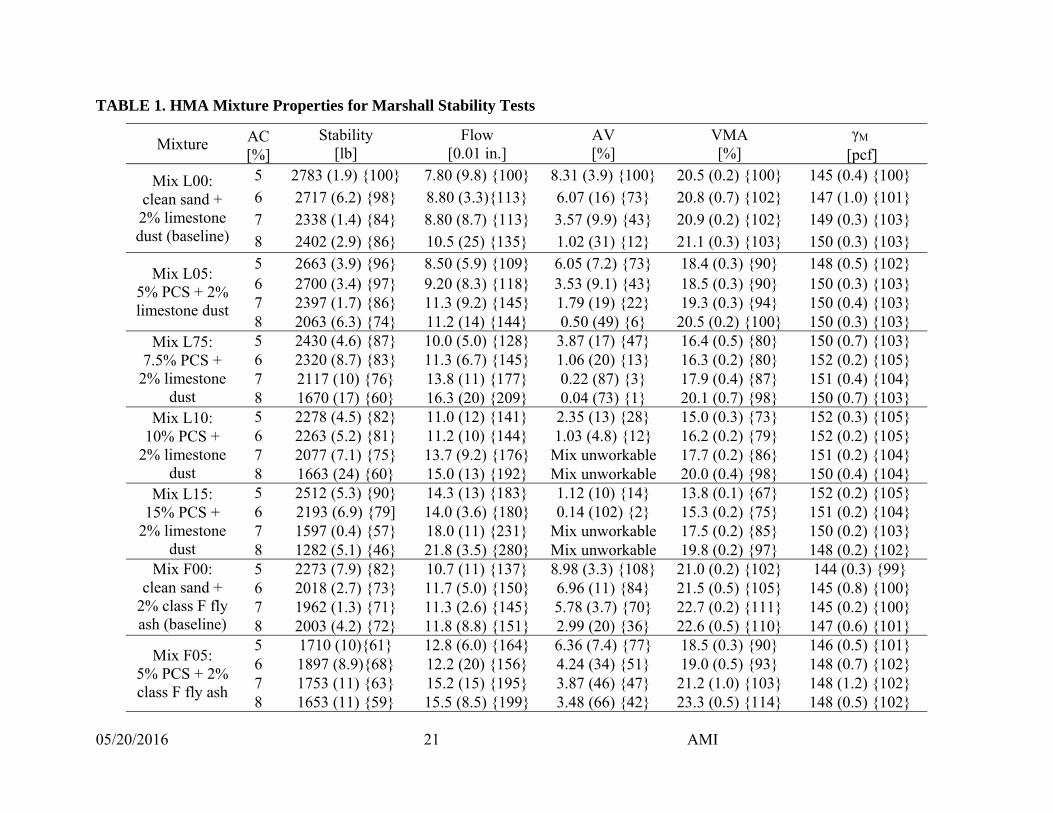
specimens were tested in accordance with the ASTM D6927 (20), and results obtained are
presented in Table 1. Marshall curves of HMA mixtures with ACs (5%, 6%, 7% and 8%) versus
the corresponding averages of stability, flow, mix unit weight (γM), AV content, and VMA
content may be established for each of the mixtures. Upon drawing the curves, the OAC for each
mixture was determined by averaging the ACs that relate to the maximum stability, the
maximum γM, and an AV content of 3.5%. Finally, the OAC is entered into the property curves
to determine the corresponding design stability, flow, AV content, VMA content, and γM as
presented Table 2.
3. Results and Discussion
05/20/2016 6 AMI
Marshall Mean Properties
Analysis was conducted in an attempt to find general trends regarding the effect of PCS content,
AC, and filler material type on the mixture’s Marshall mean properties, i.e., stability, flow, AV
content, VMA content, and γM. For the purpose of the issues discussed in this section, the
Marshall mean property values for all mixtures were normalized as percentage ratios relative to
the values of Mix L00 with 5% AC. For example, the percentage value of normalized mean
stability of Mix L05 with 6% AC was calculated as 100×(2700/2783) ≈ 97%. This value is given
in Table 1 as {97}.
To assess the effect of PCS content, the normalized means of Marshall property values were
averaged for mixtures with equal PCS contents regardless of the AC or the filler material type.
The isolated effect of AC was determined in a similar manner by averaging the normalized
means of Marshall property values for the mixtures with equal AC. Results show that an increase
of 1% PCS reduces the mean stability, AV content, and VMA content by 1.8%, 4.4%, and 1.8%,
respectively. A 1% PCS increase is found to boost flow and γM by approximately 5% and 0.6%,
respectively. The effect of PCS in stability and flow pertains to the findings by other researchers
(8, 22), who attributed such effects to the increase in petroleum oil content in the HMA mixture
specimen as PCS content increases. It is worth pointing out that stability is achieved through two
primary mechanisms: (a) internal friction among aggregates; and (b) cohesion provided by the
asphalt binder (18). A combination of both mechanisms is the most likely reason for decreasing
the stability of mixtures containing PCS. The same study (8, 22) suggested that AV content
increases with a rise in PCS content, which contradicts the trends obtained here. Intuitively, extra
petroleum oil fills some of the inter-granular voids in the HMA mixture, and therefore should
cause reduction in the AV content.
An increase by 1% AC is found to reduce stability, AV content and γM by 7.8%, 13.4% and
0.1%, respectively. A similar AC increase was found to raise flow and VMA content by 25% and
6.6%, respectively. The results indicate a similarity between the effect of PCS content and AC on
stability, flow and AV content. The effect of the AC, however, is more profound than the
influence of the PCS content on Marshall mean properties. For example, 4% PCS and 3% PCS
can cause a reduction in stability and AV content equal to that caused by 1% AC. Such a
05/20/2016 7 AMI
quantitative effect hints to a likelihood of higher PCS content (3% to 5% more) incorporation if
it was possible to decrease the AC by 1%.
The normalized means of Marshall property values were averaged for all mixtures with similar
filler material regardless of the PCS content and AC. Compared to limestone, class F fly ash was
found to reduce stability and γM by 17.6% and 0.8%, while it increases flow, AV content, and
VMA content by 21%, 4.5%, and 1.1%, respectively. Class C fly ash is found to reduce stability,
AV content, VMA content, and γM by 3.9%, 2.9%, 0.3%, and 1.4%, respectively and increases
flow by 7.1%. Similar trends with different percentages were obtained, except for AV content, if
we compare the results for Mix F00 and Mix C00 to the results of Mix L00 (refer to Table 1).
Despite these differences in tendency and values, the general trend indicated that the effect of
class F fly ash is more profound than class C fly ash, especially for stability and flow.
Except for Mix L00, Mix F10, and Mix F15, the relationship between AC and mean stability did
not yield the anticipated trend in such a way that the stability increases with increase in AC until
a certain point is reached, where it starts to decrease again. Instead, the relationship showed
maximum stability at 5% AC and then decreased at larger ACs. Such a behavior indicates that
testing at lower ACs (e.g., 3.5%, 4%, and 4.5%) may provide more insight as it will allow the
investigation of the stability trends at points prior to 5% AC. It will also enable better decision on
the PCS content with respect to reduction in OAC in the HMA mixture. A lower AC was not
attempted in this investigation due to the restrictions of minimum 5% AC imposed by ODOT
specifications (9).
ASTM D6927 (20) recommends that the coefficient of variation (CV) for stability and flow
should not exceed 6% and 9%, respectively, for what is termed as the “within-Laboratory
Precision.” Results in Table 1 indicate a relatively high variability for most mixtures with
respect to stability and flow. It is worth noting that these limiting precisions were suggested
based on a statistical analysis on data collected by the AASHTO Material Reference Laboratory
(AMRL) for regular HMA mixtures. Visiting the AMRL data, however, acquired at a later stage,
will indicate relatively different precisions, some are higher while others are lower to those
suggested initially (21). Precisions that are different from the ones suggested by the ASTM
05/20/2016 8 AMI
D6927 are indeed expected for the mixtures tested here. This is because the addition of PCS,
with various percentages, and fly ash will certainly add to the other parameters such as
environment, equipment, and operator that are expected to cause variability. Despite the fact that
precision limits were not specified, results obtained indicated low variability for VMA content
and γM for all tested mixtures, as well as relatively high variability for AV content for some
mixtures, as compared to a CV of 10% that is generally the maximum acceptable value for
various civil engineering applications.
Marshall Design Properties
The effect of PCS content, and filler material type on Marshall design property values (stability,
flow AV content, VMA content and γM corresponding to OAC) is investigated. In general, each
1% PCS causes a negligible decrease of 1.1% to design stability. This magnitude is not too far
from the result obtained earlier (1.8%) with respect to mean stability. A 1% PCS increase causes
a reduction in the design AV content and VMA content by 5.2% and 3.3%. Nevertheless, the
results in Table 2 show that all HMA-PCS mixtures fulfill the ODOT (9) requirements for
stability and flow. The design VMA content and AV content requirement were met for some of
the tested mixtures. The VMA content was achieved for mixtures containing a maximum of
7.5% PCS. The specifications for AV content were also met for mixtures containing up to 7.5%
PCS with an exception for mixtures with limestone allowing 10% PCS incorporation. It has been
established that a minimum of 15% VMA content is required to allow at least 4.5% by weight of
asphalt binder (23), thereby leading to adequate durability, i.e., longevity under climatic
stressors. An inverse correlation between VMA content and durability was confirmed more
recently (24, 25). One can speculate to attribute the low design VMA content and AV content to
the relatively high petroleum oil content in the tested PCS.
The benefits from using filler material include stiffness improvement, rutting resistance, and
stripping resistance. Although such benefits have been demonstrated experimentally (26, 27), the
mechanism by which filler material influences the properties of HMA mixtures is still
unresolved (28). The general trends drawn from Table 2 indicate that class F (class C) fly ash
reduces the Marshall design stability, flow AV content, VMA content and γM by 25% (4%), 1%
(9%), 10% (6%), 2% (4%), and 1% (<1%) respectively. The use of fly ash as a filler had been
05/20/2016 9 AMI
investigated by various researchers, who had concluded that fly ash either left mechanical
performance unchanged (29), or that it enhanced performance when compared to conventional
fillers (30). Such findings are in contrast to the results obtained by more recent results (28, 31).
The discrepancy in literature in this respect could be related to the difference in mineral
composition, particle size, and the grading of the diverse fly ashes investigated by various
researchers. The more recent findings from literature seem to correlate well with the results
obtained by the tests performed here, since significant reduction in design stability was achieved
with class F fly ash, while comparable stability, with marginal reduction, is obtained with class C
fly ash. Table 2 also indicates that class F and C fly ash reduces the AV content by less than
10%, the reduction being larger with class C fly ash. This effect is to some extent similar to
results in the literature (32).
The concept of asphalt binder extension entails the addition of a powder-like material, i.e., filler,
to HMA mixture to reduce the demand for asphalt binder, and thereby control its escalating cost.
It has been suggested that 10% to 30% of asphalt binder can be replaced with fly ash without
compromising the desirable HMA properties (33). The class F fly ash, used as extender material,
has been found not only provide cost savings (28) but also provide HMA mixture with some of
its properties being superior compared to conventional materials (34, 35). The results obtained
here did not confirm the findings from literature with respect to effect of fly ash in reducing the
OAC. The use of fly ash, however, slightly increased the OAC as can be inferred from the OAC
corresponding to Mix L00, Mix F00, and Mix C00 (refer to Table 2). The general trend obtained
from Table 2 indicates that 1% PCS reduces the OAC by 2.9% of the amount of binder to be
used. Although such reduction will not be significant, the cumulative effect of higher PCS
content would, therefore, yield a sizable decrease in OAC. Accordingly, the use of 7.5% PCS
would allow a saving of approximately 2.9 × 7.5 ≈ 22% on asphalt binder. Such an effect is not
surprising since the PCS considered here was brought from an abandoned canal used to transport
crude oil product to a nearby refinery. The presence of asphalt material in the PCS was also
evident from its black color, sticky nature and distinct odor. It should be borne in mind that the
mechanism by which fly ash extends the asphalt binder is probably different from that of PCS
despite their similar reduction effect. Interestingly, with only one exception, all mixtures
containing PCS greater than 10% resulted in OAC less than the 5%, as required by the ODOT.
05/20/2016 10 AMI
This result affirms that further reduction in clean OAC is possible if restrictions with respect to
the minimum binder content are reconsidered.
With respect to the similar magnitude effect on AV content caused by 1% AC or 3% PCS, the
lesser OAC is not only desirable for cost savings but also needed to increase the AV content of
the HMA-PCS mixtures. The latter is especially important because most of the mixtures are
either below or at the lower limit of allowable AV content.
Feasibility of PCS Re-Use
Table 2 indicates that up to 7.5% PCS can be utilized in HMA mixtures while meeting ODOT
specifications for road surface layer under light-traffic conditions (9). From a material
engineering viewpoint, conformity of HMA-PCS mixtures to the limits imposed by relevant
standards for Marshall properties is expected to mitigate a large portion of engineering concerns,
whereas aspects such as durability, longevity, and the quality consistency will need to be further
assured. Results from past studies have indicated that use of up to 35% PCS sand replacement
with less than 1% heating oil or gasoline has a negligible influence on durability compared to
mixtures without PCS (36).
At mass production levels, the use of PCS was found to cause minor impact on production
equipment and processes and only additional bins were needed to store the material (37).
Alterations might be required to accommodate emissions from the PCS incineration during
HMA-PCS mixtures production process (38). For the PCS investigated here, the dredged
material is expected to be heterogeneous due to variations contamination levels between different
spots and depths in the bed strata of the waterway. Such variation impacts negatively on the
quality consistency of the HMA-PCS mixtures, and therefore necessitates a homogenization step
for the PCS before it can be incorporated in the HMA production process. As far as field
applicability is concerned, HMA containing “remediated” PCS has been successfully used to
construct the base layer for a two-lane section of the heavily trafficked Route 72 highway in New
Jersey. For this project, the field has produced asphalt concrete conforming to the “job
specifications” with field physical properties similar to those obtained during mix design stage
(39).
05/20/2016 11 AMI
From an economic perspective, long hauling of PCS can increase the initial cost, especially if
restrictions are imposed, compared to alternative materials that may exist within the HMA
mixture production area. The HMA-PCS mixture will be economically viable only if the hauling
cost is offset by the less OAC or the PCS management cost. Additional economical use-
restricting issues include the unknown salvage value for HMA-PCS mixtures and the life cycle
cost which is primarily based upon long-term performance. The economics of HMA-PCS
production will also be adversely affected if a homogenizer is to required for an improved
quality consistency.
Environmental concerns will mainly include the PCS air emissions at the production stage and
the environmental leaching under service load and environmental weathering. The production of
HMA-PCS mixtures, with less than 1% oil, has been found to cause a negligible amount of air
pollution at production plant (36). Similar results were also obtained at laboratory production
levels (7). Results from TCLP on HMA mixtures consisting of 40% PCS sand replacement, with
6.8% petroleum oil, suggested that concentrations of most heavy metals are well below the
regulatory limits (40, 41). Deterioration, in the form of raveling and disintegration is expected to
occur at some stage for HMA-PCS mixture during the pavement’s life span, as it has been
happening for various past asphalt pavements. At such stage, the immobilization effect,
enhanced by incorporating PCS in HMA mixtures, will no longer be in action or its activity is
reduced. If this is the case, then the use of HMA-PCS mixture will lead to a wider spread of the
contaminants along the deteriorated pavement, unless contaminants are degradable. Such a long-
term concern stimulates questions regarding the management of the HMA-PCS mixture at the
end of the pavement life and invites for thoughts on reclamation recycling of the material.
Optimum HMA-PCS Mixture
In drawing a recommendation on the optimum mixture, the mixture has to first meet the required
specification. The second level in the selection criteria is based on the maximum possible use of
PCS. In the third level, the Marshall design properties are considered. The mixture designated as
Mix F75 is seen to be the best among other tested mixtures because it complies with the ODOT
requirement, and provides the highest possible PCS incorporation, greatest design stability, and
05/20/2016 12 AMI
relatively higher AV content than counterpart mixtures (Mix L75 and Mix C75). The OAC is
also less compared to Mix L75. The presence of class F fly ash in Mix F75 may also provide
additional advantage over other mixtures. The addition of class F fly ash to PCS may result in a
reduction in concentration of hydrocarbons, such as naphthalene and o-xylene, in an effluent
collected from a column leaching test (42).
The relatively high design stability and the within limits design flow found for Mix F75 is
expected to enhance the performance of a road adopting this mixture. Asphalt pavements
constructed with low stability HMA mixture are likely to develop rutting and corrugations, while
high flow values implicate a plastic mix likely to experience permanent deformation under
repeated traffic loading. On the other hand, a low flow value may suggest a mix with insufficient
asphalt binder (18) that may be vulnerable to stripping. The lower limit of design AV content
(2.5%) specified by the ODOT (9) seems to be below the corresponding limit of 3%,
recommended by the Asphalt Institute (6). A relatively low AV content is expected to decrease
the rut resistance of HMA mixtures (18), yet an AV content between 1% and 3% has been found
to exhibit significantly longer fatigue life (43). Despite earlier studies indicating negligible effect
of PCS on durability of HMA mixtures, the PCS used in Mix F05 contains petroleum oil (12%)
much greater than the highest oil content (6.8%) reported in the literature. Such higher oil
content will be expected to influence the long-term performance such as water susceptibility.
Despite the indications given in literature for various HMA-PCS mixtures, environmental
implications with respect to full-scale application of Mix F75 are not precisely known at the
present and will therefore hinder its use until relevant results are available.
4. Conclusions and Recommendations
The PCS considered in this study can be successfully incorporated to partially replace clean sand
in HMA mixtures. The specification of a surface layer for light-traffic conditions can be met by
partially replacing clean sand by up to 7.5% PCS.
An increase in PCS content and AC have a similar effect with regard to reduction in stability,
flow, and AV content and have dissimilar effects on VMA content and γM. A 1% AC influences
stability, flow, and AV content by 400%, 500%, and 300%, respectively, as compared to the

05/20/2016 13 AMI
effect of an equal percentage of PCS. Theoretically, if given restriction on minimum AC (5%)
is removed, PCS content greater than 7.5% can be used.
Class F and C fly ash can be used to replace the limestone dust in the HMA-PCS mixtures. Use
of class F and C fly ash, to replace limestone dust, reduces stability and γM, while increases flow.
The effect of class F fly ash is more profound as compared to class C fly ash. Their effect on AV
content and VMA content is insignificant and may vary in trend. The use of such materials is
found to negatively influence the Marshall design properties, but their influence is limited and
does not compromises the mixtures’ conformity to the specification of the road layer concerned.
The trade off for such a negative effect is the use and disposal of materials that would need to be
land-filled.
An optimum HMA-PCS mixture, combining PCS and fly ash, can be proportioned to contain
7.5% PCS sand replacement, 2% class F fly ash and 5.3% OAC. The results from this
investigation and from the literature indicate that addition of PCS, with different soil
composition and petroleum oil content and type, produces HMA-PCS mixtures of diverse
Marshall properties and differ with respect to the maximum viable PCS content use.
The adequate stability for HMA-PCS mixtures with up to 7.5% PCS replacement points to
possible uses in other road categories and layers. The material can be potentially applied to a
surface layer or base layer of higher road category. The use of HMA-PCS mixtures in a thicker
base layer is especially desirable as it will allow disposing of a larger quantity of PCS materials,
as compared to the surface layer applications. In addition, base layer application can be
advantageous with respect to higher than 7.5% PCS content incorporation, if lower VMA content
and AV content are acceptable.
Other engineering properties of HMA-PCS mixtures such as tensile strength, durability, and
longevity need to be investigated before it can be used in real life pavements. A trial road section
is considered to be necessary in order to allow more insight into material mass production,
construction constraints and limitations, and performance under in service traffic.
05/20/2016 14 AMI
Apart from strength and deformation requirements (i.e., technical acceptance), the HMA-PCS
mixtures with and without fly ash has to be environmentally acceptable. Leaching tests are
needed, especially with the relatively high petroleum oil content, to assess the environmental
acceptability of the material. In addition, the long-term leaching characteristics are crucial and
need to be assessed.
The economic repercussions of HMA-PCS use deserve a separate evaluation. The engineering
considerations presented herein suggest that in addition to the benefits obtained from reducing
the cost of PCS pre-treatment and of conventional material use, savings of as much as 22% may
accrue with regard to the asphalt binder. A life cycle cost assessment of such beneficial re-use
may confirm additional advantages pertaining to sustainability. Energy consumption and
emissions may also be reduced.
6. References
(1) Hutchins, S.R., Sewell, G.W., Kovacs, D.A., and Smith, G.A. 1991. Biodegradation of
Aromatic Hydrocarbons by Aquifer Microorganisms Under Denitrifying Conditions.
Environmental Science and technology, vol. 25, pp. 68-76.
(2) Stamnes, R., and Blanchard, J. 1997. Soil Vapor Extraction Implementation and Experiences.
United States Environmental Protection Agency, Emergency Response (5203G), Publication
9200.5-223FS, EPA 540/F-95/030, PB95-963315, 10 p.
(3) Lee, J.K., Kim, B-UK., and Park, D. 1999. Thermal Treatment of Petroleum Contaminated
Soils by a Fluidized Bed Desorber. Korean Journal of Chemical Engineering, vol. 16, No.5, pp.
684-687.
(4) Barth, E.F., Percin, P., Arozarena, M.M., Zieleniewski, J.L., Dozani, M., Maxey, H.R.,
Hokanson, S.A., Pryately, C.A., Whipple, T., Kravitz, R., Cullinane, M.J., Jones, L.W., and
Malone, P.G. 1990. Stabilization and Solidification of Hazardous Wastes. Noyes Data
Corporation, New Jersey, USA.
05/20/2016 15 AMI
(5) Meegoda, N.J., Mueller, R.T., Huang, D-R., DuBose,B.H., Chen, Y., and Chuang, K-Y.
1993. Petroleum Contaminated Soils in Hot Asphalt Concrete - An Overview. Use of Waste
Materials in Hot Mix Asphalt, ASTM STP 1193, H. Fred Waller, ED., American Society for
Testing and Materials, Philadelphia, USA, pp. 183-194.
(6) Asphalt Institutes. 1988. Mix design methods for asphalt concrete and other hot mix types.
Manual series No.2 (MS-2).
(7) Al-Mutairi, N.M., and Eid, W.K. 1997. Utilization of Oil-Contaminated Sands in Asphalt
Concrete for Secondary Roads. Journal of Materials and Structures, vol. 30, pp. 497-505.
(8) Hassan, F.H., Al-Rawas, A., Al-Futaisi, A., Al-jamrah, A., Taha, R., and Hago, A-W. 2006.
Potential Use of Petroleum-Contaminated Soil in Hot Mix Asphalt Concrete. Proceedings of the
Airfield and Highway Pavement Specialty Conference, Atlanta, USA, pp. 388-399.
(9) Ohio Department of Transport (ODOT). 2008. Construction and Material Specifications.
Department of Transportation Columbus, Ohio state, pp. 220-225.
(10) Gaffney, D.A. 2001. Geotextile Tube Dewatering: Part 1- Design Parameters. Geotechnical
Fabric Report, Designer’s Forum, IFAI, Roseville, MN, September, pp. 12-15.
(11) Moo-Young, H.K., Gaffney, D.A., and Mo, X. 2002. “Testing procedures to assess the
viability of dewatering with geotextile tubes” Geotextile and Geomembranes, 20 (5), PP. 289-
303.
(12) Laurent, C. 2007. Environmental acceptability of beneficial use of waste as construction
material-State of knowledge, current practice and future developments in Europe and in France.
Journal of Hazardous Materials B139, Elsevier, pp. 556-562.
(13) ASTM C618-08a. 2008. Standard Specification for Coal Fly Ash and Raw or Calcined
Natural Pozzolan for Use in Concrete.
05/20/2016 16 AMI
(14) AASHTO.2007. Standard specification for mineral filler for bituminous paving mixtures.
Washington, DC 20001: American Association of State Highway and Transportation Officials.
Report nr M 17-07.
(15) Di Gioia A.M. and Nuzzo W.L. 1972. Fly ash as structural fill. Journal of the Power
Division, June;98(1):77-92.
(16) Federal Highway Administration (FHWA) and Environmental Protection Agency (EPA).
2005. Using coal ash in highway construction: A guide to benefits and impacts. Report No. EPA-
530-k-05-002, April, 41 p.
(17) Mamlouk, M.S. and Zaniewski, J.P. 1999. Materials for Civil and Construction Engineers.
Addison Wesley Longman Inc., pp.224-237.
(18) Roberts, F.L., Kandhal, P.S., Brown, E.R., Lee, D., and Kennedy, T.W. 1991. Hot-Mix
Asphalt Materials, Mix Design, and Construction. NAPA Education Foundation, Lanham,
Maryland.
(19) ASTM D D6926-04. 2008. Standard Practice for Preparation of Bituminous Specimens
Using Marshall Apparatus. ASTM Manual, Road and Paving Materials, Vehicle-Pavement
System, vol. 04.03, pp. 869-874.
(20) ASTM D6927-06. 2008. Standard Test Method for Marshall Stability and Flow of
Bituminous Mixture. ASTM Manual, Road and Paving Materials, Vehicle-Pavement System,
vol. 04.03, pp. 875-881.
(21) AASHTO Materials Reference Laboratory (AMRL). Hot Mix Asphalt Marshall Design.
http://www.amrl.net/Portal/DesktopDefault.aspx?tabindex=99&tabid=233. Samples No. 43 &
44. Report Date: 08/16/2005.
05/20/2016 17 AMI
(22) Hassan, H.F, Taha, R., Al-Rawas, A., Al-Shandoudi, B., Al-Gheithi, K., and Al-Barami,
A.M. 2005. Potential uses of petroleum-contaminated soil in highway construction. Journal of
Construction and Building Materials, No.19, pp.646-652.
(23) McLeod, N.W. 1956. Relationships Between Density, Bitumen Content, and Voids
Properties of Compacted Bituminous Paving Mixtures. HRB Proceedings, vol. 35, pp.
(24) Asphalt Institute Superpave®. 1996. Superpave® level 1 mix design. series no.2 (SP-2),
Lexington, Kentucky.
(25) Corce, J.B. 2002. A laboratory investigation into the effect of aggregate related factors of
critical VMA in asphalt paving mixture. Center of Transportation Research and Education, Iowa
State University.
(26) Galloway, B.M. 1980. A review of the use of mineral filler in asphalt-aggregate mixtures.
Fly ash applications in 1980 conference.
(27) Churchill, E.V. and Amirkhanian, S.N. 1999. Coal Ash Utilization in Asphalt Concrete
Mixtures. Journal of Materials in Civil Engineering, Vol. 11, No. 4, pp. 295 – 301.
(28) Serkan, T. 2008. Mechanical Evaluation of asphalt-aggregate mixtures prepared with fly ash
as a filler replacement. Canadian Journal of Civil Engineering, vol. 35, NRC Canada, pp. 27-40.
(29) Fung, K.Y.K. 1968. The use of fly Ash as Filler in Asphaltic Concrete Production in New
South Wales. 4th proceedings, Australian Road research Board, Victoria, Australia.
(30) Carpenter, C.A. 1952. A comparative study of fillers in asphaltic concrete, Public Roads,
27: 101-110.
05/20/2016 18 AMI
(31) Kandhal, P.S., Lynn C.Y., and Parker, F.1998. Characterization tests for mineral fillers
related to performance of asphalt paving mixtures. Transportation Research Record;1638:101-
10.
(32) Rosner, J.C., Chehovits, J.G., and Morris, G.R.1982. Fly Ash as a Mineral Filler and Anti-
Strip Agent for Asphalt Concrete. Proceedings of the Sixth International Ash Utilization
Symposium, Reno, NV, United States Department of Energy, Morgantown Energy Technology
Center, vol. 1, pp. 57-78.
(33) Zimmer, F.V. 1970. Fly ash as bituminous filler. In proceedings of the 2nd as utilization
symposium, Pittsburg, Pa, United States Department of Interior, Bureau of Mines, Washington,
D.C.
(34) Suheibani, A.R.S. 1986. The use of fly ash as an asphalt extender. PhD. Thesis, University
of Michigan, Ann Arbor, Mich.
(35) Tons, E., Goetz, R.O., and Razi, M. 1983. Fly ash as asphalt reducer in bituminous base
courses. Project Report. University of Michigan, the Board of Water and Light, Consumer Power
Co., and Detroit Edison Co., Detroit, Mich.
(36) Meegoda, N.J., Huang, De-R., DuBose, B.H., Chen, Y., Mueller, R.T., and Vaccari, D.A.
1992. Use of Petroleum Contaminated Soils in Asphalt Concrete. Hydrocarbon Contaminated
Soils, Chapter 31, Petroleum Contaminated Soils, volume 2, Edward Calabrese and Paul
Kostecki, Lewis Publisher Inc., Chelsea, MI, pp.529-548.
(37) Meegoda, N.J. 1994. Preparation of Asphalt Concrete with Organic Contaminated Soil.
United States Patent, Patent Number: (5,340,396), Date: August, 23, 1994, New Jersey Institute
of Technology, Newwark, N.J., 6 p.
(38) Nash, J.H., Rosenthal, S., Wolf, G., Avery, M., and Chen, C.T. 1992. Potential Reuse of
Petroleum-contaminated soil: A directory of Permitted Recycling Facilities. EPA/600/R-92,
05/20/2016 19 AMI
Contract No. 68-C9-0033, Risk reduction Engineering Laboratory, Office of Research and
Development, U.S. Environmental Protection Agency, Cincinnati, USA, 16P.
(39) Meegoda, N.J., Mueller, R.T., and Palise, F. 1996. Salvaging Petroleum-Contaminated Soils
for Highway Construction. Transportation Research News, issue No. 184, Transportation
Research Board (TRB), ISSN:0738-6826, pp. 40-42.
(40) Jamrah, A., Al-Futaisi, A., Hassan, H.F., and Al-Oraimi, Salem. 2007. Petroleum
Contaminated Soil in Oman: Evaluation of Bioremedation Treatment and Potential for Reuse in
Hot Asphalt Mix Concrete.Journal of Environmental Monitoring and Assessment, No. 124, DOI
10.1007/s10661-006-9230-9, pp.331-341.
(41) Hassan, H.F., Al-Rawas, A., Hago, A.W., Jamrah, A., Al-Futaisi, A., Al-Sabqi, T. 2008.
Investigation of Permeability and Leaching of Hot Mix Asphalt Concrete Containing Oil-
contaminated Soils. Journal of Construction and Building materials, No.22, pp. 1239-1246.
(42) Aydilek,A.H., Demirkan, M.M., and Seagren, E.A. 2007. Leaching Behaviour of Petroleum
Contaminated Soils Stabilized with High Carbon Content Fly Ash. American Society of Civil
Engineers (ASCE), Geoenvironmental Engineering, Geotechnical Special Publication No. 163,
Denver / USA, pp.11-24.
(43) Harvey, J.T., and Tsai, B-W. 1996. Effects of Asphalt Content and Air Void Content on
Mix Fatigue and Stiffness. Transportation Research Record, vol. 1543, TRB, National Research
Council, Washington D.C., pp. 38-45.
Barth et al. 2010 (to be added).
05/20/2016 20 AMI
FIGURE 1. Sieve Analysis Result for PCS
05/20/2016 21 AMI
TABLE 1. HMA Mixture Properties for Marshall Stability Tests
Mixture AC [%]
Stability [lb]
Flow [0.01 in.]
AV [%]
VMA [%]
γM [pcf]
Mix L00: clean sand + 2% limestone dust (baseline)
5 2783 (1.9) {100} 7.80 (9.8) {100} 8.31 (3.9) {100} 20.5 (0.2) {100} 145 (0.4) {100}
6 2717 (6.2) {98} 8.80 (3.3){113} 6.07 (16) {73} 20.8 (0.7) {102} 147 (1.0) {101}
7 2338 (1.4) {84} 8.80 (8.7) {113} 3.57 (9.9) {43} 20.9 (0.2) {102} 149 (0.3) {103}
8 2402 (2.9) {86} 10.5 (25) {135} 1.02 (31) {12} 21.1 (0.3) {103} 150 (0.3) {103}
Mix L05: 5% PCS + 2% limestone dust
5 2663 (3.9) {96} 8.50 (5.9) {109} 6.05 (7.2) {73} 18.4 (0.3) {90} 148 (0.5) {102} 6 2700 (3.4) {97} 9.20 (8.3) {118} 3.53 (9.1) {43} 18.5 (0.3) {90} 150 (0.3) {103} 7 2397 (1.7) {86} 11.3 (9.2) {145} 1.79 (19) {22} 19.3 (0.3) {94} 150 (0.4) {103} 8 2063 (6.3) {74} 11.2 (14) {144} 0.50 (49) {6} 20.5 (0.2) {100} 150 (0.3) {103}
Mix L75: 7.5% PCS +
2% limestone dust
5 2430 (4.6) {87} 10.0 (5.0) {128} 3.87 (17) {47} 16.4 (0.5) {80} 150 (0.7) {103} 6 2320 (8.7) {83} 11.3 (6.7) {145} 1.06 (20) {13} 16.3 (0.2) {80} 152 (0.2) {105} 7 2117 (10) {76} 13.8 (11) {177} 0.22 (87) {3} 17.9 (0.4) {87} 151 (0.4) {104} 8 1670 (17) {60} 16.3 (20) {209} 0.04 (73) {1} 20.1 (0.7) {98} 150 (0.7) {103}
Mix L10: 10% PCS +
2% limestone dust
5 2278 (4.5) {82} 11.0 (12) {141} 2.35 (13) {28} 15.0 (0.3) {73} 152 (0.3) {105} 6 2263 (5.2) {81} 11.2 (10) {144} 1.03 (4.8) {12} 16.2 (0.2) {79} 152 (0.2) {105} 7 2077 (7.1) {75} 13.7 (9.2) {176} Mix unworkable 17.7 (0.2) {86} 151 (0.2) {104} 8 1663 (24) {60} 15.0 (13) {192} Mix unworkable 20.0 (0.4) {98} 150 (0.4) {104}
Mix L15: 15% PCS +
2% limestone dust
5 2512 (5.3) {90} 14.3 (13) {183} 1.12 (10) {14} 13.8 (0.1) {67} 152 (0.2) {105} 6 2193 (6.9) {79] 14.0 (3.6) {180} 0.14 (102) {2} 15.3 (0.2) {75} 151 (0.2) {104} 7 1597 (0.4) {57} 18.0 (11) {231} Mix unworkable 17.5 (0.2) {85} 150 (0.2) {103} 8 1282 (5.1) {46} 21.8 (3.5) {280} Mix unworkable 19.8 (0.2) {97} 148 (0.2) {102}
Mix F00: clean sand +
2% class F fly ash (baseline)
5 2273 (7.9) {82} 10.7 (11) {137} 8.98 (3.3) {108} 21.0 (0.2) {102} 144 (0.3) {99} 6 2018 (2.7) {73} 11.7 (5.0) {150} 6.96 (11) {84} 21.5 (0.5) {105} 145 (0.8) {100} 7 1962 (1.3) {71} 11.3 (2.6) {145} 5.78 (3.7) {70} 22.7 (0.2) {111} 145 (0.2) {100} 8 2003 (4.2) {72} 11.8 (8.8) {151} 2.99 (20) {36} 22.6 (0.5) {110} 147 (0.6) {101}
Mix F05: 5% PCS + 2% class F fly ash
5 1710 (10){61} 12.8 (6.0) {164} 6.36 (7.4) {77} 18.5 (0.3) {90} 146 (0.5) {101} 6 1897 (8.9){68} 12.2 (20) {156} 4.24 (34) {51} 19.0 (0.5) {93} 148 (0.7) {102} 7 1753 (11) {63} 15.2 (15) {195} 3.87 (46) {47} 21.2 (1.0) {103} 148 (1.2) {102} 8 1653 (11) {59} 15.5 (8.5) {199} 3.48 (66) {42} 23.3 (0.5) {114} 148 (0.5) {102}
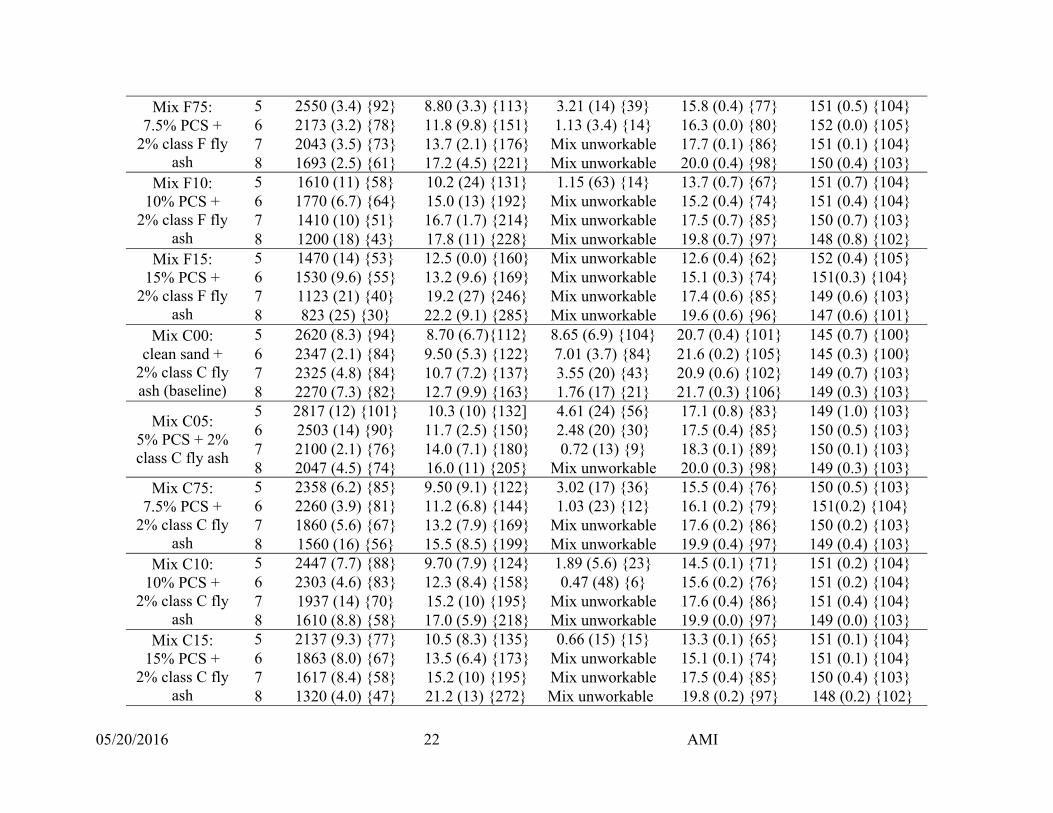
05/20/2016 22 AMI
Mix F75: 7.5% PCS +
2% class F fly ash
5 2550 (3.4) {92} 8.80 (3.3) {113} 3.21 (14) {39} 15.8 (0.4) {77} 151 (0.5) {104} 6 2173 (3.2) {78} 11.8 (9.8) {151} 1.13 (3.4) {14} 16.3 (0.0) {80} 152 (0.0) {105} 7 2043 (3.5) {73} 13.7 (2.1) {176} Mix unworkable 17.7 (0.1) {86} 151 (0.1) {104} 8 1693 (2.5) {61} 17.2 (4.5) {221} Mix unworkable 20.0 (0.4) {98} 150 (0.4) {103}
Mix F10: 10% PCS +
2% class F fly ash
5 1610 (11) {58} 10.2 (24) {131} 1.15 (63) {14} 13.7 (0.7) {67} 151 (0.7) {104} 6 1770 (6.7) {64} 15.0 (13) {192} Mix unworkable 15.2 (0.4) {74} 151 (0.4) {104} 7 1410 (10) {51} 16.7 (1.7) {214} Mix unworkable 17.5 (0.7) {85} 150 (0.7) {103} 8 1200 (18) {43} 17.8 (11) {228} Mix unworkable 19.8 (0.7) {97} 148 (0.8) {102}
Mix F15: 15% PCS +
2% class F fly ash
5 1470 (14) {53} 12.5 (0.0) {160} Mix unworkable 12.6 (0.4) {62} 152 (0.4) {105} 6 1530 (9.6) {55} 13.2 (9.6) {169} Mix unworkable 15.1 (0.3) {74} 151(0.3) {104} 7 1123 (21) {40} 19.2 (27) {246} Mix unworkable 17.4 (0.6) {85} 149 (0.6) {103} 8 823 (25) {30} 22.2 (9.1) {285} Mix unworkable 19.6 (0.6) {96} 147 (0.6) {101}
Mix C00: clean sand +
2% class C fly ash (baseline)
5 2620 (8.3) {94} 8.70 (6.7){112} 8.65 (6.9) {104} 20.7 (0.4) {101} 145 (0.7) {100} 6 2347 (2.1) {84} 9.50 (5.3) {122} 7.01 (3.7) {84} 21.6 (0.2) {105} 145 (0.3) {100} 7 2325 (4.8) {84} 10.7 (7.2) {137} 3.55 (20) {43} 20.9 (0.6) {102} 149 (0.7) {103} 8 2270 (7.3) {82} 12.7 (9.9) {163} 1.76 (17) {21} 21.7 (0.3) {106} 149 (0.3) {103}
Mix C05: 5% PCS + 2% class C fly ash
5 2817 (12) {101} 10.3 (10) {132] 4.61 (24) {56} 17.1 (0.8) {83} 149 (1.0) {103} 6 2503 (14) {90} 11.7 (2.5) {150} 2.48 (20) {30} 17.5 (0.4) {85} 150 (0.5) {103} 7 2100 (2.1) {76} 14.0 (7.1) {180} 0.72 (13) {9} 18.3 (0.1) {89} 150 (0.1) {103} 8 2047 (4.5) {74} 16.0 (11) {205} Mix unworkable 20.0 (0.3) {98} 149 (0.3) {103}
Mix C75: 7.5% PCS +
2% class C fly ash
5 2358 (6.2) {85} 9.50 (9.1) {122} 3.02 (17) {36} 15.5 (0.4) {76} 150 (0.5) {103} 6 2260 (3.9) {81} 11.2 (6.8) {144} 1.03 (23) {12} 16.1 (0.2) {79} 151(0.2) {104} 7 1860 (5.6) {67} 13.2 (7.9) {169} Mix unworkable 17.6 (0.2) {86} 150 (0.2) {103} 8 1560 (16) {56} 15.5 (8.5) {199} Mix unworkable 19.9 (0.4) {97} 149 (0.4) {103}
Mix C10: 10% PCS +
2% class C fly ash
5 2447 (7.7) {88} 9.70 (7.9) {124} 1.89 (5.6) {23} 14.5 (0.1) {71} 151 (0.2) {104} 6 2303 (4.6) {83} 12.3 (8.4) {158} 0.47 (48) {6} 15.6 (0.2) {76} 151 (0.2) {104} 7 1937 (14) {70} 15.2 (10) {195} Mix unworkable 17.6 (0.4) {86} 151 (0.4) {104} 8 1610 (8.8) {58} 17.0 (5.9) {218} Mix unworkable 19.9 (0.0) {97} 149 (0.0) {103}
Mix C15: 15% PCS +
2% class C fly ash
5 2137 (9.3) {77} 10.5 (8.3) {135} 0.66 (15) {15} 13.3 (0.1) {65} 151 (0.1) {104} 6 1863 (8.0) {67} 13.5 (6.4) {173} Mix unworkable 15.1 (0.1) {74} 151 (0.1) {104} 7 1617 (8.4) {58} 15.2 (10) {195} Mix unworkable 17.5 (0.4) {85} 150 (0.4) {103} 8 1320 (4.0) {47} 21.2 (13) {272} Mix unworkable 19.8 (0.2) {97} 148 (0.2) {102}
05/20/2016 23 AMI
L, F, and C refer to limestone dust, class F fly ash, and class C fly ash, respectively. (a) 00, 05, 75, 10, and 15 indicate PCS percentages of zero, 5, 7.5, 10 and 15, respectively. 1. Each number reported represents the mean of three specimens tested. 2. Given between () is the coefficient of variation (%) for the three specimens tested in each case. 3. Given between {} is the percentage of the corresponding property for the control specimen (Mix L00). 4. Symbols: AC = asphalt binder content; AV= air void, VMA= voids in mineral aggregate; γM = mix unit weight. 5. Values between curly brackets represent the normalized percentage values.
05/20/2016 24 AMI
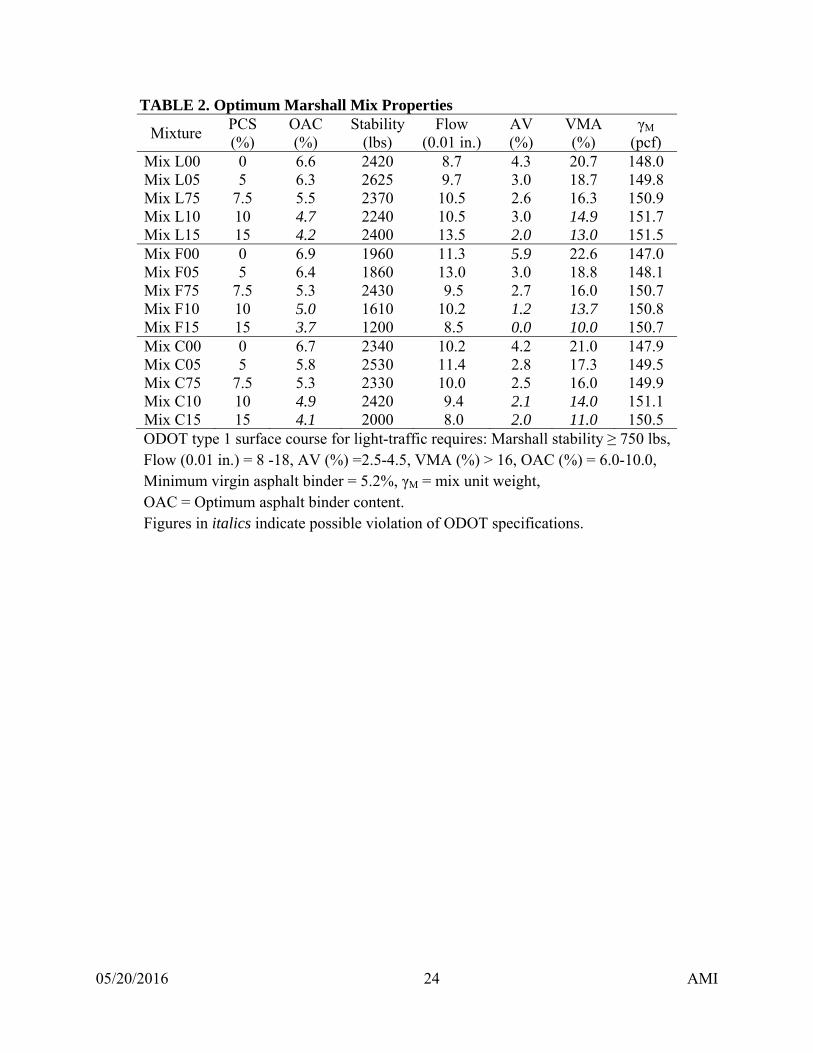
TABLE 2. Optimum Marshall Mix Properties
Mixture PCS (%)
OAC (%)
Stability (lbs)
Flow (0.01 in.)
AV (%)
VMA (%)
γM (pcf)
Mix L00 0 6.6 2420 8.7 4.3 20.7 148.0 Mix L05 5 6.3 2625 9.7 3.0 18.7 149.8 Mix L75 7.5 5.5 2370 10.5 2.6 16.3 150.9 Mix L10 10 4.7 2240 10.5 3.0 14.9 151.7 Mix L15 15 4.2 2400 13.5 2.0 13.0 151.5 Mix F00 0 6.9 1960 11.3 5.9 22.6 147.0 Mix F05 5 6.4 1860 13.0 3.0 18.8 148.1 Mix F75 7.5 5.3 2430 9.5 2.7 16.0 150.7 Mix F10 10 5.0 1610 10.2 1.2 13.7 150.8 Mix F15 15 3.7 1200 8.5 0.0 10.0 150.7 Mix C00 0 6.7 2340 10.2 4.2 21.0 147.9 Mix C05 5 5.8 2530 11.4 2.8 17.3 149.5 Mix C75 7.5 5.3 2330 10.0 2.5 16.0 149.9 Mix C10 10 4.9 2420 9.4 2.1 14.0 151.1 Mix C15 15 4.1 2000 8.0 2.0 11.0 150.5
ODOT type 1 surface course for light-traffic requires: Marshall stability ≥ 750 lbs, Flow (0.01 in.) = 8 -18, AV (%) =2.5-4.5, VMA (%) > 16, OAC (%) = 6.0-10.0, Minimum virgin asphalt binder = 5.2%, γM = mix unit weight, OAC = Optimum asphalt binder content. Figures in italics indicate possible violation of ODOT specifications.