Embed Size (px)
DESCRIPTION
Since 2005, onValues has been recording data on the sustainable investment market in Switzerland every year on FNG Switzerland’s behalf.
Citation preview
Sustainable investments in Switzerland 2011
Published by
Publisher: FNG – Sustainable Investment Forum Switzerland www.forum-ng.org
Authors: Dr. Ivo Knoepfel, David Imbert, onValues www.onvalues.ch
Design: www.christinaohmann.de
Imprint
ImprInt
Sponsored by
Sustainable Investments in Switzerland 20112
Contents
Executive summary
1. Introduction
2. Methodology
3. Results for the Swiss sustainable investment market
04
05
06
08
4. The sustainable investment market in Liechtenstein
Contents
3.1 Market volume
3.2 Analysis of investor types, asset classes and investment approaches
08
10
3.4 Other market trends and outlook
5. Annex: Data
3.3 Analysis of net in-/outflows 12
12
13
14
Sustainable Investments in Switzerland 2011 3
This report presents results of the regular survey of the Swiss sustainable investment market1 per end of 2011, which includes all sustainable assets managed in Switzer-land through funds, mandates and structured products. A total of 20 asset managers reported their assets under management (AuM) in a range of different sustainable in-vestment styles.
At the end of 2011 the sustainable market reached the value of 42.3 billion CHF, which is only marginally higher than the value it had at the end of 2010 (42.0 billion CHF). This indi-cates a good resilience of the susta inable market given the challenging market environment and investors’ risk aversi-on, especially in the second half of 2011.
Decreases in the assets managed through funds and struc-tured products were offset by the increase of assets mana-ged through mandates. This increase is due to institutional mandates for which sustainability considerations were for the first time integrated directly into financial analysis and investment decisions. This marks a new trend in the indus-try towards integration of sustainability in asset manage-ment.
In 2011, funds accounted for approximately 53%, mandates for 44%, and structured products for 3% of the total sustai-nable investment market volume. The use of sustainability information for institutional mandates mentioned above has led to a more balanced investor distribution, with in-stitutional and retail/private investors now each represen-ting about 50% of the market. In 2011 the market share of equity investments decreased from about 63% to 53%. The market share of fixed-income investments, on the other hand, grew from 21% to 31%.
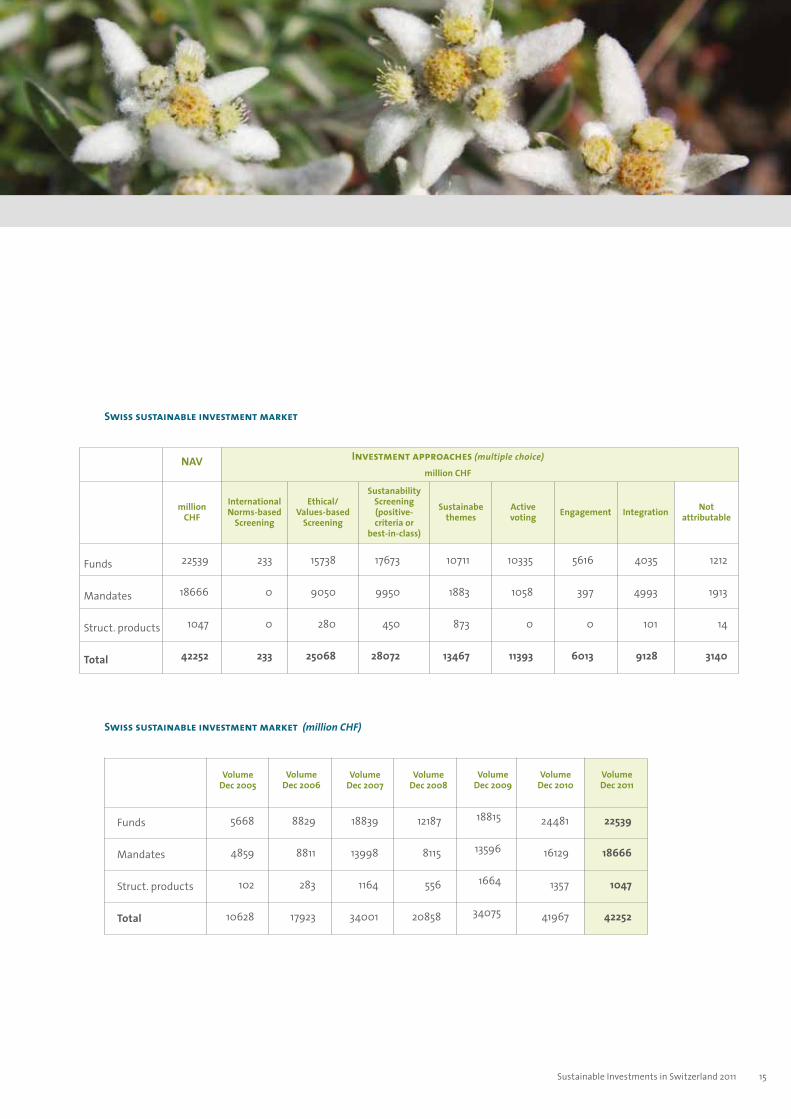
There have also been changes in the use of different invest-ment approaches. Sustainable theme investments have decreased from 16.5 to 13.5 billion CHF, assets for which active voting of proxies applied rose from 9.1 to 11.4 billion CHF, assets using the integration approach increased from 5.6 to 9.1 billion CHF. The newly surveyed approach of ‘in-ternational norms screening’, frequently used by investors in Scandinavia and other parts of the world, is almost not used in Switzerland.
In terms of new innovative strategies coming to market, 2011 has been a relatively quiet year. We nevertheless ob-served a number of new products relating to emerging markets equity, corporate bonds, real estate, natural re-source themes and impact investments being launched. Survey participants were asked about their expectations for the future growth of the sustainable investment mar-ket. Aggregated results indicate that the majority of par-ticipants expect this market to grow at up to double the average rate experienced by the Swiss investment market in the coming years.
exeCutIve summary
Executive Summary
1 this includes all assets managed in switzerland according to responsible/sustainable/srI investment approaches. the survey is estimated to cover over 95% of the total swiss sustainable investment market.
4 Sustainable Investments in Switzerland 2011
Since the end of 2005, onValues has performed periodic surveys of the Swiss sustainable investment market. This report presents the results of the survey per end of Decem-ber 2011.
It is important to note that the present survey focuses on assets managed by banks and investment management companies in Switzerland. It does not capture assets ma-naged internally by pension funds, insurance companies or other asset owners. It therefore doesn’t capture the enti-rety of assets for which environmental, social and gover-nance considerations are taken into account.
1. Introduction
The survey was overseen by a Working Group of members of FNG Switzerland, including the following institutions: Bank Sarasin, Bank Vontobel, Ethos, Inrate, Kaiser Partner, SAM, Swisscanto and Zürcher Kantonalbank.
5Sustainable Investments in Switzerland 2011
For the survey we use a methodology compatible with the Eurosif (European Social Investment Forum) statistics2. The survey includes all sustainable assets managed in Switzerland (i.e. for which the asset management function is located in Switzerland).
Data are collected directly from the asset managers by means of customized data sheets3. As a rule, managers with assets under management in excess of CHF 100 million are invited to participate in the survey. onValues then aggregates the information at the level of the entire market. The data collection and aggregation is supervised by the abovementioned FNG working group. The following asset classes are evaluated (strategic, not actual asset allocation is surveyed):
• Equity• Fixed income• Liquidity• Private equity• Hedge funds• Real estate• Commodities• Others.
The survey assesses the following sustainable investment approaches (multiple mentions are possible):
• International norms-based screening4
• Ethical/Values-based screening5
• Sustainability screening (positive-criteria or best-in-class approaches)• Sustainable themes6
• Active voting • Engagement with portfolio companies• Integration7
2 according to eurosif “... a national market is defined by the country where the assets are being managed (i.e. where the asset management team is located)”.3 Data are based on the declaration of providers and are not verified externally.4 ‘International norms’ refers to screens based on international conventions and standards (e.g. issued by the un, ILo, oeCD, etc.). 5 ‘ethical/values-based screens’ refer to exclusion criteria based on values, principles or beliefs defined by the provider and its clients (e.g. exclusions of tobacco, alcoholic beverage production, etc.).6 For ‘sustainable themes’ investments to qualify for the swiss market survey, it is not enough that an investment vehicle or mandate focuses on the exposure of companies to specific sustainable themes (e.g. climate change, renewable energy, water etc.). an additional analysis of the environmental, social and/or governance performance of the investee companies must be part of the investment process.7 assets for which esG issues are integrated directly into financial analysis and investment decisions based on a systematic process and appropriate research sources.
2. Methodology
6 Sustainable Investments in Switzerland 2011
market voLume
7Sustainable Investments in Switzerland 2011
Change Dec 11– Dec 10
-7.9%
15.7%
-22.9%
0.7%
market voLume
8
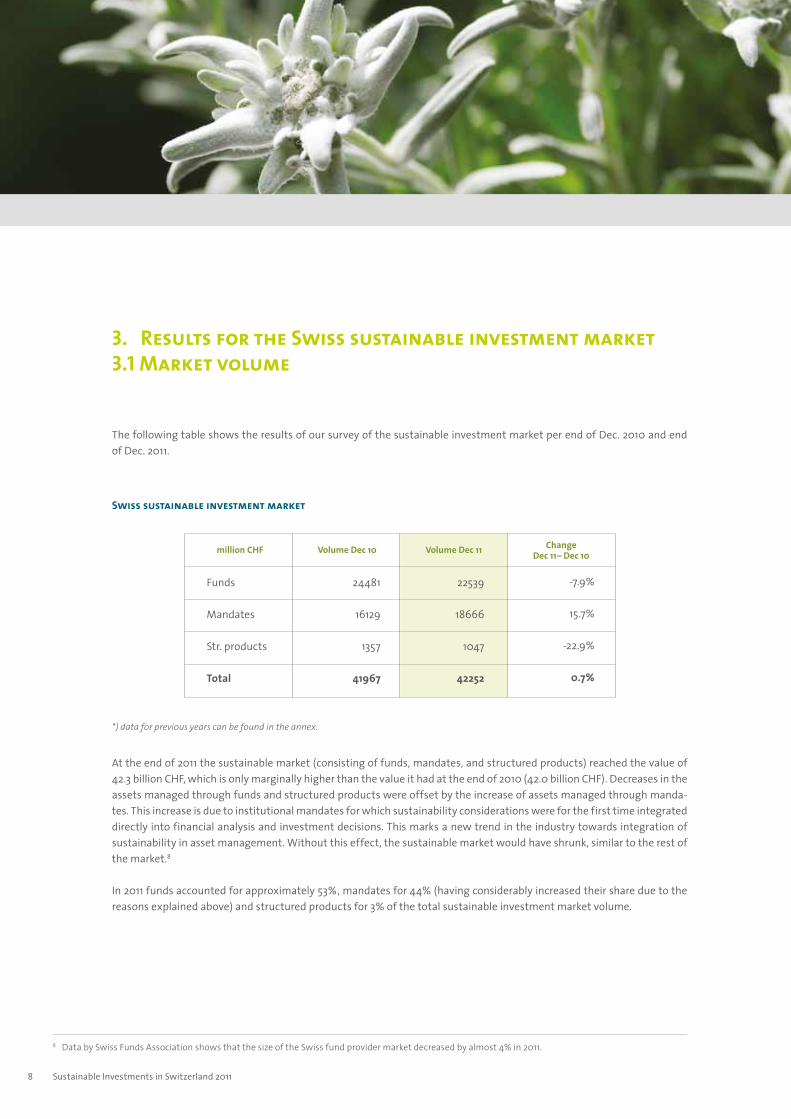
The following table shows the results of our survey of the sustainable investment market per end of Dec. 2010 and end of Dec. 2011.
8 Data by swiss Funds association shows that the size of the swiss fund provider market decreased by almost 4% in 2011.
3. Results for the Swiss sustainable investment market3.1 Market volume
Volume Dec 10
24481
16129
1357
41967
million CHF
Funds
Mandates
Str. products
Total
Volume Dec 11
22539
18666
1047
42252
At the end of 2011 the sustainable market (consisting of funds, mandates, and structured products) reached the value of 42.3 billion CHF, which is only marginally higher than the value it had at the end of 2010 (42.0 billion CHF). Decreases in the assets managed through funds and structured products were offset by the increase of assets managed through manda-tes. This increase is due to institutional mandates for which sustainability considerations were for the first time integrated directly into financial analysis and investment decisions. This marks a new trend in the industry towards integration of sustainability in asset management. Without this effect, the sustainable market would have shrunk, similar to the rest of the market.8
In 2011 funds accounted for approximately 53%, mandates for 44% (having considerably increased their share due to the reasons explained above) and structured products for 3% of the total sustainable investment market volume.
Swiss sustainable investment market
*) data for previous years can be found in the annex.
Sustainable Investments in Switzerland 2011
market voLume
Participating institutions for the current survey include:
• Bank Coop• Bank Sarasin• Bank Vontobel• BCGE (ex Synchrony)• BlueOrchard• Care Group• Credit Suisse • Ethos• Hauck & Aufhäuser (Schweiz)• LGT• Lombard Odier Darier Hentsch (LODH)• Migros Bank• Pictet• Raiffeisen• responsAbility• Sustainable Asset Management (SAM)• Swisscanto• UBS • Quantex (ex. Zegora)• Zürcher Kantonalbank (ZKB).
0
5000
10000
15000
20000
25000
30000
35000
40000
45000
MandatesFunds, str. products
Sustainable Investments in Switzerland Dec. 1996 - Dec. 2011
Dez. '96
Dez. '97
Dez. '98
Dez. '99
Dez. '00
Dez. '01
Dez. '02
Dez. '06
Dez. '05
Dez. '04
Dez. '03
Dez. '07
Dez. '11
Dez. '10
Dez. '09
Dez. '08
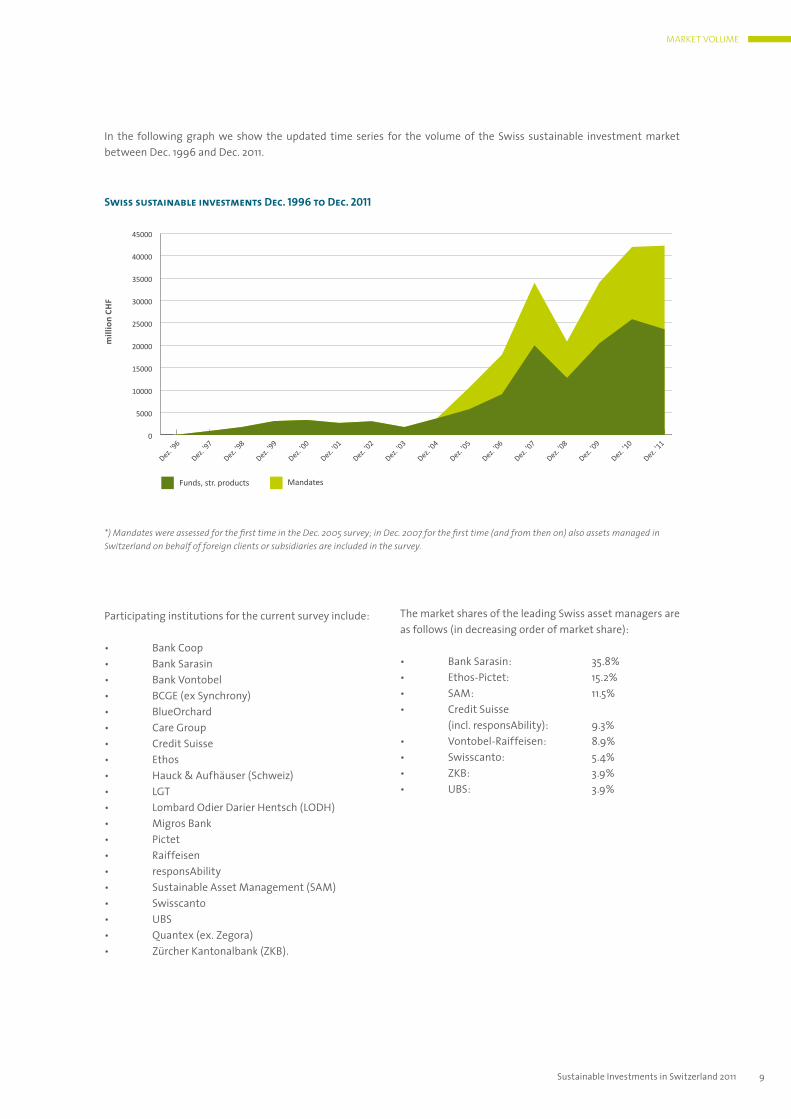
*) Mandates were assessed for the first time in the Dec. 2005 survey; in Dec. 2007 for the first time (and from then on) also assets managed in Switzerland on behalf of foreign clients or subsidiaries are included in the survey.
The market shares of the leading Swiss asset managers are as follows (in decreasing order of market share):
• Bank Sarasin: 35.8%• Ethos-Pictet: 15.2%• SAM: 11.5%• Credit Suisse (incl. responsAbility): 9.3%• Vontobel-Raiffeisen: 8.9%• Swisscanto: 5.4% • ZKB: 3.9%• UBS: 3.9%
9
Swiss sustainable investments Dec. 1996 to Dec. 2011
mill
ion
CHF
In the following graph we show the updated time series for the volume of the Swiss sustainable investment market between Dec. 1996 and Dec. 2011.
Sustainable Investments in Switzerland 2011
As in the previous evaluation, the split of assets under management (AuM) for different investor types, asset classes and investment approaches was assessed.
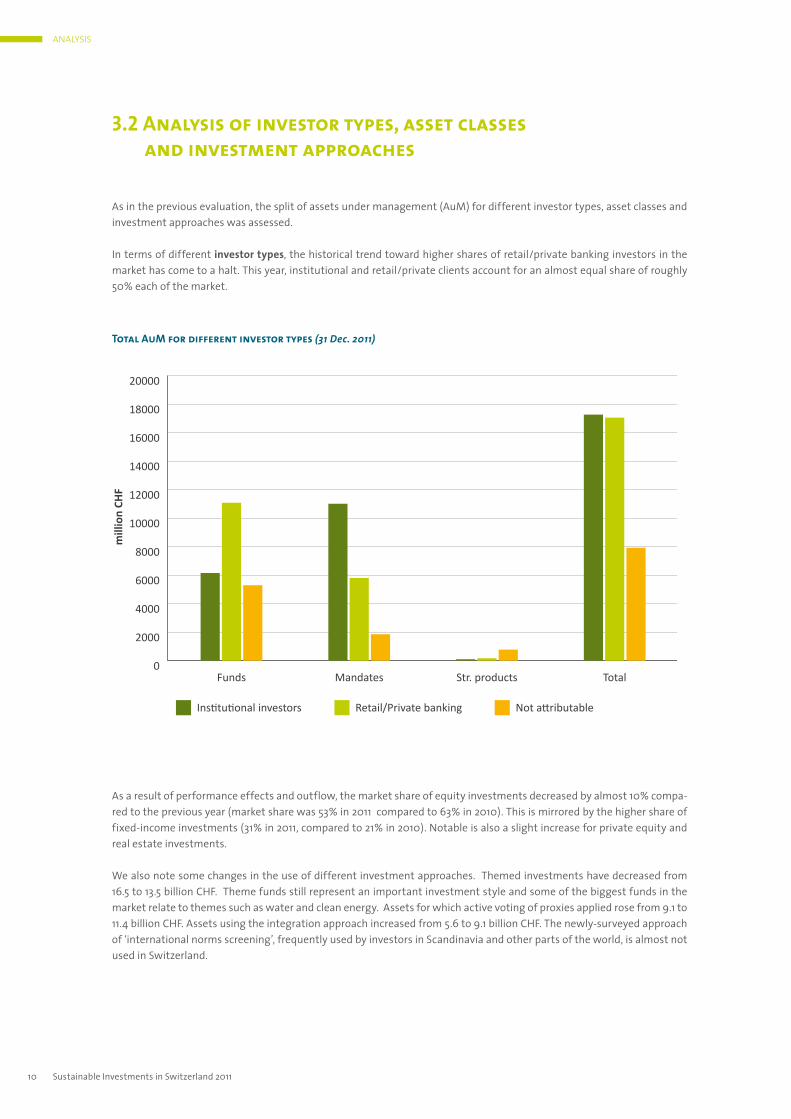
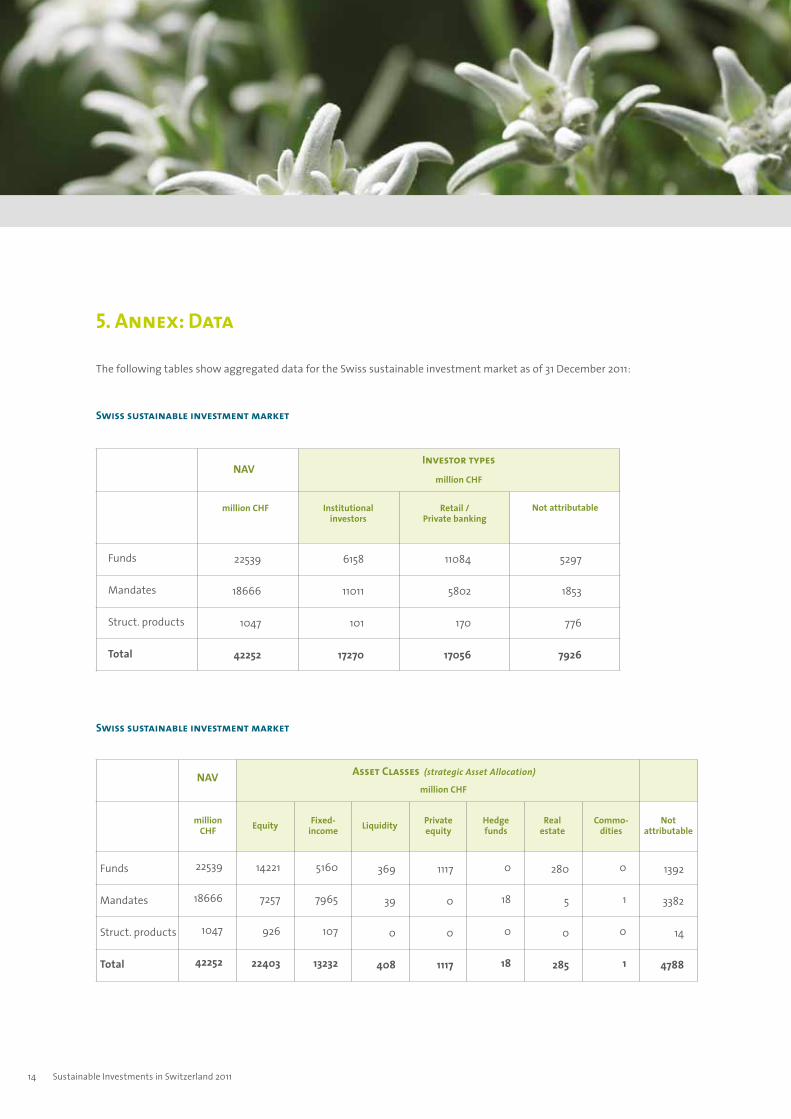
In terms of different investor types, the historical trend toward higher shares of retail/private banking investors in the market has come to a halt. This year, institutional and retail/private clients account for an almost equal share of roughly 50% each of the market.
3.2 Analysis of investor types, asset classes and investment approaches
0
2000
4000
6000
8000
10000
12000
14000
16000
18000
20000
TotalStr. productsMandatesFunds
Institutional investors Retail/Private banking Not attributable
mill
ion
CHF
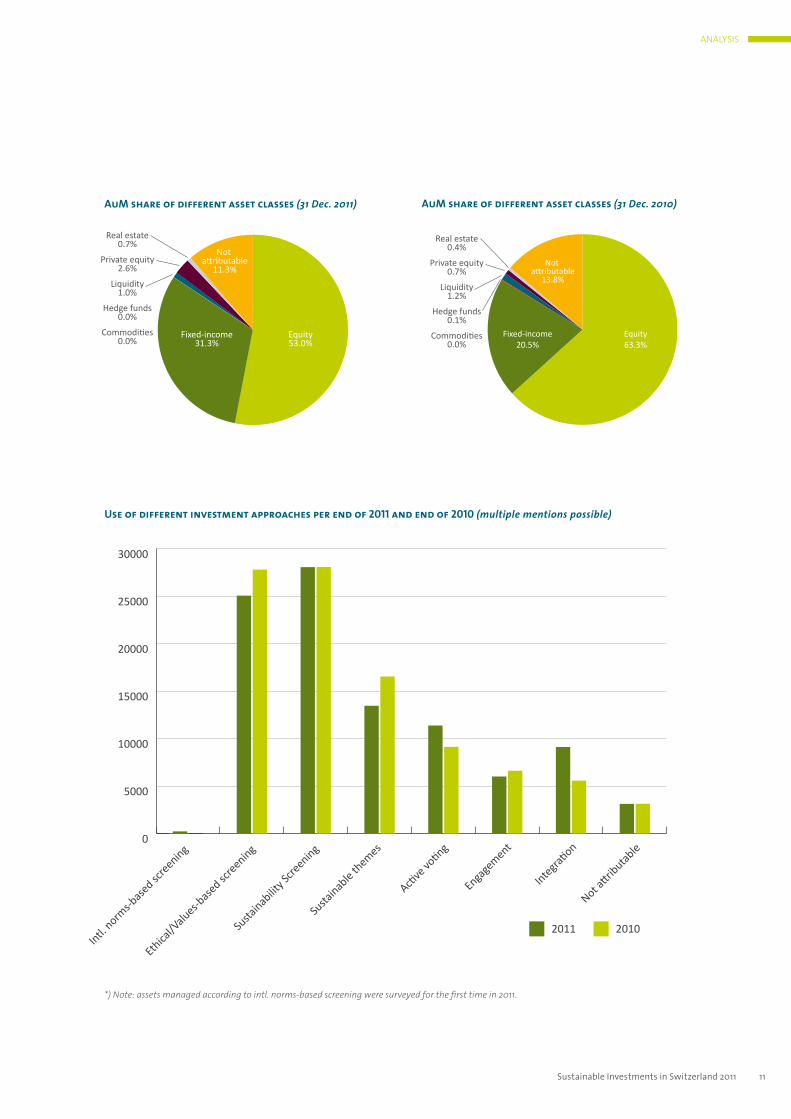
As a result of performance effects and outflow, the market share of equity investments decreased by almost 10% compa-red to the previous year (market share was 53% in 2011 compared to 63% in 2010). This is mirrored by the higher share of fixed-income investments (31% in 2011, compared to 21% in 2010). Notable is also a slight increase for private equity and real estate investments.
We also note some changes in the use of different investment approaches. Themed investments have decreased from 16.5 to 13.5 billion CHF. Theme funds still represent an important investment style and some of the biggest funds in the market relate to themes such as water and clean energy. Assets for which active voting of proxies applied rose from 9.1 to 11.4 billion CHF. Assets using the integration approach increased from 5.6 to 9.1 billion CHF. The newly-surveyed approach of ‘international norms screening’, frequently used by investors in Scandinavia and other parts of the world, is almost not used in Switzerland.
Total AuM for different investor types (31 Dec. 2011)
anaLysIs
10 Sustainable Investments in Switzerland 2011
anaLysIs
0
5000
10000
15000
20000
25000
30000
Not attrib
utable
Integra
tion
Engage
ment
Active
voting
Susta
inable th
emes
Susta
inabilit
y Scre
ening
Ethica
l/Valu
es-bas
ed scre
ening
Intl. norm
s-bas
ed scre
ening
2011 2010
Equity53.0%
Fixed-income31.3%
Liquidity1.0%
Private equity2.6%
Hedge funds0.0%
Real estate0.7%
Commodities0.0%
Not attributable
11.3%
AuM share of different asset classes (31 Dec. 2011) AuM share of different asset classes (31 Dec. 2010)
11
Use of different investment approaches per end of 2011 and end of 2010 (multiple mentions possible)
*) Note: assets managed according to intl. norms-based screening were surveyed for the first time in 2011.
Sustainable Investments in Switzerland 2011
Equity63.3%
Fixed-income20.5%
Not attributable
13.8%Liquidity
1.2%
Private equity0.7%
Hedge funds0.1%
Real estate0.4%
Commodities0.0%
onValues also asked survey participants to report net asset in-/outflows.
The results show that the Swiss sustainable investment market (funds/mandates/structured products) experienced a net asset inflow of approximately 11% in 2011. This includes existing institutional mandates for which sustainability issues were considered for the first time in financial analysis and portfolio management (integration approach). Without coun-ting this, the sustainable market would have experienced a net outflow of about 1.2%. As a comparison, the total Swiss fund provider market experienced a net inflow (purchases) of about 1.3% in 2011.9
3.3 Analysis of net in-/outflows
Based on the detailed information provided by providers for 2011, we observe the following trends with respect to inno-vative investment strategies:
• The sustainable real estate/property strategies were able to attract considerable inflow• Some funds targeting natural resource themes (agriculture, cleantech etc.) also experienced inflows• Additional global emerging markets equity strategies have come to market, increasing the choice for investors• One provider launched a new sustainable corporate bond fund, reflecting the trend toward more inclusion of sustainability in fixed income investments• Managers offering so-called impact investments (specifically designed to create measurable social and/or environmental impact, while maintaining the potential for positive financial return) are looking beyond microfinance and have launched new strategies covering themes such as fair-trade agriculture, health and access to basic services• Notable is the large increase in assets with active voting of proxies over the years. From 2.3 billion CHF in 2005, this category has grown to 11.4 billion CHF per end of 2011• New ‘balanced’ strategies for institutional investors were offered, but the total volume and choice remain limited • There was not much activity in the structured product domain, except for one provider• There is still a lack of coverage of important asset classes, including commodities and real assets/infrastructure.
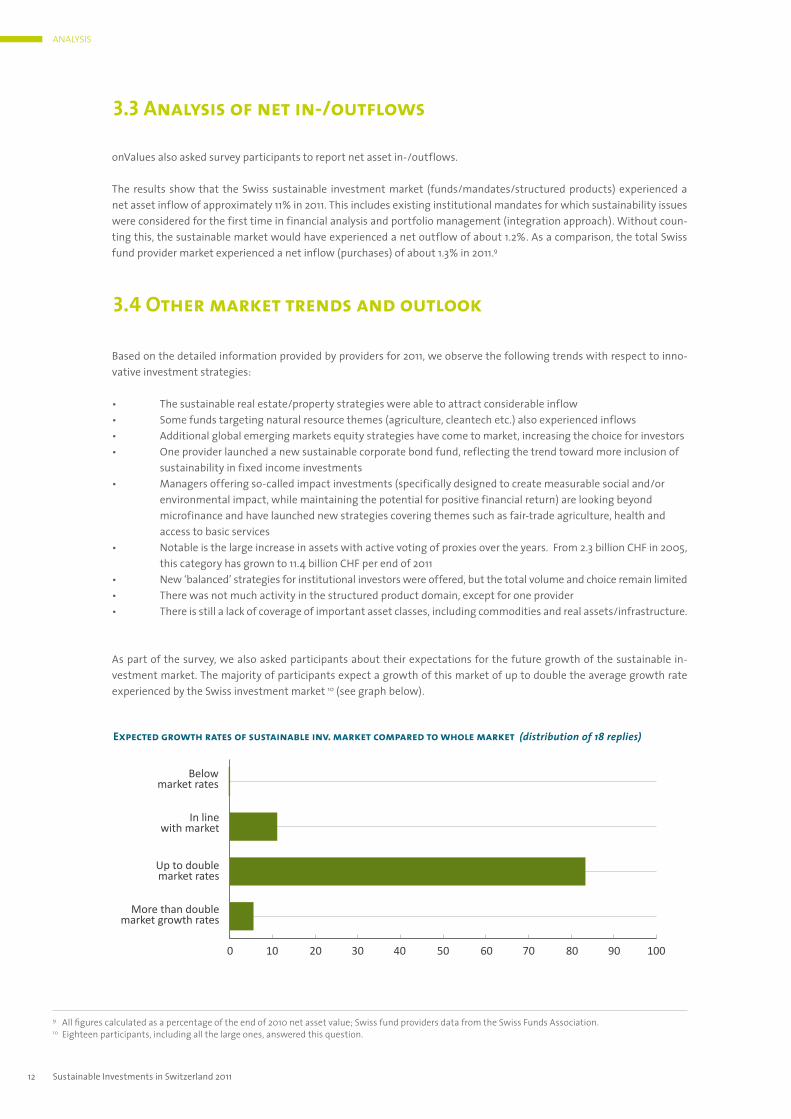
As part of the survey, we also asked participants about their expectations for the future growth of the sustainable in-vestment market. The majority of participants expect a growth of this market of up to double the average growth rate experienced by the Swiss investment market 10 (see graph below).
3.4 Other market trends and outlook
9 all figures calculated as a percentage of the end of 2010 net asset value; swiss fund providers data from the swiss Funds association.10 eighteen participants, including all the large ones, answered this question.
12
anaLysIs
0 10 20 30 40 50 60 70 80 90 100
More than doublemarket growth rates
Up to doublemarket rates
In linewith market
Belowmarket rates
Expected growth rates of sustainable inv. market compared to whole market (distribution of 18 replies)
Sustainable Investments in Switzerland 2011
As in the previous year, the trend towards sustainable investments continued in 2011 and sustainable investments‘ share of total assets under management in Liechtenstein further increased. While the growth of total assets under manage-ment overall tended to stagnate as a consequence of the strong Swiss franc, sustainable investments grew slightly. This also reflects an increasing demand of clients for sustainable and values-based investments.
This growth can be mainly attributed to the increase in the volume of funds which make out the biggest part of sustaina-ble investments. The share of sustainable funds in total funds under management of CHF36bn is at just under 2%. Equity and bond funds predominate which – mainly as thematic funds – embody sustainable investment styles or reflect a broad investment universe as best-in-class funds. The share of other asset classes such as microfinance or climate protection funds is rather small. As is the share of project funds so far, but showing an upward trend.
For the future a further growth of sustainable investments is to be expected. Both the Microfinance Initiative Liechten-stein (MIL, www.microfinance.li) as well as the LIFE Climate Foundation Liechtenstein (www.klimastiftung.li) have been well-established in Liechtenstein for quite some time. These initiatives aim to promote specific sustainable projects and financial products which are ecologically, socially and economically sustainable. Furthermore, the new AIFM legislation, which implements the European Alternative Investment Fund Managers Directive and has recently been submitted for public consultation, offers an ideal framework for alternative investments.
This section has been contributed by the Liechtenstein Bankers Association.
4. The sustainable investment market in Liechtenstein
13Sustainable Investments in Switzerland 2011
5. Annex: Data
million CHF
Funds
Mandates
Struct. products
Total
Institutionalinvestors
Retail /Private banking
Swiss sustainable investment market
The following tables show aggregated data for the Swiss sustainable investment market as of 31 December 2011:
Not attributable
Investor typesNAV
million CHF
Funds
Mandates
Struct. products
Total
Equity Fixed-income
Swiss sustainable investment market
Liquidity Hedgefunds
Private equity
Realestate
Commo-dities
Not attributable
Asset Classes (strategic Asset Allocation)NAV
14
22539
18666
1047
42252
14221
7257
926
22403
5160
7965
107
13232
369
39
0
408
1117
0
0
1117
0
18
0
18
280
5
0
285
0
1
0
1
1392
3382
14
4788
million CHF
million CHF
Sustainable Investments in Switzerland 2011
22539
18666
1047
42252
6158
11011
101
17270
11084
5802
170
17056
5297
1853
776
7926
22539
18666
1047
42252
Funds
Mandates
Struct. products
Total
233
0
0
233
15738
9050
280
25068
Swiss sustainable investment market
17673
9950
450
28072
10335
1058
0
11393
10711
1883
873
13467
5616
397
0
6013
4035
4993
101
9128
Investment approaches (multiple choice)NAV
1212
1913
14
3140
15
5668
4859
102
10628
Funds
Mandates
Struct. products
Total
Swiss sustainable investment market (million CHF)
VolumeDec 2005
8829
8811
283
17923
VolumeDec 2006
18839
13998
1164
34001
VolumeDec 2007
12187
8115
556
20858
VolumeDec 2008
18815
13596
1664
34075
VolumeDec 2009
24481
16129
1357
41967
VolumeDec 2010
22539
18666
1047
42252
VolumeDec 2011
International Norms-based
Screening
Ethical/Values-based
Screening
Sustanability Screening (positive-criteria or
best-in-class)
Sustainabe themes
Active voting Engagement Integration Not
attributablemillion
CHF
million CHF
Sustainable Investments in Switzerland 2011

www.forum-ng.org