Embed Size (px)
Citation preview
Sustainable Growth Based on Export-Oriented Economic Strategy The Bulgarian Case in an International Comparison
Prof. András Inotai
ImprintFriedrich-Ebert-StiftungOffice Bulgaria97, Knjaz Boris I St.1000 Sofia, BulgariaResponsible:Regine Schubert, Director
OrdersEconomicPolicy InstituteYasen Georgiev
e-mail: [email protected]: (+359 2) 9522693
All texts are available onlinewww.fes.bg The views expressed in this publicationare not necessarily those of theFriedrich-Ebert-Stiftung or of theorganization for which the author works.
This paper aims at identifying the strengths and weaknesses of the Bulgarian economy’s transformation to a more dynamic and export-oriented growth model. By referring to two groups of countries – Central European EU member states as well as the Western Balkans, the study puts an emphasis on the impact the EU membership and the 2009 crisis year have on the Bulgarian foreign trade and export performance in particular.
The first chapter gathers arguments in favour of the export-oriented growth model but also addresses potential risk factors of such long-term policy. Despite some drawbacks as increasing vulnerability and de-pendence on external factors, this development path is justified as the better way for achieving sustainable economic growth of small economies like Bulgaria.
The second chapter deals with the global financial crisis and its influence on the exports and foreign trade in general. Then, the author focuses on Bulgaria’s export performance in the EU and on a regional compari-son by stressing on the role of foreign direct investments in the export orientation of the country.
Finally, the paper concludes by summarizing measures and instruments for catching-up export-driven economic development and by formulating policy recommendations supporting the successful implementa-tion of such an export-led growth model.
April 2013
ECONOMIC
POLICY
ANALYSES
1
Table of Contents
1. Introduction ............................................................................................................................2
2. Why export-led growth for small and catching-up economies? Arguments, dilemmas
and impacts ................................................................................................................................3
3. Impact of the global crisis on the correlation between growth and trade .......................... 8
4. Bulgaria’s export performance in the European Union and a regional comparison ......... 12
4.1. Bulgaria’s trade development ...............................................................................................12
4.2. Selected indicators of export orientation ..............................................................................13
4.3. Geographic orientation of exports ........................................................................................17
4.4. Commodity pattern of exports and imports..........................................................................18
4.5. The role of foreign investments in export orientation............................................................21
5. Concluding remarks and policy recommendations ...........................................................26
References ................................................................................................................................31
Tables ........................................................................................................................................32
Abbreviations:
BNB Bulgarian National BankCEE Central and Eastern EuropeCMEA Council for Mutual Economic Assistance)EU European Union FDI Foreign Direct InvestmentsGDP Gross Domestic ProductOECD Organization for Economic Co-operation and Development
2
1. Introduction
Based on a widespread experience of the last four decades, high growth and successfull catching-up of less or medium-developed small economies was closely linked to their choice of an export-oriented development pattern. A growing development gap can convincingly be identified between countries following the export-oriented path and those based on domestic market orientation, trade and economic protectionism and import-led (but sooner or later unsustainable) growth. However, for countries that would like to join the group of successful exporters with a certain timelag, the change from domestic demand-generated growth to export-oriented growth is by far not easy and even less self-evident.
First, the global economic environment is constantly changing and the conditions that made export-oriented growth a success story in previous decades have been constantly modi-fied, partly in favour, partly against the switch from one strategy to another, and more im-portantly, to the implementation of an export-oriented strategy. Second, the growing impor-tance of successful export-oriented economies provides not only an example to be followed but, at the same time, it narrows the manoeuvring room of latecomers and exerts a certain “crowding-out effect”, since not each country can build its strategy on exports due to the limits of international demand and of rapidly intensifying global competition. Third, the global financial and macroeconomic crisis of 2008-2010 led to the (almost) collapse of international trade, hitting export-oriented, more open”, and as a consequence, more vulnerable econo-mies harder than countries characterized by inward-looking and domestic market-based eco-nomic policies. Fourth, even if there are a lot of convincing arguments, any change from one economic strategy to another one is not a question of desire and aspiration but fundamentally depending on the availability of the necessary resources and instruments at home and of a favourable international environment that could support successful reorientation towards an export-led growth pattern.
Central, Eastern and Southeastern European countries belong to the latecomers as com-pared to the international trend of export-orientation that emerged at least two decades earlier than the unprecedented systemic transformation process started. However, even in this circle of countries, we can observe at least three different groups. The Central European countries, particularly the Czech Republic, Hungary and – with some delay – Slovakia, rep-resent the first and largely successful, most export-oriented group (with some reservation to Slovenia and to Poland with a large domestic market). The second wave incorporates Bul-garia and Romania as relative latecomers but with a growing trend of export-orientation. Finally, the Western Balkan countries form the third group with a very low degree of and very modest instruments available for initiating an export-oriented growth strategy.
This paper aims at identifying the international scope of switching the Bulgarian econ-omy to a more dynamic and export-led growth pattern. Therefore, the (changing) features of Bulgarian exports will always be contrasted with two other groups, namely the Central European EU member countries and the Western Balkan countries.
The structure of the study follows a logical sequencing. The first chapter collects argu-ments in favour of the export-oriented pattern, mainly based on broad international litera-ture and on favourable experience of at least a dozen of small, catching-up economies. At the same time, challenges and potential barriers to export-orientation will be shortly
3
addressed. However, the general evaluation is in favour of international trade as the key engine of economic growth over decades. The second chapter deals with the impact of the global crisis, with special reference to the collapse of international trade, and the “ideologi-cal” explanation of the end of export-oriented growth pattern. This short-lived – but not yet fully disappeared – arguments were evidently rejected by the surprisingly quick recovery of international trade in general and of exports, in particular. The third chapter focuses on Bulgaria’s exports in a three-level comparison: as a member of the EU-27, as a part of the new member countries and as compared with the Western Balkan economies. Here, key components with substantial impact on the development of exports will be investigated. The last chapter contains some policy recommendations and sums up potential barriers or even dangers on the way to a sustainable and export-led growth pattern.
2. Why export-led growth for small and catching-up economies? Arguments, dilemmas and impacts
Export-oriented growth strategies date back to the 1950s and 1960s. Interestingly, the pioneers have been two countries with large domestic markets, but with strong industrial backgrounds, the Federal Republic of (Western) Germany and Japan. In the late 60s, and particularly between 1970 and 1984, four small East Asian economies, called “small tigers” turned away from import-orientation and domestic market-protection and opted for export orientation (Republic of Korea, Hong Kong, Singapore and Taiwan). Their example was fol-lowed by another group of countries in the region but already with a different degree of success (Malaysia, Thailand, on the one hand, and the Philippines and Indonesia, on the other hand). In our days, other countires of thr region, mainly Vietnam but also Cambodia and Myanmar, try to repeat the success of East+Souteast Asian countires. In Latin America, traditionally carrying out an import-substitution-based development policy, Mexico was the first to open up its market overwhelmingly to US investors discovering the advantage of wage difference for competitive production for exports (mainly back to the USA, „maqui-ladora” industries). However, we can find successful examples in Europe as well. Although the highly developed small European economies have based their growth for a long time on trade openness and exports (Benelux, Sweden, Denmark, Switzerland), Ireland and Fin-land – with largely different industrial structures, traditions and geographic background – became the success stories from the beginning of the 1990s. In a politically divided Europe and with strong – many times unilateral – links to the ex-Soviet Union, the Central, Eastern and Southeastern European countries did not have the chance of getting involved into the international trend of export orientation. Of course, all member countries of the CMEA were fundamentally dependent on the ex-Soviet market but the functioning of this market essentially differed from that of the global (capitalist) market. Therefore, their international competitiveness, a crucial factor of successful export-orientation, could not be measured correctly (and if it was measured, it turned out that they were mostly uncompetitive on Western markets, and, in addition, their otherwise potentially competitive commodities had to face high protectionist barriers). The last and most eloquent example of the success of export-oriented growth strategy has been delivered by China in the last two decades. In fact, in 2009 China became the largest exporter of the world, ahead of Germany and the
4
USA and could increase its leading position between 2009 and 2012. This phenomenon is unique if we consider that at first sight, logically, all other less developed countries with potentially large domestic markets used to focus on domestic demand-driven growth (see the examples of Brazil, India, Indonesia, Argentina, Australia, Canada, but also of the one-commodity exporter Russia).
The theory of export-led growth is based on the studies on absolute and comparative advantages developed already in the 19th century by Ricardo and Smith. The theoretical background was further strengthened by the factor-endowment-based research of Hek-scher and Ohlin, the innovation-led growth theory developed by Schumpeter and the prod-uct-cycle approach, including capital relocation by Vernon. In practice, the economic policy of the big business in the USA and of the alliance between the government and the big business in Japan followed Vernon’s theory. The USA started to relocate to Mexico labour-intensive and „mature” products, the production of which did not have any comparative advantage in the USA. Similarly, Japan developed its „flying geese” strategy that embraced the relatively most developed and open East Asian economies as production base in the first round but with some timelag, continued this policy already with the active participation of the East Asian tigers to another less developed and less industrialized group of the region.
Without going into details, several factors explain not only the viability but also the ne-cessity of the export-led strategy. (For a good summary see Gkagka-Zarotiadis, 2011.) First, concerning many industrial goods, narrow domestic markets do not offer opportunity for developing internationally competitive economies-of-scale production. It has to be noted that the size of the market crucially depends on the disposable income of the population and not – several times incorrectly stressed – on the size of the population. Second, competitive advantages fueling growth can only be utilized if a national economy orients itself towards foreign markets. Third, export orientation enhances specialization with additional positive im-pact on economies-of-scale production and competitive imports as inputs for export-oriented production. In this context, we have to emphasize the importance of openness to imports that can replace uncompetitive domestic inputs, a main barrier to competitive exports, by cheaper and higher-quality imports. Fourth, as a result of openness to imports, the export-oriented country regularly gets not only more competitive imports, but enjoys the benefits of technol-ogy transfer and efficient managerial methods. Fifth, foreign direct investments, in most cases the owners of new technologies used to play a pivotal role in successful export-led growth. According to international experience, involvement into the global and/or regional production and service network of transnational companies may not only strengthen but also deepen the pattern of international division of labour in general, and that of export orientation, in partic-ular. Sixth, the key external anchor of successful export-led strategy lies in the openness, size and dynamics of international/regional markets. Trade liberalization, either on the global scale or in the framework of regional or even bilateral free trade agreements, generates a relevant and positive impetus on opening up and offers new chances for exporting. It should not be ignored that cooperation with foreign (both transnational and small- and medium-sized) firms many times opens up external markets for domestic production and fosters the export-led growth pattern (Buturac-Lovrincevic-Mikulic, 2010). Finally, declining or stagnating domestic demand can act as a pressure or push factor for export orientation, since many companies may see their only chance for survival in finding new, external markets.
5
Over decades the export-led growth pattern delivered convincing arguments to be fol-lowed. It generated high growth rates, created new jobs, led to higher labour productivity, introduced new organizational and managerial methods of production, ensured relevant inflows of capital and technology, substantially increased export revenues and, in several cases, turned traditional trade deficit into surplus, improved the current account balance and as a result contributed to higher financial stability of the given economy.
Another, not less convincing argument, came from the failure of the decades-long experiment with import-substitution efforts. The comparison between the East Asian and (most of) the Latin American economies is more than telling. East Asian countries focused on exports to highly developed countries (in the first stage of their export-led growth on the USA where they enjoyed trade preferences).1 Regional cooperation, the growth of which we can witness in the last decade, came after getting internationally competitive. The Latin American path followed a different sequencing. Although the failure of na-tional protectionism and the unviability of domestic demand-led growth became obvious decades ago, the way did not lead to open up to the external world but to establish re-gional integrations in order to enlarge the available market and become competitive in an otherwise protected or almost closed „training ground” for several decades. In fact, very few companies (mainly in Brazil and partly in Chile) could break the deadlock of creating „regional champions” without an international competitive edge.
Third, the growing contribution of international trade to global growth provides probably the most convincing argument in favour of export-driven strategies. The evidence derived from Table 1 is that international trade in goods and services used to grow almost twice as rapidly as global GDP growth. Between 1993 and 2002 global GDP growth of 3.3 per cent annually was accompanied by global trade growth of 6.5 per cent annually. Both figures indicated an even higher dynamism in the six-year pe-riod before the crisis (2003-2008), with an obvious „gap” in favour of annual global trade growth. This correlation was brutally interrupted by the crisis in 2009. However, to the surprise of many observers and analysts, international trade could return to a dynamic path already in 2010 and became once again the leading factor of eco-nomic growth or – in many cases - could counterbalance negative developments of other key components of growth.2 It is well known that growth can be generated by three fundamental factors: domestic demand (both private and public), investments and exports. Figures contained in Table 1 indicate that – except for the crisis year of 2009 – the growth of international trade (both exports and imports) proved to be the most important engine of growth both in advanced economies and in emerging and developing countries as well. Another evidence is the correlation between elasticity
1 It has to be added that, even if free access to one or more large external markets is ensured, as an indispensable element of export-orientation („external anchor”), the success of export-led growth strategy depends on several other factors as well. In the case of the East Asian economies it was a comprehensive and long-term industrial policy connected with cautious liberalization of the domestic market, strong government intervention, undervalued national currencies, investment in education, research and development, technology transfer and its efficient absorption, cooperation with foreign firms, etc. Needless to say that some of the above conditions either do not exist in today’s globalized environment or have to be adjusted to the new international framework2 According to a forecast by the OECD prepared in 2011, world trade was expected to grow twice as much as GDP in 2011 and 2012. (The Economist, May 28, 2011).
6
of trade to world income. Taking world income 1, trade elasticity amounted to 1.77 already in the 1960s and kept on growing from decade to decade (1.94 in the 1970s, 2.75 in the 80s, 3.36 in the 90s and 3.69 in the first decade of the 21st century (Freund, 2009, Escaith et al. 2010).
Without downgrading the powerful arguments in favour of an export-led economic strategy, particularly for small economies with catching-up efforts, we have to call attention to some risks and challenges of such a strategy in order to create a more balanced picture.
First: without free (liberalized) access to large and dynamic external markets (in many cases external anchors for the entire economy), export-led growth strategy faces serious difficulties. Barriers can be raised on country-level or they can be commodity-related that have a negative impact just on those sectors that would be the backbone of an export-led strategy.
Second: another crucial factor of the success of implementing export-led strategy is the level of competitiveness of the respective economy. The measurement of competitive-ness cannot be reduced any more to such traditional elements as price, quality or times-pan of delivery of a given product or service. Even exchange rate-based competitiveness driven by continuous devaluations has not only short-term benefits (increasing exports) but also short-term disadvantages (higher price of imports, increase of overall inflation rate), and more importantly, longer-term drawbacks (postponing structural adjustment and impeding upgrading towards higher-value added production). Moreover, sustainable competitiveness in the era of globalization includes several new factors, such as the ef-ficiency of institutions on all levels (government, regional, local), lack of bureaucratic obstacles, critical minimum of social cohesion, future-oriented mentality of the society and its capacity/readiness to accept, absorb and further develop political, economic, insti-tutional and social „innovations” (innovative society).
Third: economic openness concerning trade, services, capital (and increasingly for-eign labour) brings not only relevant benefits but can involve substantial costs as well. The current crisis hit the most open economies stronger than less open ones. Export-oriented countries used to be more vulnerable to external shocks. This is particularly the case if they are specialized in commodities and/or services that happen to be above-average crisis-sensitive (Josifidis – Dragutinovi Mitrovic - Ivancev, 2012). In addition, trade liberalization reduces budgetary revenues because income from tariffs and other protectionist measures declines (a frequent argument of non-competitive African and non-oil Arab economies).
Fourth: under conditions of globalization, successful export-led strategy requires (al-most) a full opening of the economy in order to have access to competitive imports to be built into competitive export products. In this situation there is little room and maybe even less time for developing prospective economic activities without any (meaningful, although temporary) protection. Thus, the classic way of „nourishing” „infant industries” with the expectation of achieving international competitiveness after some time seems to be unlikely to be realized.3 Therefore, sources of „genuine” (home-made) growth have to
3 Frankly speaking, achievements related to „infant industry” development remained very much below original expectations everywhere in the world even in a much more protectionist period of the past decades. In addition, some of the successful examples could only become competitive with continuous support (subsidies) by the given state.
7
be looked for in other areas, most probably within the highly liberalized field and under harsh international competition.
Fifth: openness of small economies definitely increases their dependence both on the size and structure of demand in their most important export markets, but also on imports of key inputs (energy, raw materials, semi-manufactured goods, technology) directly or indirectly used for their competitive exports. The degree of dependence may be higher if the country’s exports and imports are concentrated on a few markets and a few suppliers. However, also geographic diversification hides several risks if it reduces the degree of reliability of new partners. Let alone that in long-term business relations and considering the already given deep cooperation with leading transnational com-panies, the „price” of dependence is a higher level of security of production, jobs and markets (most probably not a bad deal).
Sixth: particularly the first stage of export-led growth (and opening) is likely to be connected with higher growth of imports than of exports. This may generate substantial trade (and current account) deficit (Todorovic, 2008). Whether in a later stage of export-led growth such a deficit can be reduced or even eliminated, to a large extent depends on a number of domestic and partly external factors (upgrading potential of the given economy or sector in the value chain, substitution of imported inputs by competitive do-mestic production, efficient use of skilled labour and research and development expendi-tures, supporting public administration, developments in external markets, relations with international business, etc.).
Seventh: in fact, it happened several times that the export-led growth pattern re-mained on a low value added level of specialization and the respective economy became the hostage of an increasingly outdated and less and less competitive production struc-ture. This is a special problem if several countries compete with each other with similar low-wage products/services. Moreover, these activities are strongly exposed to rapidly growing international competition coming from more and more less developed countries that, similarly, see their opportunity in entering external markets in the initial stage of their hoped-for-catching-up process. Therefore, it is the task of the economic policy to avoid a situation in which export-led growth could become hostage of static effects in-stead of generating dynamic effects of competition (Zhelev and Tzanov, 2012).
Eighth: an export-led strategy represents a key shift in development priorities towards higher level of competitiveness. However, since the economy consists of sectors differ-ently prepared for opening and international competition, even positive-sum structural changes are accompanied by losses. They can be particularly painful in the labour market and would definitely affect the cohesiveness of the society as well. In order to avoid the disruption in the texture of the national economy and prevent similar negative division (including marginalization due to higher level of unemployment of unskilled or not ad-equately skilled labour) in the labour market and the social sphere, longer-term strategies are badly needed. They should partly be financed by the rapidly increasing revenues gen-erated by the successful export sectors and a rapidly increasing GDP in the framework of a carefully designed redistribution scheme.
Ninth: one of the serious risks of sustainable export-led growth is the potential demagogic and populist backlash addressing openness, liberalization, foreign owner-
8
ship, international institutions as a negative development and a real threat to „na-tional sovereignty”. In many cases it is not the (temporary) trade deficit or the dif-ferent perception of gains and losses (within a positive-sum game!) that may ques-tion the sustainability of export-led growth but artificially generated social attitudes („freedom fighting”).
Tenth: Economic globalization fuelled by the free flow of capital, liberalization of trade and service markets as well as the impact of the information and communication revolution did not only result in massive relocation of various production and service activities mainly from developed to medium-developed, emerging and less developed countries but have nourished a large-scale deindustrialization process with serious eco-nomic and social consequences in selected highly industrialized economies. The eco-nomic consequences expressed mainly in huge trade imbalances (both surpluses and deficits) are already clear. The social consequences may become fully visible in the next period if some developed countries do not find the right answer to this challenge (cer-tainly not by relying on more protectionism).
In sum: despite the above-mentioned potential (or real) risks and challenges, small countries in the current global conditions can hardly opt for a strategy that would not be based on growing export orientation. In case they want to create conditions for sustain-able and high growth with the real chance of catching up, they can only rely on broader and deeper participation in the international division of labour. The reduction of losses (and, similarly, the increase of gains) requires a coherent and long-term economic and social strategy. It is definitely not a return to a domestic market-based development that would bring neither growth nor catching-up and, at the same time, seems unsustainable even in the short or medium term.
3. Impact of the global crisis on the correlation between growth and trade
The financial and macroeconomic crisis suddenly disrupted decades-long correlations be-tween growth and exports. While global GDP declined by less than 1 per cent (however, by 3.7 per cent on average of the developed countries, and by 4.6 per cent in the EU-27), worldwide exports suffered a fall of more than 10 per cent. Similarly, exports of devel-oped countries experienced a decline by 12 per cent, while the EU-27 reported an export fall by almost 20 per cent. Even emerging and developing countries that could keep their GDP growth positive (2.8 per cent on the average) due to rising domestic consumption, were not exempt of the crisis in the developed countries. As a result, their aggregate ex-ports shrank also by almost 8 per cent.
Observers always critical to export-led pattern of growth got immediately into the centerplace. They have formulated three key messages, not least for the Central and Eastern European, relatively „newcomer” export-led economies. First, the crisis has re-vealed the high level of vulnerability of openness and external orientation. Second, some sectors the most competitive Central European countries were specialized on and which had long been considered as a success story of having upgraded the production pattern from low- to medium- and high-tech sectors, experienced an above-average collapse. The verdict was straightforward: a wrong pattern of specialization. And third,
9
the never settled conflict between large, competitive, financially strong transnational companies and the undercapitalized, uncompetitive domestic small- and medium-sized firms became more than evident.
However, the critical remarks did not offer any viable alternative. First, reducing the openness of the Central and Eastern European EU members would have meant to with-draw from the European integration, since 70 to 85 per cent of their exports were di-rected to the internal market. Any ideology-driven and administrative step in reducing „dependence” would have violated the basic pillar of the EU, free trade. Second, some Central European countries, in cooperation with transnational companies and other for-eign firms, have been rather successful in the last decade in developing medium- and high-tech production and service activities. Indeed, they could overcome the trap of becoming hostage of a low-wage specialization pattern. At the same time, it was not an accident that the crisis hit most severely the high-tech sectors, since in the crisis situ-ation demand in Western Europe fell above average in those areas in which acquisition plans could be delayed for the post-crisis period (computers, electronic goods, cars, some instruments, even durable household consumer goods). Demand elasticity in the above-mentioned areas was certainly higher than for products of basic needs (food, clothing, everyday household articles or utilities). Third, the sometimes manifest, some-times hidden conflict between foreign and domestic firms had been accompanying the entire transformation process in the last 20 years and was nothing new (but immediately discovered by populist politicians).
What can and should crisis-ridden countries do in order to minimize the negative impact of the crisis on their export sectors? The answer to the first question is not clos-ing down, which would not be possible without leaving the EU but (partial) reorienta-tion of exports towards other, dynamically developing markets, such as China and other Far Eastern economies, India, Russia, oil-rich Middle Eastern countries, Turkey, Latin America, etc. The second problem has to be addressed by further increasing the share of domestic value added in the total production costs of a given product or service. This can be achieved either by upgrading the production in the global value chain of a transnational company or by substituting imports by competitive domestic production (whether realized by foreign-owned or domestic capital-based companies). The narrow-ing of the gap between competitive transnational firms and (relatively) uncompetitive local enterprises needs more time, since historically developed differences cannot be eliminated overnight.
The crisis made it clear that export-led growth requires not only large and open markets and a relevant participation of foreign capital but also a clearcut and longer-term national export strategy. This should include the following tasks:
• providing support for firms looking for extra-EU markets,• cooperation with transnational companies producing in the respective Central and/
or Eastern European country and exporting to non-EU markets as well, as an integral part of their global or regional business strategy,
• supporting the technological and skill-based upgrading of domestic production in order to enhance the share of value added in overall output,
• creating favourable environment for three kinds of small- and medium-sized firms
10
(both domestic and foreign ones), namely for those able to export to different mar-kets (including EU markets), for those able to replace imports by domestic production as subcontractors to large transnational firms in competitive terms, and for those who could appear as price- and quality-competitive firms on the domestic market and „crowd out” other (foreign) sellers/suppliers. In all areas a better targeted distri-bution of financial transfers from the EU budget would be most welcome.
There is hardly any doubt that in order to achieve each of the above-mentioned goals one needs a comprehensive supporting (and certainly not „interventionist”) gov-ernment strategy.
Reality did not delay in striking back to populist critics. While GDP started to recover rather slowly (if at any rate) from the deep crisis in 2010 and 2011, foreign trade practi-cally jumped back to the pre-crisis level already in 2010 for many EU members, and for all of them, excepting Finland (Nokia effect) in 2011. The main message of Table 2 is that exports once again, and probably in an even more pronounced form, have regained their role as the key (or in several countries the only) engine of economic growth/re-covery. While in 2011 the aggregate GDP of the EU-27 still remained by almost 1 per cent below the 2008 figure, exports were already by more than 8 per cent higher than in 2008. Moreover, in 2011 seven member countries only could overcome the negative impacts of the crisis, as their GDP level above 100 per cent indicates, all member coun-tries (except for Finland) registered higher – and in some cases much higher – exports than in 2008. Interestingly, the highest export growth were produced by countries with large setbacks of GDP. The reasons are various. In the case of Bulgaria and Romania (the best performers in export dynamism) accession to the EU played a dominant role. Partic-ularly in their bilateral trade relations trade-creating effects of the integration cannot be ignored. A different explanation can be given for the astonishing increase of exports of Greece and Spain. Both countries facing a dramatic decline of domestic demand were forced to look for external markets in order to avoid massive closure of enterprises that would have further aggravated the anyhow critical level of unemployment in general, and of youth unemployment, in particular. For Greece, an economy uncompetitive in most segments practically since 1981, a large part of the „export boom” can be at-tributed to massive Chinese purchases of Greek agricultural products (overwhelmingly financed in the framework of the Common Agricultural Policy – an indirect subsidiza-tion of China by Brussels).
Statistical data of Table 3 go more in detail and identify the contribution of the in-tra- and the extra-EU market to the quick recovery of exports. It is evident that the main support came from rapidly growing extra-EU demand. In other words, the search for new markets, as mentioned earlier, became reality within a very short period, partly based on revealed comparative advantage of most member countries in global trade and partly due to the push effect of (rapidly) declining domestic demand as a result of the crisis and the crisis management (introduction of austerity measures curbing disposable income both in private and in public consumption).4 On the EU-27 level, intra-EU exports grew just
4 Additional demand-reducing factors could be in some countries higher savings in crisis times (including capital flight to „safe heavens”)and/or enhanced debt reduction/repayment efforts.
11
by 3 per cent between 2008 and 2011, while extra-EU exports revealed a growth by 17 per cent. Except three member countries plus one with similar growth rate for extra- and intra-EU exports, all of them registered higher or partly much higher dynamics of extra-EU than of intra-EU exports. The „gap of dynamics” spread from 3 percentage (Portugal) over the 10 to 30 percentage for most countries up to more than 80 per centage points in the case of Greece. In addition, five countries with falling intra-EU exports (Greece, Ire-land, Denmark, France and Italy) could more than counterbalance this negative impact by turning intensively towards extra-EU markets. Exceptions from the general rule were Bul-garia, Romania and Slovenia, while Polish exports reported the same dynamism in both main directions. Again, it is relatively easy to answer the Bulgarian and Romanian export development, as the consequence of trade creation in the first years of EU membership. The Slovenian case is more complicated, not only because intra-EU exports grew more rapidly but because extra-EU exports did not reach the level of 2008 (the only country ex-cept Finland). Most likely falling extra-EU exports have to do with declining competitive-ness in Western Balkan markets that were gradually opening up to each other and, more importantly, to the member countries of the EU (impact of the gradual implementation of free trade agreements).
As a result of increased orientation towards extra-EU markets, remarkable changes took place in the relation between intra- and extra-EU exports. The share of intra-EU export fell by more than 3 percentage points, with similar increase in the extra-EU share. The reorien-tation was particularly manifest for crisis-ridden Greece, Spain and Ireland. However, based on the dominant role in exports of Germany (and partly France, the United Kingdom and Italy), the shift can be interpreted as a proof of international competitiveness of leading EU members in extra-EU markets. In 2011, the intra-EU share of exports fell below 60 per cent for Germany and Italy, but also for other competitive countries, such as Sweden and Ireland. New member countries remained much more linked to the EU market, even if the same trend can be observed in most of them as well.
Still, it has to be emphasized that despite this geographic shift in exports, the EU market remains the most important (anchor) market for all member countries (even for Greece with a dramatic trade reorientation the sustainability of which, however, seems to be more than doubtful). Particularly new member countries are closely linked to the EU market (and intra-EU demand), all of them, except for Bulgaria, show an intra-EU share of more than 70 per cent in their total exports. The highest intra-EU orientation with more than 80 per cent can be identified in the case of the Czech Republic and Slovakia.
4. Bulgaria’s export performance in the European Union and a regional comparison
This chapter deals with key factors that determine (sustainable) export performance and international competitiveness related tohigher growth driven by export orientation. First, some relevant data of the Bulgarian foreign trade developments will be analysed on the basis of official Bulgarian statistics. The next four subchapters address different components of successful export orientation in different comparative frameworks, such as the EU-27, but more importantly, the new member states and the Western Balkan countries. In this context, attention will be paid to selected indicators of export-led growth, including the role
12
of geographic orientation and the commodity pattern of exports, as well as the impact of foreign direct investments on export performance. In order to present a comparative pic-ture, these chapters rely on international statistics.
4.1. Bulgaria’s trade development
Tables 4 and 5 contain basic data on Bulgaria’s exports and imports in the period be-tween 2007 and 2011. Here we can discover some favourable trends. First, despite the crisis that hit exports severely, the country’s exports – expressed in current lev terms – in-creased by 50 per cent in this period.Second, imports only rose by 7 per cent, so that the coverage of imports by exports could substantially be improved. Third, improving export competitiveness is supported by the spectacular rise of deliveries in some bilateral rela-tions. Table 4 includes the ten largest export markets of Bulgaria in 2011 and forwards some important messages. First of all, spectacular growth has characterized exports to Romania, a new EU member together with Bulgaria in 2007. In fact, the Romanian market became the second largest export market of Bulgaria just in 2011, ahead of such traditional markets as Italy, Greece or Turkey. Another encouraging development is the above average-growth of exports to Germany (the leading competitive member country of the EU), but also to Spain and France. In turn, exports to previously leading EU economies, such as Italy and Greece, indicated a much less than average growth certainly due to domestic problems and the Eurozone crisis. Less favourable have been the dynamism of exports to the new member countries, but particularly to the West-ern Balkans, Bulgaria’s geographic neighbourhood and a key area of potential export growth, as well as to Turkey, that revealed continuous dynamic development in the last years. Exports to Russia can be evaluated more positively, however, the small volume cannot (yet) be considered as a meaningful factor of overall export performance.
At first sight, much more moderate increase of imports resulting in substantially lower trade deficit could be assessed as positive development if growing export orientation would have been supported by rapidly increasing competitive domestic production of inputs for export-oriented sectors. However, imports from Germany that could be an indicator of pur-chasing machinery and different high-tech goods for improving the level of competitiveness of the Bulgarian economy in general and of exports in particular, did not reach the 2007 level in 2011. Import growth was due to unprecedented tripling of supplies from Spain just within one year, as well as the trade creation effect of Romania’s membership in the EU and Russian deliveries. Looking at the development level of these countries and their production and export structures, it is unlikely that import growth had supported the development of competitive exports. Therefore, the main pattern of imports developed in the last 15 years does not reveal a shift from consumer goods-dominated imports towards production- and export-supporting imports. Similar to Western Balkan countries, imports were driven by growing domestic (private) consumption fuelled by financial transfers of migrant workers and dramatically growing domestic credit volume generated mainly by foreign banks active in the country (Sanfey-Zeh, 2011). Capital inflows did not produced a qualitative shift from consumption-led to (competitive) investment-led imports. This issue will be dealt with in more detail in one of the next subchapters.
13
Higher import coverage by exports can be considered as an indicator of growing com-petitiveness, since it means that exports are more rapidly growing than imports. In this context, as Table 6 represents, Bulgaria can look back to some success, since the coverage ratio improved by almost 20 percentage points between 2007-2008 and the average of 2009-2011. Moreover, exports turned to be higher than imports in several cases (Romania, Greece) and showed a much higher surplus in the case of Spain. Taking into account the entire period between 2007 and 2011, Bulgaria could accumulate an impressive export surplus position vis-á-vis the Western Balkans, but also to Turkey and an overall higher than 100 per cent coverage with Romania, France, Greece and Italy. In addition, huge imbal-ances with the EU-27 in general, could be meaningfully reduced in trade with Germany and to a much lower extent, with the new member countries, while enormous trade deficit with Russia remained practically unchanged.
4.2. Selected indicators of export orientation
Several statistical approaches can be used in order to demonstrate the importance of exports (not necessarily export competitiveness!) of national economies. We have opted for EU com-parison in the following tables. Table 7 compares per capita GDP with per capita exports, a figure of export intensity of the given national economy. EU-27 per capita exports amounted in 2011 to 8.622 or 34 per cent of per capita GDP. Bulgaria has a very low value of per capita exports (Euro 2.525) only ahead of Greece, Romania and Cyprus. Per capita exports are more than ten times higher in Belgium, Luxembourg and the Netherlands, and theree to four times higher in the Central European new member countries of the EU plus Estonia. At the same time, vulnerability (dependence on exports) is much higher in Bulgaria than the EU average (53 per cent against 34 per cent), if per capita exports are divided by per capita GDP. Still, this „vulnerability” is even much higher in traditional export-oriented small countries of the EU and in the Central European new member states. If we compare Bulgaria with the Western Balkan countries, differences in per capita export figures become manifest. Although Bul-garia’s per capita export belongs to the lowest ones in the EU-27, it is still substantially higher than that of all Western Balkan countries, including Croatia (with a twice as high per capita GDP level as that of Bulgaria).
Trade openness is another factor characterizing export orientation, since it measures the share of total exports (and import) in the GDP of the respective country. Table 8 summarizes EU member country figures. All in all, 11 EU member countries reveal a trade openness (exports+imports/GDP) higher than 100 per cent, including not less than 8 (!) new member countries, led by Slovakia and followed by Estonia, Hungary and the Czech Republic. With its indicator of 113 per cent Bulgaria also belongs to this group. Based on these figures, Bulgaria’s trade openness is almost four times higher than that of Greece (the least opened economy) and more than twice higher than for Italy, France, United Kingdom, Spain, all „big economies” with important domestic markets as well as Cyprus. It has to be added that trade openness data are the result of the combined share of exports and imports in GDP. From the point of view of export orientation and international competitiveness, it is convenient to separate these two indicators. Namely, for many countries, imports used to be the key factor of „trade openness” and not exports. While Belgium, Slovakia, Hungary,
14
the Netherlands, the Czech Republic but – below the 100 per cent mark - also Germany, Sweden and Denmark reveal a higher than average export-induced trade openness, the above 100 figure for several other countries is due to import-driven openness (including Bulgaria, the Baltic countries, and, as extreme cases, Greece, Cyprus and Malta). This dis-crepancy is particularly characteristic of the Western Balkan countries (Josifidis et. al, 2012). Although their trade openness remains very much below 100 per cent and except Croatia even below the EU average of 69 per cent, openness is overwhelmingly the result of the share of imports in GDP and not that of exports. This clearly highlights an import-driven growth pattern, far away from export orientation and, even less, from international com-petitiveness of exports.
Table 9 contains a broader spectrum of figures, including into trade openness not only exports and imports of goods but also of services, a very important component of international exchange for several countries, including Bulgaria. A comparison among the new member countries (based on figures of 2010) points out that eight out of the ten new members (excluding Cyprus and Malta) have a higher than 100 per cent trade openness. Bulgaria ranks seventh, ahead of Romania, Poland and Latvia, but still at a meaningful distance from the most open economies such as Hungary, Estonia and Slo-vakia. At the same time, it has to be stressed that Bulgaria is the fourth largest service exporter (as a share of services in GDP) at the same level of Latvia and Hungary, and substantially surpassed by Estonia only. No doubt that the development of the service sector (not only tourism!) can become a pillar of export-led growth in Bulgaria during the next and even longer period. A comparison with the Western Balkan countries, very weak in exports of goods but somewhat better placed in exports of services, shows that all of them are still below the Bulgarian degree of openness (Macedonia only exceeds the 100 per cent mark).
Table 10 aims at finding answer to the role of exports as a driver of overall growth before, during and partly after the macroeconomic downturn of 2009. A comparison of the new member countries shows that GDP experienced a high annual growth between 2003 and 2007 (excluding Hungary) and with the negative growth rate for Estonia and Latvia continued even in 2008. In 2009 each new member country except Poland suf-fered an unprecedented decline, with double-digit shrinking GDP in the Baltic countries and slow and sluggish recovery in 2010. But how did exports perform? Between 2003 and 2008 exports proved to be engines of growth – they registered a double digit an-nual growth every year. As a result of the macroeconomic crisis exports collapesed everywhere in the region, but, surprisingly for some „experts”, rebounced in 2010 to the pre-crisis level everywhere except in Slovenia. The situation was somewhat similar in the Western Balkan countries. Interestingly, their lower level of trade openness (and „external vulnerability”) did not prevent them from a dramatic decline (much smaller volume) of exports. Moreover, despite export recovery in 2010, three of them (Croatia, Macedonia, Montenegro) could not yet reach the pre-crisis level of exports. Bulgaria’s performance fits into the general trend both concerning GDP and export growth. How-ever, export decline in 2009 was higher than in all other new member countries (exclud-ing two Baltic states). In turn, also export recovery in 2010 proved to be quicker than in all other new members (excluding Estonia). It means that Bulgarian exports were not
15
only vulnerable but also elastic to overall developments of market demand. Also, recov-ery was stronger than in any of the Western Balkan countries (except Albania with very a small export volume).
Another comparison of the new member states’ foreign trade dynamics concerning the overcoming of the crisis is provided in Table 11. Between 2009 and 2011 all countries pro-duced a very dynamic development of exports and imports. Estonia’s exports rose by 85 per cent followed by Bulgaria (73 per cent). Even the „worst” performer Slovenia reported an export growth by 33 per cent. Dynamics of exports and imports were close to each other in the Baltic countries and in all Central European economies. The surprising difference is Bulgaria, where a 73 per cent increase of exports was accompanied by 38 per cent of imports only (another, although smaller „gap” can be identified in Romania, with 55 per cent increase of exports against 41 per cent of growth of imports). Some Central European countries registered quicker recovery of imports than of exports (Czech Republic, Poland, Slovenia), Slovakia and Hungary reported higher export than import growth between 2009 and 2011. Despite the much higher export growth, Bulgaria accumulated a three-year trade deficit of 12 bn Euro (as compared to 38 bn of Poland and 29 bn of Romania). In contrast, the relatively most competitive economies, the Czech Republic and Hungary, produced an accumulated trade surplus of 18 and 16 bn Euro, respectively.
Different export and import growth figures did not induce significant changes in the relative position of the new member countries in their total trade. Poland, followed by the Czech Republic and Hungary remained the most important exporters and importers. However, Bulgaria could increase its share in the new member countries’ total exports from 3.2 to 3.9 per cent, a 0.7 percentage point increment, similar to that of Romania and of Lithuania. The growing share obviously reflects the improving position of Bulgarian exports in regional comparison. However, the initial and by 2011 achieved low level does not (yet) support any longer-term assumption of a sustainable export-led growth (See Table 12).
Some statistical figures are available for the contribution of different components (household consumption, gross fixed investments and exports) to overall growth rates between 2003 and 2007. Table 13 compares Bulgaria with the Czech Republic, Hun-gary and Romania. In all four countries exports proved to be the outstanding engine of growth. Between 2003 and 2008 also gross fixed investments grew very rapidly and even more dynamically than exports in Bulgaria and Romania. In addition, in contrast to the Czech Republic and Hungary, household consumption was a relevant pillar of overall growth in Bulgaria and Romania. This highlights the difference between export-driven growth in the Czech Republic and Hungary and the more import-driven growth in Bulgaria and Romania. In 2009 all key components of the GDP shrank, with the big-gest fall of exports in three countries and the even bigger downturn of investments in Romania. Finally, in 2010, exports became the only growth factor in three coun-tries, while the Czech Republic only could report a very modest recovery (better to say stagnation) of consumption and investments. Unfortunately, gross fixed investments, a potential source of future export-led growth suffered the highest setback in Bulgaria, followed by Hungary and Romania.
A further and more telling indicator of export competitiveness is the coverage of im-ports by exports. It is generally supposed that countries with trade surplus used to be
16
more competitive than countries with trade deficit (provided that exports do not come from energy, minerals or diamonds but from manufactured goods). This should be even more the case in free trade zones, where more competitive members used to be believed the major winners of free circulation of commodities (and services), while less competi-tive members benefit less from the advantages of free trade. Corresponding figures have been gathered in Table 14. The main messages are the following. First, all new member countries could improve their respective indicators between the average of 2003 to 2007 and 2011. Second, the crisis produced a positive jump in case of Bulgaria (probably due to the dramatic decline of imports but also of rapidly growing exports in 2010 and 2011). Third, three Central European countries reveal a higher than 100 per cent coverage ratio, led by Hungary and followed by the Czech Republic and Slovakia. No question that these figures support the hypothesis of stable competitiveness of exports in all three countries. All other new members used to import more than they were able to export. This can be explained by their relative lack of competitiveness, but in a more positive approach, it can also be evaluated as a preparation for export-led growth by importing necessary ma-chinery and other inputs for sustainable export orientation (here, a deeper analysis of the commodity structure of imports would be needed). Fourth, probably most interestingly for Bulgaria, while the macroeconomic crisis exerted a positive impact on the coverage ratio (mainly through drastically shrinking imports) in all countries of the group, further improvement was partly interrupted between 2009 and 2011. In this context, Bulgaria is the clear exception where the coverage ratio kept on rapidly improving – a potential sign of improving international competitiveness (although, as mentioned above, a careful analysis of the commodity structure of exports cannot be ignored – see later). Romania and Estonia were following the Bulgarian process, while Latvia, Lithuania, Poland and Slovenia could not improve their coverage ratio further. The gap between the less than 100 per cent coverage ratio of the new member countries and the same indicator of the Western Balkan countries is more than evident. All of the latter suffer of high degree of lack of competitiveness.
Finally, the current account position of national economies has to be taken into con-sideration when assessing international competitiveness of selected countries. Certainly, trade surplus or deficit used to be the most important item of the current account balance. However, also other factors (in many cases most importantly the balance of services) shape the current account situation. According to Table 15 containing figures for 2000, 2005 and 2010, all new member countries had partly substantial current account deficits over the en-tire period. Partly as a result of the crisis, and austerity measures introduced as an instrument to manage the costs of the macroeconomic crisis some countries reported positive current account balances in 2010 (Hungary and the three most crisis-ridden Baltic economies). While current account deficits were already high in 2000, in several new member countries they kept on rising until the crisis. Then, a crucial turnaround took place that – with the exception of the Czech Republic and Poland – led to a very rapid reduction of this deficit, with the most outstanding results in Bulgaria. As many other economic developments, this can be interpreted in a positive way of consolidating the financial situation of the country. However, a negative articulation cannot be ruled out either, namely that the introduction of austerity measures may strangulate growth and – in case of an export-led development pat-
17
tern – either undermine the sustainability of this pattern, or create a growing gap between the exporting sectors and other parts of the given economy. Again, a comparison with the Western Balkan countries makes the qualitative difference to the new member countries manifest (with the exception of Croatia and Macedonia).
4.3. Geographic orientation of exports
Successful and sustainable export-led growth cannot ignore the favourable geographic ori-entation of exports. At least the impact of three factors has to be observed: the size of the leading export market(s), the dynamism of demand in key (and emerging) economies and the development level of the most important export markets that can be reflected in the commodity structure of the exporting country.
In this context, two tables illustrate the situation of Bulgarian exports. Table 16 sum-marizes the share of the most important export markets and import sources of the Bulgarian economy. Between 2007 and 2011 exports show some shift towards the EU, mainly driven by exports to Romania and partly to Germany. The share of other major EU markets was either declining (Italy, Greece, Belgium) or stagnating. Similarly, the share of Bulgarian exports to the new member countries as well as to the Western Balkan region was falling. At first sight, contradictory conclusions can be drawn from this picture. On the one hand, a growing share of Germany may hint to a growing orientation to (one of) the most competitive and largest EU markets. Another positive sign is the rapidly grow-ing share of Romania in total exports that may be the result of growing competitiveness and an important factor of export-led growth after the accession of both countries to the EU in 2007. In fact, Bulgaria was able to successfully use the trade-creating effects of free trade with its Northern neighbour. On the other hand, less positive is the loss of previous market shares in the new member countries and in the Western Balkans, both traditional markets of Bulgarian products. Turkey’s case is more controversial, because the recovery between 2009 and 2011 could only partially offset the dramatic decline of the share of the Turkish market for Bulgarian exports between 2007 and 2009. Most probably part of the goods previously exported to Turkey has been redirected to the Romanian market. The growing share of Russia, Ukraine and China in total exports may be an encouraging sign of export diversification and enhanced competitiveness. How-ever, the very low figures do not allow such a conclusion at the moment. In fact, a 1.3 percentage point increase of the share of the three markets between 2007 and 2011 is lower than the loss of cumulative share in the new member countries and in the Western Balkan region (3.3 percentage points).
More insight can be obtained from the comparison of the geographic orientation of exports of selected new member countries (Table 17). First, it is evident that Bulgaria has the lowest EU orientation. Second, and more importantly, the share of the German market (considered to be the largest, most competitive and demanding market in the EU) in Bulgar-ia’s total exports is less than half of the share represented by Hungary, Poland, let alone the Czech Republic. Third, the share of the new member countries is one of the lowest in Bul-garia (except Romania) which hints to regional competitiveness problems (in turn, despite its declining share Bulgaria still has the highest relative export representation in the Western
18
Balkan countries, mainly due to high exports to Macedonia and Serbia). Two factors of geographic orientation of exports can be mentioned as signs of potential weakness: the lack of geographic concentration on a leading („anchor”) economy or economies resulting in a rather disperse structure, as well as the low level of focusing on the most competitive import markets.5 These features are closely linked with the level and quality (structure, mar-ket orientation and depth) of cooperation with international capital in general, and with selected transnational corporations, in particular.
4.4. Commodity pattern of exports and imports
Bulgaria, similar to other EU member countries (not only those of Central and Eastern Eu-rope) does not dispose of large quantities of oil, gas or other natural resources to be export-ed. Therefore, key to export-led growth and sustainable competitiveness are manufactured products in general, and medium- and high-tech goods in particular.
After the systemic transformation, foreign trade of all new EU member countries was faced with a double challenge: geographic reorientation of exports from the ex-Soviet (and partly ex-CMEA) markets to other, mainly Western European markets, and the development of a production and export pattern delivering competitive goods for the new markets. In the first years, the comparative advantage was obviously focused on wage differences in labour-intensive sectors. However, already in the second half of the nineties this pattern started to change at least in Central European economies that could upgrade their production and became competitive in selected areas of gen-eral and electrical machinery and car manufacturing (wage advantage of partly highly skilled labour). In the third stage, some new members of the EU were even able to attract research and development-intensive production and service activities, includ-ing regional or European R&D centres (based on the highest wage difference between Western Europe and the Central European economies, but with the same level of in-novative capacities).
Probably the most important component of sustainable export-led growth consists in the commodity pattern of exports in general, and in the capacity of continuously upgrad-ing the export structure, in particular. Despite the high degree of vulnerability during the macroeconomic crisis due to an above-average decline of demand in leading markets, medium- and high-tech exports remain the main drivers of sustainable exports. Such prod-ucts can overwhelmingly be found in different sectors of machinery production, electrical household articles, electronic devices and computers, optical and measuring instruments, cars and parts of cars based on constantly developing technologies. Also products of the pharmaceutical industry, special chemicals or in fashion-driven light industries (clothing, shoes) belong to this group. Moreover, any general classification of commodities and ser-vices according to „high-tech” or „low-tech” levels, is misleading. First, several segments of traditional material- and labour-intensive sectors include high-tech products (see the fashion industry). Second, small countries with a very low share in international trade can
5 Some experts see an obstacle of successful export orientation and enhanced competitiveness in the low level ofgeographic diversification of the Bulgarian exports. See in detail: Zhelev-Tzanov (2012).
19
always discover and specialize on „market niches” that can become – sometimes surpris-ingly – relevant engines of export-led growth.
Table 18 illustrates the commodity pattern of Bulgarian exports in a regional comparison, based on one-digit SITC classification across one decade. Manufactured products include chemicals (SITC 5), miscellaneous manufactured goods (SITC 6+8) and machinery and trans-port equipment (SITC 7). Obviously, this rough breakdown does not allow to look at the „fine structure” of exports, but still makes possible some general observations.
First, manufactured goods (SITC 5 to 8) represented about two-thirds of the Bulgarian exports in 2000 and a bit less in 2010. The share of primary products was increasing in all sectors (food and beverages, crude materials and energy) from 27 to 36 per cent in one decade. Considering the factor endowment of the Bulgarian economy, this is hardly the right direction of export specialization. The other new member countries can be divided into four groups. The most natural resource-intensive export structure, even higher than in Bulgaria, can be found in Latvia (almost half of total export sin 2010) and Lithuania (45 per cent). The second group consists of Estonia (33 per cent) of resource-intensive commodities similar to that of Bulgaria. The third group includes Poland and Romania with higher than 15 per cent, while the „most developed” structure, with around 10 per cent share can be identified in the Central European member countries. Similarly, the share of manufactured products shows the inverse ranking.
Second, since the largest share of global trade is concentrated on machinery and transport equipment, it is important to investigate this issue in the new member coun-tries, particularly as compared to the share in total exports of miscellaneous manufactured goods. The latter were the key export product group for Bulgaria but also for the three Baltic countries. In other new members’ exports machinery and transport equipment has occupied the first place either from the very beginning of the last decade (Czech Republic, Hungary, Slovakia) or as a result of inter-sectoral shifts from miscellaneous manufactured products towards machinery and transport equipment in the last decade (already before 2005 in Poland and between 2005 and 2010 in Slovenia and Romania).
Third, the share of machinery and transport equipment in total exports is an important feature of export-led growth. In Bulgaria’s exports this product group represents one-sixth of total exports (less than 17 per cent), the lowest share in the whole group. In contrast, more than 60 per cent of total exports are represented by machinery and transport equipment in Hungary, and more than 50 per cent in the Czech Republic and Slovakia.
Fourth, changes in the relative share of machinery and transport equipment over one decade (from 2000 to 2010) deserve attention. There was a very strong upgrading (shift towards these products) in Romania, particularly in the last five years (an increment of more than 23 percentage points), but also in Slovakia (15 percentage points) and the Czech Re-public (10 percentage points). Contrary developments took place in Estonia and no change can be seen in Lithuania. During the same decade, Bulgaria registered an increase of the share of machinery in total exports from less than 10 to a bit less than 17 per cent (an incre-ment of 7 percentage points).
Fifth, the process of industrial upgrading influencing export-orientedness can proba-bly be best followed in the interaction between the share of miscellaneous manufactured goods and machinery products. The share of the former (to a large extent containing low
20
wage and low skill labour-intensive commodities) was everywhere declining while the share of machinery was increasing (except Estonia). Still, miscellaneous manufactured products are still either the leading one-digit export sector or represent about one third of total ex-ports (in Hungary only the share is below 20 per cent).
A comparison with the commodity pattern of export by the Western Balkan coun-tries, the „structural gap” is more than evident. Croatia reports a share of higher than 30 per cent of machinery exports in total exports. In some other countries, this figure is less than 10 per cent (Albania, Macedonia, Montenegro). Taking into ac-count the overall very low level of exports, machinery exports are nearly non-existent. Moreover, the share of machinery exports was declining (further despecialization) in some Western Balkan countries such as Albania, Bosnia-Herzegovina and Macedonia. Everywhere, the lion’s share of exports was accounted for by miscellaneous manufac-tured goods, predominantly light industry products and/or semi-manufactured met-als. (In detail see Table 19.)
Export-led growth in less developed (catching-up) and structurally upgrading coun-tries used to be narrowly linked to the imports of machinery and other medium- and high-tech inputs used by export-oriented sectors. Thus, the share of imports of such goods may provide some orientation concerning the depth and sustainability of the export-oriented development path. Table 20 indicates the share of miscellaneous manu-factured goods and that of machinery and transport equipment in total imports of the new member countries.6 Again Hungary is the country with the highest share of machinery in total imports (just 50 per cent), followed by the Czech Republic and Slo-vakia. Since these countries represent the highest share of machinery in their respective exports as well, an obvious interaction between machinery imports and exports can be stated. In Bulgaria’s total imports machinery accounted for 23 per cent in 2010, similar to the figures for Latvia and Lithuania. However, it is more regrettable that the share of machinery imports was significantly declining between 2005 and 2010 (from 31 to 23 per cent). Such adverse developments occurred in all three Baltic countries as well. This negative trend is certainly not fostering export orientation in the sector of machinery and, even less, successful structural upgrading in other sectors producing for exports. The share of miscellaneous manufactured goods was declining in all new member countries, partly (or largely) due to the declining domestic demand for indus-trial consumer goods.
For another comparison with the Western Balkan countries: in all of them (except Mace-donia and Montenegro) the share of machinery in total imports was drastically declining and, therefore, reinforcing the justified doubts of these countries about being able to start an export-led economic strategy in the medium term.
Successful structural upgrading towards higher-technology and, not less importantly, higher domestic value-added production requires a number of additional factors, not just imports of machinery and technology, such as supportive economic policy and institutional
6 The limited size of this paper did not allow to dip deeper into the „fine structure” of imports of miscellaneous manufactured goods. Evidently, some of them represent medium- or high technology and serve as indispensable inputs into competitive export-oriented production.
21
stability, innovative enterprises (and society!), higher expenditure into demand-adequate education, increasing research and development spending, etc.7 Furthermore, all experts agree that volume, structure and market orientation of international (foreign) direct capital inflows into less developed countries in general, and into the new member countries of the EU, in particular, have played a decisive role in the (different level and structure of) export orientation during the last two decades.
4.5. The role of foreign investments in export orientation
Based on theoretical assumptions and practical experience, foreign direct investment flows are explained by three pull factors of potential host countries: availability of natural re-sources, new markets and production factors ensuring higher efficiency (and profits plus advantages in global and regional competition). With a few and partial exceptions, transi-tion countries do not offer any attraction for investments into natural resources. However, their attractiveness as new markets to be conquered and as hosts of numerous efficiency factors became manifest from the very beginning of the systemic transformation. Both at-tractive elements need some specification.
First, markets can be interpreted in different terms. In fact, the domestic market of the individual Central, Eastern and Southeastern European countries is rather small (except in Poland). In addition, for a potential investor, market size is not defined by the number of population but by the aggregate purchasing power (disposable income) of people. A special category is represented by protected domestic markets of so-called „strategic production or supply” (utilities, such as production and distribution of energy, water supply, other public services, part of banking and finance, etc.). Presence of foreign capital in these areas offers a small but protected market with high return. In addition, international capital used to look beyond the boundaries of national markets, particularly if the given economy is part of a larger free trade, customs union or advanced integration bloc. In this case, the total size and dynamics of the integrated market (or part of it, namely a region within the integrated market) plays a crucial role in taking the decision in favour (or against) investing. Moreover, transnational companies used to justify their market-based investment decisions on the development of global markets belonging to their international network of activities. Of course, national markets belonging to a free trade area may enjoy additional benefits, but global market developments (size, growth of demand, structure of demand, etc.) can either be of more important consideration or both can mutually strengthen each other when tak-ing the appropriate investment decision.
Second, potential host countries can offer a large variety of advantages. The most fre-quent factor is, of course, low labour costs. However, the right starting point is not low la-bour costs but internationally competitive unit labour costs that take into account not only the level of wage but also the productivity of labour.8 In addition, international capital is not so much interested in the wage level but in the difference between the wage level in a
7 For a detailed survey see Zhelev – Tzanov (2012).8 If the absolute level of wages were the main motivation of international direct capital flows, the ovewhelming majority of international investments would have taken place in Subsaharan Africa or Bangladesh.
22
potential host country and at home. Just as the changing (upgrading) foreign capital behav-iour in Central and Eastern Europen has proved, international investors were attracted into some countries in the skilled and highly-skilled labour segment, because the wage differ-ences between Western European and Central-Eastern European computer engineers and innovative professionalism were (much) higher than the wage level between an unskilled or semi-skilled worker employed, for instance, in a labour-intensive, low-skill light industry factory. Furthermore, investment decisions are based on a number of additional quantita-tives (taxes, price of energy and other utilities, rental costs, availability of adequate services, etc.) and qualitative factors (behaviour and effectiveness of the public administration, role of trade unions, impact of labour laws, general attitude of the society towards foreign in-vestors and owners, etc.).
Foreign direct investments in the new member countries and particularly in the Western Balkan countries reveal some substantial differences. They can be attributed to the size of the market, the quality of available labour but, even more importantly, to the timing of attracting international capital, the overall economic policy of the host governments (e.g. privatization processes and the environment of green-field investments) and the inherited structural and ideological features (barriers) that definitely influenced the shaping of the host goverment’s general policy and attitude towards potential foreign investors/invest-ments. In all categories, there is a clear cleavage between investments in selected Central European countries and in the Western Balkans (not only because of a decade of delayed opportunities). In a broad approach, Bulgaria, Romania (and partly Slovenia) can be con-sidered as intermediate examples between Central Europe and the Western Balkans. (For a more detailed survey see Inotai, 2011).
Stock data of foreign direct investment into the individual countries of the region are contained in Table 21. Based on 2011 figures, Poland, the Czech Republic and Hungary have attracted almost two-thirds of total foreign capital stock in the new member coun-tries. The total stock of the six Western Balkan countries amounts to the level of foreign capital stock in Romania alone. Bulgarian figures indicate 7.7 per cent of total capital stock in the new member countries, but 50 per cent more than foreign capital invested in the economy of Croatia, the leading capital importer of the Western Balkans. Foreign capital stock per head introduces some further modifications of the general picture. In this context, the leading new member country is Estonia closely followed by the Czech Republic. The corresponding Croatian figure is a bit more than half of that for Estonia, but about 8 per cent higher than that of Bulgaria. Bulgaria’s FDI stock per head figure is higher than the same indicator for Romania, Poland, Latvia and Lithuania. Foreign capital stock in the GDP of the individual countries is rather high. In this respect, Bulgaria is the leading new member country, with 96 per cent of GDP share of FDI stock, followed by Estonia, Hungary and the Czech Republic. While Montenegro is a clear exception, due to special reasons, the role of foreign capital in the Western Balkan countries as expressed in GDP terms is similar to that in several new member countries. However, and this makes a big differences, the overall volume is much lower due to the lower level of GDP.
Foreign direct investments play an important role in total fixed capital formation (invest-ment activities) of the host countries. In the period between 2007 and 2011 their average share fluctuated from country to country between 10 and 25 per cent (except for Bulgaria
23
in 2007 and 2008 with more than 100 and more than half of total fixed capital formation, respectively). From the point of view of export orientation, it is an open question how much investment is directed into export-oriented production and service activities and how much is dedicated to fostering positions on the domestic market (see Table 22).
The financial and macroeconomic crisis had a significant impact on the annual inflow of foreign capital in all countries of the region. Table 23 indicates the partly severe drop in inflow in 2009 and 2010 (some countries, as Slovakia and Slovenia, reported net capital outflows). Even in 2011, despite some recovery, the return of foreign investors did not hap-pen as compared to the boom years until the crisis. In 2008, Bulgaria ranked third among the new member countries attracting foreign capital (after Poland and Romania only), but the inflow declined by two-third in 2009 and halved again in 2010. Even bigger was the decline in Romania (a new star of FDI after EU accession) and Croatia, practically the only meaningful host country for FDI in the Western Balkans.
Since FDI, together with free access to the EU market, had been representing one of the major external sources of sustainable growth (and potential export orientation) for the new member countries over more than a decade, its dramatic drop during and even after the cri-sis year of 2009 raised several new questions concerning the sustainability of previous high growth rates, ongoing structural modernization and both continuing or – in some countries – turning to export-oriented strategies. It has to be stated that FDI had been largely support-ing export-oriented development in some Central European countries, first already at the mid-nineties in Hungary, followed by the Czech Republic (after the failed attempt of mass privatization) and with some delay but very vigorously by Slovakia. Poland did not open up quickly to foreign capital and, due to the large size of the market, most FDI were market- and not efficiency-oriented. Slovenia followed a cautious way of attracting massive FDI, due to the Yugoslav tradition and concerns about the dominant role of FDI in a small country of 2 million but also based on the (increasingly erroneous) conviction of being the most developed and competitive economy among the new member countries.9 Massive FDI inflow in the second wave of transformation, again combined with the prospect of EU membership, could be experienced in the last decade (before the crisis) in Bulgaaria and Romania (partly also in Poland). Also spectacular increase of FDI has been reported from several Western Balkan countries after signing the Stability Pact in 1999. However, the otherwise encouraging figures hide the structure of investments. While Hungary and the Czech Republic (later Slovakia) could attract FDI being from the very beginning export-oriented, the same or similar amounts of FDI inflow into the late(r) comers were concentrated on other sectors, with a predominant motivation of conquering key sectors of the domestic market (banking and finance, real es-tate, public utilities).
This basic difference of export vs. domestic market-orientation can be explained by various factors. First, the first-comers advantage has to be mentioned. Central European countries that were the pioneers of transformation and opened up their markets and pro-duction structures to the international players (certainly not without some drawbacks and
9 This „conviction” could be maintained for one decade. However, past advantages have been eroded by global competition (mainly China) and competition coming from the less developed new member countries of the EU. The erosion can already be seen in Slovenia’s traditional „backyard”, the Western Balkan markets.
24
short- and longer-term risks) from the very beginning of transformation, could benefit from the first wave of „eager investors”. Second, both for geographic, economic and cultural considerations, Central Europe had been quickly accepted as an organic part of the newly uniting Europe. Third, relative political and economic stability made foreign (and domes-tic) investments and business prospects calculable. Fourth, and not least, export-oriented activities developed in Central Europe, at least in the first decade of transformation, have been focusing on the markets of the neighbouring countries. In consequence, little room remained for foreign capital flowing into the second-wave countries for developing export-oriented activities in a market that, some years earlier, had already been taken by foreign investors, and many times by the same ones investing now in Bulgaria, Romania or the Western Balkan countries. Any real chance for counteracting this original „crowding-out” impact lies either in finding new niches and/or being able to convince foreign investors with deeply-rooted networks in the Central European new member countries of the EU to relocate their current production to Bulgaria, Romania (or the Western Balkans). Although there have been some signs of such relocation activities in the last years, they remained limited in size and very much behind the previous expectations of the most recent EU members. Moreover, if some relocation happened, it was the result of splitting the current production in a Central European country into two parts and relocating the less skill - and more labour-intensive part of the production and, at the same time, helping the structural upgrading process in the „old” production site.
The sectoral composition of FDI provides more information about export-led vs. do-mestic market-oriented motivation of foreign capital. While some economic sectors, due to their basic character, are domestic market-oriented (construction, trade, trans-port and communication, financial services, real estate), although they can develop international networks as well (transport, finances), the main indicator of potential export orientation is investments into manufacturing. Of course, even this activity can be domestic market-based, but this indicator can be used as a proxy to the degree of export-led investments and production. Tables 24 and 25 offer the corresponding data. FDI in manufacturing has been clearly concentrated on Poland, the Czech Republic, Hungary, Slovakia, and interestingly, on Romania in the last period. Investment stock into manufacturing in Bulgaria amount to about Euro 6 bn, ahead of Croatia and of the Baltic countries, and also of Slovenia. However, the Bulgarian figure is about half of that of Slovakia and a bit more than one-third of the manufacturing investment stock in Romania (the per capita figures would be more favourable for Bulgaria). More impor-tantly, 25 to 35 per cent of total FDI stock is represented by manufacturing in several new member countries. In contrast, the corresponding figure for Bulgaria is 17 per cent, similar to that of Estonia and Slovenia (both important service exporters). The Western Balkan figures can hardly be used for comparison, since the overall stock of FDI is much lower (except for Croatia). Investment into the manufacturing represents the largest FDI stock in sectoral comparison in several new member countries. In contrast, FDI stock in Bulgaria is higher in finance and particularly real estate than investment stock in manu-facturing, a pattern similar to Estonia, Latvia and Slovenia among the new members, and to Albania and Croatia (plus certainly Montenegro without adequate statistics) in the Western Balkan region.
25
Furthermore, it has to be stressed that focusing on manufacturing does not directly imply export-orientedforeign investments. Even less does it determine the technology level and the domestic added value of such activities. The structural composition of FDI into the manufacturing sector may be helpful in this context. Table 26 offers relevant figures for selected countries. Unfortunately, data on Bulgaria were not available. FDI in the machinery and transport equipment sectors (both, for definition, highly export-oriented) reach 40 to 45 per cent of total investment into this sector for the Czech Republic, Slovakia and Hun-gary. In contrast, only 20 to 25 per cent of such investments can be registered for Poland, Estonia and Romania (and even much less for Latvia and Lithuania). Also, the corresponding figures for the Western Balkan countries are below the 10 per cent level. It has to be added that FDI in other industries (particularly in selected subsectors of textile, clothing and shoes) can also generate export-led growth but on a different structural, technological and value-added level, with different (mainly non-existent) spill-over effects for other sectors, let alone for a sustainable export-driven growth path of the given economy.
Finally, the geographic origin of foreign investments is supposed to influence both ex-port-oriented activities in general and the structure and tecnology-intensity of relocated production and service functions, in particular.10 Table 27 summarizes the ten largest in-vestors (based on stock data) in the new member countries of the EU. Comparison of the concentration degree of the first three and the first ten investors shows that Bulgaria has a medium-level concentration. Most Central European countries, such as the Czech Repub-lic, Hungary, Slovakia and Slovenia but also Romania (let alone Estonia) have a higher than 50 per cent share of the three largest investors. Bulgaria’s figure of 44 per cent is similar to that of Poland. Taking the ten largest investors, most new member countries indicate a higher concentration degree (above 80 per cent), and Bulgaria is ahead of two Baltic coun-tries only. More dispersed (less concentrated) geographic origin of leading investors may be judged positively (differentiated structure) but also negatively (lack of focus on strategic investors). The leading investor country in several new members attracting the lion’s share of foreign investments is the Netherlands (in Bulgaria as well). Hungary (with Germany being the main investor) and Slovenia (Austrian dominance) are the two exceptions. This data does not help clarifiy the picture, because foreign investments statistically registered in the Netherlands obviously cover investments from many other countries. More important seems to be direct presence of Germany in total foreign investments, since it is supposed that first of all German investments can be connected with the establishment of export-oriented companies in the new member countries. This figure is rather low in Bulgaria and does not indicate a high export-intensity of German firms in this country. In addition, inves-tors from Greece, Cyprus, Hungary or Russia are unlikely to belong to the supporters of export-led orientation. Either this money has nothing to do with the manufacturing sector or, if it does, production is mainly or exclusively for the domestic market. Evidently, there is no direct correlation between the origin of foreign investments and export-led pattern of development, but some degree of interdependence can be hypothetically established. For more convincing arguments an in-depth analysis would be necessary.
10 For a comparison between Bulgaria+Romania and the Western Balkan countries (plus Greece) see Paul(Vass) – Alexe (2012).
26
5. Concluding remarks and policy recommendations
In the last five years Bulgaria has made clear progress in shifting its economic policy from domestic demand-led to export-led growth. Despite – or even more as a pressure coming from – the crisis, export orientation became more manifest, particularly in the geographic orientation to Romania, another new EU member country, and, to a smaller extent, to Germany, the most competitive economy of the EU. Less progress could be registered in shifting production structure towards higher-technology goods (and ser-vices) and getting gradually rid of the structural trap of „low-wage and low-skilled la-bour intensive” production for exports. Despite the still observable structural weakness and the decade-long delay of restructuring in the 1990s, the next years seem to offer both chances and pressures to launch an export-led expansion of the economy. Due to the small size of the economy, even a sluggish or slowly recovering European environ-ment offers new chances for a catching-up country. Obviously, the necessary steps have to be made at home and they should be concentrated on two areas. First, the attractive capacity of the economy has to be constantly improved in a period of globally intensi-fied competition for markets, capital, technology, skilled labour, high-level services, credits serving future-oriented developments, strategic alliances, etc. Second, new ways and means of getting incorporated into the ever deeper international division of labour in general, and into the global network of transnational companies, in particular, have to be identified and efficiently used.
Attractive capacity-building includes:• improving the general economic environment (the “doing business in Bulgaria” indi-
cators) by further eliminating different economic and institutional barriers,• creating synergy between the structure of higher education and business (labour
market) demand for skilled workers,• improve the quality of education starting from the primary school (a long-term in-
vestment that would bring results in about 15 to 20 years),• ensure more resources for target-oriented and future-oriented research (both in nat-
ural, biological and, not least, in social sciences),• invest into the qualitative upgrading of physical infrastructure as a main channel for
having better and less costly access to neighbouring markets and, at the same time, indirectly attract the attention of international investors interested in the larger re-gional market,
• create a National Competitiveness Council, similar to that established in Romania in October 2011 (see Paul (Vass) – Alexe, 2012), in order to determine the priorities of the medium- and longer-term export-oriented growth path of Bulgaria.
The medium-term development strategy based on export-led and sustainable growth has to place into the limelight the following issues:
• which are the sectoral priorities of export-led growth,11
11 A study prepared by A.T.Kearney stresses opportunities in transport equipment and machine building, chemicals and plastics, food and agriculture, logistics, IT and outsourcing, as well as healthcare services, pharmaceutical production , some sectors of biotechnology and environmental technologies (A.T.Kearney, 2011).
27
• which countries and/or regions have to be considered as the driving demand markets for commodities and services produced in Bulgaria (EU markets in a differentiated approach, unused opportunities in new member countries, more attention to the Western Balkans and special attention to rapidly developing Turkey, as well as emerg-ing markets, mainly China, the Far East and Russia),
• how can export-led pattern be combined with the attraction of foreign direct in-vestments, both regarding the desired structure of production and exports and of geographic orientation of deliveries (here, attention should focus on trade-capital flows relations with China, Russia, Turkey and, to a lesser degree, with some other emerging economies, as well as the deepening of long-term contacts with globally acting transnational firms),
• leaving some room for discovering of and benefitting from emerging „niche mar-kets” in different countries at different times.
The export-led strategy could be supported, among others, by the following in-struments:
• partial geographic reorientation of trade (and capital import) relations both with-in the EU (towards more dynamic and competitive partners plus the new member countries) and in the extra-EU space,
• clear preference given to preferred sectors (see a list above), without violating EU competition rules and by avoiding distorting intervention into the business develop-ment by the Government,
• carefully analysing the possibilities of export-oriented import substitution, which means that a growing part of imported inputs used in export-oriented production would be produced in Bulgaria by domestic or foreign-owned (mainly small- and medium-sized) companies, of course, strictly based on the principle of same quality and more competitive price or same price but better quality, or, in the optimal case, higher quality combined with more competitive price and other delivery conditions,
• supporting the export-led growth of small- and medium-sized firms in three dif-ferent ways: getting them incorporated – as subsidiaries - into the production and service network of transnational companies working in Bulgaria for exports, becoming autonomous and direct exporters of different goods and services (at the beginning, mostly to neighbouring markets, such as Romania, Western Bal-kans, some new member countries, but probabaly also Greece, Turkey and the Ukraine), and, finally, developing competitive strength to challenge the position of foreign companies present in selected sectors of the Bulgarian consumer (or investment) market (with special reference to the food and other basic consumer goods sectors),
• creating the capacity of Bulgarian production units owned /controlled by trans-national companies for structural upgrading within the given sector (from tex-tiles to machinery). The success of these efforts certainly needs close coopera-tion with the transnational companies but also with the constantly improving business environment in the country and the close following of international business developments influencing the global position and business outlook of the respective companies,
28
• structural upgrading that generally means higher level of technology incorporated into the production, employment of higher-skilled workers and higher domestic val-ue added, at a given stage, should focus on strategic cluster-building with significant synergy and spill-over effects to various sectors and areas of the economy,
• efficient cooperation with export-oriented transnational companies requires con-tinuous efforts of network-building both on the level of production cooperation and on the level of the government and its high(est)-ranking economic policy rep-resentatives,
• finally, all opportunities have to be carefully identified, how EU transfers could be used in a most efficient way for supporting export-led growth, including the export orienta-tion of small- and medium-sized companies and structural upgrading of production and/or service activities of foreign-owned enterprises located in Bulgaria.
A realistic and viable strategy has to keep in mind that its implementation is not free not only from barriers indicated above but also from some dilemmas and potential risks that may accompany and jeopardize even the most successful process. Here, only some of them will be shortly mentioned:
• - First: delayed catching-up process of Bulgaria after the systemic change has dete-riorated the initial position of the country. In fact, it created a double catching-up objective: first to the EU and second to the more developed and earlier started new member states. Therefore, conditions for successful export-led growth have been less favourable than for the Central European countries, both regarding the attrac-tion of export-oriented transnational companies and concerning the available profit-able size of potential markets. At the same time, global and regional restructuring taking place in the post(?)-crisis period and characterized by depressed domestic de-mand and a growing pressure for exports (and, in the best case, for export-oriented investments) can be supportive for launching such a strategy.
• - Second: Bulgaria started its export-oriented growth in the low-cost category. It is not easy to get out of this „hostage situation”. On the one hand, growing inter-national (mainly non-European) competition in these sectors is pressing/pushing Bulgaria out of this trap. On the other hand, successful upgrading is only possible if the economic policy can create a favourable environment for upgrading and in-ternational capital will consider Bulgaria as a valuable partner on a higher stage of its global production chain.
• - Third: any structural upgrading has two – and controversial – impacts on the la-bour market. First, it increases demand for higher-skilled (and better paid) labour, provided it is available on the domestic market. If not, the chances for upgrading may be rather limited. Second, it gets rid of unskilled or not adequately skilled labour and increases the number of unemployed persons. The double task of a convenient economic policy consists in making available the volume of adequately skilled labour in the respective sector/activity and, at the same time, provides new employment op-portunities for the labour set free by upgrading in order to avoid social problems and growing marginalization of „upgrading-hit” people.
• - Fourth: Bulgaria’s currency board created in 1997 and the main guarantor of finan-cial stability and international confidence up to the present (and probably also in the
29
next years) constrains the manouevring room of the economy because competitive-ness, even a short-lived one, can be generated by devaluing the national currency. As a result, structural upgrading is only possible if the country’s competitive position is improved as a result of higher productivity (not increasing unit labour costs as com-pared to real or potential competitors) and several other positive developments that cannot be quantified (reliability of the longer-term government economic policy and business environment, rapidly improving physical infrastructure, emergence of new markets or growing demand for selected products in different countries, etc.).
• - Fifth: the contribution of two „foreign” assets to strengthening export-led growth strategy should be given special attention to. On the one hand, several hundred thousands of Bulgarian citizens working abroad regularly send back (or bring person-ally) substantial amount of money (mainly Euro) to Bulgaria. It should be analysed how at least part of this sum could be channelled into financing investments in gen-eral, and export-led projects, in particular, be it together with EU funds, as part of the Bulgarian co-financing assets. On the other hand, part of the people working abroad is supposed to contribute to different areas of export-led strategy (from creating new export products through successful structural upgrading to more intensive coopera-tion with transnational companies).
• - Sixth, and finally: one of the basic barriers to successful export-led growth driven by international business used to be ideological opposition to hostility by part of the domestic society, often ignited or multiplied by demagogic and populist politicians. In the worst case, such an opposition/hostility becomes manifest just at the moment when export-led economic strategy seems to reach a level of no-return and could fundamentally anchor the respective economy in a sustainable export-led growth path. In order to avoid such a backlash, constant dialogue with business representatives (not least owners of small- and medium-sized ventures) and the broader society has to be on the agenda of the government from the very beginning of opting for a consequent and compre-hensive export-led strategy.
*****
To sum up: Bulgaria is a small country and a less developed but catching-up member of the largest economic community of the world, the EU. The country has a very limited domestic market and its economic openness (and vulnerability) is significant and growing. There is no other breakout of this situation than an economic strategy based on export ori-entation not only despite sluggish demand in its main external markets but just because of the declining role of other factors contributing to sustainable growth (mainly domestic de-mand growth). Investments can become an important factor of higher growth only if they are directed into export-oriented, and consequently, competitive production and service activities. For a small country international business is expected to provide always sufficient opportunities in case:
• it develops a predictable and business-friendly environment,• guarantees independent judiciary and trasnparent legislation practice,
30
• creates the necessary absorption capacity (in physical, structural and educational terms),
• remains open to global and European innovation,• economic decision-makers and experts are aware of future opportunities and chal-
lenges (future-oriented mentality),• and, last but not least, keeps strengthening not only the flexibility of the labour mar-
ket but also that of the entire society.To be more precise: export-oriented strategy makes a small economy more dependent
on external developments and may, at least temporarily, increase economic and financial vulnerability. However, the other way based on protectionism, domestic demand-led growth and inward-looking politicians and society does not lead to sustainable growth and even less can give birth to a competitive player in the emerging global environment of the 21st century. The double task of responsible economic policy consists in establishing a generally favourable environment for sustainable export-led growth and, at the same time, getting prepared to minimizing the risks deriving from higher level of vulnerability. No easy task, but there is no other way for small countries for sustainable growth and gradual catching-up to higher level of technological development, structural competitiveness and, as the main goal, to higher (and sustainable) living standard of large majority of the society.
Budapest, January 30, 2013
András INOTAI
31
References
A. T. Kearney 43 (2011), FDI Strategic Analysis, Invest in Bulgaria Agency, Sofia, January
Buturac, Goran – Lovrincevic, Zeljko – Mikulic, Davor (2010), Macroeconomic Perfor-mance, Trade and Competitiveness of South-East European Countries. The Western Balkans Policy Review, vol. 1, Issue 1, January-June, pp. 65-86.
Escaith, Hubert – Lindenberg, Nanette – Miroudot, Sébastien (2010), International Sup-ply Chains and Trade Elasticity in Times of Global Crisis. WTO Staff Working Papers, Geneva
Freund (2009), The trade response to global downturns: historical evidence. Policy Re-search Working Paper Series 5015. The World Bank, Washington D.C.
Gkagka, Aristea – Zarotiadis, Grigoris (2011), Growth and EU Trade Relations: A Case Study. South-Easwtern Europe Journal of Economics, no. 1. p. 1-11.
Hunya, Gábor (2012), wiiw Database on Foreign Direct Investment in Central, East and Southeast Europe. The Vienna Institute for International Economic Studies, Vienna, 141 pp.
Inotai, András (2011), Twenty Years of Economic Development. The New Member States of the European Union and the Western Balkan Countries: A Comparison. In: Michael Ehrke (ed.), Export-led Growth. Central European Experiences – Magic Formula for the Western Balkans? Friedrich Ebert Foundation, Office in Belgrade, Belgrade, pp. 17-42.
Josifidis, Kosta – Dragutinovic Mitrovic, Radmila – Ivancev, Olgica (2012), Heterogeneity of Growth in the West Balkans and Emerging Europe: A Dynamic Panel Data Model Ap-proach. Panoeconomicus, no. 2. Special Issue, pp. 157-183.
Paul (Vass), Andrea – Alexe, Ileana (2012), Comparative Analysis of South Eastern Eu-rope Economies Facing the Crisis. Future Prospects for the Region. Romanian Journal of European Affairs, vol. 12, no. 2, June, pp. 30-51.
Sanfey, Peter – Zeh, Simone (2011), Trade otential and long-run growth in SEE. In: Will Bartlett and Vassilis Monastiriotis (eds.), South East Europe after the Economic Crisis: A New Dawn or back to Business as Usual? London School of Economics, Research on South Eastern Europe, London, pp. 35-43.
Todorovic, Bojana (2008), Key issues in multilateral trade liberalization of economies in transition. (Manuscript), 9 pp.
Zhelev, Paskal – Tzanov, Tzvetomir (2012), Bulgaria’s Export Competitiveness Before and After EU Accession. East-West Journal of Economics and Business, vol. XV, No. 1. pp. 107-128.
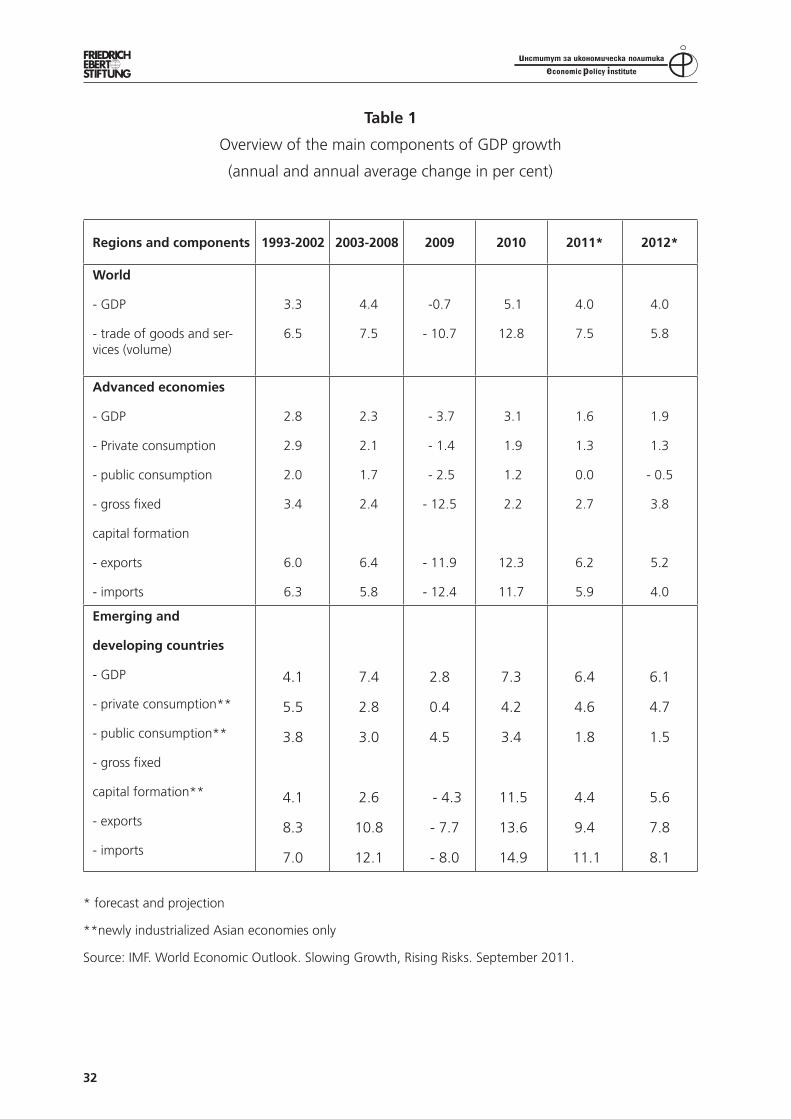
32
Table 1
Overview of the main components of GDP growth
(annual and annual average change in per cent)
Regions and components 1993-2002 2003-2008 2009 2010 2011* 2012*
World
- GDP
- trade of goods and ser-vices (volume)
3.3
6.5
4.4
7.5
-0.7
- 10.7
5.1
12.8
4.0
7.5
4.0
5.8
Advanced economies
- GDP
- Private consumption
- public consumption
- gross fixed
capital formation
- exports
- imports
2.8
2.9
2.0
3.4
6.0
6.3
2.3
2.1
1.7
2.4
6.4
5.8
- 3.7
- 1.4
- 2.5
- 12.5
- 11.9
- 12.4
3.1
1.9
1.2
2.2
12.3
11.7
1.6
1.3
0.0
2.7
6.2
5.9
1.9
1.3
- 0.5
3.8
5.2
4.0
Emerging and
developing countries
- GDP
- private consumption**
- public consumption**
- gross fixed
capital formation**
- exports
- imports
4.1
5.5
3.8
4.1
8.3
7.0
7.4
2.8
3.0
2.6
10.8
12.1
2.8
0.4
4.5
- 4.3
- 7.7
- 8.0
7.3
4.2
3.4
11.5
13.6
14.9
6.4
4.6
1.8
4.4
9.4
11.1
6.1
4.7
1.5
5.6
7.8
8.1
* forecast and projection
**newly industrialized Asian economies only
Source: IMF. World Economic Outlook. Slowing Growth, Rising Risks. September 2011.
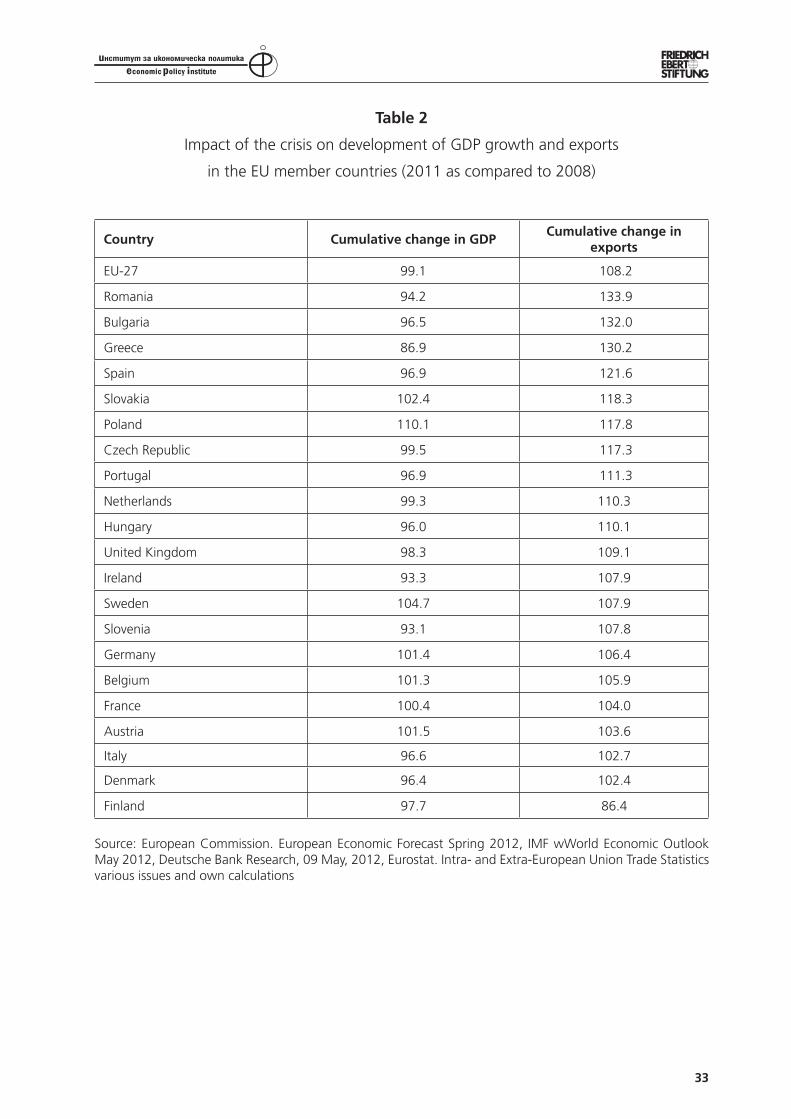
33
Table 2
Impact of the crisis on development of GDP growth and exports
in the EU member countries (2011 as compared to 2008)
Country Cumulative change in GDPCumulative change in
exports
EU-27 99.1 108.2
Romania 94.2 133.9
Bulgaria 96.5 132.0
Greece 86.9 130.2
Spain 96.9 121.6
Slovakia 102.4 118.3
Poland 110.1 117.8
Czech Republic 99.5 117.3
Portugal 96.9 111.3
Netherlands 99.3 110.3
Hungary 96.0 110.1
United Kingdom 98.3 109.1
Ireland 93.3 107.9
Sweden 104.7 107.9
Slovenia 93.1 107.8
Germany 101.4 106.4
Belgium 101.3 105.9
France 100.4 104.0
Austria 101.5 103.6
Italy 96.6 102.7
Denmark 96.4 102.4
Finland 97.7 86.4
Source: European Commission. European Economic Forecast Spring 2012, IMF wWorld Economic Outlook May 2012, Deutsche Bank Research, 09 May, 2012, Eurostat. Intra- and Extra-European Union Trade Statistics various issues and own calculations
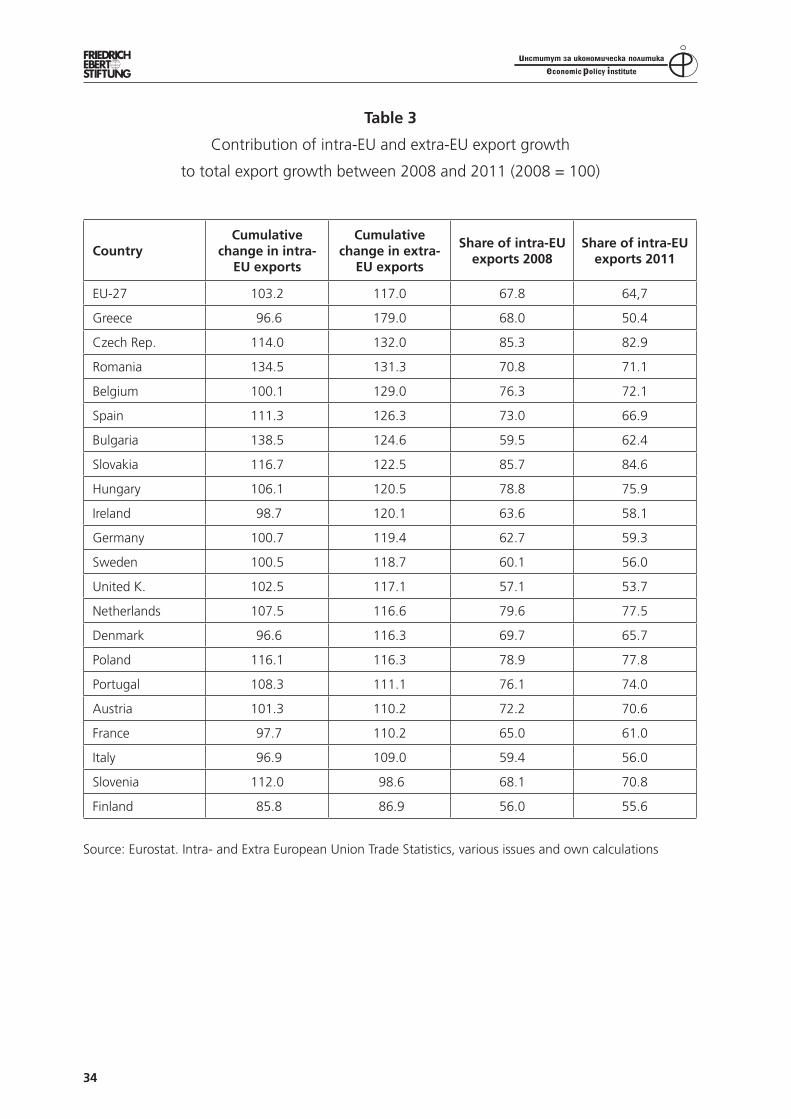
34
Table 3
Contribution of intra-EU and extra-EU export growth
to total export growth between 2008 and 2011 (2008 = 100)
CountryCumulative
change in intra-EU exports
Cumulative change in extra-
EU exports
Share of intra-EU exports 2008
Share of intra-EU exports 2011
EU-27 103.2 117.0 67.8 64,7
Greece 96.6 179.0 68.0 50.4
Czech Rep. 114.0 132.0 85.3 82.9
Romania 134.5 131.3 70.8 71.1
Belgium 100.1 129.0 76.3 72.1
Spain 111.3 126.3 73.0 66.9
Bulgaria 138.5 124.6 59.5 62.4
Slovakia 116.7 122.5 85.7 84.6
Hungary 106.1 120.5 78.8 75.9
Ireland 98.7 120.1 63.6 58.1
Germany 100.7 119.4 62.7 59.3
Sweden 100.5 118.7 60.1 56.0
United K. 102.5 117.1 57.1 53.7
Netherlands 107.5 116.6 79.6 77.5
Denmark 96.6 116.3 69.7 65.7
Poland 116.1 116.3 78.9 77.8
Portugal 108.3 111.1 76.1 74.0
Austria 101.3 110.2 72.2 70.6
France 97.7 110.2 65.0 61.0
Italy 96.9 109.0 59.4 56.0
Slovenia 112.0 98.6 68.1 70.8
Finland 85.8 86.9 56.0 55.6
Source: Eurostat. Intra- and Extra European Union Trade Statistics, various issues and own calculations
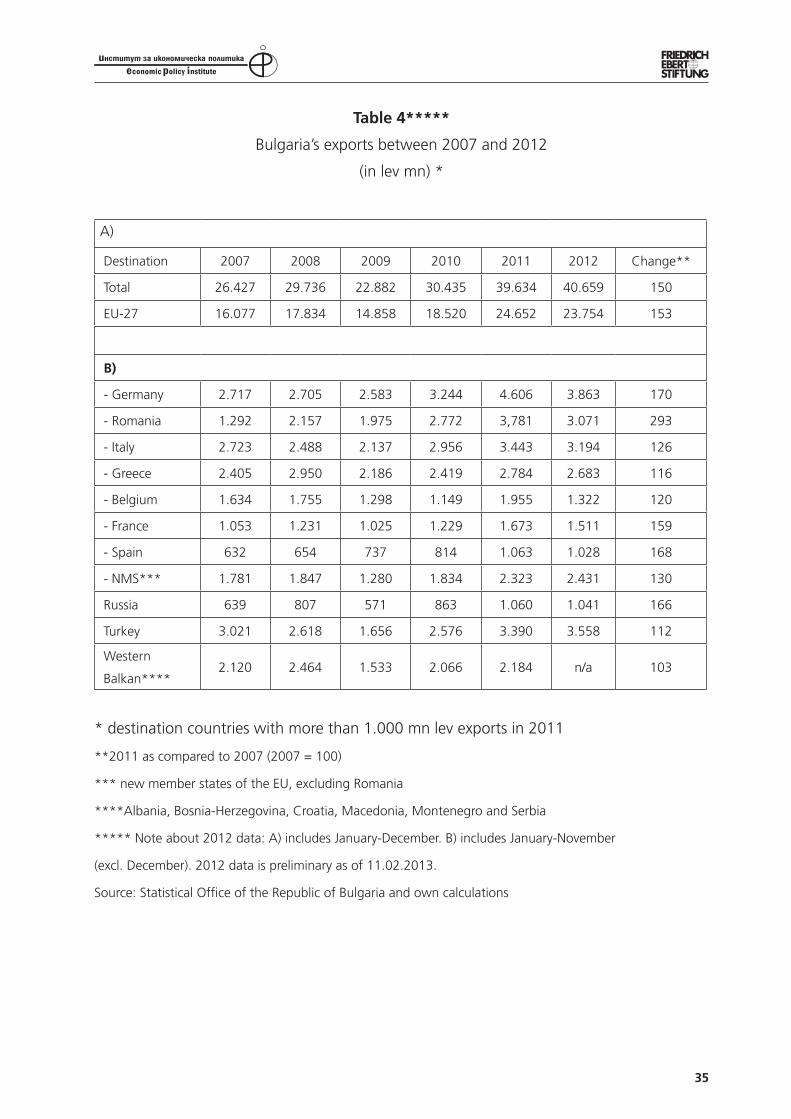
35
Table 4*****
Bulgaria’s exports between 2007 and 2012
(in lev mn) *
A)
Destination 2007 2008 2009 2010 2011 2012 Change**
Total 26.427 29.736 22.882 30.435 39.634 40.659 150
EU-27 16.077 17.834 14.858 18.520 24.652 23.754 153
B)
- Germany 2.717 2.705 2.583 3.244 4.606 3.863 170
- Romania 1.292 2.157 1.975 2.772 3,781 3.071 293
- Italy 2.723 2.488 2.137 2.956 3.443 3.194 126
- Greece 2.405 2.950 2.186 2.419 2.784 2.683 116
- Belgium 1.634 1.755 1.298 1.149 1.955 1.322 120
- France 1.053 1.231 1.025 1.229 1.673 1.511 159
- Spain 632 654 737 814 1.063 1.028 168
- NMS*** 1.781 1.847 1.280 1.834 2.323 2.431 130
Russia 639 807 571 863 1.060 1.041 166
Turkey 3.021 2.618 1.656 2.576 3.390 3.558 112
Western
Balkan****2.120 2.464 1.533 2.066 2.184 n/a 103
* destination countries with more than 1.000 mn lev exports in 2011
**2011 as compared to 2007 (2007 = 100)
*** new member states of the EU, excluding Romania
****Albania, Bosnia-Herzegovina, Croatia, Macedonia, Montenegro and Serbia
***** Note about 2012 data: A) includes January-December. B) includes January-November
(excl. December). 2012 data is preliminary as of 11.02.2013.
Source: Statistical Office of the Republic of Bulgaria and own calculations
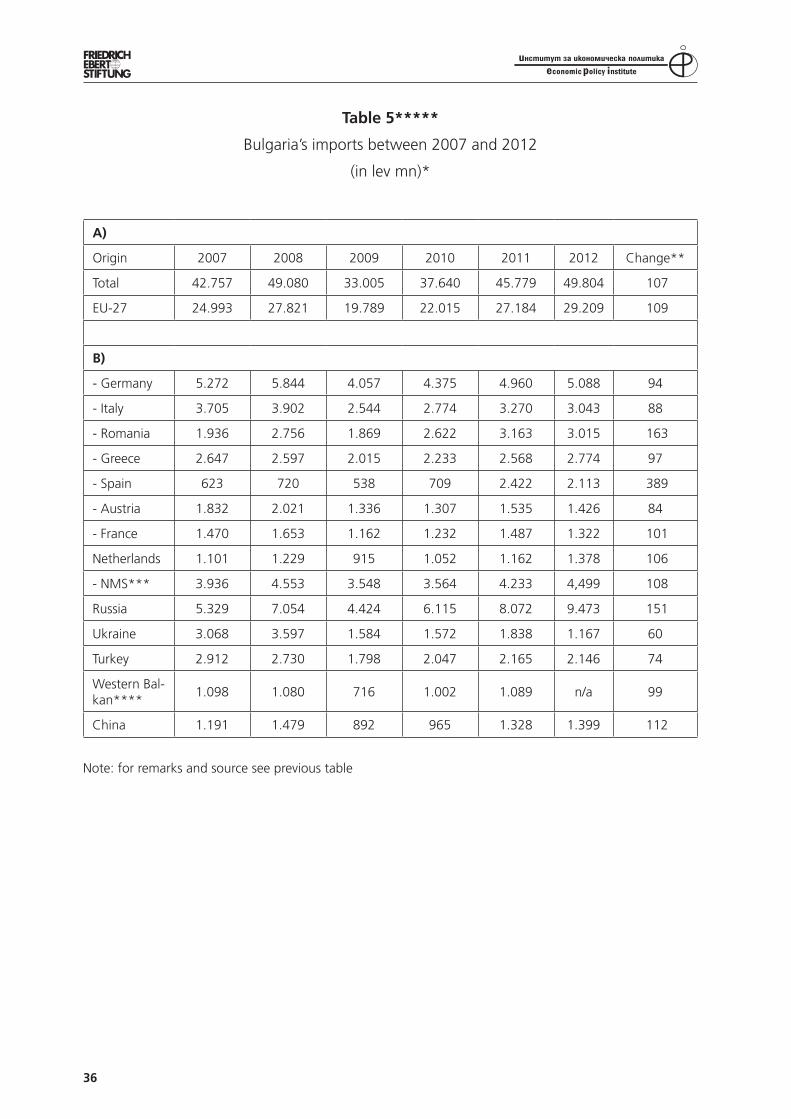
36
Table 5*****
Bulgaria’s imports between 2007 and 2012
(in lev mn)*
A)
Origin 2007 2008 2009 2010 2011 2012 Change**
Total 42.757 49.080 33.005 37.640 45.779 49.804 107
EU-27 24.993 27.821 19.789 22.015 27.184 29.209 109
B)
- Germany 5.272 5.844 4.057 4.375 4.960 5.088 94
- Italy 3.705 3.902 2.544 2.774 3.270 3.043 88
- Romania 1.936 2.756 1.869 2.622 3.163 3.015 163
- Greece 2.647 2.597 2.015 2.233 2.568 2.774 97
- Spain 623 720 538 709 2.422 2.113 389
- Austria 1.832 2.021 1.336 1.307 1.535 1.426 84
- France 1.470 1.653 1.162 1.232 1.487 1.322 101
Netherlands 1.101 1.229 915 1.052 1.162 1.378 106
- NMS*** 3.936 4.553 3.548 3.564 4.233 4,499 108
Russia 5.329 7.054 4.424 6.115 8.072 9.473 151
Ukraine 3.068 3.597 1.584 1.572 1.838 1.167 60
Turkey 2.912 2.730 1.798 2.047 2.165 2.146 74
Western Bal-kan****
1.098 1.080 716 1.002 1.089 n/a 99
China 1.191 1.479 892 965 1.328 1.399 112
Note: for remarks and source see previous table
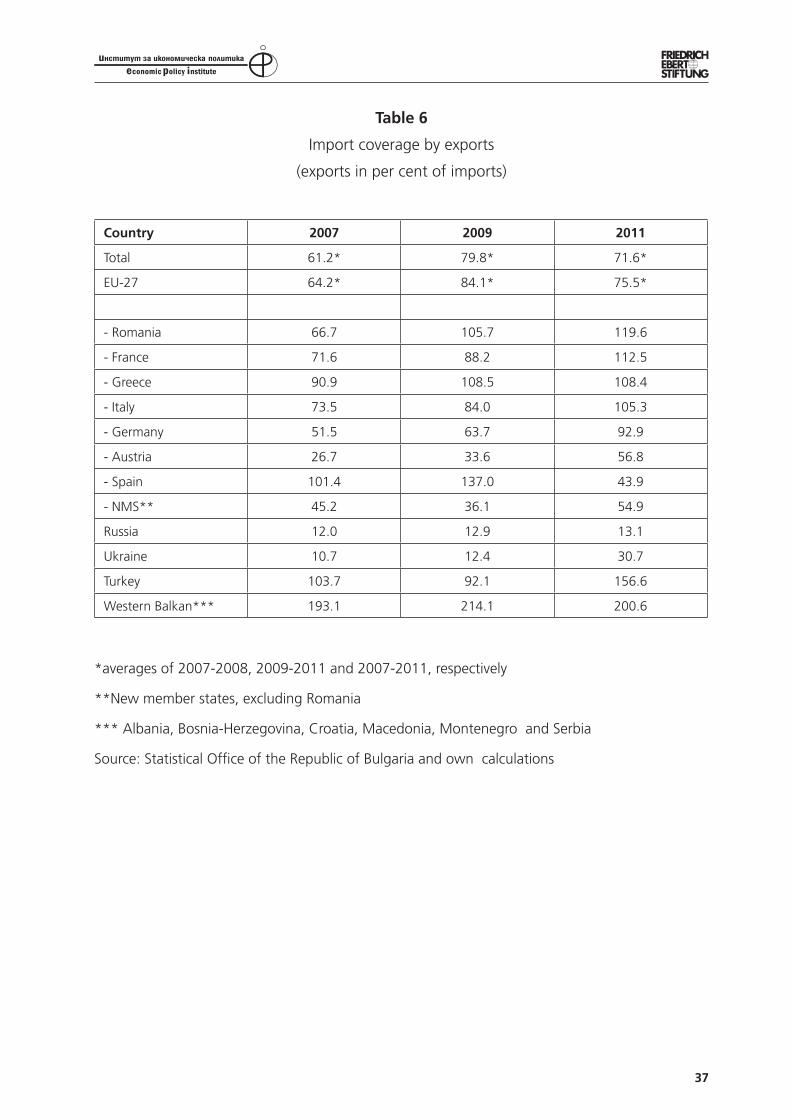
37
Table 6
Import coverage by exports
(exports in per cent of imports)
Country 2007 2009 2011
Total 61.2* 79.8* 71.6*
EU-27 64.2* 84.1* 75.5*
- Romania 66.7 105.7 119.6
- France 71.6 88.2 112.5
- Greece 90.9 108.5 108.4
- Italy 73.5 84.0 105.3
- Germany 51.5 63.7 92.9
- Austria 26.7 33.6 56.8
- Spain 101.4 137.0 43.9
- NMS** 45.2 36.1 54.9
Russia 12.0 12.9 13.1
Ukraine 10.7 12.4 30.7
Turkey 103.7 92.1 156.6
Western Balkan*** 193.1 214.1 200.6
*averages of 2007-2008, 2009-2011 and 2007-2011, respectively
**New member states, excluding Romania
*** Albania, Bosnia-Herzegovina, Croatia, Macedonia, Montenegro and Serbia
Source: Statistical Office of the Republic of Bulgaria and own calculations
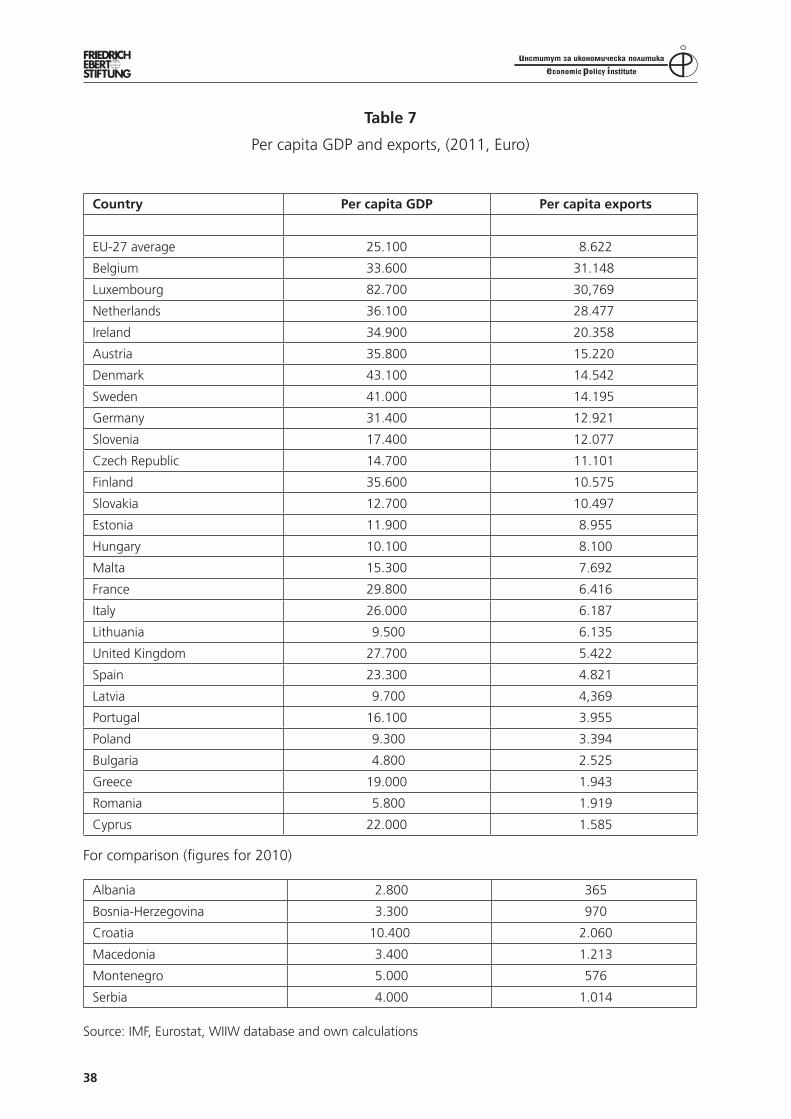
38
Table 7
Per capita GDP and exports, (2011, Euro)
Country Per capita GDP Per capita exports
EU-27 average 25.100 8.622
Belgium 33.600 31.148
Luxembourg 82.700 30,769
Netherlands 36.100 28.477
Ireland 34.900 20.358
Austria 35.800 15.220
Denmark 43.100 14.542
Sweden 41.000 14.195
Germany 31.400 12.921
Slovenia 17.400 12.077
Czech Republic 14.700 11.101
Finland 35.600 10.575
Slovakia 12.700 10.497
Estonia 11.900 8.955
Hungary 10.100 8.100
Malta 15.300 7.692
France 29.800 6.416
Italy 26.000 6.187
Lithuania 9.500 6.135
United Kingdom 27.700 5.422
Spain 23.300 4.821
Latvia 9.700 4,369
Portugal 16.100 3.955
Poland 9.300 3.394
Bulgaria 4.800 2.525
Greece 19.000 1.943
Romania 5.800 1.919
Cyprus 22.000 1.585
For comparison (figures for 2010)
Albania 2.800 365
Bosnia-Herzegovina 3.300 970
Croatia 10.400 2.060
Macedonia 3.400 1.213
Montenegro 5.000 576
Serbia 4.000 1.014
Source: IMF, Eurostat, WIIW database and own calculations
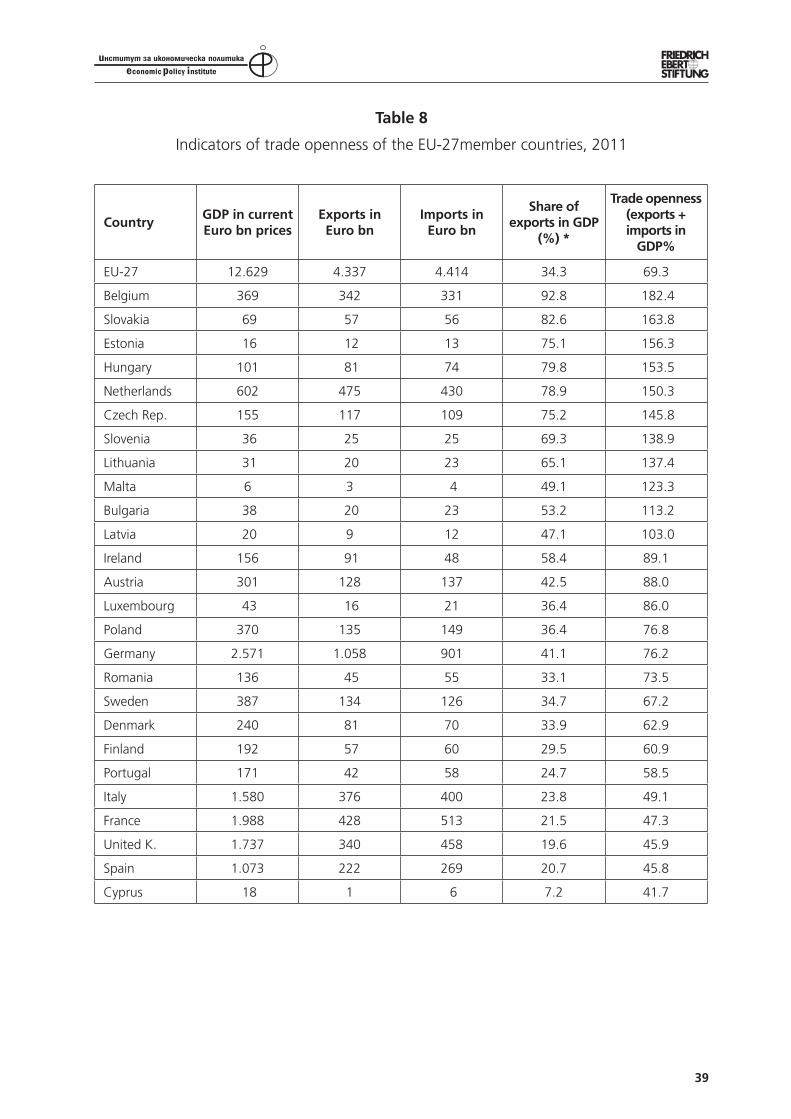
39
Table 8
Indicators of trade openness of the EU-27member countries, 2011
CountryGDP in current Euro bn prices
Exports in Euro bn
Imports in Euro bn
Share of exports in GDP
(%) *
Trade openness (exports + imports in
GDP%
EU-27 12.629 4.337 4.414 34.3 69.3
Belgium 369 342 331 92.8 182.4
Slovakia 69 57 56 82.6 163.8
Estonia 16 12 13 75.1 156.3
Hungary 101 81 74 79.8 153.5
Netherlands 602 475 430 78.9 150.3
Czech Rep. 155 117 109 75.2 145.8
Slovenia 36 25 25 69.3 138.9
Lithuania 31 20 23 65.1 137.4
Malta 6 3 4 49.1 123.3
Bulgaria 38 20 23 53.2 113.2
Latvia 20 9 12 47.1 103.0
Ireland 156 91 48 58.4 89.1
Austria 301 128 137 42.5 88.0
Luxembourg 43 16 21 36.4 86.0
Poland 370 135 149 36.4 76.8
Germany 2.571 1.058 901 41.1 76.2
Romania 136 45 55 33.1 73.5
Sweden 387 134 126 34.7 67.2
Denmark 240 81 70 33.9 62.9
Finland 192 57 60 29.5 60.9
Portugal 171 42 58 24.7 58.5
Italy 1.580 376 400 23.8 49.1
France 1.988 428 513 21.5 47.3
United K. 1.737 340 458 19.6 45.9
Spain 1.073 222 269 20.7 45.8
Cyprus 18 1 6 7.2 41.7
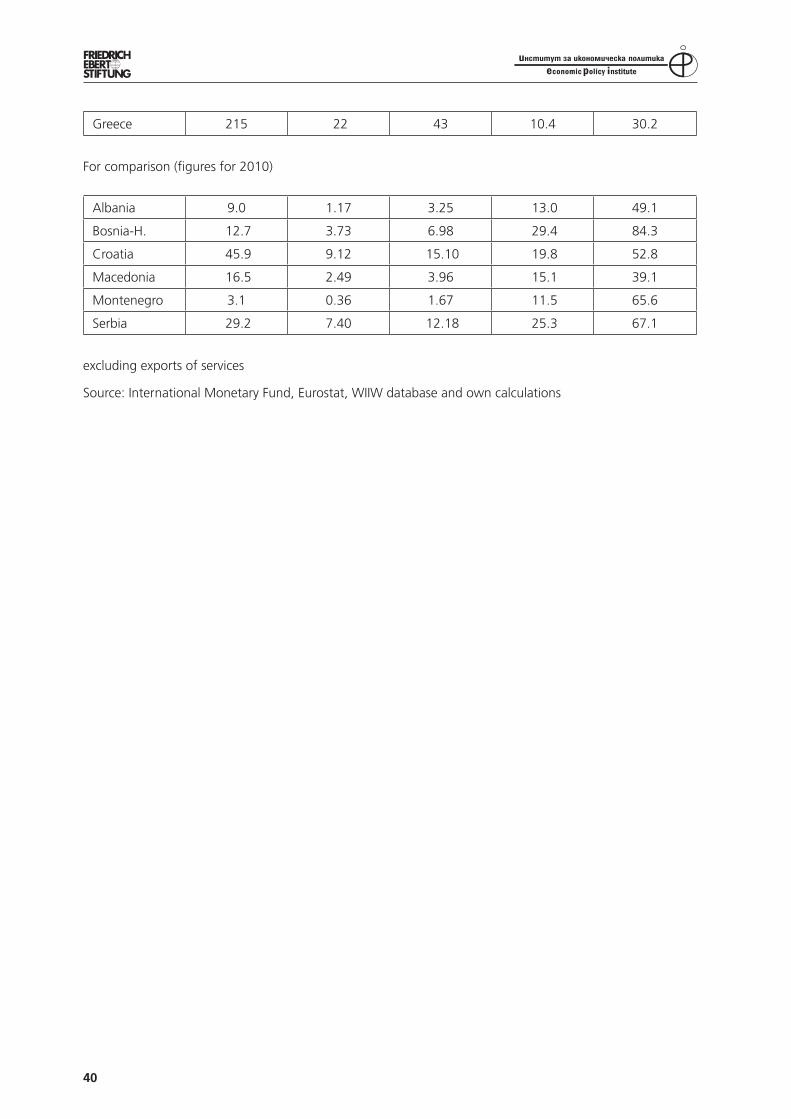
40
Greece 215 22 43 10.4 30.2
For comparison (figures for 2010)
Albania 9.0 1.17 3.25 13.0 49.1
Bosnia-H. 12.7 3.73 6.98 29.4 84.3
Croatia 45.9 9.12 15.10 19.8 52.8
Macedonia 16.5 2.49 3.96 15.1 39.1
Montenegro 3.1 0.36 1.67 11.5 65.6
Serbia 29.2 7.40 12.18 25.3 67.1
excluding exports of services
Source: International Monetary Fund, Eurostat, WIIW database and own calculations
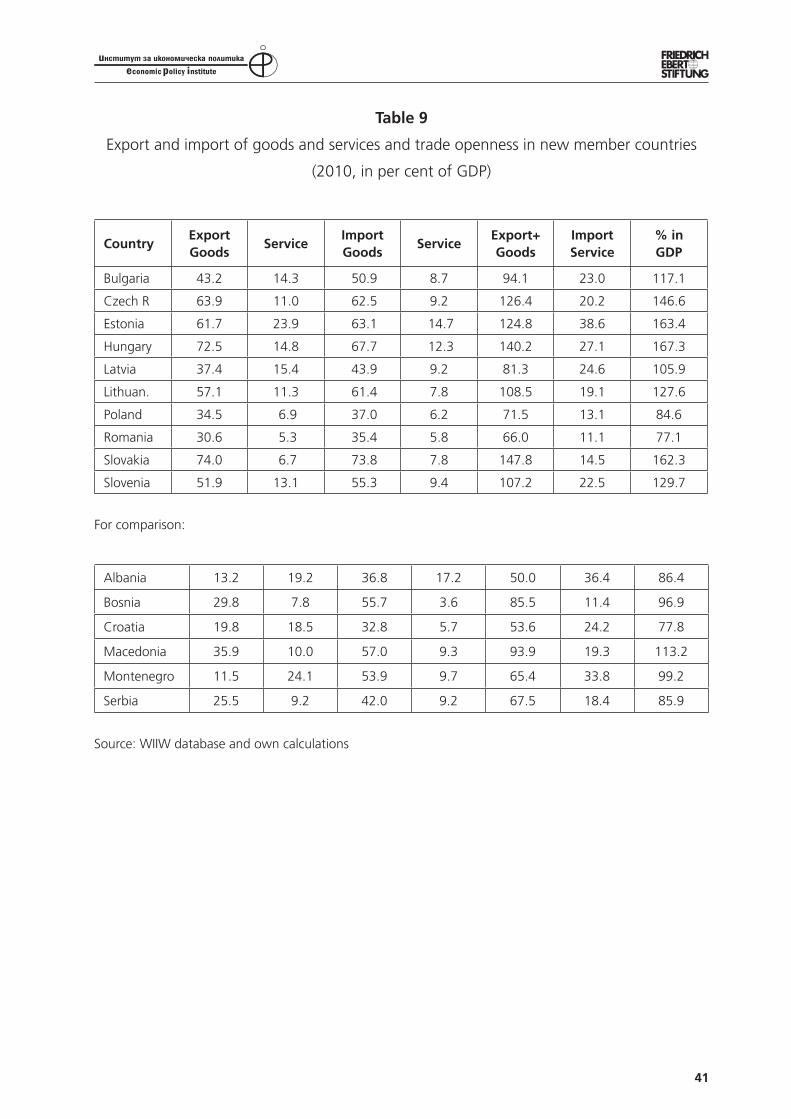
41
Table 9
Export and import of goods and services and trade openness in new member countries
(2010, in per cent of GDP)
CountryExport Goods
ServiceImportGoods
ServiceExport+Goods
ImportService
% in GDP
Bulgaria 43.2 14.3 50.9 8.7 94.1 23.0 117.1
Czech R 63.9 11.0 62.5 9.2 126.4 20.2 146.6
Estonia 61.7 23.9 63.1 14.7 124.8 38.6 163.4
Hungary 72.5 14.8 67.7 12.3 140.2 27.1 167.3
Latvia 37.4 15.4 43.9 9.2 81.3 24.6 105.9
Lithuan. 57.1 11.3 61.4 7.8 108.5 19.1 127.6
Poland 34.5 6.9 37.0 6.2 71.5 13.1 84.6
Romania 30.6 5.3 35.4 5.8 66.0 11.1 77.1
Slovakia 74.0 6.7 73.8 7.8 147.8 14.5 162.3
Slovenia 51.9 13.1 55.3 9.4 107.2 22.5 129.7
For comparison:
Albania 13.2 19.2 36.8 17.2 50.0 36.4 86.4
Bosnia 29.8 7.8 55.7 3.6 85.5 11.4 96.9
Croatia 19.8 18.5 32.8 5.7 53.6 24.2 77.8
Macedonia 35.9 10.0 57.0 9.3 93.9 19.3 113.2
Montenegro 11.5 24.1 53.9 9.7 65.4 33.8 99.2
Serbia 25.5 9.2 42.0 9.2 67.5 18.4 85.9
Source: WIIW database and own calculations
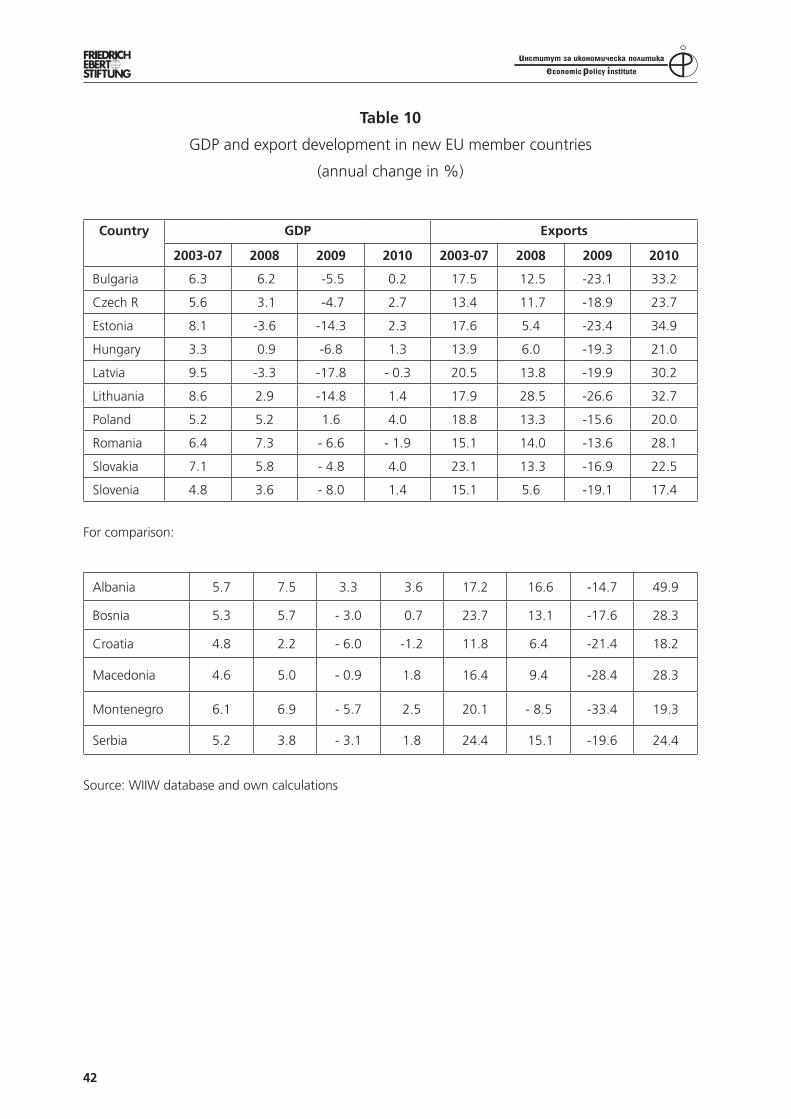
42
Table 10
GDP and export development in new EU member countries
(annual change in %)
Country GDP Exports
2003-07 2008 2009 2010 2003-07 2008 2009 2010
Bulgaria 6.3 6.2 -5.5 0.2 17.5 12.5 -23.1 33.2
Czech R 5.6 3.1 -4.7 2.7 13.4 11.7 -18.9 23.7
Estonia 8.1 -3.6 -14.3 2.3 17.6 5.4 -23.4 34.9
Hungary 3.3 0.9 -6.8 1.3 13.9 6.0 -19.3 21.0
Latvia 9.5 -3.3 -17.8 - 0.3 20.5 13.8 -19.9 30.2
Lithuania 8.6 2.9 -14.8 1.4 17.9 28.5 -26.6 32.7
Poland 5.2 5.2 1.6 4.0 18.8 13.3 -15.6 20.0
Romania 6.4 7.3 - 6.6 - 1.9 15.1 14.0 -13.6 28.1
Slovakia 7.1 5.8 - 4.8 4.0 23.1 13.3 -16.9 22.5
Slovenia 4.8 3.6 - 8.0 1.4 15.1 5.6 -19.1 17.4
For comparison:
Albania 5.7 7.5 3.3 3.6 17.2 16.6 -14.7 49.9
Bosnia 5.3 5.7 - 3.0 0.7 23.7 13.1 -17.6 28.3
Croatia 4.8 2.2 - 6.0 -1.2 11.8 6.4 -21.4 18.2
Macedonia 4.6 5.0 - 0.9 1.8 16.4 9.4 -28.4 28.3
Montenegro 6.1 6.9 - 5.7 2.5 20.1 - 8.5 -33.4 19.3
Serbia 5.2 3.8 - 3.1 1.8 24.4 15.1 -19.6 24.4
Source: WIIW database and own calculations
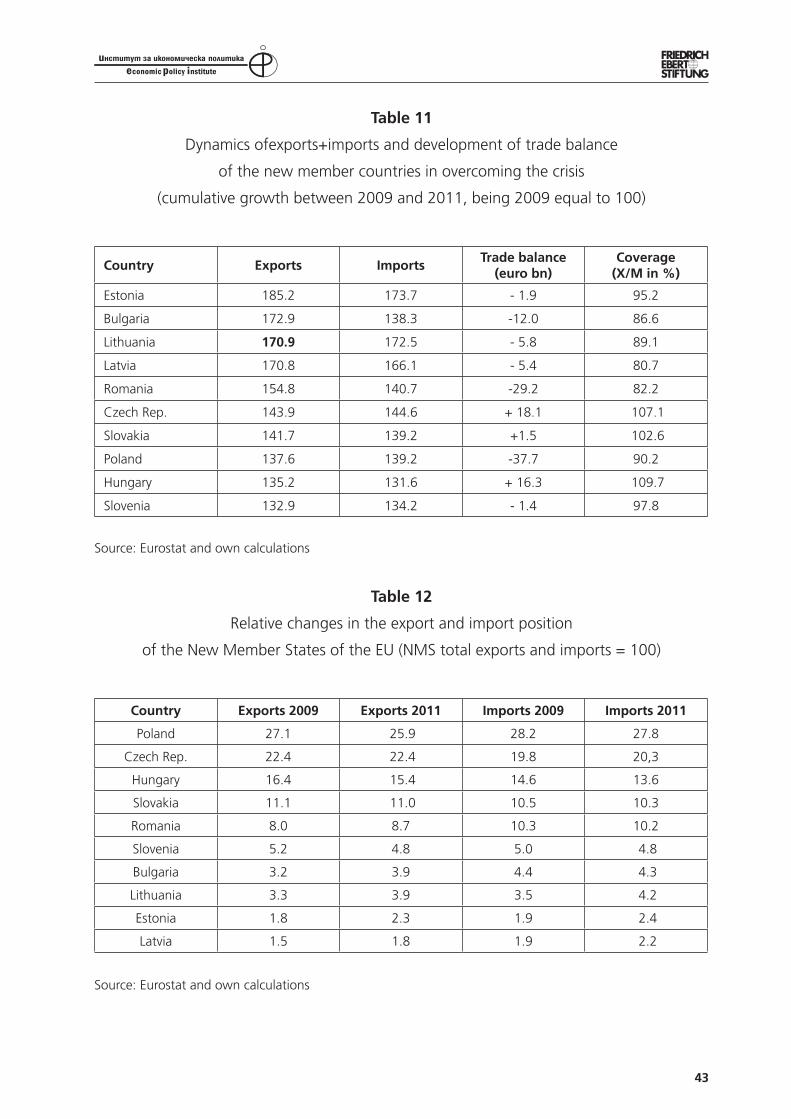
43
Table 11
Dynamics ofexports+imports and development of trade balance
of the new member countries in overcoming the crisis
(cumulative growth between 2009 and 2011, being 2009 equal to 100)
Country Exports ImportsTrade balance
(euro bn)Coverage
(X/M in %)
Estonia 185.2 173.7 - 1.9 95.2
Bulgaria 172.9 138.3 -12.0 86.6
Lithuania 170.9 172.5 - 5.8 89.1
Latvia 170.8 166.1 - 5.4 80.7
Romania 154.8 140.7 -29.2 82.2
Czech Rep. 143.9 144.6 + 18.1 107.1
Slovakia 141.7 139.2 +1.5 102.6
Poland 137.6 139.2 -37.7 90.2
Hungary 135.2 131.6 + 16.3 109.7
Slovenia 132.9 134.2 - 1.4 97.8
Source: Eurostat and own calculations
Table 12
Relative changes in the export and import position
of the New Member States of the EU (NMS total exports and imports = 100)
Country Exports 2009 Exports 2011 Imports 2009 Imports 2011
Poland 27.1 25.9 28.2 27.8
Czech Rep. 22.4 22.4 19.8 20,3
Hungary 16.4 15.4 14.6 13.6
Slovakia 11.1 11.0 10.5 10.3
Romania 8.0 8.7 10.3 10.2
Slovenia 5.2 4.8 5.0 4.8
Bulgaria 3.2 3.9 4.4 4.3
Lithuania 3.3 3.9 3.5 4.2
Estonia 1.8 2.3 1.9 2.4
Latvia 1.5 1.8 1.9 2.2
Source: Eurostat and own calculations
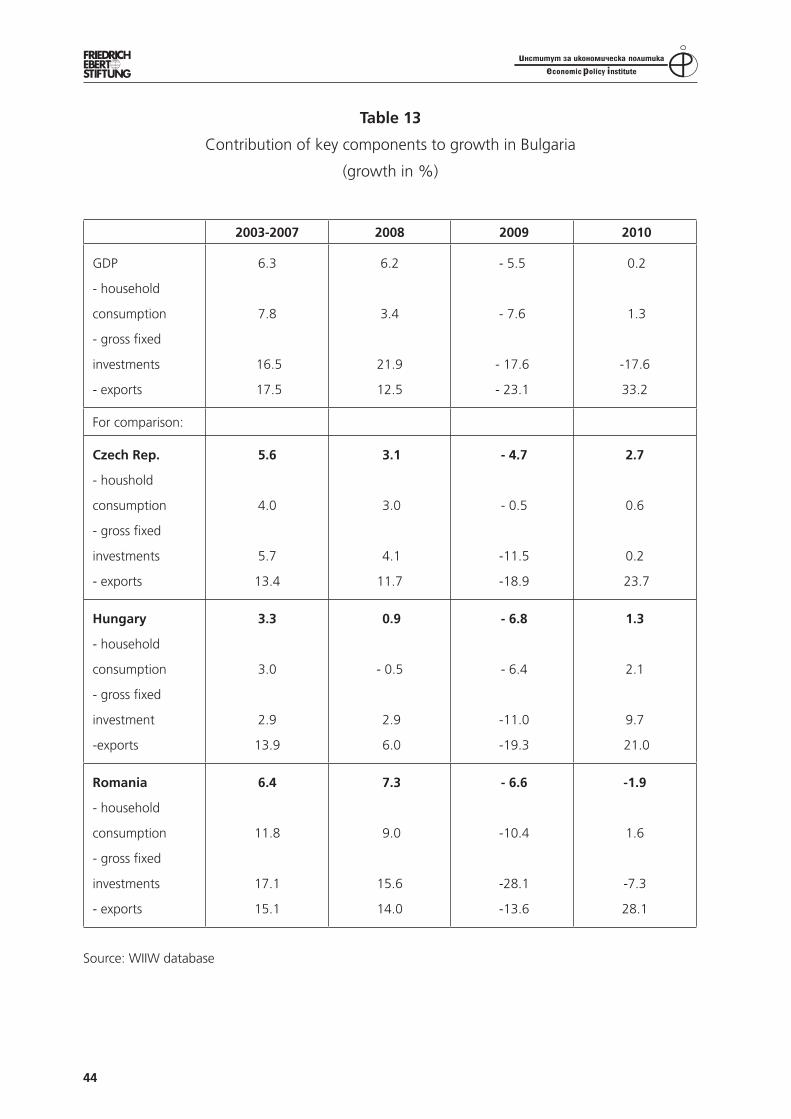
44
Table 13
Contribution of key components to growth in Bulgaria
(growth in %)
2003-2007 2008 2009 2010
GDP
- household
consumption
- gross fixed
investments
- exports
6.3
7.8
16.5
17.5
6.2
3.4
21.9
12.5
- 5.5
- 7.6
- 17.6
- 23.1
0.2
1.3
-17.6
33.2
For comparison:
Czech Rep.
- houshold
consumption
- gross fixed
investments
- exports
5.6
4.0
5.7
13.4
3.1
3.0
4.1
11.7
- 4.7
- 0.5
-11.5
-18.9
2.7
0.6
0.2
23.7
Hungary
- household
consumption
- gross fixed
investment
-exports
3.3
3.0
2.9
13.9
0.9
- 0.5
2.9
6.0
- 6.8
- 6.4
-11.0
-19.3
1.3
2.1
9.7
21.0
Romania
- household
consumption
- gross fixed
investments
- exports
6.4
11.8
17.1
15.1
7.3
9.0
15.6
14.0
- 6.6
-10.4
-28.1
-13.6
-1.9
1.6
-7.3
28.1
Source: WIIW database
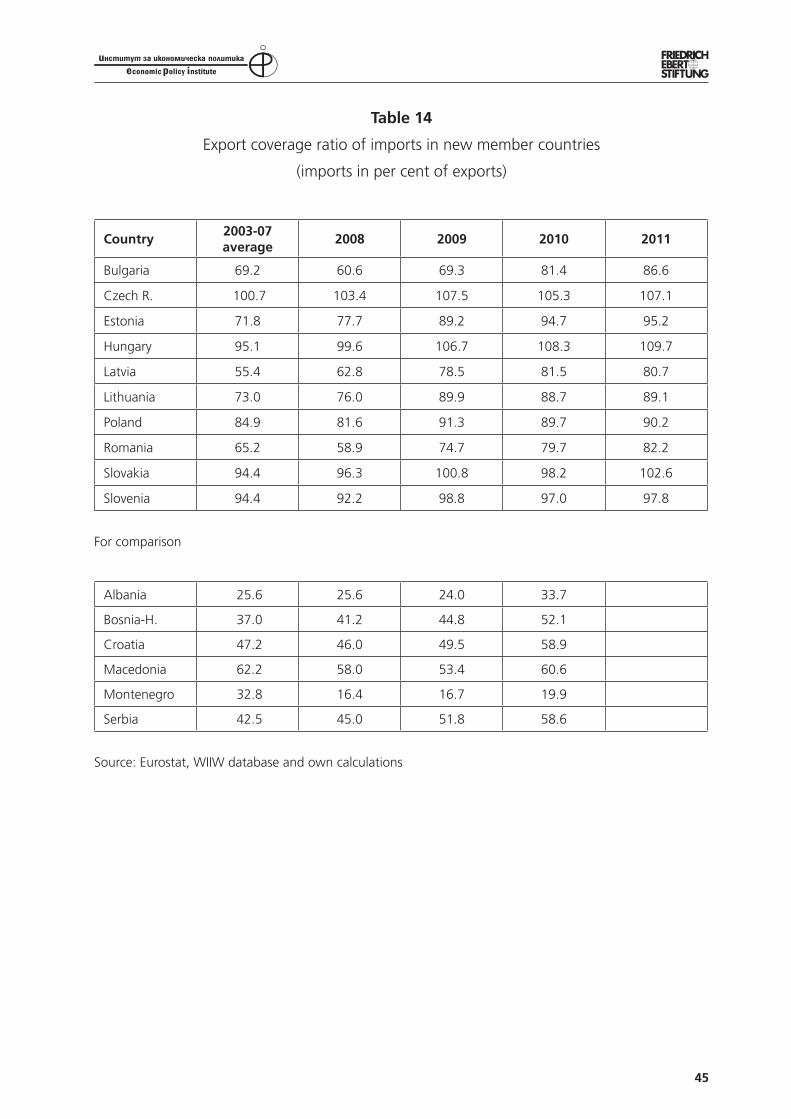
45
Table 14
Export coverage ratio of imports in new member countries
(imports in per cent of exports)
Country2003-07 average
2008 2009 2010 2011
Bulgaria 69.2 60.6 69.3 81.4 86.6
Czech R. 100.7 103.4 107.5 105.3 107.1
Estonia 71.8 77.7 89.2 94.7 95.2
Hungary 95.1 99.6 106.7 108.3 109.7
Latvia 55.4 62.8 78.5 81.5 80.7
Lithuania 73.0 76.0 89.9 88.7 89.1
Poland 84.9 81.6 91.3 89.7 90.2
Romania 65.2 58.9 74.7 79.7 82.2
Slovakia 94.4 96.3 100.8 98.2 102.6
Slovenia 94.4 92.2 98.8 97.0 97.8
For comparison
Albania 25.6 25.6 24.0 33.7
Bosnia-H. 37.0 41.2 44.8 52.1
Croatia 47.2 46.0 49.5 58.9
Macedonia 62.2 58.0 53.4 60.6
Montenegro 32.8 16.4 16.7 19.9
Serbia 42.5 45.0 51.8 58.6
Source: Eurostat, WIIW database and own calculations
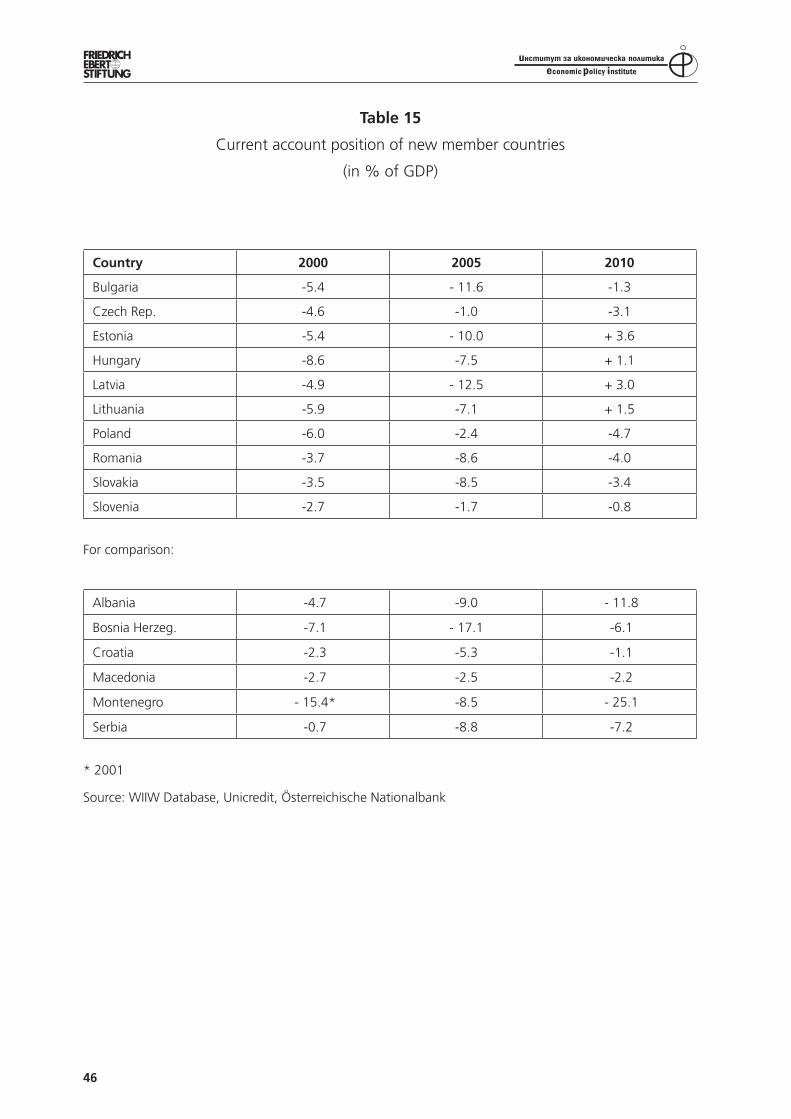
46
Table 15
Current account position of new member countries
(in % of GDP)
Country 2000 2005 2010
Bulgaria -5.4 - 11.6 -1.3
Czech Rep. -4.6 -1.0 -3.1
Estonia -5.4 - 10.0 + 3.6
Hungary -8.6 -7.5 + 1.1
Latvia -4.9 - 12.5 + 3.0
Lithuania -5.9 -7.1 + 1.5
Poland -6.0 -2.4 -4.7
Romania -3.7 -8.6 -4.0
Slovakia -3.5 -8.5 -3.4
Slovenia -2.7 -1.7 -0.8
For comparison:
Albania -4.7 -9.0 - 11.8
Bosnia Herzeg. -7.1 - 17.1 -6.1
Croatia -2.3 -5.3 -1.1
Macedonia -2.7 -2.5 -2.2
Montenegro - 15.4* -8.5 - 25.1
Serbia -0.7 -8.8 -7.2
* 2001
Source: WIIW Database, Unicredit, Österreichische Nationalbank
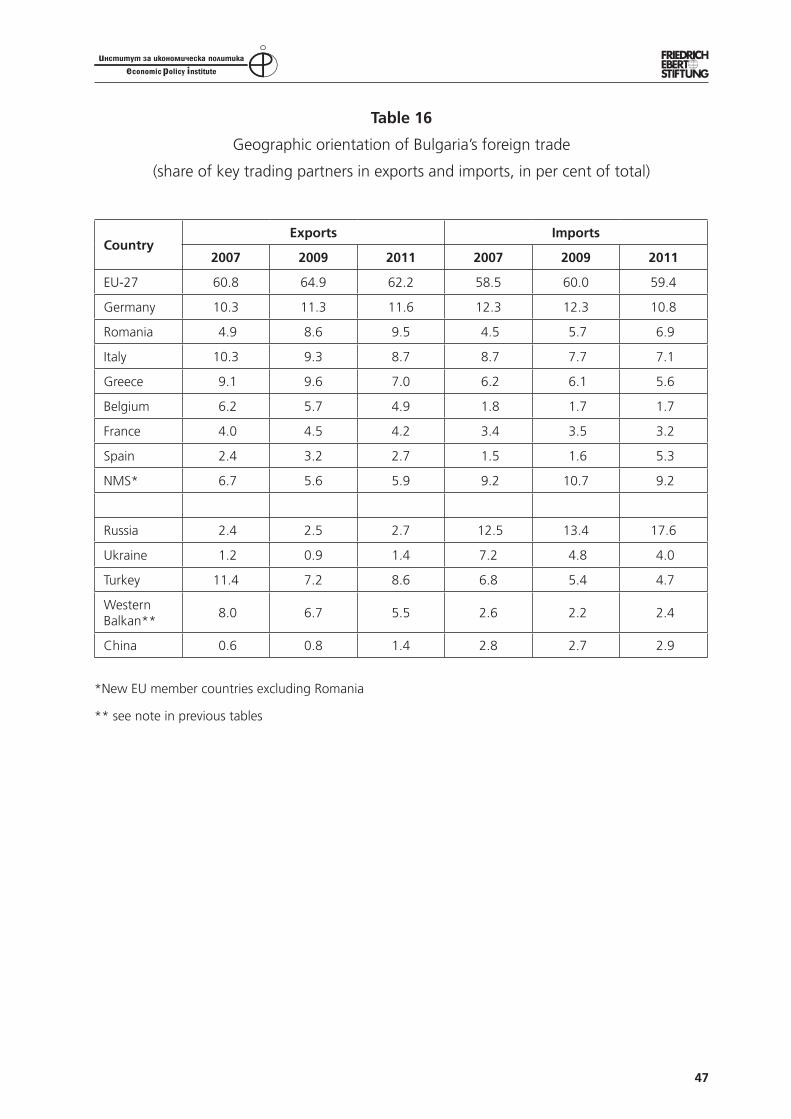
47
Table 16
Geographic orientation of Bulgaria’s foreign trade
(share of key trading partners in exports and imports, in per cent of total)
CountryExports Imports
2007 2009 2011 2007 2009 2011
EU-27 60.8 64.9 62.2 58.5 60.0 59.4
Germany 10.3 11.3 11.6 12.3 12.3 10.8
Romania 4.9 8.6 9.5 4.5 5.7 6.9
Italy 10.3 9.3 8.7 8.7 7.7 7.1
Greece 9.1 9.6 7.0 6.2 6.1 5.6
Belgium 6.2 5.7 4.9 1.8 1.7 1.7
France 4.0 4.5 4.2 3.4 3.5 3.2
Spain 2.4 3.2 2.7 1.5 1.6 5.3
NMS* 6.7 5.6 5.9 9.2 10.7 9.2
Russia 2.4 2.5 2.7 12.5 13.4 17.6
Ukraine 1.2 0.9 1.4 7.2 4.8 4.0
Turkey 11.4 7.2 8.6 6.8 5.4 4.7
Western Balkan**
8.0 6.7 5.5 2.6 2.2 2.4
China 0.6 0.8 1.4 2.8 2.7 2.9
*New EU member countries excluding Romania
** see note in previous tables
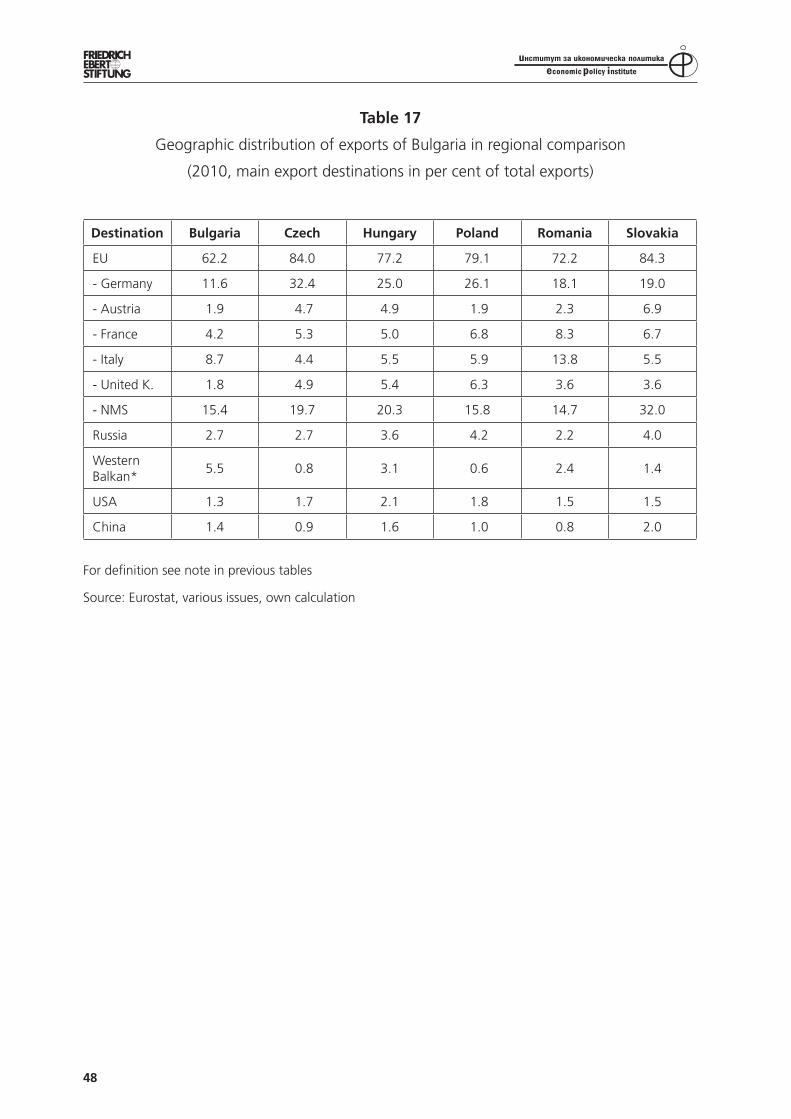
48
Table 17
Geographic distribution of exports of Bulgaria in regional comparison
(2010, main export destinations in per cent of total exports)
Destination Bulgaria Czech Hungary Poland Romania Slovakia
EU 62.2 84.0 77.2 79.1 72.2 84.3
- Germany 11.6 32.4 25.0 26.1 18.1 19.0
- Austria 1.9 4.7 4.9 1.9 2.3 6.9
- France 4.2 5.3 5.0 6.8 8.3 6.7
- Italy 8.7 4.4 5.5 5.9 13.8 5.5
- United K. 1.8 4.9 5.4 6.3 3.6 3.6
- NMS 15.4 19.7 20.3 15.8 14.7 32.0
Russia 2.7 2.7 3.6 4.2 2.2 4.0
Western Balkan*
5.5 0.8 3.1 0.6 2.4 1.4
USA 1.3 1.7 2.1 1.8 1.5 1.5
China 1.4 0.9 1.6 1.0 0.8 2.0
For definition see note in previous tables
Source: Eurostat, various issues, own calculation
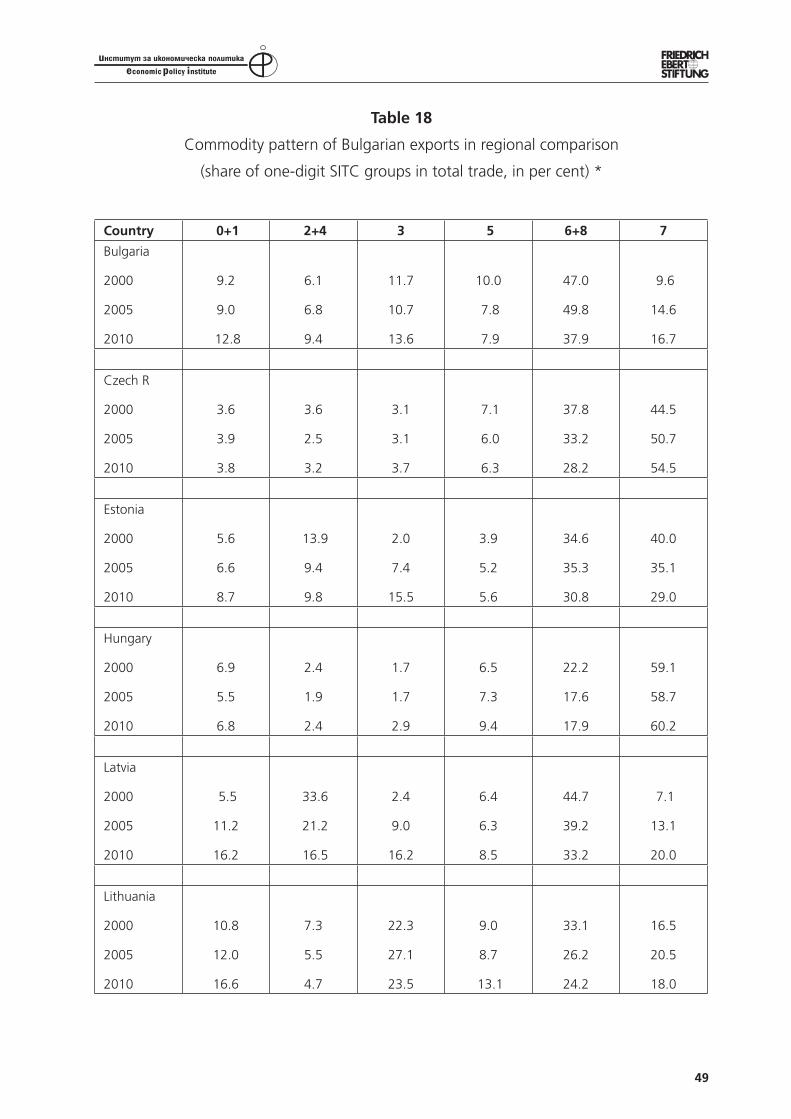
49
Table 18
Commodity pattern of Bulgarian exports in regional comparison
(share of one-digit SITC groups in total trade, in per cent) *
Country 0+1 2+4 3 5 6+8 7
Bulgaria
2000
2005
2010
9.2
9.0
12.8
6.1
6.8
9.4
11.7
10.7
13.6
10.0
7.8
7.9
47.0
49.8
37.9
9.6
14.6
16.7
Czech R
2000
2005
2010
3.6
3.9
3.8
3.6
2.5
3.2
3.1
3.1
3.7
7.1
6.0
6.3
37.8
33.2
28.2
44.5
50.7
54.5
Estonia
2000
2005
2010
5.6
6.6
8.7
13.9
9.4
9.8
2.0
7.4
15.5
3.9
5.2
5.6
34.6
35.3
30.8
40.0
35.1
29.0
Hungary
2000
2005
2010
6.9
5.5
6.8
2.4
1.9
2.4
1.7
1.7
2.9
6.5
7.3
9.4
22.2
17.6
17.9
59.1
58.7
60.2
Latvia
2000
2005
2010
5.5
11.2
16.2
33.6
21.2
16.5
2.4
9.0
16.2
6.4
6.3
8.5
44.7
39.2
33.2
7.1
13.1
20.0
Lithuania
2000
2005
2010
10.8
12.0
16.6
7.3
5.5
4.7
22.3
27.1
23.5
9.0
8.7
13.1
33.1
26.2
24.2
16.5
20.5
18.0
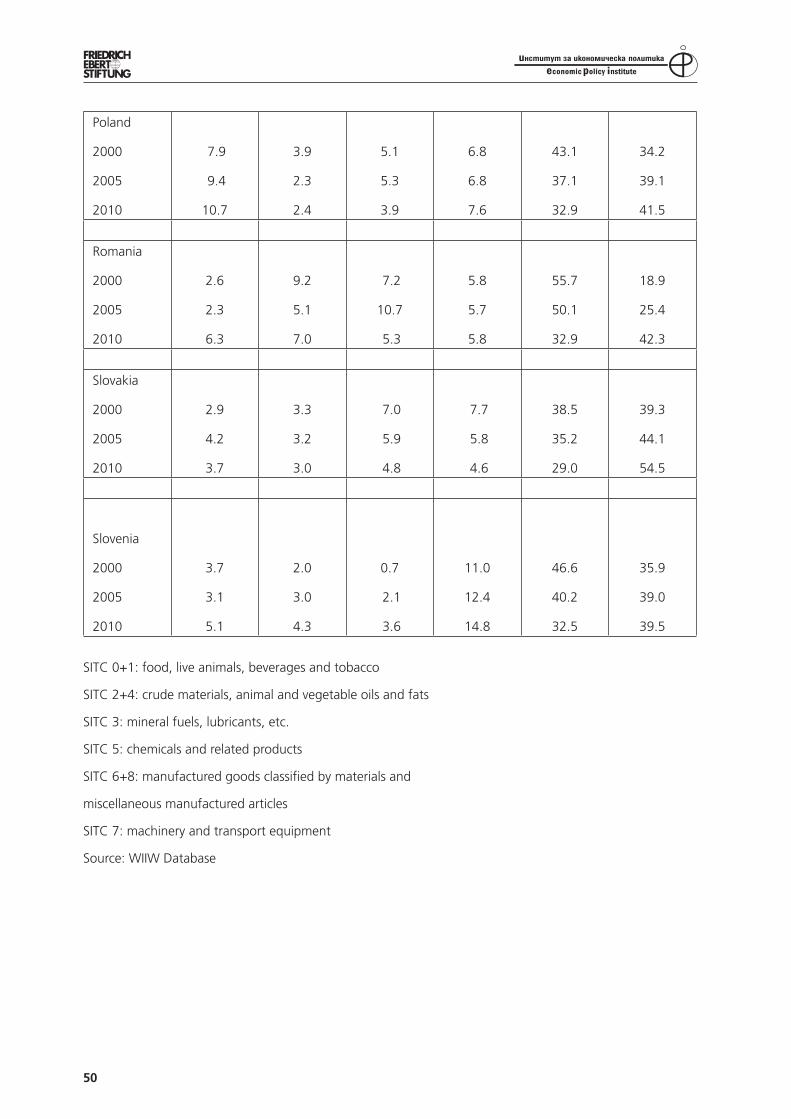
50
Poland
2000
2005
2010
7.9
9.4
10.7
3.9
2.3
2.4
5.1
5.3
3.9
6.8
6.8
7.6
43.1
37.1
32.9
34.2
39.1
41.5
Romania
2000
2005
2010
2.6
2.3
6.3
9.2
5.1
7.0
7.2
10.7
5.3
5.8
5.7
5.8
55.7
50.1
32.9
18.9
25.4
42.3
Slovakia
2000
2005
2010
2.9
4.2
3.7
3.3
3.2
3.0
7.0
5.9
4.8
7.7
5.8
4.6
38.5
35.2
29.0
39.3
44.1
54.5
Slovenia
2000
2005
2010
3.7
3.1
5.1
2.0
3.0
4.3
0.7
2.1
3.6
11.0
12.4
14.8
46.6
40.2
32.5
35.9
39.0
39.5
SITC 0+1: food, live animals, beverages and tobacco
SITC 2+4: crude materials, animal and vegetable oils and fats
SITC 3: mineral fuels, lubricants, etc.
SITC 5: chemicals and related products
SITC 6+8: manufactured goods classified by materials and
miscellaneous manufactured articles
SITC 7: machinery and transport equipment
Source: WIIW Database
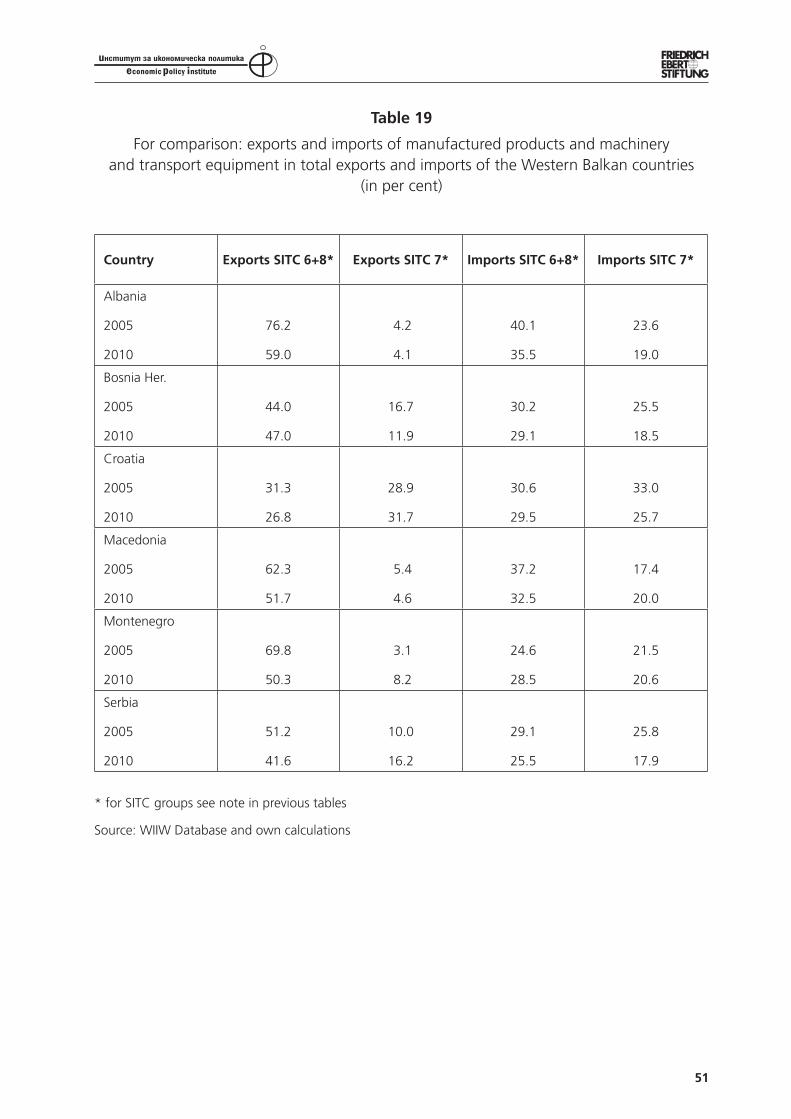
51
Table 19
For comparison: exports and imports of manufactured products and machinery and transport equipment in total exports and imports of the Western Balkan countries
(in per cent)
Country Exports SITC 6+8* Exports SITC 7* Imports SITC 6+8* Imports SITC 7*
Albania
2005
2010
76.2
59.0
4.2
4.1
40.1
35.5
23.6
19.0
Bosnia Her.
2005
2010
44.0
47.0
16.7
11.9
30.2
29.1
25.5
18.5
Croatia
2005
2010
31.3
26.8
28.9
31.7
30.6
29.5
33.0
25.7
Macedonia
2005
2010
62.3
51.7
5.4
4.6
37.2
32.5
17.4
20.0
Montenegro
2005
2010
69.8
50.3
3.1
8.2
24.6
28.5
21.5
20.6
Serbia
2005
2010
51.2
41.6
10.0
16.2
29.1
25.5
25.8
17.9
* for SITC groups see note in previous tables
Source: WIIW Database and own calculations
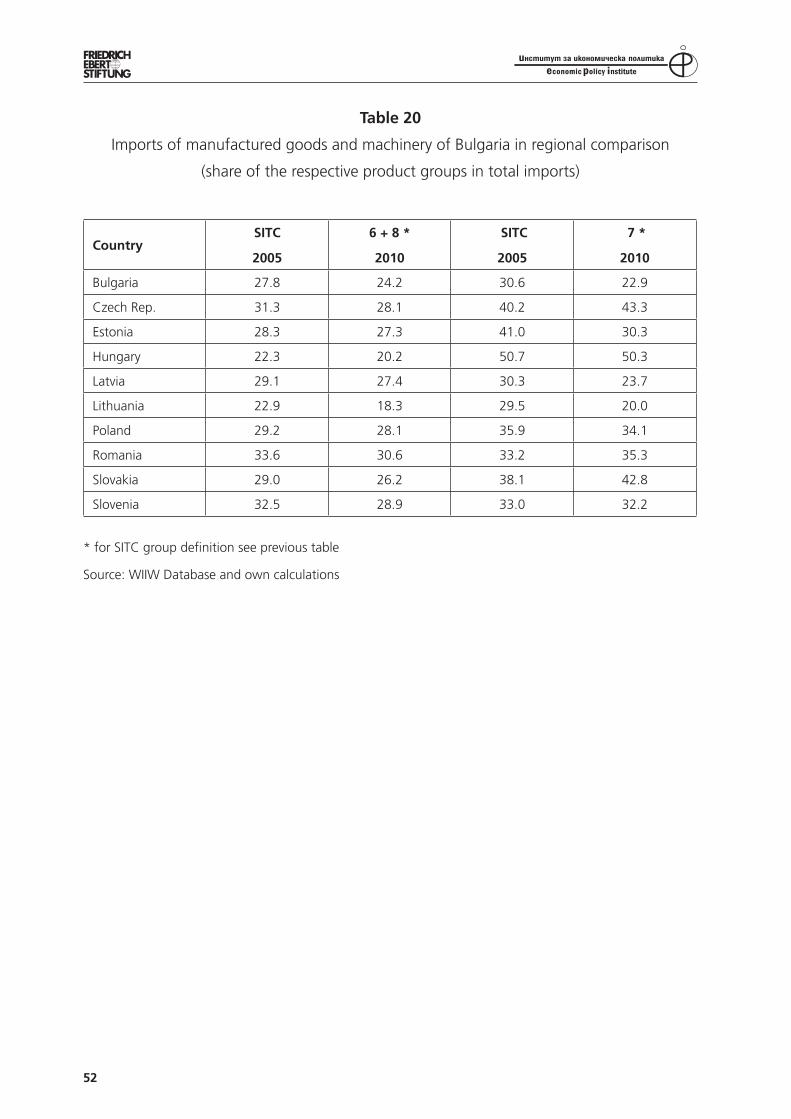
52
Table 20
Imports of manufactured goods and machinery of Bulgaria in regional comparison
(share of the respective product groups in total imports)
CountrySITC
2005
6 + 8 *
2010
SITC
2005
7 *
2010
Bulgaria 27.8 24.2 30.6 22.9
Czech Rep. 31.3 28.1 40.2 43.3
Estonia 28.3 27.3 41.0 30.3
Hungary 22.3 20.2 50.7 50.3
Latvia 29.1 27.4 30.3 23.7
Lithuania 22.9 18.3 29.5 20.0
Poland 29.2 28.1 35.9 34.1
Romania 33.6 30.6 33.2 35.3
Slovakia 29.0 26.2 38.1 42.8
Slovenia 32.5 28.9 33.0 32.2
* for SITC group definition see previous table
Source: WIIW Database and own calculations
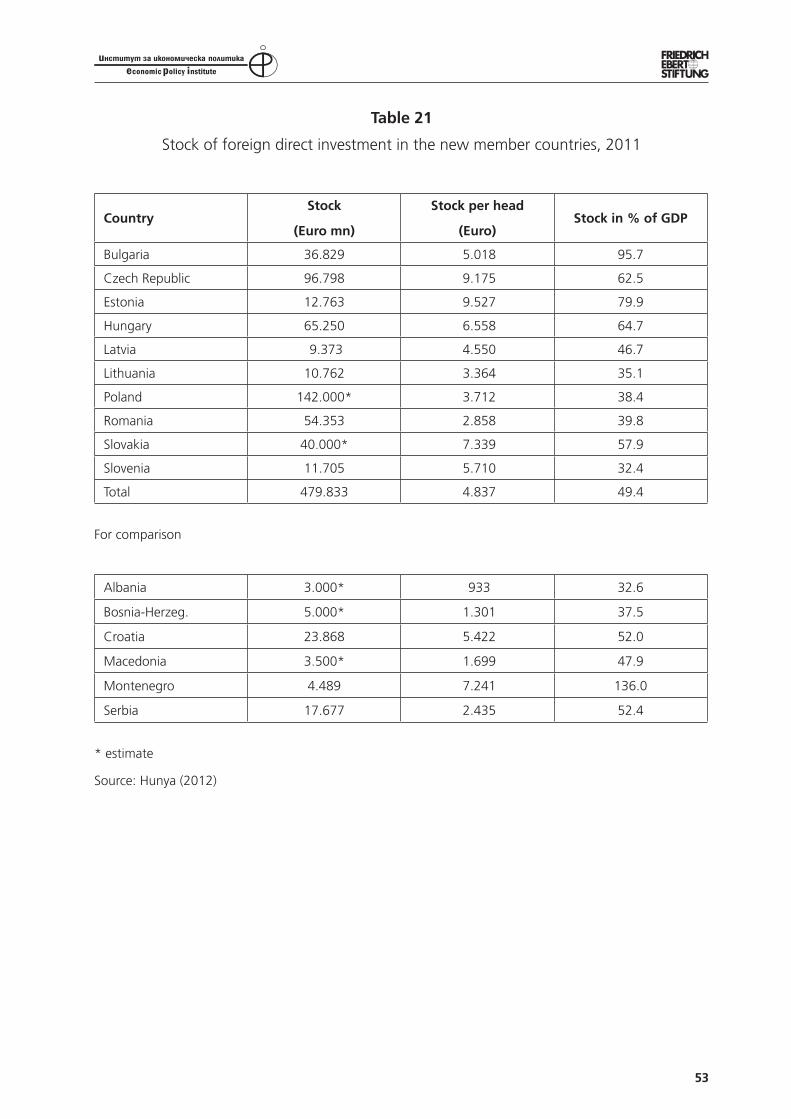
53
Table 21
Stock of foreign direct investment in the new member countries, 2011
CountryStock
(Euro mn)
Stock per head
(Euro)Stock in % of GDP
Bulgaria 36.829 5.018 95.7
Czech Republic 96.798 9.175 62.5
Estonia 12.763 9.527 79.9
Hungary 65.250 6.558 64.7
Latvia 9.373 4.550 46.7
Lithuania 10.762 3.364 35.1
Poland 142.000* 3.712 38.4
Romania 54.353 2.858 39.8
Slovakia 40.000* 7.339 57.9
Slovenia 11.705 5.710 32.4
Total 479.833 4.837 49.4
For comparison
Albania 3.000* 933 32.6
Bosnia-Herzeg. 5.000* 1.301 37.5
Croatia 23.868 5.422 52.0
Macedonia 3.500* 1.699 47.9
Montenegro 4.489 7.241 136.0
Serbia 17.677 2.435 52.4
* estimate
Source: Hunya (2012)
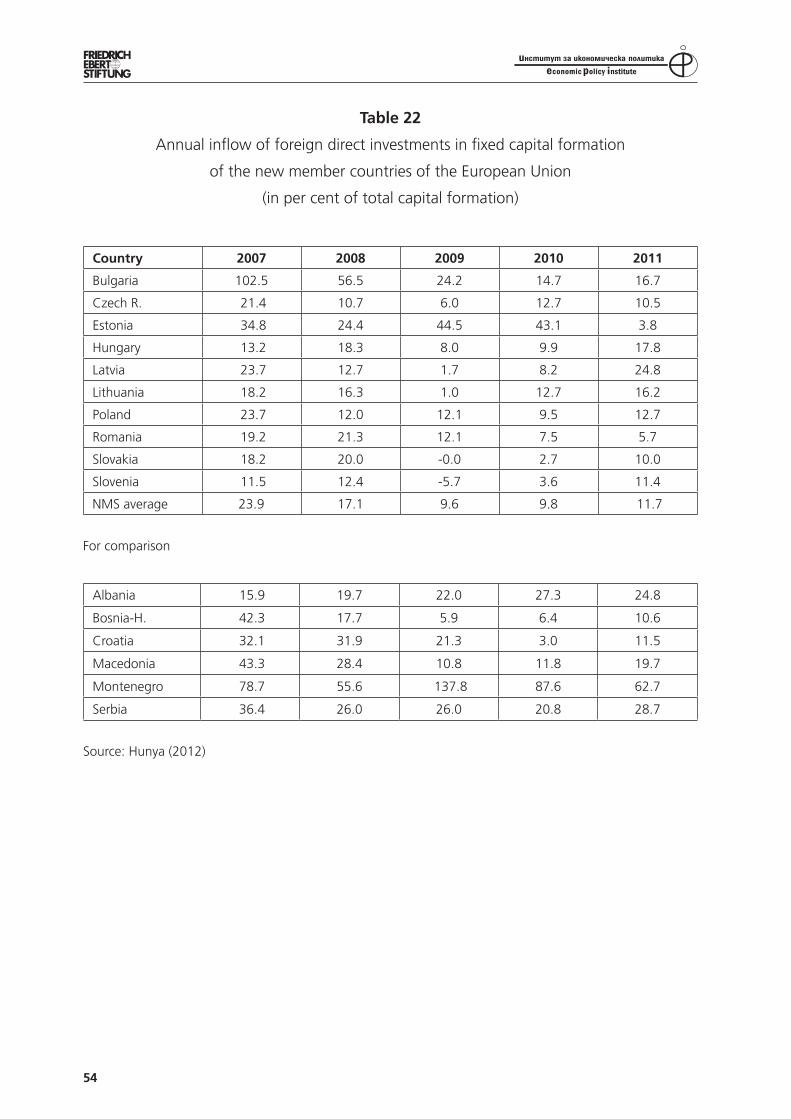
54
Table 22
Annual inflow of foreign direct investments in fixed capital formation
of the new member countries of the European Union
(in per cent of total capital formation)
Country 2007 2008 2009 2010 2011
Bulgaria 102.5 56.5 24.2 14.7 16.7
Czech R. 21.4 10.7 6.0 12.7 10.5
Estonia 34.8 24.4 44.5 43.1 3.8
Hungary 13.2 18.3 8.0 9.9 17.8
Latvia 23.7 12.7 1.7 8.2 24.8
Lithuania 18.2 16.3 1.0 12.7 16.2
Poland 23.7 12.0 12.1 9.5 12.7
Romania 19.2 21.3 12.1 7.5 5.7
Slovakia 18.2 20.0 -0.0 2.7 10.0
Slovenia 11.5 12.4 -5.7 3.6 11.4
NMS average 23.9 17.1 9.6 9.8 11.7
For comparison
Albania 15.9 19.7 22.0 27.3 24.8
Bosnia-H. 42.3 17.7 5.9 6.4 10.6
Croatia 32.1 31.9 21.3 3.0 11.5
Macedonia 43.3 28.4 10.8 11.8 19.7
Montenegro 78.7 55.6 137.8 87.6 62.7
Serbia 36.4 26.0 26.0 20.8 28.7
Source: Hunya (2012)
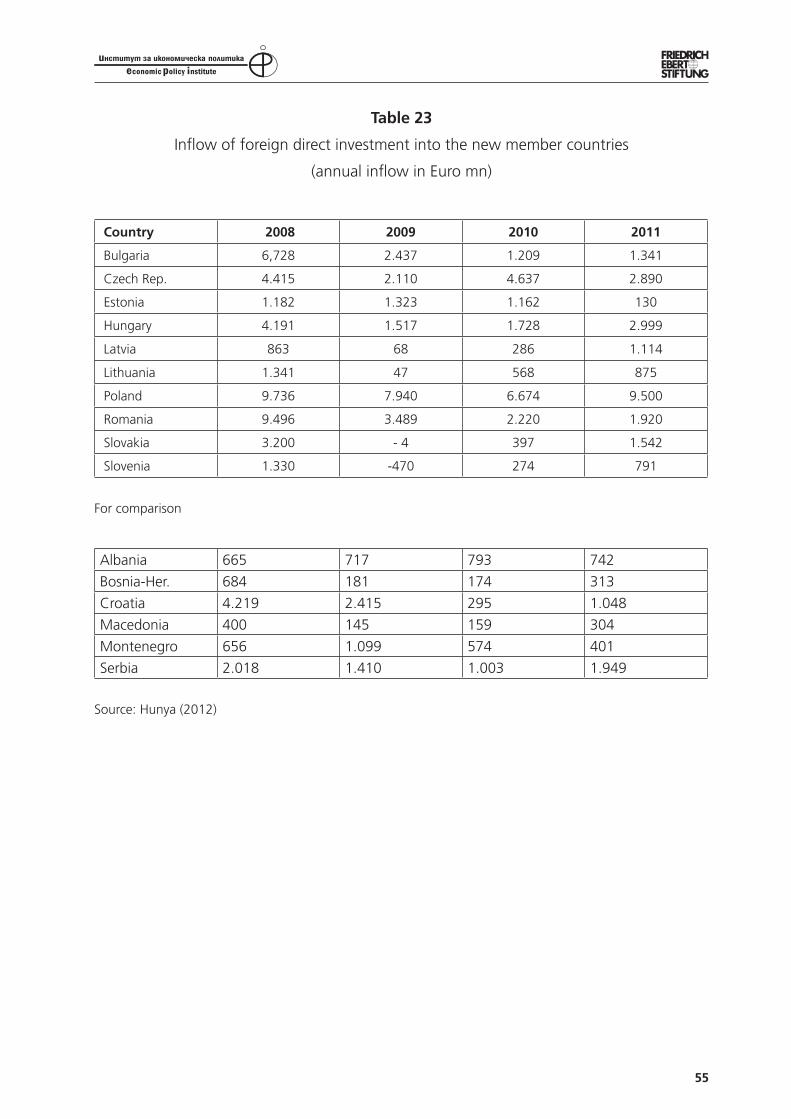
55
Table 23
Inflow of foreign direct investment into the new member countries
(annual inflow in Euro mn)
Country 2008 2009 2010 2011
Bulgaria 6,728 2.437 1.209 1.341
Czech Rep. 4.415 2.110 4.637 2.890
Estonia 1.182 1.323 1.162 130
Hungary 4.191 1.517 1.728 2.999
Latvia 863 68 286 1.114
Lithuania 1.341 47 568 875
Poland 9.736 7.940 6.674 9.500
Romania 9.496 3.489 2.220 1.920
Slovakia 3.200 - 4 397 1.542
Slovenia 1.330 -470 274 791
For comparison
Albania 665 717 793 742
Bosnia-Her. 684 181 174 313
Croatia 4.219 2.415 295 1.048
Macedonia 400 145 159 304
Montenegro 656 1.099 574 401
Serbia 2.018 1.410 1.003 1.949
Source: Hunya (2012)
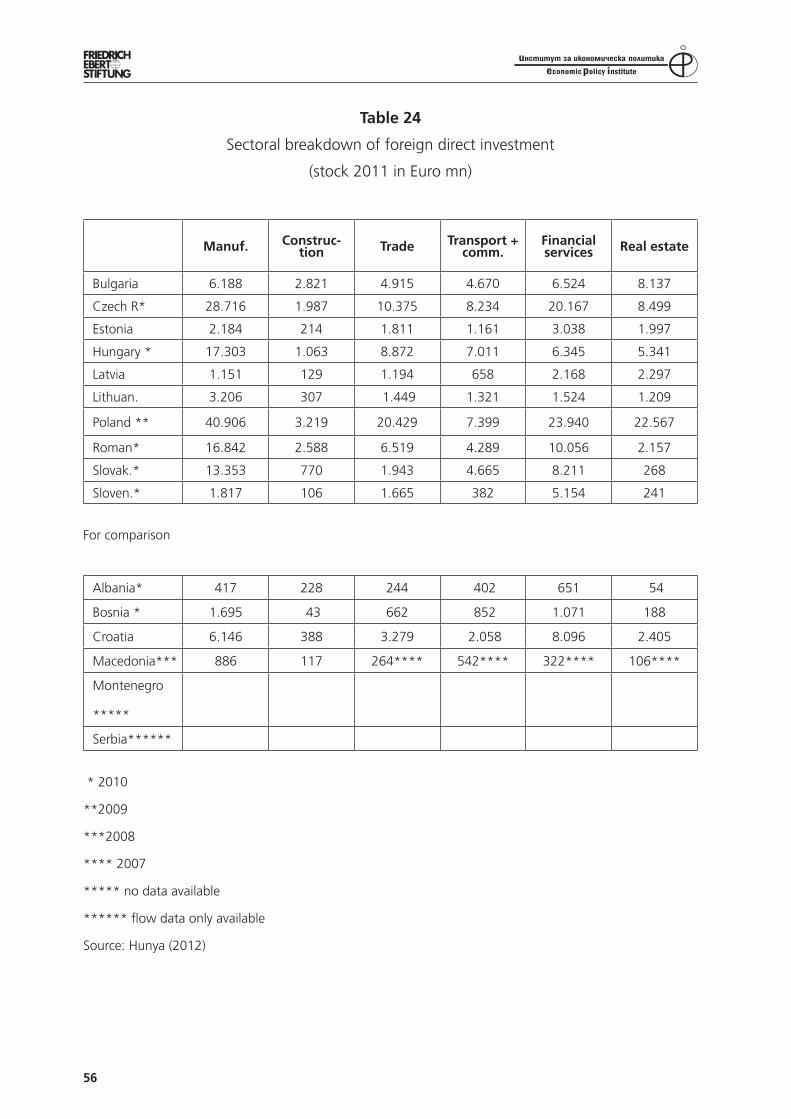
56
Table 24
Sectoral breakdown of foreign direct investment
(stock 2011 in Euro mn)
Manuf. Construc-tion Trade Transport +
comm.Financial services Real estate
Bulgaria 6.188 2.821 4.915 4.670 6.524 8.137
Czech R* 28.716 1.987 10.375 8.234 20.167 8.499
Estonia 2.184 214 1.811 1.161 3.038 1.997
Hungary * 17.303 1.063 8.872 7.011 6.345 5.341
Latvia 1.151 129 1.194 658 2.168 2.297
Lithuan. 3.206 307 1.449 1.321 1.524 1.209
Poland ** 40.906 3.219 20.429 7.399 23.940 22.567
Roman* 16.842 2.588 6.519 4.289 10.056 2.157
Slovak.* 13.353 770 1.943 4.665 8.211 268
Sloven.* 1.817 106 1.665 382 5.154 241
For comparison
Albania* 417 228 244 402 651 54
Bosnia * 1.695 43 662 852 1.071 188
Croatia 6.146 388 3.279 2.058 8.096 2.405
Macedonia*** 886 117 264**** 542**** 322**** 106****
Montenegro
*****
Serbia******
* 2010
**2009
***2008
**** 2007
***** no data available
****** flow data only available
Source: Hunya (2012)
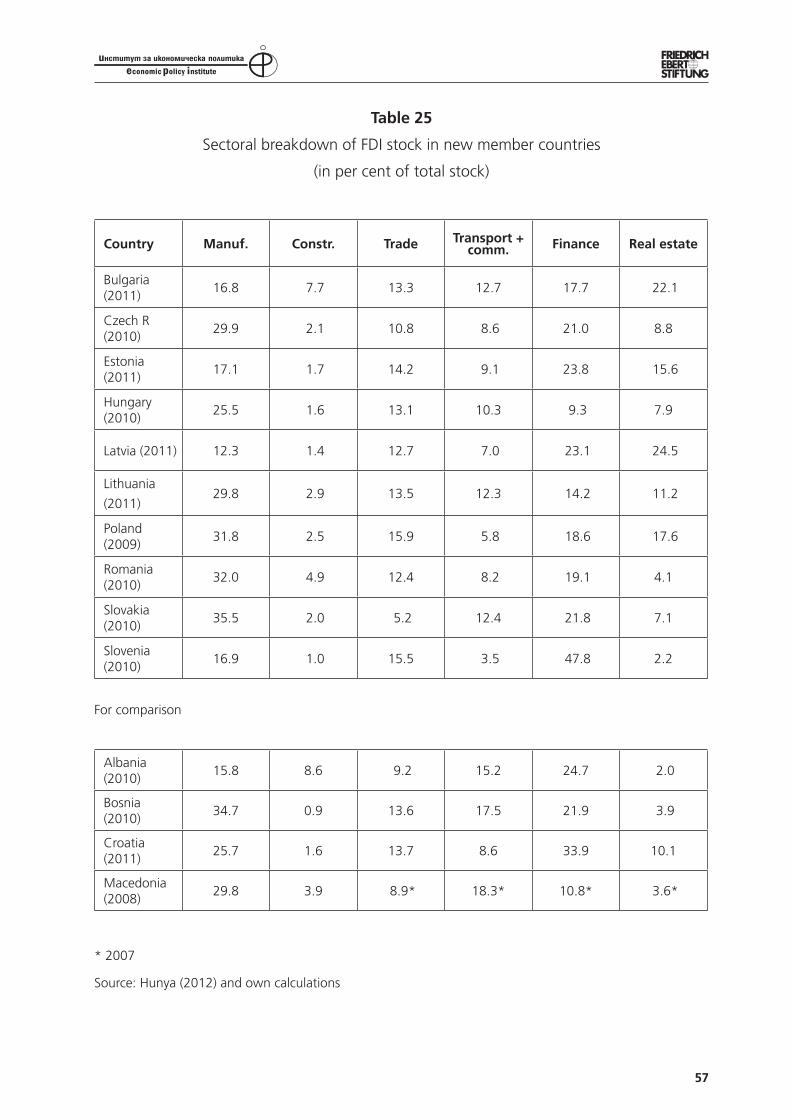
57
Table 25
Sectoral breakdown of FDI stock in new member countries
(in per cent of total stock)
Country Manuf. Constr. Trade Transport + comm. Finance Real estate
Bulgaria (2011)
16.8 7.7 13.3 12.7 17.7 22.1
Czech R (2010)
29.9 2.1 10.8 8.6 21.0 8.8
Estonia (2011)
17.1 1.7 14.2 9.1 23.8 15.6
Hungary (2010)
25.5 1.6 13.1 10.3 9.3 7.9
Latvia (2011) 12.3 1.4 12.7 7.0 23.1 24.5
Lithuania
(2011)29.8 2.9 13.5 12.3 14.2 11.2
Poland (2009)
31.8 2.5 15.9 5.8 18.6 17.6
Romania (2010)
32.0 4.9 12.4 8.2 19.1 4.1
Slovakia (2010)
35.5 2.0 5.2 12.4 21.8 7.1
Slovenia (2010)
16.9 1.0 15.5 3.5 47.8 2.2
For comparison
Albania (2010)
15.8 8.6 9.2 15.2 24.7 2.0
Bosnia (2010)
34.7 0.9 13.6 17.5 21.9 3.9
Croatia (2011)
25.7 1.6 13.7 8.6 33.9 10.1
Macedonia (2008)
29.8 3.9 8.9* 18.3* 10.8* 3.6*
* 2007
Source: Hunya (2012) and own calculations
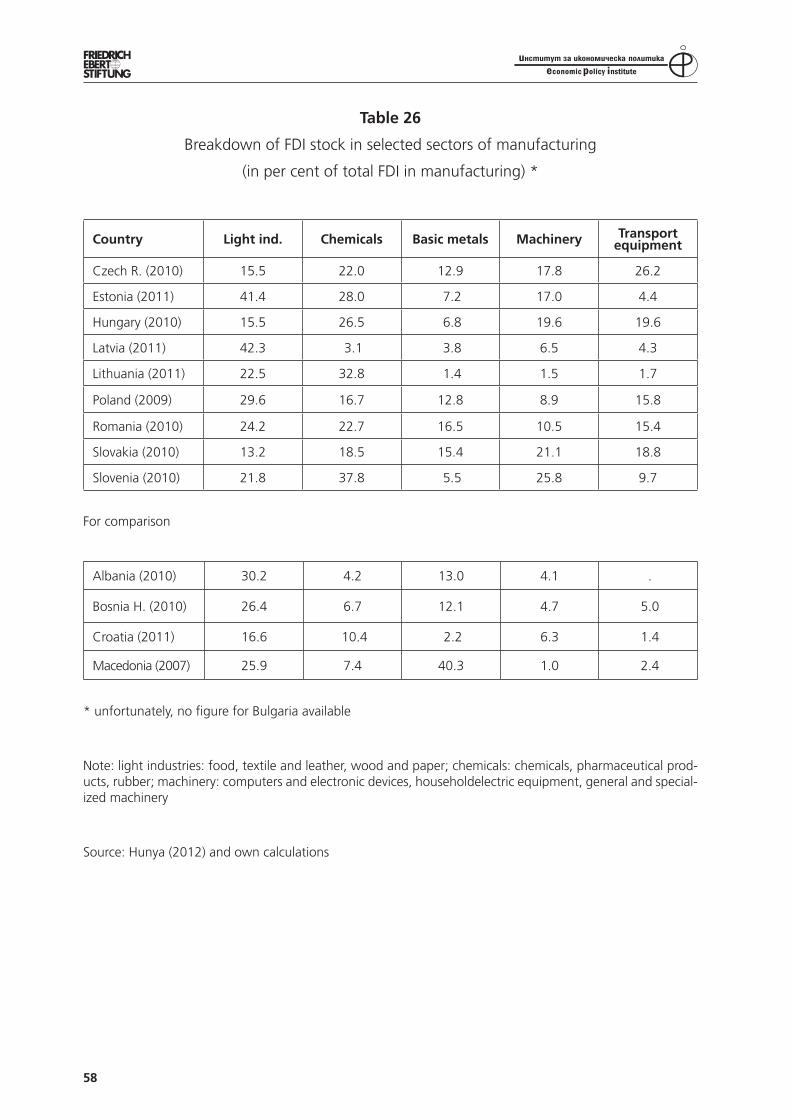
58
Table 26
Breakdown of FDI stock in selected sectors of manufacturing
(in per cent of total FDI in manufacturing) *
Country Light ind. Chemicals Basic metals Machinery Transport equipment
Czech R. (2010) 15.5 22.0 12.9 17.8 26.2
Estonia (2011) 41.4 28.0 7.2 17.0 4.4
Hungary (2010) 15.5 26.5 6.8 19.6 19.6
Latvia (2011) 42.3 3.1 3.8 6.5 4.3
Lithuania (2011) 22.5 32.8 1.4 1.5 1.7
Poland (2009) 29.6 16.7 12.8 8.9 15.8
Romania (2010) 24.2 22.7 16.5 10.5 15.4
Slovakia (2010) 13.2 18.5 15.4 21.1 18.8
Slovenia (2010) 21.8 37.8 5.5 25.8 9.7
For comparison
Albania (2010) 30.2 4.2 13.0 4.1 .
Bosnia H. (2010) 26.4 6.7 12.1 4.7 5.0
Croatia (2011) 16.6 10.4 2.2 6.3 1.4
Macedonia (2007) 25.9 7.4 40.3 1.0 2.4
* unfortunately, no figure for Bulgaria available
Note: light industries: food, textile and leather, wood and paper; chemicals: chemicals, pharmaceutical prod-ucts, rubber; machinery: computers and electronic devices, householdelectric equipment, general and special-ized machinery
Source: Hunya (2012) and own calculations
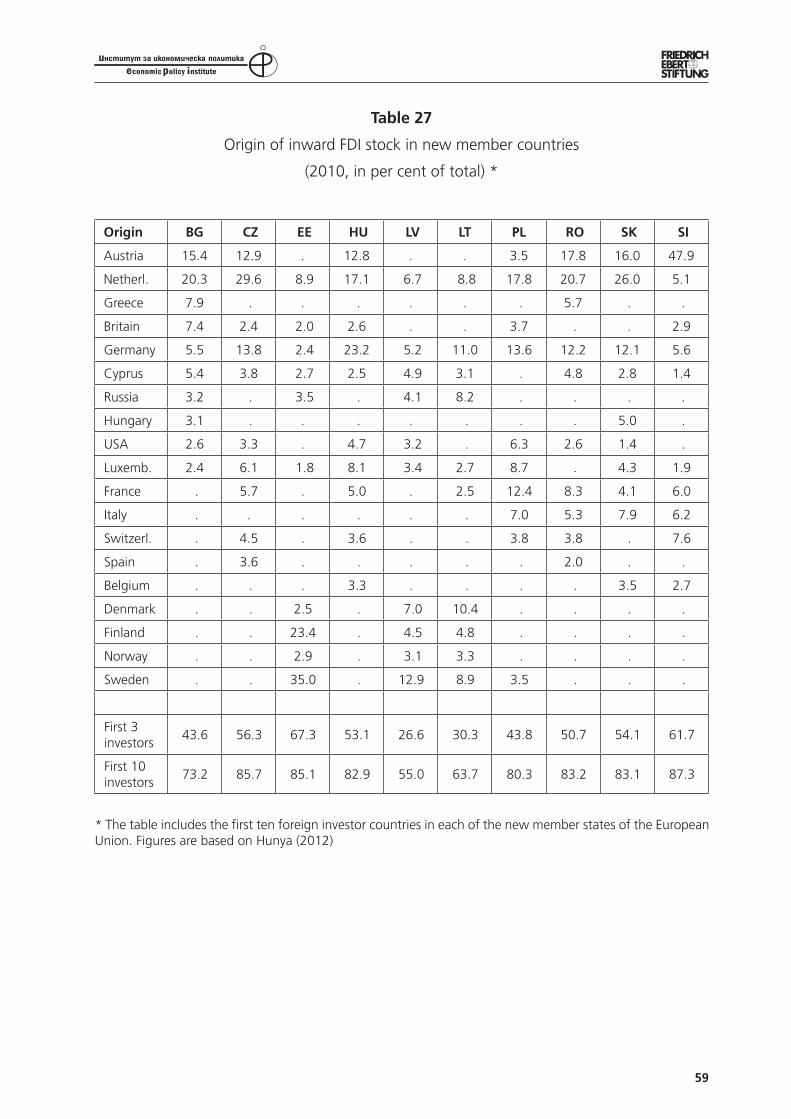
59
Table 27
Origin of inward FDI stock in new member countries
(2010, in per cent of total) *
Origin BG CZ EE HU LV LT PL RO SK SI
Austria 15.4 12.9 . 12.8 . . 3.5 17.8 16.0 47.9
Netherl. 20.3 29.6 8.9 17.1 6.7 8.8 17.8 20.7 26.0 5.1
Greece 7.9 . . . . . . 5.7 . .
Britain 7.4 2.4 2.0 2.6 . . 3.7 . . 2.9
Germany 5.5 13.8 2.4 23.2 5.2 11.0 13.6 12.2 12.1 5.6
Cyprus 5.4 3.8 2.7 2.5 4.9 3.1 . 4.8 2.8 1.4
Russia 3.2 . 3.5 . 4.1 8.2 . . . .
Hungary 3.1 . . . . . . . 5.0 .
USA 2.6 3.3 . 4.7 3.2 . 6.3 2.6 1.4 .
Luxemb. 2.4 6.1 1.8 8.1 3.4 2.7 8.7 . 4.3 1.9
France . 5.7 . 5.0 . 2.5 12.4 8.3 4.1 6.0
Italy . . . . . . 7.0 5.3 7.9 6.2
Switzerl. . 4.5 . 3.6 . . 3.8 3.8 . 7.6
Spain . 3.6 . . . . . 2.0 . .
Belgium . . . 3.3 . . . . 3.5 2.7
Denmark . . 2.5 . 7.0 10.4 . . . .
Finland . . 23.4 . 4.5 4.8 . . . .
Norway . . 2.9 . 3.1 3.3 . . . .
Sweden . . 35.0 . 12.9 8.9 3.5 . . .
First 3 investors
43.6 56.3 67.3 53.1 26.6 30.3 43.8 50.7 54.1 61.7
First 10 investors
73.2 85.7 85.1 82.9 55.0 63.7 80.3 83.2 83.1 87.3
* The table includes the first ten foreign investor countries in each of the new member states of the European Union. Figures are based on Hunya (2012)
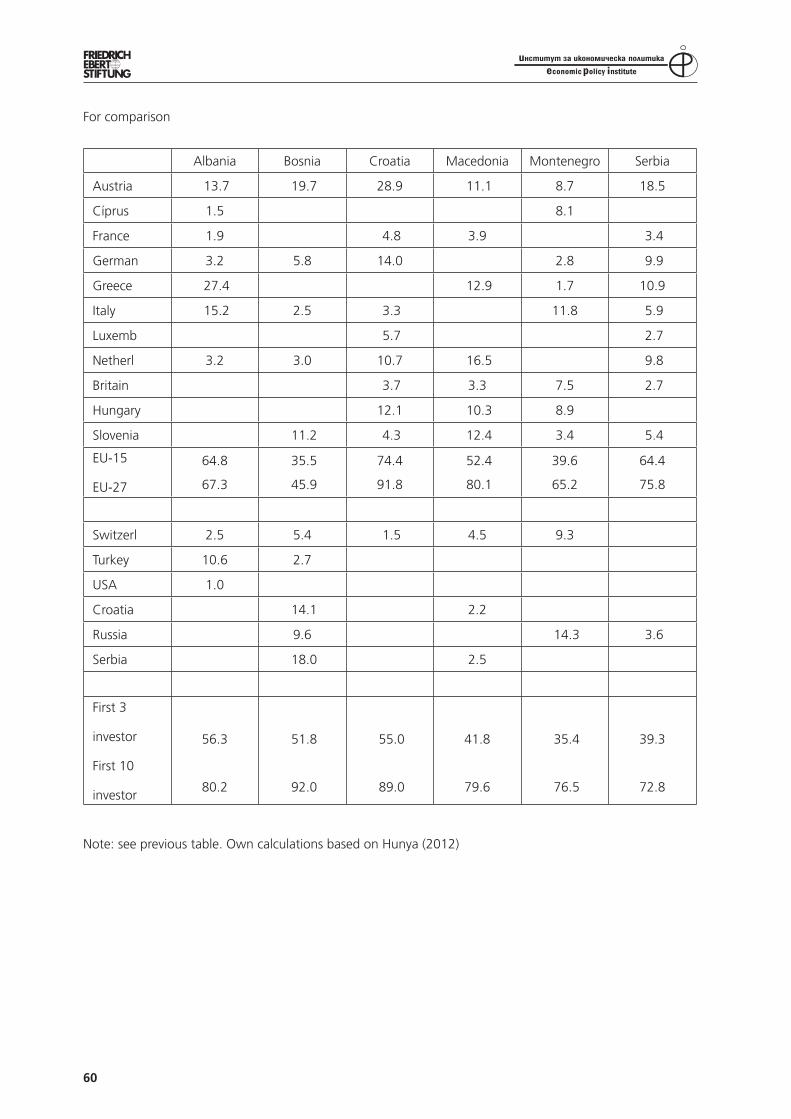
60
For comparison
Albania Bosnia Croatia Macedonia Montenegro Serbia
Austria 13.7 19.7 28.9 11.1 8.7 18.5
Cíprus 1.5 8.1
France 1.9 4.8 3.9 3.4
German 3.2 5.8 14.0 2.8 9.9
Greece 27.4 12.9 1.7 10.9
Italy 15.2 2.5 3.3 11.8 5.9
Luxemb 5.7 2.7
Netherl 3.2 3.0 10.7 16.5 9.8
Britain 3.7 3.3 7.5 2.7
Hungary 12.1 10.3 8.9
Slovenia 11.2 4.3 12.4 3.4 5.4
EU-15
EU-27
64.8
67.3
35.5
45.9
74.4
91.8
52.4
80.1
39.6
65.2
64.4
75.8
Switzerl 2.5 5.4 1.5 4.5 9.3
Turkey 10.6 2.7
USA 1.0
Croatia 14.1 2.2
Russia 9.6 14.3 3.6
Serbia 18.0 2.5
First 3
investor
First 10
investor
56.3
80.2
51.8
92.0
55.0
89.0
41.8
79.6
35.4
76.5
39.3
72.8
Note: see previous table. Own calculations based on Hunya (2012)

Sustainable Growth Based on Export-Oriented Economic Strategy The Bulgarian Case in an International Comparison
Prof. András Inotai
ImprintFriedrich-Ebert-StiftungOffice Bulgaria97, Knjaz Boris I St.1000 Sofia, BulgariaResponsible:Regine Schubert, Director
OrdersEconomicPolicy InstituteYasen Georgiev
e-mail: [email protected]: (+359 2) 9522693
All texts are available onlinewww.fes.bg The views expressed in this publicationare not necessarily those of theFriedrich-Ebert-Stiftung or of theorganization for which the author works.
This paper aims at identifying the strengths and weaknesses of the Bulgarian economy’s transformation to a more dynamic and export-oriented growth model. By referring to two groups of countries – Central European EU member states as well as the Western Balkans, the study puts an emphasis on the impact the EU membership and the 2009 crisis year have on the Bulgarian foreign trade and export performance in particular.
The first chapter gathers arguments in favour of the export-oriented growth model but also addresses potential risk factors of such long-term policy. Despite some drawbacks as increasing vulnerability and de-pendence on external factors, this development path is justified as the better way for achieving sustainable economic growth of small economies like Bulgaria.
The second chapter deals with the global financial crisis and its influence on the exports and foreign trade in general. Then, the author focuses on Bulgaria’s export performance in the EU and on a regional compari-son by stressing on the role of foreign direct investments in the export orientation of the country.
Finally, the paper concludes by summarizing measures and instruments for catching-up export-driven economic development and by formulating policy recommendations supporting the successful implementa-tion of such an export-led growth model.
April 2013
ECONOMIC
POLICY
ANALYSES