Embed Size (px)
Citation preview
Study on identification of export oriented integrated infrastructure for agri products from Karnataka & Tamil Nadu APEDA (Agriculture Produce Export Development Authority)
17 June 2015

APEDA
Study on identification of export oriented integrated infrastructure for agri products from Karnataka
& Tamil Nadu - APEDA (Agriculture Produce Export Development Authority)
PwC 2
Table of contents
1. Introduction 5
1.1. Background 5
1.2. Need of Study 6
1.3. Objectives 7
1.4. Scope of the assignment 7
2. Current Scenario of Agricultural Export from India 8
2.1. Demand for agricultural products at international level 8
2.2. Trend analysis of agricultural export from past data (5 or 10 years) 8
2.3. Major commodities exported 11
2.4. Major importing countries / Major markets 11
2.5. Major origins / states producing export quality products 14
3. Identification of crop clusters and surplus availability for exports from Karnataka 16
3.1. Methodology adopted for identification of the potential/focus crop 16
3.2. Crop wise identification of the cluster and surplus available in Karnataka 16
3.2.1. Grapes 16
3.2.2. Pomegranate 21
3.2.3. Papaya 24
3.2.4. Assorted Vegetables and Fruits 26
3.2.5. Tomato 27
3.2.6. Cucumbers/Gherkins 31
3.2.7. Pineapple 33
3.2.8. Floriculture 35
3.2.9. Mango Pulp 39
3.2.10. Other Processing Opportunity 40
3.2.11. Summary of Infrastructure required in Karnataka 42
3.2.12. Initial Basic Feasibility of the Infrastructure proposed 46
4. Identification of crop clusters and surplus availability for exports from Tamil Nadu 52
4.1. Methodology adopted for crop identification 52
4.2. Methodology adopted to calculate surplus available for export 52
4.3. Crop wise identification of the cluster and surplus available in Tamil Nadu 53
4.3.1. Banana in Tamil Nadu 53
4.3.2. Eggs in Tamil Nadu 58
4.3.3. Chicken Meat in Tamil Nadu 62

APEDA
Study on identification of export oriented integrated infrastructure for agri products from Karnataka
& Tamil Nadu - APEDA (Agriculture Produce Export Development Authority)
PwC 3
4.3.4. Maize and Tapioca in Tamil Nadu 66
4.3.5. Other Vegetables in Tamil Nadu 71
4.3.6. Summary of Infrastructure required in Tamil Nadu 75
4.3.7. Initial Basic Feasibility of the Infrastructure proposed 78
5. Assessment of Exit Point Infrastructure 82
5.1. Exit point Infrastructure 82
5.1.2. Comparative Assessment of Infrastructure available at Major Ports 85
5.1.3. Key Inferences 94
6. Summary 98
Appendix 1 A - Crop Data 101
Appendix 1 A.A - Export Growth Projections 101
Appendix 1 A.A.A - fruits and fruit products 101
Appendix 1 A.A.A - Other Commodities 103
Appendix 1 A.A - Annexure for Banana 105
Appendix 1 A.A - Annexure for Chicken Meat 106
Appendix 1 A.A - Annexure for Egg 107
Appendix 1 A.A - Annexure for Maize 108
Appendix 1 A.A - Annexure for Tapioca 109
Appendix 1 A.A - State wise details of existing infrastructure 110
Appendix 1 A.A.G - State wise list of warehouses 110
Appendix 1 A.A.G - State wise list of cold storage units 123
Appendix 1 A.A.G - State wise list of ICDs & CFSs 134
Appendix 1 B - Exit Point Infrastructure 142
Appendix 1 B.B.A - Commodity Wise Port Wise Provisional Capacities Of Major Ports (as on 31.12.2014) 142
Appendix 1 B.B.A - Details of export of agri commodities from Major seaports 146
Appendix 1 B.B.A - Details of export of agri commodities from Major airports 159
Appendix 1 C - Questionnaire 165
Appendix 1 D - Respondents 174
Appendix 1 D.D - Exporters 174
Appendix 1 D.D - Other respondents 175
Appendix 1 E - Renewable Energy 177
Appendix 1 E.E - Introduction 177
Appendix 1 E.E - Greenhouse Ventilation 177
Appendix 1 E.E - Greenhouse heating 178

APEDA
Study on identification of export oriented integrated infrastructure for agri products from Karnataka
& Tamil Nadu - APEDA (Agriculture Produce Export Development Authority)
PwC 4
Appendix 1 E.E.C - Scoping solar PV/gasifier systems 178
Appendix 1 E.E.C - Scope of Services: 180
Disclaimer 187

APEDA
Study on identification of export oriented integrated infrastructure for agri products from Karnataka
& Tamil Nadu - APEDA (Agriculture Produce Export Development Authority)
PwC 5
1. Introduction
1.1. Background
Agriculture is the backbone of Indian economy and provides employment to a large majority of Indian
work force. The nation has a vast potential in contributing to international food trade on the account of
its cultural dependence on agriculture and the agro climatic variety that gives rise to a large food basket
suitable for international trade and earning foreign exchange for Indian economy. India has an edge in
production of a number of food commodities such as cereals, milk, buffalo meat, fruits such as mango,
banana, guava and papaya, vegetables and fish. Despite large production volumes and huge potential in
strategic development role in Indian economy through processing, majority of the production is
consumed in the domestic market with low levels of processing and export. Food processing links the
largely unorganized Indian agriculture sector and industry. In India, the sector is in nascent stage and
contributes only 1.49% to national GDP. Optimizing the production, processing and enabling them to
work in tandem, is bound to boost Indian economy and the farming community alike. To accelerate the
both aspects of the supply chain synergistically, strategic investment is required in the infrastructure
pertaining to transportation, storage, processing and export. In the current scenario, upgradation of
availability and quality of food processing and export infrastructure complimenting the endeavors in
market development for food export demands the most attention.
Agricultural and processed Food Products Export (APEDA) is the leading government body to augment
the agri production and its suitability to meet food processing and export requirements by providing
technical and financial assistance to the stakeholders in agri value chain from production to export. The
current study fits in the scope of APEDA to outline the production potential and catchment areas of
suitable agricultural produce, and to identify the gaps in export oriented infrastructure of food and the
potential role of various stakeholders in the value chain for upgrading the infrastructure, process and
creating a momentum in the nation’s food export. The following table gives a snapshot of the status of
various food processing industry segments in India and the underlying opportunities:
Table 1: Market overview and opportunities
Segment Market Overview Opportunities
Meat & Poultry
The segment is dominated by unorganized
Only 1-2% of the raw meat undergoes value addition
Most of the raw meat meets domestic consumption in raw form
Eggs and broilers show a growth rate of 16% and 20% respectively
Fruits and
Vegetables
Equally divided between organized and unorganized sector
Organized sector dominates juices and pulp products while unorganized sector deals in pickles and sauces
World’s 2nd largest production
Current processing level of around 10%
High suitability for export

APEDA
Study on identification of export oriented integrated infrastructure for agri products from Karnataka
& Tamil Nadu - APEDA (Agriculture Produce Export Development Authority)
PwC 6
Segment Market Overview Opportunities
Dairy Segment dominated by unorganized sector
Cooperatives are the major players
A few FMCG brands have focus in the segment
India is the leading producer in the world
Large production base
Fish Small scale unorganized sector is dominant
Third largest producer globally
Second largest inland fish production globally
Very high export potential
Cereals/ grains
market controlled by
the unorganized sector
High scope of technological upgradation
Self-sufficiency in production
1.2. Need of Study
Despite a strong position in production of agri commodities, Indian contribution in the global food trade is limited to 1.5% which is drastically low as compared to the respective share in the production. Despite government’s sustained efforts to enhance production through a spectrum of assistance schemes and programmes, implementation of these schemes has to be orchestrated with a strong focus on channelizing the production through creation of supporting infrastructure and optimizing the value chain that terminates in the domestic and overseas markets for processed food. There are a number of limiting factors that afflict Indian food export scenario such as:
Lack of market oriented production
Inadequate backward linkages
Lack of implementation of global food quality and safety management systems
Predominance of unorganized sector in the sector
Capital intensive nature of the sector
Inadequate post-harvest handling and processing infrastructure and low economies of scale
High cost of transportation and low quality resulting in the loss of volume and quality of perishables
Instability in the commodity prices and unpredictable market forces
To address the above challenges and optimizing the utilization of production surplus for foreign exchange, following thematic areas need to have a critical focus:
Promoting Public-Private Partnerships for infrastructure creation, introducing suitable processing and logistical technology and upgrading the current supporting infrastructure.
Developing a dynamic cold chain and transportation system with focus on air-conditioned cargo, and refrigerators/ insulated containers for perishables, processed products to minimize post-harvest losses at transportation stage and at retail level.
Providing financial incentives for creation of facilities for procurement of commodities, sorting, grading and transportation of agri produce to markets and processing facilities.

APEDA
Study on identification of export oriented integrated infrastructure for agri products from Karnataka
& Tamil Nadu - APEDA (Agriculture Produce Export Development Authority)
PwC 7
To take impactful initiatives, the existing infrastructure and process flow in the agri supply chain has to be evaluated. This would help in identifying the enablers and inhibitors of agri export from India. In addition to these factors, importance of the current study is also heightened by growing competition from other countries in the global food trade.
1.3. Objectives
The current study was carried out keeping in view the following objectives as per the terms of reference of the assignment:
A study of the currently available infrastructure in the states of Karnataka and Tamil Nadu Identifying the gaps in the above mentioned infrastructure facilities for enabling higher exports.
State-wise assessment of the availability, performance and utilization of existing infrastructure associated with agricultural export.
Assessment of the key commodities suitable for export and their availability.
Identifying the possible areas for PPP approach for infrastructure and technology upgradation.
Formulating recommendations based on the study.
1.4. Scope of the assignment
For meeting the objectives stated as per the terms of reference under the assignment, an in depth study has been conducting assimilating the data from secondary sources in the public domain and our interactions with the stakeholders in the agri export value chain such exporters, state government officials of Karnataka and Tamil Nadu, Officials of exporter associations and local officials of APEDA. Following areas of study have been scoped out under the assignment:
Cold chain system, pre and post-harvest handling facilities, storage and processing facilities and the infrastructure facilitating value addition of the agricultural commodities in Karnataka and Tamil Nadu.
Identifying the sea ports, ICD’s, warehouses, distribution centers, quality testing infrastructure and CPC’s at airport etc.
Study of the commodities suitable for export from the two states (raw, semi processed & processed), their statewise availability and surplus volumes available for processing, value addition and export.
Assessment of infrastructure requirements specific to Karnataka and Tamil Nadu based on the production profile and the suitability of the currently available infrastructure thereof for implementing PPP model.
Statewise gap analysis of the available infrastructure to enhance export potential pertaining to the production clusters in the respective states out of the 17 clusters identified by APEDA.
Analysis of the available procurement infrastructure for cluster specific commodities and the gaps to be bridged in this regard.
Commodity wise analysis of the required infrastructure for boosting the export of products with production concentrated in Karnataka and Tamil Nadu such as certain grape varieties specific to Karnataka with potential for export.
Identification of the existing infrastructure in the export value chain of these region specific commodities suitable for implementation in PPP mode for export promotion.
Recommendations on operations and management of existing export oriented infrastructure based on gap analysis and specific agricultural commodities suitable for export produced therein.

APEDA
Study on identification of export oriented integrated infrastructure for agri products from Karnataka
& Tamil Nadu - APEDA (Agriculture Produce Export Development Authority)
PwC 8
2. Current Scenario of Agricultural Export from India
2.1. Demand for agricultural products at international level
For centuries countries have relied on trade in agricultural and food commodities to supplement and complement their domestic production. The uneven distribution of land resources and the influence of climatic zones on the ability to raise plants and animals have led to trade between and within continents. Historical patterns of settlement and colonization contributed to the definition of trade patterns and to the emergence of an infrastructure to support such trade. Changes in consumer taste have encouraged the emergence of global markets and added to the significance of trade. Few countries could survive the elimination of agricultural trade without a considerable drop in national income, and none could do so without considerable reduction in consumer choice and well-being.
In 2013, the agriculture trade performance was a reflection of the global economic context: many key players in agricultural trade displayed stagnant or lower exports and imports and though the demand in developing economies continued to grow it was at a slower pace. China is trying to keep up the domestic demand and it has become a major player both as an agricultural importer and exporter.
In 2013, the top 5 agricultural exporting nations were US, Brazil, China, European Union and Canada. The major traded agriculture commodities around the world includes fruits and vegetables, cereals and cereals preparation, meat and meat products, fish and marine products, coffee, tea, cocoa, spices and dairy products. The major agricultural products importing nations in the world include US, China, Japan, Russia, European Union and Canada.
Agriculture in India is the mainstay of the rural population of the country. Since independence India has made a lot of progress in agriculture in terms of growth in output, yields and area under crops. It has gone through a Green Revolution (food grains), a White Revolution (milk), a Yellow Revolution (oilseeds) and a Blue Revolution (aquaculture). Today, India is one of the largest producers of milk, fruits, cashew nuts, coconuts and tea in the world. It is also well known for the production of wheat, vegetables, sugar, fish, tobacco and rice.
Certain types of agriculture such as horticulture, organic farming, floriculture, genetic engineering, packaging and food processing have the potential to see a surge in revenues through exports. Over the past few years, the government has stressed on the development of horticulture and floriculture by creating vital infrastructure for cold storage, refrigerated transportation, packaging, processing and quality control. If India wishes to optimize the production and export potential of these commodities, then it is essential to improve these facilities, marketing and export networks much further.
India is a major exporter of commodities like apples, mangoes, grapes, onion, pomegranates, cut flowers, vegetables, processed fruits and vegetables, fishes, meat and meat products, eggs tea, tobacco etc. Apart from the above commodities India also import agricultural commodities like apples, edible oils, coconuts, marine products, meat products and dairy products.
2.2. Trend analysis of agricultural export from past data (5 or 10 years)
The exports of agricultural products around the world have increased by almost 6 per cent to US$ 1,745 billion in 2013, as compared to the previous year. The growth rate registered by global trade in agriculture is three times higher than the world average for all goods (2 per cent in 2013). Exports of food increased more markedly (6 per cent) than exports of non-food agricultural products (3 per cent) according to estimates by World Trade Organization.
Top six exporters of agricultural commodities in the world are European Union, USA, Brazil, China, Canada and India. India leads countries such as Indonesia, Argentina, Thailand and Australia. In 2013, India registered highest rate of growth in agriculture export with 11% rise as compared to previous year.

APEDA
Study on identification of export oriented integrated infrastructure for agri products from Karnataka
& Tamil Nadu - APEDA (Agriculture Produce Export Development Authority)
PwC 9
The following table figure gives an overview of the trend in global export volumes and major exporters of agricultural commodities for the year 2013.
Figure 1: Global Trend in Agriculture and Food Products
Figure 2: Major Exporter in the World (in Mn Tonnes)
Source: World trade Organization
Analysis of the time series data on Indian Export reveals an increasing share of agriculture in the total exports of the country. In the past five years, agricultural export has shown a CAGR of around 32% in terms of volumes exported. However the rate of growth in the value of agricultural export from the country has slowed down. The following figures provides a snapshot of the trend in agriculture and allied exports in terms of volumes exported, share of agriculture and allied products in Indian Export in terms of quantity, value and the rate of growth achieved in past 10 years:
3.103.51
4.26 4.284.53
0.000.501.001.502.002.503.003.504.004.505.00
2009 2010 2011 2012 2013
Export Value (Trillion USD)
56
6.5
14
1.8
82
.1
60
47
.1
37
.4
31.9
40
.894
.5
33
.8
8.6
10
.2
18
.5
9.5
10
.7
0.7
0
100
200
300
400
500
600
Europeanunion
USA brazil China Canada India Indonesia Argentina
Food Non Food

APEDA
Study on identification of export oriented integrated infrastructure for agri products from Karnataka
& Tamil Nadu - APEDA (Agriculture Produce Export Development Authority)
PwC 10
Figure 3: Agriculture Exports from India (in Mn Ton)
Source: APEDA Agri Exchange
Figure 4: Share of Agriculture and Allied Sector in Total Indian Export
Source: APEDA Agri Exchange
Figure 5: Growth in Agri and Allied Sector Export and CAGR
Source: Ministry of Finance, India
9.019.90
17.72
27.82
27.55
0.00
5.00
10.00
15.00
20.00
25.00
30.00
2009-10 2010-11 2011-12 2012-13 2013-14
Volume of Agri-Export (Mn Tons)
7.5 7.1
10.3
0
2
4
6
8
10
12
2004-05 2008-09 2013-14
Share (%)
23.326.5
19.9
0
5
10
15
20
25
30
2004-05 to 2008-09 2009-10 to 2013-14 2004-05 to 2013-14
CAGR

APEDA
Study on identification of export oriented integrated infrastructure for agri products from Karnataka
& Tamil Nadu - APEDA (Agriculture Produce Export Development Authority)
PwC 11
2.3. Major commodities exported
As per APEDA, in 2013-14 Indian agricultural export valued at around USD 39 bn 1 ( INR 2,35,988.86 crores) which shows a growth of around 16%. Rice lead the list of exported commodities with oil meals in the second place in terms of quantity exported. Other top commodities constituting the largest section of export from India are wheat, other cereals, basmati rice, sugar, fresh vegetables, buffalo meat, marine products and spices. . Share of processed fruits and vegetables has been drastically low in terms of share in total exports. . As per the data available from APEDA till November 2014, share of processed fruits, juices and processed vegetables was 2.3% of the total value of exports in the year 2014-15. The low share of processed agricultural products and perishable products such as fruits and vegetables simply states the need for upgrading the existing processing infrastructure in the country. The following table gives a comparative snapshot of key commodities exported by India:
Figure 6: Major Commodities Exported from India and their share in total agriculture exports from India
Source: APEDA
2.4. Major importing countries / Major markets
As per the information sourced from APEDA, export market for Indian agricultural commodities is currently constituted by 218 countries. In terms of quantities imported, Bangladesh occupies the leading position followed by Iran and Vietnam. The table given below enlists the major importing countries of Indian agricultural commodities with their percentage share in the quantity of total agricultural export from India and the major commodities exported to these countries:
1 Conversion done at the exchange rate of 1USD = INR 60
17
.69
%
16
.27
%
13
.79
%
11.4
7%
9.2
9%
6.1
3%
5.6
7%
3.3
8%
2.4
8%
2.2
2%
1.4
9%
1.3
5%
1.3
0%
1.2
6%
1.0
4%
0.8
6%
0.00%
2.00%
4.00%
6.00%
8.00%
10.00%
12.00%
14.00%
16.00%
18.00%
20.00%
Share in Export Quantity (%)

APEDA
Study on identification of export oriented integrated infrastructure for agri products from Karnataka
& Tamil Nadu - APEDA (Agriculture Produce Export Development Authority)
PwC 12
Table 2: Major Export markets of India along with the commodities exported
SN Country Share in the Exported
Quantity (%)
Major Commodities Exported
1 Bangladesh 11.12
Wheat, Non-Basmati Rice, Fresh Onions, Maize, Dairy Products, Cereal Preparations, Other Fresh Fruits, Other Fresh Vegetables, Miscellaneous Preparations, Fresh Grapes
2 Iran 8.33
Basmati Rice, Buffalo Meat, Non Basmati Rice, Other Cereals, Other Processed Fruits & Vegetables, Maize Groundnuts, Guar gum, Dairy Products, Miscellaneous Preparations
3 Vietnam 5.98
Buffalo Meat, Maize, Groundnuts, Wheat, Alcoholic Beverages, Fresh Onions, Walnuts, Poultry Products, Pulses, Albumin( Eggs & Milk)
4 Indonesia 5.39
Maize, Groundnuts, Wheat, Fresh Onions, Non Basmati Rice, Milled Products, Miscellaneous Preparations, Guar gum, Poultry Products, Cocoa Products
5 UAE 5.26
Basmati Rice, Wheat, Buffalo Meat, Non Basmati Rice, Alcoholic Beverages, Sheep/Goat Meat, Other Fresh Fruits, Fresh Onions, Dairy Products, Other Fresh Vegetables
6 Korea 5.10
Buffalo Meat, Maize, Fresh Onions, Groundnuts, Dairy Products, Wheat, Miscellaneous Preparations, Non Basmati Rice, Basmati Rice, Guar gum
7 Malaysia 4.05
Buffalo Meat, Maize, Fresh Onions, Groundnuts, Dairy Products, Wheat, Miscellaneous Preparations, Non Basmati Rice, Basmati Rice, Guar gum
8 Saudi Arab 3.81
Basmati Rice, Buffalo Meat, Non Basmati Rice, Other Processed Fruits & Vegetables, Wheat, Mango Pulp, Sheep/Goat Meat, Dairy Products, Other Fresh Vegetables, Miscellaneous Preparations
9 Pakistan 3.12
Other Fresh Vegetables, Pulses, Dairy Products, Fresh Onions, Other Cereals, Groundnuts, Fruits & Vegetables Seeds, Buffalo Meat, Cereal Preparations, Maize
10 Benin 2.91
Non Basmati Rice, Alcoholic Beverages, Jaggery & Confectionery, Basmati Rice, Cereal Preparations, Buffalo Meat, Cocoa Products, Dairy Products, Maize, Miscellaneous Preparations
11 Nepal 2.90
Non Basmati Rice, Maize, Cereal Preparations, Other Fresh Vegetables, Miscellaneous Preparations, Wheat, Other Fresh Fruits, Dairy Products, Fresh Onions, Jaggery & Confectionery
12 U S A 2.21 Guar gum, Basmati Rice, Casein, Natural Honey , Cereal Preparations, Miscellaneous Preparations,

APEDA
Study on identification of export oriented integrated infrastructure for agri products from Karnataka
& Tamil Nadu - APEDA (Agriculture Produce Export Development Authority)
PwC 13
SN Country Share in the Exported
Quantity (%)
Major Commodities Exported
Other Processed Fruits & Vegetables, Cucumber and Gherkins( Prepd. & Preserved), Non Basmati Rice, Cocoa Products
13 Thailand 1.92
Buffalo Meat, Groundnuts, Wheat, Fresh Grapes , Fresh Onions, Miscellaneous Preparations, Guar gum, Dairy Products, Maize, Fruits & Vegetables Seeds
Source: APEDA Agri Exchange

APEDA
Study on identification of export oriented integrated infrastructure for agri products from Karnataka
& Tamil Nadu - APEDA (Agriculture Produce Export Development Authority)
PwC 14
2.5. Major origins / states producing export quality products
India has a large production base and diverse agriculture commodities in the categories such as fruits
and vegetables. Based on secondary research we have enlisted major agricultural commodities and
their major centers of production. The data highlights the potential of various states in production of
fruits, vegetables, cereals and animal products.
Table 3: Major Production Centers in India
SN Category Commodity Major Producers
1 Fruits Apple Jammu & Kashmir, Himachal Pradesh, Uttarakhand
Grapes Maharashtra, Karnataka
Mango Andhra Pradesh, Uttar Pradesh, Karnataka, Bihar, Gujarat, Odisha, West Bengal
Banana Tamil Nadu, Gujarat, Maharashtra, Andhra Pradesh, Karnataka, Bihar, Madhya Pradesh
Citrus Andhra Pradesh, Madhya Pradesh, Punjab, Maharashtra, Rajasthan, Gujarat
Sapota Maharashtra, Gujarat, Karnataka, Tamil Nadu and Andhra Pradesh
Pomegranate Maharashtra, Karnataka and Gujarat
Papaya Andhra Pradesh, Gujarat, Maharashtra, Karnataka, Madhya Pradesh, West Bengal
Pineapple West Bengal, Assam, Tripura, Karnataka, Nagaland, Manipur
Gooseberry Madhya Pradesh, Uttar Pradesh, Tamil Nadu, Gujarat
2 Vegetables Onion Maharashtra, Madhya Pradesh, Karnataka, Andhra Pradesh, Bihar, Gujarat
Potato Uttar Pradesh, West Bengal, Bihar, Gujarat, Madhya Pradesh, Punjab
Tomato Andhra Pradesh, Karnataka, Madhya Pradesh, Odisha, Gujarat, Bihar, West Bengal, Maharashtra
Peas Uttar Pradesh, Madhya Pradesh, Jharkhand, Himachal Pradesh, Punjab
Brinjal West Bengal, Odisha, Andhra Pradesh, Gujarat, Bihar, Madhya Pradesh
Okra Andhra Pradesh, West Bengal, Bihar, Gujarat, Odisha, Jharkhand, Maharashtra, Tamil Nadu
Tapioca Tamil Nadu, Kerala, Andhra Pradesh, Karnataka
Drum Sticks Andhra Pradesh, Tamil Nadu, Karnataka, Kerala
Cabbage West Bengal, Odisha, Bihar, Gujarat, Assam, Madhya Pradesh, Jharkhand
Cauliflower West Bengal, Bihar, Madhya Pradesh, odisha, Gujarat, Haryana, Assam, Jharkhand
Cucumbers Andhra Pradesh, Karnataka
3 Other Agricultural Commodities
Cereals Rajasthan, Karnataka, Maharshtra, Andhra Pradesh, Uttar Pradesh, Madhya Pradesh, Gujarat, Tamil Nadu
Groundnut Gujarat, Tamil Nadu, Andhra Pradesh, Rajasthan, Karnataka, Maharashtra, Madhya pradesh
Sunflower Karnataka
Pulses Madhya pradesh, Uttar Pradesh, Rajasthan, Maharashtra, Andhra Pradesh, Karnataka

APEDA
Study on identification of export oriented integrated infrastructure for agri products from Karnataka
& Tamil Nadu - APEDA (Agriculture Produce Export Development Authority)
PwC 15
SN Category Commodity Major Producers
Rice West Bengal, Uttar Pradesh, Andhra Pradesh, Punjab, Bihar, Tamil Nadu, Chhattisgarh, Odisha
Wheat Uttar Pradesh, Punjab, Haryana, Madhya Pradesh, Rajasthan, Bihar
Bajra Rajasthan, Uttar Pradesh, Gujarat, Haryana, Maharashtra
4 Animal Products Total meat Uttar Pradesh, Andhra Pradesh, West Bengal, Maharashtra, Tamil Nadu, Haryana, Bihar, Punjab
Buffalo Meat Uttar Pradesh, Andhra Pradesh, Maharashtra, punjab, Kerala, Bihar, Delhi
Cattle Meat Kerala, Maharashtra, Meghalaya, Bihar, Nagaland, West Bengal, Karnataka, Tamil Nadu
Goat meat West Bengal, Uttar Pradesh, Andhra Pradesh, Maharashtra, Bihar, Odisha, Rajasthan
Swine Meat Uttar Pradesh, Bihar, Nagaland, West Bengal, Assam
Sheep Meat Andhra Pradesh, Karnataka, Maharashtra, West Bengal, Jammu and Kashmir, Rajasthan, Tamil Nadu
Poultry Andhra Pradesh, Tamil Nadu, Maharashtra, Haryana, West Bengal, Uttar Pradesh
Egg Andhra Pradesh, Tamil Nadu, Maharashtra, West Bengal, Haryana, Punjab, Karnataka
Milk Uttar Pradesh, Rajasthan, Andhra Pradesh, Punjab, Gujarat, Maharashtra, Madhya Pradesh, Tamil Nadu, Bihar, Haryana
Source: APEDA Agri Exchange

APEDA
Study on identification of export oriented integrated infrastructure for agri products from Karnataka
& Tamil Nadu - APEDA (Agriculture Produce Export Development Authority)
PwC 16
3. Identification of crop clusters and surplus availability for exports from Karnataka
3.1. Methodology adopted for identification of the potential/focus crop
There are varied type of fruits and vegetables produced in the two states covered in this report. While this chapter focuses on Karnataka, the crop selection criteria remain the same. The crops in both states are identified on the basis of –
What crops are being exported from the state
Crops in which the state is strongly places vis-à-vis rest of India
Any crop that has small volume product but still has reasonable potential for exports
Crops that were suggested by the stakeholders has also been evaluated
On the basis of the criterion defined above the potential crops selected from Karnataka are grapes, mango, papaya, pineapple, pomegranate, tomato, onions etc. Karnataka has considerable share in the overall production of these crops in the country and these crops also have export potential. These crops also have strong market linkages and high potential for export. Apart from these crops, livestock products like eggs and chicken meat also has the potential to be exported from the state.
The crops identified on the criteria’s defined above are vetted with the exporters of agriculture commodities in the two states and verified that only these crops holds potential for exports from India.
APEDA has already identified Tumkur, Bangalore Urban, Bangalore Rural, Hassan, Kolar, Chitradurga, Dharwad and Bagalkot as cluster for Gherkins however, gherkins are exported processed and do not need infrastructure support. Therefore other clusters have been identified in the subsequent section.
3.2. Crop wise identification of the cluster and surplus available in Karnataka
3.2.1. Grapes
Grapes are one most popular fresh fruits in the world besides being used as juice, wine and resins.
From the perspective of export infrastructure, the fresh produce export is what needs the maximum
infrastructure. Therefore the first focus is on export of fresh grapes.
Globally the market is dominated by Chile with about 25% volume share of the total global export
sales of about 4.2 million tons annually, followed by USA, Italy and South Africa. While Italy matches
US in volumes, the US leads in the value terms.

APEDA
Study on identification of export oriented integrated infrastructure for agri products from Karnataka
& Tamil Nadu - APEDA (Agriculture Produce Export Development Authority)
PwC 17
In the international trade, India stands 9th with 0.15 million tons exports.
Table 4: Exporters for Fresh Grapes in the World
Rank Area Quantity (MMT)
Value (Mn USD)
Global Share (%)
1 Chile 1.05 246 25
2 US 0.53 127 13
3 Italy 0.5 921 9
4 S. Africa 0.32 843 8
Source: Uncomtrade
3.2.1.1. Grape export potential of India
India’s grape export volume has grown from about 22,000 tons to about 140,000 tons in the last 10
years. This reflects a CAGR of about 23%. The export from India is almost entirely from the state of
Maharashtra. Maharashtra produces over 80% of India’s grape production.
Maharashtra produces about 2.0 million tons of grapes that and exports about 6-8% of the produce as
fresh grapes. The major varieties produced are Tas – A – Ganesh, Sonaka, Manik Chaman, Maruti
Seedless, Sangli, Thompson Seedless, Sarita Seedless (Black Sonaka), Nanasaheb Purple Seedless, Nath
Jambo Seedless, Krishna Seedless, Ambe Seedless, Mahadev Seedless etc. The state is introducing
international varieties. In the year 2008 – 09 four varieties viz. Autumn Seedless, Blush Seedless,
Marquis and Autumn Royal were imported from Davis University, California and recently two varieties
namely Victoria and Crimson Seedless were imported from South Africa.
The major varieties of Karnataka are Bangalore blue, Anab-e-shahi, Thompson Seedless, Gulabi, Arka
Vathi, Shyam etc. Thompson Seedless is the largest (area under cultivation) table variety that is grown
in Karnataka. It is estimated that out of the total production about 55% of the produce is of table variety
while the rest are more suited for wine and juice manufacture.
3.2.1.2. Analysis of exports from India
As discussed earlier, the presence of India in the international market with volume share of 3.5% in the global trade while about 2.5% in value share. Production wise as well India contributes, 3-4% of the global production. So this is one of the very few crops where India’s export performance is commensurate with its production performance.
The top destinations for Indian exports are Netherlands, Bangladesh, Russian Federation, UK, UAE and Saudi Arabia; together they constitute 80% of India’s export. However, India’s position within these markets (taken together) is not very strong. India is in 4th largest exporter with only 10% market share.

APEDA
Study on identification of export oriented integrated infrastructure for agri products from Karnataka
& Tamil Nadu - APEDA (Agriculture Produce Export Development Authority)
PwC 18
Figure 7: Major Competitors for India in key export markets (by volume)
Source: UnComtrade, PwC Analysis
Grape Seasons in India and the competing countries
The harvest time difference is a major creator of opportunity for the fresh fruit supplying country and
so is the case with Grapes –
Chile and India the harvest time is February to April while in South Africa the harvest period is
December to February (for Thompson Seedless) and the harvest season in Turkey is between August
and October. In order to capture market share we need to add varieties that can be counter cyclical to
our usual harvest season. A case in the point - Maharashtra has imported Crimson Seedless from South
Africa and trying to develop the same. Interestingly, in South Africa the Crimson Seedless is a grape
which is harvested for 2 months after the Thompson Seedless harvesting is over.
Turkey 36%
S. Africa32%
Chile19%
India10%
Others3%

APEDA
Study on identification of export oriented integrated infrastructure for agri products from Karnataka
& Tamil Nadu - APEDA (Agriculture Produce Export Development Authority)
PwC 19
3.2.1.3. Projection of Exports
Figure 8: Grapes past and projected exports from India (in 000 MT)
Source: UnComtrade, PwC Analysis
Step 1 – Projecting India’s export over next 5 years based on last 10 years’ performance - Based on the last 10 years’ export performance, if the export potential is projected (using the least square method) then it can be expected that the total exports should reach the 175,000 tons by 2019. The key question is how much of this export can be achieved by Karnataka. However it may be noted that as DGCIS records, India’s export is about 192,000 tons in 2014, a year which is not covered by the international data base of UNcomtrade. Considering this information the projected export should be about 222,000 MT. The projection graph is not being changed because firstly the DGCIS data cannot combined without homogenization and secondly even if the data is included the incremental increase in exports remains confined in the 26000-30,000 MT over the next 5 years. So the infrastructure need over the next 5 years remains the same. With this understanding we proceed to define the potential for Karnataka
Step 2 – How much of India’s export will come from Karnataka – Karnataka has a production base of 0.3 to 0.35 million tons of grapes while Maharashtra has a production base of 2 million tons. Currently, Maharashtra exports about 7% of its production. In order to match the same level of exports Karnataka should be able to export about 15,000 to 20,000 tons per annum over a production base of 300,000 tons.
Step 3 – Is this estimation reasonable – Currently Maharashtra is the only major exporter of Grapes from India with export volumes of 0.15 million tons. We assume that the overall export from India is likely to cross 0.175 million tons by 2019 at a conservative growth rate of around 5%. Further considering the current production levels we can safely assume that the additional growth of 0.025 million tons will be contributed by key production states of Maharashtra (10000 tons) and Karnataka (15000 tons).
Since the current level of export is negligible, the forecast of 15000 tons i.e. 1000 containers may appear very high. However, Karnataka gaining 15000-20000 tons of export is reasonable because of the following reasons:
- being a neighboring state, Karnataka gives a good diversification option to the export traders from Maharashtra, if the support infrastructure is in place
- this is the potential to be achieved in 5 years and
23
52 65
76
117 109
64 75
114
149 137 142 148 155
162 177
-60%
-40%
-20%
0%
20%
40%
60%
80%
100%
120%
140%
-
20
40
60
80
100
120
140
160
180
200
export growth rate

APEDA
Study on identification of export oriented integrated infrastructure for agri products from Karnataka
& Tamil Nadu - APEDA (Agriculture Produce Export Development Authority)
PwC 20
- many crops in recent years have achieved over 100% volume growths so if the circumstances are right this growth can achieved in one season
The major production zones for grapes in Karnataka are Bijapur, Bagalkote and Belgaum in the north and Bangalore (Rural) and Kolar in the south. In order to process the exports, two pack houses are needed i.e. one each in both the clusters. The two pack houses need to have capacity to process 10,000 tons within the 4 months of February to April that implies the need for an 80 -100 ton (installed capacity/day) pack house.
Further, In order to achieve this target, infrastructure development has to be supported through measures such as introducing of internationally popular grape varieties; farmers’ capacity building, GAP certifications and active promotional support during the first 5-6 years in order build the volumes.
In addition there exists potential for resins, juices and wines in Bangalore as there are quite a few varieties in Karnataka which are suitable for the juices and wines. Bangalore Blues is a variety for which geographical identifier (GI) has also been issued. The processing of grapes does not require post- harvest infrastructure.

APEDA
Study on identification of export oriented integrated infrastructure for agri products from Karnataka
& Tamil Nadu - APEDA (Agriculture Produce Export Development Authority)
PwC 21
Figure 9: Major Production cluster of grapes in Karnataka
Source: Indiastat, PwC Analysis
3.2.2. Pomegranate
This is a crop for which international trade data is very limited. The reason for limited information is the concentrated production in India and Iran. It is a crop that is native of Iran and is well suited for growing in dry / low rainfall conditions. Therefore the crop was found suitable in many regions of India.
India currently produces 1.35 million tons of pomegranates from 130,000 hectares of land. Further, India exports little over 2% of its production in the international market. Indian varieties are internationally acceptable as long as the size requirements are met. The shelf life of the fruit is about 7 days ambient and10-15 days in cold chain.
3.2.2.1. Projection of Exports
Step – 1 forecasting the exports of India - Since global trade in pomegranates is not recorded; therefore an assessment of the market is limited forecasting exports from India only. India’s exports have also grown at sluggish CAGR of 5% over the past 7 years. And a linear progression (least square method) of the existing trade will only increase the export to 35000 tons from the current level of 31000 tons. This is demonstrated through the graph below.

APEDA
Study on identification of export oriented integrated infrastructure for agri products from Karnataka
& Tamil Nadu - APEDA (Agriculture Produce Export Development Authority)
PwC 22
Figure 10: Export of Pomegranate (000 MT) and its growth rate
Source: APEDA
As can be observed, the exports has always been range bound between 30,000 and 35000 tons, while during this period the national production has increased from 0.8 million tons in 2008 to about 1.3 million tons in 20014. This shows a clear trend that production increase will not increase international trade unless supported by suitable infrastructure and export focused cultivation is done through development of international cultivars.
Step 2 – Moderation of the forecast - So going forward and planning the investments in the infrastructure we assume that the addition of infrastructure will increase the export by an additional 20% thereby increasing export of pomegranate to 42000 tons from a current level of 31000 tons. This assumption is not mathematical; instead it is based on stakeholder discussions.
Step 3 – Karnataka’s Share in the export – The production of the pomegranates in Maharashtra is about 0.9 million tons while Karnataka has 0.13 million tons and between these two states, 80% of the pomegranate production in India is covered. If the projected export of 42000 tons is allocated to these states in proportion of their production then Maharashtra can be expected to export 37000 tons and Karnataka can be expected to export 5000 tons.
The season for the crop is June to October and the major regions in Karnataka are Gulbarga, Raichur, Koppal, Bijapur, Bagalkot, Bellary, Davangere, Belgaum and Chitradurga. This region has an overlap with the Grape growing zones in North Karnataka and the season is also complementary therefore there is opportunity for having shared infrastructure. In one of the major districts Bijapur, Bagalkot and Koppal are centers for exports and we would set up multi product pack house for grapes and pomegranates.
-50%
-40%
-30%
-20%
-10%
0%
10%
20%
30%
40%
50%
60%
70%
80%
-
5.00
10.00
15.00
20.00
25.00
30.00
35.00
40.00
2007 2008 2009 2010 2011 2012 2013 2014 2015 2016 2017 2018 2019
export growth rate

APEDA
Study on identification of export oriented integrated infrastructure for agri products from Karnataka
& Tamil Nadu - APEDA (Agriculture Produce Export Development Authority)
PwC 23
Figure 11: Major Production cluster of pomegranate in Karnataka
Source: Indiastat, PwC Analysis

APEDA
Study on identification of export oriented integrated infrastructure for agri products from Karnataka
& Tamil Nadu - APEDA (Agriculture Produce Export Development Authority)
PwC 24
3.2.3. Papaya
Papaya is a tropical fruit originating from Latin America but at present India is the largest producer of Papaya in the world with nearly 40% of the production of the world is in India. However, India has only about 6% market share in volume terms and about 4% in value terms. The problem with this fruit is its low shelf life (2-5 days) and therefore difficulty in sending over long distances. The largest importer of this fruit is USA accounting for 50-60% of the import. Given the short shelf life, even the second largest producer, Brazil does not supply to the US market. This market is dominated by Mexico.
Table 5: Exporters for Papaya in the World
Rank Area Quantity (MMT)
Value (Mn USD)
Global Share (%)
1 Mexico 0.12 67 39%
2 Guatemala 0.03 12 11%
3 Brazil 0.03 42 10%
4 Belize 0.03 10 9%
Source: FAOSTAT (MMT= Million Metric Tons)
Nepal (60%), Saudi Arabia (33%), Kuwait (5%), France(1%) (#) are the major international markets for exported Indian Papayas. Within these key export markets, India is ranked among the highest. In Nepal India has 100% market share of the import of Papaya, while in Middle-east, the share of Indian exports is close to 80%.
US, Singapore, Canada, El-Salvador & Netherlands are the major importers of papayas, India’s share of exports to these countries has been miniscule. Proximity to major exporters, variety preference and perishability of the produce might be major reasons for the same.
While US, Canada, El-Salvador are currently impossible to cater to, Singapore market could have been considered for development. That market imports about 20,000 tons per annum and India could have targeted a 20-25% market share in this region. However even the Singapore market is not available. This is due their close proximity to Malaysia which is the primary suppliers for Singapore.

APEDA
Study on identification of export oriented integrated infrastructure for agri products from Karnataka
& Tamil Nadu - APEDA (Agriculture Produce Export Development Authority)
PwC 25
3.2.3.1. Projection of Exports
Figure 12: India’s export performance over the years and the projected exports based on linear forecasting
Source: FAOSTAT
Papaya export shows a growth trend of about CAGR of 26% since 2004. This is a very strong performance for a crop. Going forward the analysis throws up a modest growth rate of about 6%.
However this leads to a growth of about 15000 tons by the end of 2019. This as an absolute number is unreasonable because there are limitations to the number of markets that can be serviced from India and the markets which can support this level of growth. The current level of growth is supported largely growth in the import markets of middle- east. However these markets have grown erratically.
Based on the above information we make the following assumptions –
1. The growth in Papaya export will be small and assume that it will be only 0.1% (due to saturated primary markets and low shelf life) of the production of India (5.2 million) i.e. a growth of 5000 tons only
2. The growth will come from Middle-Eastern markets only
3. Since Karnataka and Maharashtra are the largest producer states in the west coast, the entire export will be provided by these 2 states.
4. Since Maharashtra’s production is over 3 time Karnataka’s production, therefore it is safe to assume that of the projected export of about 20,000 tons, ¾ quantity is export is from Maharashtra and ¼ is from Karnataka.
Based on these assumptions, it is projected that the export of Papaya from Karnataka is about 5000 tons only.
The cluster to be covered consists of the following districts Bangalore Rural, Kolar, Tumkur, Mandya and Mysore. The required pack house will be in an area which will be common to grapes and other vegetables and therefore it is possible to a multi commodity pack house facility.
In addition to fresh papaya exports limited quantities of papaya pulp can also be exported. A more significant category papaya based product is Pepin based enzymes. These are high value added products but do not occur on the APEDA list of products.
-20%-10%0%10%20%30%40%50%60%70%80%90%100%
0.0
5.0
10.0
15.0
20.0
25.0
30.0
35.0
export export growth rate

APEDA
Study on identification of export oriented integrated infrastructure for agri products from Karnataka
& Tamil Nadu - APEDA (Agriculture Produce Export Development Authority)
PwC 26
Figure 13: Major Papaya production centers in Karnataka
Source: Indiastat, PwC Analysis
3.2.4. Assorted Vegetables and Fruits
India is a major producer of varieties of fruits and vegetables. The country has been endowed with a
wide range of climatic and physio-geographical conditions which are suitable for growing various kinds
of vegetable cops. The country is the second largest producer of fruits and vegetables in the world. Fruits
and vegetables together form 92 percent of the total horticulture production in the country.
The country has witnessed a tremendous increase in the overall vegetable production, especially during
the green revolution. Increasing per capita income, health consciousness, urbanization, increasing
working women, shifting of farmers to high value vegetables due to higher income, favourable income
elasticity of demand and annual growth rate for domestic demand for fruits & vegetables are also
important ingredients for fuelling vegetable growth in the country.
In terms of production, major vegetables producing states in India are West Bengal, Uttar Pradesh,
Bihar, Madhya Pradesh, Gujarat, Maharashtra, Odisha, Tamil Nadu, Andhra Pradesh, Karnataka and
Haryana. These states constitute more than 80 percent of the total vegetable production in the country.
Karnataka is ranked 10th in terms of the total vegetable production in the country. The major vegetable crops of Tamil Nadu are tapioca, onion, tomato, brinjal, okara, gourds, cabbage and drum sticks. Tamil Nadu is also known for the exports of tropical vegetables from the state. The tropical vegetables like drum sticks, lady fingers, bottle gourd, snake gourd, bitter gourd, snake gourd etc. the export these tropical vegetables are taking place majorly from Chennai and Cochin airports. These terminals generally export vegetables to countries like UAE, Saudi Arabia, Kuwait and other Middle East countries.
There are small amounts of various tropical vegetables being exported by air to various countries. Though individually all these items do not have sufficient quantities, however at the aggregate level the volume becomes a substantial level of 5000 tons per annum (based on export data from DGCIS).
Market assessment for these products cannot be done because of the heterogeneous nature of the products groups, however at the aggregate level; the past volumes can be used to develop the volume potential for these crops.

APEDA
Study on identification of export oriented integrated infrastructure for agri products from Karnataka
& Tamil Nadu - APEDA (Agriculture Produce Export Development Authority)
PwC 27
These crops are –
1. Gourds – bottle gourds, bitters gourds, snake gourds
2. Drum sticks
3. Curry leaves
4. Beans (French, Chikdi, Cluster beans)
5. Brinjals
6. Cucumber
7. Ginger
8. Chilli
9. Elephant Yam
10. Coccinia
11. Peas
12. Okra
13. Garlic
14. Papaya
15. Pomegranate
16. Banana
3.2.4.1. Projection of Exports
Table 6: Export of assorted vegetables projected by least square method
Year 2012 2013 2014 2015 2016 2017
Volume in Tons 3408 3309 4816 5252 6403 7077
Growth Rate -3% 46% 9% 22% 11%
Source: APEDA
These assorted crops are exported palletized from Bangalore Airport and are done so with the use of any cold chain. They crops are procured in the morning from markets and regions not too far from Bangalore. During the day the goods are sorted, palletized, certified and loaded on to the air crafts and by late evening or early morning the goods are at the destination. Each pallet will have an assortment of vegetables and fruits as per the order.
The growth volume is projected only for 3 years because the past records were also available for 3 years. Based on this project it appears that for these crops Bangalore would be most suitable location for setting up a pack house for these assorted commodities.
So the pack house in Bangalore for assorted vegetables and fruits would require an annual through put capacity of about 7000 tons by 2017.
It must be noted that export of such assorted vegetables and fruits should not be compared at a national scale. These exports typically cover produce that can be procured, graded, sorted, palletized and air shipped within 1 day. Therefore the focus is only on locally available produce, highly seasonal and bears little correlation with similar export happening in the rest of the country.
3.2.5. Tomato
This is one of the most widely grown crops in the world and there exist many varieties across the world developed to suit the local tastes preferences and to resist the local weather and disease shocks. India is the second largest producer with 11% share of the global production. China is the largest producer with over 30% share of production.

APEDA
Study on identification of export oriented integrated infrastructure for agri products from Karnataka
& Tamil Nadu - APEDA (Agriculture Produce Export Development Authority)
PwC 28
3.2.5.1. Projection of Exports
The global trade in tomato is about 7.2 million tons, while India has a miniscule share of about 0.25 million tons. So in volume its 3% while the production is about 11% of the world. So prima facie there seems potential to substantially increase exports. It has medium shelf life of upto 10 days in cold conditions and also has good life in ambient conditions as well.
India’s current tomato exports –
Pakistan (94%), Nepal (3%) constitutes India’s major tomato market accounting as much as 97% of India’s export. In these countries India has almost 100% market share in their entire tomato import bill. Therefore in order to increase the export of tomatoes then the traditional markets of Pakistan and Nepal.
Step 1 – Projecting Exports –If we assess the trade volume growth in the past few (though it has been achieved by creating dominance in a few markets only) and forecast the volume potential after 5 years, it can be observed that the current growth momentum shows that achieving 425,000 ton of exports should be feasible. This appears to be too high but this not a projection of exports, it is export “target” for the crop. In order to achieve this growth target India needs to target new markets.
Figure 14: Export and growth rate of tomato from India
Source: UN Comtrade, PwC Analysis
-30%-20%-10%0%10%20%30%40%50%60%70%80%90%100%110%120%130%
-
50.00
100.00
150.00
200.00
250.00
300.00
350.00
400.00
450.00
500.00
2009 2010 2011 2012 2013 2014 2015 2016 2017 2018 2019
export growth rate

APEDA
Study on identification of export oriented integrated infrastructure for agri products from Karnataka
& Tamil Nadu - APEDA (Agriculture Produce Export Development Authority)
PwC 29
Step 2 – Assessing feasibility of projected exports - New markets need to be explored in order to achieve significant growth in exports along with building the back end infrastructure. So let’s consider the potential markets to target –
Figure 15: Import of tomato’s (in Million Tonnes)
Source: UN Comtrade, PwC Analysis
These markets together constitute 80% of the importers of tomato. Even after excluding Pakistan (because India is the dominant exporter there) and USA, which due to the distance may be difficult to serve, the remaining market is about 4 million tons per annum. Through orgainsed and focused effort achieving 175,000 tons export growth in a 4 million ton market is quite feasible.
Step 3 - Assessing share of Karnataka in the export growth - It is assumed that the top 3 states (in terms of production) share 90% of the export i.e. 387,000 tons should be exported by the top 3. These states are Andhra Pradesh (3.3 million tons production), Karnataka (2 million ton production) and Madhya Pradesh (1.9 million ton production) and the export should be achieved in the ratio of their production. This implies that Karnataka should be exporting about 108,000 tons. However since Karnataka is currently a exporting only a negligible amount of produce. Therefore it is assumed that Karnataka on a conservative basis should target to achieve at least half of its potential i.e. 54000 tons (2.5 % of current production level) of exports in 5 years.
In order to achieve this target, a focused and planned approach in needed on the part of Karnataka and APEDA will have to provide extensive hand holding and capacity building support. This has to be taken up in a project approach with a pilot stage, where in varieties are tested as shipments of existing varieties are tested in new markets. Thereafter the scaling plan should be put into place and partnerships created
1.54
0.86
0.74
0.67 0.56
0.42
0.27
0.25
0.20
0.14 0.14
0.13 0.12
1.45
Tomato - Top Importers
USA
Russian Federation
Germany
Croatia
France
United Kingdom
Pakistan
Netherlands
Canada
Poland
Saudi Arabia
Lithuania
Italy
Other

APEDA
Study on identification of export oriented integrated infrastructure for agri products from Karnataka
& Tamil Nadu - APEDA (Agriculture Produce Export Development Authority)
PwC 30
with suitable large international and national players as well as with various state level government bodies. Developing large base of GAP certified farmers.
In addition to fresh produce export, private sector should be motivated to develop tomato paste, flavors, soup mixes and ketchup etc.
Target Locations for Tomato Clusters –
The major production districts are in the southern cluster covering Kolar and to some extent Bangalore Rural and nearby regions.
Figure 16: Import of tomato’s (in Million Tonnes)
Source: Indiastat, PwC Analysis

APEDA
Study on identification of export oriented integrated infrastructure for agri products from Karnataka
& Tamil Nadu - APEDA (Agriculture Produce Export Development Authority)
PwC 31
3.2.6. Cucumbers/Gherkins
India is the largest exporters of Gherkins in the world and almost the entire of the production is in the state of Karnataka. This was a unique crop at the time of its introduction because the product had no market whatsoever in India. So the farmers growing this product were taking the risk that if the product did not sell, there would be not alternative revenue. The other issue of such a crop is price discovery. Since there was no open market with multiple buyers and sellers, prices would always be negotiated. Such a situation can be common in an industrial setting but in agriculture this was certainly a challenge. So this is one of the very few examples in the country farmers has grown what the end user wants and trying to sell whatever he is producing.
This approach is needed for other crops as well particularly where the domestic market is already quite established e.g. cultivation of rose onions in Karnataka even when there is a strong domestic market already. The approach for assessing the export growth potential for Gherkin would be to assess the growth of exports and growth of international market and assume that lower of the growth rates would be applicable to Gherkin export from India.
Figure 17: Export of Gherkin (in 000 tonnes)
Source: UN Comtrade, PwC Analysis
The entire production of Karnataka is geared towards export trade. While other cucurbits are harvested in large quantities for the domestic market itself, this is not a product for domestic consumption. Therefore whatever is produced is exported. The growth will be driven by external factors.
178
109
72 70
63
53 26
122
India Germany Turkey Netherlands
USA Croatia Viet Nam Others

APEDA
Study on identification of export oriented integrated infrastructure for agri products from Karnataka
& Tamil Nadu - APEDA (Agriculture Produce Export Development Authority)
PwC 32
3.2.6.1. Projection of Exports
Figure 18: Export of Gherkins (in 000 Tonnes)
Source: UN Comtrade, PwC Analysis
Based on the past performance of the global market, the past performance of the Indian exporters it can be projected through linear progression that export volume would increase to about 200,000 tons. Exporters of Gherkin have informed that physical infrastructure is not currently needed, but the area of focus should be development of planting material. As of now planting material is imported and expensive. Local agriculture research center had so far avoided pursuing research on gherkins because it is not a critical crop for India. APEDA may use its good office to influence the inclusion of crops of export importance into the research programmes.
90.85 104.02 113.80 118.20 129.68 136.77 144.71 153.99 161.50
435.96
571.63 574.23
692.27 761.41
821.73 915.32
980.05 1,057.00
-
200.00
400.00
600.00
800.00
1,000.00
1,200.00
2010 2011 2012 2013 2014 2015 2016 2017 2018
India export World export

APEDA
Study on identification of export oriented integrated infrastructure for agri products from Karnataka
& Tamil Nadu - APEDA (Agriculture Produce Export Development Authority)
PwC 33
3.2.7. Pineapple
Like almost all other crops, India is exporting well below its potential in pineapples as well. Pineapple production in India is 6-7% of the global production however our share in the global market is negligible at about 0.07%. Compared to our production, the export is almost 0%.
The bulk of the international demand is currently being met by the South and Central American countries. However, their seasons end in February and we can exploit the season after that because in India some states have very long seasons (up to 9 month including lean season for West Bengal).
Karnataka as a pineapple growing state has an advantage in catering to the western markets because the eastern sector of West Bengal, Assam and Bihar have much larger production bases and currently the hubs for bulk of the international trade for fresh, canned and juiced products.
In catering to the western market, the assessment export potential will be based on production available instead of existing exports, because existing exports are negligible. Pineapple has 7-10 days in ambient conditions and upto 15 days in cold store. The most popular commercial pineapple variety in India is Giant Kew. Other important verities are Queen, Kew, Mauritius, Charlotte, Rothchild, Jaldhup, Desi, Lakhat, etc. For the purpose of exports the Md2 varieties need to be used and they are currently available in India.
3.2.7.1. Projection of Exports
Step 1 – Assessing the international market - The international market is dominated by Latin America with Costa Rica alone exporting 1.9 million tons of the total global trade of 3.3 million tons. The products movement is defined by seasonal availability of the crop. Therefore the opportunities lie in producing off season. The other opportunity is in environmental sustainability. With almost 2/3rd of the world’s and 3/4th of Europe pineapple coming from Costa Rica, a major area of concern is the industrial production systems of Costa Rica which is heavily pesticide and fertilizer dependent.
Following graphs represent a break-up of the various market zones. All zone can be considered because pineapple is a crop that be transported over longer distances.
Figure 19: Major Importing zones of Pineapple
Source: UN Comtrade, PwC Analysis
33%
36%
8%
7%
9%7%
Pineapple import zones
N. America W. Europe E. Europe MENA Far East + China Others

APEDA
Study on identification of export oriented integrated infrastructure for agri products from Karnataka
& Tamil Nadu - APEDA (Agriculture Produce Export Development Authority)
PwC 34
Figure 20: Major Importing zones of Pineapple(000 tons)
Source: UN Comtrade, PwC Analysis
Step – 2 – Developing the export potential for Karnataka pineapples (instead of projecting for India and allocating a share to Karnataka) for developing Pineapple exports from Karnataka (which currently happens in small quantities with other fruits and vegetables) the regions that should be considered are MENA (Middle East and North Africa), Eastern and Western Europe. This approach of focusing on directly on projecting for Karnataka instead of India first and then Karnataka is adopted because unlike the other major crops of Karnataka, the domestic competition in Pineapples is not from the neighboring states but from the Eastern Indian states which have different crop cycles, varietal characteristics and value chain dynamics. Therefore clubbing Karnataka with rest of India is not advisable.
The total volume of imports in MENA, Eastern Europe and Western Europe are 0.2 million tons, o.3 million tons and 1.2 million tons respectively. Over the next 5 year period targeting 3% of the MENA market and 0.5% of total European market would be reasonable and achievable.
This brings to target export volume of 13500 tons exports from Karnataka in 5 years’ time which can be catered to by 160,000 ton of current production. The relevant regions in Karnataka are Shimoga, Kodagu, Uttar Kannada, Dakshin Kannada, Udupi.
1,092
1,188
281
232
317 232
Pineapple import zones
N. America W. Europe E. Europe MENA Far East + China Others

APEDA
Study on identification of export oriented integrated infrastructure for agri products from Karnataka
& Tamil Nadu - APEDA (Agriculture Produce Export Development Authority)
PwC 35
Figure 21: Major Production zones of Pineapple
Source: UN Comtrade, PwC Analysis
3.2.8. Floriculture
Floriculture export i.e. exports of cut flowers, loose flowers and dried flowers, has been traditionally seen as a prestigious business segment but when the global trade is considered is when the stark difference is noticeable. In a global trade of 9.5 billion US$, India has exports to the tune of US$ 75 (appox INR 450 crores) which is less than 1%.
3.2.8.1. Projection of Exports
Step 1 – Assessing the international market – The countries were India exports are USA, Germany, U K, Netherland, UAE, Singapore, Japan, Italy, Canada, Poland, France and Spain are the major international markets for flowers/floriculture products from India and even in these markets India’s total market share was only 1% and there is strong competition from Malaysia, Columbia, Kenya, Thailand & Republic of Korea.

APEDA
Study on identification of export oriented integrated infrastructure for agri products from Karnataka
& Tamil Nadu - APEDA (Agriculture Produce Export Development Authority)
PwC 36
Figure 22: Major Competitors for India in Key Export Markets (by Volume)
Source: UN Comtrade, PwC Analysis
In the international market the dominant player is Netherlands which controls over 50% of the trade, followed by Latin American and African countries.
Table 7: Top flower exporters in the World
Rank Area Quantity (MMT)
Value (Mn USD)
Global Share (%)
1 Netherlands 0.51 4640 51%
2 Colombia 0.21 1335 11%
3 Ecuador 0.16 837 8%
4 Ethiopia 0.13 527 7%
Source: UNComtrade
Step 2 – India’s Export performance - Not only India has low market share in the international market, the export in volume terms has been declining over the past decade. The volume of export has come down from ~31000 MT to ~22000 MT resulting in a CAGR of -3.1%. Projecting the export sales through least square method will lead to a negative forecast which we believe may be too conservative when planning for future infrastructure requirements. So for floriculture this forecast will not be taken into consideration.
Malaysia12% Kenya
6%
Columbia8%
China5%
India1%
Others68%
APEDA
Study on identification of export oriented integrated infrastructure for agri products from Karnataka
& Tamil Nadu - APEDA (Agriculture Produce Export Development Authority)
PwC 37
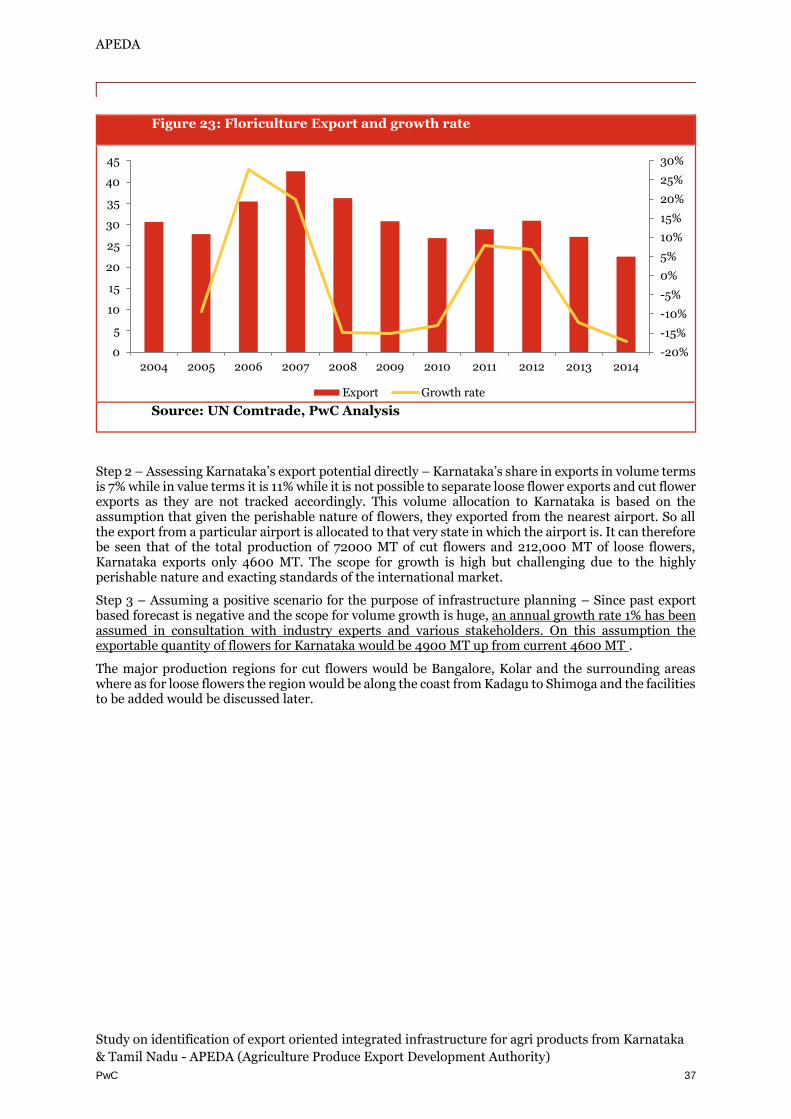
Figure 23: Floriculture Export and growth rate
Source: UN Comtrade, PwC Analysis
Step 2 – Assessing Karnataka’s export potential directly – Karnataka’s share in exports in volume terms is 7% while in value terms it is 11% while it is not possible to separate loose flower exports and cut flower exports as they are not tracked accordingly. This volume allocation to Karnataka is based on the assumption that given the perishable nature of flowers, they exported from the nearest airport. So all the export from a particular airport is allocated to that very state in which the airport is. It can therefore be seen that of the total production of 72000 MT of cut flowers and 212,000 MT of loose flowers, Karnataka exports only 4600 MT. The scope for growth is high but challenging due to the highly perishable nature and exacting standards of the international market.
Step 3 – Assuming a positive scenario for the purpose of infrastructure planning – Since past export based forecast is negative and the scope for volume growth is huge, an annual growth rate 1% has been assumed in consultation with industry experts and various stakeholders. On this assumption the exportable quantity of flowers for Karnataka would be 4900 MT up from current 4600 MT .
The major production regions for cut flowers would be Bangalore, Kolar and the surrounding areas where as for loose flowers the region would be along the coast from Kadagu to Shimoga and the facilities to be added would be discussed later.
-20%
-15%
-10%
-5%
0%
5%
10%
15%
20%
25%
30%
0
5
10
15
20
25
30
35
40
45
2004 2005 2006 2007 2008 2009 2010 2011 2012 2013 2014
Export Growth rate

APEDA
Study on identification of export oriented integrated infrastructure for agri products from Karnataka
& Tamil Nadu - APEDA (Agriculture Produce Export Development Authority)
PwC 38
Figure 24: Floriculture Export and growth rate
Source: UN Comtrade, PwC Analysis

APEDA
Study on identification of export oriented integrated infrastructure for agri products from Karnataka
& Tamil Nadu - APEDA (Agriculture Produce Export Development Authority)
PwC 39
3.2.9. Mango Pulp
As a major producer of mango both mango and mango pulp are potential products of Karnataka. Currently Karnataka exports both. However, during the field visits during consultation with exporters, APEDA officials as well as state government the opinion that came through was that while fresh mangos were exported from the state, the real strength of the state was in mango pulp as two of its primary mango varieties name Bangalora (Totapuri) and Banganapalli (Baneshan, Safeda) are quite popular with the processors.
3.2.9.1. Projection of Exports
Step – 1 – Global Position of India - Major importers from India are UAE (24%), Nepal (23%), Saudi Arabia (17%) , UK (16%), Bangladesh (10%) ) accounting for almost 80% of India’s mango exports. Within these markets, India ranks 4th with 4% market share by volume. US & Europe being the major importers of mangoes, India’s share of exports to these countries has been miniscule. Position of Indian Exports in terms of value is even lower as price realized per unit of produce exported is lower, Exports from India show a steep decline in 2013-14 due to quality issues; quality constraints in terms of compliance to Phyto-sanitary norms and violation of pesticide residual limits are the major impediments.
Figure 25: Major Competitors for India in Key Export Markets for Fresh Mangoes (by Volume)
Source: UN Comtrade, PwC Analysis
India faces competition from various other tropical countries which take advantage of the fact that they are located closer to the market. This is a significant advantage for a fruit like mango which has low shelf life. These countries with their established position in the fresh fruit market are then able to compete in the pulp market as well. These countries also have the advantage of having low local consumption. In India the exporters are competing with the local market traders as well.
Table 8: Exporters for Mango in the World
Rank Area Quantity (MMT)
Value (Mn USD)
Global Share (%)
1 Thailand 0.33 299 11.4
2 Mexico 0.26 203 8.9
3 Brazil 0.25 180 8.6
4 Peru 0.12 133 4.3
Source: UNComtrade
UK17%
Kuwait10%
Oman11%
India4%
Others58%

APEDA
Study on identification of export oriented integrated infrastructure for agri products from Karnataka
& Tamil Nadu - APEDA (Agriculture Produce Export Development Authority)
PwC 40
The second issue with the comparing international trade is classification of the trade data. While India is not performing very well in the export scenario, the international trade data is even worse as it includes other crops like mangosteen in the classifications.
Step 2 - Projecting the export potential - There is no trade data available for international trade of Mango Pulp. So we need to project the trade data from India’s past 10 years’ performance of mango pulp trade.
Figure 26: Current and Project export of Mango Pulp from India
Source: UN Comtrade, PwC Analysis
Based on the past 10 years’ export trend it is estimated that total pulp export from India will be about 186,000 tons in 5 years. It is also fair to estimate that the top 7 mango producing states (constituting 80% of the production) will be best placed to capture this export market as most investors are likely to set up facilities in high productivity areas. The top 7 mango producers are Uttar Pradesh, Andhra Pradesh, Karnataka, Telangana, Bihar, Maharashtra and Gujarat. The potential for pulp export can be taken in proportion of their production largely because it is not known how much each state it is producing at present.
Based on this assessment, Karnataka should be exporting 23000 tons of mango pulp i.e. if India is exporting 186,000 tons of pulp; Karnataka should be at least exporting 12.35% of it.
Mango processing unit has been proposed for basic level plant under PPP arrangement. This can be a demonstration facility for attracting more private investors. The number of operational plants in the region is not known. So if significant processing activity already exists, then this project need not be taken up.
3.2.10. Other Processing Opportunity
There are two other crops that can be used for developing processing infrastructure first is pulping of Sapota and the second is starch manufacturing from maize.
-20%
-10%
0%
10%
20%
30%
40%
50%
0
20
40
60
80
100
120
140
160
180
200
Mango Pulp
export growth rate

APEDA
Study on identification of export oriented integrated infrastructure for agri products from Karnataka
& Tamil Nadu - APEDA (Agriculture Produce Export Development Authority)
PwC 41
3.2.10.1. Sapota
Pulping of Sapota has not been considered highly feasible because the cluster in which it Sapota is concentrated does not have the opportunity for round the year processing. The crop is concentrated in northern Karnataka and most other crops suitable for pulping have similar harvest season as Sapota and the complementarity does not exist. However, while this recommendation is based on the production data, there can be individual pulping units which may have operations in perineal crops like tomato and may find Sapota viable. So even though a unit under PPP is not recommended, there is definite potential in development of Sapota pulping.
3.2.10.2. Maize Based Starch Unit
Maize is a highly volatile commodity where exported quantity as well as price realization per unit varies significantly as is highlighted by the below mentioned table –
Table 9: Export and Price of maize based starch
Export in 000 tons Price US$/Ton
2003 207 $ 143
2004 1,299 528% $ 146 2%
2005 433 -67% $ 170 17%
2006 634 46% $ 165 -3%
2007 1,495 136% $ 210 27%
2008 4,197 181% $ 220 5%
2009 2,695 -36% $ 198 -10%
2010 1,841 -32% $ 290 47%
2011 3,952 115% $ 274 -5%
2012 4,272 8% $ 265 -3%
2013 4,750 11% $ 265 0%
Source: UN Comtrade
It is therefore recommended that 300 MT / Day processing capacity starch manufacturing facility in western Karnataka. This plant would consume 90,000 tons of maize and the state has a production of over 3 million tons of maize.
This project can set up PPP basis. India has growing maize starch export trade, the plant will fur augment the same.
Table 10: India’s Maize Starch trade
Year Export in 000 tons
2003 8
2004 23
2005 13
2006 13
2007 20
2008 37
2009 28
2010 36
2011 81
2012 140
2013 184
CAGR 37% Source: UN Comtrade

APEDA
Study on identification of export oriented integrated infrastructure for agri products from Karnataka
& Tamil Nadu - APEDA (Agriculture Produce Export Development Authority)
PwC 42
3.2.11. Summary of Infrastructure required in Karnataka
The previous section discussed the potential of the state in terms of availability of the exportable
commodities. The current status of the exports from the state and India as a whole is minimal when
compared to the total potential available with the state to export. One of the critical factors is the
unavailability of the supporting infrastructure to facilitate smooth logistics and reservation of food
quality. Good infrastructure facilities ensure the proper delivery and safety of the exported product
along with savings in time and cost.
In Karnataka, the commodities with significant potential for export are grapes, pomegranates,
pineapples, papaya, mango pulp, sapota, tomato, gherkins, assorted vegetables (like drumstick, lady
finger (okra), various gourds, beans etc.), floriculture and maize. Although these commodities are
already being exported from the state but due to lack of infrastructure their actual potential has yet to
be achieved. The infrastructure gaps are present in the form of non-availability of pack houses / non-
availability of refer vans for transportation of perishable commodities, non-availability of refer
containers for transport of commodities to sea ports, pre-cooling facilities, processing facilities etc.
Plugging these gaps will assist the development of the export trade.
3.2.11.1. Exit Points for Karnataka
The exit options for export products from Karnataka are Mumbai – Sea and Air port, Cochin Sea Port
and Bangalore Airport. Mangalore Sea Port is also an exit option used by exporters.
It needs to be noted that the preferred usage of a sea or airport is not driven by
infrastructure around the port. It is driven by –
1. Destination port – all ports cater to a limited number of destination ports 2. Client’s preferred port – In case of FOB shipment clients simply provide the port in India where
they want the goods delivered 3. Most exporters have long term tie- ups with shipping lines which in turn have their fixed 4. Shipping / Airlines service frequency offered at the port 5. The Shipping / Airlines service frequency is dependent on the volume of produce shipped.
The following calculation shows that in Karnataka, except for Bangalore cluster no other cluster is
generating sufficient volume to justify even dedicated Cargo Freight Stations (CFS) to be created. A CFS
needs at least 1000 per annum for TEUs for viability.
Sr.
No Cluster
Commodity
Identified
Potential Exportable
quantity (in 000 MT)
No of TEUs (@20
tons/TEU)
KARNATAKA
1 Bangalore
Grape 10,000
3450 TEUs Papaya 5000
Tomato 54000
2 Bijapur Pomegranate 5000
750 TEUs Grapes 10,000
3 Mangalore Pineapples 13,500 675 TEUs
So for the period ending 2019, the cluster Bijapur will depend on conventional connectivity with
Mumbai Sea and Air ports and Mangalore cluster will depend on Mangalore and Cochin Sea port.
Additional infrastructure will not lead to an increase in sea and air freight service frequency (as volume

APEDA
Study on identification of export oriented integrated infrastructure for agri products from Karnataka
& Tamil Nadu - APEDA (Agriculture Produce Export Development Authority)
PwC 43
of agri produce is very low) and neither is it possible to change the flow of good from any existing busy
port to some newly developed port.
Bangalore has sufficient volume increase, however the district already has two ICDs and exporters are
not facing any congestion there, so the rational for new export infrastructure does not exist. Bangalore
Airport however needs a CPC (Center for Perishable Cargo) and therefore the same has been
recommended.
3.2.11.2. Existing Infrastructure
3.2.11.2.1. Pack Houses
Karnataka has only 4 pack houses that are APEDA recognized guest houses and while the utilisation of
the pack houses are not tracked even by the owners (because capacity varies with crop), yet the
stakeholders interviewed were of the view that utilisation will not be less than 70-80% as the pack house
are used for various crops round the year. Even by comparison to Maharashtra, which has over 50 pack
houses, the infrastructure gap is significant. There are pack houses funded by National Horticulture
Board and the state government but these are very small and basic and are not of significant use to
exporters. These pack houses cater more to the domestic market. Exporters interviewed were of the
view that pack houses are needed at the start of the value chain closer to the production center so that
the goods are handled professionally (and enter cold chain if needed) at the earliest so that there is
minimum value loss of produce. At the exit points need for pack houses was not felt.
3.2.11.2.2. Cold Stores
All stake holders were of the view that stand alone cold stores were neither needed nor viable unless the
owner of the cold store himself is the primary user. There are 82 cold stores in Karnataka. Out of these
3 are known to be completely non-functional. These completely non-functional cold stores are located
in Kolar, Hassan and Chikkaballapur and as such can be considered for conversion to pack houses.
However the feasibility such conversion will have to be individually evaluated. So no cold stores are
recommended and of the existing 3 can be considered for alternative development.
3.2.11.2.3. Food parks in Karnataka
There is only 1 Food Park in Karnataka, based in Tumkur and geared toward catering to the domestic
market. The promoter Future Group (Big Bazaar) is also one of the primary buyers of the produce from
this park.
3.2.11.2.4. 3rd Party Logistics
In India, there are a lot of third party logistics providers. J.M. Baxi group of companies, Maerskline and
K Line Pvt. Ltd. are the prominent private sector players which provide end to end solutions. Hanjin
Shipping and Hamburg Sud India Pvt. Ltd. are other largest International players which also operate in
India. In addition to these, Shipping Coproration of India and Container Corporation of India are the
two prominent public sector shipping and logistics players.

APEDA
Study on identification of export oriented integrated infrastructure for agri products from Karnataka & Tamil Nadu - APEDA (Agriculture Produce Export
Development Authority)
PwC 44
Based on exportable surplus estimated in the crop specific sections, the details of the proposed infrastructure along with the proposed capacities and estimated investment in the identified districts are provided below:
Sr. No
Cluster Districts covered
Commodity Identified
Seasonality
Potential quantity
that can be exported(in
000 MT)
Per day Capacity of the infrastructure
required
Infrastructure required**
Capacity of each unit
Units required based on projected exports
1 Bangalore
Bangalore, Tumkur, Kolar,
Ramnagara, Mandya, Mysore,
Chamrajapur, Chikkaballapur
Grape Feb-April 10,000 110 MT Pack House 60 MT 2
Mango 25 MT Pulping 25 MT/Day 1
Papaya All Year 5000 20 MT
(250 days year) Pack House 60 MT 1
Assorted Vegetables
All year 7000 28 MT
(250 days year) Pack House 60 MT 1
Tomato All year 54000 200 MT Pack House 60 MT 3
Floriculture (exotic)
November-February
2450 Center for
Perishable Cargo at Bangalore
6000 MT/Annum
1
Floriculture (processing)
Grading, Sorting and Packing line
9000 stems /Hour
1
2 Bijapur
Bijapur, Koppal, Bagalkote, Dharwad, Belgaum,
Gadgad, Yadgir, Gulbarga
Pomegranate Jan-April 5000 42 MT Pack House 60 MT 1
Grapes Feb-April 10,000 110 MT Pack House 60 MT 2
Maize Kharif 90,000 Starch Unit 300 MT/Day 1
3 Mangalore
Udupi, Dakshin Kannada, Uttar
Kannada, Kodagu, Shimoga,
Haveri
Pineapples August -
December 13,500 90 MT Pack House 60 MT 2
Floriculture (traditional)
All year 2450 Center for
Perishable Cargo at Bangalore
6000 MT/Annum
-
** Standard capacity of a packhouse – Unit: Installed capacity/day

APEDA
Study on identification of export oriented integrated infrastructure for agri products from Karnataka
& Tamil Nadu - APEDA (Agriculture Produce Export Development Authority)
PwC 45
Cost of the facilities
Sr. No
Location Proposed Infrastructure
Capacity of the proposed infrastructure**
Estimated cost (in lakh)
Number of Units
Total cost in Lakh Rs
1 Bangalore Pack House 60 MT 700 7 4900
Perishable cargo Center
6000 MT/Annum 710 1 710
Multi Juice and Pulp Unit*
25 MT/day 100 1 100
Flower Grading sorting packing line
9000 stems /Hour 210 1 210
2 Bijapur Pack House 60 MT 700 3 2100
Starch Unit 300 MT/Day 9000 1 9000
3 Mangalore Pack House 60 MT 700 2 1400
Total 16 18,420
** Capacity of a packhouse – Unit: Installed capacity/day
*Upgradation of existing unit for export purpose
Pack House
Consists of –
1. Grading sorting facility – 60 MT / Day
2. Ripening Facility – 150 MT
3. Pre-cooling and Cold Store Facility – 300 MT
Center for Perishable Cargo (facility at Delhi Airport Taken as reference)
Total Area 1127 Sq. Mtr.
Cold Room-1 Live Stock Products
a) Space 480 Cubic Mtrs.
b) Temperature 0°Cel. To 4°Cel.
c) Capacity 12 Aircraft Pallets
Cold Room-II Fruits & Vegetables
a) Space 480 Cubic Mtrs.
b) Temperature 10°Cel. To 12°Cel.
c) Capacity 12 Aircraft Pallets
Cold Room-II Fresh Flowers
a) Space 480 Cubic Mtrs.
b) Temperature 0°Cel. To 4°Cel.
c) Capacity 12 Aircraft Pallets
Pre Cool Room: 254 Cubic Mtrs.
a) Space 0°Cel.
b) Temperature (Capable of cooling 10 tons Products from 25° To 5° In 8 Hrs.)

APEDA
Study on identification of export oriented integrated infrastructure for agri products from Karnataka
& Tamil Nadu - APEDA (Agriculture Produce Export Development Authority)
PwC 46
c) Capacity
Examination Area:
a) Space 2024 Cubic Mtrs.
b) Temperature + 16°Cel.
Work Station 2 Nos.
ETV Corridor (Elevating Transfer Vehicle)
a) Space 996 Cubic Mtrs.
b) Temperature + 16°Cel.
Walk Corridor
a) Space 846.65 Cubic Mtrs.
b) Temperature + 16°Cel.
Receiving Area
a) Space 192 Cubic Mtrs.
b) Temperature +°Cel.
ETV Handling Capacity 15000 lbs. Or 6803 Kgs.
Engine Room Space Equivalent to one 40ft. sea container
Flower Grading Sorting and Packing line –
3.2.12. Initial Basic Feasibility of the Infrastructure proposed
The focus of the study was identifying the infrastructure requirements across the 2 states and all
possible value chains. Therefore it was not required to produce a detailed feasibility report for each of
the facilities. Such a report will have to be prepared when the specific project is being prepared. However
a basic feasibility has been conducted for the facilities proposed in terms of expected through put of the
volume of produce. In the assessment we will proceed cluster by cluster.
Fully automatic grader for –
1. Stem length 2. Ripeness 3. Bud-height 4. height of the flower bud 5. automatic bunching, 6. automatic binding and cutting
Other features –
1. optional: 2-level bunching 2. Maximum number of grades/stations: 10 3. Capacity up to 9,000 stems per hour 4. Price range: € 120,000 and € 300,000

APEDA
Study on identification of export oriented integrated infrastructure for agri products from Karnataka
& Tamil Nadu - APEDA (Agriculture Produce Export Development Authority)
PwC 47
3.2.12.1. Bangalore Cluster
At the Bangalore Cluster seven pack houses, one pulping unit, one automated flower processing unit
(grading, sorting and packing line) have been proposed. In addition, a Centre for Perishable Cargo
(CPC) facility has also been proposed.
3.2.12.1.1. Assessment of the Pack Houses proposed
A total of seven pack houses have been proposed for four crops, Grapes, Papaya, Assorted vegetables
and Tomato where each pack house is required to be multi commodity pack house with an average daily
through put of 60 tons of produce. While it is understandable that there would be capacity variance
however, an average through put has been estimated for assessing the volume based viability.
So it is estimated that only the additional volume on account of additional export has been considered
in keeping with the accounting principle of conservatism. The following table depicts the distribution
of addition produce flow in a season wise distribution.
Table 11 Distribution of exportable surplus depending on seasonality
Exportable surplus (in MT)
Seasonality January – March
April - June
July - September
October - December
Crop
Grapes 10,000 February – April
6666 3333
Papaya 5,000 All year 1250 1250 1250 1250
Assorted Vegetables
7,000 All year 1750 1750 1750 1750
Tomato 54,000 All year 13500 13500 13500 13500
Total 23166 19833 16500 16500
The exportable surplus available with each crop is distributed proportionally according to its
seasonality. This distribution helps in identifying the peak season when the pack house facilities will be
used at its maximum. It is observed that the peak season is January – March, where the pack houses
will be handling 23,166 MT of exportable surplus.
Capacity utilization and competition
The throughput for the January – March season will be 257 MT/day, as the exportable surplus is 23,166
MT and the seasonality is 90 days. The total capacity per day of all the pack houses is 420 MT (installed
capacity of one pack house/day: 60MT and total pack houses proposed are 7). Therefore the capacity
utilization in the peak season is calculated to be 61%, which suggests that it would be viable to operate
the pack houses.
However, two new pack houses are coming up in this cluster in Kolar and Mysore. Therefore, we are
required to reduce the number of pack houses being proposed to 5 pack houses instead of 7 pack houses.
The existing pack houses in this cluster are being utilized to the level 70% as per the field level feedback
however this is only an estimate as the utilisation is not tracked on continuous basis.
Hence the recommended number of pack houses is 5 for this cluster.

APEDA
Study on identification of export oriented integrated infrastructure for agri products from Karnataka
& Tamil Nadu - APEDA (Agriculture Produce Export Development Authority)
PwC 48
3.2.12.1.2. Assessment of Pulping Unit
One pulping unit has been proposed for Mango, with a per day capacity for processing 25 MT/day of
surplus Mango pulp.
Capacity utilization and competition
Surplus quantity for pulping is 25 MT/day, and the capacity of one pulping unit is 25 MT/day, therefore
the capacity utilization will be 100%, if it is assumed that it will be fully utilized to its capacity. Currently
there are a large number of pulping units in the region bordering Karnataka, Tamil Nadu and erstwhile
Andhra Pradesh. Yet it has recommended due to demand for the field level stakeholders, so only
capacity enhancement of 25 MT/day is recommended and the feasibility of the same needs to be carried
out with local availability of raw material.
3.2.12.1.3. Assessment of Centre for Perishable Cargo (CPC)
A CPC unit has been proposed at Bangalore which will cater to 2450 MT of exotic floriculture produce,
with a seasonality of 120 days besides handling assorted fruits and vegetables being air shipped on a
day to day basis.
Capacity utilization and competition
There exists a facility for processing of perishable cargo in Bangalore, however this facility is located in
the old Bangalore airport and the exports happen from the new Bangalore airport. The distance between
the CPC and the airport is about 40 kilometers and passes through the city. This requires the produce
to first enter the city and leave for the airport which leads to delays on transit due to traffic on two legs
of the journey. Therefore while a CPC facility is needed near the new Airport, the CPC in old airport
needs to be discontinued.
3.2.12.1.4. Assessment of flower grading sorting line
One Grading, Sorting and Packing Line has been proposed at Bangalore cluster with a capacity of
processing 9000 stems/hour for floriculture. The Grading line has a capacity of 9000 stems/hour.
There is currently no APEDA approved Flower grading, sorting and packing Line, therefore it will not
have any competition.
Capacity utilization and competition
In order to maintain quality of flowers/floriculture products for export purposes, a new grading, sorting
and packing line (GSP Line) has been proposed. The flowers are graded and sorted at the field location
itself by the farming community, and are sent for export directly from there. The flowers which do not
meet the requirements of export quality are generally sold in the domestic market. However, setting up
facility closer to the supply centers may not be feasible as the farms are dispersed and the aggregation
may not happen in an efficient manner.
3.2.12.1.5. Location
Location should consider factors such as hinterland connectivity, road connectivity and connectivity to
ports for export, and not solely based on availability of land at a particular location.

APEDA
Study on identification of export oriented integrated infrastructure for agri products from Karnataka
& Tamil Nadu - APEDA (Agriculture Produce Export Development Authority)
PwC 49
Commodities for export from Bangalore can be transported through various ports (Sea and Air port)
depending on the export location. Approximate distance of Bangalore from: Mangalore is 373 km, Kochi
is 537 km away, Marmagao is 602 km and Bangalore Airport is 38 km.
Private units have not been taken into consideration as they are under individual owners’ supervision
and used according to need.
3.2.12.2. Bijapur Cluster
In the Bijapur Cluster, three pack houses and one starch unit are proposed.
3.2.12.2.1. Assessment of the Pack Houses proposed
Requirement of three pack houses have been identified for two crops, Pomegranate and Grapes, and
following is the feasibility table for the proposed pack houses.
Table 12 Distribution of exportable surplus depending on seasonality
Exportable surplus (in MT)
Seasonality January - March April - June
Crop
Pomegranate 5,000 January – April 3,750 1,250
Grapes 10,000 February - April 6,666 3,333
Total 10,416 4,583
The exportable surplus available with each crop is distributed proportionally according to its
seasonality. This distribution helps in identifying the peak season when the pack house facilities will be
used at its maximum. It is observed that the peak season is January – March, where the pack houses
will be handling 10,416 MT of exportable surplus.
Capacity utilization and competition
The throughput for the January – March season will be 115 MT/day, as the exportable surplus is 10,416
MT and the seasonality is 90 days. The total capacity per day of all the pack houses is 180 MT (installed
capacity of one pack house per day: 60MT and total pack houses proposed are 3). Therefore the capacity
utilization in the peak season is calculated to be 64%, which suggests that it would be viable to operate
the pack houses.
However, two new pack houses are coming up in the Bijapur Cluster, one in Belgaum and one in Kudchi
therefore only one new pack house is being proposed in the Bijapur Cluster.
3.2.12.2.2. Location
Location should consider factors such as hinterland connectivity, road connectivity and connectivity to
ports for export, and not solely based on availability of land at a particular location.
Commodities for export from Bijapur can be transported through various ports (Sea and Air port)
depending on the export location. Approximate distance of Bijapur from: Mangalore is 570 km,
Marmagao is 348 km, JNPT/Nhava Sheva is 484 km and Bangalore Airport is 539 km.
Private units have not been taken into consideration as they are under individual owners’ supervision
and used according to need.

APEDA
Study on identification of export oriented integrated infrastructure for agri products from Karnataka
& Tamil Nadu - APEDA (Agriculture Produce Export Development Authority)
PwC 50
3.2.12.3. Mangalore Cluster
In Mangalore cluster, one new packhouse is proposed for Pineapples.
3.2.12.3.1. Assessment of the Pack Houses proposed
The exportable surplus quantity for Pineapple is calculated to be 90 MT/day. The potential quantity
that can be exported is 13500 MT. The seasonality of the crop is 150 days, from August to December.
Capacity utilization and competition
The installed capacity of a pack house/day is 60 MT, therefore two pack houses will be required, and its
capacity utilization comes out to be 75%, if it is assumed that it will be fully utilized to its capacity.
However since the seasonality of the crop of only from August to December i.e. 150 days, two dedicated
pack houses only for Pineapple do not seem feasible. As there is one pack house currently being
constructed at Haveri, which lies in the Mangalore cluster, no new pack house is being proposed in
Mangalore.
3.2.12.4. Starch Unit in Bijapur Cluster
A Starch Unit has been proposed in Bijapur Cluster, which will be sourced from Maize. The capacity of
a starch unit is 300 MT/day. The potential quantity that can be exported is 90000 MT, with a
seasonality of 180 days.
The demand for modified starch is expected to grow at 4.1% from 2013 to 2018.2 The functions of starch
in food, feed, and non-food industry includes flocculation, binding water, film-forming properties,
adhesiveness, improvement of pH stability, acidic stability, thickening, increase of shear stability,
process tolerance, and many more properties. These are the special characteristics of modified starch
that makes it useful in various industries.
The potential quantity that can be exported is 90000 MT, with seasonality of 180 days (Kharif season:
Mid-April to Mid-October). The capacity of a starch unit is 300 MT/day. Currently there are no APEDA
approved starch units at Bangalore, Mangalore and Bijapur Cluster. Private units have not been taken
into consideration as they are under individual owners’ supervision and used according to need.
2 http://www.prnewswire.com/news-releases/modified-starch-market-by-raw-material-corn-tapioca-potato-wheat-and-others-by-application-food-feed-and-non-food---global-trends--forecasts-to-2018-257247381.html

APEDA
Study on identification of export oriented integrated infrastructure for agri products from Karnataka
& Tamil Nadu - APEDA (Agriculture Produce Export Development Authority)
PwC 51
3.2.12.5. Revised Cost of the facilities
The study findings were further rationalised with inputs from stakeholders to propose the following
revised list of proposed facilities with revised cost estimates.
Table 13: Revised list of proposed infrastructure with cost estimates
Sr. No
Location Proposed Infrastructure
Capacity of the proposed infrastructure**
Estimated cost (in lakh)
Number of Units
Total cost in Lakh Rs
1 Bangalore
Pack House 60 MT 700 5 3500
Perishable cargo Center
6000 MT/Annum 710 1 710
Pulping Unit* 25 MT/day 100 1 100
2 Bijapur Pack House 60 MT 700 1 700
Starch Unit 300 MT/Day 9000 1 9000
Total 9 14,010
** Capacity of a pack house – Unit: Installed capacity/day
*Upgradation of existing unit for export purpose

APEDA
Study on identification of export oriented integrated infrastructure for agri products from Karnataka
& Tamil Nadu - APEDA (Agriculture Produce Export Development Authority)
PwC 52
4. Identification of crop clusters and surplus availability for exports from Tamil Nadu
4.1. Methodology adopted for crop identification
There are varied type of fruits and vegetables produced in Tamil Nadu. Therefore we need to identify focus crops which have potential for export. In the same regards, focus crops in Tamil Nadu are identified on criteria’s like their contribution to the countries overall production, their current level of exports from India, the estimated contribution of the state in the overall production and exports from India, existing and potential market linkage of the crop and export potential of the crop from the state.
In Tamil Nadu the major crops produced are banana, sapota, gooseberry, pear, carrots, tapioca, sorghum, ragi, maize, groundnut, other tropical vegetables like drumstick, okara, bottle gourd, snake gourd, chilies, capsicum etc. The crops which have international market for export and are exported from India are banana, , tapioca, maize and tropical vegetables. These crops also have strong market linkages and high potential for export. Apart from these crops, livestock products like eggs and chicken meat also has the potential to be exported from the state.
4.2. Methodology adopted to calculate surplus available for export
The calculation of the surplus present in the state that can be exported is based on the total production
of the commodity in the state, wastage and domestic consumption. After deducting domestic
consumption and wastage from the total production we realize the total surplus available with the state
that can either be exported or can be domestically consumed in other states of the country. After this
we apply Pareto principle for calculating the overall exportable potential from the state. Out of the total
production of the commodity only 20 percent of the produce is suitable for export in the international
market. Out of this suitable exportable produce, again 80 percent of the quantity will be directed into
the domestic market and thus only 20 percent of the exportable produce is actually the potential
exportable surplus. This way with the application of Pareto Principle we calculated the total surplus
available for exports. We also applied discounting factor for several crops in consultation with the
exporters.
The projection of the future potential quantity available for export, we forecasted the future potential
export quantity based on the trends of the last 10 years exports and projected them for further coming
years. Based on the current capacity and the future capacity required we identified the capacity of the
proposed infrastructure.
APEDA has already identified Tuticorin as cluster for dry flowers, Theni / Thrichy for Bananas and
Namakkal / Udumalpet for Poultry. While dry flowers are not perishable and the infrastructure required
is not much, Banana and Poultry clusters have been dealt with in the subsequent section and suitable
infrastructure recommended.

APEDA
Study on identification of export oriented integrated infrastructure for agri products from Karnataka
& Tamil Nadu - APEDA (Agriculture Produce Export Development Authority)
PwC 53
4.3. Crop wise identification of the cluster and surplus available in Tamil Nadu
4.3.1. Banana in Tamil Nadu
Banana is one of the most important fruit crop in India. Currently nearly in respect of area it ranks
second and first in production only after mango in this country. India leads the world in banana
production with an annual output of about 29.72 Million tonnes3. In India Tamil Nadu leads in total
production with 5.65 Million tonnes4. The banana culture in India is as old as Indian civilization. It
seems that it is one of the earliest fruit crops grown by mankind at the dawn of civilization.
Considering the nutritive value and fruit value of bananas, it is the most widely available fruit among
all other fruits in the country. Considering the year round availability of fruits, unlike the seasonal
availability of other tree fruits, it has become an inevitable necessity in any household in India, for all
functions. The bananas were grown in Southern Asia even before the prehistoric periods and the world's
largest diversity in banana population is found in this area. Hence, it is generally agreed that all the
edible bananas and plantains are indigenous to the warm, moist regions of tropical Asia comprising the
regions of India, Burma, Thailand and Indo China.
India’s share in the global banana production stands at 26 percent5 followed by countries
like China, Philippines, Ecuador, Brazil and Indonesia. In terms of exports, the top 4 exporters of
banana are Ecuador, Philippines, Guatemala and Cost Rica. The overall global trade in banana is
expected to be of the order of 9497 Million USD and India’s share in the total exports of bananas
stand at 0.14% of the total quantity exported around the world6. So it can be concluded that
although India produces a major quantity of the global banana production, its export in the
international market is very low. This can be attributed to high postharvest losses and high domestic
consumption. India exports both Cavendish G9 and traditional varieties.
The major importing destinations from India are UAE, Nepal, Saudi Arabia, Oman and Kuwait. These
destinations together constitute more than 80 percent of the total export from India. The distribution
of exports of bananas from India is provided below:
3 National Horticulture data base 2013. 4 National Horticulture database 2013. 5 FAOStat 6 UNComtrade

APEDA
Study on identification of export oriented integrated infrastructure for agri products from Karnataka
& Tamil Nadu - APEDA (Agriculture Produce Export Development Authority)
PwC 54
Figure 27: Major banana export markets of India
Source: PwC analysis, UNCOMTRADE
4.3.1.1. Surplus available for export
In terms of production in India, the major banana producing states are Tamil Nadu followed by Gujarat,
Maharashtra, Andhra Pradesh and Karnataka. Tamil Nadu is the largest banana producing state in the
country with a total share of 19 percent of the total production in the country 7. The major banana
producing districts in Tamil Nadu are illustrated below:
Figure 28: Major banana production centers in Tamil Nadu
Source: PwC analysis, Indiastat
The general trend in the overall production of bananas in Tamil Nadu is shown below:
7 National Horticulture Database 2013
United Arab Emirates 39%
Nepal, 17%
Saudi Arabia, 13%
Oman, 8%
Kuwait, 6%others, 17%

APEDA
Study on identification of export oriented integrated infrastructure for agri products from Karnataka
& Tamil Nadu - APEDA (Agriculture Produce Export Development Authority)
PwC 55
Figure 29: Total production of banana in Tamil Nadu (in 000 tonne)
Source: PwC analysis, Indiastat, National Horticulutre Database.
In terms of export, India is not exporting a major quantity to the international market. Only 0.2%8 of
the total production of banana is export out of India in 2012-13. This shows a lot of potential for
increasing the export of bananas from India. In order to enhance the overall export of bananas from
India, major focus should be on increasing exports from Tamil Nadu as it is the leading producer of
bananas in India.
It has been observed that although the Tamil Nadu is the largest producer of bananas in India, it is also
the largest consumer of bananas. But still it has the potential to increase the overall export of banana
from the country. The estimated current and potential export of bananas from Tamil Nadu (based on
previous trends) is illustrated below:
Figure 30: Actual and Potential Export of banana from Tamil Nadu
Source: PwC analysis
8 UNcomtrade data
6116.56667
5200
8253
6736.4
5136.25650
0
1000
2000
3000
4000
5000
6000
7000
8000
9000
2007-08 2008-09 2009-10 2010-11 2011-12 2012-13 2013-14
Total Production in TN (in 000 tonnes)
0
5
10
15
20
25
Actual Exported (in 000 tonnes)

APEDA
Study on identification of export oriented integrated infrastructure for agri products from Karnataka
& Tamil Nadu - APEDA (Agriculture Produce Export Development Authority)
PwC 56
Based on the methodology discussed in section 4.2 we calculate the total potential for banana export in
Tamil Nadu along with the proposed capacity of the identified infrastructure. The available surplus with
Tamil Nadu for export is 22.6 thousand MT9. This clearly indicates that there is a huge gap between the
actual and potential exports in terms of banana. The calculation for the surplus available in Tamil Nadu
is illustrated below:
Table 14: Calculation of the surplus for banana and the capacity of the identified infrastructure
Statement Value
Total Production of bananas in Tamil Nadu in 2013-14 (in 000 tonnes)
5650
Applying Pareto Principle we get total potential for exports (in 000 tonnes)
226
Total projected potential in 2019 250.76
Total current export from India (in 000 tonnes) 28.1
Total exports from Tamil Nadu (in 000 tonnes) 7.7
As the potential for export of export from Tamil Nadu is very high, in coming years we cannot achieve this figure practically. Therefore in consultation with the exporters we have discounted the potential availability, which comes out to be
25.08
The arrival of this crop in a year (in days) 300
Extra per day arrival (in tonnes) 58
Therefore the capacity of the proposed infrastructure should be minimum (in MT/day)
60
The gap identified in the above calculation needs to be filled by providing appropriate infrastructure to
support the export operations. As per the locations shown in Figure 28 we have identified that the
proposed infrastructure should be located in Theni as it is at the minimum distance from all the major
banana producing districts.
It has been observed that the infrastructure requirement for the value added products of banana like
banana chips; banana cookies, banana powder etc. are minimal as they have longer shelf life as
compared to raw banana. Therefore we require export infrastructure for export of raw banana 10 .
Therefore we propose a pack house facility integrated with ripening chamber for the export of bananas
from Theni.
9 Calculation is shown in detail in Annexure A.2 10 Exporters Opinion

APEDA
Study on identification of export oriented integrated infrastructure for agri products from Karnataka
& Tamil Nadu - APEDA (Agriculture Produce Export Development Authority)
PwC 57
Figure 31: Actual and Potential Export of banana from Tamil Nadu
Source: PwC analysis, Indiastat

APEDA
Study on identification of export oriented integrated infrastructure for agri products from Karnataka
& Tamil Nadu - APEDA (Agriculture Produce Export Development Authority)
PwC 58
4.3.2. Eggs in Tamil Nadu
Egg is one of the most important poultry products in India. Currently India is the third largest producer
of eggs in the world. In India, Andhra Pradesh is the leading egg producer with 212103 lakh eggs11.
India’s share in the global egg production stands at 6 percent followed by countries like China, and
United States. In terms of exports, the top 4 exporters of eggs are Netherland, Turkey, Poland and US.
The overall global trade in egg is expected to be of the order of 3466 Million USD12 and India’s share in
the total exports of eggs stand at 9% of the total quantity exported around the world. So it can be
concluded that although India produces a major share of the global egg production, its export in the
international market is very low. This can be attributed to high domestic consumption.
The major importing destinations from India are Afghanistan, Angola, Pakistan, Oman, Liberia and
Maldives. These destinations together constitute more than 80 percent of the total export from India13.
The distribution of exports of bananas from India is provided below:
Figure 32: Major Egg importing nations from India.
Source: PwC analysis, UNCOMTRADE
11 Basic Animal Husbandry Statistics 2013 12 UN Comtrade 13 UN Comtrade
Afghanistan 24%
Angola 13%
Liberia 7%
Maldives 8%
Oman 18%
Pakistan 9%
Others 21%

APEDA
Study on identification of export oriented integrated infrastructure for agri products from Karnataka
& Tamil Nadu - APEDA (Agriculture Produce Export Development Authority)
PwC 59
Surplus available for export
In terms of production, the major egg producing states in India are Andhra Pradesh followed by Tamil
Nadu, Maharashtra, West Bengal and Haryana. Tamil Nadu is the second largest egg producing state
in the country with a total share of 18 percent of the total production in the country. The major egg
producing districts in Tamil Nadu are illustrated below:
Figure 33: Egg production zones in Tamil Nadu
Source: PwC analysis, UNCOMTRADE
The general trend in the overall production of eggs in Tamil Nadu is shown below:
Figure 34: Total Egg Production in Tamil Nadi (in lakh nos.)
Source: PwC analysis, Indiastat, National Horticulutre Database.
63948 62225
80435 83937 88098
108476115137 118518 118526
124370
0
20000
40000
60000
80000
100000
120000
140000
Total egg production in Tamil Nadu (in lakh nos.)

APEDA
Study on identification of export oriented integrated infrastructure for agri products from Karnataka
& Tamil Nadu - APEDA (Agriculture Produce Export Development Authority)
PwC 60
In terms of export, India is not exporting a major quantity of eggs to the international market. Only 1%
of the total production of egg is export out of India in 2012-1314. This shows a lot of potential for
increasing the export of eggs from India. In order to enhance the overall export of eggs from India,
major focus should be on increasing exports from Tamil Nadu as it is a major producer of eggs in India.
It has been observed that although the Tamil Nadu is the second largest producer of eggs in India, it is
also a major consumer of eggs. But still it has the potential to increase the overall export of eggs from
the country. The actual exports of eggs from Tamil Nadu (based on previous trends) is calculated in
Annexure A.4 and illustrated below:
Figure 35: Actual and projected exports from Tamil Nadu
Source: PwC analysis
Based on the methodology discussed in section 4.2 we calculate the total potential for egg export in
Tamil Nadu along with the proposed capacity of the identified infrastructure. The available surplus with
Tamil Nadu for export is 3281 lakh eggs15. This clearly indicates that there is a huge gap between the
actual and potential exports in terms of egg. The surplus eggs available in Tamil Nadu are provided
below:
Table 15: Calculation of the surplus for egg and the capacity of the identified infrastructure
Statement Value
Total Production of eggs in Tamil Nadu in 2012-13 (in lakh nos) 118526
Applying Pareto Principle we get total potential for exports (in lakh nos) 4298
Total production of egg project in 2019 (in lakh nos) 6354
Total current export from India (in lakh nos) 6356
Total exports from Tamil Nadu (in lakh nos) 1641
As the potential for export of export from Tamil Nadu is very high, in coming years we cannot achieve this figure practically. Therefore in consultation with the exporters we have discounted the potential availability, which comes out to be (in lakh nos)
3281
The arrival of this crop in a year (in days) 300
Hence per day extra arrival (in lakh nos) 5
Extra Per day arrival (in lakh nos) 5
Therefore the capacity of the proposed infrastructure should be minimum (in lakh/day)
5lakh eggs/day
14 UN Comtrade 15 Calculation is shown in detail in Appendix A.4
0
500
1000
1500
2000
2500
3000
Year 2004 2005 2006 2007 2008 2009 2010 2011 2012 2013 2014 2015 2016 2017
Actual & Projected Exports from Tamil Nadu

APEDA
Study on identification of export oriented integrated infrastructure for agri products from Karnataka
& Tamil Nadu - APEDA (Agriculture Produce Export Development Authority)
PwC 61
The gap identified needs to be filled by providing appropriate infrastructure to support the export
operations. As per the locations shown in Figure 33 we have identified that the proposed infrastructure
should be located in Nammakkal as it is at the minimum distance from all the major egg producing
districts.
The potential for raw egg is high when compared to processed egg products like egg powder, egg
albumin etc. as per the key exporters and also the processed products have higher shelf life, therefore
they don’t require any infrastructure which is required in the raw perishable egg. Therefore we propose
refer containers for exports of raw eggs.
Figure 36: Our proposed location for the identified infrastructure
Source: PwC analysis
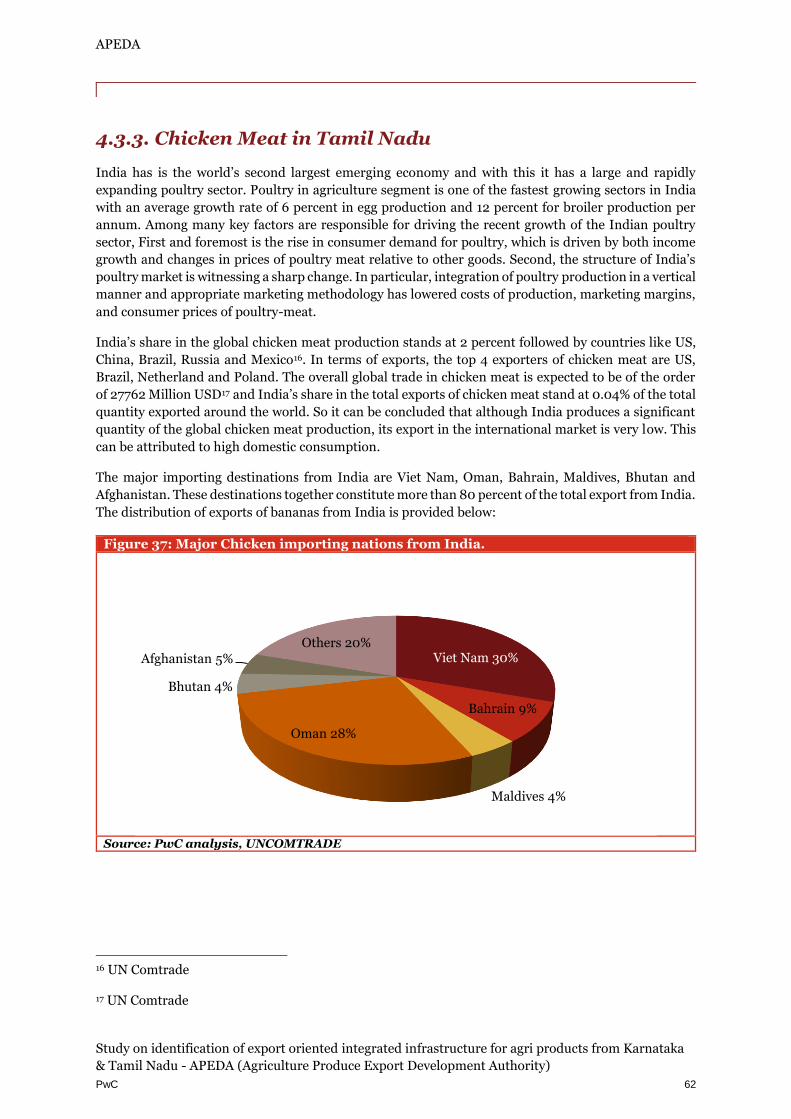
APEDA
Study on identification of export oriented integrated infrastructure for agri products from Karnataka
& Tamil Nadu - APEDA (Agriculture Produce Export Development Authority)
PwC 62
4.3.3. Chicken Meat in Tamil Nadu
India has is the world’s second largest emerging economy and with this it has a large and rapidly
expanding poultry sector. Poultry in agriculture segment is one of the fastest growing sectors in India
with an average growth rate of 6 percent in egg production and 12 percent for broiler production per
annum. Among many key factors are responsible for driving the recent growth of the Indian poultry
sector, First and foremost is the rise in consumer demand for poultry, which is driven by both income
growth and changes in prices of poultry meat relative to other goods. Second, the structure of India’s
poultry market is witnessing a sharp change. In particular, integration of poultry production in a vertical
manner and appropriate marketing methodology has lowered costs of production, marketing margins,
and consumer prices of poultry-meat.
India’s share in the global chicken meat production stands at 2 percent followed by countries like US,
China, Brazil, Russia and Mexico16. In terms of exports, the top 4 exporters of chicken meat are US,
Brazil, Netherland and Poland. The overall global trade in chicken meat is expected to be of the order
of 27762 Million USD17 and India’s share in the total exports of chicken meat stand at 0.04% of the total
quantity exported around the world. So it can be concluded that although India produces a significant
quantity of the global chicken meat production, its export in the international market is very low. This
can be attributed to high domestic consumption.
The major importing destinations from India are Viet Nam, Oman, Bahrain, Maldives, Bhutan and
Afghanistan. These destinations together constitute more than 80 percent of the total export from India.
The distribution of exports of bananas from India is provided below:
Figure 37: Major Chicken importing nations from India.
Source: PwC analysis, UNCOMTRADE
16 UN Comtrade
17 UN Comtrade
Viet Nam 30%
Bahrain 9%
Maldives 4%
Oman 28%
Bhutan 4%
Afghanistan 5%Others 20%

APEDA
Study on identification of export oriented integrated infrastructure for agri products from Karnataka
& Tamil Nadu - APEDA (Agriculture Produce Export Development Authority)
PwC 63
Surplus available for export
In terms of production in India, the major chicken producing states are Andhra Pradesh followed by
Tamil Nadu, Maharashtra and West Bengal. Tamil Nadu is the second largest chicken meat producing
state in the country with a total share of 14 percent of the total production in the country. The major
chicken meat producing districts in Tamil Nadu are illustrated below:
Figure 38: Chicken meat production zones in Tamil Nadu
Source: PwC analysis, UNCOMTRADE
The general trend in the overall production of chicken meat in Tamil Nadu is shown below:
Figure 39: Total production of chicken meat in Tamil Nadu (in tonnes)
Source: PwC analysis, Indiastat, Basic Animal Husbandry Statistics
In terms of export, India is not exporting a major quantity of chicken meat to the international market.
Only 0.4% of the total production of chicken meat is export out of India in 2012-13. This shows a lot of
4248068705
334000356000
397000362000 350000
321095 328188
0
50000
100000
150000
200000
250000
300000
350000
400000
450000
2004-05 2005-06 2007-08 2008-09 2009-10 2010-11 2011-12 2012-13 2013-14
Total Production of chicken meat in Tamil Nadu (tonnes)

APEDA
Study on identification of export oriented integrated infrastructure for agri products from Karnataka
& Tamil Nadu - APEDA (Agriculture Produce Export Development Authority)
PwC 64
potential for increasing the export of chicken meat from India. In order to enhance the overall export of
chicken meat from India, major focus should be on increasing exports from Tamil Nadu as it is a major
producer of chicken meat in India.
Figure 40: Total export of chicken meat in Tamil Nadu (in tonnes)
Source: PwC analysis
It has been observed that although the Tamil Nadu is the second largest producer of chicken meat in
India, it is also a major consumer of chicken meat. But still it has the potential to increase the overall
export of chicken meat from the country.
Based on the methodology discussed in section 4.2 we calculate the total potential for chicken meat
export in Tamil Nadu along with the proposed capacity of the identified infrastructure. Although the
chicken meat export is increasing we require quality standards in the overall exports of chicken meat.
As per the exporters, infrastructure is required to enhance the quality and shelf life of the chicken meat.
Therefore we propose a irradiation facility to enhance the export of chicken meat from Tamil Nadu.
As per the locations shown in Figure 38 we have identified that the proposed infrastructure should be
located in Tirupur as it is at the minimum distance from all the major chicken meat producing districts.
0.00
500.00
1000.00
1500.00
2000.00
2500.00
2004 2005 2007 2008 2009 2011 2012 2013 2014 2015 2016 2017 2018 2019
Exports from Tamil Nadu (in MT)

APEDA
Study on identification of export oriented integrated infrastructure for agri products from Karnataka
& Tamil Nadu - APEDA (Agriculture Produce Export Development Authority)
PwC 65
Therefore we propose Irradiation Facility for exports of chicken meat.
Acceptability of irradiation of food
Irradiation in food reduces the risk of food borne illness, prevent the spread of invasive pests, and delay
or eliminate sprouting or ripening. Food irradiation is permitted by over 60 countries, with about
500,000 metric tons of foodstuffs annually processed worldwide. United States is the major consumer
of irradiated food. The type of food irradiated includes fruits, vegetables and meat products. Apart
from its own installed capacity of irradiated food, United States import irradiated food from Mexico,
Thailand, Viet Nam and India. In European countries Belgium, Netherlands and France are the major
suppliers of irradiated meat.
Figure 41: Our proposed infrastructure
Source: PwC analysis

APEDA
Study on identification of export oriented integrated infrastructure for agri products from Karnataka
& Tamil Nadu - APEDA (Agriculture Produce Export Development Authority)
PwC 66
4.3.4. Maize and Tapioca in Tamil Nadu
Maize is one of the most important cereal crops of the world and contributes to food security in most of
the developing countries. In India, maize is emerging as third most important crop after rice and wheat.
Its importance lies in the fact that it is not only used for human food and animal feed but at the same
time it is also widely used for corn starch industry, corn oil production, baby corns etc.
Corn production has nearly doubled from around 12.0 million tons in the early 2000s to around 22
million tons today. This remarkable production growth has been largely driven by adoption of single
cross hybrids in the late 1980’s and continuous demand in domestic and export market. The increasing
use of maize as feed, increasing interest of the consumers in nutritionally enriched products and rising
demand for maize seed are the core driving forces behind emerging importance of maize crop in India.
Maize production is dominated by Andhra Pradesh and Karnataka. Nine states viz. Karnataka, Andhra
Pradesh, Tamil Nadu, Rajasthan, Maharashtra, Bihar, Uttar Pradesh , Madhya Pradesh and Gujarat
account for 85 per cent of India’s maize production and 80 per cent of area under cultivation.
India has witnessed a jump in maize exports from 2007-08. The increase in export volumes is a result
of increased production, higher realization and demand for maize from international markets. Export
volume declined during the period 2009-2011 due to drought conditions leading to low production.
Increase local demand for maize from poultry and starch industries, within India, and application in
diversified industries such as alcoholic beverages, bio-fuel, processed food, corn oil, etc., has kept maize
prices relatively steady. Exports have declined in 2013-14 due to weak export demand which is due to
relatively weak global prices on improved supplies from other competing locations.
The major importing destinations from India are Indonesia, Viet Nam, Malaysia, Taiwan and Nepal.
These destinations together constitute more than 80 percent of the total export from India. The
distribution of exports of maize from India is provided below:
Figure 42: Major Maize importing nations from India.
Source: PwC analysis, UNCOMTRADE
Tapioca is a starch that comes from the roots of a shrub-like plant called cassava. By itself, tapioca is
nearly flavorless. It is most commonly used as a food thickener, and is perhaps best known as an
ingredient in tapioca pudding. The demand for tapioca has emerged due to rising costs of maize have
started using tapioca starch as an alternative to maize starch. India currently produces only 3 percent
of the total world production of tapioca. Tamil Nadu is the largest producer of tapioca in the country
and it also stands first into production of starch and tapioca pearls. Salem district of Tamil Nadu plays
a major role in serving the domestic tapioca market.
Indonesia 33%
Viet Nam 27%
Malaysia 20%
Taiwan 8%
Nepal 3% Others 9%

APEDA
Study on identification of export oriented integrated infrastructure for agri products from Karnataka
& Tamil Nadu - APEDA (Agriculture Produce Export Development Authority)
PwC 67
Tamil Nadu alone accounts for more than 60 percent of the total production of tapioca in India. The
remarkable increase in the production of tapioca in Tamil Nadu is due to high productivity of the crop
in the state. The crop has become an important raw material for the starch and sago industry established
in Salem and Dharampuri districts of Tamil Nadu. The use pattern in Tamil Nadu, particularly in the
Salem district has been quite different. Here tapioca was used principally in the processing factories
and the demand for direct consumption was negligible.
The export of tapioca is very minimal from India. The major tapioca importing countries from India are
US, Saudi Arabia, UAE, Nepal and Netherlands. These countries constitute nearly 80 percent of the
total export of tapioca from India. The distribution of exports of maize from India is provided below:
Figure 43: Major Tapioca importing nations from India.
Source: PwC analysis, UNCOMTRADE
USA 27%
Saudi Arabia18%
United Arab Emirates 17%
Nepal 12%
Netherlands5%
Others 20%

APEDA
Study on identification of export oriented integrated infrastructure for agri products from Karnataka
& Tamil Nadu - APEDA (Agriculture Produce Export Development Authority)
PwC 68
Surplus available with the state
In terms of production in India, the major maize producing states are Andhra Pradesh, Karnataka,
Tamil Nadu, Maharashtra and Bihar. Tamil Nadu is the third largest maize producing state in the
country with a total share of 9 percent of the total production in the country. The major maize producing
districts in Tamil Nadu are illustrated below:
Figure 44: Major maize production zones
Source: PwC analysis, UNCOMTRADE
Similarly, in terms of production of tapioca, the major tapioca producing states in India are Tamil
Nadu & Kerala. These two states constitute nearly 92 percent of the total tapioca produced in the
country. In Tamil Nadu the major tapioca producing districts are illustrated below:
Figure 45: Major tapioca production zones
Source: PwC analysis, UNCOMTRADE

APEDA
Study on identification of export oriented integrated infrastructure for agri products from Karnataka
& Tamil Nadu - APEDA (Agriculture Produce Export Development Authority)
PwC 69
The general trend in the overall production of maize and tapioca in Tamil Nadu is shown below:
Figure 46: Total production of maize in Tamil Nadu (in 000 tonnes)
Source: PwC analysis, Indiastat, National Horticulutre Database.
Figure 47: Total production of tapioca in Tamil Nadu (in 000 tonnes)
Source: PwC analysis, Indiastat, National Horticulutre Database.
In terms of export, India is not exporting a major quantity of maize and tapioca to the international
market. Only 0.03% of the total production of tapioca is export out of India in 2013-14. This shows a lot
of potential for increasing the export of tapioca and tapioca based products from India. In order to
enhance the overall export of tapioca and tapioca based products from India, major focus should be on
increasing exports from Tamil Nadu as it is a major producer of tapioca in India.
810.6
1257.81144.3
1027.5
1695.471829.9
0
200
400
600
800
1000
1200
1400
1600
1800
2000
2007-08 2008-09 2009-10 2010-11 2011-12 2012-13
Total production of Maize in Tamil Nadu (in 000 tonnes)
6114.4
6664.7
5113.65522.7
5964.49
4523.234975.56
0
1000
2000
3000
4000
5000
6000
7000
2007-08 2008-09 2009-10 2010-11 2011-12 2012-13 2013-14
Total production of tapioca in Tamil Nadu (in 000 tonnes)

APEDA
Study on identification of export oriented integrated infrastructure for agri products from Karnataka
& Tamil Nadu - APEDA (Agriculture Produce Export Development Authority)
PwC 70
Similarly in case of maize, India has witnessed a jump in maize exports from 2007-08. The increase in
export volumes is a result of increased production, higher realization and demand for maize from
international markets. Export volume declined during the period 2009-2011 due to drought conditions
leading to low production. Increase local demand for maize from poultry and starch industries, within
India, and application in diversified industries such as alcoholic beverages, bio-fuel, processed food,
corn oil, etc., has kept maize prices relatively steady. Exports have declined in 2013-14 due to weak
export demand which is due to relatively weak global prices on improved supplies from other competing
locations. India has exported 13 percent of its total maize production in 2013-14.
The above argument clearly indicates that there is a huge gap between the actual and potential exports
in terms of maize and tapioca. The gap needs to be filled by providing appropriate infrastructure to
support the export operations. Therefore apart from exporting maize in raw form, we can convert the
raw maize into value added product like starch which has high global demand and better price than raw
material in international market. In the same regards we propose to set up a starch unit at Erode for the
processing of tapioca and maize.
The total amount of maize and tapioca available for processing is calculated below:
Table 16: Calculation of the surplus for maize & tapioca and the capacity of the identified
infrastructure
Statement18 Value
Total surplus of Maize available in Tamil Nadu in 2019 (in 000 tonnes)
102.07
Total surplus of Tapioca available in Tamil Nadu in 2019 (in 000 tonnes)
117.37
Total surplus of maize that can be converted to starch 10%
Total surplus of tapioca that can be converted to starch 50%
Total maize available for starch production (in tonnes) 10207.4
Total tapioca available for starch production (in tonnes) 58685
Total number of working days 250
Total per day availability of maize 40.8
Total per day availability of tapioca 234.7
Total capacity of the plant per day 275.56
18 See all figure from Appendix A

APEDA
Study on identification of export oriented integrated infrastructure for agri products from Karnataka
& Tamil Nadu - APEDA (Agriculture Produce Export Development Authority)
PwC 71
4.3.5. Other Vegetables in Tamil Nadu
India is a major producer of varieties of fruits and vegetables. The country has been endowed with a
wide range of climatic and physio-geographical conditions which are suitable for growing various kinds
of vegetable cops. The country is the second largest producer of fruits and vegetables in the world. Fruits
and vegetables together form 92 percent of the total horticulture production in the country.
The country has witnessed a tremendous increase in the overall vegetable production, especially during
the green revolution. Increasing per capita income, health consciousness, urbanization, increasing
working women, shifting of farmers to high value vegetables due to higher income, favourable income
elasticity of demand and annual growth rate for domestic demand for fruits & vegetables are also
important ingredients for fuelling vegetable growth in the country.
In terms of production, major vegetables producing states in India are West Bengal, Uttar Pradesh,
Bihar, Madhya Pradesh, Gujarat, Maharashtra, Odisha, Tamil Nadu, Andhra Pradesh, Karnataka and
Haryana. These states constitute more than 80 percent of the total vegetable production in the country.
Tamil Nadu is ranked 8th in terms of the total vegetable production in the country. The state accounts
for nearly 3 percent of the area under vegetables in the country and accounts for 5 percent of the total
vegetable production of the country. The major vegetable crops of Tamil Nadu are tapioca, onion,
tomato, brinjal, okara, gourds, cabbage and drum sticks. These vegetable crops accounts for more than
87 percent of the total area as well as the total production of vegetables.
Tamil Nadu is also known for the exports of tropical vegetables from the state. The tropical vegetables
like drum sticks, lady fingers, bottle gourd, snake gourd, bitter gourd, snake gourd etc. the export these
tropical vegetables are taking place majorly from Chennai and Cochin airports. These terminals
generally export vegetables to countries like UAE, Saudi Arabia, Kuwait and other Middle East
countries.
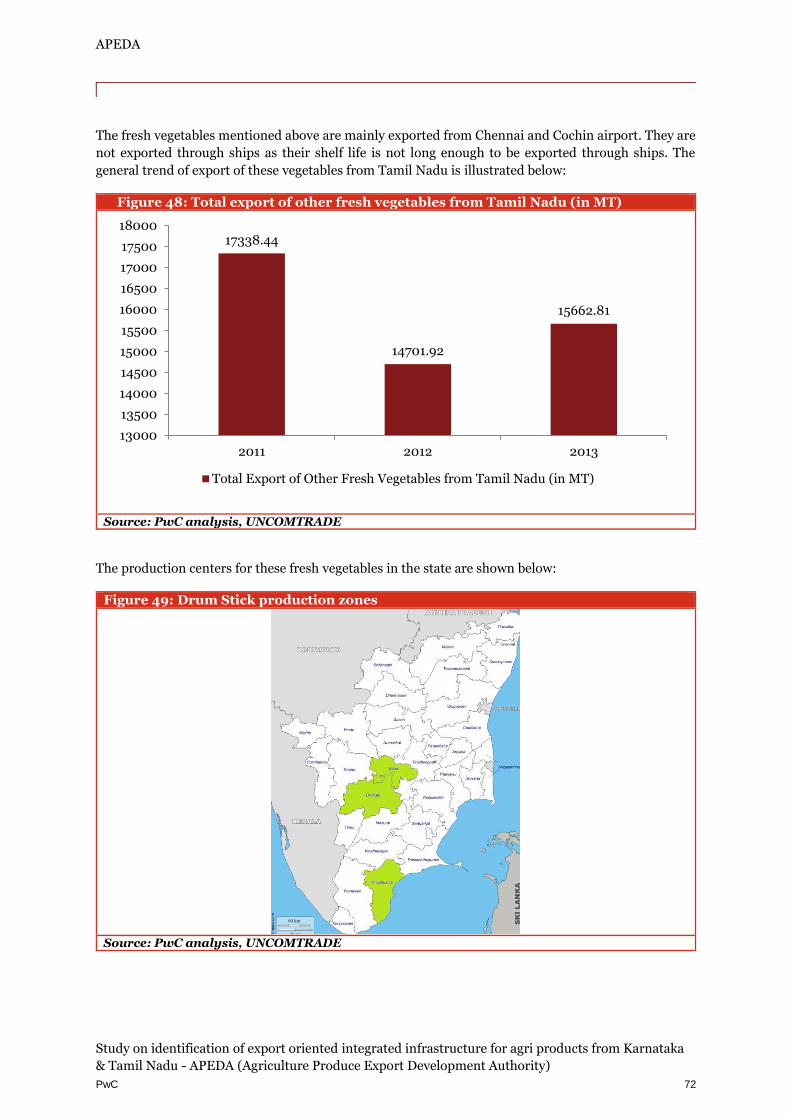
APEDA
Study on identification of export oriented integrated infrastructure for agri products from Karnataka
& Tamil Nadu - APEDA (Agriculture Produce Export Development Authority)
PwC 72
The fresh vegetables mentioned above are mainly exported from Chennai and Cochin airport. They are
not exported through ships as their shelf life is not long enough to be exported through ships. The
general trend of export of these vegetables from Tamil Nadu is illustrated below:
Figure 48: Total export of other fresh vegetables from Tamil Nadu (in MT)
Source: PwC analysis, UNCOMTRADE
The production centers for these fresh vegetables in the state are shown below:
Figure 49: Drum Stick production zones
Source: PwC analysis, UNCOMTRADE
17338.44
14701.92
15662.81
13000
13500
14000
14500
15000
15500
16000
16500
17000
17500
18000
2011 2012 2013
Total Export of Other Fresh Vegetables from Tamil Nadu (in MT)

APEDA
Study on identification of export oriented integrated infrastructure for agri products from Karnataka
& Tamil Nadu - APEDA (Agriculture Produce Export Development Authority)
PwC 73
Figure 50: Lady Finger production zones
Source: PwC analysis, UNCOMTRADE
Figure 51: Bottle Gourd production zones
Source: PwC analysis, UNCOMTRADE
The export of these vegetable are projected over the years in order to assess the future requirement of
the infrastructure. As these vegetable are highly perishable they are exported through air freight on
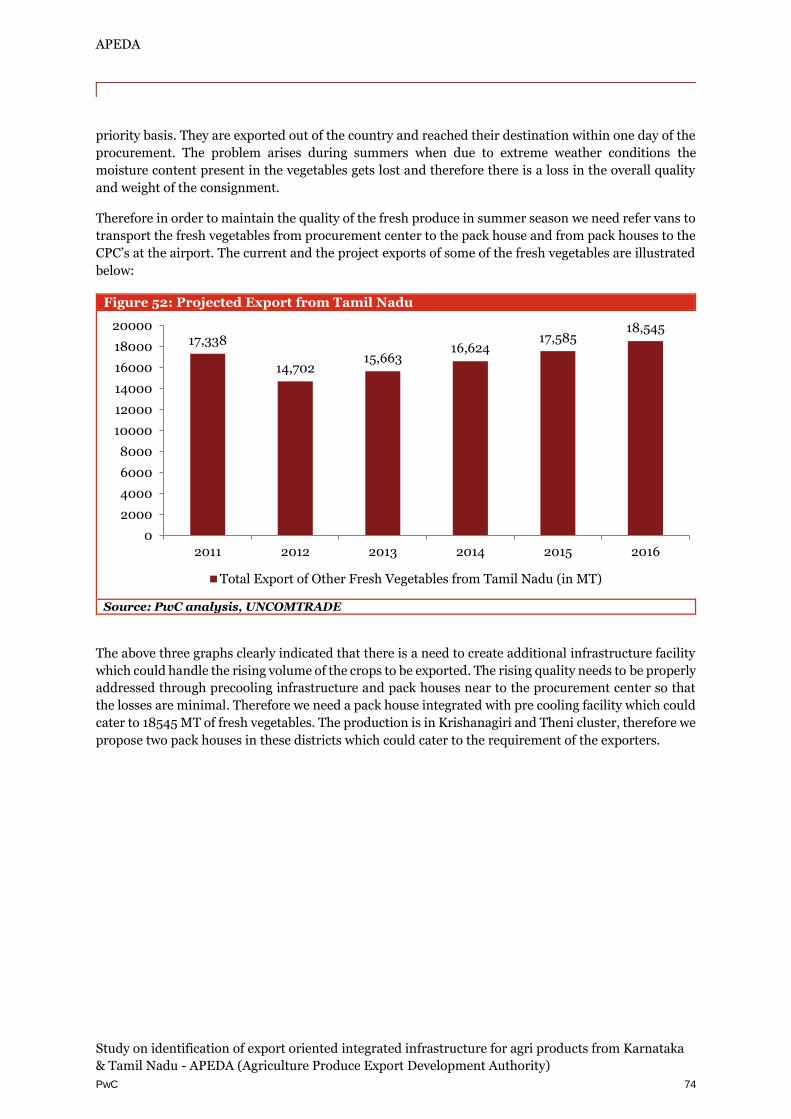
APEDA
Study on identification of export oriented integrated infrastructure for agri products from Karnataka
& Tamil Nadu - APEDA (Agriculture Produce Export Development Authority)
PwC 74
priority basis. They are exported out of the country and reached their destination within one day of the
procurement. The problem arises during summers when due to extreme weather conditions the
moisture content present in the vegetables gets lost and therefore there is a loss in the overall quality
and weight of the consignment.
Therefore in order to maintain the quality of the fresh produce in summer season we need refer vans to
transport the fresh vegetables from procurement center to the pack house and from pack houses to the
CPC’s at the airport. The current and the project exports of some of the fresh vegetables are illustrated
below:
Figure 52: Projected Export from Tamil Nadu
Source: PwC analysis, UNCOMTRADE
The above three graphs clearly indicated that there is a need to create additional infrastructure facility
which could handle the rising volume of the crops to be exported. The rising quality needs to be properly
addressed through precooling infrastructure and pack houses near to the procurement center so that
the losses are minimal. Therefore we need a pack house integrated with pre cooling facility which could
cater to 18545 MT of fresh vegetables. The production is in Krishanagiri and Theni cluster, therefore we
propose two pack houses in these districts which could cater to the requirement of the exporters.
17,338
14,70215,663
16,62417,585
18,545
0
2000
4000
6000
8000
10000
12000
14000
16000
18000
20000
2011 2012 2013 2014 2015 2016
Total Export of Other Fresh Vegetables from Tamil Nadu (in MT)

APEDA
Study on identification of export oriented integrated infrastructure for agri products from Karnataka
& Tamil Nadu - APEDA (Agriculture Produce Export Development Authority)
PwC 75
4.3.6. Summary of Infrastructure required in Tamil Nadu
In the previous section we have discussed the potential of the state in terms of availability of the
exportable commodities. It has been observed that the current status of the exports from the state is
minimal when compared to the total potential available with the state to export. The huge gap in exports
is due to unavailability of the supporting infrastructure to promote exports of the commodities. Good
infrastructure facilities ensure the proper delivery and safety of the exported product along with savings
in time and cost.
In Tamil Nadu it has been observed that the major commodities having potential for export are banana,
egg, chicken meat, maize, tapioca, sapota, gooseberry, vegetables like drumstick, lady finger (okara) and
bottle gourd. Although these commodities are already being exported from the state but due to lack of
infrastructure their actual potential has yet to be achieved. The infrastructure gaps are present in the
form of non-availability of pack houses, over utilized pack houses, non-availability of refer vans for
transportation of perishable commodities, non-availability of refer containers for transport of
commodities to sea ports, pre-cooling facilities, processing facilities etc. In order to enhance the overall
export from the state and realize actual export potential of the state, these gaps has to be plugged.
In the same regards, we have identified various districts based on their respective production strength, proximity the port, existing market and infrastructure availability for exports, connectivity and their potential for further development.
4.3.6.1. Exit Points for Tamil Nadu
The exit options for export products from Karnataka are Chennai – Sea and Air port, Cochin Sea Port
and Bangalore Airport. Tuticorin Sea Port is also an exit option used by exporters.
Developing infrastructure around Chennai and Tuticorin
1. Dedicated berth at Chennai port – Not Feasible
a. Dedicated berth needs 1.3 million containers per annum to be viable while food
container traffic is limited to about 0.2 million containers only
b. For a dedicated berth, a ship needs to take its entire cargo from the same berth and
food / refer container shipments are not large enough to meet that requirement
2. Development of Infrastructure around Chennai port – not Feasible
a. There are over 60 ICDs/CFCs catering to goods moving through Chennai port, adding
additional facilities would be un-necessary
3. Development of facilities around Tuticorin Port – Not feasible
a. Shipping frequency is low and the exporter may not find it possible to ship significant
volumes
b. The port has low draft therefore large ship cannot be berthed there
c. International logistics is volume driven and using small ships is not viable therefore the
exports have to go through large ports and be shipped by largest ships possible
An ICD has been recommended at Theni though at present there is no viability, because it is deemed
essential for development of trade. This ICD needs to be connected to Cochin, Chennai and Tuticorin
through conventional i.e. road and where feasible through rails.

APEDA
Study on identification of export oriented integrated infrastructure for agri products from Karnataka
& Tamil Nadu - APEDA (Agriculture Produce Export Development Authority)
PwC 76
4.3.6.2. Existing Infrastructure
4.3.6.2.1. Pack Houses
Tamil Nadu has only 4 pack houses (3 at the time study and 1 recently added) that are APEDA
recognized pack houses and while the utilisation of the pack houses are not tracked even by the owners
(because capacity varies with crop), yet the stakeholders interviewed were of the view that utilisation
will not be less than 80-85% as the pack house are used for various crops round the year.
4.3.6.2.2. Cold Stores
There are 136 cold stores in Tamil Nadu. Though as usual the utilisation is low or seasonal there no non-
functional cold stores in Tamil Nadu. It is estimated by stake holders that the utilisation would be in the
range of 60-65% and in some cases even 70%. The cold stores in Tamil Nadu are performing better on
account marine, milk and animal products which are less seasonal than fruits and vegetables. In
addition, cold storage increases the life of these products much more than it does for fruits and
vegetables. In Namakkal 2 new cold stores have been recommended based on both projected growth in
egg exports and also based on demand from stakeholders. However, there project feasibility has to be
studied before actually approving a project.
4.3.6.2.3. Food parks in Tamil Nadu
There are no food parks in Tamil Nadu, though innovations in processed foods have been going on. A
food processing incubation center cold have been recommended but one such facility is already under
implementation under the private sector, therefore it has not been included.
4.3.6.2.4. Innovative technologies
Technological innovations seen elsewhere are not easy to adopt for the Indian market due to the
fragmented farm holdings and the limited investment capacity in India. A case in the point is the
example of overhead conveyor cables for transportation bananas, a very successful innovation in
Philippines is effective there due to the large size of the holdings and not applicable in the Indian setting
because of the small farms. However, in the recommendations gamma irradiation facilities have been
included as it is not affected by farm sizes and more over for the Indian system it is able to address some
of the Sanitary and Phyto-Sanitary issues.
4.3.6.2.5. 3rd Party Logistics
In India, there are a lot of third party logistics providers. J.M. Baxi group of companies, Maerskline and
K Line Pvt. Ltd. are the prominent private sector players which provide end to end solutions. Hanjin
Shipping and Hamburg Sud India Pvt. Ltd. are other largest International players which also operate in
India. In addition to these, Shipping Corporation of India and Container Corporation of India are the
two prominent public sector shipping and logistics players.
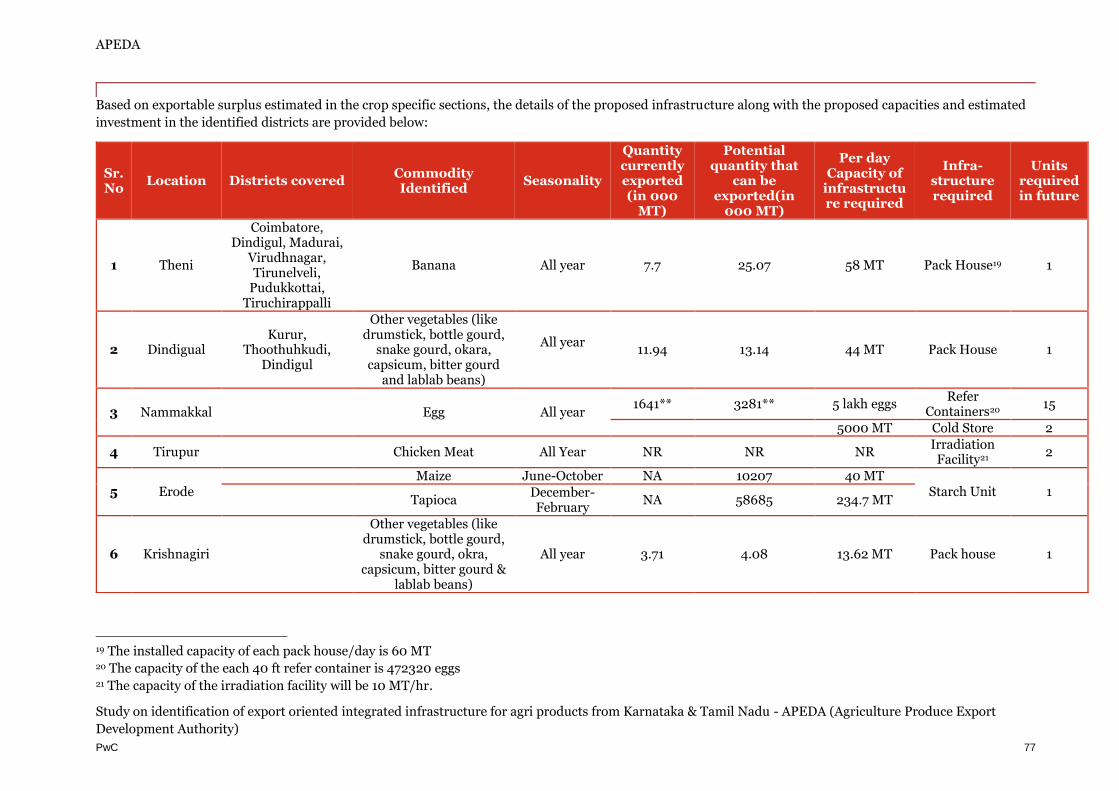
APEDA
Study on identification of export oriented integrated infrastructure for agri products from Karnataka & Tamil Nadu - APEDA (Agriculture Produce Export
Development Authority)
PwC 77
Based on exportable surplus estimated in the crop specific sections, the details of the proposed infrastructure along with the proposed capacities and estimated
investment in the identified districts are provided below:
19 The installed capacity of each pack house/day is 60 MT 20 The capacity of the each 40 ft refer container is 472320 eggs 21 The capacity of the irradiation facility will be 10 MT/hr.
Sr. No
Location Districts covered Commodity Identified
Seasonality
Quantity currently exported (in 000
MT)
Potential quantity that
can be exported(in
000 MT)
Per day Capacity of
infrastructure required
Infra-structure required
Units required in future
1 Theni
Coimbatore, Dindigul, Madurai,
Virudhnagar, Tirunelveli,
Pudukkottai, Tiruchirappalli
Banana All year 7.7 25.07 58 MT Pack House19 1
2 Dindigual Kurur,
Thoothuhkudi, Dindigul
Other vegetables (like drumstick, bottle gourd,
snake gourd, okara, capsicum, bitter gourd
and lablab beans)
All year
11.94 13.14 44 MT Pack House 1
3 Nammakkal Egg All year 1641** 3281** 5 lakh eggs
Refer Containers20
15
5000 MT Cold Store 2
4 Tirupur Chicken Meat All Year NR NR NR Irradiation Facility21
2
5 Erode Maize June-October NA 10207 40 MT
Starch Unit 1 Tapioca
December-February
NA 58685 234.7 MT
6 Krishnagiri
Other vegetables (like drumstick, bottle gourd,
snake gourd, okra, capsicum, bitter gourd &
lablab beans)
All year 3.71 4.08 13.62 MT Pack house 1
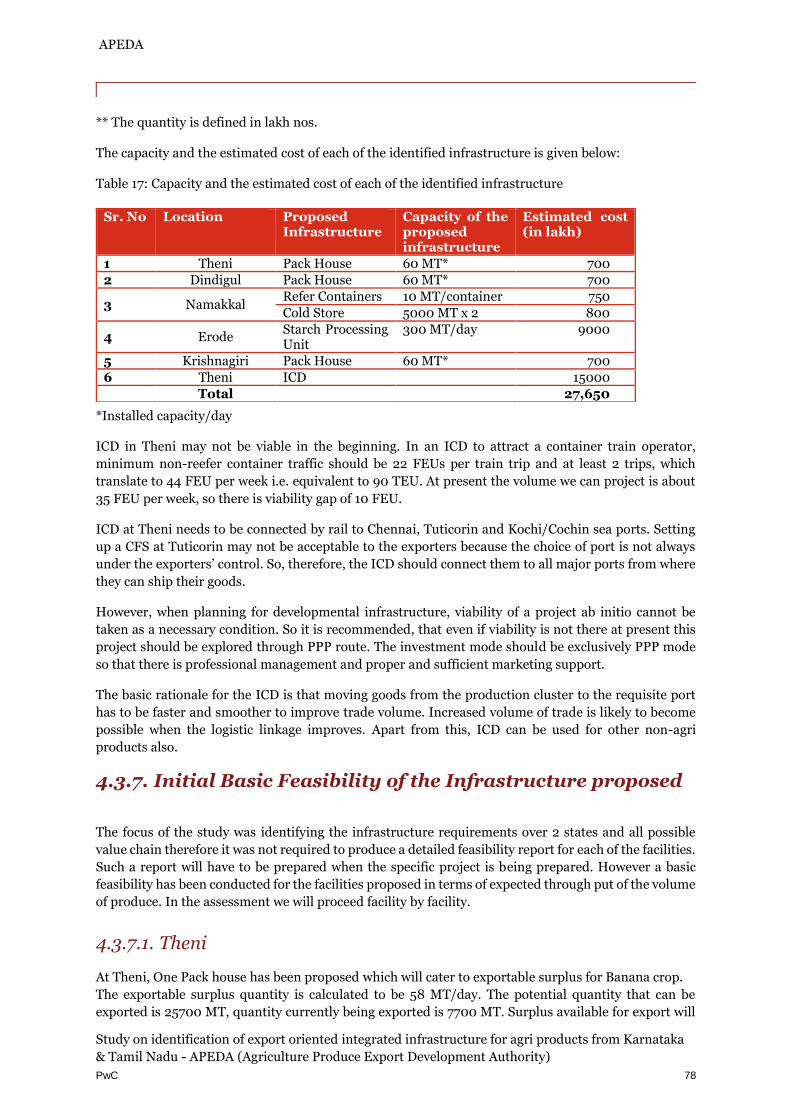
APEDA
Study on identification of export oriented integrated infrastructure for agri products from Karnataka
& Tamil Nadu - APEDA (Agriculture Produce Export Development Authority)
PwC 78
** The quantity is defined in lakh nos.
The capacity and the estimated cost of each of the identified infrastructure is given below:
Table 17: Capacity and the estimated cost of each of the identified infrastructure
*Installed capacity/day
ICD in Theni may not be viable in the beginning. In an ICD to attract a container train operator,
minimum non-reefer container traffic should be 22 FEUs per train trip and at least 2 trips, which
translate to 44 FEU per week i.e. equivalent to 90 TEU. At present the volume we can project is about
35 FEU per week, so there is viability gap of 10 FEU.
ICD at Theni needs to be connected by rail to Chennai, Tuticorin and Kochi/Cochin sea ports. Setting
up a CFS at Tuticorin may not be acceptable to the exporters because the choice of port is not always
under the exporters’ control. So, therefore, the ICD should connect them to all major ports from where
they can ship their goods.
However, when planning for developmental infrastructure, viability of a project ab initio cannot be
taken as a necessary condition. So it is recommended, that even if viability is not there at present this
project should be explored through PPP route. The investment mode should be exclusively PPP mode
so that there is professional management and proper and sufficient marketing support.
The basic rationale for the ICD is that moving goods from the production cluster to the requisite port
has to be faster and smoother to improve trade volume. Increased volume of trade is likely to become
possible when the logistic linkage improves. Apart from this, ICD can be used for other non-agri
products also.
4.3.7. Initial Basic Feasibility of the Infrastructure proposed
The focus of the study was identifying the infrastructure requirements over 2 states and all possible
value chain therefore it was not required to produce a detailed feasibility report for each of the facilities.
Such a report will have to be prepared when the specific project is being prepared. However a basic
feasibility has been conducted for the facilities proposed in terms of expected through put of the volume
of produce. In the assessment we will proceed facility by facility.
4.3.7.1. Theni
At Theni, One Pack house has been proposed which will cater to exportable surplus for Banana crop.
The exportable surplus quantity is calculated to be 58 MT/day. The potential quantity that can be
exported is 25700 MT, quantity currently being exported is 7700 MT. Surplus available for export will
Sr. No Location Proposed Infrastructure
Capacity of the proposed infrastructure
Estimated cost (in lakh)
1 Theni Pack House 60 MT* 700
2 Dindigul Pack House 60 MT* 700
3 Namakkal Refer Containers 10 MT/container 750
Cold Store 5000 MT x 2 800
4 Erode Starch Processing Unit
300 MT/day 9000
5 Krishnagiri Pack House 60 MT* 700
6 Theni ICD 15000
Total 27,650
APEDA
Study on identification of export oriented integrated infrastructure for agri products from Karnataka
& Tamil Nadu - APEDA (Agriculture Produce Export Development Authority)
PwC 79
be 18000 MT (25700-7700). The seasonality of Banana crop is 300 days, therefore per day surplus
comes out to be 58 MT/day.
4.3.7.1.1. Capacity utilization and competition
The installed capacity/day of a pack house is 60 MT, therefore one pack house will suffice the surplus,
and its capacity utilization comes out to be 97%, if it is assumed that it will be fully utilized to its capacity.
Currently there are no APEDA approved pack houses at Theni, therefore there will be no competition
to this new pack house that is being proposed.
4.3.7.1.2. Location
Location should consider factors such as hinterland connectivity, road connectivity and connectivity to
ports for export, and not solely based on availability of land at a particular location. Banana for export
from Theni can be transported through various ports depending on the export location. Approximate
distance of Theni from: Chennai is 509 km, Kochi is 190 km away and Tuticorin is 212 km.
4.3.7.2. Dindigul
At Dindigul, improvements in the existing pack house have been suggested.
The exportable surplus quantity is calculated to be 44 MT/day. The potential quantity that can be
exported is 13140 MT, quantity currently being exported is 11940 MT. The seasonality for other fresh
vegetables is 300 days, therefore per day surplus comes out to be 44MT/day.
4.3.7.2.1. Capacity utilization and competition
The installed capacity/day of a pack house is 60 MT, therefore one pack house will suffice the surplus,
and its capacity utilization comes out to be 73%, if it is assumed that it will be fully utilized to its capacity.
However there is one APEDA approved pack house already at Dindigul for fruits and vegetables.
Therefore it is suggested that instead of a new pack house the improvements may be planned.
4.3.7.2.2. Location
Location considers factors such as hinterland connectivity, road connectivity and connectivity to ports
for export, and not solely based on availability of land at a particular location. Other fresh vegetable for
export from Dindigul can be transported through various ports depending on the export location.
Approximate distance of Dindigul from: Chennai is 431 km, Kochi is 196 km away and Tuticorin is 210
km.
4.3.7.3. Erode
A Starch unit has been proposed at Erode, with the raw starch being sourced from Maize and Tapioca.
The demand for modified starch is expected to grow at 4.1% from 2013 to 2018. 22 The functions of
starch in food, feed, and non-food industry includes flocculation, binding water, film-forming
properties, adhesiveness, improvement of pH stability, acidic stability, thickening, increase of shear
stability, process tolerance, and many more properties. These are the special characteristics of modified
starch that makes it useful in various industries.
22 http://www.prnewswire.com/news-releases/modified-starch-market-by-raw-material-corn-tapioca-potato-wheat-and-others-by-application-food-feed-and-non-food---global-trends--forecasts-to-2018-257247381.html

APEDA
Study on identification of export oriented integrated infrastructure for agri products from Karnataka
& Tamil Nadu - APEDA (Agriculture Produce Export Development Authority)
PwC 80
4.3.7.3.1. Location
Location should consider factors such as hinterland connectivity, road connectivity and connectivity to
ports for export, and not solely based on availability of land at a particular location.
Erode is located 426 km from Ennore, 409 km from Chennai, 349 km away from Tuticorin, 456 km
from Mangalore and 286 km from Kochi.
4.3.7.4. Krishnagiri
At Krishnagiri, One Pack house has been proposed which will cater to exportable surplus for other fresh
vegetables.
The exportable surplus quantity is calculated to be 14 MT/day. The potential quantity that can be
exported is 4080 MT, quantity currently being exported is 3710 MT. For Krishnagiri the surplus is taken
4080 MT as the current quantity being exported is not through a pack house and is done in a remote
area. The seasonality for other fresh vegetables is 300 days, therefore per day surplus comes out to be
14 MT/day.
4.3.7.4.1. Capacity utilization and competition
The installed capacity/day of a pack house is 60 MT, therefore one pack house will suffice the surplus,
and its capacity utilization comes out to be 23%, if it is assumed that it will be fully utilized to its capacity.
There is no APEDA approved pack house at Krishnagiri for fruits and vegetables.
However given that the capacity utilization is less than 50% for the category other fresh vegetables, and
no pack house is present it can also be used for other commodities in the region.
4.3.7.4.2. Location
Location should consider factors such as hinterland connectivity, road connectivity and connectivity to
ports for export, and not solely based on availability of land at a particular location.
Other fresh vegetable for export from Krishnagiri can be transported through various ports depending
on the export location. Approximate distance of Krishnagiri from: Chennai is 256 km, Kochi is 463 km
away, Tuticorin is 492 km, Mangalore lies at 475 km and Ennore is 274 km away.
4.3.7.5. Nammakkal
At Nammakkal, fifteen reefer containers have been proposed for a month.
The current quantity of eggs being exported are 1641 lakh numbers, the projected potential is 3281 lakh
numbers. Therefore the additional numbers of eggs that can be exported are 1640 lakh numbers.
4.3.7.5.1. Capacity Utilization
Capacity of a 40 feet refer container is approximately 5 lakh eggs per day. For 1640 lakh number of
surplus eggs, the surplus per day comes out to be 5 lakh eggs per day. (Exportable surplus: 1640 lakh
numbers, and eggs are produced round the year: 300 days)
One refer container can transport the eggs to export destinations of India, mainly Afghanistan, Oman,
Maldives and Pakistan, and return to Indian ports in 2 days. Therefore 15 refer containers will be
required for a month.

APEDA
Study on identification of export oriented integrated infrastructure for agri products from Karnataka
& Tamil Nadu - APEDA (Agriculture Produce Export Development Authority)
PwC 81
4.3.7.5.2. Location
The reefer containers have been proposed to be located at Nammakkal, where they would be directly
transported to the exporting ports. Nammakkal is located 408 km from Ennore, 392 km from Chennai,
329 km away from Tuticorin, 633 km from Mangalore and 332 km from Kochi.
4.3.7.6. Revised cost estimates
The study findings were further rationalised with inputs from stakeholders to propose the following
revised list of proposed facilities with revised cost estimates.
Table 18: Revised list of proposed infrastructure with cost estimates
*Installed capacity/day
Sr. No
Location Proposed Infrastructure
Capacity of the proposed
infrastructure
No. of units proposed
Estimated cost (in lakh)
1 Theni Pack House 60 MT* 1 700
ICD - 1 15000
2 Namakkal Refer Containers 10
MT/container 750
Cold Store 1000 MT 2 800
3 Erode Starch Processing Unit
300 MT/day 1 9000
4 Krishnagiri Pack House 60 MT* 1 700
Total 26,950

APEDA
Study on identification of export oriented integrated infrastructure for agri products from Karnataka
& Tamil Nadu - APEDA (Agriculture Produce Export Development Authority)
PwC 82
5. Assessment of Exit Point Infrastructure
5.1. Exit point Infrastructure
Infrastructure requirements at ports are defined by various structural and operational factors to ensure safe and timely transportation of quality products. Structural factors namely nature of the product (fragile, perishable, temperature sensitive, etc.), shelf life of the produce, packaging and quality requirements of the importing country and operational factors such as mode of transportation deployed, overhauls & lead times, transportation conditions (moisture percentage, humidity levels, temperature fluctuations in transit), etc. play a crucial role in determining the way in which the cargo will be transported i.e. either bulk or containerized and the mode of transportation (air freight or sea shipment).
Depending on the specialized nature of agricultural commodities, agricultural produce can be broadly categorized as bulk cargo or containerized cargo:
Figure 53: Methods of cargo handling of agricultural commodities for export purposes
5.1.1.1. BULK CARGO:
Bulk cargo is commodity cargo that is transported unpackaged in large quantities. Material in either liquid or granular/particulate form, as a mass of relatively small solids, such as petroleum/crude oil, grain, coal, or gravel, are transported as bulk cargo.
The cargo is usually carried loose in ship’s hold, and loaded and discharged through hatchways. Usually, panamax or post-panamax vessels, with huge holding capacity are used for transporting bulk cargo. Such vessels require a minimum draft of 39.5 ft (12.04 m) in Tropical Fresh Water (TFW)23. The salinity
23 The name and definition of TFW is derived using the freshwater Lake Gatún as a reference, since
this is the determination of the maximum draft.
• Low value, high volume commodities• High shelf life/ non-perishable
commodities with low urgency in demand
• Eg.: Maize, wheat, Gypsophilla etc.
BULK CARGO
• High value commodities• Low shelf life/ perishable
commodities with high urgency in demand
• Eg.: Flowers, fruits, vegetables, etc.
CONTAINERIZED CARGO

APEDA
Study on identification of export oriented integrated infrastructure for agri products from Karnataka
& Tamil Nadu - APEDA (Agriculture Produce Export Development Authority)
PwC 83
and temperature of water affect its density, and hence how deep a ship will float in the water. Specialized ships with tankers are used for transportation of liquid cargo.
Type of Cargo transported as Bulk:
Transport through sea freight attracts risks (such as risk of physical damage and quality deterioration through hostile weather and climatic conditions during transit, inappropriate storage conditions, etc.). Also, both the lead times and risks associated with sea freight are high and least controllable, therefore, predominantly low value and high volume commodities are transported through sea freight. High volume commodities bring in economies of scale counterbalancing the high freight costs involved in sea transportation.
Sea freight is also a preferred option for commodities with high shelf life and low urgency in demand such as grains, coal, POL, etc. High volume and high shelf life commodities such as Grains (maize, wheat and unpolished/non-branded rice), low value and low demand urgency products such as flower fillers like gypsophilla are transported) are transported through sea freight.
5.1.1.1.1. Specialized Requirements at Ports to handle bulk cargo:
1. Cargo handling equipment:
a. For on-loading and off-loading of cargo: Front loaders, hoppers, elevators (US) or silos for grain - they may be operated by pneumatic suction which sucks the grain out of the ship's hold, quay cranes or floating cranes for general cargo, etc.
b. For facilitating movement of cargo to and from the ship’s side and the transit shed: Four-wheeled trucks either manually or mechanica1ly propelled, and mechanically or electrica1ly propelled tractors for hauling four wheeled trailers, ro-ro trailers, conveyor belts, etc.
2. Open and covered warehouses for storage purposes to ensure in-transit storage and quality of the produce
3. Hinterland connectivity by road & rail for efficient, cost effective and timely delivery of the produce
5.1.1.2. CONTAINERZIED CARGO:
Cargo transported in large standardized, sealed containers whose contents do not have to be unloaded at each point of transfer.
Loose cargo is packed in standard 20 feet or 40 feet metal containers. Exporter may choose to opt a Full Container Load (exclusive 20 feet or 40 Feet container with consignments from one exporter/consignee) or Less than Container Load (container to be shared with other consignees/exporters) based on the volume of the goods transported, sensitivity and nature of cargo and urgency in demand (LCL shipment can depart only when the complete container is filled).
Shipment by container load continues to be the preferred method for export and import goods because it is much more efficient, allowing ships to spend less time in port. The use of containers to unitize cargo ensures efficient transportation, supply and storage keeping the quality of the product untampered. Containers offer a more flexible option for smaller exporters as well as importers. Containers are available in various volumes and in a number of specialized constructions to accommodate various cargo types, including reefer containers for highly perishable or temperature sensitive products.
Type of Cargo preferred to be transported as Containerized cargo:
Containerized cargo safeguards the product from various physical risks faced by the cargo during sea freight. High value and medium to low shelf life products such as fruits viz. grapes, apple, bananas, fruit pulps, processed fruits & vegetables and low volume and/or highly sensitive (both in terms of quality requirements by importing country and nature of the product) food grade commodities are transported through container cargo. Reefer containers can be used for highly temperature sensitive products such as meat, eggs and frozen fruits and vegetables. Vented containers are used for moisture-sensitive goods like tobacco, spices and coffee to allow for appropriate ventilation and thus eliminate potential condensation, preventing damage. Typical process flow deployed while transporting cargo by sea freight is as follows:

APEDA
Study on identification of export oriented integrated infrastructure for agri products from Karnataka
& Tamil Nadu - APEDA (Agriculture Produce Export Development Authority)
PwC 84
Figure 54 Typical process flow for transporting cargo (both bulk and containerized) by sea freight
High value products with high demand urgency and extremely low shelf life are transported via reefer containers through air freight. Containerization of cargo also provides better handling and allows for use of multi modal transportation modes to ensure timely delivery with uncompromised quality. Typical process flow deployed while transporting cargo by air freight is as follows:
Figure 55: Typical process flow for transporting cargo by air freight
More than 80% of the cargo handled globally is containerized today, others are gradually moving towards containerized cargo. Around 12 percent of global trade in agricultural goods such as oilseeds and grains, traditionally shipped in bulk, was shipped via container in 2012, data from shipping consultancy Seabury Group showed. Ports are also renovating/upgrading, to respond to this shift in customer preferences, to better equip them to handle container cargo.
5.1.1.2.1. Specialized Requirements at Ports to handle Container Cargo:
1. Dedicated container terminals, with proper berthing facilities, to handle container ships and manage container cargo
2. Cargo handling equipment:
Grading, sorting and
secondary packaging in
corrugated pest free
cardboard boxes
Document verification,
customs’ clearance:
Invoice, packing list,
certificate of origin, Bill of
Lading, Phytosanitary
certificate , and other export
documents. Road transportation to
ICD/CFS (at seaport) in
reefer vans
Freight Forwarder: Container and vessel booking,
document clearance, physical
verification of the cargo &
containerization of the cargo; if
applicable
Containerization at
ICD/CFS; if applicable
Storage:
For bulk cargo: Covered warehouses or grain silos
For Perishable/Container Cargo: Cold/reefer
storage, container stack yards
To destination port
Grading, sorting and secondary
packaging in corrugated pest
free cardboard boxes
Document verification,
customs’ clearance: Invoice, packing list, certificate
of origin, Royalty certificate,
Phytosanitary certificate Road transportation to
airport in reefer vans
CHA/Freight Forwarder:
Pallet booking, document clearance,
physical verification of the cargo &
palletisation
Palletisation: To be completed latest before 6
hrs. of flight departure
Storage: At reefer points on port in case
the palletisation is complete
much before flight departure
To destination airport
Storage at ICD/CFS

APEDA
Study on identification of export oriented integrated infrastructure for agri products from Karnataka
& Tamil Nadu - APEDA (Agriculture Produce Export Development Authority)
PwC 85
a. For on-loading and off-loading of cargo: quayside container cranes, i.e. container gantries also called shiptainers.
b. For facilitating movement of cargo to and from the ship’s side and the transit shed: Transtainers or stacking cranes, straddle carriers, van carriers, front and side loading fork-lift trucks, etc. are used for moving and stacking containers within the terminal up to five-high, i.e. five containers one above the other. Mechanically powered straddle carriers are designed to distribute containers on the quay and on the terminal. Fork lift trucks (FLT) are mechanically or electrically operated and fitted in front with a platform in the shape of two prongs of a fork; lifting capacity varies from 1 to 45 tons.
3. Container stack yards with/without reefer points, refrigerated warehouses for storage purposes
4. Availability of Container Freight Stations (CFS) to handle high on-site container traffic and adequate connectivity with neighboring Inland Container Depots (ICDs) to consolidate cargo volumes from neighboring landlocked states. ICDs/CFS offer services for handling and temporary storage of import/export laden and empty containers carried under customs control and with Customs and other agencies competent to clear goods for home use, warehousing, temporary admissions, re-export, temporary storage for onward transit and outright export. Transshipment of cargo can also take place from such stations.
5. Center for Perishable Cargo (CPCs):
These are dedicated terminals on airports specially designed to cater to agricultural products with extremely low shelf life such as cut flowers, ornamentals, frozen meat, frozen vegetables. These centers provide controlled storage conditions, documentation and customs’ clearance with on-site Phyto-sanitary and quality inspection laboratories to ensure physical inspection of produce under a continuous, controlled temperature zone.
5.1.2. Comparative Assessment of Infrastructure available at Major Ports
In order to assess the existing infrastructural capabilities and to identify existing gaps in infrastructure, required to manage the expected influx of agricultural commodity exports to major international target markets, a comparative assessment of various sea ports and airports was done. Infrastructure requirements at exit points were assessed with focus on select commodities from the focus states of Tamil Nadu & Karnataka with high production base in these states, comparative regional advantage and huge prospective export potential. Nonetheless, it has also been ensured that capacities developed will be in line with national export trends and requirements. Only major airports and sea ports from Southern India are evaluated under this study. This selection is considering the fact that proximity of the port is not the only criteria in port selection for transportation of a given commodity to a said destination. It depends upon the nature of commodity, type of cargo handled (containerized/bulk) and underlying capabilities, sectors/destination ports covered by the given port and shipping line operations. These all factors, in turn, depend upon various commercial preferences and operational priorities.
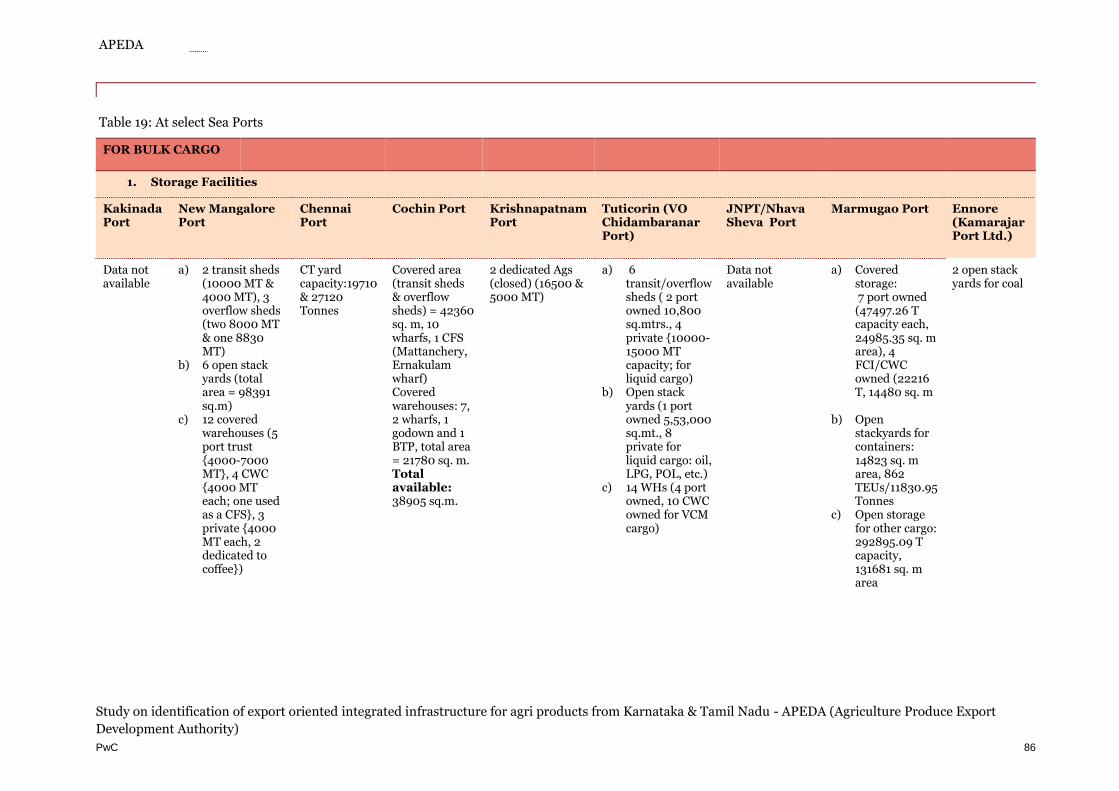
APEDA
Study on identification of export oriented integrated infrastructure for agri products from Karnataka & Tamil Nadu - APEDA (Agriculture Produce Export
Development Authority)
PwC 86
Table 19: At select Sea Ports
FOR BULK CARGO
1. Storage Facilities
Kakinada Port
New Mangalore Port
Chennai Port
Cochin Port Krishnapatnam Port
Tuticorin (VO Chidambaranar Port)
JNPT/Nhava Sheva Port
Marmugao Port Ennore (Kamarajar Port Ltd.)
Data not available
a) 2 transit sheds (10000 MT & 4000 MT), 3 overflow sheds (two 8000 MT & one 8830 MT)
b) 6 open stack yards (total area = 98391 sq.m)
c) 12 covered warehouses (5 port trust {4000-7000 MT}, 4 CWC {4000 MT each; one used as a CFS}, 3 private {4000 MT each, 2 dedicated to coffee})
CT yard capacity:19710 & 27120 Tonnes
Covered area (transit sheds & overflow sheds) = 42360 sq. m, 10 wharfs, 1 CFS (Mattanchery, Ernakulam wharf) Covered warehouses: 7, 2 wharfs, 1 godown and 1 BTP, total area = 21780 sq. m. Total available: 38905 sq.m.
2 dedicated Ags (closed) (16500 & 5000 MT)
a) 6 transit/overflow sheds ( 2 port owned 10,800 sq.mtrs., 4 private {10000-15000 MT capacity; for liquid cargo)
b) Open stack yards (1 port owned 5,53,000 sq.mt., 8 private for liquid cargo: oil, LPG, POL, etc.)
c) 14 WHs (4 port owned, 10 CWC owned for VCM cargo)
Data not available
a) Covered storage: 7 port owned (47497.26 T capacity each, 24985.35 sq. m area), 4 FCI/CWC owned (22216 T, 14480 sq. m
b) Open stackyards for containers: 14823 sq. m area, 862 TEUs/11830.95 Tonnes
c) Open storage for other cargo: 292895.09 T capacity, 131681 sq. m area
2 open stack yards for coal

APEDA
Study on identification of export oriented integrated infrastructure for agri products from Karnataka & Tamil Nadu - APEDA (Agriculture Produce Export
Development Authority)
PwC 87
2. Marine Infrastructure:
Kakinada Port New Mangalore Port
Chennai Port
Cochin Port Krishnapatnam Port
Tuticorin (VO Chidambaranar Port)
JNPT/Nhava Sheva Port
Marmugao Port Ennore (Kamarajar Port Ltd.)
Part of a Special Economic Zone and a proposed “Petroleum, Chemical and Petrochemical Investment Region”
15 berths with total capacity of 76.77 Mn tons
24 berths, incl. 7 CT berths
10 general cargo berths and 1 for fertilizers , 2 jetties (for liquid cargo)
10 operational berths
Data not available Shallow draught berth: Feeder Container Vessels, Cement , General cargo and liquid cargo vessels are being handled with a capacity of about 1.2 million tonnes per annum.
Data not available 5 berths (2 handle thermal coal, 1 automobiles, others POL/liquid cargo)
LEGEND:
CT: Container Terminal, TEUs: Twenty Feet Equivalent Units, POL: Petroleum, Oil, & Lubricants

APEDA
Study on identification of export oriented integrated infrastructure for agri products from Karnataka & Tamil Nadu - APEDA (Agriculture Produce Export
Development Authority)
PwC 88
FOR CONTAINERIZED CARGO
Kakinada Port
New Mangalore Port
Chennai Port Cochin Port
Krishnapatnam Port
Tuticorin
(VO Chidambaranar Port)
JNPT/Nhava Sheva Port
Marmugao Port
Ennore (Kamarajar Port Ltd.)
1. Container Handling Capabilities (Terminals & Cargo handled):
Modern container terminal is proposed, to become operational in 2015
Well equipped to handle bulk, liquid chemicals, hazardous cargoes, crude and POL products, heavy lifts, machinery, containers Handles exports of gherkins, maize, rice, cashew, sugar, coffee, etc.
3 dedicated CTs (7 berths in total) More than 70% container cargo: Handled 1344757 TEUs in a year (till 12.02.2015) & 644408 TEUs of export
No dedicated CT
1 CT: 4.8 Mn TEUs & 2 operational dedicated berths
1 CT 3 major terminals: JNPCT, NSICT, APM + 1 private terminal (run by DP World Pvt. Ltd.): 1)Jawaharlal Nehru Port Container Terminal (JNPCT): Three berths (Linear quay length of 680 Metres), Can handle third generation container vessels, 36,000 TEUs capacity with additional paved area: 1,80,000 square metres 320 numbers.(with power backup facility) 2)Nhava Sheva International Container Terminal (NSICT): 672 reefer points, Current capacity: 15.6 million tonnes per year 3) Gateway Terminals India (GTI) No reefer cargo handling points, mainly deals in container cargo of non-perishable commodities
Container handling capacity: 1.3 Mil TEUs per annum ||4.16 million TEUs handled in FY 2013-14: 55.74% of the container traffic handled by the Major Ports - 1st position in container handling among Major Ports
0.08 Mn T export container cargo in 2010-11
3 CTs

APEDA
Study on identification of export oriented integrated infrastructure for agri products from Karnataka & Tamil Nadu - APEDA (Agriculture Produce Export
Development Authority)
PwC 89
Kakinada Port
New Mangalore Port
Chennai Port Cochin Port
Krishnapatnam Port
Tuticorin
(VO Chidambaranar Port)
JNPT/Nhava Sheva Port
Marmugao Port
Ennore (Kamarajar Port Ltd.)
1. Container Cargo Handled:
Handled 122441 TEUs/2363000 Tonnes container cargo in Jan. 2015 (1119000 T exports & 1244000 T imports) Handled 1303224 TEUs/ 25152000 T C. cargo (Apr. to Jan. 2015) against target of 25890000 T Exports:12201000 T || Imports: 12021000 T
Handles:
Export cargo for Maize, chillies, mango pulp, onions, rice, shrimps, sugar &tobacco Import cargo for apples, coffee, fish, chillies, pulses, oranges, etc.
The Port handled 62.35 million tonnes of total cargo during 2013-14 as against 64.49 million tonnes during the previous year. Of the total share of containerised cargo: 55.24 million tonnes (88.59 per cent), liquid cargo was 6.29 million tonnes (10.10 per cent) and the remaining. 0.82 million tonnes (1.31 per cent) was miscellaneous types of dry bulk and break-bulk cargo
Handled exports for Fish, gherkins, cashew, etc.
Majorly handles coal, POL, automobiles and liquid cargo Out of 27.34 Mn T cargo traffic, 22.49 MT was coal, 2.43 POL, 2.42 MT was others (incl. Containerized cargo and other bulk cargo) (2013-14)
2. No. of Reefer Points:
Data not available
360 NA 400 + 20 (@ CFS) 84 992 84 NA
3. CFS Space:
Data not available
1 CFS Not available currently. However, availability of good transportation services and linkages is evident. Trains to
NA one CFS, 6000 TEUs, 48 acres area (provision to expand upto 300 acres)
30 in operation, 6 in process Data not available
NA

APEDA
Study on identification of export oriented integrated infrastructure for agri products from Karnataka & Tamil Nadu - APEDA (Agriculture Produce Export
Development Authority)
PwC 90
LEGEND:
CT: Container Terminal
TEUs: Twenty Feet Equivalent Units
POL: Petroleum, Oil, & Lubricants
ICD with daily departures
Kakinada Port
New Mangalore Port
Chennai Port Cochin Port
Krishnapatnam Port
Tuticorin
(VO Chidambaranar Port)
JNPT/Nhava Sheva Port
Marmugao Port
Ennore (Kamarajar Port Ltd.)
4. Cargo handling facilities
Data not available
can handle upto 64 tons, one 75 T mobile crane
Three 10 Ton mobile cranes, 14 locos (12 of 700 HP and remaining 1400 HP), 10 quay cranes
NA 20 quay cranes (super post panamax)
3 quay cranes, trailers, loco, trailer trucks
Quay cranes, Gantry cranes, reach stackers, trailers available at each CT
2 reach stackers: 40 T each, 2 loco 1400 HP
Data not available

APEDA
Study on identification of export oriented integrated infrastructure for agri products from Karnataka & Tamil Nadu - APEDA (Agriculture Produce Export
Development Authority)
PwC 91
Table 20: At select Airports
Bengaluru airport Mumbai Airport Chennai Airport
1. Sectors covered Singapore, Sri Lanka, Germany, Qatar, The Netherlands, UAE
China, US, UK, Japan, Malaysia, Iran, Kenya, Ethiopia, Qatar, France, Switzerland, Saudi Arabia, Turkey, Mauritius, UK, Thailand
UAE, Qatar, Japan, Korea, Saudi Arabia, Malaysia, Thailand, Singapore, France, UK, Sri Lanka
2. Container Terminal/ Air Cargo Complex/Terminal
1) AISATS( joint venture (JV) between Air India and Singapore Air Terminal Services) owns a 4-level cargo terminal in Bengaluru airport. The terminal has a total gross floor area of 20,000 sqm, designed to handle over 200,000 tonnes of cargo per annum. The terminal was proposed recently, however, the project is no longer operational 2) Menzies Aviation Bobba (B'lore) Pvt Ltd, (MABBPL) has been awarded the concession by Bengaluru International Airport Ltd (BIAL) to build and operate the Cargo Terminal at the Bangalore International Airport, Devanahalli for a period of 15 years till 2023
Dedicated Cargo terminal, MIAL Cargo
Dedicated Air Cargo Terminal
3. Container Cargo handling capabilities
The terminal has a maximum capacity to handle 280000 tons of cargo annually. Will handle the International cargo (Export, Import) carried by international airlines operating out of Bangalore- Lufthansa Cargo, Aero Logic, DHL, Kalitta Air, Air Asia, Air France Cargo , British Airways World Cargo, Thai Airways, Gulf Airlines, Oman Air, Qatar Airlines, Kingfisher Airlines and Blue Dart. MABBPL will also handle Domestic cargo carried by Domestic Airlines
Details not available Forklifts, mass stackers, trolleys, etc. Can handle container load from 3 to 12 MT
As on date, on an average 720 MT (Export 350 MT and Import 370 MT) is being handled on a daily basis at Chennai Air Cargo Complex.

APEDA
Study on identification of export oriented integrated infrastructure for agri products from Karnataka & Tamil Nadu - APEDA (Agriculture Produce Export
Development Authority)
PwC 92
The airport handled 242,246 metric tonnes of cargo in 2013-14
4. Storage Capacity
No a) Trans-shipment cargo storage facility b. Cold Storage: Export state-of-the-art
b) Perishable Centre: Temp. range: +15 to +25 ºC, +2 to +8 ºC, 0 to -10 ºC , One time holding capacity: 160 Tons, Annual Handling capacity: 50,000 Tons
c) Cold Storage: Temp. range: +15 to +25 ºC, +2 to +8 ºC, One time holding capacity: 120 Tons, Annual Handling capacity: 30,000 Tons
Yes, capacity details not available
5. Port Infrastructure
Accredited phytosanitary labs and quality inspection agencies are required on-site to ensure on-site physical verification of cargo.
Regulators available on-port: Indian Customs, Animal Quarantine, Plant Quarantine, Drug Control, Airport Health Officer, Food Safety & Standards Authority of India, Wild Life Protection Authority and Bureau of Civil Aviation Security
on- site customs’ clearance and physical verification facilities available
6. CFS Space Not available Not available Not available

APEDA
Study on identification of export oriented integrated infrastructure for agri products from Karnataka & Tamil Nadu - APEDA (Agriculture Produce Export
Development Authority)
PwC 93
7. Cargo handling equipment/facilities
Owned by airline Owned by airline Owned by airline
8. CPCs No, but required Yes, increase in capacity required
Centre for perishable cargo storage facility with a holding capacity of 40 MT
LEGEND:
CPCs: Center for Perishable Cargo; ICDs: Inland Container Depot; CFS: Container Freight Station

APEDA
Study on identification of export oriented integrated infrastructure for agri products from Karnataka
& Tamil Nadu - APEDA (Agriculture Produce Export Development Authority)
PwC 94
5.1.3. Key Inferences
1. In order to promote agri exports Karnataka & Tamil Nadu, it is necessary to focus on major export destinations/sectors where agricultural products from these states are in demand or have future demand potential since:
a. Choice of port for a given commodity depends on destination market, nature of commodity, type of cargo and preference of the buyer in terms of demand urgency, lead times, packaging preferences and quality of the product.
b. Type of cargo traffic (bulk or container cargo) is defined by ports’ cargo handling capabilities in terms of port infrastructure availability and capacity to handle container traffic and not by proximity to production centers or export hubs.
2. Assessment of port infrastructure was done for select ports - JNPT/Nhava Shewa, Marmugao, New Mangalore, Cochin/Kochi, Chennai and Tuticorin. These ports were selected on the following basis:
a. Volume of agri export cargo handled by each port on annual basis
b. Availability of suitable infrastructure at ports and hinterland connectivity to undertake agri –commodity exports
c. Export destinations catered by these ports
3. On the basis of our analysis, the major sea ports handling agri commodities are JNPT, Cochin/Kochi & New Mangalore port on the west coast and Chennai & Tuticorin ports on the east coast.
a. Export volumes of agri commodities are miniscule and spread sporadically throughout the year. Considering the low export volumes of agri commodities at other ports and their limited infrastructural capabilities, there is little scope to further build these ports to attract export cargo for agricultural commodities.
i. Marmugao predominantly is an iron ore export port, with iron ore exports holding a 62% share in the total cargo handled by the port in 2013-14 (Refer Appendix B.1.1 for more details)
ii. Only agricultural commodity exported from the Karwar port in 2013-14 was Maize and it was all as bulk cargo.
4. JNPT, New Mangalore, Cochin/Kochi on the West Coast and Tuticorin & Chennai ports on East Coast have the potential to be further developed for export of agri commodities. Assessment of existing potential and analysis of available avenues to further strengthen the port infrastructure for agri-commodity exports are enumerated below:
a) JNPT Port:
a. JNPT, on the West coast, has the highest container handling capacity among all major sea ports in India (for details, refer Appendix B.1.1). It handled 59.48 Mn Tons of container cargo in 2013-14, which is 42% of the total container cargo handling capacity of the country. It can handle nearly 45.50 lakh TEUs of container traffic every year, almost 11630 TEUs/day. JNPT port is the preferred port for transport of agricultural commodities to MENA, UK, Japan and France. Both reefer and non-reefer containerized cargo are handled at port.
b. However, with changing consumer preferences towards containerized cargo over bulk cargo, there is a need to redevelop the bulk terminal into a container terminal to cater to increased export volumes and container traffic at the port. Additionally, deployment of additional machineries, equipment and port crafts, installation of additional reefer points, upscaling and capacity expansion of existing storage areas (both temperature controlled and ambient) in line with the expected increase in reefer container traffic at the port and development of back up facilities needs to be undertaken to cater this expected increase in container traffic at the port. This capacity up gradation of port
APEDA
Study on identification of export oriented integrated infrastructure for agri products from Karnataka
& Tamil Nadu - APEDA (Agriculture Produce Export Development Authority)
PwC 95
infrastructure can be taken in a PPP mode to overcome project management, time and investment limitations and simultaneously, meeting industry requirements.
b) New Mangalore port :
a. New Mangalore port is mainly into bulk cargo exports. Almost 65% of the total cargo traffic at New Mangalore port is contributed by POL. Agricultural commodities are generally transported as bulk cargo from the port and constitute to around 10% of the total cargo handled at the port. For details, refer Appendix B.1.1.
b. The port has strategic geographical importance for Karnataka and the neighboring region with regards to export of agricultural commodities– it caters to all major export markets for agricultural exports from Karnataka such as MENA, UK, France and Japan. Due to limited port infrastructural capabilities to handle container cargo, currently all containerized agricultural exports are sent either via JNPT, Cochin or Chennai port and therefore, attract huge pre shipment internal transportation costs which acts as a huge deterrence for small and medium exporters.
c) Cochin/Kochi Port:
a. Almost 25% of cargo volume handled at Kochi/Cochin sea port is bulk cargo. Containerized exports include fresh fruits, vegetables and floriculture products (4% of the total cargo volume at the port) (for details, refer Appendix B.1.2). Some of the container cargo is also for bulk building at JNPT/Mumbai port.
b. In order to ensure quality of exported products for long and to attract more containerized cargo to the port, capacity expansion at port, both container handling capacity and storage capacity, needs to be considered.
d) Chennai Port:
a. On the East coast, Chennai stood second (after JNPT on west coast) in terms of annual container traffic handled at the port, with annual container handling capacity of 42.45 Mn Tons i.e. 35 lakh TEUs of container traffic every year, almost 9590 TEUs/day (For details, refer Appendix B.1.1).
b. Similar to JNPT port, the port requires capacity expansion. Deployment of additional reefer points and backup systems, creation of new cold storage units and covered warehouses, creation of additional container berths are quintessential to sustain the projected growth of containerized cargo at the port (expected to grow at 10.5% p.a.) (Refer Appendix B.1.1 & B.1.2).
e) Tuticorin port:
a. Though a minor port, it is strategically important for Tamil Nadu and can also be explored for export markets in South East Asia for agri exports from Tamil Nadu and Karnataka viz. Sri Lanka, Malaysia, Thailand, Singapore, etc.
b. Tuticorin, with only 9.83 Mn Tons of annual cargo handling capacity, is used as a major exit point for various agricultural commodities, both reefer and non-reefer containerized cargo. However, export volumes of containerized cargo catered are negligible. Poultry products, fresh onions, cucumber/gherkins, fresh vegetables and non-basmati rice are major agri commodities exported from the port (Refer Appendix B.1.2 for details).
c. Considering the limited draft depth (max. draft = 8.25 mtrs.), the port can be used for bulk building container cargo for Chennai port. Alternatively, a dredging expedition to deepen the draft further can also be explored.
f) An economically viable ICD requires 2 MN TEUs equivalent of non-reefer cargo traffic for an international terminal operator to provide its services. ICDs at New Mangalore and Marmugao port with focus on agricultural commodities may not be viable

APEDA
Study on identification of export oriented integrated infrastructure for agri products from Karnataka
& Tamil Nadu - APEDA (Agriculture Produce Export Development Authority)
PwC 96
considering the volume of cargo handled at these ports. The major traffic handled at Marmugao port is iron ore and POL. It handled 27.50 Mn Tons of iron ore, almost 40% of the iron ore cargo volume handled at all major Indian ports (Refer Appendix B.1.1 for details). New Mangalore has begun handling agricultural commodities and can share the cargo traffic at Nhava Sheva and Cochin sea ports for agricultural commodities in future. The port might require viability gap funding to ensure economical and operational viability of the ICD.
g) Alternatively, an up gradation of on-site CFS at the ports can also be done so that it can handle a minimum of 22 FEUs of reefer containers and 45 TEUs of non-reefer containers. This is equivalent to 2 trainloads a week, just enough to begin with and attract a train operator to provide hinterland connectivity. Viability gap funding to be evaluated to cater to issues of seasonal nature of cargo traffic and costs of return of empty reefer containers.
h) Good hinterland connectivity through rail and road needs to be created with Tuticorin port, Chennai seaport and Kochi port, to facilitate easy in-bound logistics and domestic transportation. This will ensure timely supply and delivery of perishable and time sensitive cargo to and from the neighboring states and regional distribution centers/markets and/or export hubs. This will also provide avenues for the state governments to attract revenues from neighboring states for export and import of perishable cargo by providing adequate infrastructure at major air ports and sea ports in the state.
5. On a similar basis, Chennai, Bengaluru and Mumbai airport were selected for further assessment of existing infrastructure capabilities and potential for further development of the port to cater to the requirements of agri-commodity exports.
6. Air freight predominantly carries containerized cargo. Bengaluru airport and Chennai airport are the preferred airports for containerized cargo for agri commodities from Tamil Nadu & Karnataka. Since, lead times are a crucial factor for export of perishable agri-commodities, Mumbai airport was only used as a reference point for infrastructure capabilities and is not been considered for further infrastructure capability up gradation/expansion for export of agri commodities from the focus states.
Details of existing infrastructure gaps and requirements to cater agri-commodity exports are given below:
a. Bengaluru airport:
i. 4341 MT of fresh vegetables were transported from Bengaluru airport last year, representing 46% of the total cargo traffic at the airport. (For details, refer Appendix B.1.3). Floriculture products represented 14% of the total cargo traffic at the airport.
ii. However, exporters face issues in maintaining the cold chain for flowers during transit. There is an urgent need for a dedicated controlled temperature unit at the airport to facilitate hassle free physical verification, Phytosanitary inspection, document verification, customs’ clearance and in-transit storage of perishable cargo at the airport.
iii. This dedicated unit/Center for Perishable Cargo (CPC) would also provide basic quality inspection and testing facilities at the airport so as to prevent physical damage to cargo due to transportation (loading, unloading, temperature and humidity changes, etc.)
b. Chennai port:
i. Fresh & dried vegetables, poultry products and fresh mangoes constituted more than 35% of the total cargo traffic from the Chennai port in 2013-14. Fresh & dried/processed vegetables together saw a 73% y-o-y growth from 2012-13. (For details, refer Appendix B.1.3). Capacity availability at Chennai airport’s Air Cargo Terminal needs to be evaluated in line with the growth pattern and the expected gush in export cargo from the port. CPC at Kochi

APEDA
Study on identification of export oriented integrated infrastructure for agri products from Karnataka
& Tamil Nadu - APEDA (Agriculture Produce Export Development Authority)
PwC 97
airport can also be explored as a temporary alternative to cater to the increased cargo volumes until the capacity expansion at Chennai airport is not complete.
c. Feasibility of operating a chartered flight for export of perishable and demand sensitive commodities to key export hubs can also be explored, in conjunction with airport authorities and respective state governments. Minimum tonnage required to viably run such a chartered flight is 50 Tons/flight and maximum load limit is 120 Tons/ flight. Small aircrafts are also available with load capacity of 15-20 Tons approx.. , however, commercial and operational viability of operating such a small aircraft needs to be evaluated with regards to export price differential, available profit margins and industry willingness.
7. Support from respective State governments, in conjunction with guidance and support from the Export Promotion agency, is required to bridge the indicated infrastructure gap, especially to ensure good hinterland connectivity through rail and road transport network and to provide viability gap funding, wherever required to instill investor confidence and attract cargo traffic to the renovated/upgraded ports.

APEDA
Study on identification of export oriented integrated infrastructure for agri products from Karnataka
& Tamil Nadu - APEDA (Agriculture Produce Export Development Authority)
PwC 98
6. Summary
In order to improve exports of agri commodities there are interventions needed across the value chain.
These interventions, though not all of them come in the purview of APEDA, are as important as
infrastructure. We have discussed some of them in the following section
1. Stage 1 of agriculture – good planting material – It is understood that planting material is
not under the purview of APEDA, however good agricultural produce starts with good planting
material and at least APEDA should sensitize the concerned departments of the following –
a. Firstly the need to develop crop variations that have internationally acceptable
characters such as taste, appearance, size etc. Most of these crops could be exotic crops
where Indian research agencies are not focused e.g. planting material is the biggest
concerns for the floriculture industry, gherkin exporters, pomegranate sector etc. So if
better and international market focused seed research is done, that will help in the long
term
b. Secondly introduction of new varieties – APEDA can in consultation with exporters
identify new seed variants for each major export commodity for development
2. Farmer Development and Capacity building – Farmer certification is a major bottle neck
which often prevents development of new markets, there is need for organizing GAP
certifications of farmers for long term sustainability of exports
3. Traceability –Traceability of produce has multiple benefits –
a. Increasingly this is becoming a requirement in the international market even for
processed goods
b. In case of a contagion it is easier to trace the source and control the spread
c. Even when it is not essential there exists premium for traceable products in some
markets
4. Product development – processed food products like breakfast mixes / cake mixes etc need
developmental push i.e. APEDA needs to push for the development and creation of new
products – one of the most successful methods for promoting innovation is through the
development of Incubation centers for new product development.
5. Sanitary and Phyto – Sanitary (SPS) issues – SPS issues are often used as no trade
barriers for controlling trade flow and need to be addressed. However SPS issues for each of the
crops discussed would be different and would also vary based on location of the production
base. One of the suggestions that came through were for having testing facilities in each district
or at least converting the laboratories of the universities in these into facilities for testing and
certifications. There are 2 constraints that make it unviable, firstly that even to convert an
existing facility into a basic level lab (Bio-Safety Level 2) will also entail significant costs (about
INR 250 million) and the viability of such a laboratory cannot be established at this stage.
Secondly, having a laboratory will not ensure that produce from the farms meet the SPS
requirements of every country. In order for more and more farm produce to meet the

APEDA
Study on identification of export oriented integrated infrastructure for agri products from Karnataka
& Tamil Nadu - APEDA (Agriculture Produce Export Development Authority)
PwC 99
requirements it is important to develop an outreach / training programme to educate /sensitize
the farmers / traders to the requirements of international SPS and the process changes that
they need to adopt in order to meet the global standards. In this context suitable campaigns are
needed to increase the number of GAP certified farmers as well as phasing out of hazardous
agro chemicals. Most of these activities however would be out of the direct purview of APEDA
and would need active support of the local state government as well as national Horticulture
Board. So to summarize, in view of the uncertain viability and high cost, BSL 2 labs are not
being recommended however it is advisable that efforts be made to improve the farming
processes. It may be noted that were feasible, gamma irradiation has been included. Gamma
irradiation helps control biological hazards to a certain extent.
Existing Infrastructure and proposed infrastructure
The summary of the infrastructure required for each state is given as the summary of the state specific
chapter.
Karnataka – Investment required in Karnataka is INR 140.10 crores for 6 pack houses, 1 pulping unit,
1 starch unit, and a Centre for Perishable Cargo at Bangalore Airport.
Tamil Nadu – The investment required in Tamil Nadu is INR 269.50 Crores for 2 pack houses, refer
containers and 2 cold stores, 1 starch unit, and an Inland Container Depot at Theni or in the nearby
region.
The structure of partnership for the above mentioned projects would be –
Project Partnership Remarks Funding
Starch Project - Karnataka
PPP The partners should be private sector players with existing manufacturing operations in corn starch business.
While it is premature to define the funding structure for the projects at this stage, however it can be assumed that APEDA can provide funds to the extent allowed under its schemes and rest will be arranged by the project promotors.
Starch Project – Tamil Nadu
PPP
Center for Perishable Cargo – Bangalore Airport
PPP Partner must have experience in managing similar facilities.
Cold Stores in Namakkal
PPP Utilisation is key to a cold store therefore the partners must have captive business or experience egg export
ICD – Tamil Nadu
State Government
Initial stage there will not be viability therefore there may be very limited private sector interest
Reefer Containers
PPP Multipurpose use leading to assured initial returns, thereby capable of attracting private investment. Also, require high investment and technical capabilities. State oversight required to boost targeted export growth.
Mango Pulping Unit
PPP Partner should have experience in export of mango pulp.
Pack Houses Private /State government or any other registered body
These are not difficult to operate and can be managed well all types of partners. For packhouses with capacity utilisation less than 65%, viability gap funding may be required to ensure financial sustainability and economic viability in the initial years.

APEDA
Study on identification of export oriented integrated infrastructure for agri products from Karnataka
& Tamil Nadu - APEDA (Agriculture Produce Export Development Authority)
PwC 100
The facilities have been distributed across suitable clusters of the given state. It is not possible to
determine the exact location at this stage. The capacities given are for growth in exports and not for
covering the exiting level of exports.
The list of existing cold stores, Inland Container Depots, Container Freight Stations have been included
in the appendix A.7, while infrastructure assessment of all ports and airports have been captured in
Appendix B.
Utilization of existing resources as not tracked, however it know that large standalone cold stores are
rarely properly utilised, while small cold stores at pack houses have better utilization.
Two Additional infrastructure options –
These options will not necessarily increase exports but are important enablers –
1. Food Product Incubation center – A 150,000 square feet incubation center that can
support at least 60 start –ups will require an investment of INR 50 crores. This project
necessarily must be developed under PPP.
2. Renewable energy – Based on the request of floriculturists, we have compiled a cost analysis
of powering green houses with renewable energy. The analysis is included in appendix E. the
benefit of this arrangement will be in terms increase in production of flowers by about 25% due
to extension of the growing period.

APEDA
Study on identification of export oriented integrated infrastructure for agri products from Karnataka & Tamil Nadu - APEDA (Agriculture Produce Export
Development Authority)
PwC 101
Appendix 1 A - Crop Data
Appendix 1 A.A - Export Growth Projections
Appendix 1 A.A.A - fruits and fruit products
Grape Exports from India ('000 Tons)
Y-o-Y Growth Rate
Papaya Exports from India ('000 Tons)
Y-o-Y Growth Rate
Pomegranate
Exports from India ('000 Tons)
Y-o-Y Growth Rate
Mango Pulp Exports from India ('000 Tons)
Y-o-Y Growth Rate
2004 23 0% 3.5 0% 90
2005 52 130% 6.4 85% 96 7%
2006 65 23% 10.3 61% 135 40%
2007 76 18% 10.9 5% 21.67 157 17%
2008 117 55% 13.8 27% 35.18 62% 167 6%
2009 109 -8% 17.6 27% 34.81 -1% 173 4%
2010 64 -41% 15.4 -12% 33.42 -4% 186 8%
2011 75 17% 18.7 21% 18.21 -45% 170 -9%
2012 114 52% 21.5 15% 30.16 66% 150 -12%
2013 149 30% 23.1 8% 36.03 19% 148 -2%
2014 137 -8% 24.7 7% 31.33 -13% 175 18%
2015 142 3% 26.7 8% 32.39 3% 189 8%

APEDA
Study on identification of export oriented integrated infrastructure for agri products from Karnataka & Tamil Nadu - APEDA (Agriculture Produce Export
Development Authority)
PwC 102
2016 148 5% 28.3 6% 30.52 -6% 190 0%
2017 155 4% 30.1 6% 31.40 3% 186 -2%
2018 162 4% 32.6 8% 33.08 5% 185 0%
2019 177 9% 34.2 5% 35.47 7%
Source: UN Comtrade, PwC analysis

APEDA
Study on identification of export oriented integrated infrastructure for agri products from Karnataka & Tamil Nadu - APEDA (Agriculture Produce Export
Development Authority)
PwC 103
Appendix 1 A.A.A - Other Commodities
Tomato Exports from India ('000 Tons)
Y-o-Y Growth Rate
Gherkin Exports from India ('000 Tons)
Y-o-Y Growth Rate
Flowers Exports from India ('000 Tons)
Y-o-Y Growth Rate
Maize Exports from India ('000 Tons)
Y-o-Y Growth Rate
2003 8 204%
2004 31 23 -42%
2005 28 -9% 13 -4%
2006 35 28% 13 58%
2007 43 20% 20 82%
2008 36 -15% 37 -24%
2009 0.16 31 -15% 28 26%
2010 0.02 263 27 -13% 36 127%
2011 0.23 209 26% 29 8% 81 73%
2012 0.17 -25% 259 -19% 31 7% 140 31%
2013 0.23 33% 239 8% 27 -12% 184
2014 0.25 8% 219 9% 22 -17%
2015 0.31 27% 220 0%
2016 0.31 -1% 223 -2%
2017 0.37 17% 205 9%
2018 0.40 8% 202 1%
2019 0.43 9% 200 1%
Source: UN Comtrade, PwC analysis

APEDA
Study on identification of export oriented integrated infrastructure for agri products from Karnataka & Tamil Nadu - APEDA (Agriculture Produce Export
Development Authority)
PwC 104
Table 21: Major gherkin exporters - Global (2013)
Exporting Country Quantity (in ‘000 Tons)
India 178
Germany 109
Turkey 72
Netherlands 70
USA 63
Croatia 53
Viet Nam 26
Others 122
Total 692.27
Source: UN Comtrade, PwC analysis
Table 22: Major pineapple import zones in the world (2013)
Importing Region Qty (in ‘000 Tons) % share
N. America 1,092 33%
W. Europe 1,188 36%
E. Europe 281 8%
MENA 232 7%
Far East + China 317 9%
Others 232 7% Source: UN Comtrade, PwC analysis

APEDA
Study on identification of export oriented integrated infrastructure for agri products from Karnataka & Tamil Nadu - APEDA (Agriculture Produce Export
Development Authority)
PwC 105
Appendix 1 A.A - Annexure for Banana
Commodity Type Years Production in India (in 000 tonnes)
Total production in Tamil Nadu (in 000 tonnes)
Total exported from India (in 000 tonnes)
Estimated export from Tamil Nadu (in 000 tonnes)
Potential for exports from the state (in 000 tonnes)
Estimated export after discounting (in 000 tonnes)
no of working days
Per day additional capacity requirement (in MT/day)
Banana
Actual
2007 23823.0 6116.5 16.7 5.5 244.7 24.47 300
2008 26217.0 6667.0 30.4 10.2 266.7 26.67 300
2009 26469.5 5200.0 54.3 14.3 208.0 20.80 300
2010 29780.0 8253.0 60.8 23.2 330.1 33.01 300
2011 28455.1 6736.4 40.9 13.5 269.5 26.95 300
2012 26509.1 5136.2 53.8 14.5 205.4 20.54 300
2013 29724.5 5650.0 28.1 7.7 226.0 22.60 300
Projection
2014 30178.6 6270.7 50.3 14.8 252.2 25.22 300
2015 30902.7 6262.5 52.7 15.3 251.8 25.18 300
2016 31626.8 6255.1 55.1 15.9 251.5 25.15 300
2017 32350.9 6248.4 57.5 16.4 251.3 25.13 300
2018 33075.0 6242.4 60.0 16.9 251.0 25.10 300
2019 33799.0 6236.8 62.4 17.4 250.8 25.08 300 58.0

APEDA
Study on identification of export oriented integrated infrastructure for agri products from Karnataka & Tamil Nadu - APEDA (Agriculture Produce Export
Development Authority)
PwC 106
Appendix 1 A.A - Annexure for Chicken Meat
Commodity Type Years Production in India (in 000 tonnes)
Total production in Tamil Nadu (in 000 tonnes)
Total exported from India (in 000 tonnes)
Estimated export from Tamil Nadu (in 000 tonnes)
Potential for exports from the state (in 000 tonnes)
Chicken Meat
Actual
2007 1755.0 334.0 1.0 0.2 1.4
2008 1884.0 356.0 1.7 0.4 2.4
2009 2087.0 397.0 0.8 0.2 12.7
2011 2483.0 350.0 10.1 1.8 13.5
2012 2277.9 321.1 5.1 0.9 14.7
2013 2328.3 328.2 5.5 1.0 13.3
Projected
2014 2913.5 441.2 7.0 1.3 12.8
2015 3133.2 438.8 7.6 1.4 11.7
2016 3353.0 444.8 8.3 1.6 16.7
2017 3572.7 455.6 8.9 1.7 17.8
2018 3792.4 451.6 9.6 1.8 19.0
2019 4012.2 454.2 10.2 2.0 20.2

APEDA
Study on identification of export oriented integrated infrastructure for agri products from Karnataka & Tamil Nadu - APEDA (Agriculture Produce Export
Development Authority)
PwC 107
Appendix 1 A.A - Annexure for Egg
Commodity Type Years Production in India (in lakh nos)
Total production in Tamil Nadu (in lakh nos)
Total exported from India (in lakh nos)
Estimated export from Tamil Nadu (in lakh nos)
Potential for exports from the state (in lakh nos)
Estimated export after discounting (in lakh nos)
no of working days
Per day additional capacity requirement (in lakh/day)
Egg
Actual
2007 535649 83937 12229 2749 3065
2008 555624 88098 9529 2198 3219
2009 602671 108476 8793 439 3929
2010 630244 115137 3652 960 4175
2011 664499 118518 5961 1539 4299
2012 664545 118526 6356 1641 4298
2013 697310 124370 4888 1121 4513
Projected
2014 735261 137777 4026 982 4996
2015 764008 145306 3291 860 5267
2016 792755 152835 2557 738 5539
2017 821502 160364 1823 616 5811
2018 850248 167893 1089 494 6082
2019 878995 175423 980 372 6354 3282 300 11

APEDA
Study on identification of export oriented integrated infrastructure for agri products from Karnataka & Tamil Nadu - APEDA (Agriculture Produce Export
Development Authority)
PwC 108
Appendix 1 A.A - Annexure for Maize
Commodity Type Years Production in India (in 000 tonnes)
Total production in Tamil Nadu (in 000 tonnes)
Potential for processing from the state (in 000 tonnes)
Estimated quantity processed after discounting (in 000 tonnes)
no of working days
Per day additional capacity requirement (in MT/day)
Maize
Actual
2007 18955.4 810.6 27.6
2008 19731.4 1257.8 42.8
2009 16719.5 1144.3 38.9
2010 21725.8 1027.5 34.9
2011 21759.4 1695.5 57.6
2012 21058.4 1829.9 62.2
Projected
2013 22152.2 1923.5 65.4
2014 22769.5 2103.3 71.5
2015 23386.7 2283.1 77.6
2016 24004.0 2462.9 83.7
2017 24621.3 2642.7 89.8
2018 25238.6 2822.5 96.0
2019 25855.9 3002.3 102.1 10.2 250 40.8
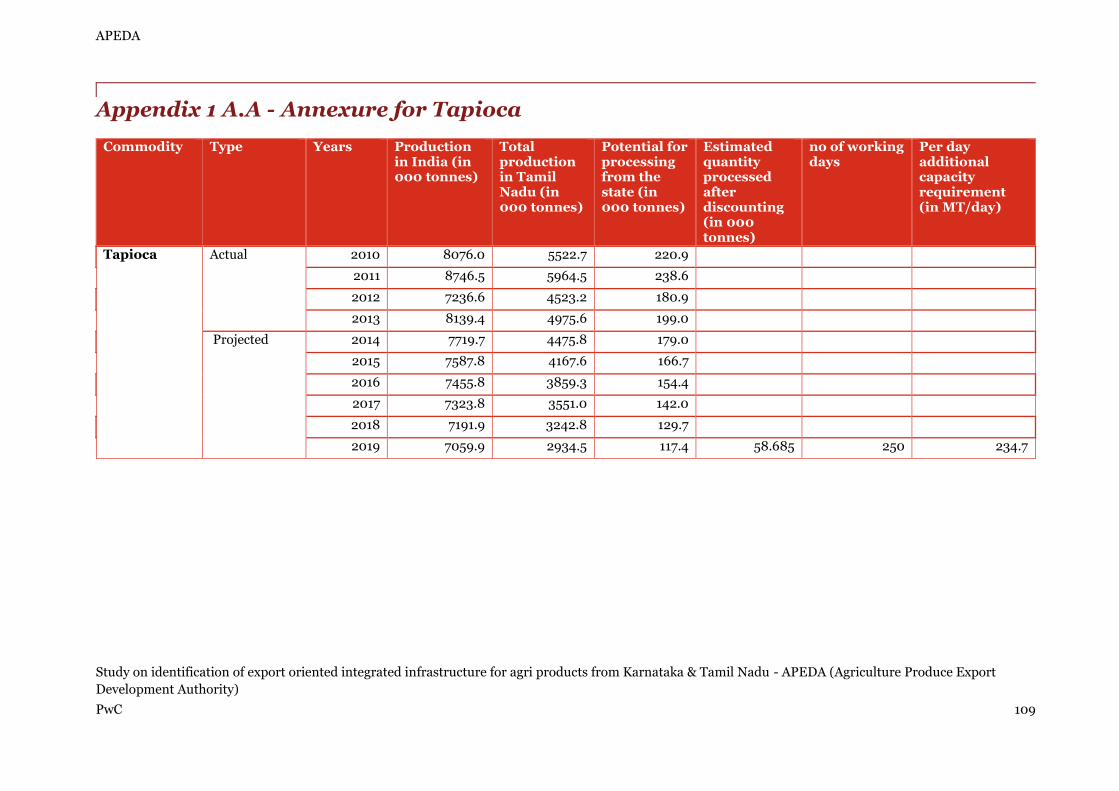
APEDA
Study on identification of export oriented integrated infrastructure for agri products from Karnataka & Tamil Nadu - APEDA (Agriculture Produce Export
Development Authority)
PwC 109
Appendix 1 A.A - Annexure for Tapioca
Commodity Type Years Production in India (in 000 tonnes)
Total production in Tamil Nadu (in 000 tonnes)
Potential for processing from the state (in 000 tonnes)
Estimated quantity processed after discounting (in 000 tonnes)
no of working days
Per day additional capacity requirement (in MT/day)
Tapioca
Actual
2010 8076.0 5522.7 220.9
2011 8746.5 5964.5 238.6
2012 7236.6 4523.2 180.9
2013 8139.4 4975.6 199.0
Projected
2014 7719.7 4475.8 179.0
2015 7587.8 4167.6 166.7
2016 7455.8 3859.3 154.4
2017 7323.8 3551.0 142.0
2018 7191.9 3242.8 129.7
2019 7059.9 2934.5 117.4 58.685 250 234.7

APEDA
Study on identification of export oriented integrated infrastructure for agri products from Karnataka & Tamil Nadu - APEDA (Agriculture Produce Export
Development Authority)
PwC 110
Appendix 1 A.A - State wise details of existing infrastructure
Appendix 1 A.A.G - State wise list of warehouses
Appendix 1 A.A.G.A - List of warehouses in Karnataka
Warehouses of CWC
District Name of the warehouse Total capacity in ‘000 Tonnes
Bangalore Bangalore I 25.54
Bangalore II 5.93
Bangalore V 5.02
Bangalore X 1.66
Whitefield 5.90
Hoskote 4.28
Bangalore MSIL premises
Bellary Amarapura 22.39
Bidar Bidar 10.00
Chitradurga Chitradurga 27.52
Davangere Davangere 25.93
Dharwad Dharwad 13.33
Gadag Gadag 48.25
Gulbarga Gulbarga I 9.78
Gulbarga II 35.00
Hubli I 11.44

APEDA
Study on identification of export oriented integrated infrastructure for agri products from Karnataka & Tamil Nadu - APEDA (Agriculture Produce Export
Development Authority)
PwC 111
Dharwad Hubli II 9.31
Koppal Koppal 1.48
Mandya Maddur 4.67
Mandya 5.19
Dakshin Kannada Mangalore I 18.72
Mangalore II CFS 14.70
Gadag Nargund 10.69
Raichur Raichur 4.68
Gulbarga Sedam 3.60
Shimoga Shikaripur 8.02
Shimoga II 13.75
Shimoga III 19.13
Shimoga IV 68.23
Shimoga V 17.34
Belgaum Soundatti 9.00
Tumkur Tumkur 23.93
Bellary Toranagallu 121.83
Hospet 12.22
Bellary 15.30
Raichur Munirabad 6.01
Chikmagalur Chikmagalur 29.52
Hassan Hassan 8.66
Coorg Kushalnagar 12.06
** Details of private warehouses in Karnataka not available

APEDA
Study on identification of export oriented integrated infrastructure for agri products from Karnataka & Tamil Nadu - APEDA (Agriculture Produce Export
Development Authority)
PwC 112
Appendix 1 A.A.G.A - Region wise list of warehouses in Tamil Nadu
S.No Name of the Region / Warehouse Address
STD Code
Phone No. Capacity MT.
CHENNAI REGION
01 Arakkonam Warehouse, ShahNagar, Ekku Nagar P.O.,
Arakkonam 631 004
04177
232547
21400
02 Arni Warehouse, 5/64, Chetput Road, Arni, Vellore Dist
04173
226821
12900
03 Kancheepuram Warehouse, 17H, Reddipet Road,Hodsenpet, Kancheepuram631 501
044
27222184
11400
04 Katpadi Warehouse,
Post Box No.710,
VIT Back Side,
Katpadi 632 007.
0416
2915706
3400
05 Madhuranthakam Warehouse, Near Gurukulam, PuduMambakkam Madhuranthakam - 603306
044
27552454
6000
06 Polur Warehouse, Near S.I. Mills Polur, 606803
04181
222118
10000

APEDA
Study on identification of export oriented integrated infrastructure for agri products from Karnataka & Tamil Nadu - APEDA (Agriculture Produce Export
Development Authority)
PwC 113
07 Ranipet Warehouse, 12B, SIPCOT Industrial Complex, Ponnai Road, Ranipet 632 403
04172
244758
7800
08 Tiruvellore Warehouse, Lakshmipuram,
Tiruvellore 602 001
044
27660530
9400
09 Vellore Warehouse, TNWC, No.1, Katpadi Road, Vellore 632004
0416
2222695
9500
Coimbatore Region:
S.No Name of the Region / Warehouse Address
STD Code Phone No. Capacity MT.
01 Avinashi Warehouse No. 141, Managalam Road, Avinashi 638 654
04296
273311
13800
02 Mettupalayam Warehouse Karamadai Road, Mettupalayam 641 301
04254
222076
15100
03 Palladam Warehouse Tiruppur Road, Narayanapuram Post, Palladam 638 664
04255
253005
8000

APEDA
Study on identification of export oriented integrated infrastructure for agri products from Karnataka & Tamil Nadu - APEDA (Agriculture Produce Export
Development Authority)
PwC 114
04 Pollachi Warehouse Meenakarai Road, Pollachi 642 001
04259
226065
10380
05 Tiruppur Warehouse S.F. NO. 400, Angeripalayam Road, Tiruppur 636 603
0421
2472252
18000
Cuddalore Region:
S.No Name of the Region / Warehouse Address
STD Code Phone No. Capacity MT.
01
Cuddalore Warehouse Enikkaran Thottam, Cuddalore Port 607 003
04142
238219
13000
02
Panruti Warehouse Kumbakonam Road,
Panruti, Cuddalore Dist. 607 106
04142
242096
6500
03
Tindivanam Warehouse Salavathy Village,
Ayyanthope P.O., Tindivanam, Cuddalore Dist.
04147
222060
9400
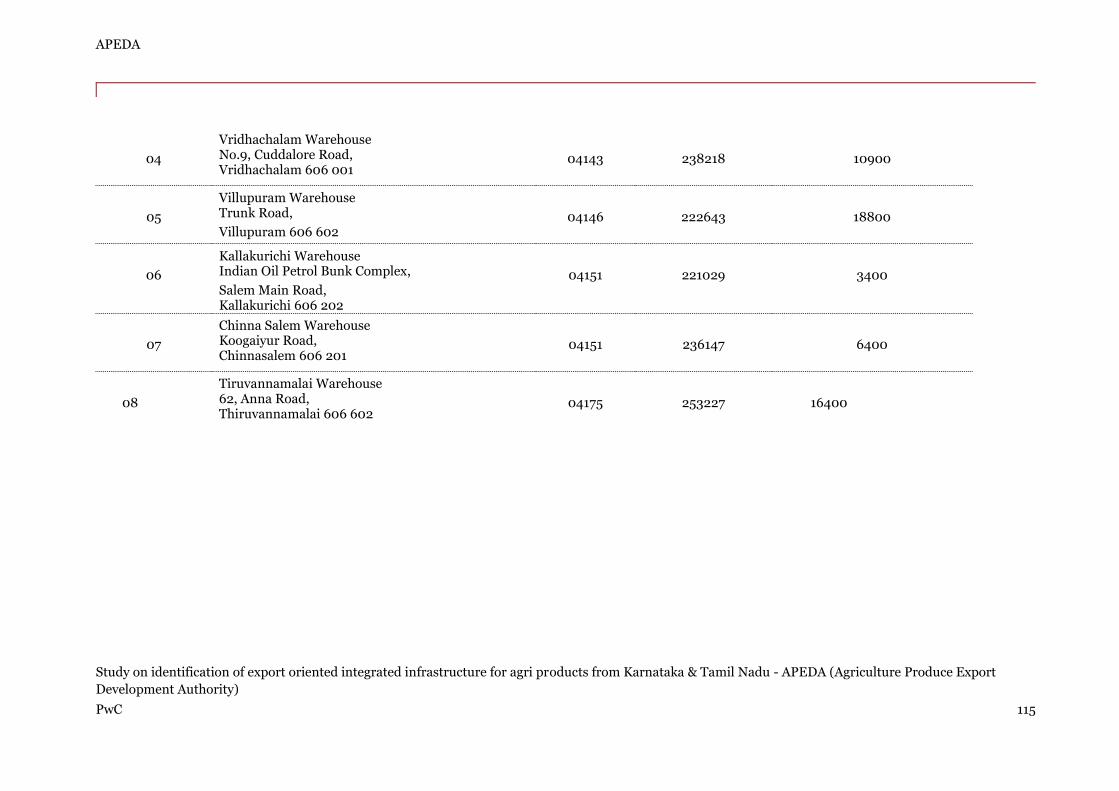
APEDA
Study on identification of export oriented integrated infrastructure for agri products from Karnataka & Tamil Nadu - APEDA (Agriculture Produce Export
Development Authority)
PwC 115
04
Vridhachalam Warehouse No.9, Cuddalore Road, Vridhachalam 606 001
04143
238218
10900
05
Villupuram Warehouse Trunk Road,
Villupuram 606 602
04146
222643
18800
06
Kallakurichi Warehouse Indian Oil Petrol Bunk Complex,
Salem Main Road, Kallakurichi 606 202
04151
221029
3400
07
Chinna Salem Warehouse Koogaiyur Road, Chinnasalem 606 201
04151
236147
6400
08
Tiruvannamalai Warehouse 62, Anna Road, Thiruvannamalai 606 602
04175
253227
16400

APEDA
Study on identification of export oriented integrated infrastructure for agri products from Karnataka & Tamil Nadu - APEDA (Agriculture Produce Export
Development Authority)
PwC 116
Madurai Region:
S.No Name of the Region / Warehouse Address
STD Code Phone No. Capacity MT.
01 Aruppukottai Warehouse 393, Sukkil Natham Road, Aruppukottai 626 117
04566
220571
8000
02
Dharapuram Warehouse S.V. Ram Warehouse, Poolavadi Road, Dharapuram 638 657
04258
234554
3104
03
Dindigul Warehouse, Palani Road, Dindigul 624 010
0451
2427319
14100
04
Karaikudi Warehouse Illupukudi Road,
Alagappapuram P.O. Karaikudi 626 003
04565
220267
18500
05 Manamadurai Warehouse 17 & 18, SIPCOT Industrial Estate, Manamadurai Dist 623 606
04574
258026
6000
06 Palani Warehouse MDPCCWS Limited godown, Dindigul Road, Palani 624 191
04545
242750
2053
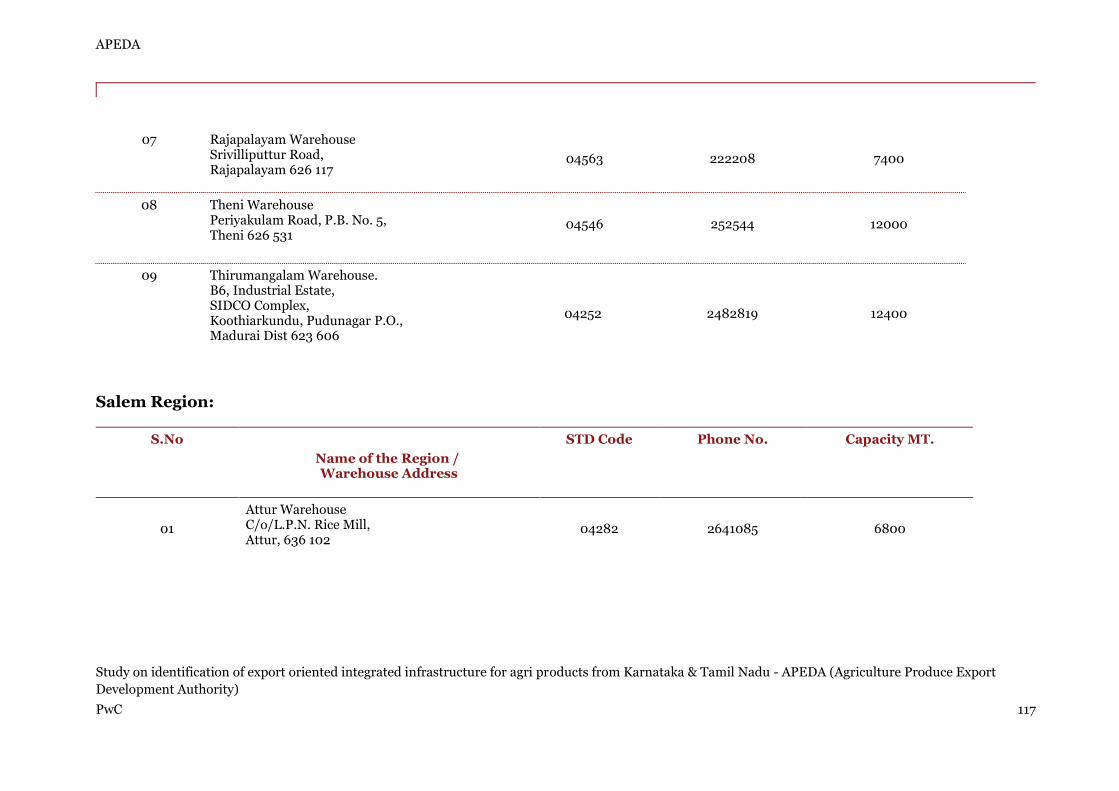
APEDA
Study on identification of export oriented integrated infrastructure for agri products from Karnataka & Tamil Nadu - APEDA (Agriculture Produce Export
Development Authority)
PwC 117
07 Rajapalayam Warehouse Srivilliputtur Road, Rajapalayam 626 117
04563
222208
7400
08 Theni Warehouse Periyakulam Road, P.B. No. 5, Theni 626 531
04546
252544
12000
09 Thirumangalam Warehouse. B6, Industrial Estate, SIDCO Complex, Koothiarkundu, Pudunagar P.O., Madurai Dist 623 606
04252
2482819
12400
Salem Region:
S.No
Name of the Region / Warehouse Address
STD Code Phone No. Capacity MT.
01
Attur Warehouse C/o/L.P.N. Rice Mill, Attur, 636 102
04282
2641085
6800

APEDA
Study on identification of export oriented integrated infrastructure for agri products from Karnataka & Tamil Nadu - APEDA (Agriculture Produce Export
Development Authority)
PwC 118
02
Dharmapuri Warehouse Bharathipuram Collectorate Post, Dharmapuri 636 705
04342
230987
12750
03
Gobi Warehouse 4/255B Sathy Main Road, Karattadipalayam, Gobi 638 453
04285
240619
6800
04
Krishnagiri Warehouse Ramapuram Post, Krishnagiri 635 115
04343
242443
2700
05
Namakkal Warehouse 76/A3, Triuchengode Road, Namakkal 637 001
04286
280315
9900
06
Salem Junction Warehouse Ariyangoundanpatti Lake, Suramangalam P.O.
Salem 636 005
0427
2387029
28600
07
Salem Town Warehouse Seetharama Chettiar Road, Salem 636 009
0427
2352465
14200

APEDA
Study on identification of export oriented integrated infrastructure for agri products from Karnataka & Tamil Nadu - APEDA (Agriculture Produce Export
Development Authority)
PwC 119
Tirunelveli Region:
S.No Name of the Region / Warehouse Address
STD Code Phone No. Capacity MT.
01 Ambasamudram Warehouse Opp. Railway Station, Ambasamudram 627 401
04634
250332
5500
02 Kovilpatti Warehouse Opp. Industrial Estate, Tuticorin Town Kovilpatti 627 701
04632
220852
9000
03 Meelavittan Warehouse Plot No. C45 to C49, Sipcot Complex Meelavittan 628 008
0461
2340366
18600
04 Palayamkottai Warehouse College Road, Perumalpuram Post, Tirunelveli 627 007
0462
2553083
18500
05 Sankaran Koil Warehouse 2/137, Kalugamalai Road, Sankarankoil 627750
04636
222478
6400

APEDA
Study on identification of export oriented integrated infrastructure for agri products from Karnataka & Tamil Nadu - APEDA (Agriculture Produce Export
Development Authority)
PwC 120
06 Tenkasi Warehouse Madurai Road, Near Panchyat Union Office, Tenkasi 627 811
04633
280452
6400
07 Tirunelveli Warehouse Swamy Nellaiappar High Road, Tirunelveli 627 001
0462
2333723
18500
08 Tuticorin Port Warehouse Railway Quarters Trunk Road, Tuticorin 628 004
0461
2352155
44700
09 Tuticorin Town Warehouse. 59, George Road, Tuticorin.
0461
2321471
5500
Trichy Region:
S.No Name of the Region / Warehouse Address
STD Code Phone No. Capacity MT.
01
Arantangi Warehouse Opp. Railway Station , Aranthangi 614 616
04371
220522
10000
02
Karur Warehouse Pasupathipalaym,
Karur 639 004
04324
242288
16200

APEDA
Study on identification of export oriented integrated infrastructure for agri products from Karnataka & Tamil Nadu - APEDA (Agriculture Produce Export
Development Authority)
PwC 121
03 Mayiladuthurai Warehouse West Sithakadu, Mayladuthurai, Thanjavur Dist.
04364
259314
17400
04 Musiri Warehouse Bye pass Road, Almarthupatti, Musiri 621 211
04326
260018
3400
05 Nagapattinam Warehouse Velipalayam,
Thanjavur Dist.613 006
04365
242347
18000
06 Nanjikottai Warehouse Nanjikottai Road,
Thanjavur Dist 613 006
04362
255291
19800
07 Pattukottai Warehouse No.60, Kottaikulam West Street, Pattukottai 641 601
04373
222239
4744
08 Pudukottai Warehouse Thirukogarnam P.O. Pudukootai 622 002
04322
236828
13000
09 Thiruvarur Warehouse Thanjavur Road, Vilamal, Thiruvarur 610 101
04366
222487
9000

APEDA
Study on identification of export oriented integrated infrastructure for agri products from Karnataka & Tamil Nadu - APEDA (Agriculture Produce Export
Development Authority)
PwC 122
10 Tirchy Warehouse No.1, Tanjore Road, Trichy 620 008.
0431
2201787
15610

APEDA
Study on identification of export oriented integrated infrastructure for agri products from Karnataka & Tamil Nadu - APEDA (Agriculture Produce Export
Development Authority)
PwC 123
Appendix 1 A.A.G - State wise list of cold storage units
Appendix 1 A.A.G.B - List of cold storage units in Karnataka
Sl.N0.
District
Name & Address of the cold storage Capacity (MT)
Ownership Commodities stored
1 Bangalore (urban)
1. Balala Tourist Hotel Pvt.Ltd(Cold Storage 450 Fruits and vegetables
Division)#18/B,Veerasandra Industrial Area, Anekal Taluk
2. M.R.C Cold Storage, 211, Bommasandra, Industrial Area, Anekal Taluk
2000 Fruits and vegetables
3. Himalaya Cold Storage, # 52, F, Bommasandra, Industrial Area, Anekal Taluk
300 Fruits and vegetables
4. Sumukha Cold Storage, Sampige nagar, Electronic city, (post), Anekal Taluk.
3500 Sumukha Cold Storage
Fruits and vegetables
5. Chethan Cold Storage unit, RMC Yard, Yeshwanthpur, Bangalore North.
800 Chethan Cold Storage Chili, Potato, Tomato, Cashew, Tamarind
6. Kaveri Cold Storage unit, RMC Yard, Yeshwanthpur, Bangalore North.
1000 Kaveri Cold Storage Tamarind, Cabbage, Resins, Cashew, potato
7. Lalbagh, Cold Storage, Lalbagh, Bangalore. 800 Department of Horticulture
Functioning
Potato.
2 Chikkaballapur
8. Nandi Cold Storage, BB Road 1200 Nandi Cold Storage Potato
9. Sapthagiri cold storage, Chikkaballapur 2500 Sapthagiri cold Potato
10.
Bhavani cold storage, Chikkaballapur - Bhavani cold storage cold

APEDA
Study on identification of export oriented integrated infrastructure for agri products from Karnataka & Tamil Nadu - APEDA (Agriculture Produce Export
Development Authority)
PwC 124
11.
Chikkaballapur cold storage 800 Chikkaballapur, Dept. of Horticulture
Non functioning
3 Yadgiri 12.
Usha Cold Storage,Industrial Area,(Roacking Area),BB Road,Shahapur
2500 Usha Cold Storage Dry Chillies
4 Kolar 13.
Kolar Cold Storage,District Office, Kolar 800 Department of Horti. Non functioning
14.
Bhavani cold storage, Tamaka, Kolar 2500 Bhavani Cold storage
15.
Marketing Federation cold storage, APMC, Kolar
2500 Marketing Federation
5 Belgaum 16.
Bharaphawala &Company,239/4, Mahathma
500 Bharaphawala Tamarind,BatateApple,Orange,Moosa
Phule Road, Shahapura,Belgam &Company mbi.&Flower Seeds
17.
Shakthi Agro Cold Storage,E/2,B.K.Kangrali,Industrial Estate,Belgam
3000 Shakthi Agro Cold Storage
Tamarind,BatateApple,Orange,Moosa mbi.&Flower Seeds
6 Hassan 18.
Perfect Cold Storage,No.31 B,B Katehalli, Industrial Area,Hassan
3000 Perfect Cold Storage Potato
19.
Balaji Cold Storage,Plot No.275,276,K,I,A,D,B.
7000 Balaji Cold Storage Potato
Industrial Area Growth Center, Holenarsipura
Road,Hassan
20.
J.P.G.A Cold Storage Pvt .Ltd.Plot No.271,272,
1000 J.P.G.A Cold Storage Potato
K.I.A.D.B. . Industrial Area Growth Center,
Holenarsipura Road,Hassan
21.
Sathanam Agro Cold Storage, Pl.No.322, 7500 Sathanam Agro Cold Potato

APEDA
Study on identification of export oriented integrated infrastructure for agri products from Karnataka & Tamil Nadu - APEDA (Agriculture Produce Export
Development Authority)
PwC 125
K.I.A.D.B. . Industrial Area Growth Center, Storage
Holenarsipura Road,Hassan
22.
Jaspindar Cold Storage Pvt. Ltd., Pl.No.322, 10000 Jaspindar Cold potato
K.I.A.D.B. . Industrial Area Growth Center, Storage
Holenarsipura Road,Hassan
23.
Shri Anand cold storage pvt.ltd., Pl.No.242, 8500 Shri Anand cold potato
243, K.I.A.D.B. . Industrial Area Growth storage
Center, Holenarsipura Road,Hassan
24.
Ganpathi cold storage, No. 339, 340, 7500 Ganpathi cold storage
Potato
K.I.A.D.B. . Industrial Area Growth Center, storage
Holenarsipura Road,Hassan
25.
Shri Gurudeva Cold storage pvt.ltd, No.1 E, Opp. HPCA, K.I.A.D.B. . Industrial Area Growth Center, Holenarsipura Road,Hassan
6800 Shri Gurudeva Cold Storage
Potato
26
.
Hassan cold storage 800 Department of
Horticulture
Non functioning
7 Tumkur 27.
Gayathri cold storage, opp. Karnataka state ware house, BH Road, Tumkur.
1500 Gayathri cold Storage
Tamarind, chili, potato, apple, moosambi, orange,
8 Hubli- Dharwad
28.
Shri. G.cold storage, 67/A, 2nd stage, Tharihala, Industrial Area, Hubli-31
3800 Shri. G. cold storage
Tamarind, chili, potato, vegetables & fruits
29.
AGTK, Expo cold storage, #124, K.I.A.D.B. Industrial Area, Tharihala, Hubli-31
3800 AGTK, Expo cold storage
Tamarind, chili, vegetables & fruits
30.
Hubli cold storage, APMC YARD, Amaragola, Hubli
7500 Tamarind, chili, potato, vegetables & fruits
9 Bangalore (rural)
31.Safal Market, Kannamangala,Hoskote Tq 10 Safal Potato, Fruits, Tamarind

APEDA
Study on identification of export oriented integrated infrastructure for agri products from Karnataka & Tamil Nadu - APEDA (Agriculture Produce Export
Development Authority)
PwC 126
10 Raichur 32. Raichur cold storage pvt.ltd., Haskihalla, Raichur taluk, Raichur dist.
6500 Apple, Tamarind, chili, potato, apple, moosambi, orange,tomato, cucumber, dry chilis, dates & sum
33 Raichur cold storage pvt.ltd., Haskihalla, Raichur taluk, Raichur dist.
6500 agricultural products.
11 Uttar kannada
34. T.S.S. Pvt. Cold storage Sirsi 886 T.S.S. Pvt. Cold Storage
Arecanut, Pepper, cardamum, vanilla,
12 Mangalore 35 .Ms/G.N.H. Kini cold storage, N.H.17, Bangra kulluru, Mangalore, 575013, D.K. district.
2100 Ms/G.N.H. Kini cold storage
Pepper, grapes, orange, peas, almond, cocam, dates.
13 Bijapur 36. Grape growers co-operative society, K.I.A.D.B Industrial Area Bijapur
1200 Grape growers co- operative society,
Dry grapes
37. Karnataka cold storage, APMC , K.I.A.D.B Industrial Area Bijapur
1000 Dry grapes, Tamarind & fruits.
38. Agro food cold storage, K.I.A.D.B Industrial Area, Bijapur
1000 Dry grapes
39. Kissan cold storage, K.I.A.D.B Industrial Area Bijapur
1000 Kissan cold storage
Dry grapes, spices.
40. Runavala agritec pvt.ltd, Toravi, Bijapur taluk, Bijapur distirict.
4000 Runavala agritec pvt.ltd
Dry grapes
41. KAPPEC , K.I.A.D.B Industrial Area Bijapur
65 ` KAPPEC Export quality grapes
42. Sagara Agritec cold storage, K.I.A.D.B Industrial Area, Bijapur
120 Sagara Agritec cold storage
Export quality grapes, citrus, vegetables
43. Basaveswar agro food pvt. Ltd, K.I.A.D.B Industrial Area Bijapur
500 Basaveswar agro food
Export quality grapes
44. K.H.B. agro foods & cold storage, APMC Yard, Bijapur.
3000 K.H.B. agro foods & cold storage
Dry grapes, Tamarind, chili, citrus, dates, apple.
71. Sai Balaji Cold Storage, Bellary. 5500 Sai Balaji Cold storage
72. Lalitha Cold Storage, Ananthapura,Bellary.
3500 Lalitha Cold Storage
73. Prasanna Anjaneya cold storage,bellary. 5500 Prasanna Anjaneya cold
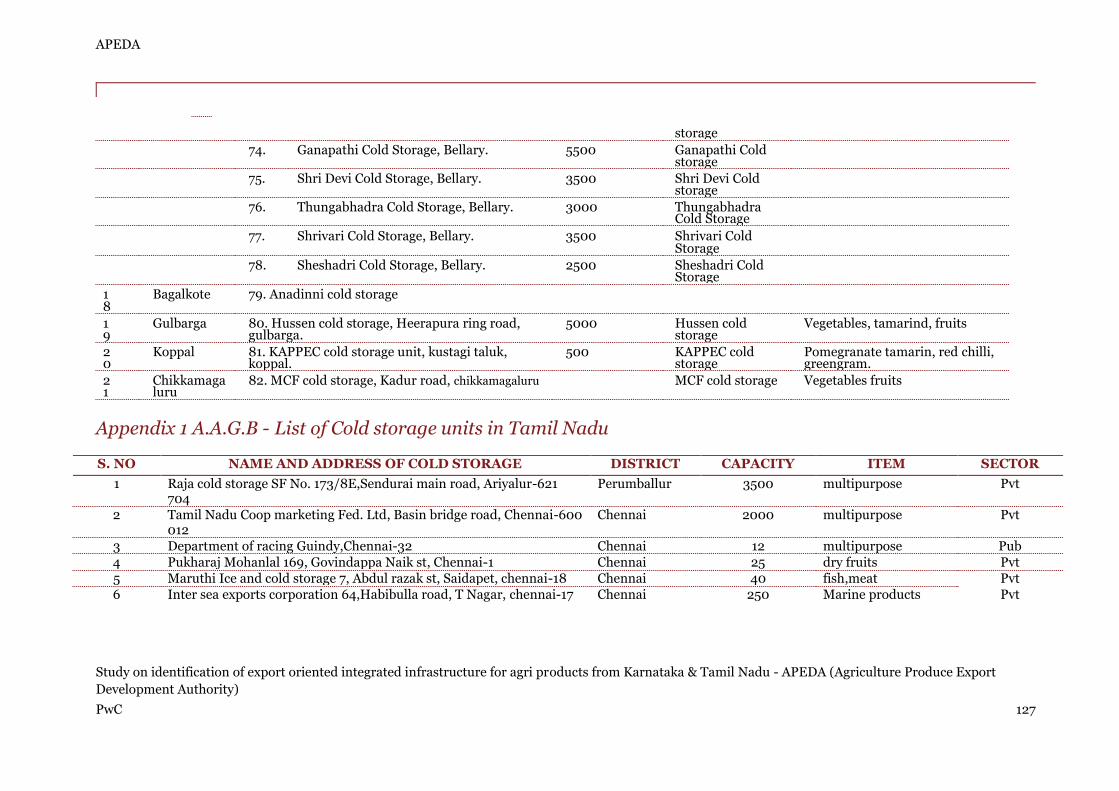
APEDA
Study on identification of export oriented integrated infrastructure for agri products from Karnataka & Tamil Nadu - APEDA (Agriculture Produce Export
Development Authority)
PwC 127
storage
74. Ganapathi Cold Storage, Bellary. 5500 Ganapathi Cold storage
75. Shri Devi Cold Storage, Bellary. 3500 Shri Devi Cold storage
76. Thungabhadra Cold Storage, Bellary. 3000 Thungabhadra Cold Storage
77. Shrivari Cold Storage, Bellary. 3500 Shrivari Cold Storage
78. Sheshadri Cold Storage, Bellary. 2500 Sheshadri Cold Storage
18
Bagalkote 79. Anadinni cold storage
19
Gulbarga 80. Hussen cold storage, Heerapura ring road, gulbarga.
5000 Hussen cold storage
Vegetables, tamarind, fruits
20
Koppal 81. KAPPEC cold storage unit, kustagi taluk, koppal.
500 KAPPEC cold storage
Pomegranate tamarin, red chilli, greengram.
21
Chikkamagaluru
82. MCF cold storage, Kadur road, chikkamagaluru MCF cold storage Vegetables fruits
Appendix 1 A.A.G.B - List of Cold storage units in Tamil Nadu
S. NO NAME AND ADDRESS OF COLD STORAGE DISTRICT CAPACITY ITEM SECTOR
1 Raja cold storage SF No. 173/8E,Sendurai main road, Ariyalur-621 704
Perumballur 3500 multipurpose Pvt
2 Tamil Nadu Coop marketing Fed. Ltd, Basin bridge road, Chennai-600 012
Chennai 2000 multipurpose Pvt
3 Department of racing Guindy,Chennai-32 Chennai 12 multipurpose Pub
4 Pukharaj Mohanlal 169, Govindappa Naik st, Chennai-1 Chennai 25 dry fruits Pvt
5 Maruthi Ice and cold storage 7, Abdul razak st, Saidapet, chennai-18 Chennai 40 fish,meat Pvt
6 Inter sea exports corporation 64,Habibulla road, T Nagar, chennai-17 Chennai 250 Marine products Pvt

APEDA
Study on identification of export oriented integrated infrastructure for agri products from Karnataka & Tamil Nadu - APEDA (Agriculture Produce Export
Development Authority)
PwC 128
7 Little top exports ltd 1, Kamaraj park st Royapuram Chennai-13 Chennai 200 marine products Pvt
8 TNFDC Ltd 67,Greams Road Chennai-6 CS at Adayar Chennai 50 Marine products Pub
9 Spencer & Co 788, Mount road Chennai-2 Chennai 102 multipurpose Pvt
10 Tamil nadu coop Marketing federation Ltd,, 91,St.Mary's Road,Chennai18 (CS at Koyambedu market)
Chennai 3000 Multipurpose Coop
11 Himachal Cld stotage Ltd, Thiruvottiyur, Chennai-1 Chennai 4000 multipurpose Pub
12 Modern Ice Manufacturers 93, Dr. natesan road, Mylapore Chennai-4 Chennai 25 Fish, Meat Pvt
13 Sivitha ice creams p ltd, 92, P.H. road, Chennai-84 Chennai 50 ice creams Pvt
14 Asvini fisheries ltd, 10,K.B. Dasan Road, Chennai-18 Chennai 200 marine products Pvt
15 Madras Ice factory & CS 99, Sydenhams road, Chennai-600003 Chennai 50 Marine products Pvt 16 Kalyani marine exports 166,peters road Royapettah,Chennai-14 Chennai 300 Marine products Pvt
17 KPS Cold storage Ooty road, Mettupalayam-641 301 (unit-II) Coimbatore 1500 multipurpose Pvt
18 Nahar Cold storage Thadagam road, Coimbatore-1 Coimbatore 1500 multipurpose Pvt
19 Tamil nadu coop milk marketing fed ltd, Coimbatore dary Coimbatore Coimbatore 280 milk products Coop
20 KPS Abdul Majeed & Co 10.Olylla st, Mettupalayam-641 301 Coimbatore 2500 multipurpose Pvt
21 Kwality ice creams P ltd E-47,Kurichi Ind.Estate Coimbatore-641 021 Coimbatore 40 ice creams Pvt
22 Abhirami cold storage P ltd Palaugarai Village Avinashi Taluk Coimbatore
Coimbatore 1000 multipurpose Pvt
23 Suvai foods Vaikalpalayam, Perur main road, Coimbatore-541 010 Coimbatore 40 ice creams Pvt
24 Nilgiri cold storage Ooty road Mettupalayam-641 301 Coimbatore 3000 multipurpose Pvt
25 AKS cold storage SF No. 956-57 Bhadrakaliamman koil Tekkampally village Mettupalayam-641 305
Coimbatore 5400 multipurpose Pvt
26 Kerala food packers Kinjampettai Cuddalore port-607 003 (closed) (closed)
Cuddalore 100 Marine products Pvt
27 George Maijo 112, Sonagat st, Cuddalore. (closed) (closed) (closed) Cuddalore 25 marine products Pvt
28 ASA cold storage Ameer estate,Azad nagar Krishnagiri-635 001 Dharmapuri 5000 multipurpose Pvt
29 Tamil nadu Coop milk marketing Fed. Ltd, Krishnagiri dairy Krishnagiri
Dharmapuri 490 milk products Coop
30 New Vennila cold storage 117A, Jettihalli post Dharmapuri- Dt Dharmapuri 3200 multipurpose Pvt

APEDA
Study on identification of export oriented integrated infrastructure for agri products from Karnataka & Tamil Nadu - APEDA (Agriculture Produce Export
Development Authority)
PwC 129
31 R.R cold storage 140/A, Kattinayarapalli, Varathanpalli Road Krishnagiri- 634 001
Dharmapuri 5000 multipurpose Pvt
32 Brothers cold storage 65, Nalla Thambi st Krishnagiri (expansion) Dharmapuri 1400 multipurpose Pvt
33 Jayalakhmi cold storage Krishnagiri Dharmapuri 750 multipurpose Pvt
34 Vennila cold storage 25-A,Kaliappa Gounder st Mathikonpalayam Dharmapuri
Dharmapuri 2500 multipurpose Pvt
35 Brothers cold storage 65, Nalla thambi st, Krishnagiri-635 002 Dharmapuri 2000 multipurpose Pvt 36 Ebenezar cold storage, Odanchatram Taluk, Dindigul Dindigul 1200 multipurpose Pvt
37 Tamil Nadu Coop milk Marketing Fed Ltd, Dindigul dairy Dindigul Dindigul 38 milk products Coop
38 Avanam Pillayar cold storage P Ltd, 31-A, MVM Nagar, Dindigal- 624 004
Dindigul 2000 multipurpose Pvt
39 Saravana cold storage 30/1 B1,Viralipatti Village Koovanoothu PO, Dindigul
Dindigul 4000 multipurpose Pvt
40 Nilgiri dairy farm ltd, Erode Erode 50 milk products Pvt 41 Tamil nadu coop milk marketing fed. Ltd Erode dairy Erode Erode 602 milk products Coop
42 Thirumuruga cold storage Ltd, SIPCOT Ind. Estate, Perumdurai Erode (dt)
Erode 5200 multipurpose Pvt
43 George maijo & Co, Plot.No.23, MGR road, Palavakkam, Chennai-41(closed)
Kancheepuram 250 Marine products Pvt
44 Westernfarm fresh P ltd 15/1-B1 Varadarajapuram Poonamallee Sriperumbudur
Kancheepuram 2500 fruits and vegetables Pvt
45 Abad Overseas P ltd, C/2, SIPCOT Ind. Estate, Irrungattukottai Chennau-602 105
Kancheepuram 500 Marine products Pvt
46 Aries exports P Ltd Kumaran nagar, Old Mahabalipuram road Chamacheri, Chennai-96
Kancheepuram 100 marine products Pvt
47 Devi marine exports ltd, 63/1, Muttukadu road, Chennai-41 Kancheepuram 150 Marine products Pvt 48 New India Maritime Agencies 55, Armenian st Chennai-1 CS at
Tondiarpet Kancheepuram 750 Multipurpose Pvt
49 Agri-Marine exports P ltd Ennore coastal high road Chennai-19 Kancheepuram 75 Marine products Pvt

APEDA
Study on identification of export oriented integrated infrastructure for agri products from Karnataka & Tamil Nadu - APEDA (Agriculture Produce Export
Development Authority)
PwC 130
50 Liberty cold storage Ltd, 63/1, Muttukadu road, Neelankarai, chenni-41
Kancheepuram 750 Marine products Pvt
51 New India maritime agencies 55, Armenian St, Chennai-1 CS at Tondiarpet
Kancheepuram 400 Marine products Pvt
52 TNFDC Ltd 67, Greams Road, Chennai-6 Cs at Ennore CS at Adayar Kancheepuram 100 Marine products Pub
53 Agar & Alginate Laboratories Muttukadu road, Neelankarai, Chennai-41(closed)
Kancheepuram 75 Marine products Pvt
54 Farm SuzzanneP ltd Palavakkam Chennai-41 Kancheepuram 200 Marine products Pvt
55 Blue star foods 4-215A, MGR road Palavakkam Chennai-41 Kancheepuram 150 Marine products Pvt
56 Victoria Marine & Agro exports ltd, 37, Old Mahabalipuram road,Padur, Chennai
Kancheepuram 350 marine products Pvt
57 Overseas marine products D-3.block, DII, Alwarpet Chennai-18 CS at kancheepuram Dt
Kancheepuram 400 Marine products Pvt
58 Cochin sea foods, 4/216 , MGR road, Palavakkam,Chennai-41 Kancheepuram 150 Marine products Pvt
59 Orient marine products P Ltd Manjambakkam, Chennai-600 060 Kancheepuram 300 marine products Pvt
60 Ayshwarya Seafoods Ltd 4/364, Anna Rd,Palavakkam Chennai-41 Kancheepuram 150 marine products Pvt
61 RBT exports 291,Bandikavannor village Ponneri Taluk Kancheepuram 180 marine products Pvt
62 Balaji sea food exports Ltd 107,Bandikavannor village Sholavaram post Chennai-67
Kancheepuram 140 marine products Pvt
63 Sri sakthi cold storage P ltd 35, Kazhipattur village Padur post Kancheepuram Dist
Kancheepuram 400 marine products Pvt
64 Ocean foods I ltd Padur village Old Mahabalipuram road Chennai-103 Kancheepuram 100 marine products Pvt
65 Westernfarm fresh P Ltd Varadarajapuram Poonamalee Sriperambadur,Chennai
Kancheepuram 5475 multipurpose Pvt
66 Asian marine products p Ltd East coast road, Injambakkam, Chennai-41
Kancheepuram 150 marine products Pvt
67 Oceanic Fisheries Ltd Padanthalmoodu Kanyakumari Distt Kanyakumari 50 Marine Products Pvt
68 Relish foods P Ltd, 17/9B, Tirunelveli Road, Madhavapuram, Kanyakumari
Kanyakumari 75 Marine products Pvt

APEDA
Study on identification of export oriented integrated infrastructure for agri products from Karnataka & Tamil Nadu - APEDA (Agriculture Produce Export
Development Authority)
PwC 131
69 M.M.Hitech cold storage P ltd, 104, East masi st Madurai-625001 (expansion)
Madurai 2000 multipurpose Pvt
70 Ayyanar cold storage Madurai-Dindigul NH Ayyankottai Madurai-624221 (expansion)
Madurai 206 multipurpose Pvt
71 Ayyanar cold storage , Dindigul NH road, Ayyankottai, Madurai-624 221.(expn)
Madurai 3200 multipurpose Pvt
72 Kaveri cold storage Paravai village Madurai-625 402 (expansion) Madurai 2000 multipurpose Pvt
73 Farmer brothers & co 33, M.C. Chidambara nadar st, Virudhnagar CS at Madurai
Madurai 3500 multipurpose Pvt
74 M.M.Hi-Tech cold storage P ltd, 104, East Masi st, Madurai-625 001 Madurai 2000 multipurpose Pvt
75 Tamil nadu coop milk marketing fed. Ltd, Madurai dairy Madurai Madurai 735 milk products Coop
76 Kaveri cold storage 39C/NH, Paravai Village, Madurai-625 019 Madurai 3500 Multipurpose Pvt
77 Ayyanar Cold storage Madurai-Dindigul NH Ayyankottai,Madurai-624221
Madurai 4000 Multipurpose Pvt
78 ADR cold storage, D-24, SIDCO Ind. Estate, Kappalur, Madurai. Madurai 2327 multipurpose Pvt
79 Tamil Nadu coop milk marketing fed ltd Ooty dary Ooty Nilgiris 470 milk products Coop
80 Shanmuganathan cold storage P ltd, 95-A, Thiru-Vika nagar, Puthur, Trichy-620 017 (CS at Puthukottai)
Puthukottai 2500 multipurpose Pvt
81 TNFDC Ltd Boat building yard Mandapam 623 518 Ramnathapuram
100 Marine products Pvt
82 Poyilakada fisheries Ltd RS No.38/1235, Nagachi Village, Uchuppudi Ramnad Dist
Ramnathapuram
200 Marine products Pvt
83 Baby marine exports Mandapam Ramnadapuram Dt Ramnathapuram
400 Marine products Pvt
84 Asvini fisheries Ltd, 10, K. B dasan Road, Chennai-6000 18 (CS at ramanathapuram)
Ramnathapuram
300 marine products Pvt
85 Tamil nadu coop milk marketing fed ltd, Ramanathapuram dairy Ramnad
Ramnathapuram
40 milk products Coop
86 Tamil nadu coop milk Marketing Fed Ltd Salem dairy Salem Salem 543 milk products Coop

APEDA
Study on identification of export oriented integrated infrastructure for agri products from Karnataka & Tamil Nadu - APEDA (Agriculture Produce Export
Development Authority)
PwC 132
87 Raj Vignesh cold storage P ltd, 107/5B,Kudalore village Sankan Taluk Salem
Salem 2500 multipurpose Pvt
88 Sri Selvi cold storage P Ltd, 81/6-C, kanagagiri village, Kakapalayam, Salem-637 103
Salem 2500 multipurpose Pvt
89 Atlantic foods Ramalingapuram Salem-636 106 Salem 100 Ice creams Pvt
90 Sri Sachithananda Cold storage,90, east masi St, Madurai-625 001 CS at Theni
Theni 3000 multipurpose Pvt
91 Sri Sundaram Cold storage Allingaram,Periyakulam Rd, Theni Theni 4000 multipurpose Pvt
92 National dairy devt. Board Ambattur dairy Ambattur Thiruvallur 175 milk products Coop
93 Parwaz food packers 289/2B,Thiruvallur road Alamatti, redhills Chennai-52
Thiruvallur 200 marine products Pvt
94 Saradakripa cold storage P ltd, plot. No.34, Madhavaram Village Ambattur Taluk
Thiruvallur 5400 multipurpose Pvt
95 Renuka Parameswari cold storage P ltd, S.No. 766/1 Near Madhavaram Fly over Madhavaram
Thiruvallur 6050 multipurpose Pvt
96 Poorna Vijayasali cold storage ltd, 14, Lotus colony Ist street, Madavaram Chennai-600060
Thiruvallur 3100 multipurpose Pvt
97 SBP cold storage P ltd P H Road, Noombai village, Behind sindhi college Chennai-600077
Thiruvallur 2000 multipurpose Pvt
98 Tamil nadu coop milk marketing fed. Ltd, Ambattur dairy II Ambattur Thiruvallur 384 milk products Coop
99 Govind cold storageP ltd Ambattur Taluk Thiruvallur Thiruvallur 4150 multipurpose Pvt
100 Tamil nadu coop milk marketing fed ltd, Ambattur dairy Ambattur Thiruvallur 575 milk products Coop
101 Hatsun foods Company Nallur Village,Ponneri, Thiruvallur Dt Thiruvallur 200 ice creams Pvt
102 Bala marine exports P ltd 1/145,APH road,Vanagaram Chennai-102 Thiruvallur 55 marine products Pvt
103 Somanica foods P ltd 372, Ind.Estate Ambattur, Chennai-58 Thiruvallur 45 ice creams Pvt
104 Tamil nadu coop milk marketing fed ltd, Tirunelveli dairy Tirunelveli Tirunelveli 130 milk products Coop
105 Trichy cold storage P ltd, SIDCO Ind.Estate, Thuvakudi, Trichy. Trichy 5000 multipurpose Pvt
106 Nila sea foods 166-A, North beach road, Tuticorin- 628 001 Tuticorin 50 marine products Pvt
107 George Maijo & Co, 2-B, Apex Plaza 3, Nungambakkam High Road, Chennai-34 CS at Mandapam
Tuticorin 75 Marine products Pvt
APEDA
Study on identification of export oriented integrated infrastructure for agri products from Karnataka & Tamil Nadu - APEDA (Agriculture Produce Export
Development Authority)
PwC 133
108 Amulya sea foods C-84, SIPCOT Ind. Estate Tuticorin-628 008 Tuticorin 200 Marine products Pvt
109 Amulya sea foods P ltd, C-97 SIPCOT Ind. Estate Tuticorin-628008 Tuticorin 200 Marine products Pvt
110 Diamond seafood exports 3/52,Krishnarajapuram Tuticorin-628002 Tuticorin 150 Marine products Pvt
111 TNFDC Ltd 166A, North beach road, Tuticorin-628001 Tuticorin 150 Marine products Pvt
112 Kings international Aqua exports ltd, 51/15B, Muniaswamipuram II st,Kamaraj Salai, Tuticorin-628 101
Tuticorin 100 marine products Pvt
113 Baby marine eastern exports C-75 SIPCOT Ind.Estate Tuticorin-628 008
Tuticorin 400 Marine products Pvt
114 Theva & Co 3/52, Krishnarajapuram Tuticorin-2 Tuticorin 200 Marine products Pvt
115 Nila seas foods P ltd, 137-A, Pudurpandiapuram Tuticorin-628 002 Tuticorin 500 marine products Pvt
116 Amulya sea foods C-96 SIPCOT Ind.Estate Tuticorin-628 008 Tuticorin 100 marine products Pvt
117 Ninans cold storage SIPCOT ind.complex Madathur Tuticorin Tuticorin 5150 Fruits & Vegetable Pvt
118 Nila cold storage P Ltd 215-B, Pudurpandiapuram Tuticorin Tuticorin 10000 multipurpose Pvt
119 Kadar Investment & trading Co Ltd, C-51 SIPCOT Ind.Estate, Tuticorin-8
Tuticorin 500 Marine products Pvt
120 Indus cold storage 1/129, Chitheri, Vellore Vellore 1000 multipurpose Pvt
121 Sri Krishna cold storage 10/2-5, Paranattamangalam Salem Salem 5300 multipurpose Pvt
122 Adi Sakthi cold storage p Ltd, Annur road, Bellady village, Mettupalayam.
Coimbatore 5000 multipurpose Pvt
123 kolar Cold storage Alamaram stop Jedayampalayam village Mettupalayam
Coimbatore 4500 multipurpose Pvt
124 Palamudir cold storgae Chinnayampalayam Coimbatore Coimbatore 500 multipurpose Pvt
125 Ranga Lalitha Cold Storage, 500, Main Road, Shevepet, salem-636 002
Salem 2000 multipurpose Pvt
126 Vidya Bharathi cold storage, 152/34, G N T Road, Madhavaram, Chennai
Thiruvallur 5500 mutipurpose Pvt
127 Garden Fresh cold storage, SF 89, Karisalpatti, Allampatti PO, Thirumangalam
Madurai 2500 multipurpose Pvt
128 Sri Ayyappa Hitech cold storage Ltd, 277/2, Jadayampalayam, Annur road, Mettupalayam, Coimbatore
Coimbatore 5000 multipurpose Pvt

APEDA
Study on identification of export oriented integrated infrastructure for agri products from Karnataka & Tamil Nadu - APEDA (Agriculture Produce Export
Development Authority)
PwC 134
129 Ranga Lalitha cold storage, 500, main road, Shevapet, salem-636 002 Salem 2000 multipurpose Pvt
130 EmpeeBee Exports&imports, 109/3, Noombal Village, Ambattoor Thiruvallur 3000 multipurpose Pvt
131 Fazil cold storage, SF 68, Punganur village, Dindigul road, Trichy. Trichy 4400 multipurpose Pvt
132 Elumalai Cold Storage P Ltd, 31/1A, Padikasipatti village, Rajapalayam,Virudhnagar,
Virudhnagar 2320 multipurpose Pvt
133 Sree Bishnu Potato cold storageLtd,SF 464/3,Bellathi village, Mettupalayam
Coimbatore 7000 multipurpose Pvt
134 Devraj Agro Industries 103, women ind. Park, Thirumullaivoyal, Ambattor
Thiruvallur 5760 multipurpose Pvt
135 Kolar cold storage 238/1, Jadampalayam village Mettupalayam. Coimbatore 4250 multipurpose Pvt
136 Arunachala cold storage 219/1A-4, Puzhal Vill, Vadaperumbakkam, Ambattur.
Thiruvallur 5300 multipurpose Pvt
Appendix 1 A.A.G - State wise list of ICDs & CFSs
Appendix 1 A.A.G.C - List of ICD & CFS in Karnataka
Location Whether CFS or ICD
Agency/ Company State Date of LOI Whether Functioning or
Under Implementation
Mangalore (Panambur) CFS Central Warehousing Corporation Karnataka 14/08/1995 F
Karwar CFS Central Warehousing Corporation Karnataka 24/03/2000 F
Whitefield, Bangalore CFS Central Warehousing Corporation Karnataka 09/05/2000 F
Bangalore CFS M/s Continental Warehousing Corporation Ltd.
Karnataka 02/08/2001 UI

APEDA
Study on identification of export oriented integrated infrastructure for agri products from Karnataka & Tamil Nadu - APEDA (Agriculture Produce Export
Development Authority)
PwC 135
Kanwar Port CFS M/s Vikram Integrated Logistics Pvt. Ltd .
Karnataka 13/05/2005 F
Hassan CFS Vikram Logistics and Maritime Services (P) Ltd
Karnataka 16/04/2008 F
Bangalore CFS Hindustan Aeronautics Ltd Karnataka 21/04/2008 UI
Jokkatte Road, Baikampadi, Mangalaore
CFS ABG Infralogistics Limited, Mumbai Karnataka 25/11/2010 UI
Whitefield, Bangalore CFS Marigold Logistics Private limited Karnataka 02/02/2012 UI
Kachrakanahalli village, Bangalore
ICD Sical mullimodal and Rail transport Ltd.
Karnataka 12/11/2012 UI
Atlible, Anekal Taluk, Bangalore
ICD M/s Palrecha Infrastructure and Developers
Karnataka 20/03/2013 UI

APEDA
Study on identification of export oriented integrated infrastructure for agri products from Karnataka & Tamil Nadu - APEDA (Agriculture Produce Export
Development Authority)
PwC 136
Appendix 1 A.A.G.C - List of ICD & CFS in Tamil Nadu
Location Whether ICD or CFS
Agency/ Company State Date of LOI Whether Functioning or
Under Implementation
Tuticorin CFS Container Corporation of India Ltd. TN 22.10.92 F
Tuticorin CFS M/s SEC Services Ltd. TN 16.10.92 F
Madhavaram CFS Central Warehousing Corporation TN 13.08.93 F
Tirupur CFS M/s TEA Lemuir Cont, Terminal Pvt. Ltd. TN 28.03.94 F
Tuticorin CFS M/s St. John Freight Systems Pvt. Ltd. TN 11.08.94 F
Coimbatore, ,Singanallur CFS Central Warehousing Corporation TN 14.08,95 F
Chennai CFS M/s Gateway Distriparks (South) Pvt. Ltd. TN 28.02.95 F
Chennai CFS Ws A.S.Shipping Agencies Pvt. Ltd. TN 28.02.95 F
Salem CFS Ws Sanco Trans Ltd. TN 14.08.95 F
Chennai CFS Balmer Lawrie & Co. Ltd. TN 24.10.95 F
Chennai CFS M/s Viking Warehousing TN 24.10.95 F
Chennai CFS M/s SICAL Distriparks Ltd. TN 15.07.96 F

APEDA
Study on identification of export oriented integrated infrastructure for agri products from Karnataka & Tamil Nadu - APEDA (Agriculture Produce Export
Development Authority)
PwC 137
Tuticorin CFS Central Warehousing Corporation TN 10.11.97 F
Tuticorin CFS Ws Sanco Trans Ltd. TN 10.11.97 F
Madurai ICD Container Corporation of India Ltd. TN 10.11.97 Non Functional
Chennai CFS M/s Sattva Hi-Tech & Conware Pvt. .Ltd. TN 01.09.99 F
Malpakkam Arakkonam ICD M/s Sattva Hi-Tech & Conware (Arakkonam) Pvt.. Ltd.
TN 24.03.2000 F
Tuticorin CFS M/s Continental ContainerFreight Station This CFS has been amalgamated with Indev Logistics Private Ltd. With the approval of IMC held on 21.10.10.
TN 24.03.2000 F
Karur CFS M/s Continental Container Freight Station Pvt. Ltd.(Continental Container Freight Station was changed to Continental Container Freight Stations Pvt.Ltd. vide their letter dated 20.6.10.This CFS has been amalgamated with lndev Logistics Private Ltd. With the approval of IMC held on 21.10.10.
TN 28,06.2000 F
Tuticorin CFS M/s Raja Agencies TN 07.06.01 F
Madhavaram CFS M/s Continental Warehousing Corporation Ltd. , Chennai (LOI was transferred to Continental Warehousing Corporation (Nhava Seva) Ltd. , Navi Mumbai on 7/6/2010
TN 09.08.2000 F
Manali CFS M/s Indian Corporate Business Centre Ltd. TN 02.08.02 F

APEDA
Study on identification of export oriented integrated infrastructure for agri products from Karnataka & Tamil Nadu - APEDA (Agriculture Produce Export
Development Authority)
PwC 138
Tirupur CFS M/s Continental Container Freight Station Pvt. Ltd,(Continental Container Freight Station is converted into Continental Container Freight Stations Pvt. Ltd. vide their letter dated 20.6.10. This CFS has been amalgamated with Indev Logistics Private Ltd. With the approval of IMC held on 21.10.10)
TN 06 08 02 F
Tuticorin CFS M/s K.S.P.S. Natarajan CFS Park Pvt. Ltd. TN 07.08.02 F
Tuticorin CFS M/s Hari & Co TN 16.08.02 F
Manali CFS M/s Kailash Shipping Services Pvt. Ltd. TN 08.11.02 F
Edyansavadu (Ponneri Taluk) CFS M/s Triway CFS Pvt. Ltd. TN 22.11.02 F
Tirupur ICD Container Corporation of India Ltd. TN 07.05.03 F
Chennai CFS M/s Vishrutha Logistics Ltd. TN 30.06.03 F
Coimbatore ICD M/s Chettinad Logistics Pvt. Ltd. TN 26.09.03
Irugur ICD Container Corporation of India Ltd• TN 24.11.04 F
Tuticorin CFS M/s A S Shipping Pvt. Ltd. TN 17.05.05 F
Manali CFS M/s Sattva Logistics Pvt. Ltd. TN 26.09.05 UI
Chennai CFS M/s Allcargo Movers (I) Pvt. Ltd. TN 06.03.06 F

APEDA
Study on identification of export oriented integrated infrastructure for agri products from Karnataka & Tamil Nadu - APEDA (Agriculture Produce Export
Development Authority)
PwC 139
Vallur Village Chennai CFS M/s German Express Shipping Agency (India) Pvt. Ltd.
TN 06.03.06 F
Napalayam, Chennai CFS M/s PRK Container Freight TN 11.05.06 UI
Station Pvt. .Ltd.
Irrungattukottai, Sriperumbudur
CFS Glovis India Pvt.Ltd., Tamil Nadu (LOI issued to Hyundai Motor India Ltd. was cancelled on 1.1.10 and LOI was reissued to Glovis India (P) Ltd.on 1.1.10
TN 1.1.2010 F
Vichur Village, Chennai CFS M/s. Avanthi Logistics Pvt, Ltd. TN 29.06.06 UI
Sadayankuppam Village Chennai
CFS M/s GRR Logistics Pvt. Ltd. TN 26.07.06 UI
Chennai CFS M/s Chandra CFS and Terminal Operators Pvt. Ltd.
TN 26.07.06 F
K attram bakkam Village, Chennai ICD M/s Sun Global Logistics Pvt.Ltd. TN 26.07.06 F
Irungattukottai Chennai ICD M/s Indev Logistics Pvt Ltd. TN 26.07.06 F
Chennai CFS Mis Devadoss Reddy Logistics Pvt. Ltd. TN 12.10.06 F
Tuticorin CFS M/s Vilsons Container Terminal TN 15.05.07 F
Tuticorin CFS Central Warehousing Corporation TN 15.05.07 F
Gummidipoondi Chennai CFS M/s Durai Shipping & Services Pvt. Ltd., TN 15 05 07 UI

APEDA
Study on identification of export oriented integrated infrastructure for agri products from Karnataka & Tamil Nadu - APEDA (Agriculture Produce Export
Development Authority)
PwC 140
Chrompet (Chennai) ICD Central Warehousing Corporation TN 02.08.07 F
Chennai CFS M/s Ennore Cargo Containers Terminals Pvt. Ltd.
TN 10.02.05 F
Chennai CFS M/s Seahorse Distribution andfreight Services Pvt.Ltd
TN 03.03.08 UI
Gounderpalayam CFS M/s Maersk India Pvt.Ltd. TN 04.03.08
Vichur village CFS M/s R.R.Distriparks (P) Ltd TN 08.04.08 UI
Tuticorin CFS M/s Diamond Shipping Agencies Pvt.Ltd., Tuticorin
TN 4.6.2008 F
Chennai CFS M/s Triway Warehouses and Holdings Pvt. Ltd. Chennai
TN 6.6.2008 UI
Tuticorin CFS M/s St. John Freight Systems Ltd. , Tuticorin
TN 1.9.2008 UI
Milavattan Village,Tuticorin CFS SICAL Distriparks Ltd TN 27.4.200 9 F
Puzhal Village, Thiruvallur, Chennai
CFS Calyx Container Terminal Pvt.Ltd Mumbai TN 19.8.09 UI
Ponneri Taluk,Tiruvallur Distt. Near Ennore Port
CFS Sattva Conware Pvt.Ltd. , Chennai TN 1.1.2010 F
Madhavaram, Chennai CFS iThiru Rani Logistic Private Ltd.Chennai TN 11 2.201 0

APEDA
Study on identification of export oriented integrated infrastructure for agri products from Karnataka & Tamil Nadu - APEDA (Agriculture Produce Export
Development Authority)
PwC 141
Kattupalli Port,Ponneri Taluka,Thiruvallur Dist. T.N
CFS L&T Shipbuilding Ltd.Chennai TN 2 6.2010 UI
Attathangal/Nallur Village CFS Continental Warehousing Corporation (Nhava Seva), Navi Mumbai
TN 18.10.10 UI
Ambur,North Arcot District CFS Western Gateway Cargo Services Private Limited
TN 02.02.12 UI
Hosur, Krishnagiri District ICD Pearl Port & Warehousing Pvt. Ltd. TN 31.05.12 UI
Door No.121, Harbour Express Road,Tuticorin
CFS Chola Logistiks Pvt.Ltd TN 20.6.12 F
Manali, Vaikadu Village, Chennai CFS Sudharsan Logistics Pvt.Ltd. TN 12.11.12 UI
Anuppampattu Village CFS Sical Multimodal and Rail Transport Ltd. TN 07.12.12 UI
Tiruvottiyur, Chennai CFS STP, Services Private Limited TN 05.09.13 UI
Chennai Port CFS Chennai Port Trust TN 17.12.13 UI

APEDA
Study on identification of export oriented integrated infrastructure for agri products from Karnataka & Tamil Nadu - APEDA (Agriculture Produce Export
Development Authority)
PwC 142
Appendix 1 B - Exit Point Infrastructure
Appendix 1 B.B.A - Commodity Wise Port Wise Provisional Capacities Of Major Ports (as on
31.12.2014)
(IN MILLION TONNES)
Sl. #
COMMODITY KOLKATA
HALDIA
PARADIP VIZAG
CHENNAI
ENNORE
VOC
COCHIN
NEW MA- NGALORE
MORMUGAO
MUMBAI
KANDLA
J.N.P
TOTAL
1 P.O.L 4.50
17.00 43.00(1)+3 SBM
17.65
17.65 3.00 2.30
24.01 49.17 1.50 32.00 66.60+0.8
5.50 291.90+4.80
+4.0
(3+2BJ)
(4) (4) (1) (1) (4)+SPM
(5+ SPM) (1) (5) (8+3SBM) +A
(2) (44+8SBM+ 2BJ)
(7)+A
2 IRON ORE 6.00 4.50 12.50
12.50 6.00 7.50 27.50 72.00
(2) (1) (1) (1) (1) (1) (1+3 Trans)
(8+ 3Trans)
3 COAL 7.00 20.00 21.00 12.55
5.40 (1) 65.95
(THERMAL) (2) (2) (3) (3) (11)

APEDA
Study on identification of export oriented integrated infrastructure for agri products from Karnataka & Tamil Nadu - APEDA (Agriculture Produce Export
Development Authority)
PwC 143
4 FERTILISER 7.50 1.00 0.80 2.00 11.30
(2) (1) (1) (1) (5)
5 GEN. BREAK 6.74
15.75 33.80 47.09
17.92 1.00 22.21
12.35 15.70 7.65 11.53+6.00
26.52* 0.90 219.16+6.51
BULK CARGO 0.51
(8) (9) (15) (14) (1) (10)
(12) (8) (4) (25)*+(A)
(13) (1) (142)+A
(22)+A
6 CONTAINERS 5.90
4.00 2.68 42.45 5.00
12.50 1.00 7.20 59.48@
140.21
(4) (2) (1) (7) (1) (2) (1) (2) (9) (29)
In lakhs TEUs 4.58
3.33 2.08 35.00 4.17
10.00 0.83 6.00 45.50
114.19
TOTAL (Upto 31-3-2014)
17.14
49.75 108.80 88.92
86.04 31.00 42.06
49.66 77.77 36.65 44.53 102.32 65.88
800.52
+4.51
(17)+2BJ
(15)+3SPM
(22) (24) (6) (15) (19)+SPM
(15 +SPM) (6+ 3Trans)
+6.0 +0.8 (12) 11.31
(33)+A
(31)+A
(24+3SBM)+A
(239+9SBM+
3 Trans+2BJ+
A)
APEDA
Study on identification of export oriented integrated infrastructure for agri products from Karnataka & Tamil Nadu - APEDA (Agriculture Produce Export
Development Authority)
PwC 144
Capacity Addition during April 2014 to September 2014
0.00
0.00 10.00 0.00
0.00 2.00 0.00
0.00 0.00 7.11 0.00 4.00 0.00
23.11
TOTAL (Upto 30-09-2014)
17.14
49.75 118.80 88.92
86.04 33.00 42.06
49.66 77.77 43.76 44.53 106.32 65.88
823.63
+4.51
(17)+2BJ
(15)+3SPM
(22) (24) (6) (15) (19)+SPM
(15 +SPM) (6+ 3Trans)
+6.0 +0.8 (12) 11.31
(33)+A
(31)+A
(24+3SBM)+A
(239+9SBM+
3 Trans+2BJ+
A)
Figures in the parenthesis indicate the number of berths. BJ - Barge Jetties, T - Transhippers, A - Anchorages, SBM - Single Buoy Mooring
@ Capacity of JNP container terminal (3 berths), NSICT (2 berths), GTIL (3 berths) and shallow water berth (1 no) has been taken as 16.88 MT, 15.00 MT, 26.40 MT and
1.20 MT respectively. Capacity of one shallow water berth at JNPT is 0.90 MT for dry bulk cargo.
#
At Mumbai, only BPS berth is considered as dedicated container berth. Assessed capacity of BPS(Dedicated) container berth is 1.0 MT
Berth No 6, 7/8 ID are used as holding berths for MBPT Crafts and no capacity has been accounted.

APEDA
Study on identification of export oriented integrated infrastructure for agri products from Karnataka & Tamil Nadu - APEDA (Agriculture Produce Export
Development Authority)
PwC 145
** Capacity of Chennai Port 1st Container Terminal (4 Berths) and IInd Container Terminal (3 Berths) has been taken as 24.00 MT and 18.00 MT respectively
Capacity of Iron Ore Berth has been taken as 6.0 MT at Ennore Port. After full fledged commissioning, balance capacity of 6.0 MT will be added
* After accounting the capacity due to productivity, addition of berth No 13 & 15, MHC, Floating cranes
Only BPS berth of Mumbai Port is considered as dedicated container berth. Assessed capacity of BPS(Dedicated) container berth of Mumbai Port is 1.0 MT. Berth No 6,7/8 ID are used as holding berths for MbPT crafts and no capacity has been accounted.
Provisional Total Capacities of all the ports in India as on 31.12.2014 :1423.100 Mn Tons
Source: Port Authority of India

APEDA
Study on identification of export oriented integrated infrastructure for agri products from Karnataka & Tamil Nadu - APEDA (Agriculture Produce Export
Development Authority)
PwC 146
Appendix 1 B.B.A - Details of export of agri commodities from Major seaports
Value in Rs Lacs
Qty in MT
Port: MUMBAI SEA
2011-12 2012-13 2013-14
Product Qty Value Qty Value Qty Value
Alcoholic Beverages
4690 2003.62 0 0 11154.75 5613.54
Miscellaneous Preparations
1.48 4.49 0 0 7.33 17.44
Jaggery & Confectionery
550 157.71 0 0 3.5 6.61
Fresh Onions 3891 313.12 575.34 55.12 0 0
Milled Products 10029 1634.34 5378.86 874.5 0 0
Non Basmati Rice 57822.94 12190.6 12055 2540.17 0 0
Other Cereals 0 0 9000 1403.6 0 0
Poultry Products 0 0 80 17.73 0 0
Total 76,984.42 16,303.88 27,089.20 4,891.12 11,165.58 5,637.59
Source: DGCIS Annual Export
APEDA
Study on identification of export oriented integrated infrastructure for agri products from Karnataka & Tamil Nadu - APEDA (Agriculture Produce Export
Development Authority)
PwC 147
Value in Rs Lacs
Qty in MT
Port: NHAVA SHEVA SEA
2011-12 2012-13 2013-14
Product Qty Value Qty Value Qty Value
Buffalo Meat 633458.89 867987.46 618734.1 932126.46 687270.25 1318989.23
Fresh Onions 776246.34 92993.63 959880.62 112381.19 790332.69 155337.08
Fresh Grapes 61893.85 45267.96 126929.6 111132.88 151160.95 151012.47
Pulses 141887.08 86939.85 176260.46 111935.57 284379.09 141747.6
Alcoholic Beverages
129338.03 83128.88 134640.02 90916.91 148044.35 113579.68
Non Basmati Rice 163919.06 36917.78 294670.11 73631.32 381520.02 107005.42
Maize 653408.95 89734.07 760334.2 120387.49 663048.27 99616.76
Other Processed Fruits & Vegetables
102742.46 62318.31 113311.05 75523.93 107874.3 87222.31
Dairy Products 4046.52 7452.25 19066.54 32286.48 33050.61 71481.63
Cereal Preparations
80388.91 48204.49 84561.82 59457.04 83616.96 66544.48
Miscellaneous Preparations
72898.76 36403.07 91762.03 44496.87 102890.15 55444.25
Cocoa Products 12005.25 11378.37 15183.84 22184.4 9525.68 42698.14
Jaggery & Confectionery
60472.94 28601.32 61157.42 30728.35 70608.62 41188.51
Other Fresh Vegetables
175928.42 33362.15 165836.5 36675.13 160432.95 40442.07
Other Fresh Fruits 80033.16 22224.41 80669.28 32695.59 63303.44 37333.41
Milled Products 66269.69 15747.05 80716.95 19561.19 121438.72 32514.25

APEDA
Study on identification of export oriented integrated infrastructure for agri products from Karnataka & Tamil Nadu - APEDA (Agriculture Produce Export
Development Authority)
PwC 148
Groundnuts 56571.91 34961.98 42543.32 30702.1 49138.73 31549.61
Fresh Mangoes 22840.25 11070.79 37533.29 16231.94 27732.6 17522.8
Other Cereals 36896.3 6392.5 82011.57 14630.3 84492.1 16429.33
Mango Pulp 25621.46 15793.34 17389 12291.52 24067.71 14908.19
Guargum 5977.97 10988.41 6140.09 22963.59 5483.05 12601.12
Sheep/Goat Meat 5053.39 10988.44 4201.25 9559.82 5776 12391.56
Dried & Preserved Vegetables
9122.45 8920.07 11299 10142.65 9380.71 11492.45
Poultry Products 39475.2 5855.63 14430.44 6538.08 6414.36 6831.41
Cucumber and Gherkins( Prepd. & Presvd)
16472.66 4927.33 16893.47 6040.93 16223.06 6545.51
Wheat 31038.36 4206.13 33808.21 5828.57 35788.68 6497.47
Fruits & Vegetables Seeds
3063.84 2954.52 2751.59 3279.3 3547.66 4595.66
Basmati Rice 34723.37 14775.3 8025.43 4376.38 5641.85 4391.24
Walnuts 1432.67 5610.64 1097.9 4329.81 868.81 4367.38
Casein 65.74 282.33 629.78 2563.88 355.27 2093.85
Animal Casings 347.12 642.69 362.58 533.17 156.12 1262.72
Floriculture 705.36 885.58 1053.91 1256.19 738.26 1012.19
Processed Meat 537.96 847.97 777.2 895.02 485.22 680.02
Natural Honey 69.41 130.18 183.92 239.47 136.88 232.04
Albumin( Eggs & Milk )
0.08 0.14 1.21 0.89 0.41 0.66
Other Meat 150.45 167.02 113.03 119 0 0
Total 35,05,104.26 17,09,062.04 40,64,960.73 20,58,643.41 41,34,924.53 27,17,562.50
Source: DGCIS Annual Export

APEDA
Study on identification of export oriented integrated infrastructure for agri products from Karnataka & Tamil Nadu - APEDA (Agriculture Produce Export
Development Authority)
PwC 149
Port: MARMAGOA SEA
2011-12 2012-13 2013-14
Product Qty Value Qty Value Qty Value
Wheat 0 0 31190 5422.13 43999.8 7235.28
Alcoholic Beverages 317.63 427.62 1397.71 2408.12 2521.2 5274.47
Jaggery & Confectionery 0 0 0 0 5472 1540.94
Miscellaneous Preparations 0 0 0 0 2926 752.44
Other Processed Fruits & Vegetables
1.32 2.51 1.32 2.78 2.4 10.99
Maize 960 144.49 27980 4148.93 0 0
Total 1,278.95 574.62 60,569.03 11,981.96 54,921.40 14,814.12
Source: DGCIS Annual Export
APEDA
Study on identification of export oriented integrated infrastructure for agri products from Karnataka & Tamil Nadu - APEDA (Agriculture Produce Export
Development Authority)
PwC 150
Value in Rs Lacs
Qty in MT
Port: NEWMANGALORE SEA
2011-12 2012-13 2013-14
Product Qty Value Qty Value Qty Value
Maize 83261 10719.7 160091 24161.77 84253 11908.49
Wheat 0 0 27000 4595.62 33000 5416.52
Jaggery & Confectionery 8.3 3.52 608.31 169.08 9393.15 2579.39
Cocoa Products 680.43 774.36 645.94 893.7 1197.75 1644.01
Cereal Preparations 219.61 266.21 225.21 334.86 1091.96 1230.48
Miscellaneous Preparations 5 2.62 0 0 3113.17 1077.52
Floriculture 1318.71 729.93 881.44 641.52 88 172.88
Other Processed Fruits & Vegetables
10.1 16.41 60.26 19.56 87.87 169.64
Non Basmati Rice 120.28 28.79 382.66 103.37 267.37 84.68
Cucumber and Gherkins( Prepd. & Presvd)
285.66 81.47 266.84 85.32 40.8 16.68
Alcoholic Beverages 23.01 23.05 127.69 54.05 20.81 7.22
Dairy Products 0 0 0 0 0.53 2.34
Other Fresh Fruits 63.1 88.19 0 0 0.18 0.38
Natural Honey 0 0 0 0 0.13 0.37
Mango Pulp 0 0 0 0 0.72 0.36
Milled Products 15 3.26 0 0 0 0

APEDA
Study on identification of export oriented integrated infrastructure for agri products from Karnataka & Tamil Nadu - APEDA (Agriculture Produce Export
Development Authority)
PwC 151
Total 86,010.20 12,737.51 1,90,289.35 31,058.85 1,32,555.44 24,310.96
Source: DGCIS Annual Export
Value in Rs Lacs
Qty in MT
Port: COCHIN SEA
2011-12 2012-13 2013-14
Product Qty Value Qty Value Qty Value
Miscellaneous Preparations
7018.07 5444.49 10248.98 8231.32 14127.59 16034.2
Non Basmati Rice 60231.64 11552.98 40438.75 11889.89 42982.89 16027.25
Other Processed Fruits & Vegetables
22550.74 13029.26 13147.06 12381.94 10463.34 14588.1
Cereal Preparations 9577.23 4602.2 11800.75 8458.29 13807.89 10008.21
Dairy Products 238.89 421.91 4602.1 7791.04 3538.51 8843.26
Buffalo Meat 2.67 77.84 2112.08 3071.3 2466 4087.05
Milled Products 15048.94 4046.54 12803.11 3827.73 7310.03 3390.12
Dried & Preserved Vegetables
1637.34 1860.91 1656.29 2348.93 1147.57 2387.61
Other Fresh Vegetables
3381.25 996.11 2809.88 1012.68 3049.42 1686.35

APEDA
Study on identification of export oriented integrated infrastructure for agri products from Karnataka & Tamil Nadu - APEDA (Agriculture Produce Export
Development Authority)
PwC 152
Fruits & Vegetables Seeds
214.66 2301.14 110.55 871.19 170.3 1039.91
Jaggery & Confectionery
3241.3 648.02 3216.81 884.12 1541.78 918.03
Poultry Products 2871.31 1274.44 3191.5 750.12 2596.32 611.12
Other Fresh Fruits 2371.07 844.4 2221.1 920.45 624.33 339.6
Cocoa Products 587.32 1042.32 196.6 307.37 40.52 181.85
Alcoholic Beverages 0.97 28.28 32.23 173.04 33.26 128.33
Floriculture 23.45 11.85 42.53 85.31 84.08 127.3
Mango Pulp 3745.24 1555.39 3078.58 1034.51 224.4 102.46
Other Cereals 736.02 131.46 365.11 80.3 218.84 92.87
Fresh Mangoes 124.53 112.45 112.91 134.95 31.94 45.45
Basmati Rice 69.7 24.31 44.15 20.97 30.9 24.08
Pulses 32.02 14.81 11.4 6.22 11.7 13.69
Groundnuts 276.38 109.81 20.64 19.33 18.2 12.36
Fresh Grapes 6.61 16.55 130.09 136.18 11.45 7.19
Wheat 41.56 9.99 47.6 11.42 32.38 6.66
Processed Meat 0.1 0.3 4.44 11.41 0.84 2.33
Casein 0.4 0.95 0.05 0.06 0.2 0.52

APEDA
Study on identification of export oriented integrated infrastructure for agri products from Karnataka & Tamil Nadu - APEDA (Agriculture Produce Export
Development Authority)
PwC 153
Natural Honey 24.09 33.55 0.08 0.12 0.17 0.21
Maize 0 0 5.72 1.63 0.96 0.14
Fresh Onions 86.76 22.39 50.92 12.89 0 0
Guargum 9.9 22.17 0 0 0 0
Sheep/Goat Meat 0 0 1.68 3.94 0 0
Total 1,34,150.16 50,236.82 1,12,503.69 64,478.65 1,04,565.81 80,706.25
Source: DGCIS Annual Export
Value in Rs Lacs
Qty in MT
Port: TUTICORIN SEA
2011-12 2012-13 2013-14
Product Qty Value Qty Value Qty Value
Poultry Products
545388.18 30017.6 486412.95 30059 389472.57 27948.3
Cucumber and Gherkins( Prepd. & Presvd)
53360.33 15009.17 46949.84 16701.75 39354.75 17365.65
Fresh Onions 21845.63 3779.64 19209.17 4567.56 89403.05 15957.67
Floriculture 9217.79 9655.98 7942.34 11317.22 4985.69 9750.72
Dairy Products
164.38 351.72 622.83 1922.23 3589.33 8477.71

APEDA
Study on identification of export oriented integrated infrastructure for agri products from Karnataka & Tamil Nadu - APEDA (Agriculture Produce Export
Development Authority)
PwC 154
Non Basmati Rice
29830.03 7843.21 32230.79 8916.57 24305.48 7670.39
Albumin( Eggs & Milk )
892.1 3413.78 1188.03 6512.27 1019.9 6502.29
Maize 318075.7 41578.55 188474.16 26660.06 43713.9 6415.43
Other Fresh Vegetables
31000.17 3289.09 13513.25 2078.47 28860.5 6009.55
Other Processed Fruits & Vegetables
6815.45 3347.96 3014.12 2253.47 3428.87 2560.28
Other Fresh Fruits
4992.22 2209.85 3768.94 2045.05 3880.18 2446.27
Milled Products
3940.68 808.77 15886.62 3732.3 9140.93 2250.4
Miscellaneous Preparations
1926.05 995.78 2461.21 1278.44 1721.12 1691.94
Cereal Preparations
2660.79 1498.64 2271.28 1494.61 1985.79 1515.22
Jaggery & Confectionery
16432.7 5187.75 19333.8 5558 2535.47 1010.61
Mango Pulp 12776.01 3890.35 11081.56 3748.62 1705.6 768.14
Other Cereals 4048.3 529.78 2765.78 582.57 1575.9 410.98
Basmati Rice 12.77 6.59 30.84 12.7 103.42 104.05
Groundnuts 3647.34 1640.72 1092.09 615.82 173.5 101.43
Pulses 1007.79 415.4 448.09 175.06 192.49 87.35
Fruits & Vegetables Seeds
12.95 21.32 66.31 318.53 21.41 63.65

APEDA
Study on identification of export oriented integrated infrastructure for agri products from Karnataka & Tamil Nadu - APEDA (Agriculture Produce Export
Development Authority)
PwC 155
Casein 0 0 1 1.86 10.23 19.53
Cocoa Products
0.28 0.19 4.81 9.22 14.23 15.53
Fresh Mangoes
2.6 4.59 45.11 13.48 8.63 6.82
Fresh Grapes 21.16 13.41 111.94 58.58 6.93 6.17
Guargum 5.1 1.42 0 0 3 4.92
Natural Honey
28.16 19.9 12.05 7.52 2.25 4.71
Dried & Preserved Vegetables
138.91 29.23 752.52 277.33 3.33 2.56
Alcoholic Beverages
1.1 1.16 1.61 0.81 10.64 1.88
Processed Meat
0 0 0 0 1.74 1.52
Wheat 2 0.5 0 0 0.1 0.03
Animal Casings
13.6 8.95 0 0 0 0
Other Meat 0 0 0.1 0.12 0 0
Sheep/Goat Meat
0 0 0.99 1.58 0 0
Total 10,68,260.27 1,35,571.00 8,59,694.13 1,30,920.80 6,51,230.93 1,19,171.70
Source: DGCIS Annual Export

APEDA
Study on identification of export oriented integrated infrastructure for agri products from Karnataka & Tamil Nadu - APEDA (Agriculture Produce Export
Development Authority)
PwC 156
Value in Rs Lacs
Qty in MT
Port: CHENNAI SEA
2011-12 2012-13 2013-14
Product Qty Value Qty Value Qty Value
Groundnuts 320456.55 207779.97 235410.82 175832.33 242133.82 150150.7
Non Basmati Rice 155671.82 45032.77 221132.96 57661.68 257502.64 74418.23
Mango Pulp 99193.16 36107.42 109340.31 39601.53 137009.48 54169.6
Other Processed Fruits & Vegetables
57654 27916.61 67773.17 35698.32 82940.88 52188.89
Wheat 16.47 2.64 251610.74 42328.48 233492.78 39355.44
Fresh Onions 110914.35 26278.28 100488.89 24938.98 88268.12 38716.49
Maize 739890.82 103248.27 493380.4 73487.17 225445.5 33869.58
Cucumber and Gherkins( Prepd. & Presvd)
75314.43 22080.74 69402.65 24466.42 53946.85 23732.23
Dairy Products 639.46 1401.61 10475.77 16903.9 11206.73 23294.57
Buffalo Meat 5063.89 6627.07 8652.67 12923.69 12655.1 22502.74
Cereal Preparations 19232.4 19515.69 15611.48 17313.72 15250.26 20135.11
Miscellaneous Preparations
7687.97 4811.09 10097.88 7359.9 17641.84 11179.38

APEDA
Study on identification of export oriented integrated infrastructure for agri products from Karnataka & Tamil Nadu - APEDA (Agriculture Produce Export
Development Authority)
PwC 157
Jaggery & Confectionery
13499.79 4336.65 14642.22 4640.42 21604.93 7847.3
Floriculture 5385.42 6163.79 4328.08 7260.24 4160.62 7766.52
Poultry Products 3514.53 2335.64 3875.17 3720.11 4123.31 6281.38
Other Fresh Fruits 10784.44 3605.16 9676.92 3556.29 13172.66 5361.2
Alcoholic Beverages 3161.56 5066.96 2676.86 6211.37 2877.63 3345.36
Other Fresh Vegetables 873.53 263.26 450.19 156.69 4413.82 1813.24
Albumin( Eggs & Milk ) 143.36 581.05 265.53 1267.32 296.92 1749.2
Milled Products 4402.83 1040.58 4500.03 1222.76 3585.59 1445.45
Other Cereals 1249.22 224.27 1144.48 337.88 4716.59 949.71
Pulses 724.49 379.11 605.11 367.87 1190.51 633.82
Basmati Rice 949.25 219.27 240.43 179.71 838.95 594.3
Fruits & Vegetables Seeds
295.52 327.52 289.07 370.71 581.96 395.81
Cocoa Products 683.22 610.17 321.38 545.33 114.99 271.4
Dried & Preserved Vegetables
118.22 57.05 2884.6 1548.01 51.21 72.22
Fresh Mangoes 135.98 46.8 151.5 53.32 118.56 70.08
Fresh Grapes 114.64 42.21 1.65 2.06 69.5 61.22
Natural Honey 10.54 16.81 10.76 16.5 14.25 22.17
Sheep/Goat Meat 0 0 0 0 7.2 8.8
Guargum 8.63 8.91 0.77 2.05 1.79 6.73
Casein 1.81 2.39 52.71 133.13 2.64 4.28
Walnuts 0.16 0.51 0.16 0.72 0.08 0.44

APEDA
Study on identification of export oriented integrated infrastructure for agri products from Karnataka & Tamil Nadu - APEDA (Agriculture Produce Export
Development Authority)
PwC 158
Animal Casings 0 0 0.13 0.17 0 0
Processed Meat 0.01 0.07 0.76 0.77 0 0
Total 16,37,792.47 5,26,130.34 16,39,496.25 5,60,109.55 14,39,437.71 5,82,413.59
Source: DGCIS Annual Export

APEDA
Study on identification of export oriented integrated infrastructure for agri products from Karnataka & Tamil Nadu - APEDA (Agriculture Produce Export
Development Authority)
PwC 159
Appendix 1 B.B.A - Details of export of agri commodities from Major airports
Value in Rs Lacs
Qty in MT
Port: CHENNAI AIR
2011-12 2012-13 2013-14
Product Qty Value Qty Value Qty Value
Other Fresh Vegetables 2962.39 1247.34 3518.81 1525.24 3714.61 2039.3
Floriculture 242.16 211.73 550.54 555.7 649.64 720.13
Dried & Preserved Vegetables 251.91 92.03 521.76 234.81 1284.97 501.13
Poultry Products 0 0 11225.9 614.81 2144.57 354.5
Fresh Mangoes 575.42 235.25 452.59 236.15 352.38 291.95
Miscellaneous Preparations 145.77 425.19 388.82 322.35 115.88 289.5
Cereal Preparations 46.64 63 117.75 198.71 88.22 198.02
Dairy Products 102.71 182.77 82.81 132.6 111.18 176.18
Fruits & Vegetables Seeds 44.3 538.33 7.35 154.58 13.92 172.99
Other Processed Fruits & Vegetables
179.31 111.36 186.11 403.98 100.83 106.58
Other Fresh Fruits 1255.7 198.39 490.23 133.05 92.87 97.57
Jaggery & Confectionery 62.54 42.04 24.38 57.42 21.49 43.51
Sheep/Goat Meat 60.66 115.12 2.88 2.4 6.28 19.06
Pulses 0 0 0 0 39.67 18.37
Fresh Onions 2.4 0.44 35.69 14.49 26.24 13.45
Fresh Grapes 0.55 0.09 0.34 0.22 7.41 11.67
Alcoholic Beverages 4.67 29.41 3.42 14.24 2.51 10.26
Cocoa Products 4.76 5.49 0.2 0.27 0.59 4.49

APEDA
Study on identification of export oriented integrated infrastructure for agri products from Karnataka & Tamil Nadu - APEDA (Agriculture Produce Export
Development Authority)
PwC 160
Milled Products 0.51 0.3 1.07 1.38 4.47 3.42
Mango Pulp 4.09 2.96 8.6 7.26 2.96 2.47
Basmati Rice 0.15 0.05 0 0 0.4 0.79
Walnuts 0 0 0 0 0.25 0.27
Wheat 0 0 0 0 0.95 0.26
Cucumber and Gherkins( Prepd. & Presvd)
98.63 33.56 0.06 0.02 0.23 0.17
Non Basmati Rice 0.49 0.13 0.27 0.1 0.38 0.16
Albumin( Eggs & Milk ) 1.71 10.54 9.45 29.92 0 0.07
Other Meat 0 0 0 0 0.05 0.05
Casein 0 0 0 0 0 0.02
Groundnuts 1.93 1 0 0 0.04 0.01
Maize 0 0 0.03 0 0 0
Natural Honey 0 0 0 0 0 0
Other Cereals 0 0 0.02 0.01 0 0
Processed Meat 29.13 75.21 1.07 1 0 0
Total 6,078.53 3,621.73 17,630.15 4,640.71 8,782.99 5,076.35
Source: DGCIS Annual Export

APEDA
Study on identification of export oriented integrated infrastructure for agri products from Karnataka & Tamil Nadu - APEDA (Agriculture Produce Export
Development Authority)
PwC 161
Value in Rs Lacs
Qty in MT
Port: BANGALORE AIRPORT
2011-12 2012-13 2013-14
Product Qty Value Qty Value Qty Value
Fruits & Vegetables Seeds 131.87 3206.67 82.78 4452.05 96.65 5356.68
Other Fresh Vegetables 3116.4 2101.37 2802.48 3197.79 4341.44 5135.44
Floriculture 869.81 2445.87 1017.81 3783.7 1298.29 4286.25
Miscellaneous Preparations 532.56 806.12 2034.99 1245.82 498.97 1587.35
Poultry Products 2.22 2.86 7833.34 669.48 2585.85 422.1
Other Fresh Fruits 264.02 112.5 327.31 218.23 440.9 420.29
Albumin( Eggs & Milk ) 0 0 0 0 10.11 61.34
Cucumber and Gherkins( Prepd. & Presvd)
3.78 6.01 1.23 0.81 135.42 57.62
Fresh Mangoes 17.04 11.39 13.86 13.8 29.85 34.99
Other Processed Fruits & Vegetables
14.21 11.37 37.62 26.26 27.43 30.67
Dried & Preserved Vegetables 13.15 15.8 141.11 205.86 6.34 25.19
Mango Pulp 10.02 6.68 2.96 0.4 19.96 11.39
Jaggery & Confectionery 3.9 5.02 1.9 4.44 2.09 9.29
Cereal Preparations 2.17 2.83 4.85 6.29 3.16 6.58
Fresh Onions 23.49 4.7 14.27 7.28 2.26 3.79
Alcoholic Beverages 0.92 1.97 2.26 4.73 3.35 3.53
Dairy Products 0.15 0.06 0 0 0.85 3.35
Natural Honey 3.43 7.14 4 2.58 0.25 0.95
Maize 0.12 0.06 0.51 0.81 0.42 0.91

APEDA
Study on identification of export oriented integrated infrastructure for agri products from Karnataka & Tamil Nadu - APEDA (Agriculture Produce Export
Development Authority)
PwC 162
Non Basmati Rice 0 0 0.03 0.01 0.35 0.5
Fresh Grapes 0.15 0.16 3.75 5.8 0.09 0.12
Cocoa Products 3.77 13.76 2.69 2.51 0.07 0.09
Pulses 3.5 3.94 0.04 0.02 0.04 0.05
Milled Products 2.65 0.33 1.13 0.14 0.26 0.04
Other Cereals 0 0 0.08 0.02 0.12 0.03
Basmati Rice 0 0 0 0 0.01 0.01
Groundnuts 5 2.64 10 3.93 0 0
Total 5,024.33 8,769.25 14,341.00 13,852.76 9,504.53 17,458.55
Source: DGCIS Annual Export
Value in Rs Lacs
Qty in MT
Port: MUMBAI AIR
2011-12 2012-13 2013-14
Product Qty Value Qty Value Qty Value
Other Fresh Vegetables 41360.6 16920.24 42211.57 20804.44 40405.9 22552.13
Sheep/Goat Meat 3782.21 10311.66 3779.04 11690.13 3204.07 11112.85
Floriculture 1446.83 4808.34 1109.97 4591.29 1202.76 7175.64
Fruits & Vegetables Seeds 187.85 3718.52 226.06 6143.42 269.91 6950.81

APEDA
Study on identification of export oriented integrated infrastructure for agri products from Karnataka & Tamil Nadu - APEDA (Agriculture Produce Export
Development Authority)
PwC 163
Fresh Mangoes 5545.62 3189 6633.37 5950.02 5435.25 6943.48
Other Fresh Fruits 14532.24 2657.82 15323.51 4016.67 8502.08 5335.18
Miscellaneous Preparations 809.66 1713.67 841.49 2785.03 524.04 3513.01
Poultry Products 15764.55 1697.79 13604.58 1034.62 13625 3455.41
Cocoa Products 359.91 328.77 68.54 262 124.35 663.76
Animal Casings 164.75 443.58 128.02 254.67 136.98 503.11
Jaggery & Confectionery 115.42 89.01 120.4 196.56 110.09 429.87
Fresh Grapes 208.05 204.76 326.43 325.2 204.06 260.64
Dried & Preserved Vegetables 11.69 15.53 509.18 437.28 76.51 223.85
Maize 75.5 61.83 2.01 3.09 96.08 220.01
Fresh Onions 1025.12 84.86 1208.16 115.13 496.45 209.7
Guargum 106.88 207.94 40.47 181.9 42.65 168.48
Other Processed Fruits & Vegetables 96.16 147.75 100.31 149.9 114.46 153.63
Albumin( Eggs & Milk ) 251.35 654.14 14.31 435.51 3.35 147.86
Cereal Preparations 197.54 260.31 118.48 158.27 70.43 125.26
Alcoholic Beverages 75.21 781.55 25.1 169.25 51.83 90.05
Casein 4.88 51.82 9.06 135.91 3.26 40.31

APEDA
Study on identification of export oriented integrated infrastructure for agri products from Karnataka & Tamil Nadu - APEDA (Agriculture Produce Export
Development Authority)
PwC 164
Dairy Products 64.09 115.59 42.78 88.51 7.3 28.85
Natural Honey 14.32 43.96 2.22 17.16 1.69 20.01
Mango Pulp 22.71 24.22 4.92 4.58 9.37 17.24
Groundnuts 0.22 0.09 0 0 5.49 12.5
Milled Products 31.72 6.41 20.02 5.6 8.25 2.61
Other Cereals 1.3 0.09 0.25 0.07 0.25 1.18
Non Basmati Rice 1.04 1.11 0.05 0.02 1.34 0.87
Cucumber and Gherkins( Prepd. & Presvd) 0.12 0.43 0.14 1.1 0.49 0.36
Basmati Rice 0 0 0.1 0.05 0.18 0.14
Buffalo Meat 1412.81 3323.9 34.29 164.34 0.05 0.05
Processed Meat 0 0 0.02 0.05 0 0.02
Other Meat 5 5.71 9.4 19.6 0 0
Pulses 2.18 3.57 2.66 1.27 0 0
Walnuts 0 0 0.03 0.09 0 0
Wheat 0.06 0.11 0 0 0 0
Total 87,677.59 51,874.08 86,516.94 60,142.73 74,733.92 70,358.87
Source: DGCIS Annual Export

APEDA
Study on identification of export oriented integrated infrastructure for agri products from Karnataka & Tamil Nadu - APEDA (Agriculture Produce Export
Development Authority)
PwC 165
Appendix 1 C - Questionnaire
For Exporter / Exporter Association
Questionnaire Excel Sheet
Name of respondent
designation
name of firm
Address
Phone Number
Mobile number
e-mail id
APEDA Products exported:
Name of Product
Quantity Exported (appox. - annual)
Value exported (appox. - annual)
Type of activity (manufacturing / trading)
Number of units / offices (in case of trading)
Total Processing Capacity (if applicable)
P1
P2
P3

APEDA
Study on identification of export oriented integrated infrastructure for agri products from Karnataka & Tamil Nadu - APEDA (Agriculture Produce Export
Development Authority)
PwC 166
P4
P5
RAW MATERIAL (RM) P1 P2 P3 P4 P5
Raw material (name)
RM Volume
RM Value
Quantity Stored
Storage days
Type of storage
Safety measures adopted
Packaging Details
Costs related to RM P1 P2 P3 P4 P5
Transportation cost
Storage cost
Packaging Cost
Any other process
Any other (s)
Services used for RM P1 P2 P3 P4 P5
Testing /Certification
Grading / Sorting
Procurement
Any other srevises

APEDA
Study on identification of export oriented integrated infrastructure for agri products from Karnataka & Tamil Nadu - APEDA (Agriculture Produce Export
Development Authority)
PwC 167
FINAL PRODUCT P1 P2 P3 P4 P5
Infra & services needed
Quantity Stored
Storage days
Type of storage
Safety measures adopted
Packaging Details
Testing /Certification
Marketing support
Transportation & Logistics
Transportation volume
Trasportation frequency
Trasporation cost per unit
Any other related heads
FINAL PRODUCT P1 P2 P3 P4 P5
Documentation
time taken per shipment
cost per shipment
no of documents
others 1
others 2

APEDA
Study on identification of export oriented integrated infrastructure for agri products from Karnataka & Tamil Nadu - APEDA (Agriculture Produce Export
Development Authority)
PwC 168
Infrastructure requirement post harvest
Infrastructure type RM1 RM2 RM3 RM4 RM5
Dry Storage Y/N Y/N Y/N Y/N Y/N
Cold Storage Y/N Y/N Y/N Y/N Y/N
Other storage Y/N Y/N Y/N Y/N Y/N
grading sorting facilities Y/N Y/N Y/N Y/N Y/N
transportation Y/N Y/N Y/N Y/N Y/N
Any other infra 1 Y/N Y/N Y/N Y/N Y/N
Any other infra 2 Y/N Y/N Y/N Y/N Y/N
Capacity Needed (shortage felt)) RM1 RM2 RM3 RM4 RM5
Dry Storage
Cold Storage
CA Storage
Other storage
grading sorting facilities
transportation
Any other infra 1
Any other infra 2
Capacity Needed (Location)

APEDA
Study on identification of export oriented integrated infrastructure for agri products from Karnataka & Tamil Nadu - APEDA (Agriculture Produce Export
Development Authority)
PwC 169
Dry Storage
Cold Storage
CA Storage Other storage (e.g. with ripening chembers
grading sorting facilities
transportation
Any other infra 1
Any other infra 2
Services Needed
testing facility
price information
farmer certification
product certification
GI registration
logistics
others 1
others 2
others 3
Services Needed (Location)
testing facility
price information

APEDA
Study on identification of export oriented integrated infrastructure for agri products from Karnataka & Tamil Nadu - APEDA (Agriculture Produce Export
Development Authority)
PwC 170
farmer certification
product certification
GI registration
logistics
others 1
others 2
others 3
Infrastructure requirement end product
Infrastructure type P1 P2 P3 P4 P5
Dry Storage Y/N Y/N Y/N Y/N Y/N
Cold Storage Y/N Y/N Y/N Y/N Y/N
CA Storage Y/N Y/N Y/N Y/N Y/N
sotrage at ports Y/N Y/N Y/N Y/N Y/N
container/facilties Y/N Y/N Y/N Y/N Y/N
Other facilties at port Y/N Y/N Y/N Y/N Y/N
Any other infra 1 Y/N Y/N Y/N Y/N Y/N
Any other infra 2 Y/N Y/N Y/N Y/N Y/N
Capacity Needed (total)
Dry Storage

APEDA
Study on identification of export oriented integrated infrastructure for agri products from Karnataka & Tamil Nadu - APEDA (Agriculture Produce Export
Development Authority)
PwC 171
Cold Storage
CA Storage
sotrage at ports (sea/air)
container/facilties
Other facilties at port
Any other infra 1
Any other infra 2
Capacity Needed (Location) P1 P2 P3 P4 P5
Dry Storage
Cold Storage
CA Storage
sotrage at ports
container/facilties
Other facilties at port
Any other infra 1
Any other infra 2
Services Needed P1 P2 P3 P4 P5
testing facility
price information
producer certification

APEDA
Study on identification of export oriented integrated infrastructure for agri products from Karnataka & Tamil Nadu - APEDA (Agriculture Produce Export
Development Authority)
PwC 172
product certification
GI registration
logistics
HACCP / safety certification
others 1
others 2
Services Needed (Location)
testing facility
price information
producer certification
product certification
GI registration
logistics
HACCP / safety certification
others 1
others 2
At Raw material procurement stage
problem 1
problem 2

APEDA
Study on identification of export oriented integrated infrastructure for agri products from Karnataka & Tamil Nadu - APEDA (Agriculture Produce Export
Development Authority)
PwC 173
problem 3
problem 4
problem 5
problem 1 Solution
problem 2 Solution
problem 3 Solution
problem 4 Solution
problem 5 Solution
At final product stage
problem 1
problem 2
problem 3
problem 4
problem 5
problem 1 Solution
problem 2 Solution
problem 3 Solution
problem 4 Solution
problem 5 Solution

APEDA
Study on identification of export oriented integrated infrastructure for agri products from Karnataka & Tamil Nadu - APEDA (Agriculture Produce Export
Development Authority)
PwC 174
Appendix 1 D - Respondents
Appendix 1 D.D - Exporters
Exporters Name Company Mobile No. Email Id
R. Muthu R.M. NETRA EXIM 9500617343, 9444393335 [email protected]
S.V.N. EXPORTS 9500617343, 9444393335 [email protected]
V.S. Vishnu Prasad, M.Sc. The United Export Agents
91 9952829390, +91 422 4388247 [email protected]
N. Ambika Vishwaroopa Enterprises 9790755586, 9884121886
[email protected], [email protected]
K. Gnanasekar Maha Agricultural Products Pvt Ltd 91 9940178481 [email protected]
K. Ravindran Jayanthi Exports 91- 9003111432, 9443163560 [email protected], [email protected]
S. Srimathi A.A. Exports 9841275710 [email protected]
K. Namasivayam Vast Exporters 91 9789959552, 8608906987 [email protected], [email protected]
P.Srinivasan Natural Products Export Corpn. Ltd. 91 98417 24444 [email protected]
V.R.Naik MYCAAN ( Mysore Fruit Products Pvt Ltd) Mob. +91 9448065724 www.mysorefruits.com
Tel No. +91 8023491972, 23492457
Dr. Prassanna D Way 2 Agribusiness India Pvt. Ltd Mob.+919449004956 [email protected]

APEDA
Study on identification of export oriented integrated infrastructure for agri products from Karnataka & Tamil Nadu - APEDA (Agriculture Produce Export
Development Authority)
PwC 175
V.Jhansi Laxmi South India Floriculture Association Mob: +91-9448276041 [email protected]
Tel No.: 080 32710707 [email protected]
Dr Jayaprakash Rao South India Floriculture Association Mob: 9341241389 [email protected]
Tel No: +91-80-23336565 [email protected]
M.R. Reddy Virdis Vatika Fresh Pvt. Ltd Mob: +91 9986278105 [email protected]
Vijay Reddy Y Cook India Pvt Ltd Mob: +91 9543095430 [email protected]
Tel No:080 40903663 V.H.PRASAD Blooms & Greens Mob: +91 9035177188 [email protected]
Tel no.08032710707
Appendix 1 D.D - Other respondents
1. Shriram Institute for Industrial Research, 14-15 Sadarmangla Industrial Area, Whitefield Road,Bangalore 560 048, Tel: 080-28410172, 28410165/166/167, Fax :28410189, [email protected]; [email protected]; [email protected];
2. TUV Sud South Asia Pvt. Ltd., No. 151, 2nd C Main, 2nd stage, Peenya Industrial Estate, Bangalore 560058, Tel: 080-67458000 Fax: 080-67458058,
[email protected]; [email protected]; [email protected];
3. S.P. Shastri, Chief Manager, Container Corporation of India Ltd. Inland Container Depot, Whitefield Road, Bangalore-560066,
[email protected], 080-28451329
4. N. Sreekumar, Chief General Manager, Container Corporation of India Ltd., 8th Floor, CAO/CN Office, Southern Railway, EVR Periyar Salai, Egmore, Chennai-600008, [email protected]
5. Bureau Veritas Consumer Products Services, India Private Limited (BVCPS), F-2 Phase-III Thiruvika Industrial Estate, Chennai 600 032, Tel: 044-
4967 4000 Fax: 22491651, [email protected];

APEDA
Study on identification of export oriented integrated infrastructure for agri products from Karnataka & Tamil Nadu - APEDA (Agriculture Produce Export
Development Authority)
PwC 176
6. SGS India Pvt. Ltd., Opposite to State Bank of India, 28 B/1 (SP), 28 B/2 (SP) 2nd Main Road Ambattur Industrial Estate, Chennai 600 058, Tel: 044-66693109 Fax: 24963075, [email protected]; [email protected];
7. T A Labs Private Limited, No. 17 NewStreet Kottur, Chennai 600 085, Tel: 044-24474505, 64551505,
[email protected];[email protected]; [email protected]
8. SMS Labs Services Private Limited, 39/6 Thiruvallur High Road Puduchatrm, Post Thirumazhisai Via Poonamalee TK, Chennai 600 124, Tel: 044-
26811997, 26811993, Cell: 09444418694, [email protected]; [email protected];
9. Mr. Sathyamurthy Krishna Giri – Mango Cluster Representative (Krishnagiri) – 09443262912
10. Mr. B. A. C. Gowda – representative from Gherkin growers association
11. Mr. Avinash, Aerosea Logistics Limited, Mb.: +91 99801 55852, Email: [email protected]
12. Mr. Rajiv Sathe, Domain Consultant – Shipping & logistics’ || Trainer – Ocean & air freight management and international logistics’ management, Mb.:
+91 98230 15374, Email: [email protected]
13. Mr. Mayur Agarwal, Agri - entrepreneur and exporter, Mb.: +91 97537 04444
APEDA
Study on identification of export oriented integrated infrastructure for agri products from Karnataka & Tamil Nadu - APEDA (Agriculture Produce Export
Development Authority)
PwC 177
Appendix 1 E - Renewable Energy
Appendix 1 E.E - Introduction
A greenhouse' (also called a glasshouse or hothouse) is a building or complex in which plants are grown. These structures range in size from small sheds to
industrial-sized buildings. A miniature greenhouse is known as a cold frame.
Commercial glass greenhouses are often high tech production facilities for vegetables or flowers. The glass greenhouses are filled with equipment like screening
installations, heating, cooling, lighting and also may be automatically controlled by a computer to maximize potential growth. A greenhouse is a structural building
with different types of covering materials, such as a glass or plastic roof and frequently glass or plastic walls; it heats up because incoming visible sunshine is
absorbed inside the structure. Air warmed by the heat from warmed interior surfaces is retained in the building by the roof and wall; the air that is warmed near
the ground is prevented from rising indefinitely and flowing away. This is the same mechanism as the "greenhouse effect". Green house production requires the
use of large amount of energy, water and agro-chemicals and it usually generates huge quantities of waste to be disposed of.
The management of the greenhouse environment is strongly reliant on temperature manipulation. Temperature manipulation is critical to influencing plant
growth and morphology and so is the major strategy in the environmental modification of the crops. Major points for energy consumption of the green hose
environment include- Greenhouse Ventilation and Greenhouse Heating.
Appendix 1 E.E - Greenhouse Ventilation
Ventilation is one of the most important components in a successful greenhouse. If there is no proper ventilation, greenhouses and their growing plants can
become prone to problems. The main purposes of ventilation are to regulate the temperature and humidity to the optimal level, and to ensure movement of air
and thus prevent build-up of plant pathogens that prefer still air conditions. Ventilation also ensures a supply of fresh air for photosynthesis and plant respiration,
and may enable important pollinators to access the greenhouse crop.
APEDA
Study on identification of export oriented integrated infrastructure for agri products from Karnataka & Tamil Nadu - APEDA (Agriculture Produce Export
Development Authority)
PwC 178
Ventilation can be achieved via use of vents and recirculation fans. Ventilation is either forced or natural. The forced ventilation uses electricity which is used to
feed greenhouse cooling such as fans, fog and pad evaporative system
Appendix 1 E.E - Greenhouse heating
Heating or electricity is one of the most considerable costs in the operation of greenhouses across the globe, especially in colder climates. The main problem with
heating a greenhouse as opposed to a building that has solid opaque walls is the amount of heat lost through the greenhouse covering. Since the coverings need
to allow light to filter into the structure, they conversely cannot insulate very well.
During the winter season, electrical energy is being applied for the heating systems based on the ground source heat pumps and pond water heat pumps.
Appendix 1 E.E.C - Scoping solar PV/gasifier systems
The existing greenhouse system has 20Hp of electrical load. Electricity is being used to feed greenhouse equipment’s particularly employed for ventilation, heating
and lighting systems. Electricity is essentially being generated from DG sets or is being sourced from the grid to meet the load requirement. In order to reduce
the reliance on the grid and DG power, it is imperative to look for renewable power solutions. Solar PV systems, either stand alone or grid interactive, of appropriate
size can be used to meet the load requirements during the day time by replacing the grid and DG power. A typical illustration on expected returns on investment
on employing solar PV system of 75Kw (without batteries) for meeting the in-house load requirement through replacing the usage of grid power and DG power
has been presented below. The assumptions for the calculation are presented in exhibit 1.

APEDA
Study on identification of export oriented integrated infrastructure for agri products from Karnataka & Tamil Nadu - APEDA (Agriculture Produce Export
Development Authority)
PwC 179
Additionally, electricity storage by means of batteries in the stand alone system could be employed to ensure power continuous power. However, in case, if batteries
are being employed, the required capacity of the solar PV plant increases and it also entails high investment and maintenance cost.
It is also pertinent to mention that since the identified greenhouse agricultural production site is amid the agricultural area, planning and implementing the
biomass gasifier based off-grid power installation could be also contemplated. Biomass gasifier based power unit would ensure continuous power supply to meet
the load requirements. . A typical illustration on expected returns on investment on employing biomass gasifier system of 250Kw for meeting the in-house
load requirement through replacing the usage of grid power and DG power has been presented below The assumptions for the calculation is presented in Exhibit
2.

APEDA
Study on identification of export oriented integrated infrastructure for agri products from Karnataka & Tamil Nadu - APEDA (Agriculture Produce Export
Development Authority)
PwC 180
In light of the aforementioned, it would be prudent to adopt renewable measures to meet the energy requirements of the load for the identified plant. In order to
meet this objective, it is envisaged that following activities can be conducted.
Appendix 1 E.E.C - Scope of Services:
With regards to meeting the load requirements by replacing the usage of grid and DG power with solar PV unit, following activities would be endeavored:
Conducting site assessment and load profiling of the unit.
Conducting solar resource assessment

APEDA
Study on identification of export oriented integrated infrastructure for agri products from Karnataka & Tamil Nadu - APEDA (Agriculture Produce Export
Development Authority)
PwC 181
Estimating size of plant and yield estimation
Preparation of Project Feasibility Reports.
With regards to meeting the load requirements by replacing the usage of grid and DG power with biomass gasifier unit, following activities would be endeavored:
Conducting site assessment, load profiling of the unit and Estimating size of plant
Conducting biomass resource assessment and subsequently its power potential
Preparation of Project Feasibility Reports

APEDA
Study on identification of export oriented integrated infrastructure for agri products from Karnataka & Tamil Nadu - APEDA (Agriculture Produce Export
Development Authority)
PwC 182
Exhibit 1
Solar Power Plant related assumptions Actual
S. No. Assumption Head
Sub-Head Unit Solar PV
1 Power Generation
Installed Power Generation Capacity MW 0.075
Annual Deration Factor % 0.25%
Capacity Utilisation Factor % 17.2%
2 Time period Life of the project Years 25
Construction period Months 12
3 Project Cost Power Plant Cost Rs Lakhs 83.80
MNRE subsidy Rs Lakhs 25.14
Plant overall cost Rs Lakhs 58.66
4 Financial Assumptions
Debt % 70.00%
Equity % 30.00%
Upfront equity % 25.00%
Interest Rate % 12.30%
Return on equity for first 10 years % p.a 16.00%
Return on Equity after 10 years % p.a 16.00%

APEDA
Study on identification of export oriented integrated infrastructure for agri products from Karnataka & Tamil Nadu - APEDA (Agriculture Produce Export
Development Authority)
PwC 183
5 Tax and depreciation
Income Tax % 32.45%
MAT Rate % 20.01%
Depreciation Rate - First 12 years % 5.83%
Depreciation Rate - Remaining Years % 1.54%
Years for 5.28% rate Years 12
Salvage value % 10.0%
Depreciation as per Income tax Act 15.0%
Accelerated depreciation rate 80%
Salvage value as per IT Act 5%
6 Working Capital O&M Charges Months 1
Receivables for Debtors Months 2
Maintenance Spare % of O&M expenses 15%
Interest On Working Capital % 12.8%
7 Operation & Maintenance
O&M charges for FY 2011-12 Rs Lakhs 0.825
Total O & M Expenses Escalation % 5.72%
8 Tariff from Grid and DG Set
Tariff from Grid Rs./ kWh 7
Tariff from DG set Rs./ kWh 15.71
Cost of Diesel Rs./Litre 55

APEDA
Study on identification of export oriented integrated infrastructure for agri products from Karnataka & Tamil Nadu - APEDA (Agriculture Produce Export
Development Authority)
PwC 184
Usage of Grid power % 50%
Usage of DG set power % 50%
Escalation of grid tariff % 3%
Escalation of DG set tariff % 5%
Exhibit 2
Biomass gasifier Power Plant related assumptions Actual
S. No. Assumption Head Sub-Head Unit Biomass Gasifier
1 Power Generation Installed Power Generation Capacity MW 0.25
Auxiliary Consumption % 10%
PLF % 75%
2 Time period Life of the project Years 20
3 Project Cost Power Plant Cost (including IDC) Rs Lakhs 211.28
MNRE subsidy Rs Lakhs 25
Plant overall cost Rs Lakhs 186.28
4 Financial Assumptions
Debt % 70.00%
Equity % 30.00%
Upfront equity % 25.00%

APEDA
Study on identification of export oriented integrated infrastructure for agri products from Karnataka & Tamil Nadu - APEDA (Agriculture Produce Export
Development Authority)
PwC 185
Interest Rate % 12.30%
5 Tax and depreciation Income Tax % 32.45%
MAT Rate % 20.01%
Depreciation Rate - First 12 years % 5.83%
Depreciation Rate - Remaining Years % 2.51%
Salvage value % 10.0%
Depreciation as per Income tax Act 15.0%
Salvage value as per IT Act 5%
6 Working Capital O&M Charges Months 1
Receivables for Debtors Months 2
Maintenance Spare % of O&M expenses 15%
Interest On Working Capital % 12.8%
7 Operation & Maintenance
O&M charges for FY 2013-14 Rs Lakhs 10
Total O & M Expenses Escalation % 5.72%
8 Tariff from Grid and DG Set
Tariff from Grid Rs./ kWh 5.5
Tariff from DG set Rs./ kWh 15.71
Cost of Diesel Rs./Litre 55
Usage of Grid power % 58%
APEDA
Study on identification of export oriented integrated infrastructure for agri products from Karnataka & Tamil Nadu - APEDA (Agriculture Produce Export
Development Authority)
PwC 186
Usage of DG set power % 42%
Escalation of grid tariff % 3%
Escalation of DG set tariff % 5%

APEDA
Study on identification of export oriented integrated infrastructure for agri products from Karnataka
& Tamil Nadu - APEDA (Agriculture Produce Export Development Authority)
PwC 187
Disclaimer
This report has been prepared for and only for APEDA, India in accordance with the agreed terms and conditions as per the contract and for no other purpose. We do not accept or assume any liability or duty of care for any other purpose or to any other person to whom this report is shown or into whose hands it may come save where expressly agreed by our prior consent in writing.
The opinions contained in this report are based on the facts, assumptions, and representations stated herein. Our assessment and opinions are based on the fact and circumstances provided/ collected during our meetings with related officials and research from sources in public domain held to be reliable. If any of these facts, assumptions or representations are not entirely complete or accurate, the conclusions drawn therein could undergo material change and the incompleteness of inaccuracy could cause us to change our opinions. The assertions and conclusions are based on the information available at the time of writing this report.
The procedures we carried out in performing the work that forms the basis of this report were not as to constitute an audit. As such, the content of this report should not be considered as providing the same level of assurance as an audit. PwC disclaims all liability to any third party who may place reliance on this report and therefore does not assume responsibility for any loss or damage suffered by any such third party in reliance thereon.
This report is provided on the basis that it is for the use of APEDA, India only and that it (and any
extract of it) will not be copied or disclosed to any third party or otherwise quoted or referred to, in
whole or in part, without PwC prior written consent. Furthermore, PwC will not be bound to discuss,
explain, or reply to queries raised by any agency, other than the intended recipient of this report.
© 2016 PricewaterhouseCoopers Private Ltd. All rights reserved. “PwC”, a registered trademark, refers to
PricewaterhouseCoopers Private Limited (a limited company in India) or, as the context requires, other member
firms of PwC International Limited, each of which is a separate and independent legal entity.