Embed Size (px)
Citation preview
SUSTAINABLE FOREST
MANAGEMENT PLAN 4
for Tree Farm Licence 48
held by Canadian Forest Products Ltd.
(Plan Effective October 15, 2006)
Approved July 2007 by the
Provincial Chief Forester
British Columbia Ministry of Forests and Range
3rd Floor, 1520 Blanshard Street Victoria, BC V8W 3C8
by
Canadian Forest Products Ltd. Chetwynd Division
Chetwynd, BC V0C 1J0
December 23, 2011
Version 2.5
Sustainable Forest Management Plan 4 - TFL 48
December 23, 2011 i
ACKNOWLEDGEMENTS
Several authors, researchers and reviewers contributed in developing key components of this plan. Accordingly, Canfor-Chetwynd gratefully acknowledges these individuals for their diligence and effort in assisting with the preparation of this document:
BEALE, Jeff BEAULAC, Ben BERLINGER, Liz
BRANDT, Loren BUNNEL, Fred BURBEE, Jeremy
CAMPBELL, Wayne CODERRE, Marc COFFEY, Erin
DEAL, John EASON, Jamie ERICKSON, Jon
HILLTON, Crystal JOHNSTON, Colin JUKES, Warren
MCCORMACK, Jim
NEUMEIER, Wes
PHIPPS, Bob
MILLER, Mike
NEWBERY, Alison
SAUGSTAD, Evan
NELSON, Marie
NORRIS, Carol
SCHUETZ, Rob
SROCHENSKI, Jeremy VAN TASSEL, Mark WALLIN, Gail
WELLS, Ralph WOODING, Paul
Cover Photo: Photo by Jon Erickson from Thunder Mountain looking west towards TFL 48 Block 5 in the background

Sustainable Forest Management Plan 4 - TFL 48
December 23, 2011 iii
TABLE OF CONTENTS
1 INTRODUCTION .................................................................................................................................. 1
1.1 Purpose ...................................................................................................................................... 1
1.2 Description of the Licence/Defined Forest Area ......................................................................... 1
1.2.1 Description of the TFL .........................................................................................................1
1.2.2 History .................................................................................................................................3
1.2.3 Licence Holder and Administration ......................................................................................3
1.3 Progress on Commitments ......................................................................................................... 4
1.3.1 Pre-1982 Backlog NSR .......................................................................................................4
1.3.2 Rationale Statement Requests from the Deputy Chief Forester ...........................................4
1.3.3 Management Plan 3 Approval Letter Requests from the Deputy Chief Forester ..................5
2 SUSTAINABLE FOREST MANAGEMENT ........................................................................................ 7
2.1 Management Principles .............................................................................................................. 7
2.1.1 Canfor Mission Statement ...................................................................................................8
2.1.2 Canfor Environment Policy ..................................................................................................9
2.1.3 Canfor’s Forestry Principles ...............................................................................................10
2.2 Forest Management Systems Certification............................................................................... 11
2.2.1 ISO Environmental Management System ..........................................................................11
2.2.2 CSA Sustainable Forestry System.....................................................................................11
2.3 Roles and Responsibilities ....................................................................................................... 11
2.3.1 BC Timber Sales ...............................................................................................................11
2.3.2 Other Forest Tenure Holders .............................................................................................11
2.3.3 Other Industrial Users (Oil and Gas, Mining, etc) ...............................................................12
2.3.4 Chetwynd Public Advisory Committee ...............................................................................12
2.4 Existing Strategic Plans ............................................................................................................ 12
2.4.1 Dawson Creek Land and Resource Management Plan .....................................................12
2.4.2 Dunlevy Creek Management Plan .....................................................................................13
2.5 Sustaining Biological Richness ................................................................................................. 13
2.6 Natural Disturbance Unit Planning ........................................................................................... 16
2.7 Resource Inventories ............................................................................................................... 17
2.8 Managed Stand Monitoring ...................................................................................................... 19
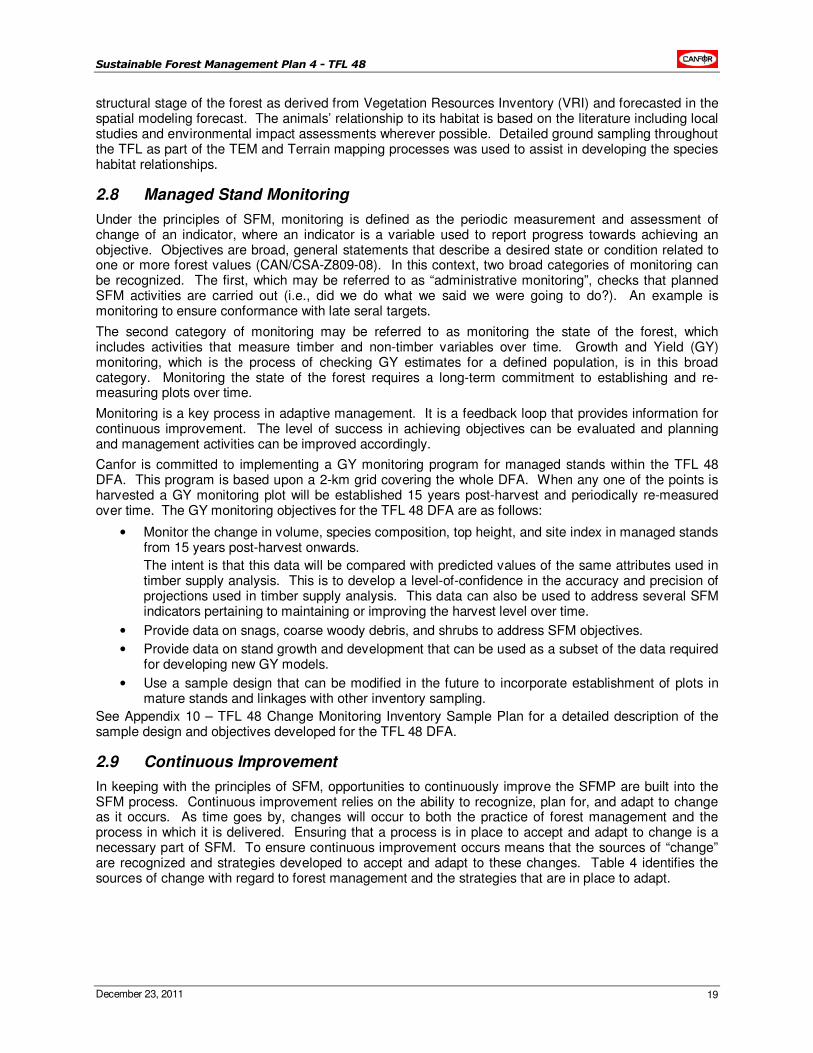
2.9 Continuous Improvement ......................................................................................................... 19
3 SFM OBJECTIVES, INDICATORS AND TARGETS ........................................................................ 21
3.1 Ecosystem Representation ...................................................................................................... 23
3.2 Forest Types ............................................................................................................................ 27
3.3 Late Seral Forest ...................................................................................................................... 30
3.4 Patch Size Distribution ............................................................................................................. 39
3.5 Snags/Live Tree Retention ....................................................................................................... 43
3.6 Wildlife Tree Patches................................................................................................................ 48
3.7 Average Minimum Width of RRZ and RMZ .............................................................................. 50
3.8 Shrubs/Early Forest .................................................................................................................. 52
3.9 Wildlife Habitat Areas, Ungulate Winter Ranges and Dunlevy Creek Management Plan ........ 54
3.10 Habitat Supply for Species of Public Concern .......................................................................... 57
3.11 Species of Management Concern ............................................................................................ 62
Sustainable Forest Management Plan 4 - TFL 48
December 23, 2011 iv
3.12 Coniferous Seeds ..................................................................................................................... 64
3.13 Deciduous Seeds and Vegetative Material............................................................................... 66
3.14 Class A Parks, Ecological Reserves and LRMP Designated Protected Areas ....................... 67
3.15 Known Values and Uses Addressed in Operational Planning .................................................. 70
3.16 Conformance to Elements Pertinent to Treaty Rights .............................................................. 72
3.17 Free Growing Stands ............................................................................................................... 74
3.18 Regeneration Declaration ......................................................................................................... 76
3.19 Area of Forested Land Lost to Non-Forest Industry ................................................................. 78
3.20 Permanent Access Corridors ................................................................................................... 79
3.21 Harvest Levels/Volumes ........................................................................................................... 82
3.22 Allowable Annual Cut ............................................................................................................... 83
3.23 Soil Degradation ....................................................................................................................... 87
3.24 Soil Disturbance Surveys ......................................................................................................... 88
3.25 Use of Environmentally Friendly Lubricants ............................................................................. 89
3.26 Site Index ................................................................................................................................. 90
3.27 Coarse Woody Debris .............................................................................................................. 93
3.28 Stream Crossing Quality Index ................................................................................................. 95
3.29 Action Plans for High Water Quality Concern Rating (WQCR) .............................................. 100
3.30 Peak Flow Index ..................................................................................................................... 101
3.31 Watershed Reviews ............................................................................................................... 106
3.32 Spills Entering Water Bodies .................................................................................................. 107
3.33 Carbon Sequestration ............................................................................................................ 108
3.34 Ecosystem Carbon Storage (Mg) in the DFA ......................................................................... 111
3.35 Range Opportunities .............................................................................................................. 113
3.36 Harvest Method ...................................................................................................................... 115
3.37 Proportion of Harvesting Consistent with Visual Quality Objective ......................................... 117
3.38 Back Country Condition .......................................................................................................... 118
3.39 Recreational Sites .................................................................................................................. 122
3.40 Consistency with Third Party Action Plans ............................................................................. 123
3.41 Waste ..................................................................................................................................... 124
3.42 Forest Health .......................................................................................................................... 125
3.43 Proportion of Completed Forest Health Action Plans ............................................................. 134
3.44 Community Donations ............................................................................................................ 135
3.45 Local Employment .................................................................................................................. 137
3.46 Summer and Fall Deliveries ................................................................................................... 138
3.47 Level of Investment in Training and Skills Development ........................................................ 140
3.48 Level of Direct and Indirect Employment ................................................................................ 141
3.49 Level of Aboriginal Participation in the Forest Economy......................................................... 142
3.50 First Nations Awareness Training ........................................................................................... 143
3.51 Consultation and Information Sharing with First Nations on Management Plans ................... 144
3.52 Diversifying the Local Economy ............................................................................................. 146
3.53 Safety Over the DFA .............................................................................................................. 147
3.54 Public Advisory Committee Satisfaction ................................................................................. 148
3.55 Public Advisory Committee .................................................................................................... 149
3.56 Public Advisory Committee Terms of Reference .................................................................... 151
3.57 Educational Opportunities ...................................................................................................... 152
3.58 Response to Public Inquires ................................................................................................... 153
3.59 Distribution/Access to SFM Plan, Annual Reports and Audit Results .................................... 155
Sustainable Forest Management Plan 4 - TFL 48
December 23, 2011 v
4 REGULATORY MANAGEMENT OBJECTIVES ............................................................................ 156
4.1 Management and Utilization of Timber Resources................................................................. 156
4.2 Protection and Conservation of Non-timber Values and Resources ...................................... 157
4.3 Integration of Harvesting Activities with Non-timber Uses ...................................................... 158
4.4 Forest Fire .............................................................................................................................. 159
4.5 Forest Health .......................................................................................................................... 159
4.6 Silviculture .............................................................................................................................. 160
4.6.1 Pre-82 Backlog ................................................................................................................ 160
4.7 Roads ..................................................................................................................................... 161
5 SUMMARY OF CHANGES AND IMPACTS ................................................................................... 162
5.1 Comparison between MP 3 and SFMP 4 ............................................................................... 162
5.1.1 Land Base ....................................................................................................................... 162
5.1.2 Inventories ....................................................................................................................... 162
5.1.3 Planning .......................................................................................................................... 163
5.1.4 Mountain Pine Beetle ...................................................................................................... 163
5.2 Impact Summary of Implementing MP 3 ................................................................................ 163
5.2.1 Harvest Levels ................................................................................................................. 163
5.2.2 Economic Opportunities................................................................................................... 163
5.2.3 Employee and Contractor Opportunities .......................................................................... 163
5.2.4 Non-timber Values ........................................................................................................... 163
5.3 Impact and Summary of Implementing SFMP 4..................................................................... 164
5.3.1 Harvest Levels ................................................................................................................. 164
5.3.2 Economic Opportunities................................................................................................... 164
5.3.3 Employee and Contractor Opportunities .......................................................................... 164
5.3.4 Non-timber Values ........................................................................................................... 164
6 PUBLIC REVIEW OF SFMP 4 ......................................................................................................... 165
6.1 Chetwynd Public Advisory Committee ................................................................................... 165
6.2 Summary of Public Review Opportunities .............................................................................. 166
6.3 Summary of Comments Received from Review of SFMP 4 .................................................. 166
6.4 First Nations ........................................................................................................................... 166
7 REFERENCES ................................................................................................................................. 167
8 ABBREVIATIONS AND DEFINITIONS ........................................................................................... 169
9 APPENDICES .................................................................................................................................. 171
Sustainable Forest Management Plan 4 - TFL 48
December 23, 2011 vi
LIST OF FIGURES
Figure 1: Tree Farm Licence 48 Defined Forest Area ............................................................................. 2
Figure 2: Canfor’s Mission ..................................................................................................................... 8
Figure 3: Canfor’s Environment Policy ................................................................................................... 9
Figure 4: Canfor’s Forestry Principles .................................................................................................. 10
Figure 5: Natural Disturbance Units ..................................................................................................... 16
Figure 6: Ecosystem Representation by THLB vs. Non-THLB .............................................................. 25
Figure 7: Change in Status of Late Seral Forest Over Time .................................................................. 37
Figure 8: Mature Interior Forest Patches .............................................................................................. 42
Figure 9: Distribution of Ecological Groups by THLB and Where Snags are Prescribed ........................ 45
Figure 10: Ecological Groups Distribution between THLB and Non-THLB ............................................. 46
Figure 11: Dunlevy Creek Management Plan Subzones and UWR's ..................................................... 55
Figure 12: Moose Habitat Supply .......................................................................................................... 58
Figure 13: Elk Habitat Supply ................................................................................................................ 59
Figure 14: Caribou Habitat Supply ........................................................................................................ 59
Figure 15: Marten Habitat Supply .......................................................................................................... 60
Figure 16: Fisher Habitat Supply ........................................................................................................... 60
Figure 17: Grizzly Bear Habitat Supply.................................................................................................. 60
Figure 18: Wolverine Habitat Supply ..................................................................................................... 61
Figure 19: Free Growing Status by Year of Harvest Start ...................................................................... 75
Figure 20: Distribution of Pine Volume in Stands Greater than 80 Years Old within THLB ..................... 85
Figure 21: TFL 48 Alternative Coniferous Harvest Levels ...................................................................... 86
Figure 22: Range of CWD Accumulations (volume/ha) Over Age .......................................................... 94
Figure 23: Peak Flow Index – Example Calculation ............................................................................. 102
Figure 24: PFI Watersheds Within TFL 48........................................................................................... 104
Figure 25: An Example of Average C Sequestration Rates for a Natural Spruce Leading BWBS Mesic Site Stand (Forecast AU 5) and an Associated Managed Stand (Forecast AU M3).............. 109
Figure 26: Carbon Sequestration (Mg C/year) within TFL 48 Over Time .............................................. 109
Figure 27: An Example of C Storage for a Natural Spruce Leading BWBS Mesic Site Stand (Forecast AU 5) and an Associated Managed Stand (Forecast AU M3) .................................................... 112
Figure 28: Total Ecosystem Carbon (Mg) Storage in the DFA Over Time ............................................ 112
Figure 29: Proportion of Conventional Harvest Systems Used 2007-2012 ........................................... 116
Figure 30: Back Country Areas Within TFL 48..................................................................................... 119
Figure 31: Proportion of Dollars Spent on Local versus Non-Local Contractors ................................... 137
Sustainable Forest Management Plan 4 - TFL 48
December 23, 2011 vii
LIST OF TABLES
Table 1: Biological Richness and its Indicators and Sub-indicators (Wells et. al. 2003) ......................... 13
Table 2: Habitat and Landscape Elements Identified by Bunnell et al. (1999) ....................................... 14
Table 3: Species Selected for Habitat Modeling and Some of the Criteria for their Selection ................. 18
Table 4: Continuous Improvement Process for the SFMP .................................................................... 20
Table 5: Ecosystem Representation Groups ........................................................................................ 24
Table 6: Description of Forest Types .................................................................................................... 27
Table 7: Forest Type Distribution Status and Target Ranges ................................................................ 28
Table 8: Forest Type Distribution Within TFL 48 ................................................................................... 29
Table 9: Proportion of NDU's within TFL 48........................................................................................... 31
Table 10: Late Seral Forest Targets ...................................................................................................... 32
Table 11: Historic Status and Projection of Late Seral Forest – Deciduous ............................................ 34
Table 12: Curent Status and Projection of Late Seral Forest – Deciduous ............................................. 34
Table 13: Historic Status and Projection of Late Seral Forest – Coniferous ........................................... 35
Table 14: Current Status and Projection of Late Seral Forest – Coniferous ........................................... 36
Table 15: Patch Size Class Targets ...................................................................................................... 40
Table 16: Early Patch Size Class Current and Future Status ................................................................. 41
Table 17: Mature Patch Size Class Current and Future Status .............................................................. 41
Table 18: Ecosystem Groups where Snags/Live Tree Retention is Prescribed ...................................... 46
Table 19: Summary of WTP’s in Areas Harvested Since 1995 to 2010 .................................................. 49
Table 20: Summary of Riparian Reserve and Management Zones in 2000 – 2010 ................................ 51
Table 21: Historic Shrub Habitat, Current Condition, and Targets .......................................................... 53
Table 22: WHA and UWR Area’s Incorporated in SFMP 4..................................................................... 56
Table 23: Area Targeted for Harvest by Decade within the Dunlevy Creek Plan Area ............................ 56
Table 24: Species Selected for Wildlife Habitat Supply Analysis in MP 3 and SFMP 4 ........................... 58
Table 25: Natural Rates of Disturbance by NDU ................................................................................... 61
Table 26: Vertebrate Species of Potential Management Concern .......................................................... 63
Table 27: Reductions to Land Base Due to Other Uses (Excluding Roads) ........................................... 78
Table 28: Permanent Access Corridors in TFL 48 (Existing) .................................................................. 80
Table 29: Forecasted Future Permanent Access Corridors ................................................................... 80
Table 30: Actual Recorded and Allowable Annual Cut Summary ........................................................... 82
Table 31: Annual Allowable Cut and Long-Term Harvest Level ............................................................. 84
Table 32: Recommended Allowable Soil Disturbance Within the Net Areas to be Reforested (NAR) ..... 88
Table 33: Site Index by Leading Species for Free Growing Stands ........................................................ 91
Table 34: SCQI and Water Quality Concerns for Three Sub-Basins Within TFL 48 – Sampling Completed
2001 to 2010 ......................................................................................................................... 97
Table 35: Stream Crossing Inventory for Bogus Watershed ................................................................ 100
Table 36: Hydrological Recovery for Fully Stocked Stands That Reach a Maximum Crown Closure of
50% - 70% ........................................................................................................................... 102
Table 37: Peak Flow Index Current Status and Post FDP Status ......................................................... 103
Table 38: Spill Reporting Levels.......................................................................................................... 107
Sustainable Forest Management Plan 4 - TFL 48
December 23, 2011 viii
Table 39: Animal Unit Months on TFL 48 ............................................................................................ 114
Table 40: Baseline Condition – ROS Inventory.................................................................................... 120
Table 41: Current Condition – ROS Inventory Updated to June 2005 .................................................. 121
Table 42: Avoidable Waste and Residue Guidelines ........................................................................... 125
Table 43: Summary of Forest Health Concerns on TFL 48 .................................................................. 126
Table 44: 2000 – 2010 Summary of Forest Health Issues on Unmanaged Stands ............................... 127
Table 45: Estimated Incidence, Severity, Current Conditions and Potential Impact of Damage Agents in
the TFL 48 DFA .................................................................................................................. 128
Table 46: Detection & Monitoring, and Treatment Groupings for Damage Agents ................................ 133
Table 47: Public Advisory Committee Meetings ................................................................................... 150
Table 48: Indicator Monitoring Implementation Schedule..................................................................... 154
Table 49: Inventories Needed to Monitor and Analyze Indicator .......................................................... 154
Table 50: Management and Utilization of the Timber Resource Linkages to the SFMP ........................ 156
Table 51: Protection and Conservation of Non-timber Values and Resources Linkages to the SFMP .. 157
Table 52: Integration of Harvesting Activities with Non-timber Use Linkages to the SFMP ................... 158
Table 53: Forest Fire Objectives Linked to SFMP................................................................................ 159
Table 54: Forest Health Objectives Linked to SFMP ........................................................................... 159
Table 55: Silviculture Objectives Linked to SFMP................................................................................ 160
Table 56: Road Objectives Linked to SFMP ........................................................................................ 161
Table 57: Land Base Comparisons Between MP 3 and SFMP 4 ......................................................... 162
Table 58: Changes to TFL 48 Gross Area Between MP 3 and SFMP 4 ............................................... 162
Sustainable Forest Management Plan 4 - TFL 48
December 23, 2011 1
1 INTRODUCTION
1.1 Purpose
The purpose of the Sustainable Forest Management Plan 4 (also referred to as ‘SFMP 4’ or ‘the plan’) document is to define the objectives, goals, commitments, and strategies for TFL 48 for the period October 15, 2006 to the replacement of this SFM Plan with SFMP5. Overall, SFMP 4 uses past performance towards predetermined milestones to measure success, involves the public to establish future performance, and provides commitments and strategies to ensure those objectives are met. SFMP 4 represents a suite of tools that we can use to develop broad resource objectives to meet explicit site-specific expectations on TFL 48.
SFMP 4 is organized into the following sections:
• Section 1 describes TFL 48 and SFMP 4.
• Section 2 describes Canfor’s management principles and vision for TFL 48. It also explores existing certifications, external relationships, strategic plans and inventories.
• Section 3 specifically articulates the objectives, indicators and targets for TFL 48.
• Section 4 Links the TFL 48 Licence requirement management objectives to the SFMP Objectives throughout the document.
• Section 5 summarizes the changes between SFMP 3 and SFMP 4 including the impact summary of each plan.
• Section 6 summarizes the public involvement during the development of SFMP 4.
• Section 7 provides a list of references and literature cited.
• Section 8 outlines abbreviations and definitions for technical terms used in the plan.
• Section 9 is a series of appendices to provide background and support for the initiatives, standards and procedures discussed in the plan.
1.2 Description of the Licence/Defined Forest Area
1.2.1 Description of the TFL
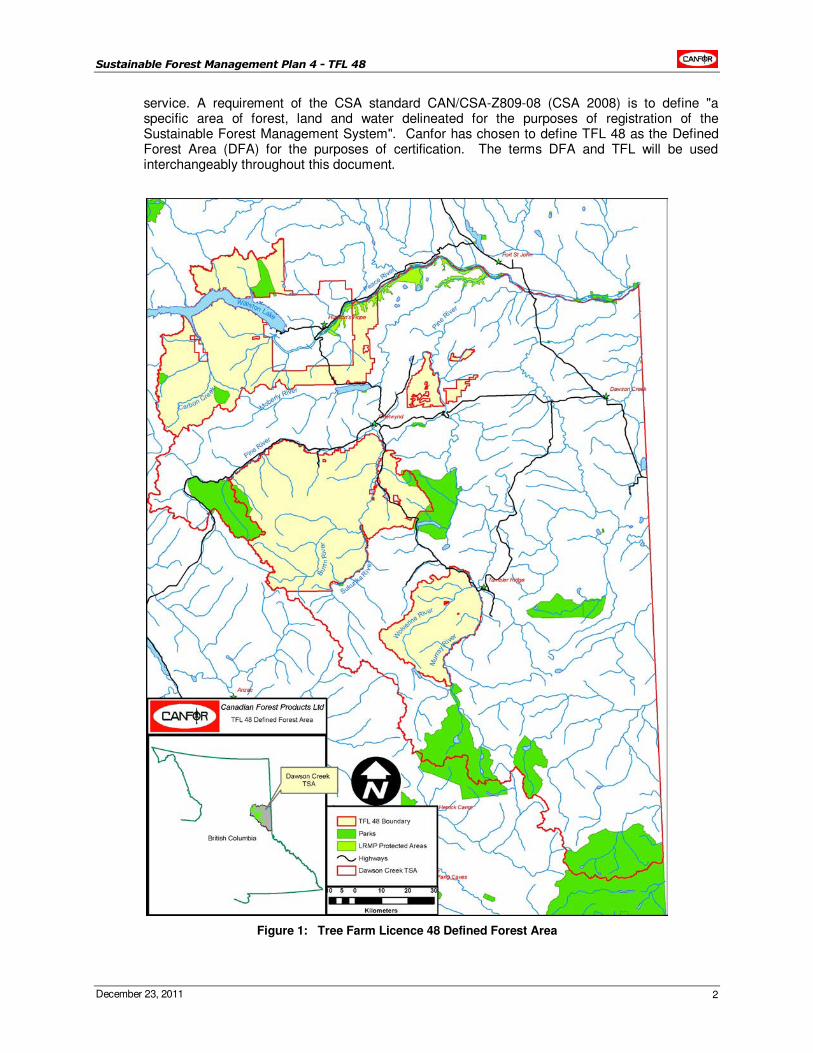
TFL 48, also known as the Chetwynd TFL, is held by Canadian Forest Products Ltd. (Canfor) and comprises five supply blocks in the western half of the Dawson Creek Forest District in the Prince George Forest Region. The blocks are clustered around the communities of Chetwynd, Hudson's Hope and Tumbler Ridge and cover approximately 643,239 hectares. For the most part, the blocks border the Dawson Creek Timber Supply Area (TSA), but they also share boundaries with the Mackenzie, Fort St. John and (for a very short distance) Prince George TSA’s. Additionally, a substantial portion of the TFL (67%) overlaps the operating area of Pulpwood Agreement (PA) 13, issued to Tembec.
The TFL ranges from 540 to 560 longitude and 1200 to 1220 latitude with the eastern portions of the TFL located in the Alberta Plateau while the western portion is within the Rocky Mountains. The northeastern parts of the TFL lie on flat or gently rolling terrain in the Boreal White and Black Spruce biogeoclimatic zone. Further west and south the licence area enters the lee side of the Rocky Mountains, and the more rugged terrain there falls in the Engelmann Spruce-Subalpine Fir, Sub-Boreal Spruce and Alpine Tundra biogeoclimatic zones. This diversity of terrain and climate has led to considerable variation in tree species and productivity. The principal commercial species are white spruce and aspen in the northeast, and white spruce, lodgepole pine, subalpine fir, aspen and cottonwood in the mountainous areas to the west and south.
The communities in the area are Chetwynd (over 3000), Tumbler Ridge (over 2300), Hudson's Hope (over 1,100), Saulteau (over 180), West Moberly (approximately 70) and Moberly Lake (over 100). Of these, Chetwynd, the site of Canfor's sawmill, is the most economically dependent upon harvesting operations in TFL 48. Other economic activities in the area include oil and gas, mining, hydroelectric power generation, agriculture, trapping, outdoor recreation and public
Sustainable Forest Management Plan 4 - TFL 48
December 23, 2011 2
service. A requirement of the CSA standard CAN/CSA-Z809-08 (CSA 2008) is to define "a specific area of forest, land and water delineated for the purposes of registration of the Sustainable Forest Management System". Canfor has chosen to define TFL 48 as the Defined Forest Area (DFA) for the purposes of certification. The terms DFA and TFL will be used interchangeably throughout this document.
Figure 1: Tree Farm Licence 48 Defined Forest Area
Sustainable Forest Management Plan 4 - TFL 48
December 23, 2011 3
1.2.2 History
TFL 48 was first awarded to Canfor on December 1, 1988. It was first replaced 10 years later on December 1, 1998. The most recent replacement Tree Farm Licence (TFL) 48 agreement came into effect on December 1, 2008. The document has been amended over time through Instruments 4 and 5. Instrument 4 came into effect on April 1, 2000 to reflect changing government policy. Instrument 5 came into effect on July 27, 2004 to remove some fields in the Rice property, and add some forested land in the Stewart Lake area, north of the Rice property.
As part of the granting of TFL 48 to Canfor, Canfor committed to eliminating specified pre-1982 backlog NSR areas on the TFL no later than November 30, 2008.
Canfor manages the area according to a long term strategic plan. Our continuous improvement approach allows us to periodically revisit regulatory changes, determine new resource needs, identify information deficiencies, review our management goals and objectives, and develop a forecast that sustains the harvest level over several rotations. The key to this approach is to make our assumptions explicit so they can be measured, monitored and adjusted to reflect future management strategies.
MP 3 was approved by the Ministry of Forests for a five year planning period from October 15, 2001 to October 14, 2006. MP 4 was approved July 24
th 2007 and was made retroactively
effective for October 15, 2006. The term was set to expire September31, 2011 however amendments to government regulation has eliminated the need to approve Management Plans and thus this MP has no expiry date.
A number of significant forest management initiatives of local and provincial importance have developed since the approval of MP 3, including:
• Change of CSA standard to Z809-08 from Z809-02
• Approval of Instrument 5 of the TFL 48 Licence document. This removes fields on the Rice Property and adds forested land in the Stewart Lake area.
• Completion of the Dunlevy Creek Management Plan under the Dawson Creek LRMP
• Change of CSA standard to Z809-02 from Z809-96
• Removal of new woodlot areas from the TFL
• Completion of VRI
• Introduction of Forest Range and Practices Act for the eventual replacement of the Forest Practices Code
These developments directly impact our management approach and our productive land base allocation. SFMP 4 will address these changing economic, social and environmental needs.
In April 1997 Canfor purchased the Rice Property for inclusion into TFL 48. In August 1998, the Ministry of Forests and Range approved the transfer of land into TFL 48 and the conversion to coniferous forests. To preserve the cultivated fields present on the Rice property, a land transfer was approved to remove the fields, and add immature forested land from the nearby Stewart Lake area. This was approved on July 27, 2004 through Instrument 5. The addition of the Rice Property/Stewart Lake land (6,295 ha gross) increased the operable landbase through the conversion of marginal agricultural land, mature deciduous stands and logged over coniferous sites to sustainable coniferous forest management.
1.2.3 Licence Holder and Administration
Canfor is a leading integrated forest products company based in Vancouver, British Columbia. The company is the largest producer of softwood lumber and one of the largest producers of northern softwood kraft pulp in Canada. Canfor also produces kraft paper, plywood, remanufactured lumber products, oriented strand board (OSB), hardboard paneling and a range of specialized wood products, including baled fibre and fibre mat at 30 facilities located in BC, Alberta and Quebec.
Through its operations, affiliated companies and contractors, Canfor employs approximately 9,700 people.
Sustainable Forest Management Plan 4 - TFL 48
December 23, 2011 4
Canfor has an annual production capability of approximately 5.2 billion board feet of lumber, 950 million square feet of plywood and OSB, 1.2 million tonnes of pulp, and 142,000 tonnes of kraft paper. Additionally, Canfor has approximately 14 million cubic metres of allowable annual cut under its forest tenures, all of which are ISO 14001 certified. Canfor (CFP) is listed on the Toronto Stock Exchange. The main operating company is Canadian Forest Products Ltd., from which the name Canfor is derived.
The Chetwynd division of Canadian Forest Products Ltd located in Chetwynd manages TFL 48.
1.3 Progress on Commitments
1.3.1 Pre-1982 Backlog NSR
Section 21.00 of the TFL licence agreement requires Canfor to eliminate all pre-1982 backlog NSR areas prior to November 30, 2008.
Over the period of Management Plan 3, Canfor was able to complete all of its pre-82 backlog NSR commitments included in the TFL 48 licence document.
• Canfor met with the District Manager regarding the outstanding pre-82 backlog NSR commitments contained within the TFL 48 license document.
• A plan to complete Canfor’s pre-82 backlog NSR obligations was approved by the district manager on January 19, 2004.
• The last of the outstanding silviculture treatments were completed in June 2004.
• In a letter dated January 20, 2005, the District Manager confirmed that Canfor has completed all of its outstanding silviculture obligations on the pre-82 backlog NSR sites.
• As part of Canfor’s commitment to the District Manager, yield curves for these backlog areas are included in the information package as Analysis Units 131 and 132.
1.3.2 Rationale Statement Requests from the Deputy Chief Forester
In the last AAC Determination for TFL 48, the Deputy Chief Forester made some requests for works to be completed leading to the next determination. The requests and the progress towards the requests are summarized in the following:
Request: That the licensee complete Phase 2 of the vegetation resource inventory.
Progress: Phase 2 of the VRI was completed in March 2005. A discussion of this can be found in Section 2.7.
Request: That the licensee classify areas within the TFL that do not currently have an inventory label.
Progress: The missing data was immediately recovered. The current information is complete.
Request: That the licensee monitor harvesting performance in deciduous-leading stands which are currently classified as having a low timber growing potential.
Progress: All harvesting activities are monitored and tracked. There has been no significant harvesting in these areas since MP 3, but an increase is anticipated due to recently developed deciduous processing facilities.
Request: That the licensee document the success of stand conversion activities being conducted on the Rice properties.
Progress: All primary stand conversion treatments have been completed. These areas are properly reflected in the inventory and are included in the information package. The performance of these plantations will be monitored.
Request: That the licensee obtain localized site productivity information.
Progress: Predictive Ecosystem Mapping accuracy assessment has been completed and meets the provincial standard for inclusion in timber supply analysis. A sample plan has been developed to collect localized data. Fieldwork has not yet commenced.
Sustainable Forest Management Plan 4 - TFL 48
December 23, 2011 5
Request: That the licensee monitor the productivity of regenerating and advanced regeneration stands in areas managed under the irregular shelterwood silvicultural system.
Progress: Canfor has developed a managed stand sample plan to be implemented in the term of SFMP 4. Please refer to Section 2.8.
Request: That the licensee document actual wildlife tree patch retention.
Progress: WTP retention is documented and has been reported in Indicator 6 (Section 3.6).
Request: That the licensee track and quantify the area of forested land on the TFL that is denuded as a result of energy exploration and development activities.
Progress: This information is now tracked spatially and is current. Between Trim II and the latest VRI work, all existing development has been captured as of 1997. Current development is captured via digital referrals from the industrial users, and is constantly updated as the information is supplied. All known denudations as of December 2004 due to other industrial users have been incorporated into the VRI and are reflected in the long-term harvest level base case determinations for TFL 48.
Request: That the licensee in conjunction with the BCFS staff confirm the actual management practices in riparian management areas.
Progress: Actual performance is tracked and has been reported in Indicator 7 (Section 3.7). Annual performance is captured in the CSA annual reports which are sent to the MoFR.
Request: That the licensee in conjunction with the BCFS staff confirm the area of not satisfactorily restocked land.
Progress: Canfor met with the district manager regarding the outstanding pre-82 NSR backlog commitments contained within the TFL 48 license document. A plan to complete Canfor’s pre-82 backlog obligations was approved by the district manager on January 19, 2004. The last of the outstanding silviculture treatments was completed in June 2004.
1.3.3 Management Plan 3 Approval Letter Requests from the Deputy Chief Forester
In the approval letter dated September 20, 2001, the Deputy Chief Forester made some requests for works to be completed leading to the next determination. Some of those requests were also included in the rationale statement and have been addressed in Section 1.3.2 above. The requests not addressed above and the progress towards the requests are summarized in the following:
Request: With regard to the non-replaceable timber sale licenses, please note that the district manager and the Licensee must agree upon areas of Schedule B land for forest development purposes, in accordance with paragraph 1.12 of the TFL 48 agreement.
Progress: Canfor has jointly developed Operating Guidelines with BCTS for their operations within TFL 48. This agreement was made effective September 12, 2005. See Section 2.3.1 for more information on the process for BCTS and Canfor to agree on areas for forest development.
Request: In the timber supply analysis, I note that your estimate for non-recoverable losses is equivalent to approximately ten percent of the allowable annual cut. This is a significant factor, and I would ask that you work with the Dawson Creek Forest District district manager to confirm or vary this estimate in time for the next timber supply analysis.
Progress: During the term of MP 3 losses have been tracked with a total of 21,975 m3, or an
average of 4,395 m3/year. This is significantly less than the amount currently being modeled,
however in consideration of the current Mountain Pine Beetle outbreak currently on TFL 48 Canfor has chosen not to adjust downward the non-recoverable losses estimate at this time.
Sustainable Forest Management Plan 4 - TFL 48
December 23, 2011 6
Request: I encourage you to continue working with the regional working group that is formulating recommendations on boreal mixed wood management in the northeast part of the province.
Progress: Canfor has participated continuously with this group during the term of MP 3 and we are encouraged that there is continued progress being made, including the inclusion of deciduous species into managed stand growth models (although not in time for inclusion in SFMP 4) and ongoing work on developing mixed wood stocking standards.
Request: On an ongoing basis, please provide the Dawson Creek Forest District district manager with copies of the minutes of meetings held by the Canadian Forest Products – Chetwynd Public Advisory Committee, for CSA Certification.
Progress: The Dawson Creek Forest District, now Peace Forest District has had continuous representation as an advisor on the Chetwynd Public Advisory Committee (PAC) during the term or MP 3. Copies of the meeting minutes and annual reports have been forwarded to all members and advisors of the PAC.
Sustainable Forest Management Plan 4 - TFL 48
December 23, 2011 7
2 SUSTAINABLE FOREST MANAGEMENT
2.1 Management Principles
Canfor adopts an adaptive management approach in the short-term to achieve long-term goals of sustainable forest management (SFM). This incorporates the experience gained from the results of previous management methods and actions into updated objectives and strategies. The key to adaptive management is making strategies and assumptions explicit so they can be measured, monitored, and adjusted for future management strategies.
Canfor has defined the guiding vision, policies and principles for the company in the following documents: Mission Statement, Environment Policy and Forestry Principles. Canfor’s commitment to:
(1) Achieve and maintain SFM;
(2) Meet or exceed all relevant legislation, regulations, policies, and other
requirements to which the organization subscribes;
(3) Respect and recognize Aboriginal title and rights, and treaty rights;
(4) Provide for public participation;
(5) Provide participation opportunities for Aboriginal Peoples with rights to and
interests in SFM within the DFA;
(6) Provide conditions and safeguards for the health and safety of DFA-related
workers and the public;
(7) Honour all international agreements and conventions to which Canada is a
Signatory;
(8) Improve knowledge about the forest and SFM, monitor advances in SFM
science and technology, and incorporate these advances where applicable;
and
(9) Demonstrate continual improvement of SFM.
are demonstrated through the following documents as well as the SFM Plan and processes.
Sustainable Forest Management Plan 4 - TFL 48
December 23, 2011 8
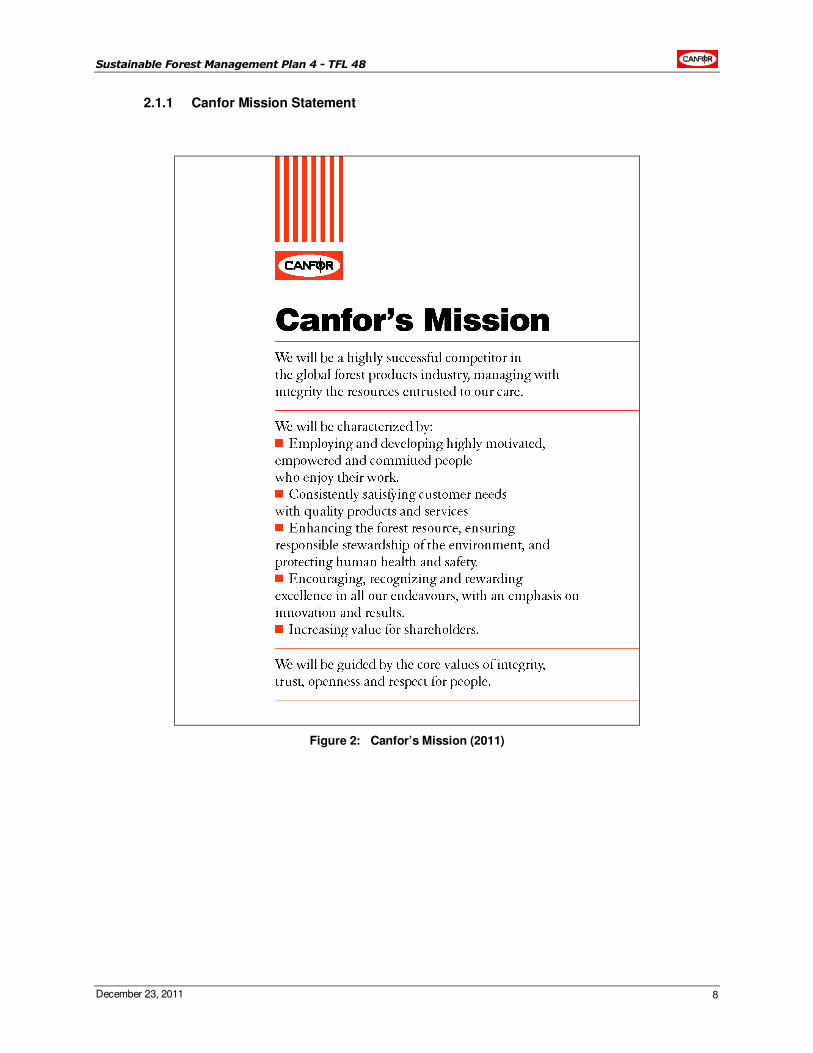
2.1.1 Canfor Mission Statement
Figure 2: Canfor’s Mission (2011)
Sustainable Forest Management Plan 4 - TFL 48
December 23, 2011 9
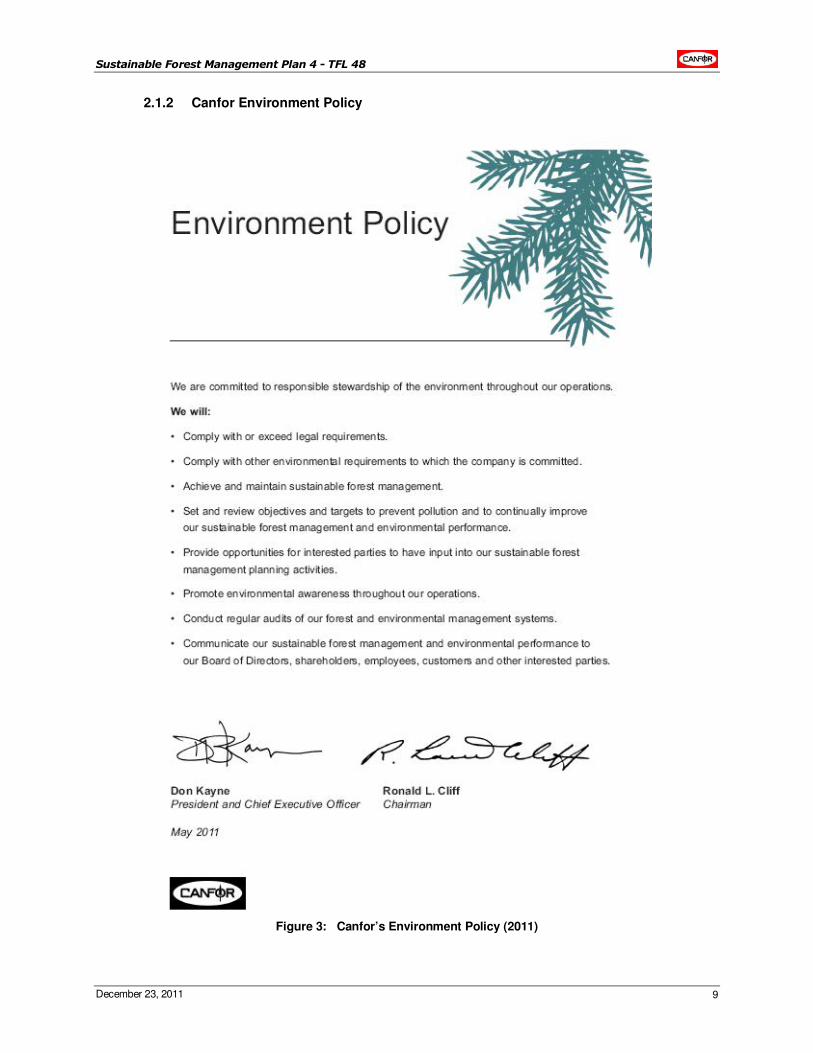
2.1.2 Canfor Environment Policy
Figure 3: Canfor’s Environment Policy (2011)
Sustainable Forest Management Plan 4 - TFL 48
December 23, 2011 10
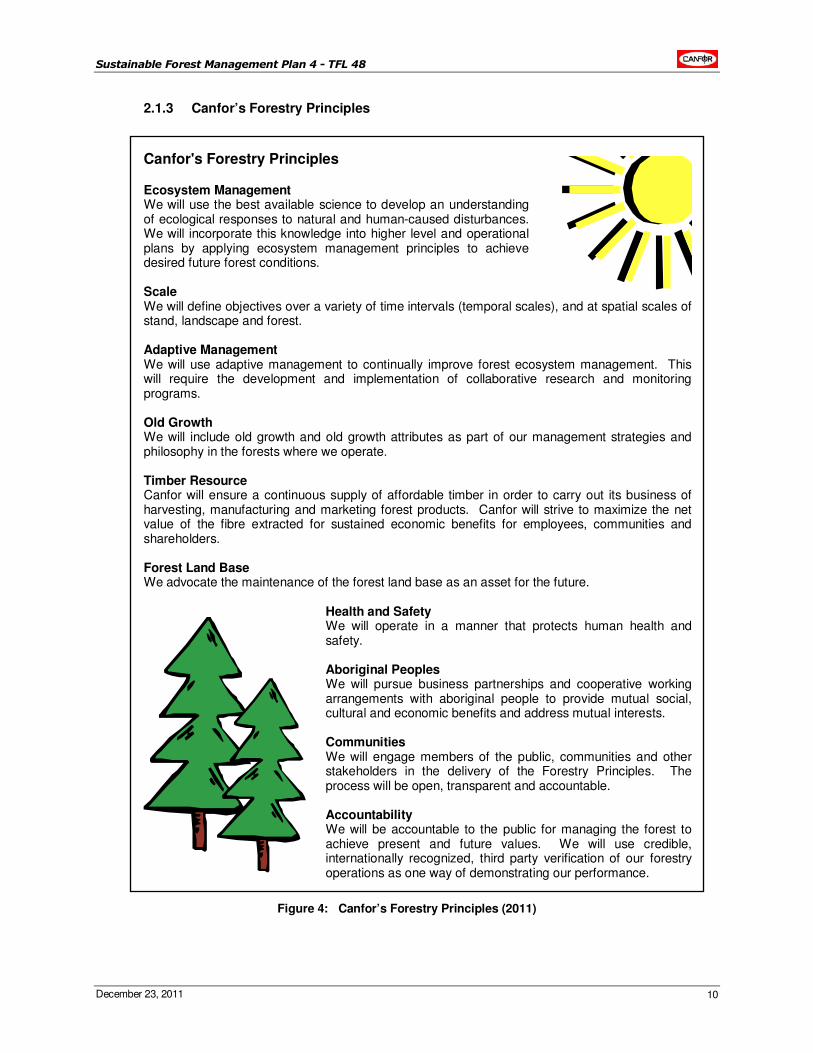
2.1.3 Canfor’s Forestry Principles
Canfor's Forestry Principles Ecosystem Management We will use the best available science to develop an understanding of ecological responses to natural and human-caused disturbances. We will incorporate this knowledge into higher level and operational plans by applying ecosystem management principles to achieve desired future forest conditions. Scale We will define objectives over a variety of time intervals (temporal scales), and at spatial scales of stand, landscape and forest. Adaptive Management We will use adaptive management to continually improve forest ecosystem management. This will require the development and implementation of collaborative research and monitoring programs. Old Growth We will include old growth and old growth attributes as part of our management strategies and philosophy in the forests where we operate. Timber Resource Canfor will ensure a continuous supply of affordable timber in order to carry out its business of harvesting, manufacturing and marketing forest products. Canfor will strive to maximize the net value of the fibre extracted for sustained economic benefits for employees, communities and shareholders. Forest Land Base We advocate the maintenance of the forest land base as an asset for the future.
Health and Safety We will operate in a manner that protects human health and safety. Aboriginal Peoples We will pursue business partnerships and cooperative working arrangements with aboriginal people to provide mutual social, cultural and economic benefits and address mutual interests. Communities We will engage members of the public, communities and other stakeholders in the delivery of the Forestry Principles. The process will be open, transparent and accountable. Accountability We will be accountable to the public for managing the forest to achieve present and future values. We will use credible, internationally recognized, third party verification of our forestry operations as one way of demonstrating our performance.
Figure 4: Canfor’s Forestry Principles (2011)
Sustainable Forest Management Plan 4 - TFL 48
December 23, 2011 11
2.2 Forest Management Systems Certification
2.2.1 ISO Environmental Management System
As a preparatory step to sustainable forest management certification, Canfor developed an environmental management system (EMS) for the company's woodlands operations. In November 1999 this environmental management system was certified to the ISO 14001 standard developed by the International Organization for Standardization. The company EMS provides a platform on which to build the sustainable forest management elements required to meet CAN/CSA-Z809-08.
2.2.2 CSA Sustainable Forestry System
In July of 1999 Canfor formally announced its commitment to seek sustainable forest management certification of the company's forestry operations under the Canadian Standards Association Sustainable Forest Management System standard CAN/CSA-Z809-96. TFL 48 was initially registered to the CSA Standard in July 2000 and was re-registered in October 2002. Re-registration was conducted in 2005 to the CAN/CSA-Z809-02 standard. Additionally in 2005 BCTS expressed interest to join the certification for their operation on TFL 48. A gap analysis was completed in the fall of 2005 and a BCTS registration audit for their operations was conducted in the fall of 2006. In July of 2007 the Ministry of Forests and Range approved the SFMP4 dated September 26, 2006. Re-registration was again conducted in 2008. This plan is intended to fulfill the requirements for re-registration in 2011 to the CAN/CSA-Z809-08 standard while maintaining the Management Plan indicators approved in 2007.
2.3 Roles and Responsibilities
Canfor is not the sole operator within TFL 48. BC Timber Sales has access to 54,330 m3 per year of
conifer leading volume. Tembec has access to 55,000 m3 of deciduous leading volume through the PA
13 licence.
2.3.1 BC Timber Sales
Canfor and BCTS have agreed to seek a joint certification to the CAN/CSA-Z809-02 standard in 2006. See Appendix 2 – BCTS SFM Policies for copies of BCTS Environment Policy and Sustainable Resource Management Policy. This SFMP serves as the SFMP for this process.
Canfor has jointly developed Operating Guidelines with BCTS for their operations within TFL 48. Canfor retains control over the planning stages of these areas and can therefore directly ensure that the proposed cut blocks meet the SFM objectives. BCTS has the responsibility to report all harvesting and silviculture activities to Canfor until free growing has been achieved and is committed to operate within the requirements of the joint certification SFM plan. Canfor incorporates all of the BCTS activities in the annual reports. In addition to this summary a detailed responsibility action matrix has been developed for all the indicators listed in section 3 which includes all of BCTS responsibilities as well as Canfor’s.
BCTS had awarded 40,000 m3/year of their allocation to licence A64393 issued to Emporium Investments Ltd. All of the blocks harvested in this licence have been included in the analysis supporting this SFMP. Approximately 178,101 m
3 was laid out during MP 3 and will not be
subject to stand level requirements of SFMP 4. All future blocks will come from Canfor’s FDP/FSP and Canfor is responsible for conducting the analysis for these areas. BCTS assumes the responsibility to ensure layout conducted after 2005 and harvesting activities are consistent with this SFMP. This licence expired April 19, 2011. BCTS retains the silviculture liability for this licence.
2.3.2 Other Forest Tenure Holders
Canfor had a memorandum of understanding with the former PA 13 holder, Louisiana Pacific. When LP sold the license to Tembec, this MoU was dissolved. Although a new agreement has not yet been formalized with Tembec, Canfor and Tembec have been operating under the intent
Sustainable Forest Management Plan 4 - TFL 48
December 23, 2011 12
of the former MoU. Tembec has the same commitment to report activities to Canfor, so that they can be incorporated into the annual reports.
2.3.3 Other Industrial Users (Oil and Gas, Mining, etc)
All oil, gas and mining activities (e.g., seismic, roads, pipelines, well sites, mine sites) proposed for the TFL are referred to the Canfor office. Canfor provides comments to minimize impacts on the timber harvesting land base (e.g., reforest disturbed sites), proposed road locations and known resource features.
For oil and gas these comments are provided to the company proposing development. The company is then obligated to report these comments and how they will incorporate these comments to the Oil and Gas Commission.
For mining activities (e.g., mine review) the comments are provided to the company proposing development and to the Ministry of Energy and Mines.
Canfor offers to purchase merchantable coniferous timber from these developments at market value.
Industrial developments (e.g., well sites, pipelines, mines) are mapped by Canfor and included in timber supply analysis.
2.3.4 Chetwynd Public Advisory Committee
The Chetwynd Public Advisory Committee (PAC) serves to provide the vital public participation component of SFM in Canada. Since its first meeting on February 4, 2000, the members’ participation has enhanced their own knowledge of SFM in general and has provided a valuable opportunity to be involved with the decision making for the local forest.
2.4 Existing Strategic Plans
2.4.1 Dawson Creek Land and Resource Management Plan
Objectives for values and resources, and acceptable uses on Crown land, were outlined in the Dawson Creek LRMP, a public land use process. The plan was approved by cabinet on March 4, 1999. The plan incorporates the principles of integrated resource management into a long term plan (ten years) for resource development on Crown land within the Dawson Creek Timber Supply Area (TSA) and TFL 48. TFL 48 falls completely within the area covered by the Dawson Creek LRMP.
The Dawson Creek LRMP is the outcome of the deliberations of a range of local private citizens, stakeholders, including Canfor and government agency representatives. The Dawson Creek LRMP process incorporated a form of consensus-based decision-making that enabled general agreement on all issues.
The Dawson Creek LRMP adopts the following principles as stated in the approved document:
• Sustainable use of renewable natural resources.
• The management of any one resource shall take into consideration other resource values, rights, tenures, and development opportunities and shall recognize the biological and physical limitations of the land and resources.
• Maintenance or enhancement of the quality of life, social and economic stability, employment opportunities including job creation, and the vitality of the local communities.
• Acknowledgement that communities located within the planning area should have the opportunity to benefit from the natural resources within the planning area. This can be achieved through, but is not limited to, the following: economic diversification, managed access to resources, and increased value-added manufacturing and processing.
• Land, water, air and all living organisms are integral parts of the ecosystem and should be sustained and accommodated by management plans.
Sustainable Forest Management Plan 4 - TFL 48
December 23, 2011 13
An implementation plan for the LRMP has been developed and is reviewed periodically by a core of representatives from the original planning table. The implementation plan is under the direction of the Ministry of Agriculture and Lands.
Forest resource planning conducted by Canfor, including the Sustainable Forest Management Plan, will be consistent with the objectives of the Dawson Creek LRMP. Canfor is committed to managing to the spirit and intent of the LRMP and this is reflected in this SFMP. Appendix 11 – Linkages of SFMP 4 to Dawson Creek LRMP cross-references the linkages between SFMP 4 objectives, indicators and targets, and the Dawson Creek LRMP objectives.
2.4.2 Dunlevy Creek Management Plan
The Dawson Creek LRMP identifies several special resource management zones in recognition of their respective wildlife habitat / wilderness recreation values. The Dunlevy Creek Special Management Zone (SMZ) is one of these zones.
Under the direction of the LRMP, the Dunlevy Creek SMZ project was initiated in May 2000. This project resulted in a strategic management plan for the Dunlevy Creek SMZ that guides oil and gas development and the disposition of petroleum and natural gas tenures, and enables landscape level planning to guide forest development.
In the Dunlevy Creek Management Plan, recommendations to coordinate resource development activities among tenured users and to plan resource developments in consultation with interested stakeholders in the Dunlevy Creek SMZ are intended to integrate resource planning and development in a manner that is consistent with the Dawson Creek LRMP.
Refer to Section 3.9 for specific information on the Dunlevy Creek Management Plan.
2.5 Sustaining Biological Richness
The concept of “sustaining biological richness” as described in this SFMP was derived from the work initially developed by Dr. Fred Bunnell and the Weyerhaeuser Adaptive Management Working Group (Bunnell et. al. 2003). This concept is further described in discussion papers completed for Canfor’s TFL 48 (Bunnell 2002), and for the Prince George Timber Supply Area (Wells et. al. 2003b). The following section describes the importance of “sustaining biological richness” as it relates to “biodiversity” and three “indicators” that may be used to assess achievement. The term “indicator” used by Bunnell et. al. 2003; Bunnell 2002; and Wells et. al. 2003a,b is used in the context of providing broad qualitative tests not to be confused with the indicators in Section 3 of this plan, which are specific measures of performance.
Table 1 identifies biological richness and the indicators and sub-indicators defined by Wells et. al. 2003a,b. Performance indicators are contained in Section 3 that measure and demonstrate performance with regard to the conservation of biological richness over time.
Table 1: Biological Richness and its Indicators and Sub-indicators (Wells et. al. 2003)
Biological Diversity Criterion: Biological richness and its associated values are sustained within the management unit.
Indicator 1: Ecologically distinct ecosystem types are represented in the non-harvestable land base of the management unit to maintain lesser known species and ecological functions.
Indicator 2: The amount, distribution and heterogeneity of habitat and landscape structure important to sustain biological richness is maintained over time.
Coarse woody debris
Large live trees
Cavity trees (snags)
Shrubs
Broad-leaved trees
Riparian areas
Late seral and early seral
Adjacent or continuous canopy
Indicator 3: Productive and well-distributed populations of forest dwelling species are maintained over time.
Sustainable Forest Management Plan 4 - TFL 48
December 23, 2011 14
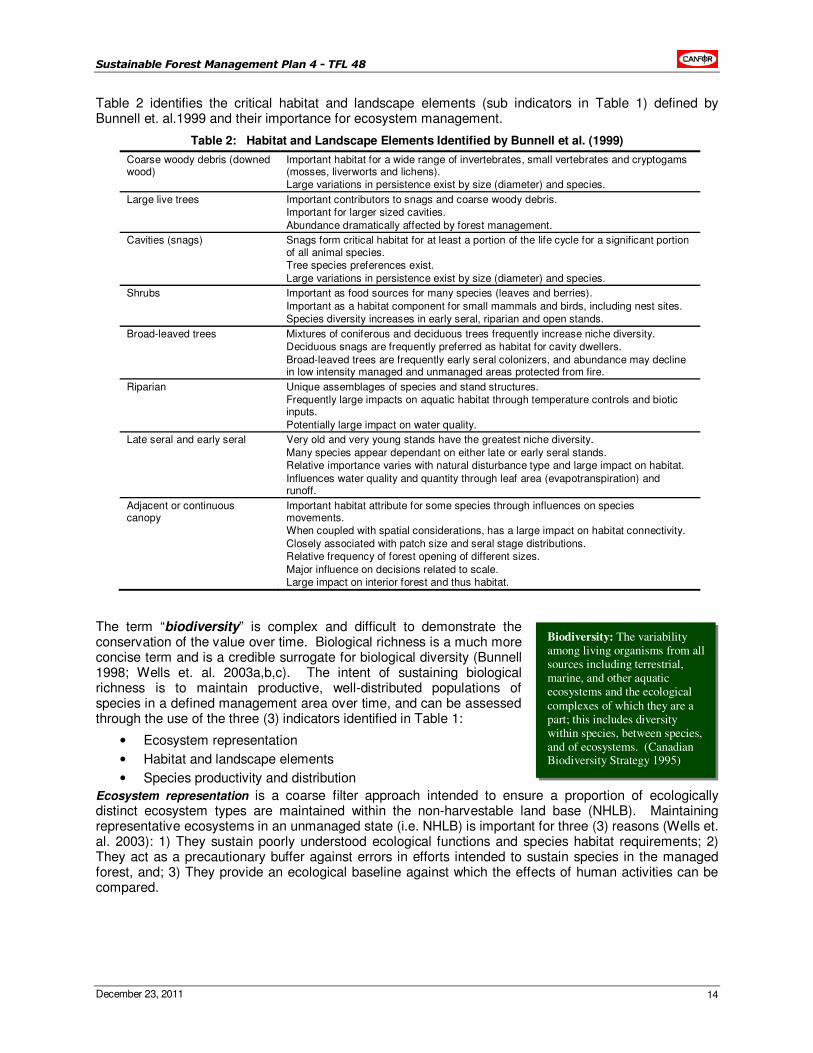
Table 2 identifies the critical habitat and landscape elements (sub indicators in Table 1) defined by Bunnell et. al.1999 and their importance for ecosystem management.
Table 2: Habitat and Landscape Elements Identified by Bunnell et al. (1999)
Coarse woody debris (downed wood)
Important habitat for a wide range of invertebrates, small vertebrates and cryptogams (mosses, liverworts and lichens). Large variations in persistence exist by size (diameter) and species.
Large live trees Important contributors to snags and coarse woody debris. Important for larger sized cavities.
Abundance dramatically affected by forest management.
Cavities (snags) Snags form critical habitat for at least a portion of the life cycle for a significant portion of all animal species. Tree species preferences exist.
Large variations in persistence exist by size (diameter) and species.
Shrubs Important as food sources for many species (leaves and berries).
Important as a habitat component for small mammals and birds, including nest sites. Species diversity increases in early seral, riparian and open stands.
Broad-leaved trees Mixtures of coniferous and deciduous trees frequently increase niche diversity. Deciduous snags are frequently preferred as habitat for cavity dwellers.
Broad-leaved trees are frequently early seral colonizers, and abundance may decline in low intensity managed and unmanaged areas protected from fire.
Riparian Unique assemblages of species and stand structures. Frequently large impacts on aquatic habitat through temperature controls and biotic inputs.
Potentially large impact on water quality.
Late seral and early seral Very old and very young stands have the greatest niche diversity.
Many species appear dependant on either late or early seral stands. Relative importance varies with natural disturbance type and large impact on habitat.
Influences water quality and quantity through leaf area (evapotranspiration) and runoff.
Adjacent or continuous canopy
Important habitat attribute for some species through influences on species movements. When coupled with spatial considerations, has a large impact on habitat connectivity.
Closely associated with patch size and seral stage distributions. Relative frequency of forest opening of different sizes.
Major influence on decisions related to scale. Large impact on interior forest and thus habitat.
The term “biodiversity” is complex and difficult to demonstrate the conservation of the value over time. Biological richness is a much more concise term and is a credible surrogate for biological diversity (Bunnell 1998; Wells et. al. 2003a,b,c). The intent of sustaining biological richness is to maintain productive, well-distributed populations of species in a defined management area over time, and can be assessed through the use of the three (3) indicators identified in Table 1:
• Ecosystem representation
• Habitat and landscape elements
• Species productivity and distribution
Ecosystem representation is a coarse filter approach intended to ensure a proportion of ecologically distinct ecosystem types are maintained within the non-harvestable land base (NHLB). Maintaining representative ecosystems in an unmanaged state (i.e. NHLB) is important for three (3) reasons (Wells et. al. 2003): 1) They sustain poorly understood ecological functions and species habitat requirements; 2) They act as a precautionary buffer against errors in efforts intended to sustain species in the managed forest, and; 3) They provide an ecological baseline against which the effects of human activities can be compared.
Biodiversity: The variability among living organisms from all sources including terrestrial, marine, and other aquatic ecosystems and the ecological
complexes of which they are a part; this includes diversity within species, between species, and of ecosystems. (Canadian Biodiversity Strategy 1995)
Sustainable Forest Management Plan 4 - TFL 48
December 23, 2011 15
Habitat and landscape elements are structural attributes that occur at a variety of temporal and spatial scales. Maintaining these elements is a medium filter approach and is important for two (2) reasons (Bunnell and Kremsater 1990; Lindenmayer and Franklin 2002; Wells et. al. 2003): 1) Studies have shown that most forest dwelling species require these elements as a habitat requirement, and; 2) Forest management activities have a strong influence over the abundance, distribution and functionality of these elements.
Species productivity and distribution is a fine filter approach intended to monitor the presence and trends of species in response to changes in habitat structure and pattern. This indicator is a long-term adaptive approach, which tests the “effectiveness” of the provisions designed to manage indicators 1 and 2 (above). This approach is often referred to as “effectiveness monitoring” and relies on the results of long-term forest monitoring and research programs such as, forest inventory monitoring plots, and wildlife research that supports species accounts (distribution and abundance). As stated above, effectiveness monitoring can be used to support adaptive management or continuous improvement of forest practices related to Indicators 1 and 2 (see Table 1) over time. Continuous improvement of the SFMP is further discussed in Section 2.9.
Sustainable Forest Management Plan 4 - TFL 48
December 23, 2011 16
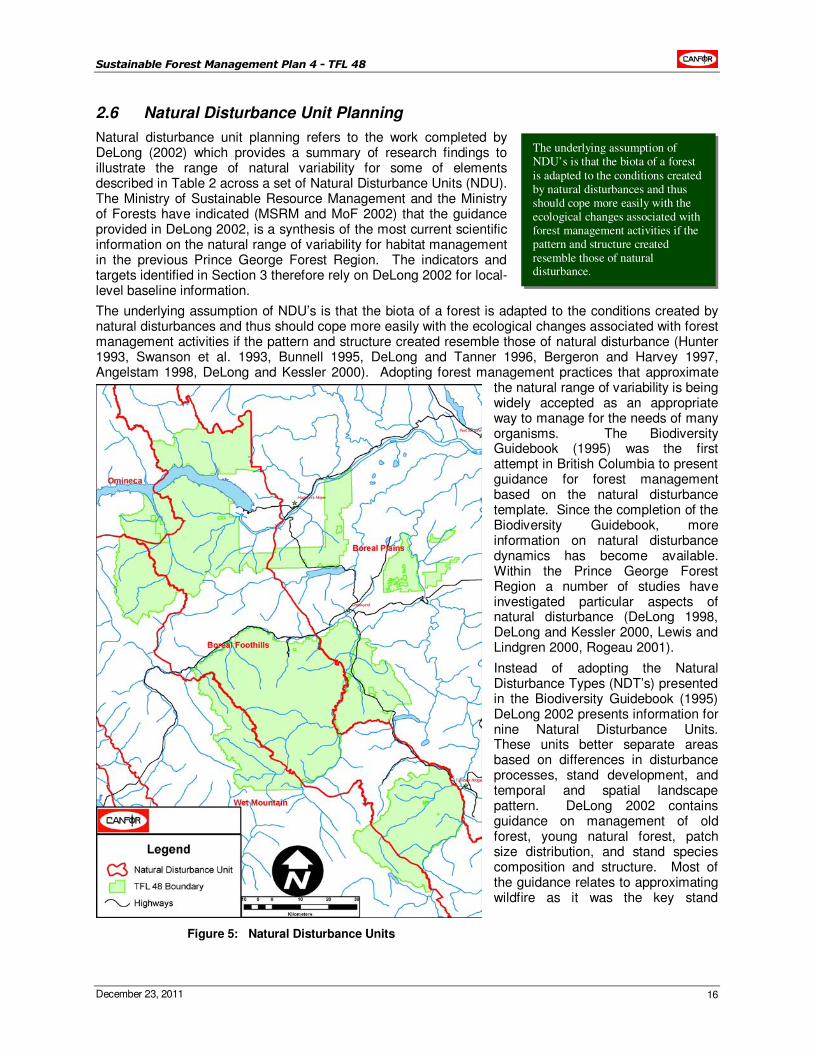
2.6 Natural Disturbance Unit Planning
Natural disturbance unit planning refers to the work completed by DeLong (2002) which provides a summary of research findings to illustrate the range of natural variability for some of elements described in Table 2 across a set of Natural Disturbance Units (NDU). The Ministry of Sustainable Resource Management and the Ministry of Forests have indicated (MSRM and MoF 2002) that the guidance provided in DeLong 2002, is a synthesis of the most current scientific information on the natural range of variability for habitat management in the previous Prince George Forest Region. The indicators and targets identified in Section 3 therefore rely on DeLong 2002 for local-level baseline information.
The underlying assumption of NDU’s is that the biota of a forest is adapted to the conditions created by natural disturbances and thus should cope more easily with the ecological changes associated with forest management activities if the pattern and structure created resemble those of natural disturbance (Hunter 1993, Swanson et al. 1993, Bunnell 1995, DeLong and Tanner 1996, Bergeron and Harvey 1997, Angelstam 1998, DeLong and Kessler 2000). Adopting forest management practices that approximate
the natural range of variability is being widely accepted as an appropriate way to manage for the needs of many organisms. The Biodiversity Guidebook (1995) was the first attempt in British Columbia to present guidance for forest management based on the natural disturbance template. Since the completion of the Biodiversity Guidebook, more information on natural disturbance dynamics has become available. Within the Prince George Forest Region a number of studies have investigated particular aspects of natural disturbance (DeLong 1998, DeLong and Kessler 2000, Lewis and Lindgren 2000, Rogeau 2001).
Instead of adopting the Natural Disturbance Types (NDT’s) presented in the Biodiversity Guidebook (1995) DeLong 2002 presents information for nine Natural Disturbance Units. These units better separate areas based on differences in disturbance processes, stand development, and temporal and spatial landscape pattern. DeLong 2002 contains guidance on management of old forest, young natural forest, patch size distribution, and stand species composition and structure. Most of the guidance relates to approximating wildfire as it was the key stand
Figure 5: Natural Disturbance Units
The underlying assumption of NDU’s is that the biota of a forest
is adapted to the conditions created by natural disturbances and thus should cope more easily with the ecological changes associated with forest management activities if the pattern and structure created resemble those of natural disturbance.
Sustainable Forest Management Plan 4 - TFL 48
December 23, 2011 17
replacement disturbance agent in most landscapes and it is the one that we have exhibited the most control over. In other words it is the disturbance process we are attempting to replace with harvesting.
Examples of how this plan has adopted the principles identified in DeLong 2002 include:
• Maintenance of some naturally disturbed areas over time, which is not salvaged.
• Openings, which represent a more natural patch, size distribution.
• Providing for stand-level characteristics (e.g. species composition, stand structure) that emulate natural baseline information as much as possible.
To move towards a more natural range of variation and to emulate patterns of natural disturbance many of the indicators and targets identified in Section 3 are established at a NDU or DFA level, as opposed to management strategies directed at individual stands or cutblocks.
2.7 Resource Inventories
Canfor has completed a variety of resource inventories since it was awarded TFL 48. These are periodically updated as needed to meet strategic or operational planning needs. Key inventories are briefly discussed below while additional detail is provided in the information package (Appendix 5 – Timber Supply Analysis Information Package).
Vegetation Resource Inventory
Canfor recently completed several projects focusing on improving forest cover or Vegetation Resource Inventory (VRI) information within TFL 48. These projects include:
• Photo Interpretation (Phase I) – Classification completed in June 2000 to the VRI 1998 standard.
• Ground Sampling (Phase II) – Sampling forest cover polygons and compiling the data was completed in the fall of 2002 to the VRI standard.
• Adjustment – Statistical analysis and adjustment of the VRI was completed in March 2003 to the VRI standard.
• Net Volume Adjustment Factors (NVAF) – Sampling trees from the Phase II project, compiling, analyzing and adjusting the VRI was completed in March 2005 to the VRI standard. See report titled Tree Farm Licence 48 Vegetation Resources Inventory Statistical Adjustment (Appendix 9 – TFL 48 Vegetation Resource Inventory Statistical Adjustment).
Recreation
The most recent recreation inventory was completed in 1994 to the MoFR standard, while a separate inventory of recreation sites and trails was completed in 1999.
Visual Landscape Inventory
During the term of MP 2 (1994), an inventory of visual portions of the TFL landscape was completed by Canfor. In 1999 this visual landscape inventory was added to and updated to the 1997 standard. In 2005 the Ministry of Forests consolidated all visual landscape inventories within the previous Dawson Creek Forest District (TFL48 and Dawson Creek TSA). During this process it was discovered that some areas that had been declared and made known were not part of the TFL 48 visual inventory used in MP3. The 2005 consolidated inventory that was provided by the MoFR, and identifies polygons having an existing VQO (EVQO) on the file, is used in the base case for TFL 48.
The areas added during the 1999 inventory are represented in the 2005 consolidated inventory with recommended VQO’s (RVQO). Sensitivity analysis will be carried out that adds ‘Recommended’ VQO's to the 2005 consolidated visual landscape inventory. The sensitivity analysis is the cumulative amount of established and recommended VQO’s from the 2005 consolidated inventory.
Terrain Mapping
In March 2001 Terrain Mapping to the RIC 1994 standard was completed for TFL 48. This inventory along with a landslide inventory formed the basis for operability definitions and the Predictive Ecosystem Mapping.
Sustainable Forest Management Plan 4 - TFL 48
December 23, 2011 18
Physical Operability
Using the terrain components of the TEM work completed for the Burnt River LU and the Lower Sukunka LU, the terrain mapping for the remainder of the TFL, and the Landslide Inventory Terrain Stability Classes were derived for the entire TFL using the Stability Index MAPing (SINMAP) model.
The SINDEX map is then further analyzed and classified into physical operability classes.
Predictive Ecosystem Mapping
Using the terrain mapping completed for the TFL along with VRI and TRIM data a predictive ecosystem map was completed for TFL 48 in January 2003. An August 2006 accuracy assessment demonstrated that the area weighted dominant correct score on the PEM database, based on 88 field polygons is over 77%. This information is used for habitat modeling and managed stand site index estimates.
Fish and Fish Habitat
Since 1995, Canfor has been conducting 1:20,000 reconnaissance level RIC standard fish and fish habitat surveys within TFL 48.
RIC standard reconnaissance level fish and fish habitat inventories have been completed across the TFL. In 2005 Canfor completed the stream modeling project which assigned stream classifications based on stream barriers and derived stream width for all streams within TFL 48. This information is used for strategic planning purposes.
Fish inventories will continue to be required on an operational basis (e.g., cut block and road planning).
Cultural Heritage
Canfor obtained GIS coverage’s for the Archaeological Overview Assessment (AOA) and Archaeological Site Information for the Dawson Creek Forest District from the Ministry of Small Business Tourism and Culture (MSBTC) in June 1999. The data is maintained under a Confidentiality Agreement with the MSBTC.
At the time of timber supply analysis there were 20 known heritage sites within the TFL, six of these sites occurred within new Protected Areas and up to six of the known sites were expected to occur in riparian management areas.
We have completed over 50 Archaeological Impact Assessments (AIAs) for forest roads and cut blocks since 1995. To date we have not found any Heritage Resources during these surveys. Canfor expects that heritage resources will be identified and protected on site-specific areas in the future.
Wildlife and Wildlife Habitat
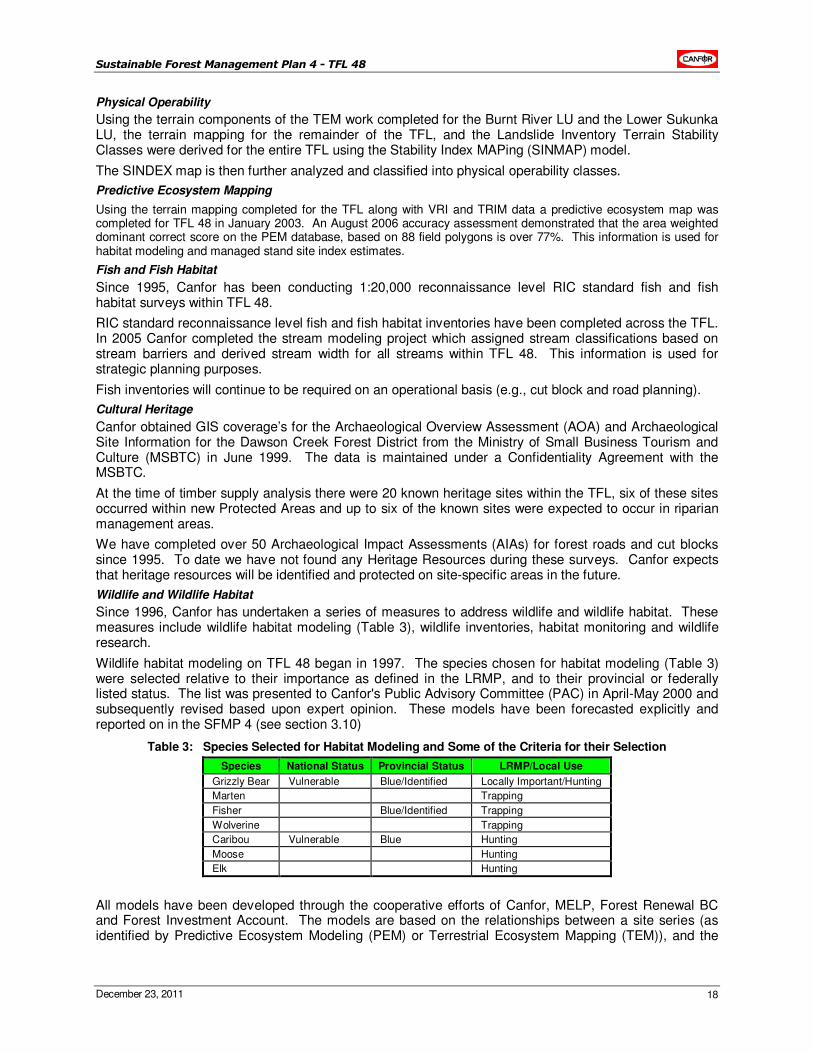
Since 1996, Canfor has undertaken a series of measures to address wildlife and wildlife habitat. These measures include wildlife habitat modeling (Table 3), wildlife inventories, habitat monitoring and wildlife research.
Wildlife habitat modeling on TFL 48 began in 1997. The species chosen for habitat modeling (Table 3) were selected relative to their importance as defined in the LRMP, and to their provincial or federally listed status. The list was presented to Canfor's Public Advisory Committee (PAC) in April-May 2000 and subsequently revised based upon expert opinion. These models have been forecasted explicitly and reported on in the SFMP 4 (see section 3.10)
Table 3: Species Selected for Habitat Modeling and Some of the Criteria for their Selection
Species National Status Provincial Status LRMP/Local Use
Grizzly Bear Vulnerable Blue/Identified Locally Important/Hunting
Marten Trapping
Fisher Blue/Identified Trapping
Wolverine Trapping
Caribou Vulnerable Blue Hunting
Moose Hunting
Elk Hunting
All models have been developed through the cooperative efforts of Canfor, MELP, Forest Renewal BC and Forest Investment Account. The models are based on the relationships between a site series (as identified by Predictive Ecosystem Modeling (PEM) or Terrestrial Ecosystem Mapping (TEM)), and the
Sustainable Forest Management Plan 4 - TFL 48
December 23, 2011 19
structural stage of the forest as derived from Vegetation Resources Inventory (VRI) and forecasted in the spatial modeling forecast. The animals’ relationship to its habitat is based on the literature including local studies and environmental impact assessments wherever possible. Detailed ground sampling throughout the TFL as part of the TEM and Terrain mapping processes was used to assist in developing the species habitat relationships.
2.8 Managed Stand Monitoring
Under the principles of SFM, monitoring is defined as the periodic measurement and assessment of change of an indicator, where an indicator is a variable used to report progress towards achieving an objective. Objectives are broad, general statements that describe a desired state or condition related to one or more forest values (CAN/CSA-Z809-08). In this context, two broad categories of monitoring can be recognized. The first, which may be referred to as “administrative monitoring”, checks that planned SFM activities are carried out (i.e., did we do what we said we were going to do?). An example is monitoring to ensure conformance with late seral targets.
The second category of monitoring may be referred to as monitoring the state of the forest, which includes activities that measure timber and non-timber variables over time. Growth and Yield (GY) monitoring, which is the process of checking GY estimates for a defined population, is in this broad category. Monitoring the state of the forest requires a long-term commitment to establishing and re-measuring plots over time.
Monitoring is a key process in adaptive management. It is a feedback loop that provides information for continuous improvement. The level of success in achieving objectives can be evaluated and planning and management activities can be improved accordingly.
Canfor is committed to implementing a GY monitoring program for managed stands within the TFL 48 DFA. This program is based upon a 2-km grid covering the whole DFA. When any one of the points is harvested a GY monitoring plot will be established 15 years post-harvest and periodically re-measured over time. The GY monitoring objectives for the TFL 48 DFA are as follows:
• Monitor the change in volume, species composition, top height, and site index in managed stands from 15 years post-harvest onwards.
The intent is that this data will be compared with predicted values of the same attributes used in timber supply analysis. This is to develop a level-of-confidence in the accuracy and precision of projections used in timber supply analysis. This data can also be used to address several SFM indicators pertaining to maintaining or improving the harvest level over time.
• Provide data on snags, coarse woody debris, and shrubs to address SFM objectives.
• Provide data on stand growth and development that can be used as a subset of the data required for developing new GY models.
• Use a sample design that can be modified in the future to incorporate establishment of plots in mature stands and linkages with other inventory sampling.
See Appendix 10 – TFL 48 Change Monitoring Inventory Sample Plan for a detailed description of the sample design and objectives developed for the TFL 48 DFA.
2.9 Continuous Improvement
In keeping with the principles of SFM, opportunities to continuously improve the SFMP are built into the SFM process. Continuous improvement relies on the ability to recognize, plan for, and adapt to change as it occurs. As time goes by, changes will occur to both the practice of forest management and the process in which it is delivered. Ensuring that a process is in place to accept and adapt to change is a necessary part of SFM. To ensure continuous improvement occurs means that the sources of “change” are recognized and strategies developed to accept and adapt to these changes. Table 4 identifies the sources of change with regard to forest management and the strategies that are in place to adapt.
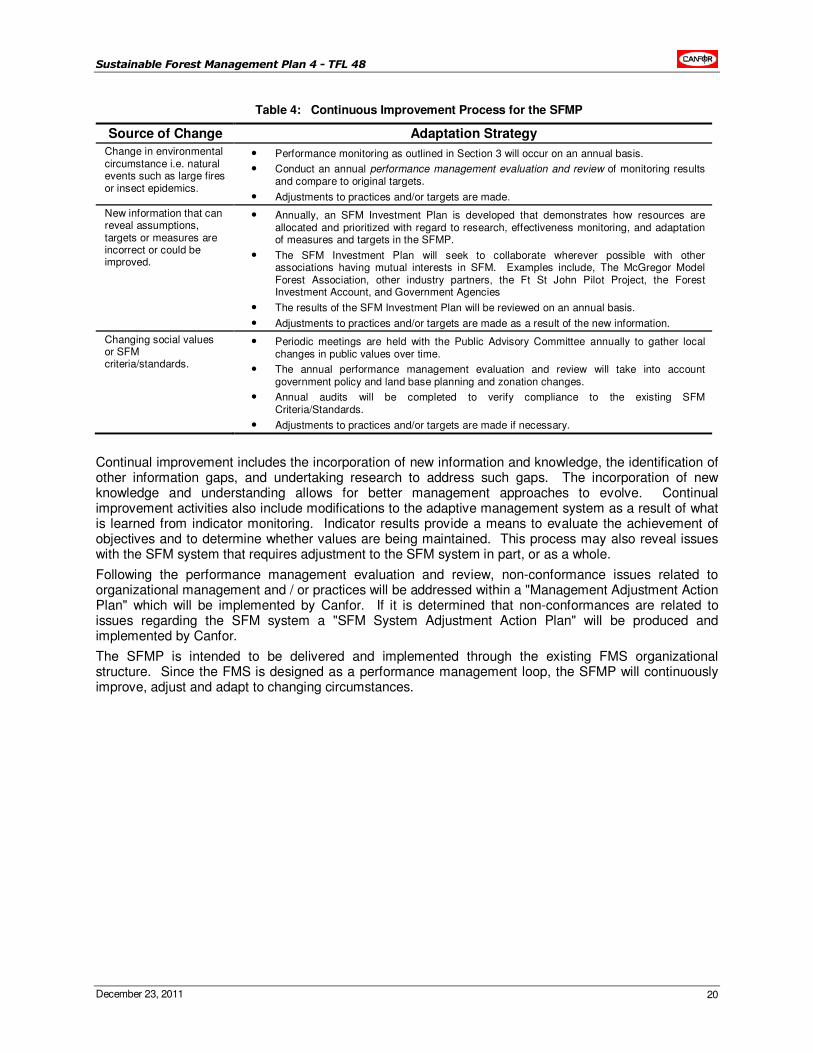
Sustainable Forest Management Plan 4 - TFL 48
December 23, 2011 20
Table 4: Continuous Improvement Process for the SFMP
Source of Change Adaptation Strategy
Change in environmental circumstance i.e. natural events such as large fires or insect epidemics.
• Performance monitoring as outlined in Section 3 will occur on an annual basis.
• Conduct an annual performance management evaluation and review of monitoring results and compare to original targets.
• Adjustments to practices and/or targets are made.
New information that can reveal assumptions, targets or measures are incorrect or could be improved.
• Annually, an SFM Investment Plan is developed that demonstrates how resources are allocated and prioritized with regard to research, effectiveness monitoring, and adaptation of measures and targets in the SFMP.
• The SFM Investment Plan will seek to collaborate wherever possible with other associations having mutual interests in SFM. Examples include, The McGregor Model Forest Association, other industry partners, the Ft St John Pilot Project, the Forest Investment Account, and Government Agencies
• The results of the SFM Investment Plan will be reviewed on an annual basis.
• Adjustments to practices and/or targets are made as a result of the new information.
Changing social values or SFM criteria/standards.
• Periodic meetings are held with the Public Advisory Committee annually to gather local changes in public values over time.
• The annual performance management evaluation and review will take into account government policy and land base planning and zonation changes.
• Annual audits will be completed to verify compliance to the existing SFM Criteria/Standards.
• Adjustments to practices and/or targets are made if necessary.
Continual improvement includes the incorporation of new information and knowledge, the identification of other information gaps, and undertaking research to address such gaps. The incorporation of new knowledge and understanding allows for better management approaches to evolve. Continual improvement activities also include modifications to the adaptive management system as a result of what is learned from indicator monitoring. Indicator results provide a means to evaluate the achievement of objectives and to determine whether values are being maintained. This process may also reveal issues with the SFM system that requires adjustment to the SFM system in part, or as a whole.
Following the performance management evaluation and review, non-conformance issues related to organizational management and / or practices will be addressed within a "Management Adjustment Action Plan" which will be implemented by Canfor. If it is determined that non-conformances are related to issues regarding the SFM system a "SFM System Adjustment Action Plan" will be produced and implemented by Canfor.
The SFMP is intended to be delivered and implemented through the existing FMS organizational structure. Since the FMS is designed as a performance management loop, the SFMP will continuously improve, adjust and adapt to changing circumstances.
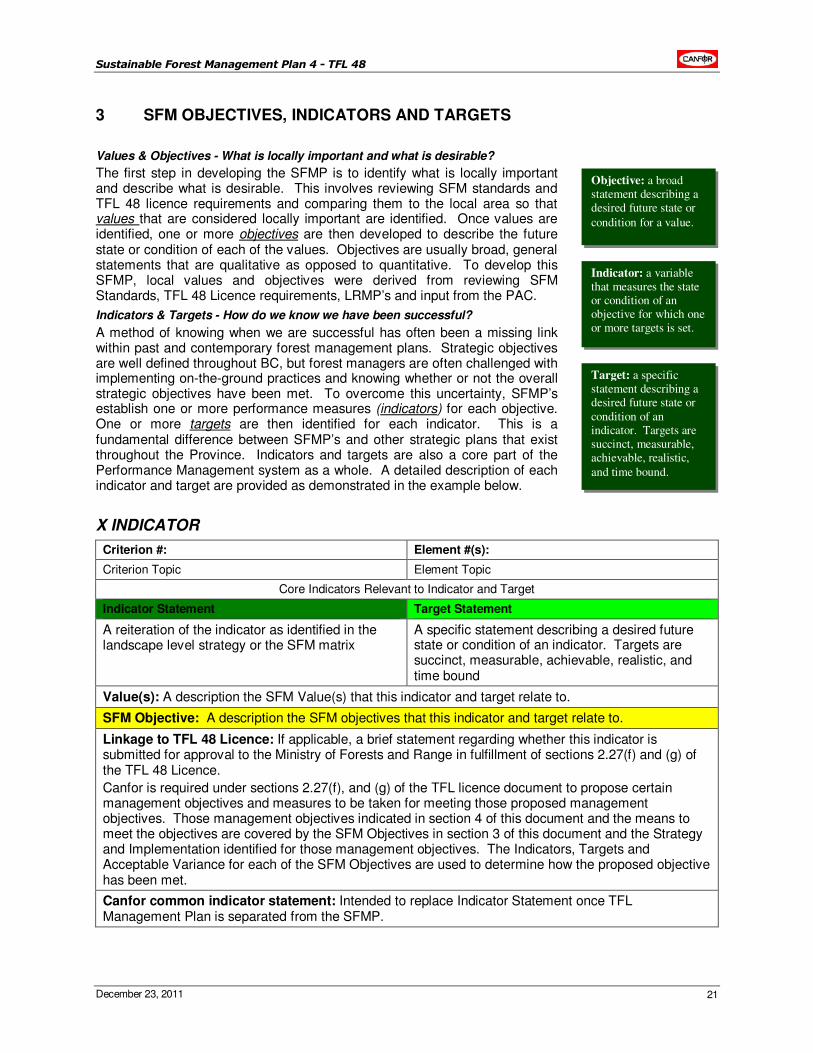
Sustainable Forest Management Plan 4 - TFL 48
December 23, 2011 21
3 SFM OBJECTIVES, INDICATORS AND TARGETS
Values & Objectives - What is locally important and what is desirable?
The first step in developing the SFMP is to identify what is locally important and describe what is desirable. This involves reviewing SFM standards and TFL 48 licence requirements and comparing them to the local area so that values that are considered locally important are identified. Once values are identified, one or more objectives are then developed to describe the future state or condition of each of the values. Objectives are usually broad, general statements that are qualitative as opposed to quantitative. To develop this SFMP, local values and objectives were derived from reviewing SFM Standards, TFL 48 Licence requirements, LRMP’s and input from the PAC.
Indicators & Targets - How do we know we have been successful?
A method of knowing when we are successful has often been a missing link within past and contemporary forest management plans. Strategic objectives are well defined throughout BC, but forest managers are often challenged with implementing on-the-ground practices and knowing whether or not the overall strategic objectives have been met. To overcome this uncertainty, SFMP’s establish one or more performance measures (indicators) for each objective. One or more targets are then identified for each indicator. This is a fundamental difference between SFMP’s and other strategic plans that exist throughout the Province. Indicators and targets are also a core part of the Performance Management system as a whole. A detailed description of each indicator and target are provided as demonstrated in the example below.
X INDICATOR
Criterion #: Element #(s):
Criterion Topic Element Topic
Core Indicators Relevant to Indicator and Target
Indicator Statement Target Statement
A reiteration of the indicator as identified in the landscape level strategy or the SFM matrix
A specific statement describing a desired future state or condition of an indicator. Targets are succinct, measurable, achievable, realistic, and time bound
Value(s): A description the SFM Value(s) that this indicator and target relate to.
SFM Objective: A description the SFM objectives that this indicator and target relate to.
Linkage to TFL 48 Licence: If applicable, a brief statement regarding whether this indicator is submitted for approval to the Ministry of Forests and Range in fulfillment of sections 2.27(f) and (g) of the TFL 48 Licence.
Canfor is required under sections 2.27(f), and (g) of the TFL licence document to propose certain management objectives and measures to be taken for meeting those proposed management objectives. Those management objectives indicated in section 4 of this document and the means to meet the objectives are covered by the SFM Objectives in section 3 of this document and the Strategy and Implementation identified for those management objectives. The Indicators, Targets and Acceptable Variance for each of the SFM Objectives are used to determine how the proposed objective has been met.
Canfor common indicator statement: Intended to replace Indicator Statement once TFL Management Plan is separated from the SFMP.
Objective: a broad statement describing a desired future state or
condition for a value.
Indicator: a variable that measures the state or condition of an objective for which one or more targets is set.
Target: a specific statement describing a desired future state or
condition of an indicator. Targets are succinct, measurable, achievable, realistic,
and time bound.
Sustainable Forest Management Plan 4 - TFL 48
December 23, 2011 22
ACCEPTABLE VARIANCE
This provides the acceptable variance from the desired level of the Indicator.
WHAT IS THIS INDICATOR AND WHY IS IT IMPORTANT?
A description of the indicator.
CURRENT STATUS
The information provided under this heading summarizes the current state (if known) and objective levels of the quantifiable indicator. This information will usually be summarized in table format by Natural Disturbance Unit and BEC sub zone, or whatever scale at which the objective is to be met. Where current and quantitative information is available for the indicator, that information will be presented here.
FORECASTING ASSUMPTIONS AND ANALYTICAL METHODS
CSA specifies that: a) quantitative and long-term projections of expected future indicator levels have been prepared; b) that the assumptions and analytic methods used in forecasting have been specified; and c) the public participation process was used to select the preferred forecast.
Where possible and when they exist, this section provides a summary of the forecasting assumptions and analytical methods used to project a variety of possible future forest conditions that could result from present forest management activities.
STRATEGY AND IMPLEMENTATION SCHEDULE
A description of the chosen strategy, including all significant actions to be undertaken and their associated implementation schedule.
MONITORING PROCEDURE
The information provided under this heading summarizes the sources of monitoring information, timing and frequency of monitoring to ensure that Canfor meet the targets.
LINKAGES TO OPERATIONAL PLANS
A demonstration of the links between short-term operational plans and the SFMP.
Classifying indicators is important because it helps us understand the variable we are attempting to measure and the data that is produced. Indicators can be divided into three groups: context, process, and response indicators (Duinker 2000):
• Context Indicators – These indicators measure the output of a system where the outcome cannot be controlled at the local level. An example is measuring climate variables such as temperature or precipitation. These indicators provide useful data to help us understand the context in which we operate, but provide little value within our SFMP because the outcome is not directly linked to our actions.
• Process Indicators – These indicators measure the output of an agreed upon practice or process. An example is measuring the number of seedlings planted in a given year or season. These indicators are usually very effective because it is relatively easy to establish targets and measure and record data. However, they are based on an assumption that the practice or process is correct in the first place. Further investigation and validation of the assumptions used can help mitigate these uncertainties and facilitate continuous improvement.
• Response Indicators – These indicators measure the output of a system as a direct response to actions applied. An example is the change in site index of a managed stand as various silviculture or harvesting practices are applied. These indicators are very useful but are often difficult to measure, or the results are difficult to interpret. The lack of knowledge of biological systems and/or the expense of providing meaningful results can be preventative in the short term. Gathering more knowledge about biological systems, coupled with technological improvements will aid in the development of these types of indicators.
To be effective, an SFMP should contain both process and response indicators. Once all SFM objectives are covered by one or more of these types of indicators, the addition of context indicators may provide enhanced value.
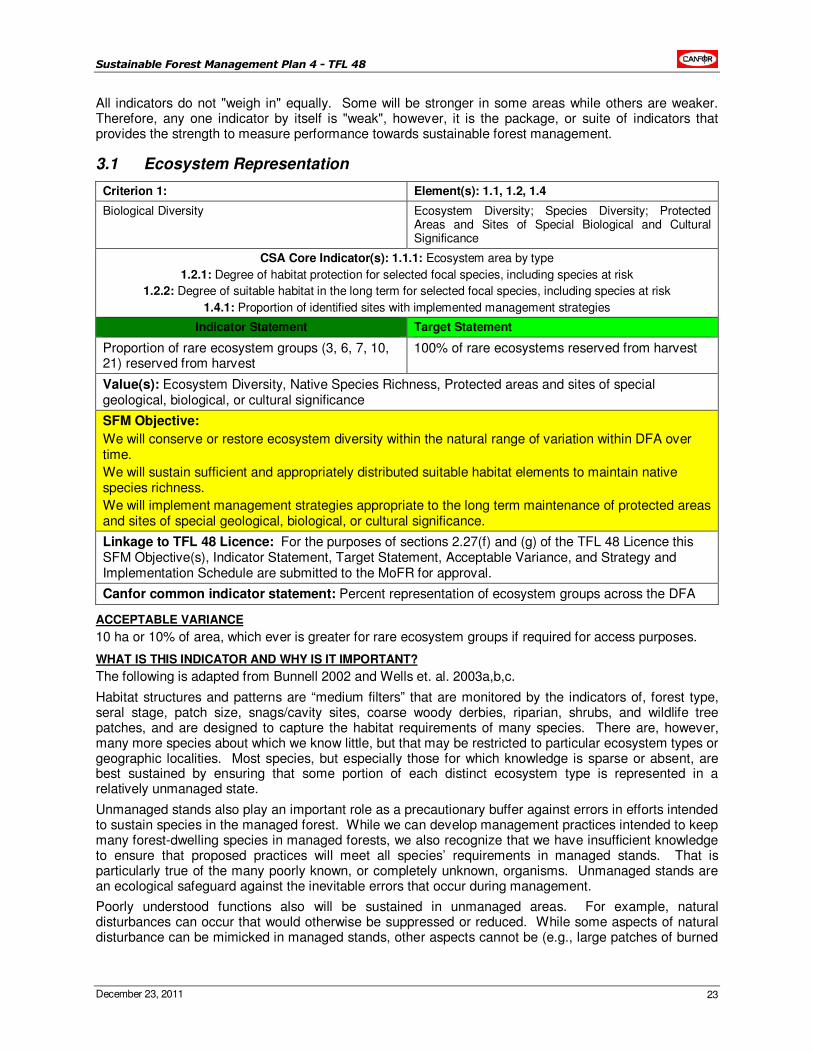
Sustainable Forest Management Plan 4 - TFL 48
December 23, 2011 23
All indicators do not "weigh in" equally. Some will be stronger in some areas while others are weaker. Therefore, any one indicator by itself is "weak", however, it is the package, or suite of indicators that provides the strength to measure performance towards sustainable forest management.
3.1 Ecosystem Representation
Criterion 1: Element(s): 1.1, 1.2, 1.4
Biological Diversity Ecosystem Diversity; Species Diversity; Protected Areas and Sites of Special Biological and Cultural Significance
CSA Core Indicator(s): 1.1.1: Ecosystem area by type
1.2.1: Degree of habitat protection for selected focal species, including species at risk
1.2.2: Degree of suitable habitat in the long term for selected focal species, including species at risk
1.4.1: Proportion of identified sites with implemented management strategies
Indicator Statement Target Statement
Proportion of rare ecosystem groups (3, 6, 7, 10, 21) reserved from harvest
100% of rare ecosystems reserved from harvest
Value(s): Ecosystem Diversity, Native Species Richness, Protected areas and sites of special geological, biological, or cultural significance
SFM Objective:
We will conserve or restore ecosystem diversity within the natural range of variation within DFA over time.
We will sustain sufficient and appropriately distributed suitable habitat elements to maintain native species richness.
We will implement management strategies appropriate to the long term maintenance of protected areas and sites of special geological, biological, or cultural significance.
Linkage to TFL 48 Licence: For the purposes of sections 2.27(f) and (g) of the TFL 48 Licence this SFM Objective(s), Indicator Statement, Target Statement, Acceptable Variance, and Strategy and Implementation Schedule are submitted to the MoFR for approval.
Canfor common indicator statement: Percent representation of ecosystem groups across the DFA
ACCEPTABLE VARIANCE
10 ha or 10% of area, which ever is greater for rare ecosystem groups if required for access purposes.
WHAT IS THIS INDICATOR AND WHY IS IT IMPORTANT?
The following is adapted from Bunnell 2002 and Wells et. al. 2003a,b,c.
Habitat structures and patterns are “medium filters” that are monitored by the indicators of, forest type, seral stage, patch size, snags/cavity sites, coarse woody derbies, riparian, shrubs, and wildlife tree patches, and are designed to capture the habitat requirements of many species. There are, however, many more species about which we know little, but that may be restricted to particular ecosystem types or geographic localities. Most species, but especially those for which knowledge is sparse or absent, are best sustained by ensuring that some portion of each distinct ecosystem type is represented in a relatively unmanaged state.
Unmanaged stands also play an important role as a precautionary buffer against errors in efforts intended to sustain species in the managed forest. While we can develop management practices intended to keep many forest-dwelling species in managed forests, we also recognize that we have insufficient knowledge to ensure that proposed practices will meet all species’ requirements in managed stands. That is particularly true of the many poorly known, or completely unknown, organisms. Unmanaged stands are an ecological safeguard against the inevitable errors that occur during management.
Poorly understood functions also will be sustained in unmanaged areas. For example, natural disturbances can occur that would otherwise be suppressed or reduced. While some aspects of natural disturbance can be mimicked in managed stands, other aspects cannot be (e.g., large patches of burned
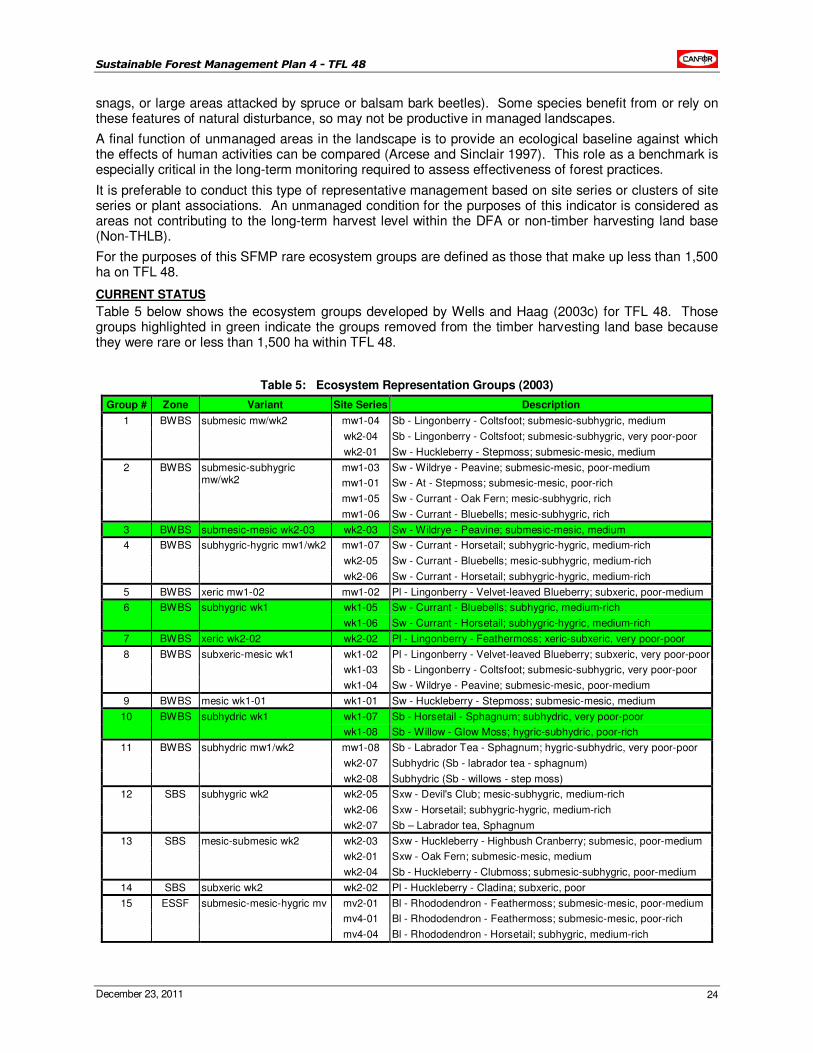
Sustainable Forest Management Plan 4 - TFL 48
December 23, 2011 24
snags, or large areas attacked by spruce or balsam bark beetles). Some species benefit from or rely on these features of natural disturbance, so may not be productive in managed landscapes.
A final function of unmanaged areas in the landscape is to provide an ecological baseline against which the effects of human activities can be compared (Arcese and Sinclair 1997). This role as a benchmark is especially critical in the long-term monitoring required to assess effectiveness of forest practices.
It is preferable to conduct this type of representative management based on site series or clusters of site series or plant associations. An unmanaged condition for the purposes of this indicator is considered as areas not contributing to the long-term harvest level within the DFA or non-timber harvesting land base (Non-THLB).
For the purposes of this SFMP rare ecosystem groups are defined as those that make up less than 1,500 ha on TFL 48.
CURRENT STATUS
Table 5 below shows the ecosystem groups developed by Wells and Haag (2003c) for TFL 48. Those groups highlighted in green indicate the groups removed from the timber harvesting land base because they were rare or less than 1,500 ha within TFL 48.
Table 5: Ecosystem Representation Groups (2003)
Group # Zone Variant Site Series Description
1 BWBS submesic mw/wk2 mw1-04 Sb - Lingonberry - Coltsfoot; submesic-subhygric, medium
wk2-04 Sb - Lingonberry - Coltsfoot; submesic-subhygric, very poor-poor
wk2-01 Sw - Huckleberry - Stepmoss; submesic-mesic, medium
2 BWBS submesic-subhygric mw/wk2
mw1-03 Sw - Wildrye - Peavine; submesic-mesic, poor-medium
mw1-01 Sw - At - Stepmoss; submesic-mesic, poor-rich
mw1-05 Sw - Currant - Oak Fern; mesic-subhygric, rich
mw1-06 Sw - Currant - Bluebells; mesic-subhygric, rich
3 BWBS submesic-mesic wk2-03 wk2-03 Sw - Wildrye - Peavine; submesic-mesic, medium
4 BWBS subhygric-hygric mw1/wk2 mw1-07 Sw - Currant - Horsetail; subhygric-hygric, medium-rich
wk2-05 Sw - Currant - Bluebells; mesic-subhygric, medium-rich
wk2-06 Sw - Currant - Horsetail; subhygric-hygric, medium-rich
5 BWBS xeric mw1-02 mw1-02 Pl - Lingonberry - Velvet-leaved Blueberry; subxeric, poor-medium
6 BWBS subhygric wk1 wk1-05 Sw - Currant - Bluebells; subhygric, medium-rich
wk1-06 Sw - Currant - Horsetail; subhygric-hygric, medium-rich
7 BWBS xeric wk2-02 wk2-02 Pl - Lingonberry - Feathermoss; xeric-subxeric, very poor-poor
8 BWBS subxeric-mesic wk1 wk1-02 Pl - Lingonberry - Velvet-leaved Blueberry; subxeric, very poor-poor
wk1-03 Sb - Lingonberry - Coltsfoot; submesic-subhygric, very poor-poor
wk1-04 Sw - Wildrye - Peavine; submesic-mesic, poor-medium
9 BWBS mesic wk1-01 wk1-01 Sw - Huckleberry - Stepmoss; submesic-mesic, medium
10 BWBS subhydric wk1 wk1-07 Sb - Horsetail - Sphagnum; subhydric, very poor-poor
wk1-08 Sb - Willow - Glow Moss; hygric-subhydric, poor-rich
11 BWBS subhydric mw1/wk2 mw1-08 Sb - Labrador Tea - Sphagnum; hygric-subhydric, very poor-poor
wk2-07 Subhydric (Sb - labrador tea - sphagnum)
wk2-08 Subhydric (Sb - willows - step moss)
12 SBS subhygric wk2 wk2-05 Sxw - Devil's Club; mesic-subhygric, medium-rich
wk2-06 Sxw - Horsetail; subhygric-hygric, medium-rich
wk2-07 Sb – Labrador tea, Sphagnum
13 SBS mesic-submesic wk2 wk2-03 Sxw - Huckleberry - Highbush Cranberry; submesic, poor-medium
wk2-01 Sxw - Oak Fern; submesic-mesic, medium
wk2-04 Sb - Huckleberry - Clubmoss; submesic-subhygric, poor-medium
14 SBS subxeric wk2 wk2-02 Pl - Huckleberry - Cladina; subxeric, poor
15 ESSF submesic-mesic-hygric mv mv2-01 Bl - Rhododendron - Feathermoss; submesic-mesic, poor-medium
mv4-01 Bl - Rhododendron - Feathermoss; submesic-mesic, poor-rich
mv4-04 Bl - Rhododendron - Horsetail; subhygric, medium-rich
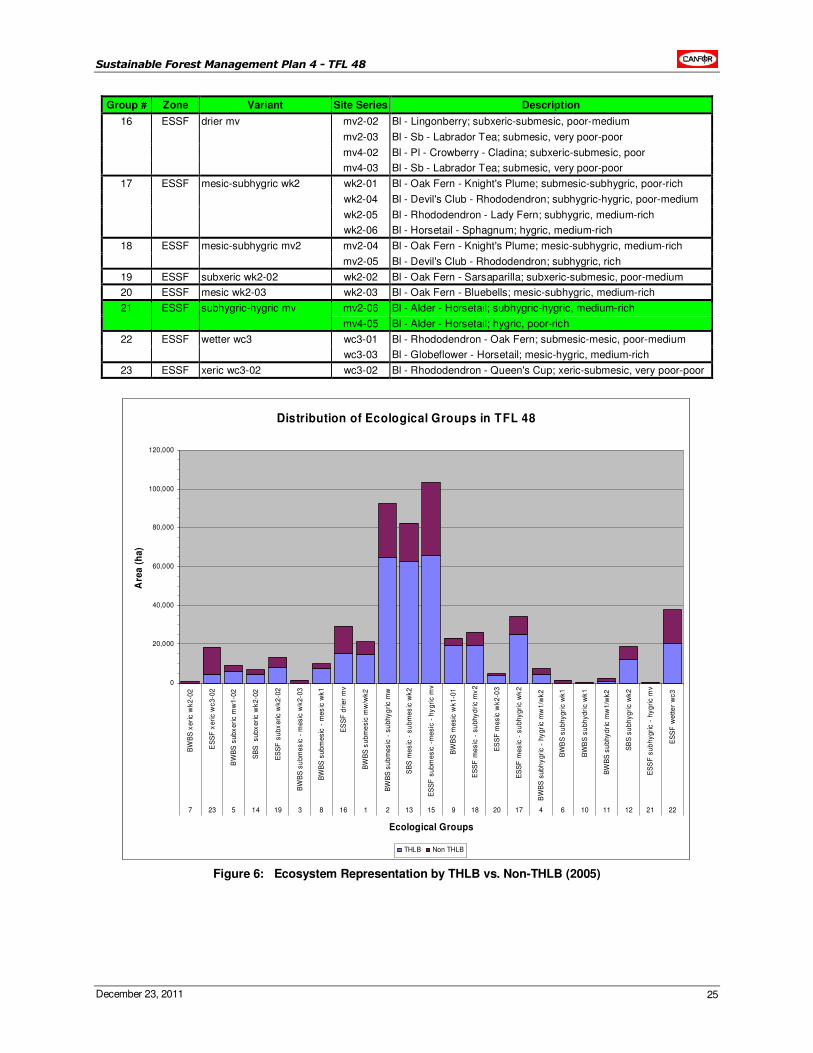
Sustainable Forest Management Plan 4 - TFL 48
December 23, 2011 25
Group # Zone Variant Site Series Description
16 ESSF drier mv mv2-02 Bl - Lingonberry; subxeric-submesic, poor-medium
mv2-03 Bl - Sb - Labrador Tea; submesic, very poor-poor
mv4-02 Bl - Pl - Crowberry - Cladina; subxeric-submesic, poor
mv4-03 Bl - Sb - Labrador Tea; submesic, very poor-poor
17 ESSF mesic-subhygric wk2 wk2-01 Bl - Oak Fern - Knight's Plume; submesic-subhygric, poor-rich
wk2-04 Bl - Devil's Club - Rhododendron; subhygric-hygric, poor-medium
wk2-05 Bl - Rhododendron - Lady Fern; subhygric, medium-rich
wk2-06 Bl - Horsetail - Sphagnum; hygric, medium-rich
18 ESSF mesic-subhygric mv2 mv2-04 Bl - Oak Fern - Knight's Plume; mesic-subhygric, medium-rich
mv2-05 Bl - Devil's Club - Rhododendron; subhygric, rich
19 ESSF subxeric wk2-02 wk2-02 Bl - Oak Fern - Sarsaparilla; subxeric-submesic, poor-medium
20 ESSF mesic wk2-03 wk2-03 Bl - Oak Fern - Bluebells; mesic-subhygric, medium-rich
21 ESSF subhygric-hygric mv mv2-06 Bl - Alder - Horsetail; subhygric-hygric, medium-rich
mv4-05 Bl - Alder - Horsetail; hygric, poor-rich
22 ESSF wetter wc3 wc3-01 Bl - Rhododendron - Oak Fern; submesic-mesic, poor-medium
wc3-03 Bl - Globeflower - Horsetail; mesic-hygric, medium-rich
23 ESSF xeric wc3-02 wc3-02 Bl - Rhododendron - Queen's Cup; xeric-submesic, very poor-poor
Distribution of Ecological Groups in TFL 48
0
20,000
40,000
60,000
80,000
100,000
120,000
BW
BS
xe
ric
wk
2-0
2
ES
SF
xe
ric
wc
3-0
2
BW
BS
su
bx
eri
c m
w1
-02
SB
S
su
bx
eri
c w
k2
-02
ES
SF
su
bx
eri
c w
k2
-02
BW
BS
su
bm
es
ic -
me
sic
wk
2-0
3
BW
BS
su
bm
es
ic -
me
sic
wk
1
ES
SF
dri
er
mv
BW
BS
su
bm
es
ic m
w/w
k2
BW
BS
su
bm
es
ic -
su
bh
yg
ric
mw
SB
S m
es
ic -
su
bm
es
ic w
k2
ES
SF
su
bm
es
ic -
me
sic
- h
yg
ric
mv
BW
BS
me
sic
wk
1-0
1
ES
SF
me
sic
- s
ub
hy
dri
c m
v2
ES
SF
me
sic
wk
2-0
3
ES
SF
me
sic
- s
ub
hy
gri
c w
k2
BW
BS
su
bh
yg
ric
- h
yg
ric
mw
1/w
k2
BW
BS
su
bh
yg
ric
wk
1
BW
BS
su
bh
yd
ric
wk
1
BW
BS
su
bh
yd
ric
mw
1/w
k2
SB
S s
ub
hy
gri
c w
k2
ES
SF
su
bh
yg
ric
- h
yg
ric
mv
ES
SF
we
tte
r w
c3
7 23 5 14 19 3 8 16 1 2 13 15 9 18 20 17 4 6 10 11 12 21 22
Ecological Groups
Are
a (
ha
)
THLB Non THLB
Figure 6: Ecosystem Representation by THLB vs. Non-THLB (2005)
Sustainable Forest Management Plan 4 - TFL 48
December 23, 2011 26
FORECASTING ASSUMPTIONS AND ANALYTICAL METHODS
• Does forecasting apply (y/n)? No
STRATEGY AND IMPLEMENTATION SCHEDULE
Setting aside a large percentage of the land base as unmanaged forest to ensure that biological richness is sustained is not compatible with economic and social objectives of managed forests. Fortunately, forest tenures in BC typically have 20% to 50% or more of the forest in an unmanaged state. This unmanaged area is of two types: 1) areas that are not harvested or are harvested only lightly because of concerns other than conserving biological diversity (e.g., operability, visual quality, watershed protection, favoured-species management
1); and 2) areas intentionally set aside to protect biological diversity (e.g.,
wildlife tree patches, riparian buffers). This unmanaged proportion of the land base exceeds the objective for protected areas of most jurisdictions (typically 12%, following the Brundtland commission), and is comparable to many recommendations derived from principles of conservation biology (e.g., 33 to 50%; Noss 1993; Sætersdal and Birks 1993; Stokland 1997; Soulé and Sanjayen 1998) (Bunnell 2002).
On the TFL 48 DFA, wholly constrained areas represent 35.8% of the forest. Area identified as rare ecosystems (those ecosystem groups with less than 1,500 ha in total) within TFL 48 represent 4,080 ha or 0.7% of the total forested land base and have been removed from the timber harvesting land base.
All cut block layout completed after June 2005 will incorporate an assessment of rare ecosystems into the fieldwork stage of development.
MONITORING PROCEDURE
This indicator is analyzed at each TSR. Ecosystem groups undergo an extensive review to see whether and by how much they contribute to timber supply. Depending on how much area of each group exists the group is either included or excluded from the timber harvesting land base. The current status was derived from the base case analysis definition of the timber harvesting land base conducted in support of SFMP 4.
During development of Forest Development Plans (FDP) or Forest Stewardship Plans (FSP’s) blocks are compared against the rare ecosystem data and activities identified where the presence of the rare ecosystem is confirmed. The results of the ground confirmation will be reported annually in the annual report.
LINKAGES TO OPERATIONAL PLANS
In order to ensure that 100% of the rare ecosystem groups are reserved from harvesting, the following actions will be undertaken.
• Prior to layout being conducted a map identifying the locations of rare ecosystems is compared to proposed road and block locations. The requirement to assess the block for absence or presence of rare ecosystems is tracked in Canfor’s forest information management system Genus (Task window of Cut Block Management System).
• The requirement to reserve rare ecosystems from harvest is reviewed with layout contractors during the pre-work stage. This will enable the contractors to identify any of the rare ecosystem sites during their fieldwork.
• Where rare ecosystem groups are identified the areas will be preserved from harvest or road construction by either removing from block or incorporating in WTP's.
1
Even though favoured species, such as caribou and Northern Goshawk, are a component of biological richness, such species-specific approaches can work against
sustaining all of biological diversity. It is important to assess how areas set aside for a single species contribute to the broader goals of representation.
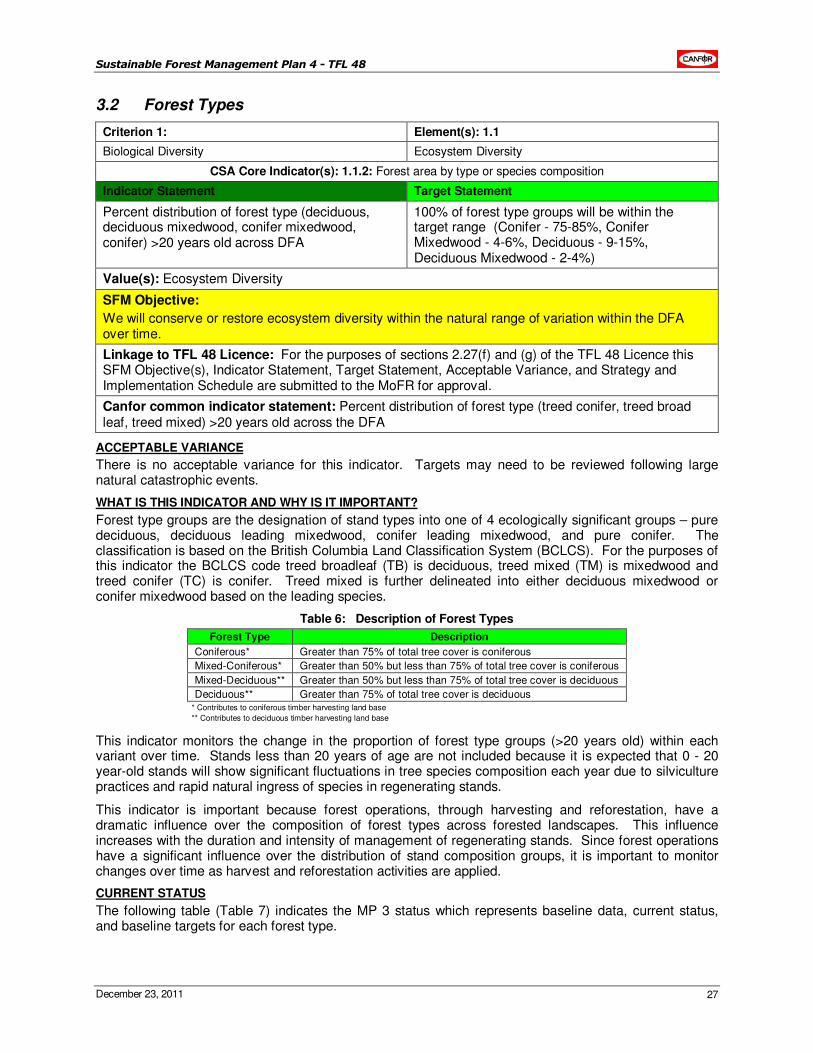
Sustainable Forest Management Plan 4 - TFL 48
December 23, 2011 27
3.2 Forest Types
Criterion 1: Element(s): 1.1
Biological Diversity Ecosystem Diversity
CSA Core Indicator(s): 1.1.2: Forest area by type or species composition
Indicator Statement Target Statement
Percent distribution of forest type (deciduous, deciduous mixedwood, conifer mixedwood, conifer) >20 years old across DFA
100% of forest type groups will be within the target range (Conifer - 75-85%, Conifer Mixedwood - 4-6%, Deciduous - 9-15%, Deciduous Mixedwood - 2-4%)
Value(s): Ecosystem Diversity
SFM Objective:
We will conserve or restore ecosystem diversity within the natural range of variation within the DFA over time.
Linkage to TFL 48 Licence: For the purposes of sections 2.27(f) and (g) of the TFL 48 Licence this SFM Objective(s), Indicator Statement, Target Statement, Acceptable Variance, and Strategy and Implementation Schedule are submitted to the MoFR for approval.
Canfor common indicator statement: Percent distribution of forest type (treed conifer, treed broad leaf, treed mixed) >20 years old across the DFA
ACCEPTABLE VARIANCE
There is no acceptable variance for this indicator. Targets may need to be reviewed following large natural catastrophic events.
WHAT IS THIS INDICATOR AND WHY IS IT IMPORTANT?
Forest type groups are the designation of stand types into one of 4 ecologically significant groups – pure deciduous, deciduous leading mixedwood, conifer leading mixedwood, and pure conifer. The classification is based on the British Columbia Land Classification System (BCLCS). For the purposes of this indicator the BCLCS code treed broadleaf (TB) is deciduous, treed mixed (TM) is mixedwood and treed conifer (TC) is conifer. Treed mixed is further delineated into either deciduous mixedwood or conifer mixedwood based on the leading species.
Table 6: Description of Forest Types
Forest Type Description
Coniferous* Greater than 75% of total tree cover is coniferous
Mixed-Coniferous* Greater than 50% but less than 75% of total tree cover is coniferous
Mixed-Deciduous** Greater than 50% but less than 75% of total tree cover is deciduous
Deciduous** Greater than 75% of total tree cover is deciduous * Contributes to coniferous timber harvesting land base
** Contributes to deciduous timber harvesting land base
This indicator monitors the change in the proportion of forest type groups (>20 years old) within each variant over time. Stands less than 20 years of age are not included because it is expected that 0 - 20 year-old stands will show significant fluctuations in tree species composition each year due to silviculture practices and rapid natural ingress of species in regenerating stands.
This indicator is important because forest operations, through harvesting and reforestation, have a dramatic influence over the composition of forest types across forested landscapes. This influence increases with the duration and intensity of management of regenerating stands. Since forest operations have a significant influence over the distribution of stand composition groups, it is important to monitor changes over time as harvest and reforestation activities are applied.
CURRENT STATUS
The following table (Table 7) indicates the MP 3 status which represents baseline data, current status, and baseline targets for each forest type.
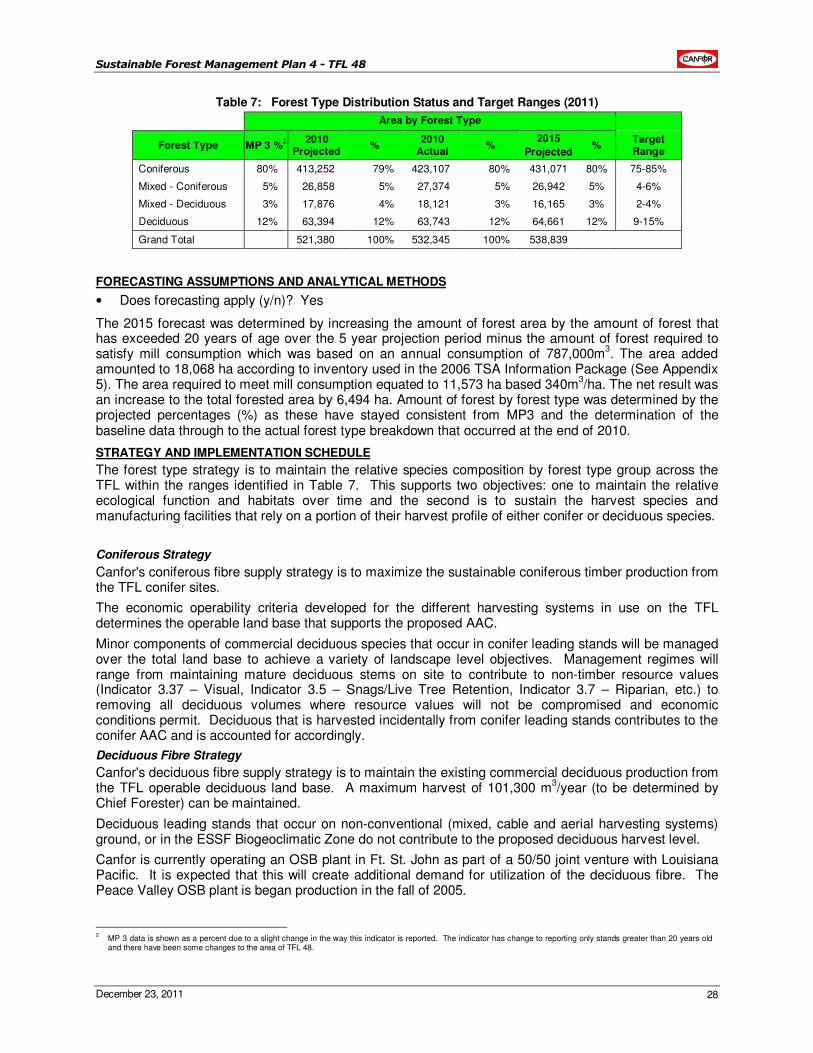
Sustainable Forest Management Plan 4 - TFL 48
December 23, 2011 28
Table 7: Forest Type Distribution Status and Target Ranges (2011)
Area by Forest Type
Forest Type MP 3 %2
2010 Projected
% 2010
Actual %
2015
Projected %
Target Range
Coniferous 80% 413,252 79% 423,107 80% 431,071 80% 75-85%
Mixed - Coniferous 5% 26,858 5% 27,374 5% 26,942 5% 4-6%
Mixed - Deciduous 3% 17,876 4% 18,121 3% 16,165 3% 2-4%
Deciduous 12% 63,394 12% 63,743 12% 64,661 12% 9-15%
Grand Total 521,380 100% 532,345 100% 538,839
FORECASTING ASSUMPTIONS AND ANALYTICAL METHODS
• Does forecasting apply (y/n)? Yes
The 2015 forecast was determined by increasing the amount of forest area by the amount of forest that has exceeded 20 years of age over the 5 year projection period minus the amount of forest required to satisfy mill consumption which was based on an annual consumption of 787,000m
3. The area added
amounted to 18,068 ha according to inventory used in the 2006 TSA Information Package (See Appendix 5). The area required to meet mill consumption equated to 11,573 ha based 340m
3/ha. The net result was
an increase to the total forested area by 6,494 ha. Amount of forest by forest type was determined by the projected percentages (%) as these have stayed consistent from MP3 and the determination of the baseline data through to the actual forest type breakdown that occurred at the end of 2010.
STRATEGY AND IMPLEMENTATION SCHEDULE
The forest type strategy is to maintain the relative species composition by forest type group across the TFL within the ranges identified in Table 7. This supports two objectives: one to maintain the relative ecological function and habitats over time and the second is to sustain the harvest species and manufacturing facilities that rely on a portion of their harvest profile of either conifer or deciduous species.
Coniferous Strategy
Canfor's coniferous fibre supply strategy is to maximize the sustainable coniferous timber production from the TFL conifer sites.
The economic operability criteria developed for the different harvesting systems in use on the TFL determines the operable land base that supports the proposed AAC.
Minor components of commercial deciduous species that occur in conifer leading stands will be managed over the total land base to achieve a variety of landscape level objectives. Management regimes will range from maintaining mature deciduous stems on site to contribute to non-timber resource values (Indicator 3.37 – Visual, Indicator 3.5 – Snags/Live Tree Retention, Indicator 3.7 – Riparian, etc.) to removing all deciduous volumes where resource values will not be compromised and economic conditions permit. Deciduous that is harvested incidentally from conifer leading stands contributes to the conifer AAC and is accounted for accordingly.
Deciduous Fibre Strategy
Canfor's deciduous fibre supply strategy is to maintain the existing commercial deciduous production from the TFL operable deciduous land base. A maximum harvest of 101,300 m
3/year (to be determined by
Chief Forester) can be maintained.
Deciduous leading stands that occur on non-conventional (mixed, cable and aerial harvesting systems) ground, or in the ESSF Biogeoclimatic Zone do not contribute to the proposed deciduous harvest level.
Canfor is currently operating an OSB plant in Ft. St. John as part of a 50/50 joint venture with Louisiana Pacific. It is expected that this will create additional demand for utilization of the deciduous fibre. The Peace Valley OSB plant is began production in the fall of 2005.
2 MP 3 data is shown as a percent due to a slight change in the way this indicator is reported. The indicator has change to reporting only stands greater than 20 years old
and there have been some changes to the area of TFL 48.
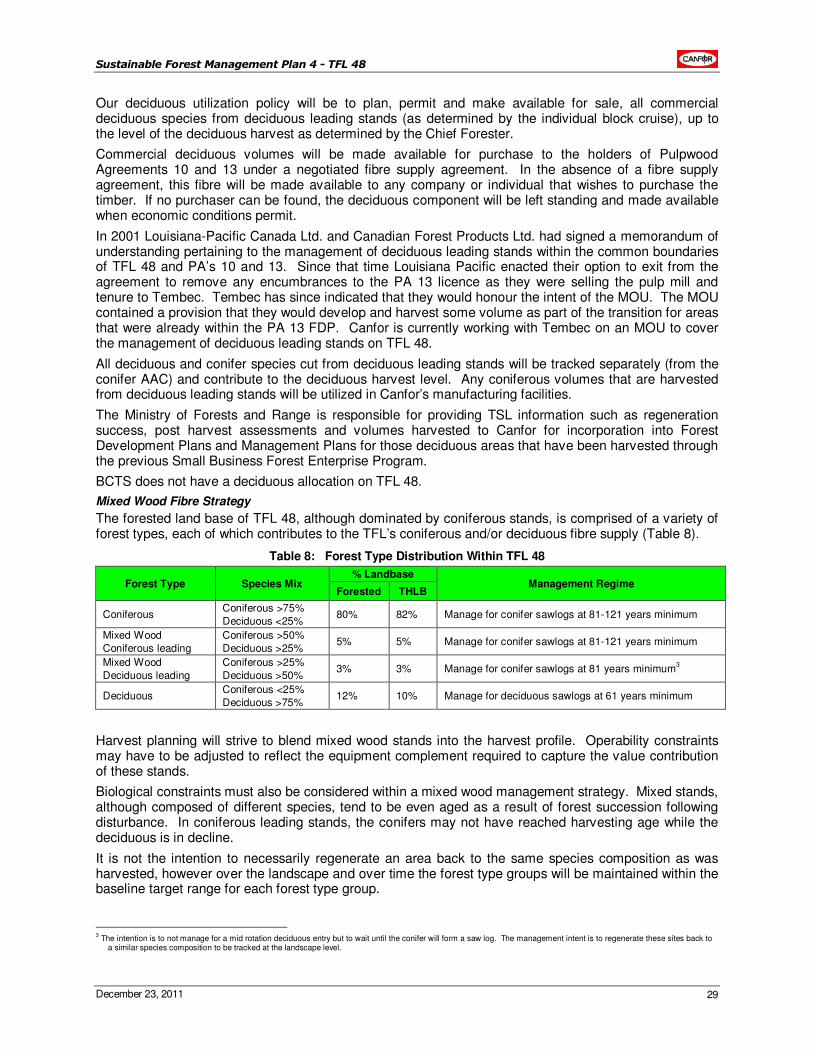
Sustainable Forest Management Plan 4 - TFL 48
December 23, 2011 29
Our deciduous utilization policy will be to plan, permit and make available for sale, all commercial deciduous species from deciduous leading stands (as determined by the individual block cruise), up to the level of the deciduous harvest as determined by the Chief Forester.
Commercial deciduous volumes will be made available for purchase to the holders of Pulpwood Agreements 10 and 13 under a negotiated fibre supply agreement. In the absence of a fibre supply agreement, this fibre will be made available to any company or individual that wishes to purchase the timber. If no purchaser can be found, the deciduous component will be left standing and made available when economic conditions permit.
In 2001 Louisiana-Pacific Canada Ltd. and Canadian Forest Products Ltd. had signed a memorandum of understanding pertaining to the management of deciduous leading stands within the common boundaries of TFL 48 and PA’s 10 and 13. Since that time Louisiana Pacific enacted their option to exit from the agreement to remove any encumbrances to the PA 13 licence as they were selling the pulp mill and tenure to Tembec. Tembec has since indicated that they would honour the intent of the MOU. The MOU contained a provision that they would develop and harvest some volume as part of the transition for areas that were already within the PA 13 FDP. Canfor is currently working with Tembec on an MOU to cover the management of deciduous leading stands on TFL 48.
All deciduous and conifer species cut from deciduous leading stands will be tracked separately (from the conifer AAC) and contribute to the deciduous harvest level. Any coniferous volumes that are harvested from deciduous leading stands will be utilized in Canfor’s manufacturing facilities.
The Ministry of Forests and Range is responsible for providing TSL information such as regeneration success, post harvest assessments and volumes harvested to Canfor for incorporation into Forest Development Plans and Management Plans for those deciduous areas that have been harvested through the previous Small Business Forest Enterprise Program.
BCTS does not have a deciduous allocation on TFL 48.
Mixed Wood Fibre Strategy
The forested land base of TFL 48, although dominated by coniferous stands, is comprised of a variety of forest types, each of which contributes to the TFL’s coniferous and/or deciduous fibre supply (Table 8).
Table 8: Forest Type Distribution Within TFL 48
Forest Type Species Mix % Landbase
Management Regime Forested THLB
Coniferous Coniferous >75%
Deciduous <25% 80% 82% Manage for conifer sawlogs at 81-121 years minimum
Mixed Wood
Coniferous leading
Coniferous >50%
Deciduous >25% 5% 5% Manage for conifer sawlogs at 81-121 years minimum
Mixed Wood
Deciduous leading
Coniferous >25%
Deciduous >50% 3% 3% Manage for conifer sawlogs at 81 years minimum
3
Deciduous Coniferous <25%
Deciduous >75% 12% 10% Manage for deciduous sawlogs at 61 years minimum
Harvest planning will strive to blend mixed wood stands into the harvest profile. Operability constraints may have to be adjusted to reflect the equipment complement required to capture the value contribution of these stands.
Biological constraints must also be considered within a mixed wood management strategy. Mixed stands, although composed of different species, tend to be even aged as a result of forest succession following disturbance. In coniferous leading stands, the conifers may not have reached harvesting age while the deciduous is in decline.
It is not the intention to necessarily regenerate an area back to the same species composition as was harvested, however over the landscape and over time the forest type groups will be maintained within the baseline target range for each forest type group.
3 The intention is to not manage for a mid rotation deciduous entry but to wait until the conifer will form a saw log. The management intent is to regenerate these sites back to
a similar species composition to be tracked at the landscape level.
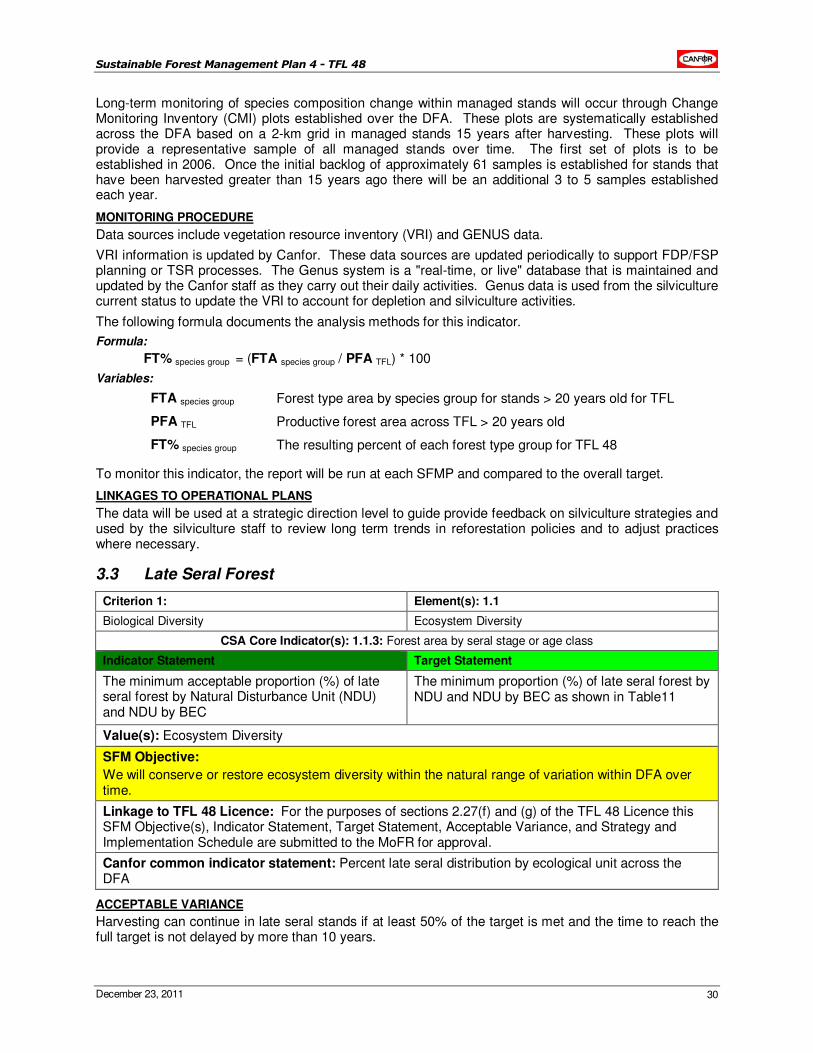
Sustainable Forest Management Plan 4 - TFL 48
December 23, 2011 30
Long-term monitoring of species composition change within managed stands will occur through Change Monitoring Inventory (CMI) plots established over the DFA. These plots are systematically established across the DFA based on a 2-km grid in managed stands 15 years after harvesting. These plots will provide a representative sample of all managed stands over time. The first set of plots is to be established in 2006. Once the initial backlog of approximately 61 samples is established for stands that have been harvested greater than 15 years ago there will be an additional 3 to 5 samples established each year.
MONITORING PROCEDURE
Data sources include vegetation resource inventory (VRI) and GENUS data.
VRI information is updated by Canfor. These data sources are updated periodically to support FDP/FSP planning or TSR processes. The Genus system is a "real-time, or live" database that is maintained and updated by the Canfor staff as they carry out their daily activities. Genus data is used from the silviculture current status to update the VRI to account for depletion and silviculture activities.
The following formula documents the analysis methods for this indicator.
Formula:
FT% species group = (FTA species group / PFA TFL) * 100
Variables:
FTA species group Forest type area by species group for stands > 20 years old for TFL
PFA TFL Productive forest area across TFL > 20 years old
FT% species group The resulting percent of each forest type group for TFL 48
To monitor this indicator, the report will be run at each SFMP and compared to the overall target.
LINKAGES TO OPERATIONAL PLANS
The data will be used at a strategic direction level to guide provide feedback on silviculture strategies and used by the silviculture staff to review long term trends in reforestation policies and to adjust practices where necessary.
3.3 Late Seral Forest
Criterion 1: Element(s): 1.1
Biological Diversity Ecosystem Diversity
CSA Core Indicator(s): 1.1.3: Forest area by seral stage or age class
Indicator Statement Target Statement
The minimum acceptable proportion (%) of late seral forest by Natural Disturbance Unit (NDU) and NDU by BEC
The minimum proportion (%) of late seral forest by NDU and NDU by BEC as shown in Table11
Value(s): Ecosystem Diversity
SFM Objective:
We will conserve or restore ecosystem diversity within the natural range of variation within DFA over time.
Linkage to TFL 48 Licence: For the purposes of sections 2.27(f) and (g) of the TFL 48 Licence this SFM Objective(s), Indicator Statement, Target Statement, Acceptable Variance, and Strategy and Implementation Schedule are submitted to the MoFR for approval.
Canfor common indicator statement: Percent late seral distribution by ecological unit across the DFA
ACCEPTABLE VARIANCE
Harvesting can continue in late seral stands if at least 50% of the target is met and the time to reach the full target is not delayed by more than 10 years.
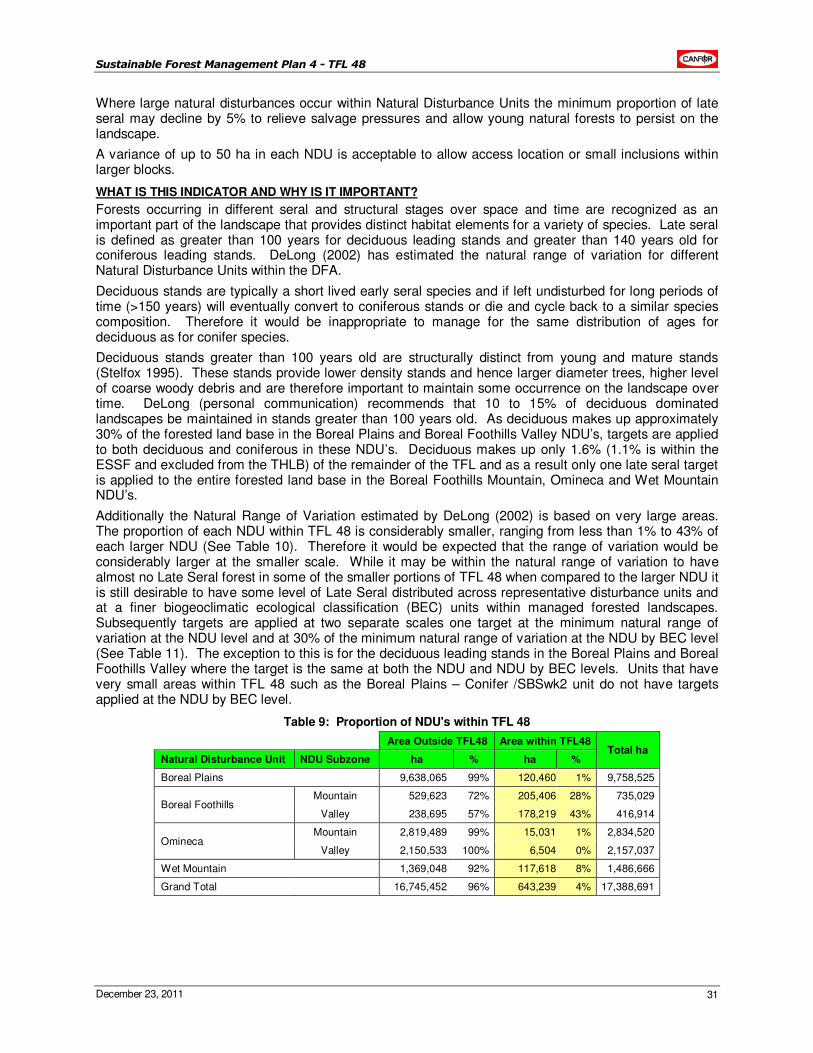
Sustainable Forest Management Plan 4 - TFL 48
December 23, 2011 31
Where large natural disturbances occur within Natural Disturbance Units the minimum proportion of late seral may decline by 5% to relieve salvage pressures and allow young natural forests to persist on the landscape.
A variance of up to 50 ha in each NDU is acceptable to allow access location or small inclusions within larger blocks.
WHAT IS THIS INDICATOR AND WHY IS IT IMPORTANT?
Forests occurring in different seral and structural stages over space and time are recognized as an important part of the landscape that provides distinct habitat elements for a variety of species. Late seral is defined as greater than 100 years for deciduous leading stands and greater than 140 years old for coniferous leading stands. DeLong (2002) has estimated the natural range of variation for different Natural Disturbance Units within the DFA.
Deciduous stands are typically a short lived early seral species and if left undisturbed for long periods of time (>150 years) will eventually convert to coniferous stands or die and cycle back to a similar species composition. Therefore it would be inappropriate to manage for the same distribution of ages for deciduous as for conifer species.
Deciduous stands greater than 100 years old are structurally distinct from young and mature stands (Stelfox 1995). These stands provide lower density stands and hence larger diameter trees, higher level of coarse woody debris and are therefore important to maintain some occurrence on the landscape over time. DeLong (personal communication) recommends that 10 to 15% of deciduous dominated landscapes be maintained in stands greater than 100 years old. As deciduous makes up approximately 30% of the forested land base in the Boreal Plains and Boreal Foothills Valley NDU’s, targets are applied to both deciduous and coniferous in these NDU’s. Deciduous makes up only 1.6% (1.1% is within the ESSF and excluded from the THLB) of the remainder of the TFL and as a result only one late seral target is applied to the entire forested land base in the Boreal Foothills Mountain, Omineca and Wet Mountain NDU’s.
Additionally the Natural Range of Variation estimated by DeLong (2002) is based on very large areas. The proportion of each NDU within TFL 48 is considerably smaller, ranging from less than 1% to 43% of each larger NDU (See Table 10). Therefore it would be expected that the range of variation would be considerably larger at the smaller scale. While it may be within the natural range of variation to have almost no Late Seral forest in some of the smaller portions of TFL 48 when compared to the larger NDU it is still desirable to have some level of Late Seral distributed across representative disturbance units and at a finer biogeoclimatic ecological classification (BEC) units within managed forested landscapes. Subsequently targets are applied at two separate scales one target at the minimum natural range of variation at the NDU level and at 30% of the minimum natural range of variation at the NDU by BEC level (See Table 11). The exception to this is for the deciduous leading stands in the Boreal Plains and Boreal Foothills Valley where the target is the same at both the NDU and NDU by BEC levels. Units that have very small areas within TFL 48 such as the Boreal Plains – Conifer /SBSwk2 unit do not have targets applied at the NDU by BEC level.
Table 9: Proportion of NDU's within TFL 48
Area Outside TFL48 Area within TFL48 Total ha
Natural Disturbance Unit NDU Subzone ha % ha %
Boreal Plains 9,638,065 99% 120,460 1% 9,758,525
Boreal Foothills Mountain 529,623 72% 205,406 28% 735,029
Valley 238,695 57% 178,219 43% 416,914
Omineca Mountain 2,819,489 99% 15,031 1% 2,834,520
Valley 2,150,533 100% 6,504 0% 2,157,037
Wet Mountain 1,369,048 92% 117,618 8% 1,486,666
Grand Total 16,745,452 96% 643,239 4% 17,388,691
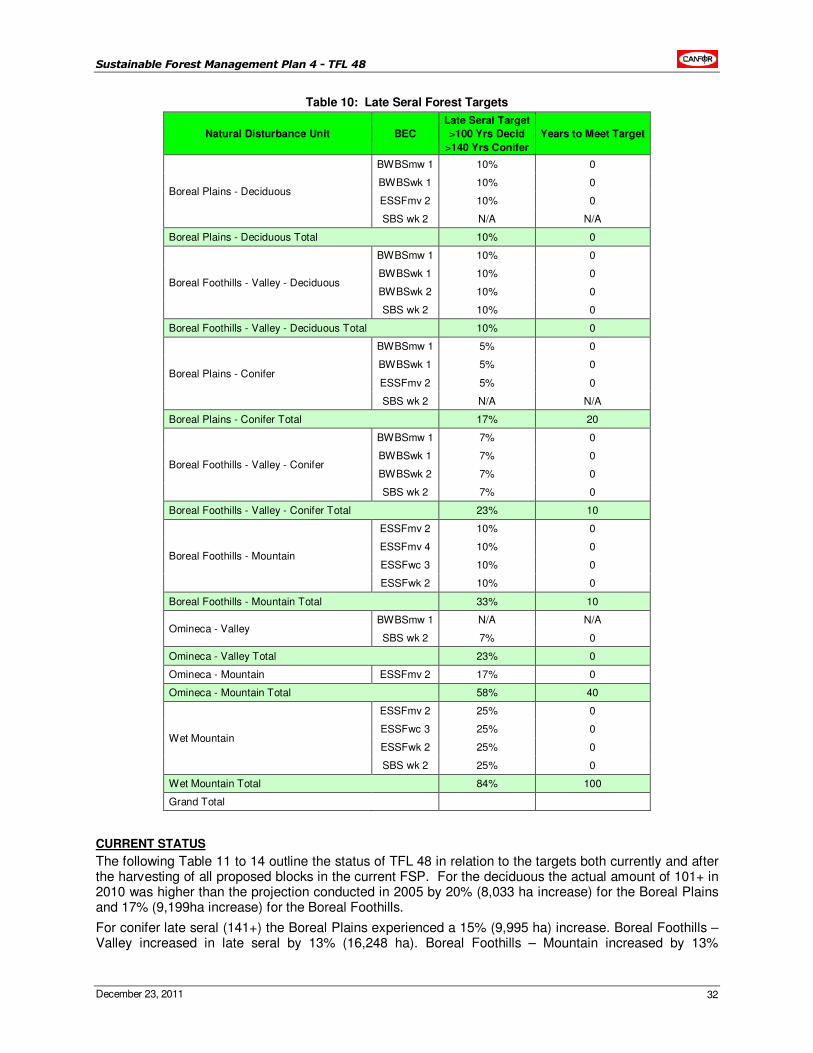
Sustainable Forest Management Plan 4 - TFL 48
December 23, 2011 32
Table 10: Late Seral Forest Targets
Natural Disturbance Unit BEC
Late Seral Target
>100 Yrs Decid
>140 Yrs Conifer
Years to Meet Target
Boreal Plains - Deciduous
BWBSmw 1 10% 0
BWBSwk 1 10% 0
ESSFmv 2 10% 0
SBS wk 2 N/A N/A
Boreal Plains - Deciduous Total 10% 0
Boreal Foothills - Valley - Deciduous
BWBSmw 1 10% 0
BWBSwk 1 10% 0
BWBSwk 2 10% 0
SBS wk 2 10% 0
Boreal Foothills - Valley - Deciduous Total 10% 0
Boreal Plains - Conifer
BWBSmw 1 5% 0
BWBSwk 1 5% 0
ESSFmv 2 5% 0
SBS wk 2 N/A N/A
Boreal Plains - Conifer Total 17% 20
Boreal Foothills - Valley - Conifer
BWBSmw 1 7% 0
BWBSwk 1 7% 0
BWBSwk 2 7% 0
SBS wk 2 7% 0
Boreal Foothills - Valley - Conifer Total 23% 10
Boreal Foothills - Mountain
ESSFmv 2 10% 0
ESSFmv 4 10% 0
ESSFwc 3 10% 0
ESSFwk 2 10% 0
Boreal Foothills - Mountain Total 33% 10
Omineca - Valley BWBSmw 1 N/A N/A
SBS wk 2 7% 0
Omineca - Valley Total 23% 0
Omineca - Mountain ESSFmv 2 17% 0
Omineca - Mountain Total 58% 40
Wet Mountain
ESSFmv 2 25% 0
ESSFwc 3 25% 0
ESSFwk 2 25% 0
SBS wk 2 25% 0
Wet Mountain Total 84% 100
Grand Total
CURRENT STATUS
The following Table 11 to 14 outline the status of TFL 48 in relation to the targets both currently and after the harvesting of all proposed blocks in the current FSP. For the deciduous the actual amount of 101+ in 2010 was higher than the projection conducted in 2005 by 20% (8,033 ha increase) for the Boreal Plains and 17% (9,199ha increase) for the Boreal Foothills.
For conifer late seral (141+) the Boreal Plains experienced a 15% (9,995 ha) increase. Boreal Foothills – Valley increased in late seral by 13% (16,248 ha). Boreal Foothills – Mountain increased by 13%

Sustainable Forest Management Plan 4 - TFL 48
December 23, 2011 33
(18,566ha). Omineca – Valley increased by 16% (991ha). Omineca – Mountain increased 20% (2,520ha). Wet Mountain increased by 14% (9,089ha). Overall there was a consistent increase in late seral for both conifer and deciduous.
Only two areas currently do not meet the late seral targets and those are Omineca Mountain and Wet Mountain conifer. The NDU and BEC all currently meet the NDU target however when statistics are rolled up for both these areas they are lower than the identified targets (58% and 84% late seral). When this indicator was first developed/introduced in 2005 these two areas were at that time not meeting the indicated targets. Since 2005 there has been a steady increase in the amount of late seral for these two units and in 2010 operations exceeded the 2010 projections on reducing the deficit of late seral.
The projections of late seral out to 2015 all show increasing trends with the exception of Boreal Foothills - Valley conifer which decreases from the 2010 actual by 1%. This unit consists of sufficient late seral to experience a minor decrease in future late seral.
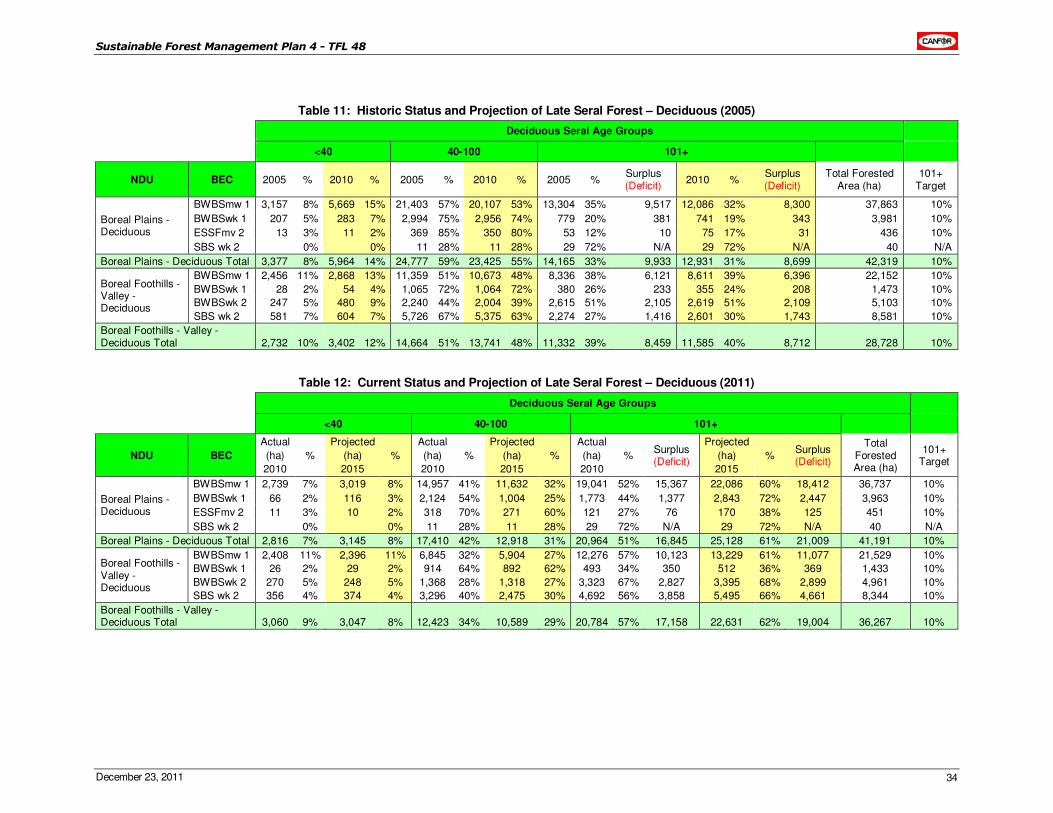
Sustainable Forest Management Plan 4 - TFL 48
December 23, 2011 34
Table 11: Historic Status and Projection of Late Seral Forest – Deciduous (2005)
Deciduous Seral Age Groups
<40 40-100 101+
NDU BEC 2005 % 2010 % 2005 % 2010 % 2005 % Surplus (Deficit)
2010 % Surplus (Deficit)
Total Forested Area (ha)
101+ Target
Boreal Plains - Deciduous
BWBSmw 1 3,157 8% 5,669 15% 21,403 57% 20,107 53% 13,304 35% 9,517 12,086 32% 8,300 37,863 10%
BWBSwk 1 207 5% 283 7% 2,994 75% 2,956 74% 779 20% 381 741 19% 343 3,981 10%
ESSFmv 2 13 3% 11 2% 369 85% 350 80% 53 12% 10 75 17% 31 436 10%
SBS wk 2 0% 0% 11 28% 11 28% 29 72% N/A 29 72% N/A 40 N/A
Boreal Plains - Deciduous Total 3,377 8% 5,964 14% 24,777 59% 23,425 55% 14,165 33% 9,933 12,931 31% 8,699 42,319 10%
Boreal Foothills - Valley - Deciduous
BWBSmw 1 2,456 11% 2,868 13% 11,359 51% 10,673 48% 8,336 38% 6,121 8,611 39% 6,396 22,152 10%
BWBSwk 1 28 2% 54 4% 1,065 72% 1,064 72% 380 26% 233 355 24% 208 1,473 10%
BWBSwk 2 247 5% 480 9% 2,240 44% 2,004 39% 2,615 51% 2,105 2,619 51% 2,109 5,103 10%
SBS wk 2 581 7% 604 7% 5,726 67% 5,375 63% 2,274 27% 1,416 2,601 30% 1,743 8,581 10%
Boreal Foothills - Valley - Deciduous Total 2,732 10% 3,402 12% 14,664 51% 13,741 48% 11,332 39% 8,459 11,585 40% 8,712 28,728 10%
Table 12: Current Status and Projection of Late Seral Forest – Deciduous (2011)
Deciduous Seral Age Groups
<40 40-100 101+
NDU BEC
Actual
(ha)
2010
%
Projected
(ha)
2015
%
Actual
(ha)
2010
%
Projected
(ha)
2015
%
Actual
(ha)
2010
% Surplus (Deficit)
Projected
(ha)
2015
% Surplus (Deficit)
Total Forested Area (ha)
101+ Target
Boreal Plains - Deciduous
BWBSmw 1 2,739 7% 3,019 8% 14,957 41% 11,632 32% 19,041 52% 15,367 22,086 60% 18,412 36,737 10%
BWBSwk 1 66 2% 116 3% 2,124 54% 1,004 25% 1,773 44% 1,377 2,843 72% 2,447 3,963 10%
ESSFmv 2 11 3% 10 2% 318 70% 271 60% 121 27% 76 170 38% 125 451 10%
SBS wk 2 0% 0% 11 28% 11 28% 29 72% N/A 29 72% N/A 40 N/A
Boreal Plains - Deciduous Total 2,816 7% 3,145 8% 17,410 42% 12,918 31% 20,964 51% 16,845 25,128 61% 21,009 41,191 10%
Boreal Foothills - Valley - Deciduous
BWBSmw 1 2,408 11% 2,396 11% 6,845 32% 5,904 27% 12,276 57% 10,123 13,229 61% 11,077 21,529 10%
BWBSwk 1 26 2% 29 2% 914 64% 892 62% 493 34% 350 512 36% 369 1,433 10%
BWBSwk 2 270 5% 248 5% 1,368 28% 1,318 27% 3,323 67% 2,827 3,395 68% 2,899 4,961 10%
SBS wk 2 356 4% 374 4% 3,296 40% 2,475 30% 4,692 56% 3,858 5,495 66% 4,661 8,344 10%
Boreal Foothills - Valley - Deciduous Total 3,060 9% 3,047 8% 12,423 34% 10,589 29% 20,784 57% 17,158 22,631 62% 19,004 36,267 10%
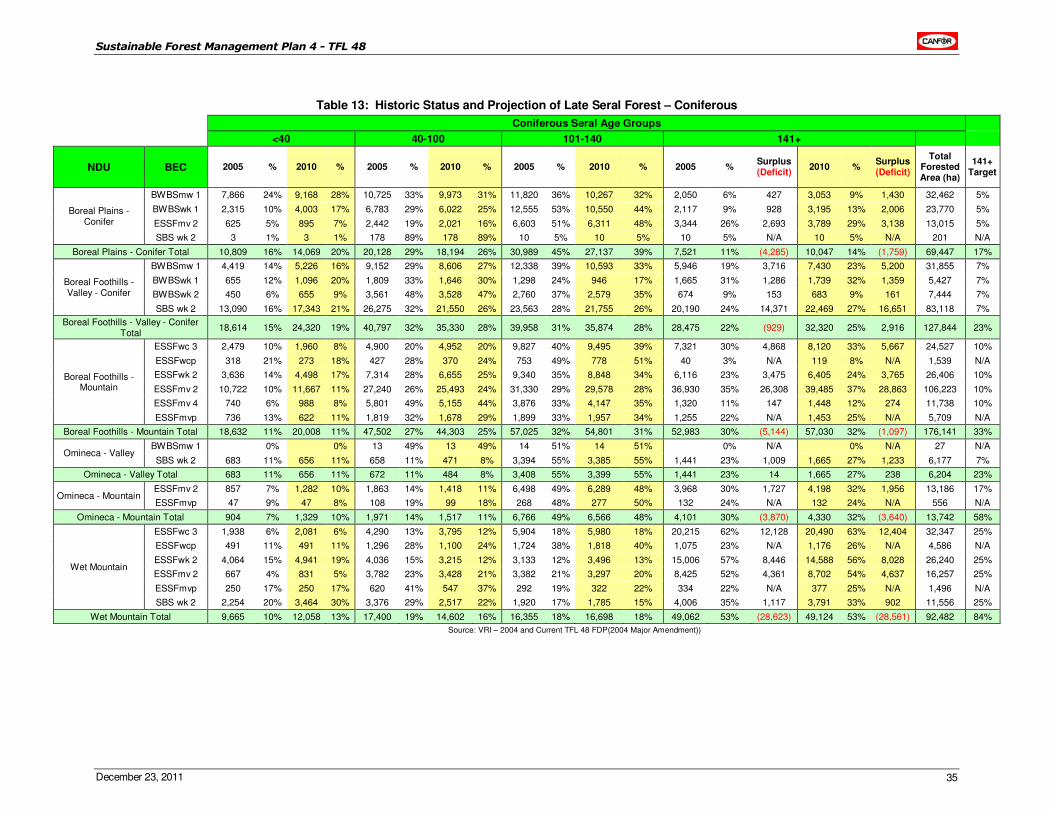
Sustainable Forest Management Plan 4 - TFL 48
December 23, 2011 35
Table 13: Historic Status and Projection of Late Seral Forest – Coniferous
Coniferous Seral Age Groups
<40 40-100 101-140 141+
NDU BEC 2005 % 2010 % 2005 % 2010 % 2005 % 2010 % 2005 % Surplus (Deficit)
2010 % Surplus (Deficit)
Total Forested Area (ha)
141+ Target
Boreal Plains - Conifer
BWBSmw 1 7,866 24% 9,168 28% 10,725 33% 9,973 31% 11,820 36% 10,267 32% 2,050 6% 427 3,053 9% 1,430 32,462 5%
BWBSwk 1 2,315 10% 4,003 17% 6,783 29% 6,022 25% 12,555 53% 10,550 44% 2,117 9% 928 3,195 13% 2,006 23,770 5%
ESSFmv 2 625 5% 895 7% 2,442 19% 2,021 16% 6,603 51% 6,311 48% 3,344 26% 2,693 3,789 29% 3,138 13,015 5%
SBS wk 2 3 1% 3 1% 178 89% 178 89% 10 5% 10 5% 10 5% N/A 10 5% N/A 201 N/A
Boreal Plains - Conifer Total 10,809 16% 14,069 20% 20,128 29% 18,194 26% 30,989 45% 27,137 39% 7,521 11% (4,285) 10,047 14% (1,759) 69,447 17%
Boreal Foothills - Valley - Conifer
BWBSmw 1 4,419 14% 5,226 16% 9,152 29% 8,606 27% 12,338 39% 10,593 33% 5,946 19% 3,716 7,430 23% 5,200 31,855 7%
BWBSwk 1 655 12% 1,096 20% 1,809 33% 1,646 30% 1,298 24% 946 17% 1,665 31% 1,286 1,739 32% 1,359 5,427 7%
BWBSwk 2 450 6% 655 9% 3,561 48% 3,528 47% 2,760 37% 2,579 35% 674 9% 153 683 9% 161 7,444 7%
SBS wk 2 13,090 16% 17,343 21% 26,275 32% 21,550 26% 23,563 28% 21,755 26% 20,190 24% 14,371 22,469 27% 16,651 83,118 7%
Boreal Foothills - Valley - Conifer Total
18,614 15% 24,320 19% 40,797 32% 35,330 28% 39,958 31% 35,874 28% 28,475 22% (929) 32,320 25% 2,916 127,844 23%
Boreal Foothills - Mountain
ESSFwc 3 2,479 10% 1,960 8% 4,900 20% 4,952 20% 9,827 40% 9,495 39% 7,321 30% 4,868 8,120 33% 5,667 24,527 10%
ESSFwcp 318 21% 273 18% 427 28% 370 24% 753 49% 778 51% 40 3% N/A 119 8% N/A 1,539 N/A
ESSFwk 2 3,636 14% 4,498 17% 7,314 28% 6,655 25% 9,340 35% 8,848 34% 6,116 23% 3,475 6,405 24% 3,765 26,406 10%
ESSFmv 2 10,722 10% 11,667 11% 27,240 26% 25,493 24% 31,330 29% 29,578 28% 36,930 35% 26,308 39,485 37% 28,863 106,223 10%
ESSFmv 4 740 6% 988 8% 5,801 49% 5,155 44% 3,876 33% 4,147 35% 1,320 11% 147 1,448 12% 274 11,738 10%
ESSFmvp 736 13% 622 11% 1,819 32% 1,678 29% 1,899 33% 1,957 34% 1,255 22% N/A 1,453 25% N/A 5,709 N/A
Boreal Foothills - Mountain Total 18,632 11% 20,008 11% 47,502 27% 44,303 25% 57,025 32% 54,801 31% 52,983 30% (5,144) 57,030 32% (1,097) 176,141 33%
Omineca - Valley BWBSmw 1 0% 0% 13 49% 13 49% 14 51% 14 51% 0% N/A 0% N/A 27 N/A
SBS wk 2 683 11% 656 11% 658 11% 471 8% 3,394 55% 3,385 55% 1,441 23% 1,009 1,665 27% 1,233 6,177 7%
Omineca - Valley Total 683 11% 656 11% 672 11% 484 8% 3,408 55% 3,399 55% 1,441 23% 14 1,665 27% 238 6,204 23%
Omineca - Mountain ESSFmv 2 857 7% 1,282 10% 1,863 14% 1,418 11% 6,498 49% 6,289 48% 3,968 30% 1,727 4,198 32% 1,956 13,186 17%
ESSFmvp 47 9% 47 8% 108 19% 99 18% 268 48% 277 50% 132 24% N/A 132 24% N/A 556 N/A
Omineca - Mountain Total 904 7% 1,329 10% 1,971 14% 1,517 11% 6,766 49% 6,566 48% 4,101 30% (3,870) 4,330 32% (3,640) 13,742 58%
Wet Mountain
ESSFwc 3 1,938 6% 2,081 6% 4,290 13% 3,795 12% 5,904 18% 5,980 18% 20,215 62% 12,128 20,490 63% 12,404 32,347 25%
ESSFwcp 491 11% 491 11% 1,296 28% 1,100 24% 1,724 38% 1,818 40% 1,075 23% N/A 1,176 26% N/A 4,586 N/A
ESSFwk 2 4,064 15% 4,941 19% 4,036 15% 3,215 12% 3,133 12% 3,496 13% 15,006 57% 8,446 14,588 56% 8,028 26,240 25%
ESSFmv 2 667 4% 831 5% 3,782 23% 3,428 21% 3,382 21% 3,297 20% 8,425 52% 4,361 8,702 54% 4,637 16,257 25%
ESSFmvp 250 17% 250 17% 620 41% 547 37% 292 19% 322 22% 334 22% N/A 377 25% N/A 1,496 N/A
SBS wk 2 2,254 20% 3,464 30% 3,376 29% 2,517 22% 1,920 17% 1,785 15% 4,006 35% 1,117 3,791 33% 902 11,556 25%
Wet Mountain Total 9,665 10% 12,058 13% 17,400 19% 14,602 16% 16,355 18% 16,698 18% 49,062 53% (28,623) 49,124 53% (28,561) 92,482 84%
Source: VRI – 2004 and Current TFL 48 FDP(2004 Major Amendment))
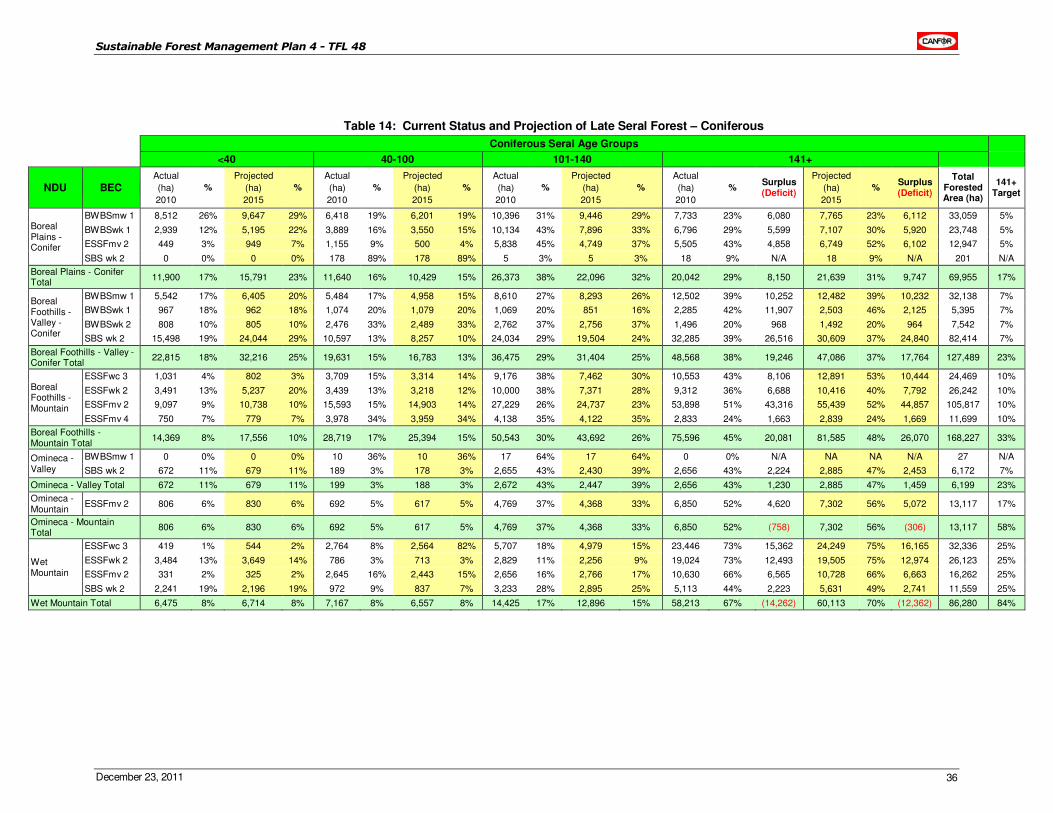
Sustainable Forest Management Plan 4 - TFL 48
December 23, 2011 36
Table 14: Current Status and Projection of Late Seral Forest – Coniferous
Coniferous Seral Age Groups
<40 40-100 101-140 141+
NDU BEC Actual
(ha)
2010
%
Projected
(ha)
2015
%
Actual
(ha)
2010
%
Projected
(ha)
2015
%
Actual
(ha)
2010
%
Projected
(ha)
2015
%
Actual
(ha)
2010
% Surplus (Deficit)
Projected
(ha)
2015
% Surplus (Deficit)
Total Forested Area (ha)
141+ Target
Boreal Plains - Conifer
BWBSmw 1 8,512 26% 9,647 29% 6,418 19% 6,201 19% 10,396 31% 9,446 29% 7,733 23% 6,080 7,765 23% 6,112 33,059 5%
BWBSwk 1 2,939 12% 5,195 22% 3,889 16% 3,550 15% 10,134 43% 7,896 33% 6,796 29% 5,599 7,107 30% 5,920 23,748 5%
ESSFmv 2 449 3% 949 7% 1,155 9% 500 4% 5,838 45% 4,749 37% 5,505 43% 4,858 6,749 52% 6,102 12,947 5%
SBS wk 2 0 0% 0 0% 178 89% 178 89% 5 3% 5 3% 18 9% N/A 18 9% N/A 201 N/A
Boreal Plains - Conifer Total
11,900 17% 15,791 23% 11,640 16% 10,429 15% 26,373 38% 22,096 32% 20,042 29% 8,150 21,639 31% 9,747 69,955 17%
Boreal Foothills - Valley - Conifer
BWBSmw 1 5,542 17% 6,405 20% 5,484 17% 4,958 15% 8,610 27% 8,293 26% 12,502 39% 10,252 12,482 39% 10,232 32,138 7%
BWBSwk 1 967 18% 962 18% 1,074 20% 1,079 20% 1,069 20% 851 16% 2,285 42% 11,907 2,503 46% 2,125 5,395 7%
BWBSwk 2 808 10% 805 10% 2,476 33% 2,489 33% 2,762 37% 2,756 37% 1,496 20% 968 1,492 20% 964 7,542 7%
SBS wk 2 15,498 19% 24,044 29% 10,597 13% 8,257 10% 24,034 29% 19,504 24% 32,285 39% 26,516 30,609 37% 24,840 82,414 7%
Boreal Foothills - Valley - Conifer Total
22,815 18% 32,216 25% 19,631 15% 16,783 13% 36,475 29% 31,404 25% 48,568 38% 19,246 47,086 37% 17,764 127,489 23%
Boreal Foothills - Mountain
ESSFwc 3 1,031 4% 802 3% 3,709 15% 3,314 14% 9,176 38% 7,462 30% 10,553 43% 8,106 12,891 53% 10,444 24,469 10%
ESSFwk 2 3,491 13% 5,237 20% 3,439 13% 3,218 12% 10,000 38% 7,371 28% 9,312 36% 6,688 10,416 40% 7,792 26,242 10%
ESSFmv 2 9,097 9% 10,738 10% 15,593 15% 14,903 14% 27,229 26% 24,737 23% 53,898 51% 43,316 55,439 52% 44,857 105,817 10%
ESSFmv 4 750 7% 779 7% 3,978 34% 3,959 34% 4,138 35% 4,122 35% 2,833 24% 1,663 2,839 24% 1,669 11,699 10%
Boreal Foothills - Mountain Total
14,369 8% 17,556 10% 28,719 17% 25,394 15% 50,543 30% 43,692 26% 75,596 45% 20,081 81,585 48% 26,070 168,227 33%
Omineca - Valley
BWBSmw 1 0 0% 0 0% 10 36% 10 36% 17 64% 17 64% 0 0% N/A NA NA N/A 27 N/A
SBS wk 2 672 11% 679 11% 189 3% 178 3% 2,655 43% 2,430 39% 2,656 43% 2,224 2,885 47% 2,453 6,172 7%
Omineca - Valley Total 672 11% 679 11% 199 3% 188 3% 2,672 43% 2,447 39% 2,656 43% 1,230 2,885 47% 1,459 6,199 23%
Omineca - Mountain
ESSFmv 2 806 6% 830 6% 692 5% 617 5% 4,769 37% 4,368 33% 6,850 52% 4,620 7,302 56% 5,072 13,117 17%
Omineca - Mountain Total
806 6% 830 6% 692 5% 617 5% 4,769 37% 4,368 33% 6,850 52% (758) 7,302 56% (306) 13,117 58%
Wet Mountain
ESSFwc 3 419 1% 544 2% 2,764 8% 2,564 82% 5,707 18% 4,979 15% 23,446 73% 15,362 24,249 75% 16,165 32,336 25%
ESSFwk 2 3,484 13% 3,649 14% 786 3% 713 3% 2,829 11% 2,256 9% 19,024 73% 12,493 19,505 75% 12,974 26,123 25%
ESSFmv 2 331 2% 325 2% 2,645 16% 2,443 15% 2,656 16% 2,766 17% 10,630 66% 6,565 10,728 66% 6,663 16,262 25%
SBS wk 2 2,241 19% 2,196 19% 972 9% 837 7% 3,233 28% 2,895 25% 5,113 44% 2,223 5,631 49% 2,741 11,559 25%
Wet Mountain Total 6,475 8% 6,714 8% 7,167 8% 6,557 8% 14,425 17% 12,896 15% 58,213 67% (14,262) 60,113 70% (12,362) 86,280 84%
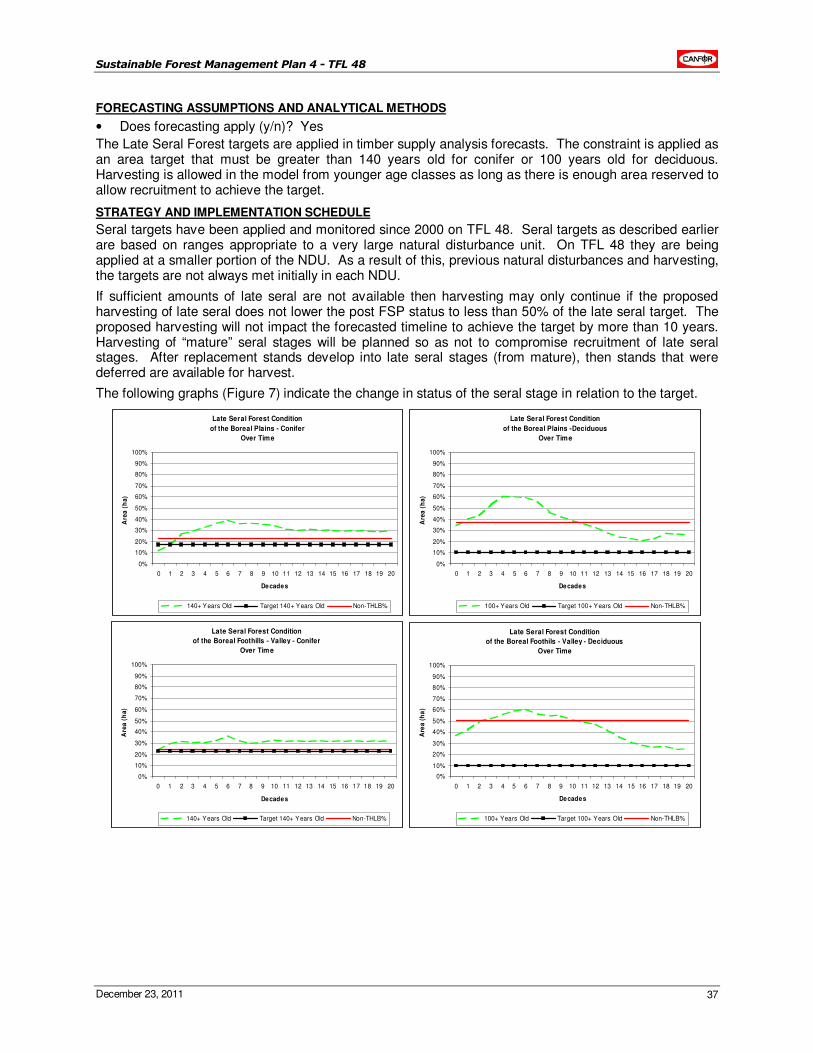
Sustainable Forest Management Plan 4 - TFL 48
December 23, 2011 37
FORECASTING ASSUMPTIONS AND ANALYTICAL METHODS
• Does forecasting apply (y/n)? Yes
The Late Seral Forest targets are applied in timber supply analysis forecasts. The constraint is applied as an area target that must be greater than 140 years old for conifer or 100 years old for deciduous. Harvesting is allowed in the model from younger age classes as long as there is enough area reserved to allow recruitment to achieve the target.
STRATEGY AND IMPLEMENTATION SCHEDULE
Seral targets have been applied and monitored since 2000 on TFL 48. Seral targets as described earlier are based on ranges appropriate to a very large natural disturbance unit. On TFL 48 they are being applied at a smaller portion of the NDU. As a result of this, previous natural disturbances and harvesting, the targets are not always met initially in each NDU.
If sufficient amounts of late seral are not available then harvesting may only continue if the proposed harvesting of late seral does not lower the post FSP status to less than 50% of the late seral target. The proposed harvesting will not impact the forecasted timeline to achieve the target by more than 10 years. Harvesting of “mature” seral stages will be planned so as not to compromise recruitment of late seral stages. After replacement stands develop into late seral stages (from mature), then stands that were deferred are available for harvest.
The following graphs (Figure 7) indicate the change in status of the seral stage in relation to the target.
Late Seral Forest Condition
of the Boreal Plains - Conifer
Over Time
0%
10%
20%
30%
40%
50%
60%
70%
80%
90%
100%
0 1 2 3 4 5 6 7 8 9 10 11 12 13 14 15 16 17 18 19 20
Decades
Are
a (
ha
)
140+ Years Old Target 140+ Years Old Non-THLB%
Late Seral Forest Condition
of the Boreal Plains -Deciduous
Over Time
0%
10%
20%
30%
40%
50%
60%
70%
80%
90%
100%
0 1 2 3 4 5 6 7 8 9 10 11 12 13 14 15 16 17 18 19 20
Decades
Are
a (
ha
)
100+ Years Old Target 100+ Years Old Non-THLB%
Late Seral Forest Condition
of the Boreal Foothills - Valley - Conifer
Over Time
0%
10%
20%
30%
40%
50%
60%
70%
80%
90%
100%
0 1 2 3 4 5 6 7 8 9 10 11 12 13 14 15 16 17 18 19 20
Decades
Are
a (
ha
)
140+ Years Old Target 140+ Years Old Non-THLB%
Late Seral Forest Condition
of the Boreal Foothils - Valley - Deciduous
Over Time
0%
10%
20%
30%
40%
50%
60%
70%
80%
90%
100%
0 1 2 3 4 5 6 7 8 9 10 11 12 13 14 15 16 17 18 19 20
Decades
Are
a (
ha
)
100+ Years Old Target 100+ Years Old Non-THLB%
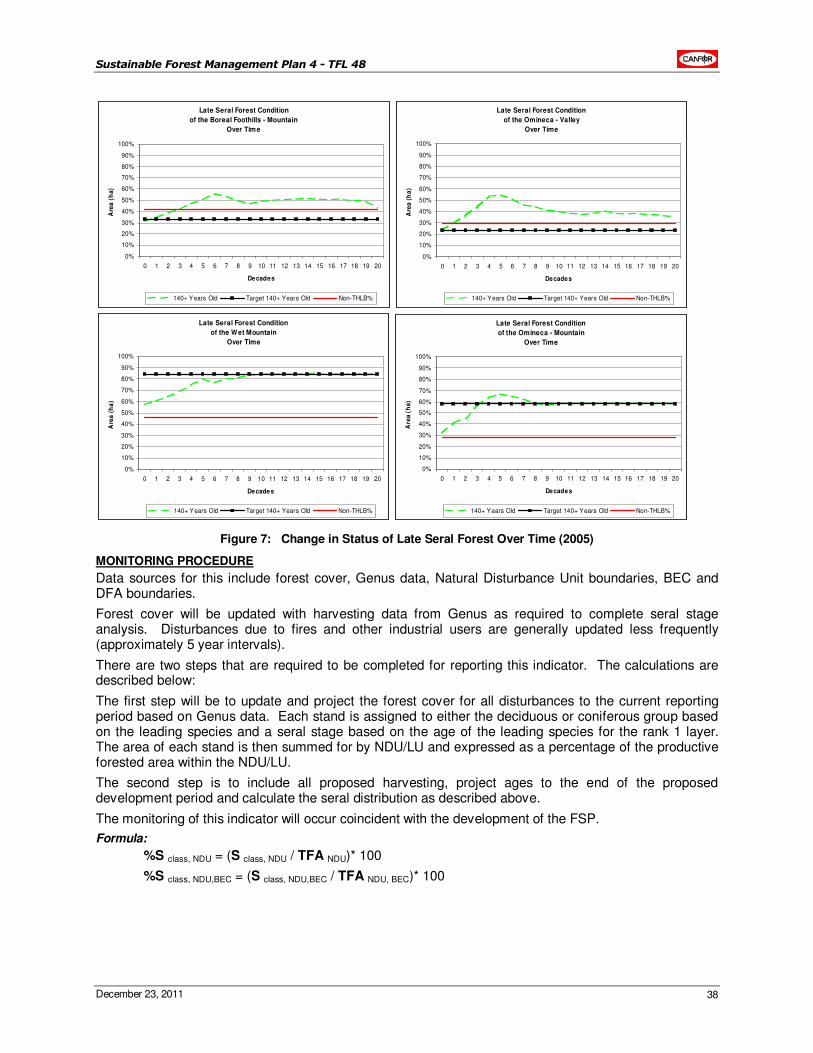
Sustainable Forest Management Plan 4 - TFL 48
December 23, 2011 38
Late Seral Forest Condition
of the Boreal Foothills - Mountain
Over Time
0%
10%
20%
30%
40%
50%
60%
70%
80%
90%
100%
0 1 2 3 4 5 6 7 8 9 10 11 12 13 14 15 16 17 18 19 20
Decades
Are
a (
ha
)
140+ Years Old Target 140+ Years Old Non-THLB%
Late Seral Forest Condition
of the Omineca - Valley
Over Time
0%
10%
20%
30%
40%
50%
60%
70%
80%
90%
100%
0 1 2 3 4 5 6 7 8 9 10 11 12 13 14 15 16 17 18 19 20
Decades
Are
a (
ha
)
140+ Years Old Target 140+ Years Old Non-THLB%
Late Seral Forest Condition
of the Wet Mountain
Over Time
0%
10%
20%
30%
40%
50%
60%
70%
80%
90%
100%
0 1 2 3 4 5 6 7 8 9 10 11 12 13 14 15 16 17 18 19 20
Decades
Are
a (
ha
)
140+ Years Old Target 140+ Years Old Non-THLB%
Late Seral Forest Condition
of the Omineca - Mountain
Over Time
0%
10%
20%
30%
40%
50%
60%
70%
80%
90%
100%
0 1 2 3 4 5 6 7 8 9 10 11 12 13 14 15 16 17 18 19 20
Decades
Are
a (
ha
)
140+ Years Old Target 140+ Years Old Non-THLB%
Figure 7: Change in Status of Late Seral Forest Over Time (2005)
MONITORING PROCEDURE
Data sources for this include forest cover, Genus data, Natural Disturbance Unit boundaries, BEC and DFA boundaries.
Forest cover will be updated with harvesting data from Genus as required to complete seral stage analysis. Disturbances due to fires and other industrial users are generally updated less frequently (approximately 5 year intervals).
There are two steps that are required to be completed for reporting this indicator. The calculations are described below:
The first step will be to update and project the forest cover for all disturbances to the current reporting period based on Genus data. Each stand is assigned to either the deciduous or coniferous group based on the leading species and a seral stage based on the age of the leading species for the rank 1 layer. The area of each stand is then summed for by NDU/LU and expressed as a percentage of the productive forested area within the NDU/LU.
The second step is to include all proposed harvesting, project ages to the end of the proposed development period and calculate the seral distribution as described above.
The monitoring of this indicator will occur coincident with the development of the FSP.
Formula:
%S class, NDU = (S class, NDU / TFA NDU)* 100
%S class, NDU,BEC = (S class, NDU,BEC / TFA NDU, BEC)* 100
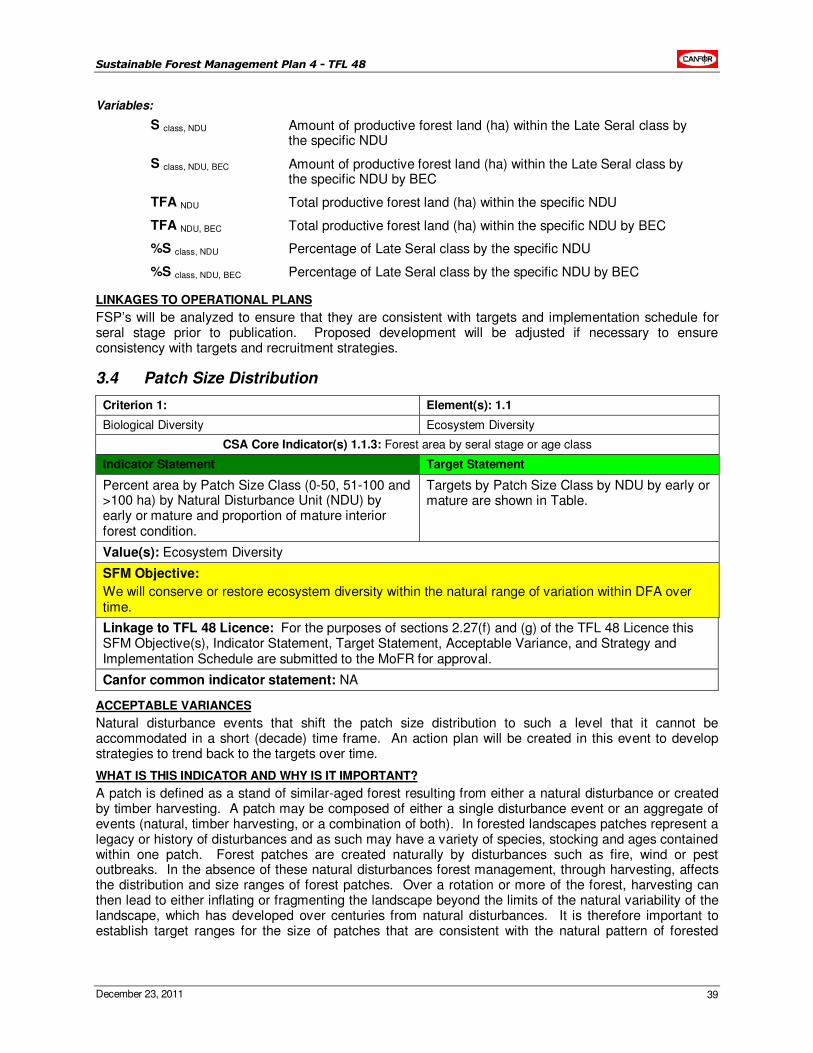
Sustainable Forest Management Plan 4 - TFL 48
December 23, 2011 39
Variables:
S class, NDU Amount of productive forest land (ha) within the Late Seral class by the specific NDU
S class, NDU, BEC Amount of productive forest land (ha) within the Late Seral class by the specific NDU by BEC
TFA NDU Total productive forest land (ha) within the specific NDU
TFA NDU, BEC Total productive forest land (ha) within the specific NDU by BEC
%S class, NDU Percentage of Late Seral class by the specific NDU
%S class, NDU, BEC Percentage of Late Seral class by the specific NDU by BEC
LINKAGES TO OPERATIONAL PLANS
FSP’s will be analyzed to ensure that they are consistent with targets and implementation schedule for seral stage prior to publication. Proposed development will be adjusted if necessary to ensure consistency with targets and recruitment strategies.
3.4 Patch Size Distribution
Criterion 1: Element(s): 1.1
Biological Diversity Ecosystem Diversity
CSA Core Indicator(s) 1.1.3: Forest area by seral stage or age class
Indicator Statement Target Statement
Percent area by Patch Size Class (0-50, 51-100 and >100 ha) by Natural Disturbance Unit (NDU) by early or mature and proportion of mature interior forest condition.
Targets by Patch Size Class by NDU by early or mature are shown in Table.
Value(s): Ecosystem Diversity
SFM Objective:
We will conserve or restore ecosystem diversity within the natural range of variation within DFA over time.
Linkage to TFL 48 Licence: For the purposes of sections 2.27(f) and (g) of the TFL 48 Licence this SFM Objective(s), Indicator Statement, Target Statement, Acceptable Variance, and Strategy and Implementation Schedule are submitted to the MoFR for approval.
Canfor common indicator statement: NA
ACCEPTABLE VARIANCES
Natural disturbance events that shift the patch size distribution to such a level that it cannot be accommodated in a short (decade) time frame. An action plan will be created in this event to develop strategies to trend back to the targets over time.
WHAT IS THIS INDICATOR AND WHY IS IT IMPORTANT?
A patch is defined as a stand of similar-aged forest resulting from either a natural disturbance or created by timber harvesting. A patch may be composed of either a single disturbance event or an aggregate of events (natural, timber harvesting, or a combination of both). In forested landscapes patches represent a legacy or history of disturbances and as such may have a variety of species, stocking and ages contained within one patch. Forest patches are created naturally by disturbances such as fire, wind or pest outbreaks. In the absence of these natural disturbances forest management, through harvesting, affects the distribution and size ranges of forest patches. Over a rotation or more of the forest, harvesting can then lead to either inflating or fragmenting the landscape beyond the limits of the natural variability of the landscape, which has developed over centuries from natural disturbances. It is therefore important to establish target ranges for the size of patches that are consistent with the natural pattern of forested
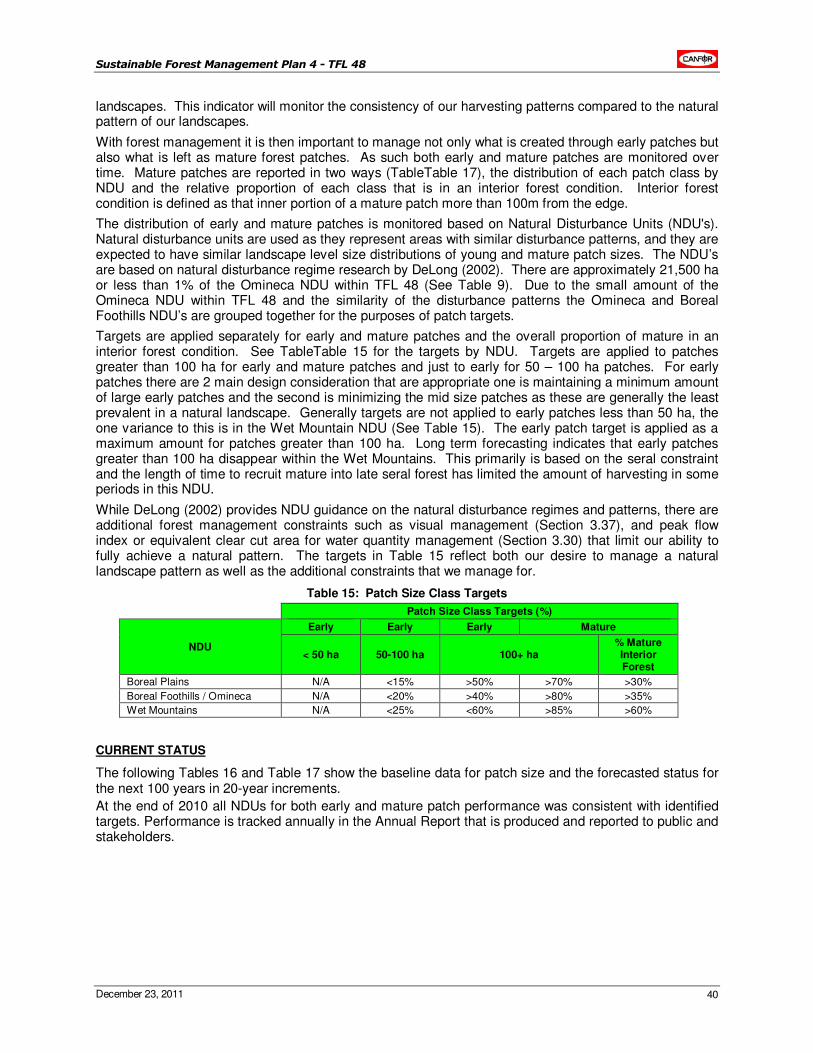
Sustainable Forest Management Plan 4 - TFL 48
December 23, 2011 40
landscapes. This indicator will monitor the consistency of our harvesting patterns compared to the natural pattern of our landscapes.
With forest management it is then important to manage not only what is created through early patches but also what is left as mature forest patches. As such both early and mature patches are monitored over time. Mature patches are reported in two ways (TableTable 17), the distribution of each patch class by NDU and the relative proportion of each class that is in an interior forest condition. Interior forest condition is defined as that inner portion of a mature patch more than 100m from the edge.
The distribution of early and mature patches is monitored based on Natural Disturbance Units (NDU's). Natural disturbance units are used as they represent areas with similar disturbance patterns, and they are expected to have similar landscape level size distributions of young and mature patch sizes. The NDU’s are based on natural disturbance regime research by DeLong (2002). There are approximately 21,500 ha or less than 1% of the Omineca NDU within TFL 48 (See Table 9). Due to the small amount of the Omineca NDU within TFL 48 and the similarity of the disturbance patterns the Omineca and Boreal Foothills NDU’s are grouped together for the purposes of patch targets.
Targets are applied separately for early and mature patches and the overall proportion of mature in an interior forest condition. See TableTable 15 for the targets by NDU. Targets are applied to patches greater than 100 ha for early and mature patches and just to early for 50 – 100 ha patches. For early patches there are 2 main design consideration that are appropriate one is maintaining a minimum amount of large early patches and the second is minimizing the mid size patches as these are generally the least prevalent in a natural landscape. Generally targets are not applied to early patches less than 50 ha, the one variance to this is in the Wet Mountain NDU (See Table 15). The early patch target is applied as a maximum amount for patches greater than 100 ha. Long term forecasting indicates that early patches greater than 100 ha disappear within the Wet Mountains. This primarily is based on the seral constraint and the length of time to recruit mature into late seral forest has limited the amount of harvesting in some periods in this NDU.
While DeLong (2002) provides NDU guidance on the natural disturbance regimes and patterns, there are additional forest management constraints such as visual management (Section 3.37), and peak flow index or equivalent clear cut area for water quantity management (Section 3.30) that limit our ability to fully achieve a natural pattern. The targets in Table 15 reflect both our desire to manage a natural landscape pattern as well as the additional constraints that we manage for.
Table 15: Patch Size Class Targets
Patch Size Class Targets (%)
NDU
Early Early Early Mature
< 50 ha 50-100 ha 100+ ha % Mature Interior Forest
Boreal Plains N/A <15% >50% >70% >30%
Boreal Foothills / Omineca N/A <20% >40% >80% >35%
Wet Mountains N/A <25% <60% >85% >60%
CURRENT STATUS
The following Tables 16 and Table 17 show the baseline data for patch size and the forecasted status for the next 100 years in 20-year increments.
At the end of 2010 all NDUs for both early and mature patch performance was consistent with identified targets. Performance is tracked annually in the Annual Report that is produced and reported to public and stakeholders.
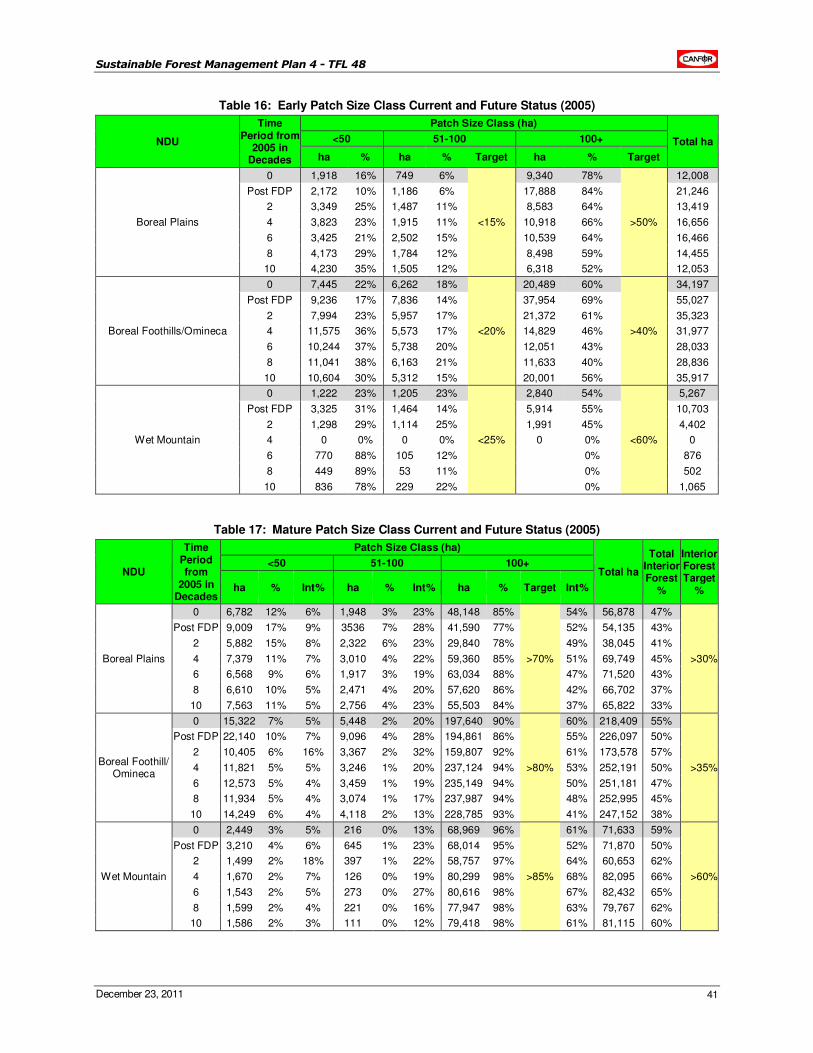
Sustainable Forest Management Plan 4 - TFL 48
December 23, 2011 41
Table 16: Early Patch Size Class Current and Future Status (2005)
NDU
Time Period from
2005 in Decades
Patch Size Class (ha)
Total ha <50 51-100 100+
ha % ha % Target ha % Target
Boreal Plains
0 1,918 16% 749 6%
<15%
9,340 78%
>50%
12,008
Post FDP 2,172 10% 1,186 6% 17,888 84% 21,246
2 3,349 25% 1,487 11% 8,583 64% 13,419
4 3,823 23% 1,915 11% 10,918 66% 16,656
6 3,425 21% 2,502 15% 10,539 64% 16,466
8 4,173 29% 1,784 12% 8,498 59% 14,455
10 4,230 35% 1,505 12% 6,318 52% 12,053
Boreal Foothills/Omineca
0 7,445 22% 6,262 18%
<20%
20,489 60%
>40%
34,197
Post FDP 9,236 17% 7,836 14% 37,954 69% 55,027
2 7,994 23% 5,957 17% 21,372 61% 35,323
4 11,575 36% 5,573 17% 14,829 46% 31,977
6 10,244 37% 5,738 20% 12,051 43% 28,033
8 11,041 38% 6,163 21% 11,633 40% 28,836
10 10,604 30% 5,312 15% 20,001 56% 35,917
Wet Mountain
0 1,222 23% 1,205 23%
<25%
2,840 54%
<60%
5,267
Post FDP 3,325 31% 1,464 14% 5,914 55% 10,703
2 1,298 29% 1,114 25% 1,991 45% 4,402
4 0 0% 0 0% 0 0% 0
6 770 88% 105 12% 0% 876
8 449 89% 53 11% 0% 502
10 836 78% 229 22% 0% 1,065
Table 17: Mature Patch Size Class Current and Future Status (2005)
NDU
Time Period from
2005 in Decades
Patch Size Class (ha)
Total ha
Total Interior Forest
%
Interior Forest Target
%
<50 51-100 100+
ha % Int% ha % Int% ha % Target Int%
Boreal Plains
0 6,782 12% 6% 1,948 3% 23% 48,148 85%
>70%
54% 56,878 47%
>30%
Post FDP 9,009 17% 9% 3536 7% 28% 41,590 77% 52% 54,135 43%
2 5,882 15% 8% 2,322 6% 23% 29,840 78% 49% 38,045 41%
4 7,379 11% 7% 3,010 4% 22% 59,360 85% 51% 69,749 45%
6 6,568 9% 6% 1,917 3% 19% 63,034 88% 47% 71,520 43%
8 6,610 10% 5% 2,471 4% 20% 57,620 86% 42% 66,702 37%
10 7,563 11% 5% 2,756 4% 23% 55,503 84% 37% 65,822 33%
Boreal Foothill/ Omineca
0 15,322 7% 5% 5,448 2% 20% 197,640 90%
>80%
60% 218,409 55%
>35%
Post FDP 22,140 10% 7% 9,096 4% 28% 194,861 86% 55% 226,097 50%
2 10,405 6% 16% 3,367 2% 32% 159,807 92% 61% 173,578 57%
4 11,821 5% 5% 3,246 1% 20% 237,124 94% 53% 252,191 50%
6 12,573 5% 4% 3,459 1% 19% 235,149 94% 50% 251,181 47%
8 11,934 5% 4% 3,074 1% 17% 237,987 94% 48% 252,995 45%
10 14,249 6% 4% 4,118 2% 13% 228,785 93% 41% 247,152 38%
Wet Mountain
0 2,449 3% 5% 216 0% 13% 68,969 96%
>85%
61% 71,633 59%
>60%
Post FDP 3,210 4% 6% 645 1% 23% 68,014 95% 52% 71,870 50%
2 1,499 2% 18% 397 1% 22% 58,757 97% 64% 60,653 62%
4 1,670 2% 7% 126 0% 19% 80,299 98% 68% 82,095 66%
6 1,543 2% 5% 273 0% 27% 80,616 98% 67% 82,432 65%
8 1,599 2% 4% 221 0% 16% 77,947 98% 63% 79,767 62%
10 1,586 2% 3% 111 0% 12% 79,418 98% 61% 81,115 60%
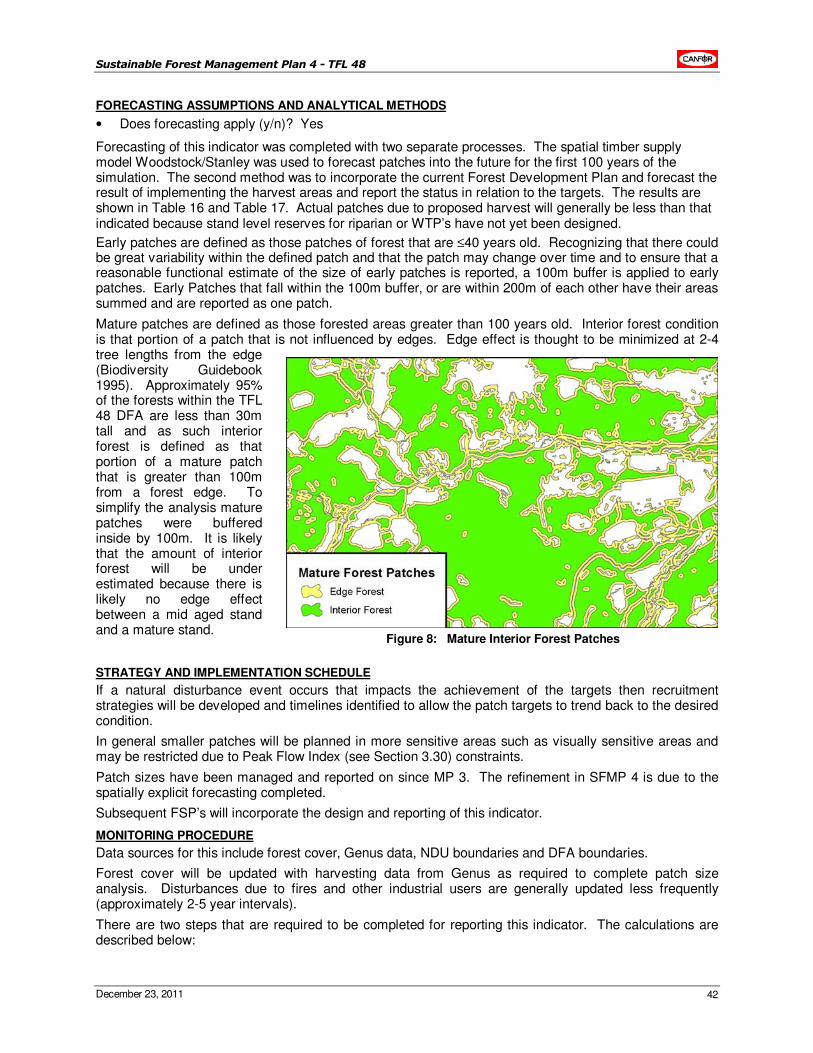
Sustainable Forest Management Plan 4 - TFL 48
December 23, 2011 42
FORECASTING ASSUMPTIONS AND ANALYTICAL METHODS
• Does forecasting apply (y/n)? Yes
Forecasting of this indicator was completed with two separate processes. The spatial timber supply model Woodstock/Stanley was used to forecast patches into the future for the first 100 years of the simulation. The second method was to incorporate the current Forest Development Plan and forecast the result of implementing the harvest areas and report the status in relation to the targets. The results are shown in Table 16 and Table 17. Actual patches due to proposed harvest will generally be less than that indicated because stand level reserves for riparian or WTP’s have not yet been designed.
Early patches are defined as those patches of forest that are ≤40 years old. Recognizing that there could be great variability within the defined patch and that the patch may change over time and to ensure that a reasonable functional estimate of the size of early patches is reported, a 100m buffer is applied to early patches. Early Patches that fall within the 100m buffer, or are within 200m of each other have their areas summed and are reported as one patch.
Mature patches are defined as those forested areas greater than 100 years old. Interior forest condition is that portion of a patch that is not influenced by edges. Edge effect is thought to be minimized at 2-4 tree lengths from the edge (Biodiversity Guidebook 1995). Approximately 95% of the forests within the TFL 48 DFA are less than 30m tall and as such interior forest is defined as that portion of a mature patch that is greater than 100m from a forest edge. To simplify the analysis mature patches were buffered inside by 100m. It is likely that the amount of interior forest will be under estimated because there is likely no edge effect between a mid aged stand and a mature stand.
STRATEGY AND IMPLEMENTATION SCHEDULE
If a natural disturbance event occurs that impacts the achievement of the targets then recruitment strategies will be developed and timelines identified to allow the patch targets to trend back to the desired condition.
In general smaller patches will be planned in more sensitive areas such as visually sensitive areas and may be restricted due to Peak Flow Index (see Section 3.30) constraints.
Patch sizes have been managed and reported on since MP 3. The refinement in SFMP 4 is due to the spatially explicit forecasting completed.
Subsequent FSP’s will incorporate the design and reporting of this indicator.
MONITORING PROCEDURE
Data sources for this include forest cover, Genus data, NDU boundaries and DFA boundaries.
Forest cover will be updated with harvesting data from Genus as required to complete patch size analysis. Disturbances due to fires and other industrial users are generally updated less frequently (approximately 2-5 year intervals).
There are two steps that are required to be completed for reporting this indicator. The calculations are described below:
Figure 8: Mature Interior Forest Patches
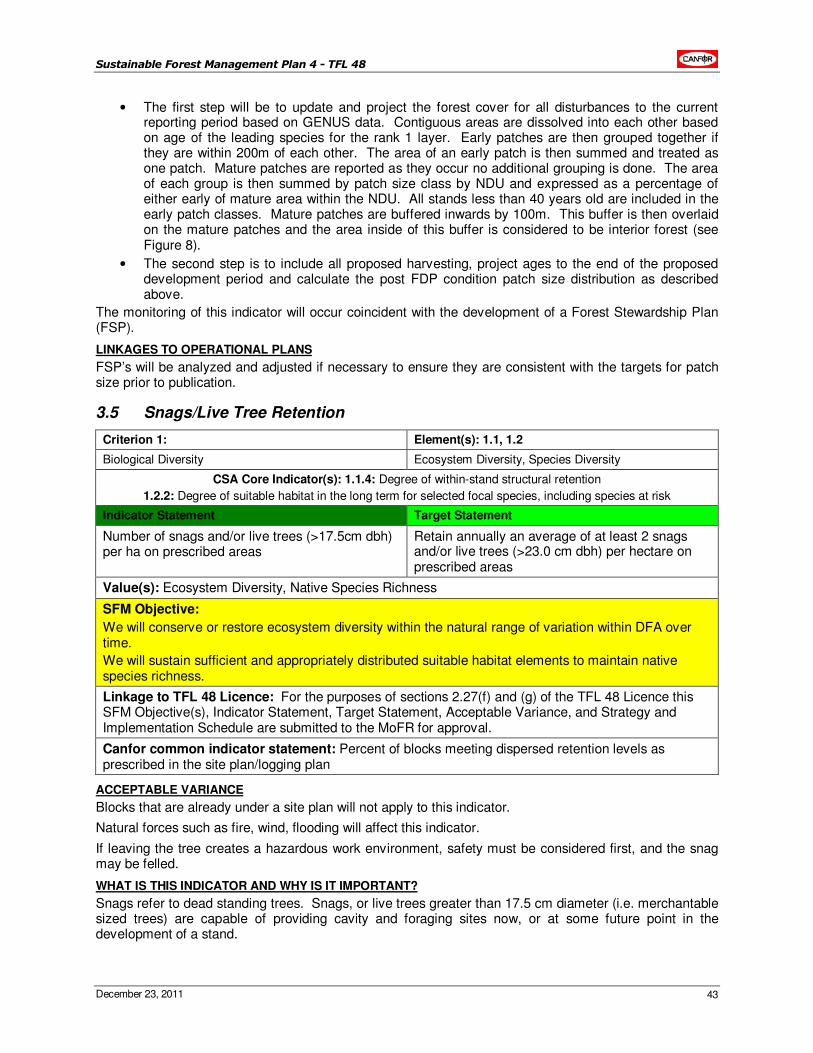
Sustainable Forest Management Plan 4 - TFL 48
December 23, 2011 43
• The first step will be to update and project the forest cover for all disturbances to the current reporting period based on GENUS data. Contiguous areas are dissolved into each other based on age of the leading species for the rank 1 layer. Early patches are then grouped together if they are within 200m of each other. The area of an early patch is then summed and treated as one patch. Mature patches are reported as they occur no additional grouping is done. The area of each group is then summed by patch size class by NDU and expressed as a percentage of either early of mature area within the NDU. All stands less than 40 years old are included in the early patch classes. Mature patches are buffered inwards by 100m. This buffer is then overlaid on the mature patches and the area inside of this buffer is considered to be interior forest (see Figure 8).
• The second step is to include all proposed harvesting, project ages to the end of the proposed development period and calculate the post FDP condition patch size distribution as described above.
The monitoring of this indicator will occur coincident with the development of a Forest Stewardship Plan (FSP).
LINKAGES TO OPERATIONAL PLANS
FSP’s will be analyzed and adjusted if necessary to ensure they are consistent with the targets for patch size prior to publication.
3.5 Snags/Live Tree Retention
Criterion 1: Element(s): 1.1, 1.2
Biological Diversity Ecosystem Diversity, Species Diversity
CSA Core Indicator(s): 1.1.4: Degree of within-stand structural retention
1.2.2: Degree of suitable habitat in the long term for selected focal species, including species at risk
Indicator Statement Target Statement
Number of snags and/or live trees (>17.5cm dbh) per ha on prescribed areas
Retain annually an average of at least 2 snags and/or live trees (>23.0 cm dbh) per hectare on prescribed areas
Value(s): Ecosystem Diversity, Native Species Richness
SFM Objective:
We will conserve or restore ecosystem diversity within the natural range of variation within DFA over time.
We will sustain sufficient and appropriately distributed suitable habitat elements to maintain native species richness.
Linkage to TFL 48 Licence: For the purposes of sections 2.27(f) and (g) of the TFL 48 Licence this SFM Objective(s), Indicator Statement, Target Statement, Acceptable Variance, and Strategy and Implementation Schedule are submitted to the MoFR for approval.
Canfor common indicator statement: Percent of blocks meeting dispersed retention levels as prescribed in the site plan/logging plan
ACCEPTABLE VARIANCE
Blocks that are already under a site plan will not apply to this indicator.
Natural forces such as fire, wind, flooding will affect this indicator.
If leaving the tree creates a hazardous work environment, safety must be considered first, and the snag may be felled.
WHAT IS THIS INDICATOR AND WHY IS IT IMPORTANT?
Snags refer to dead standing trees. Snags, or live trees greater than 17.5 cm diameter (i.e. merchantable sized trees) are capable of providing cavity and foraging sites now, or at some future point in the development of a stand.
Sustainable Forest Management Plan 4 - TFL 48
December 23, 2011 44
The prescribed area refers to those portions of cut blocks to which the site plan prescribes the retention of snags or live trees to provide potential future cavity sites.
These elements can provide important habitats for at least portions of life cycles of a wide variety of animals. Snags or live trees retained within the perimeter of a block can provide cavity sites and other habitat values for several decades following disturbance, provided they remain standing. Hoyt and Hannon (2002), for example, note that trees averaging 16 cm and 23 cm dbh provide feeding and nesting habitat respectively for black backed and three toed woodpeckers in recent burns. In 2009 Bunnell et al. proposed a change in diameter to the retention target suggesting a 23.0 cm dbh provided greater habitat value and as such the retention strategy will be measured and monitored for trees that are >23.0cm dbh.
Snags and/or residual live trees are a common component of young stands following natural disturbance. Fires (the predominant natural disturbance in the DFA) burn at different intensities, depending on site and climatic conditions. This results in the natural retention of live trees and snags at variable densities across the landscape.
Retaining some dispersed snags or live trees in suitable portions of managed stands supplements sources of this habitat element from wildlife tree patches, unsalvaged natural disturbances, and from the non timber harvesting land base. All of these sources of this habitat element supports reestablishment of the many species dependent on this element.
Bunnell et al, (1997) states that primary excavators prefer trees that are easier to excavate. Generally hardwoods are the commonly preferred trees for cavity excavation. Decay prone hardwoods are more desirable than decay resistant hardwoods. When hardwood options are limited, birds will use conifers, but prefer those that have rotten heartwood.
While the retention of standing material in managed stands may be at relatively low levels, the duration of retention of the vertical structure is likely longer than average, due to the lack of fire damage. This indicator thereby contributes to maintaining ecosystem function, composition and structure that assists the ecosystem in recovering quicker from logging disturbance.
Harvested stands on the DFA tend to be relatively uniform, with smaller tree sizes, and fewer dead trees than similar stands in other parts of the province. This is apparently due to the frequency of fires on the landscape, and the relatively young age of the forest stands.
Relatively little research exists on desired levels of retention, particularly in the boreal forest. Bunnell (1999) reports that little use is gained by sustained provision of more than about 2 snags/ha.
CURRENT STATUS
Currently on the Defined Forest Area we are managing for snags and live tree retention. The following statement, or a similar derivative of this statement is included in our site plans where ground conditions exist:
“Where operationally feasible retain the larger clumps/islands of deciduous stems. Avoid leaving dispersed individual deciduous stems, as they will impede future silviculture operations. Large snags may be retained for wildlife trees if they meet with WCB regulations and do not compromise harvesting or silviculture activities; or they may be stubbed or felled.“
While harvesting supervisors assess conformance to SP measures during harvesting inspections, which includes prescribed snag or live tree retention, no information is currently available on actual densities of retained snags, live trees or stub trees following the completion of operations.
FORECASTING ASSUMPTIONS AND ANALYTICAL METHODS
• Does forecasting apply (y/n)? No
STRATEGY AND IMPLEMENTATION SCHEDULE
Subsequent to harvesting, with consideration for safety and economic limitations, dispersed snags or live trees are retained in some suitable areas within managed stands to provide potential cavity sites through time. The guidelines below describe where this indicator will be applied.
• This strategy is designed to encourage the retention of some snags or live trees capable of providing cavity sites, within the harvested portion of the timber harvesting land base.
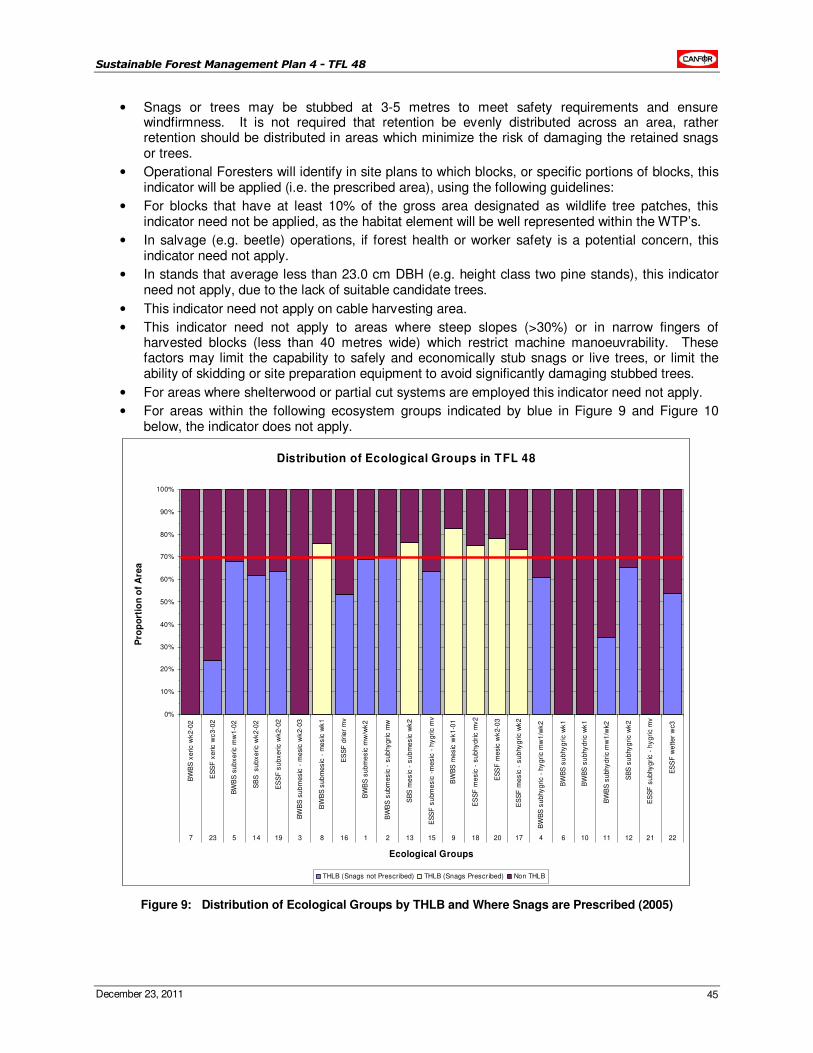
Sustainable Forest Management Plan 4 - TFL 48
December 23, 2011 45
• Snags or trees may be stubbed at 3-5 metres to meet safety requirements and ensure windfirmness. It is not required that retention be evenly distributed across an area, rather retention should be distributed in areas which minimize the risk of damaging the retained snags or trees.
• Operational Foresters will identify in site plans to which blocks, or specific portions of blocks, this indicator will be applied (i.e. the prescribed area), using the following guidelines:
• For blocks that have at least 10% of the gross area designated as wildlife tree patches, this indicator need not be applied, as the habitat element will be well represented within the WTP’s.
• In salvage (e.g. beetle) operations, if forest health or worker safety is a potential concern, this indicator need not apply.
• In stands that average less than 23.0 cm DBH (e.g. height class two pine stands), this indicator need not apply, due to the lack of suitable candidate trees.
• This indicator need not apply on cable harvesting area.
• This indicator need not apply to areas where steep slopes (>30%) or in narrow fingers of harvested blocks (less than 40 metres wide) which restrict machine manoeuvrability. These factors may limit the capability to safely and economically stub snags or live trees, or limit the ability of skidding or site preparation equipment to avoid significantly damaging stubbed trees.
• For areas where shelterwood or partial cut systems are employed this indicator need not apply.
• For areas within the following ecosystem groups indicated by blue in Figure 9 and Figure 10 below, the indicator does not apply.
Distribution of Ecological Groups in TFL 48
0%
10%
20%
30%
40%
50%
60%
70%
80%
90%
100%
BW
BS
xe
ric
wk
2-0
2
ES
SF
xe
ric
wc
3-0
2
BW
BS
su
bx
eric
mw
1-0
2
SB
S s
ub
xe
ric
wk
2-0
2
ES
SF
su
bx
eric
wk
2-0
2
BW
BS
su
bm
es
ic -
me
sic
wk
2-0
3
BW
BS
su
bm
es
ic -
me
sic
wk
1
ES
SF
dri
er
mv
BW
BS
sub
me
sic
mw
/wk
2
BW
BS
sub
me
sic
- s
ub
hy
gri
c m
w
SB
S m
es
ic -
su
bm
es
ic w
k2
ES
SF
su
bm
es
ic -
me
sic
- h
yg
ric m
v
BW
BS
me
sic
wk
1-0
1
ES
SF
me
sic
- s
ub
hy
dri
c m
v2
ES
SF
me
sic
wk
2-0
3
ES
SF
me
sic
- s
ub
hy
gri
c w
k2
BW
BS
su
bhy
gri
c -
hy
gri
c m
w1
/wk
2
BW
BS
su
bhy
gri
c w
k1
BW
BS
su
bhy
dri
c w
k1
BW
BS
su
bh
yd
ric
mw
1/w
k2
SB
S s
ub
hy
gri
c w
k2
ES
SF
su
bhy
gri
c -
hy
gri
c m
v
ES
SF
we
tte
r w
c3
7 23 5 14 19 3 8 16 1 2 13 15 9 18 20 17 4 6 10 11 12 21 22
Ecological Groups
Pro
po
rtio
n o
f A
rea
THLB (Snags not Prescr ibed) THLB (Snags Prescr ibed) Non THLB
Figure 9: Distribution of Ecological Groups by THLB and Where Snags are Prescribed (2005)
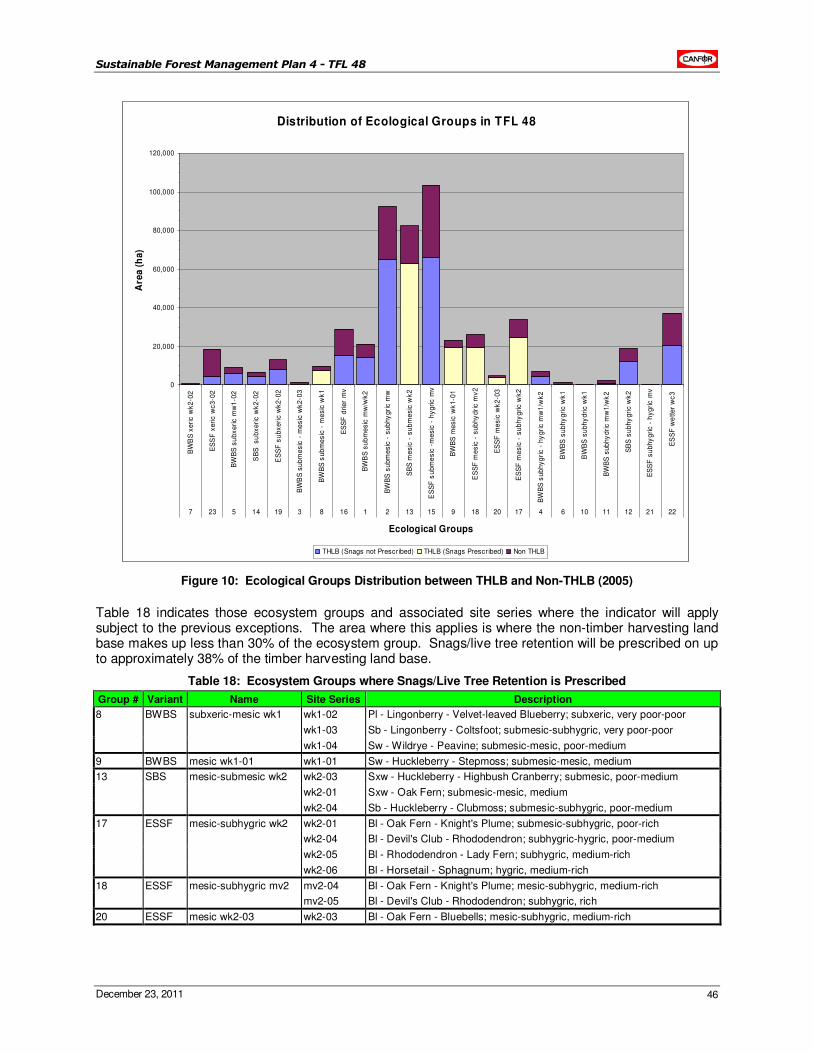
Sustainable Forest Management Plan 4 - TFL 48
December 23, 2011 46
Distribution of Ecological Groups in TFL 48
0
20,000
40,000
60,000
80,000
100,000
120,000
BW
BS
xe
ric
wk
2-0
2
ES
SF
xe
ric
wc
3-0
2
BW
BS
su
bx
eri
c m
w1
-02
SB
S
su
bx
eri
c w
k2
-02
ES
SF
su
bx
eri
c w
k2
-02
BW
BS
su
bm
es
ic -
me
sic
wk
2-0
3
BW
BS
su
bm
es
ic -
me
sic
wk
1
ES
SF
dri
er
mv
BW
BS
su
bm
es
ic m
w/w
k2
BW
BS
su
bm
es
ic -
su
bh
yg
ric
mw
SB
S m
es
ic -
su
bm
es
ic w
k2
ES
SF
su
bm
es
ic -
me
sic
- h
yg
ric
mv
BW
BS
me
sic
wk
1-0
1
ES
SF
me
sic
- s
ub
hy
dri
c m
v2
ES
SF
me
sic
wk
2-0
3
ES
SF
me
sic
- s
ub
hy
gri
c w
k2
BW
BS
su
bh
yg
ric
- h
yg
ric
mw
1/w
k2
BW
BS
su
bh
yg
ric
wk
1
BW
BS
su
bh
yd
ric
wk
1
BW
BS
su
bh
yd
ric
mw
1/w
k2
SB
S s
ub
hy
gri
c w
k2
ES
SF
su
bh
yg
ric
- h
yg
ric
mv
ES
SF
we
tte
r w
c3
7 23 5 14 19 3 8 16 1 2 13 15 9 18 20 17 4 6 10 11 12 21 22
Ecological Groups
Are
a (
ha
)
THLB (Snags not Prescr ibed) THLB (Snags Prescr ibed) Non THLB
Figure 10: Ecological Groups Distribution between THLB and Non-THLB (2005)
Table 18 indicates those ecosystem groups and associated site series where the indicator will apply subject to the previous exceptions. The area where this applies is where the non-timber harvesting land base makes up less than 30% of the ecosystem group. Snags/live tree retention will be prescribed on up to approximately 38% of the timber harvesting land base.
Table 18: Ecosystem Groups where Snags/Live Tree Retention is Prescribed
Group # Variant Name Site Series Description
8 BWBS subxeric-mesic wk1 wk1-02 Pl - Lingonberry - Velvet-leaved Blueberry; subxeric, very poor-poor
wk1-03 Sb - Lingonberry - Coltsfoot; submesic-subhygric, very poor-poor
wk1-04 Sw - Wildrye - Peavine; submesic-mesic, poor-medium
9 BWBS mesic wk1-01 wk1-01 Sw - Huckleberry - Stepmoss; submesic-mesic, medium
13 SBS mesic-submesic wk2 wk2-03 Sxw - Huckleberry - Highbush Cranberry; submesic, poor-medium
wk2-01 Sxw - Oak Fern; submesic-mesic, medium
wk2-04 Sb - Huckleberry - Clubmoss; submesic-subhygric, poor-medium
17 ESSF mesic-subhygric wk2 wk2-01 Bl - Oak Fern - Knight's Plume; submesic-subhygric, poor-rich
wk2-04 Bl - Devil's Club - Rhododendron; subhygric-hygric, poor-medium
wk2-05 Bl - Rhododendron - Lady Fern; subhygric, medium-rich
wk2-06 Bl - Horsetail - Sphagnum; hygric, medium-rich
18 ESSF mesic-subhygric mv2 mv2-04 Bl - Oak Fern - Knight's Plume; mesic-subhygric, medium-rich
mv2-05 Bl - Devil's Club - Rhododendron; subhygric, rich
20 ESSF mesic wk2-03 wk2-03 Bl - Oak Fern - Bluebells; mesic-subhygric, medium-rich
Sustainable Forest Management Plan 4 - TFL 48
December 23, 2011 47
Planning supervisors spatially identify in genus the area where snag/live tree retention will be retained and choose the appropriate harvesting strategy, i.e. clearcut with snag retention.
During the harvesting prework, prior to the commencement of operations, operational supervisors are advised if this indicator is applicable to a block, and if so specifically to which sections of the block it applies. This information will be identified on the logging plan maps.
Logging supervisors will consult with the silviculture forester on each block to determine if stubbing is the preferred method to meet the target for this indicator. Leaving live trees or snags can seriously impede the treatment options for brushing. For example, aerial herbicide requires snag/live tree removal, as the helicopter cannot adequately or safely maneuver around these standing trees. By carrying out stubbing in areas with poor access, or on sites where aerial herbicide is anticipated, the treatment options are left open.
Silviculture will have access to the layer where this data exists. They will be able to overlay this layer with their planned blocks, to determine in which areas of the blocks the indicator applies.
Supervisors will review the requirements pertaining to this indicator in preworks with harvesting and silviculture workers, and discuss methods and procedures to create and/or retain these habitat elements to the target levels.
MONITORING PROCEDURE
Monitoring and reporting procedures will be as follows:
On areas where this indicator applies, operations supervisors note in harvesting inspections whether or not operational activities are in general compliance with the indicator.
The reporting summary table will be similar to the following format.
Cutblock Number Prescribed Area (ha) Was indicator applied correctly?
700-005 32 Yes
Silviculture will also note in their inspections whether we are in conformance with this indicators, on blocks that they carry out snag falling.
LINKAGES TO OPERATIONAL PLANS
Site plans will identify whether cutblocks or portions thereof are candidate areas for dispersed snag or live tree retention.
Logging plan maps will show areas where the indicator is applied.
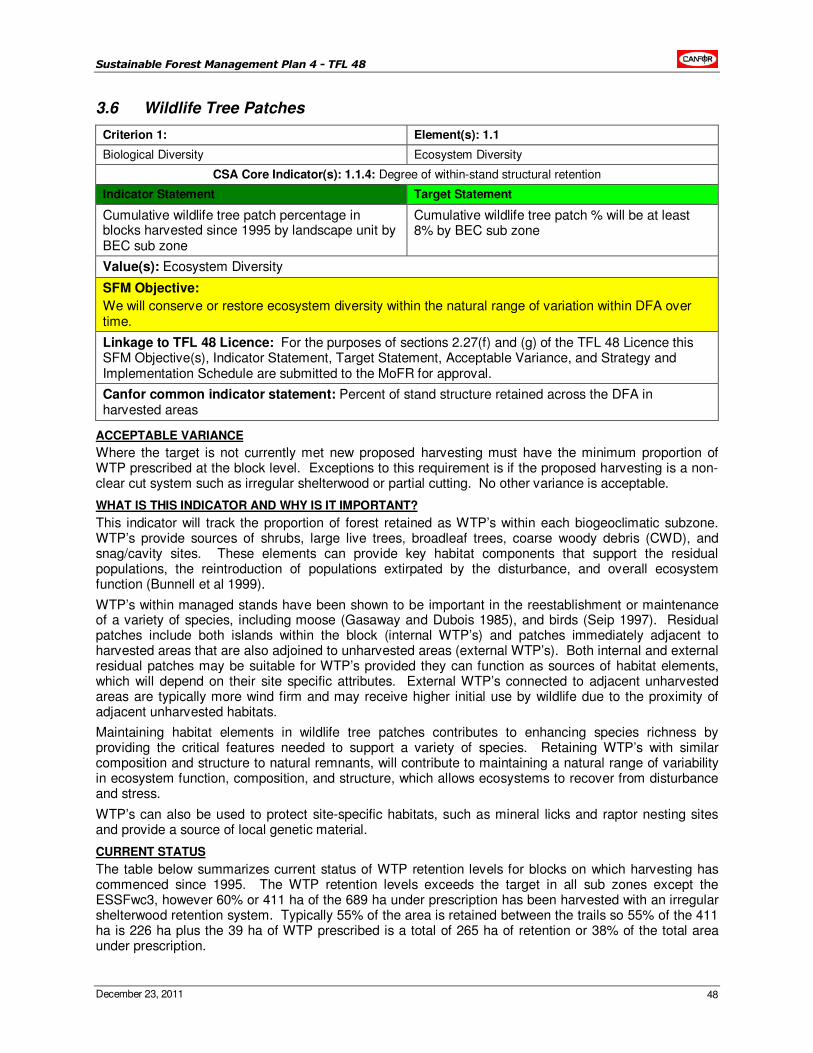
Sustainable Forest Management Plan 4 - TFL 48
December 23, 2011 48
3.6 Wildlife Tree Patches
Criterion 1: Element(s): 1.1
Biological Diversity Ecosystem Diversity
CSA Core Indicator(s): 1.1.4: Degree of within-stand structural retention
Indicator Statement Target Statement
Cumulative wildlife tree patch percentage in blocks harvested since 1995 by landscape unit by BEC sub zone
Cumulative wildlife tree patch % will be at least 8% by BEC sub zone
Value(s): Ecosystem Diversity
SFM Objective:
We will conserve or restore ecosystem diversity within the natural range of variation within DFA over time.
Linkage to TFL 48 Licence: For the purposes of sections 2.27(f) and (g) of the TFL 48 Licence this SFM Objective(s), Indicator Statement, Target Statement, Acceptable Variance, and Strategy and Implementation Schedule are submitted to the MoFR for approval.
Canfor common indicator statement: Percent of stand structure retained across the DFA in harvested areas
ACCEPTABLE VARIANCE
Where the target is not currently met new proposed harvesting must have the minimum proportion of WTP prescribed at the block level. Exceptions to this requirement is if the proposed harvesting is a non-clear cut system such as irregular shelterwood or partial cutting. No other variance is acceptable.
WHAT IS THIS INDICATOR AND WHY IS IT IMPORTANT?
This indicator will track the proportion of forest retained as WTP’s within each biogeoclimatic subzone. WTP’s provide sources of shrubs, large live trees, broadleaf trees, coarse woody debris (CWD), and snag/cavity sites. These elements can provide key habitat components that support the residual populations, the reintroduction of populations extirpated by the disturbance, and overall ecosystem function (Bunnell et al 1999).
WTP’s within managed stands have been shown to be important in the reestablishment or maintenance of a variety of species, including moose (Gasaway and Dubois 1985), and birds (Seip 1997). Residual patches include both islands within the block (internal WTP’s) and patches immediately adjacent to harvested areas that are also adjoined to unharvested areas (external WTP’s). Both internal and external residual patches may be suitable for WTP’s provided they can function as sources of habitat elements, which will depend on their site specific attributes. External WTP’s connected to adjacent unharvested areas are typically more wind firm and may receive higher initial use by wildlife due to the proximity of adjacent unharvested habitats.
Maintaining habitat elements in wildlife tree patches contributes to enhancing species richness by providing the critical features needed to support a variety of species. Retaining WTP’s with similar composition and structure to natural remnants, will contribute to maintaining a natural range of variability in ecosystem function, composition, and structure, which allows ecosystems to recover from disturbance and stress.
WTP’s can also be used to protect site-specific habitats, such as mineral licks and raptor nesting sites and provide a source of local genetic material.
CURRENT STATUS
The table below summarizes current status of WTP retention levels for blocks on which harvesting has commenced since 1995. The WTP retention levels exceeds the target in all sub zones except the ESSFwc3, however 60% or 411 ha of the 689 ha under prescription has been harvested with an irregular shelterwood retention system. Typically 55% of the area is retained between the trails so 55% of the 411 ha is 226 ha plus the 39 ha of WTP prescribed is a total of 265 ha of retention or 38% of the total area under prescription.
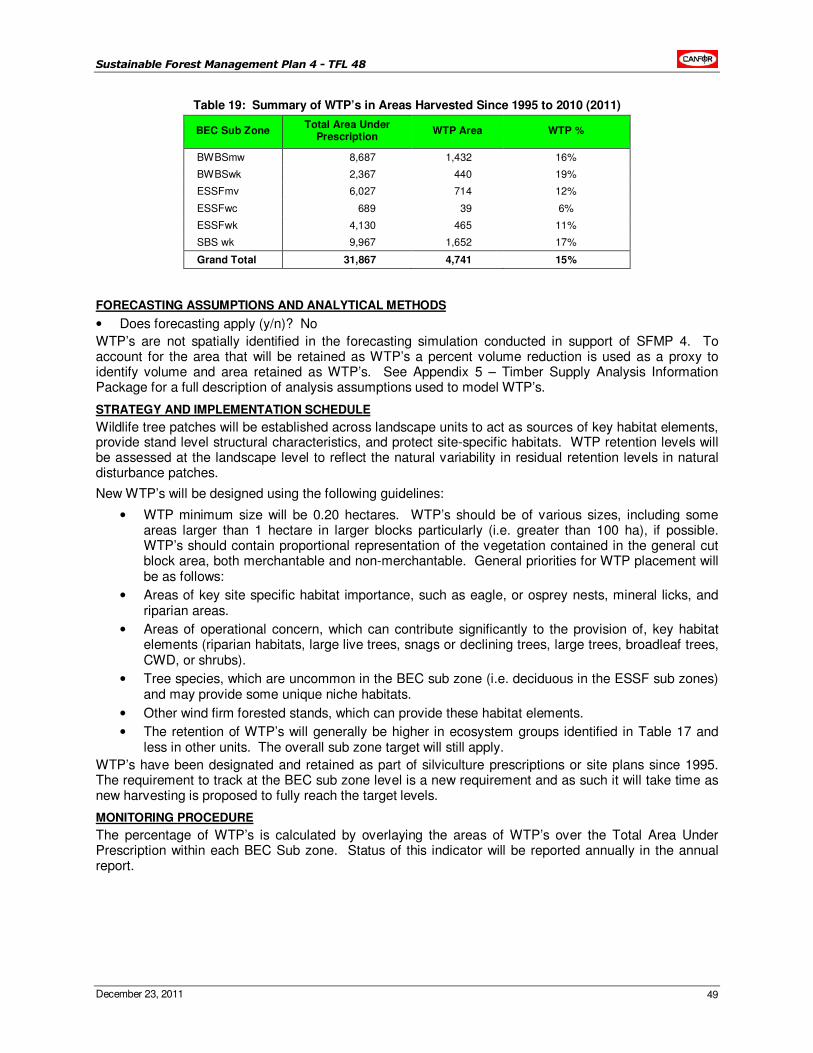
Sustainable Forest Management Plan 4 - TFL 48
December 23, 2011 49
Table 19: Summary of WTP’s in Areas Harvested Since 1995 to 2010 (2011)
BEC Sub Zone Total Area Under
Prescription WTP Area WTP %
BWBSmw 8,687 1,432 16%
BWBSwk 2,367 440 19%
ESSFmv 6,027 714 12%
ESSFwc 689 39 6%
ESSFwk 4,130 465 11%
SBS wk 9,967 1,652 17%
Grand Total 31,867 4,741 15%
FORECASTING ASSUMPTIONS AND ANALYTICAL METHODS
• Does forecasting apply (y/n)? No
WTP’s are not spatially identified in the forecasting simulation conducted in support of SFMP 4. To account for the area that will be retained as WTP’s a percent volume reduction is used as a proxy to identify volume and area retained as WTP’s. See Appendix 5 – Timber Supply Analysis Information Package for a full description of analysis assumptions used to model WTP’s.
STRATEGY AND IMPLEMENTATION SCHEDULE
Wildlife tree patches will be established across landscape units to act as sources of key habitat elements, provide stand level structural characteristics, and protect site-specific habitats. WTP retention levels will be assessed at the landscape level to reflect the natural variability in residual retention levels in natural disturbance patches.
New WTP’s will be designed using the following guidelines:
• WTP minimum size will be 0.20 hectares. WTP’s should be of various sizes, including some areas larger than 1 hectare in larger blocks particularly (i.e. greater than 100 ha), if possible. WTP’s should contain proportional representation of the vegetation contained in the general cut block area, both merchantable and non-merchantable. General priorities for WTP placement will be as follows:
• Areas of key site specific habitat importance, such as eagle, or osprey nests, mineral licks, and riparian areas.
• Areas of operational concern, which can contribute significantly to the provision of, key habitat elements (riparian habitats, large live trees, snags or declining trees, large trees, broadleaf trees, CWD, or shrubs).
• Tree species, which are uncommon in the BEC sub zone (i.e. deciduous in the ESSF sub zones) and may provide some unique niche habitats.
• Other wind firm forested stands, which can provide these habitat elements.
• The retention of WTP’s will generally be higher in ecosystem groups identified in Table 17 and less in other units. The overall sub zone target will still apply.
WTP’s have been designated and retained as part of silviculture prescriptions or site plans since 1995. The requirement to track at the BEC sub zone level is a new requirement and as such it will take time as new harvesting is proposed to fully reach the target levels.
MONITORING PROCEDURE
The percentage of WTP’s is calculated by overlaying the areas of WTP’s over the Total Area Under Prescription within each BEC Sub zone. Status of this indicator will be reported annually in the annual report.
Sustainable Forest Management Plan 4 - TFL 48
December 23, 2011 50
Formula:
%WTP BEC Subzone = (WTP BEC Subzone / TAUP BEC Subzone)*100
Variables:
%WTP BEC Subzone Percent area in wildlife tree patches relative to the total area under prescription by Biogeoclimatic Ecosystem Classification Sub zone.
WTP BEC Subzone Area in wildlife tree patches by Biogeoclimatic Ecosystem Classification Sub zone.
TAUP BEC Subzone Total Area Under Prescription by Biogeoclimatic Ecosystem Classification Sub zone.
LINKAGES TO OPERATIONAL PLANS
Silviculture prescriptions and site plans prescribe the areas to be retained as WTP’s.
3.7 Average Minimum Width of RRZ and RMZ
Criterion 1: Element(s): 1.2, 3.2
Biological Diversity Species Diversity; Water Quality and Quantity
CSA Core Indicator(s): 1.2.1: Degree of habitat protection for selected focal species, including species at risk
3.2.1: Proportion of watershed or water management areas with recent stand-replacing disturbance
Indicator Statement Target Statement
Average minimum width of retention by Riparian Reserve Zone or Riparian Management Zone by appropriate stream, lake or wetland classification within cutblocks
We will meet or exceed the regulatory retention widths by Riparian Reserve Zone by appropriate stream, lake or wetland classification within cutblocks
Value(s): Native Species Richness, Water Quality and Quantity
SFM Objective:
We will sustain sufficient and appropriately distributed suitable habitat elements to maintain native species richness.
We will maintain water quality and quantity.
Linkage to TFL 48 Licence: For the purposes of sections 2.27(f) and (g) of the TFL 48 Licence this SFM Objective(s), Indicator Statement, Target Statement, Acceptable Variance, and Strategy and Implementation Schedule are submitted to the MoFR for approval.
Canfor common indicator statement: Number of non-conformances where forest operations are not consistent with riparian management requirements as identified in operation plans
ACCEPTABLE VARIANCE
The only acceptable variances will be where the district manager has approved removal within the Riparian Management Zone because of specific issues, such as removal of timber infested with Mountain Pine Beetle.
WHAT IS THIS INDICATOR AND WHY IS IT IMPORTANT?
Riparian areas occur adjacent to wetlands or bodies of water such as rivers, streams, or lakes. Riparian habitats include the stream bank and flood plain area adjacent to streams or waterbodies. On larger streams particularly, riparian areas often provide productive, structurally diverse habitats. In addition to providing ready access to water, these areas also support important characteristics such as coarse woody debris, cavity sites, shrubs and broadleaf trees, which have been identified as key habitat elements necessary to support species richness.
Riparian reserve zones (RRZ’s) are specific areas on larger fish bearing streams, in which harvesting is not normally permitted, in order to protect significant riparian and aquatic habitats. Maintaining RRZ’s provides many of the habitat elements needed to support a diverse species mix across the landscape.
Minimum RRZ’s do not apply to road right of ways of roads that cross streams.
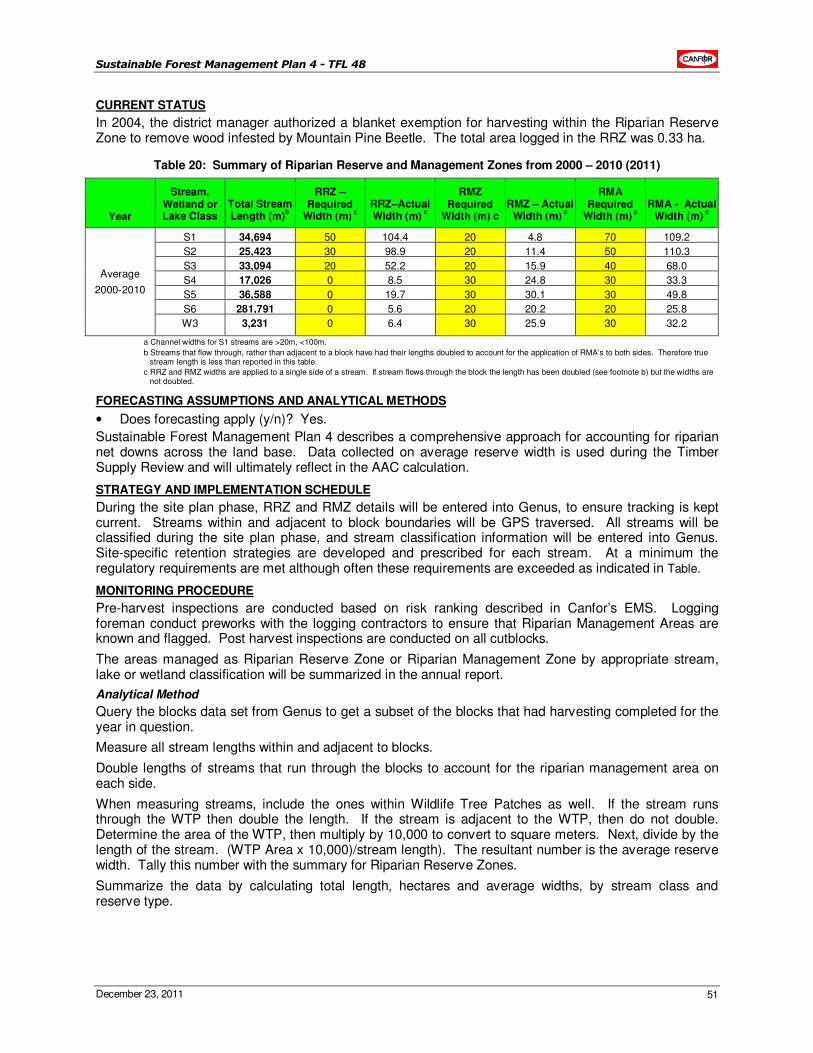
Sustainable Forest Management Plan 4 - TFL 48
December 23, 2011 51
CURRENT STATUS
In 2004, the district manager authorized a blanket exemption for harvesting within the Riparian Reserve Zone to remove wood infested by Mountain Pine Beetle. The total area logged in the RRZ was 0.33 ha.
Table 20: Summary of Riparian Reserve and Management Zones from 2000 – 2010 (2011)
Year
Stream, Wetland or Lake Class
Total Stream Length (m)
b
RRZ – Required
Width (m) c
RRZ–Actual Width (m)
c
RMZ Required
Width (m) c RMZ – Actual
Width (m) c
RMA Required
Width (m) c
RMA - Actual Width (m)
c
Average
2000-2010
S1 34,694 50 104.4 20 4.8 70 109.2
S2 25,423 30 98.9 20 11.4 50 110.3
S3 33,094 20 52.2 20 15.9 40 68.0
S4 17,026 0 8.5 30 24.8 30 33.3
S5 36,588 0 19.7 30 30.1 30 49.8
S6 281,791 0 5.6 20 20.2 20 25.8
W3 3,231 0 6.4 30 25.9 30 32.2
a Channel widths for S1 streams are >20m, <100m.
b Streams that flow through, rather than adjacent to a block have had their lengths doubled to account for the application of RMA’s to both sides. Therefore true stream length is less than reported in this table.
c RRZ and RMZ widths are applied to a single side of a stream. If stream flows through the block the length has been doubled (see footnote b) but the widths are not doubled.
FORECASTING ASSUMPTIONS AND ANALYTICAL METHODS
• Does forecasting apply (y/n)? Yes.
Sustainable Forest Management Plan 4 describes a comprehensive approach for accounting for riparian net downs across the land base. Data collected on average reserve width is used during the Timber Supply Review and will ultimately reflect in the AAC calculation.
STRATEGY AND IMPLEMENTATION SCHEDULE
During the site plan phase, RRZ and RMZ details will be entered into Genus, to ensure tracking is kept current. Streams within and adjacent to block boundaries will be GPS traversed. All streams will be classified during the site plan phase, and stream classification information will be entered into Genus. Site-specific retention strategies are developed and prescribed for each stream. At a minimum the regulatory requirements are met although often these requirements are exceeded as indicated in Table.
MONITORING PROCEDURE
Pre-harvest inspections are conducted based on risk ranking described in Canfor’s EMS. Logging foreman conduct preworks with the logging contractors to ensure that Riparian Management Areas are known and flagged. Post harvest inspections are conducted on all cutblocks.
The areas managed as Riparian Reserve Zone or Riparian Management Zone by appropriate stream, lake or wetland classification will be summarized in the annual report.
Analytical Method
Query the blocks data set from Genus to get a subset of the blocks that had harvesting completed for the year in question.
Measure all stream lengths within and adjacent to blocks.
Double lengths of streams that run through the blocks to account for the riparian management area on each side.
When measuring streams, include the ones within Wildlife Tree Patches as well. If the stream runs through the WTP then double the length. If the stream is adjacent to the WTP, then do not double. Determine the area of the WTP, then multiply by 10,000 to convert to square meters. Next, divide by the length of the stream. (WTP Area x 10,000)/stream length). The resultant number is the average reserve width. Tally this number with the summary for Riparian Reserve Zones.
Summarize the data by calculating total length, hectares and average widths, by stream class and reserve type.
Sustainable Forest Management Plan 4 - TFL 48
December 23, 2011 52
LINKAGES TO OPERATIONAL PLANS
The location, classification and, where applicable, RRZ requirements of waterbodies will be included in SP’s and/or operational maps used for timber harvesting, road construction and silviculture activities.
Field foresters will identify site specific requirements for the protection of reserve zones, and management practices will be included in SP’s.
Preworks completed prior to harvesting, road construction or silviculture activities will review RRZ’s size and location, and any site specific protection measures.
3.8 Shrubs/Early Forest
Criterion 1: Element(s): 1.2
Biological Diversity Species Diversity
CSA Core Indicator(s): 1.2.1: Degree of habitat protection for selected focal species, including species at risk
Indicator Statement Target Statement
The minimum proportion of shrub habitat (%) by Natural Disturbance Unit
Each Natural Disturbance Unit will meet or exceed the baseline target (%) proportion of shrub habitat (Table 21)
Value(s): Native Species Richness
SFM Objective:
We will sustain sufficient and appropriately distributed habitat elements to maintain native species richness.
Linkage to TFL 48 Licence: N/A.
Canfor common indicator statement: NA
ACCEPTABLE VARIANCE
Acceptable variance is ± 20% of the baseline target.
WHAT IS THIS INDICATOR AND WHY IS IT IMPORTANT?
Shrubs are defined in the Vegetation Resource Inventory (VRI) BCLCS Level 4 as either shrub low (SL) or shrub tall (ST). Forest or harvested sites less than 30 years old are also considered to contribute to shrub habitat in the DFA.
Shrubs are common in riparian areas, and readily enter larger forest openings, especially on moist sites. As the stand closes they are suppressed by the taller trees, and remain uncommon until the stand naturally opens. Many species respond positively to shrub abundance, and shrub abundance is influenced by forest practices (Bunnell 1999).
In a review of the vertebrates known to be within TFL 48 Bunnell (2005) found that 41%, 42% and 35% were restricted to or favoured shrub or early seral habitat in the BWBS, ESSF and SBS biogeoclimatic zones respectively.
CURRENT STATUS
The following table (21) indicates the current and post FDP condition of shrub habitat within the DFA. Targets were established for this indicator by reviewing the amount of naturally occurring shrub areas by natural disturbance unit as well as forested areas less than 30 years old. Natural disturbance units with low levels of naturally occurring shrubs generally have lower targets than areas with higher levels of shrubs.
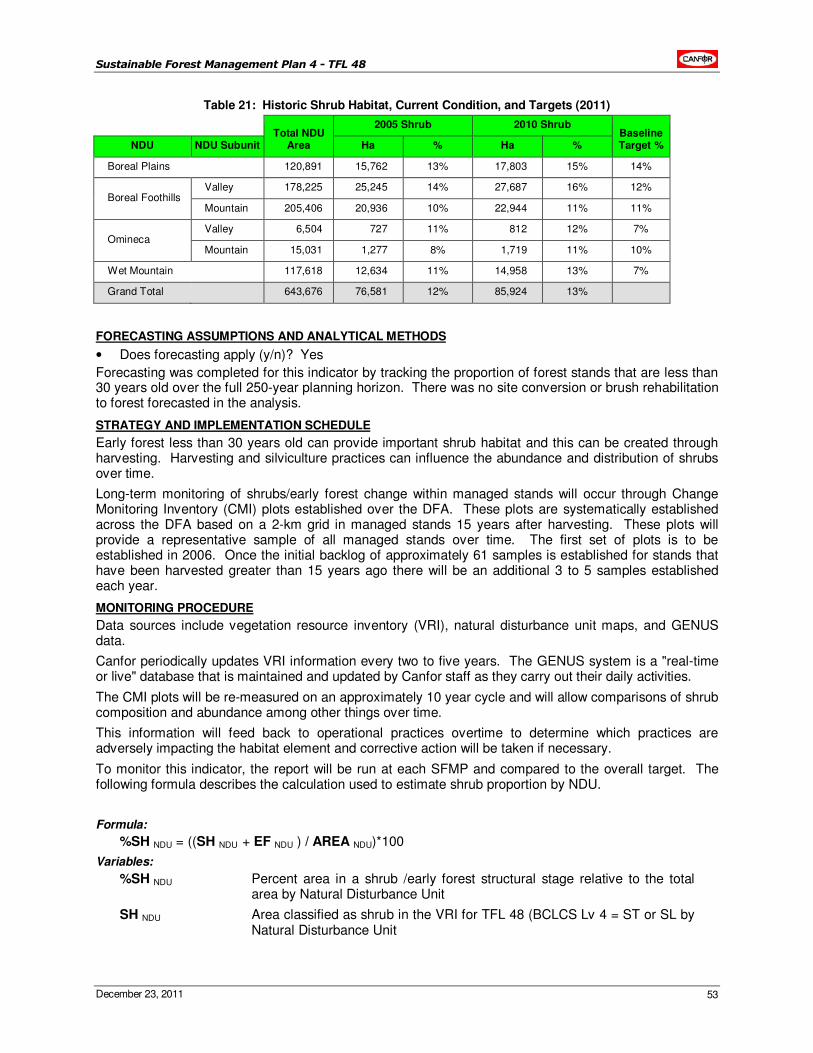
Sustainable Forest Management Plan 4 - TFL 48
December 23, 2011 53
Table 21: Historic Shrub Habitat, Current Condition, and Targets (2011)
Total NDU
Area
2005 Shrub 2010 Shrub Baseline Target % NDU NDU Subunit Ha % Ha %
Boreal Plains 120,891 15,762 13% 17,803 15% 14%
Boreal Foothills Valley 178,225 25,245 14% 27,687 16% 12%
Mountain 205,406 20,936 10% 22,944 11% 11%
Omineca Valley 6,504 727 11% 812 12% 7%
Mountain 15,031 1,277 8% 1,719 11% 10%
Wet Mountain 117,618 12,634 11% 14,958 13% 7%
Grand Total 643,676 76,581 12% 85,924 13%
FORECASTING ASSUMPTIONS AND ANALYTICAL METHODS
• Does forecasting apply (y/n)? Yes
Forecasting was completed for this indicator by tracking the proportion of forest stands that are less than 30 years old over the full 250-year planning horizon. There was no site conversion or brush rehabilitation to forest forecasted in the analysis.
STRATEGY AND IMPLEMENTATION SCHEDULE
Early forest less than 30 years old can provide important shrub habitat and this can be created through harvesting. Harvesting and silviculture practices can influence the abundance and distribution of shrubs over time.
Long-term monitoring of shrubs/early forest change within managed stands will occur through Change Monitoring Inventory (CMI) plots established over the DFA. These plots are systematically established across the DFA based on a 2-km grid in managed stands 15 years after harvesting. These plots will provide a representative sample of all managed stands over time. The first set of plots is to be established in 2006. Once the initial backlog of approximately 61 samples is established for stands that have been harvested greater than 15 years ago there will be an additional 3 to 5 samples established each year.
MONITORING PROCEDURE
Data sources include vegetation resource inventory (VRI), natural disturbance unit maps, and GENUS data.
Canfor periodically updates VRI information every two to five years. The GENUS system is a "real-time or live" database that is maintained and updated by Canfor staff as they carry out their daily activities.
The CMI plots will be re-measured on an approximately 10 year cycle and will allow comparisons of shrub composition and abundance among other things over time.
This information will feed back to operational practices overtime to determine which practices are adversely impacting the habitat element and corrective action will be taken if necessary.
To monitor this indicator, the report will be run at each SFMP and compared to the overall target. The following formula describes the calculation used to estimate shrub proportion by NDU.
Formula:
%SH NDU = ((SH NDU + EF NDU ) / AREA NDU)*100
Variables:
%SH NDU Percent area in a shrub /early forest structural stage relative to the total area by Natural Disturbance Unit
SH NDU Area classified as shrub in the VRI for TFL 48 (BCLCS Lv 4 = ST or SL by Natural Disturbance Unit
Sustainable Forest Management Plan 4 - TFL 48
December 23, 2011 54
EF NDU Area classified as Early Forest VRI for TFL 48 (BCLCS Lv 2 = T and Projected Age <30 years) by Natural Disturbance Unit
AREA NDU Total Area of Natural Disturbance Unit within TFL 48
LINKAGES TO OPERATIONAL PLANS
The data will be used at the Forest Stewardship Plan level to guide future harvest planning and will be used by the silviculture staff to review long term trends in reforestation policies and to adjust practices where necessary.
3.9 Wildlife Habitat Areas, Ungulate Winter Ranges and Dunlevy Creek Management Plan
Criterion 1: Element(s): 1.2, 1.4
Biological Diversity Species Diversity; Protected Areas and Sites of Special Biological and Cultural Significance
CSA Core Indicator(s) 1.2.1: Degree of habitat protection for selected focal species, including species at risk
1.2.2: Degree of suitable habitat in the long term for selected focal species, including species at risk
1.4.1: Proportion of identified sites with implemented management strategies
Indicator Statement Target Statement
Proportion of activities consistent with objectives of Wildlife Habitat Areas (WHA), Ungulate Winter Ranges (UWR), and Dunlevy Creek Management Plan
All forest management activities will be consistent with objectives of Wildlife Habitat Areas (WHA), Ungulate Winter Ranges (UWR), and Dunlevy Creek Management Plan
Value(s): Native Species Richness, Protected Areas and Sites of Special Geological, Biological, or Cultural Significance
SFM Objective:
We will sustain sufficient and appropriately distributed suitable habitat elements to maintain native species richness.
We will implement management strategies appropriate to the long term maintenance of protected areas and sites of special geological, biological, or cultural significance.
Linkage to TFL 48 Licence: For the purposes of sections 2.27(f) and (g) of the TFL 48 Licence this SFM Objective(s), Indicator Statement, Target Statement, Acceptable Variance, and Strategy and Implementation Schedule are submitted to the MoFR for approval.
Canfor common indicator statement: NA
ACCEPTABLE VARIANCE
No variances unless authorized by the Regional Manager Ministry of Environment.
WHAT IS THIS INDICATOR AND WHY IS IT IMPORTANT?
Consistency with the objectives of WHA's and UWR's ensures the protection of specific features and critical habitat. The objectives designed for these areas generally allow activities provided that protection of the special features of these areas is maintained.
Wildlife Habitat Areas are mapped areas of habitat that are biologically limiting to a species or are remaining examples of identified plant communities. They are established by MWLAP to protect critical habitat elements for one or more species of Identified Wildlife. Identified Wildlife are considered to be sensitive to habitat alteration associated with forest and range practices and are considered to be at risk (i.e. endangered, threatened, vulnerable, or regionally important).
Ungulate Winter Range refers to an area that is identified as being necessary for the winter survival of an ungulate species.
Dunlevy Creek Management Plan (DCMP) refers to a special management plan for the Dunlevy block of the TFL developed and prepared during the term of MP 3 by the Ministry of Sustainable Resource
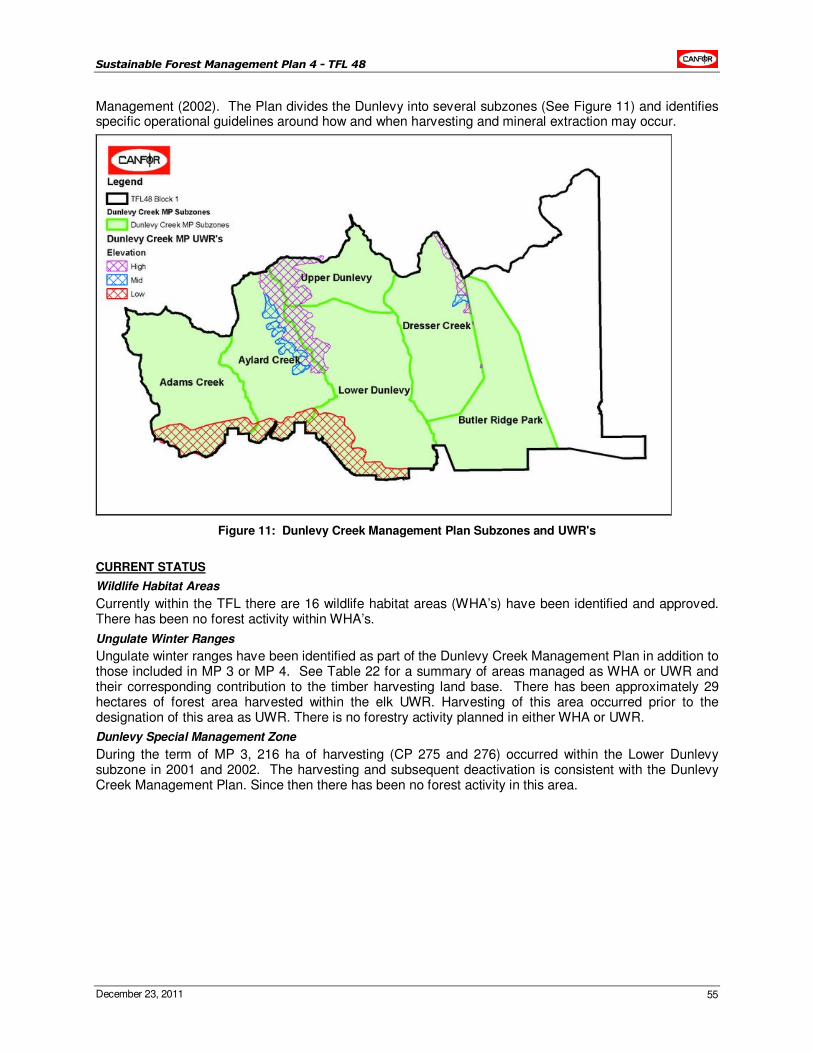
Sustainable Forest Management Plan 4 - TFL 48
December 23, 2011 55
Management (2002). The Plan divides the Dunlevy into several subzones (See Figure 11) and identifies specific operational guidelines around how and when harvesting and mineral extraction may occur.
Figure 11: Dunlevy Creek Management Plan Subzones and UWR's
CURRENT STATUS
Wildlife Habitat Areas
Currently within the TFL there are 16 wildlife habitat areas (WHA’s) have been identified and approved. There has been no forest activity within WHA’s.
Ungulate Winter Ranges
Ungulate winter ranges have been identified as part of the Dunlevy Creek Management Plan in addition to those included in MP 3 or MP 4. See Table 22 for a summary of areas managed as WHA or UWR and their corresponding contribution to the timber harvesting land base. There has been approximately 29 hectares of forest area harvested within the elk UWR. Harvesting of this area occurred prior to the designation of this area as UWR. There is no forestry activity planned in either WHA or UWR.
Dunlevy Special Management Zone
During the term of MP 3, 216 ha of harvesting (CP 275 and 276) occurred within the Lower Dunlevy subzone in 2001 and 2002. The harvesting and subsequent deactivation is consistent with the Dunlevy Creek Management Plan. Since then there has been no forest activity in this area.
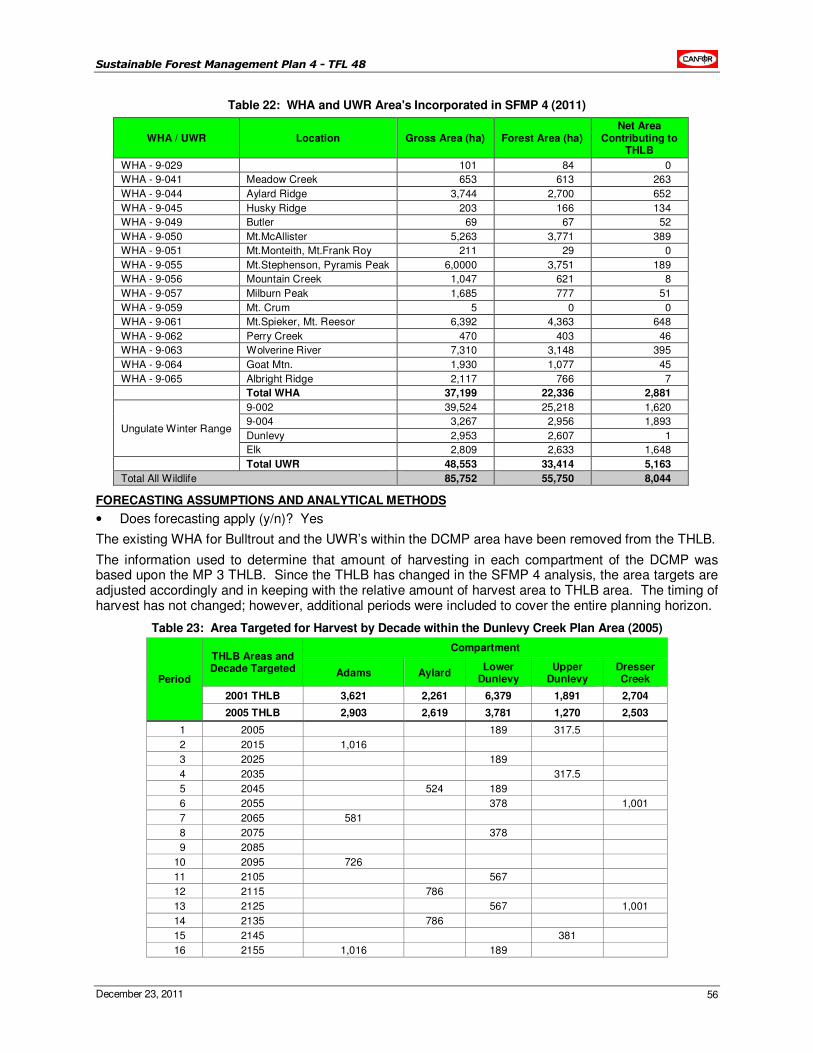
Sustainable Forest Management Plan 4 - TFL 48
December 23, 2011 56
Table 22: WHA and UWR Area's Incorporated in SFMP 4 (2011)
WHA / UWR Location Gross Area (ha) Forest Area (ha) Net Area
Contributing to THLB
WHA - 9-029 101 84 0
WHA - 9-041 Meadow Creek 653 613 263
WHA - 9-044 Aylard Ridge 3,744 2,700 652
WHA - 9-045 Husky Ridge 203 166 134
WHA - 9-049 Butler 69 67 52
WHA - 9-050 Mt.McAllister 5,263 3,771 389
WHA - 9-051 Mt.Monteith, Mt.Frank Roy 211 29 0
WHA - 9-055 Mt.Stephenson, Pyramis Peak 6,0000 3,751 189
WHA - 9-056 Mountain Creek 1,047 621 8
WHA - 9-057 Milburn Peak 1,685 777 51
WHA - 9-059 Mt. Crum 5 0 0
WHA - 9-061 Mt.Spieker, Mt. Reesor 6,392 4,363 648
WHA - 9-062 Perry Creek 470 403 46
WHA - 9-063 Wolverine River 7,310 3,148 395
WHA - 9-064 Goat Mtn. 1,930 1,077 45
WHA - 9-065 Albright Ridge 2,117 766 7
Total WHA 37,199 22,336 2,881
Ungulate Winter Range
9-002 39,524 25,218 1,620
9-004 3,267 2,956 1,893
Dunlevy 2,953 2,607 1
Elk 2,809 2,633 1,648
Total UWR 48,553 33,414 5,163
Total All Wildlife 85,752 55,750 8,044
FORECASTING ASSUMPTIONS AND ANALYTICAL METHODS
• Does forecasting apply (y/n)? Yes
The existing WHA for Bulltrout and the UWR’s within the DCMP area have been removed from the THLB.
The information used to determine that amount of harvesting in each compartment of the DCMP was based upon the MP 3 THLB. Since the THLB has changed in the SFMP 4 analysis, the area targets are adjusted accordingly and in keeping with the relative amount of harvest area to THLB area. The timing of harvest has not changed; however, additional periods were included to cover the entire planning horizon.
Table 23: Area Targeted for Harvest by Decade within the Dunlevy Creek Plan Area (2005)
Period
THLB Areas and Decade Targeted
Compartment
Adams Aylard Lower
Dunlevy Upper
Dunlevy Dresser Creek
2001 THLB 3,621 2,261 6,379 1,891 2,704
2005 THLB 2,903 2,619 3,781 1,270 2,503
1 2005 189 317.5
2 2015 1,016
3 2025 189
4 2035 317.5
5 2045 524 189
6 2055 378 1,001
7 2065 581
8 2075 378
9 2085
10 2095 726
11 2105 567
12 2115 786
13 2125 567 1,001
14 2135 786
15 2145 381
16 2155 1,016 189
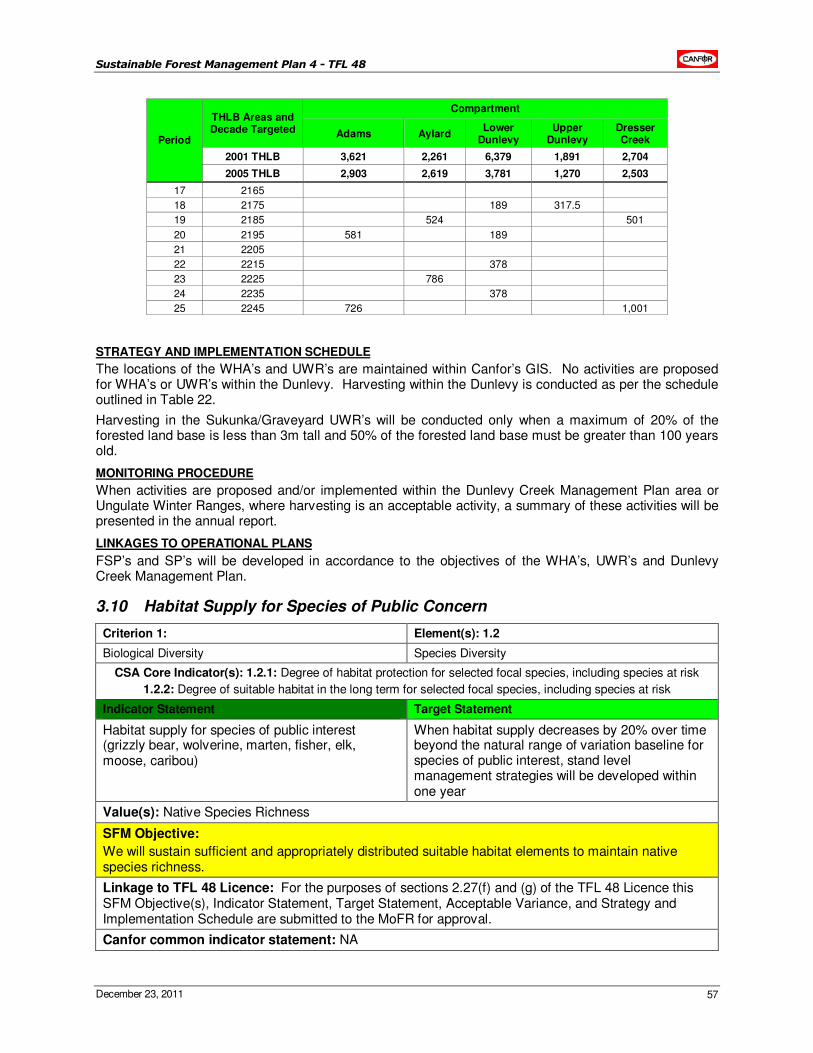
Sustainable Forest Management Plan 4 - TFL 48
December 23, 2011 57
Period
THLB Areas and Decade Targeted
Compartment
Adams Aylard Lower
Dunlevy Upper
Dunlevy Dresser Creek
2001 THLB 3,621 2,261 6,379 1,891 2,704
2005 THLB 2,903 2,619 3,781 1,270 2,503
17 2165
18 2175 189 317.5
19 2185 524 501
20 2195 581 189
21 2205
22 2215 378
23 2225 786
24 2235 378
25 2245 726 1,001
STRATEGY AND IMPLEMENTATION SCHEDULE
The locations of the WHA’s and UWR’s are maintained within Canfor’s GIS. No activities are proposed for WHA’s or UWR’s within the Dunlevy. Harvesting within the Dunlevy is conducted as per the schedule outlined in Table 22.
Harvesting in the Sukunka/Graveyard UWR’s will be conducted only when a maximum of 20% of the forested land base is less than 3m tall and 50% of the forested land base must be greater than 100 years old.
MONITORING PROCEDURE
When activities are proposed and/or implemented within the Dunlevy Creek Management Plan area or Ungulate Winter Ranges, where harvesting is an acceptable activity, a summary of these activities will be presented in the annual report.
LINKAGES TO OPERATIONAL PLANS
FSP’s and SP’s will be developed in accordance to the objectives of the WHA’s, UWR’s and Dunlevy Creek Management Plan.
3.10 Habitat Supply for Species of Public Concern
Criterion 1: Element(s): 1.2
Biological Diversity Species Diversity
CSA Core Indicator(s): 1.2.1: Degree of habitat protection for selected focal species, including species at risk
1.2.2: Degree of suitable habitat in the long term for selected focal species, including species at risk
Indicator Statement Target Statement
Habitat supply for species of public interest (grizzly bear, wolverine, marten, fisher, elk, moose, caribou)
When habitat supply decreases by 20% over time beyond the natural range of variation baseline for species of public interest, stand level management strategies will be developed within one year
Value(s): Native Species Richness
SFM Objective:
We will sustain sufficient and appropriately distributed suitable habitat elements to maintain native species richness.
Linkage to TFL 48 Licence: For the purposes of sections 2.27(f) and (g) of the TFL 48 Licence this SFM Objective(s), Indicator Statement, Target Statement, Acceptable Variance, and Strategy and Implementation Schedule are submitted to the MoFR for approval.
Canfor common indicator statement: NA
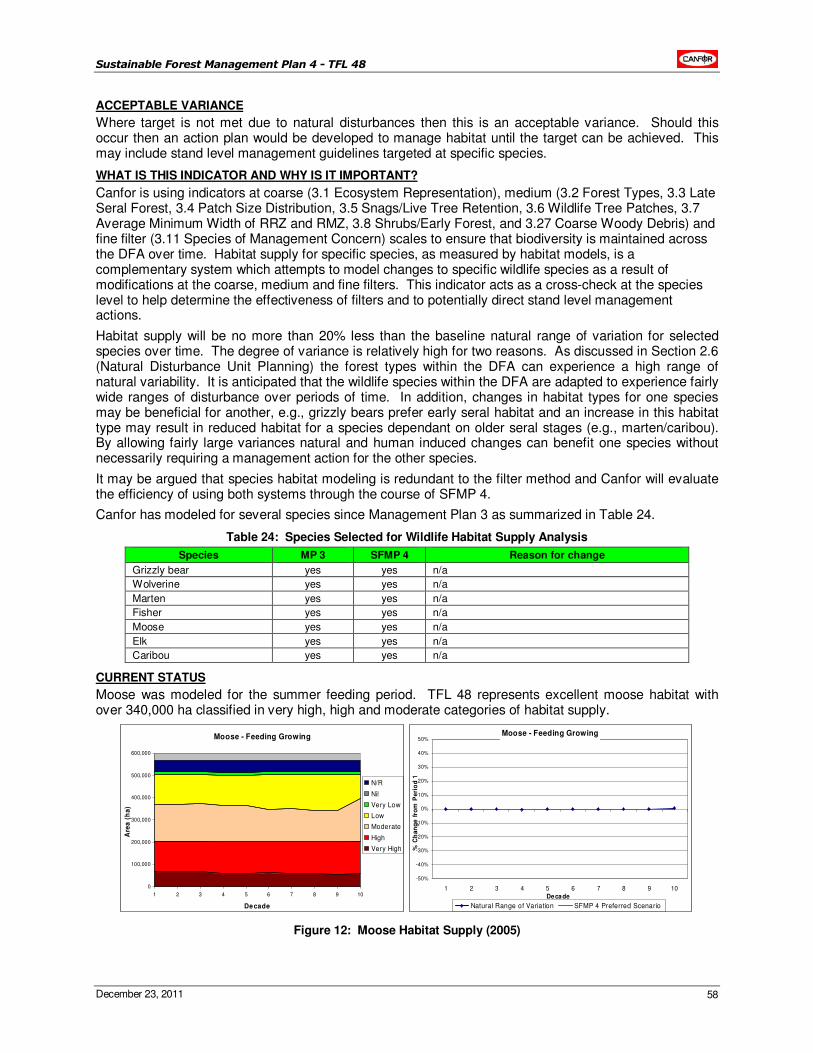
Sustainable Forest Management Plan 4 - TFL 48
December 23, 2011 58
ACCEPTABLE VARIANCE
Where target is not met due to natural disturbances then this is an acceptable variance. Should this occur then an action plan would be developed to manage habitat until the target can be achieved. This may include stand level management guidelines targeted at specific species.
WHAT IS THIS INDICATOR AND WHY IS IT IMPORTANT?
Canfor is using indicators at coarse (3.1 Ecosystem Representation), medium (3.2 Forest Types, 3.3 Late Seral Forest, 3.4 Patch Size Distribution, 3.5 Snags/Live Tree Retention, 3.6 Wildlife Tree Patches, 3.7 Average Minimum Width of RRZ and RMZ, 3.8 Shrubs/Early Forest, and 3.27 Coarse Woody Debris) and fine filter (3.11 Species of Management Concern) scales to ensure that biodiversity is maintained across the DFA over time. Habitat supply for specific species, as measured by habitat models, is a complementary system which attempts to model changes to specific wildlife species as a result of modifications at the coarse, medium and fine filters. This indicator acts as a cross-check at the species level to help determine the effectiveness of filters and to potentially direct stand level management actions.
Habitat supply will be no more than 20% less than the baseline natural range of variation for selected species over time. The degree of variance is relatively high for two reasons. As discussed in Section 2.6 (Natural Disturbance Unit Planning) the forest types within the DFA can experience a high range of natural variability. It is anticipated that the wildlife species within the DFA are adapted to experience fairly wide ranges of disturbance over periods of time. In addition, changes in habitat types for one species may be beneficial for another, e.g., grizzly bears prefer early seral habitat and an increase in this habitat type may result in reduced habitat for a species dependant on older seral stages (e.g., marten/caribou). By allowing fairly large variances natural and human induced changes can benefit one species without necessarily requiring a management action for the other species.
It may be argued that species habitat modeling is redundant to the filter method and Canfor will evaluate the efficiency of using both systems through the course of SFMP 4.
Canfor has modeled for several species since Management Plan 3 as summarized in Table 24.
Table 24: Species Selected for Wildlife Habitat Supply Analysis
Species MP 3 SFMP 4 Reason for change
Grizzly bear yes yes n/a
Wolverine yes yes n/a
Marten yes yes n/a
Fisher yes yes n/a
Moose yes yes n/a
Elk yes yes n/a
Caribou yes yes n/a
CURRENT STATUS
Moose was modeled for the summer feeding period. TFL 48 represents excellent moose habitat with over 340,000 ha classified in very high, high and moderate categories of habitat supply.
Moose - Feeding Growing
0
100,000
200,000
300,000
400,000
500,000
600,000
1 2 3 4 5 6 7 8 9 10
Decade
Are
a (
ha
)
N/R
Nil
Very Low
Low
Moderate
High
Very High
Moose - Feeding Growing
-50%
-40%
-30%
-20%
-10%
0%
10%
20%
30%
40%
50%
1 2 3 4 5 6 7 8 9 10Decade
% C
ha
ng
e f
rom
Pe
rio
d 1
Natural Range of Variation SFMP 4 Preferred Scenario
Figure 12: Moose Habitat Supply (2005)
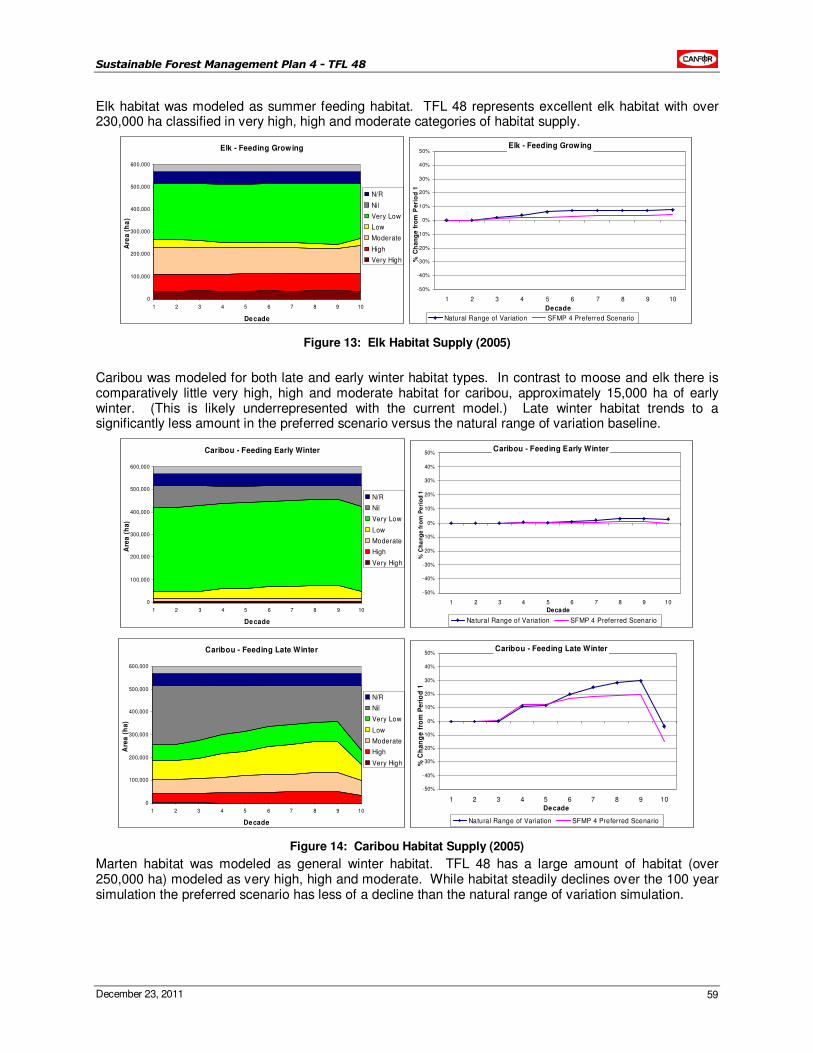
Sustainable Forest Management Plan 4 - TFL 48
December 23, 2011 59
Elk habitat was modeled as summer feeding habitat. TFL 48 represents excellent elk habitat with over 230,000 ha classified in very high, high and moderate categories of habitat supply.
Elk - Feeding Growing
0
100,000
200,000
300,000
400,000
500,000
600,000
1 2 3 4 5 6 7 8 9 10
Decade
Are
a (
ha
)
N/R
Nil
Very Low
Low
Moderate
High
Very High
Elk - Feeding Growing
-50%
-40%
-30%
-20%
-10%
0%
10%
20%
30%
40%
50%
1 2 3 4 5 6 7 8 9 10
Decade
% C
ha
ng
e f
rom
Pe
rio
d 1
Natural Range of Variation SFMP 4 Preferred Scenario
Figure 13: Elk Habitat Supply (2005)
Caribou was modeled for both late and early winter habitat types. In contrast to moose and elk there is comparatively little very high, high and moderate habitat for caribou, approximately 15,000 ha of early winter. (This is likely underrepresented with the current model.) Late winter habitat trends to a significantly less amount in the preferred scenario versus the natural range of variation baseline.
Caribou - Feeding Early Winter
0
100,000
200,000
300,000
400,000
500,000
600,000
1 2 3 4 5 6 7 8 9 10
Decade
Are
a (
ha
)
N/R
Nil
Very Low
Low
Moderate
High
Very High
Caribou - Feeding Early Winter
-50%
-40%
-30%
-20%
-10%
0%
10%
20%
30%
40%
50%
1 2 3 4 5 6 7 8 9 10
Decade
% C
ha
ng
e f
rom
Pe
rio
d 1
Natural Range of Variation SFMP 4 Preferred Scenario
Caribou - Feeding Late Winter
0
100,000
200,000
300,000
400,000
500,000
600,000
1 2 3 4 5 6 7 8 9 10
Decade
Are
a (
ha
)
N/R
Nil
Very Low
Low
Moderate
High
Very High
Caribou - Feeding Late Winter
-50%
-40%
-30%
-20%
-10%
0%
10%
20%
30%
40%
50%
1 2 3 4 5 6 7 8 9 10
Decade
% C
ha
ng
e f
rom
Pe
rio
d 1
Natural Range of Variation SFMP 4 Preferred Scenario
Figure 14: Caribou Habitat Supply (2005)
Marten habitat was modeled as general winter habitat. TFL 48 has a large amount of habitat (over 250,000 ha) modeled as very high, high and moderate. While habitat steadily declines over the 100 year simulation the preferred scenario has less of a decline than the natural range of variation simulation.
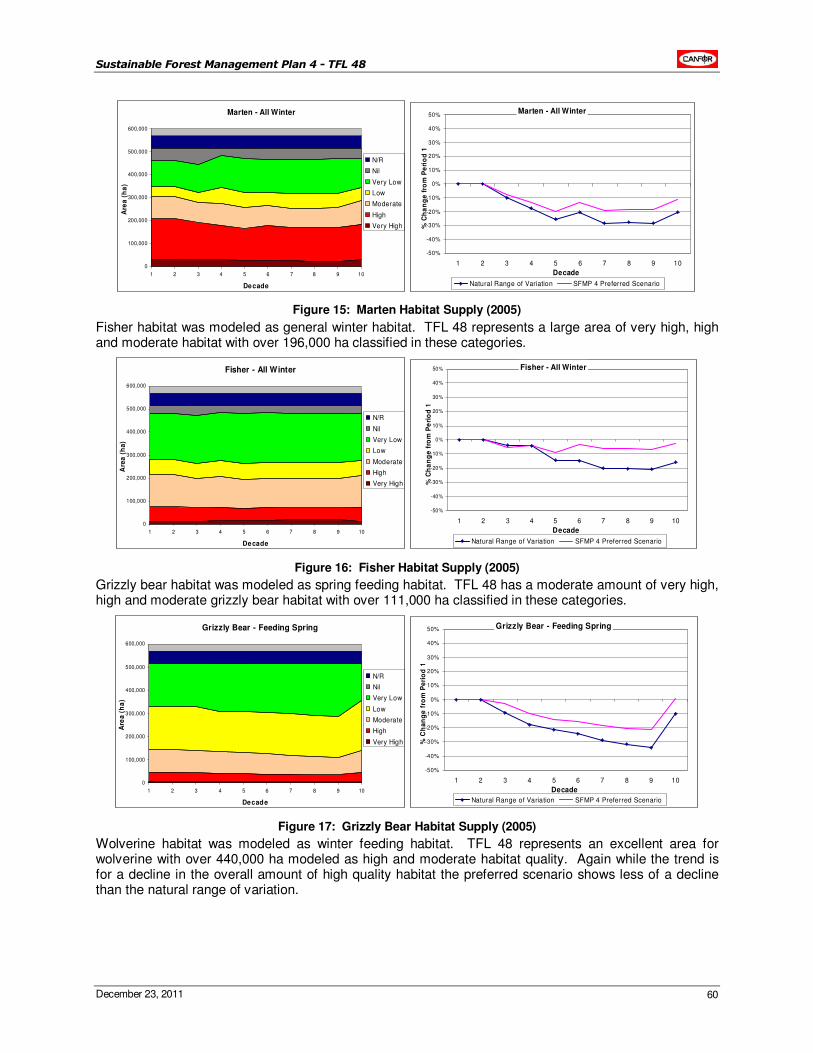
Sustainable Forest Management Plan 4 - TFL 48
December 23, 2011 60
Marten - All Winter
0
100,000
200,000
300,000
400,000
500,000
600,000
1 2 3 4 5 6 7 8 9 10
Decade
Are
a (
ha
)
N/R
Nil
Very Low
Low
Moderate
High
Very High
Marten - All Winter
-50%
-40%
-30%
-20%
-10%
0%
10%
20%
30%
40%
50%
1 2 3 4 5 6 7 8 9 10
Decade
% C
ha
ng
e f
rom
Pe
rio
d 1
Natural Range of Variation SFMP 4 Preferred Scenario
Figure 15: Marten Habitat Supply (2005)
Fisher habitat was modeled as general winter habitat. TFL 48 represents a large area of very high, high and moderate habitat with over 196,000 ha classified in these categories.
Fisher - All Winter
0
100,000
200,000
300,000
400,000
500,000
600,000
1 2 3 4 5 6 7 8 9 10
Decade
Are
a (
ha
)
N/R
Nil
Very Low
Low
Moderate
High
Very High
Fisher - All Winter
-50%
-40%
-30%
-20%
-10%
0%
10%
20%
30%
40%
50%
1 2 3 4 5 6 7 8 9 10
Decade
% C
ha
ng
e f
rom
Pe
rio
d 1
Natural Range of Variation SFMP 4 Preferred Scenario
Figure 16: Fisher Habitat Supply (2005)
Grizzly bear habitat was modeled as spring feeding habitat. TFL 48 has a moderate amount of very high, high and moderate grizzly bear habitat with over 111,000 ha classified in these categories.
Grizzly Bear - Feeding Spring
0
100,000
200,000
300,000
400,000
500,000
600,000
1 2 3 4 5 6 7 8 9 10
Decade
Are
a (
ha
)
N/R
Nil
Very Low
Low
Moderate
High
Very High
Grizzly Bear - Feeding Spring
-50%
-40%
-30%
-20%
-10%
0%
10%
20%
30%
40%
50%
1 2 3 4 5 6 7 8 9 10
Decade
% C
ha
ng
e f
rom
Pe
rio
d 1
Natural Range of Variation SFMP 4 Preferred Scenario
Figure 17: Grizzly Bear Habitat Supply (2005)
Wolverine habitat was modeled as winter feeding habitat. TFL 48 represents an excellent area for wolverine with over 440,000 ha modeled as high and moderate habitat quality. Again while the trend is for a decline in the overall amount of high quality habitat the preferred scenario shows less of a decline than the natural range of variation.
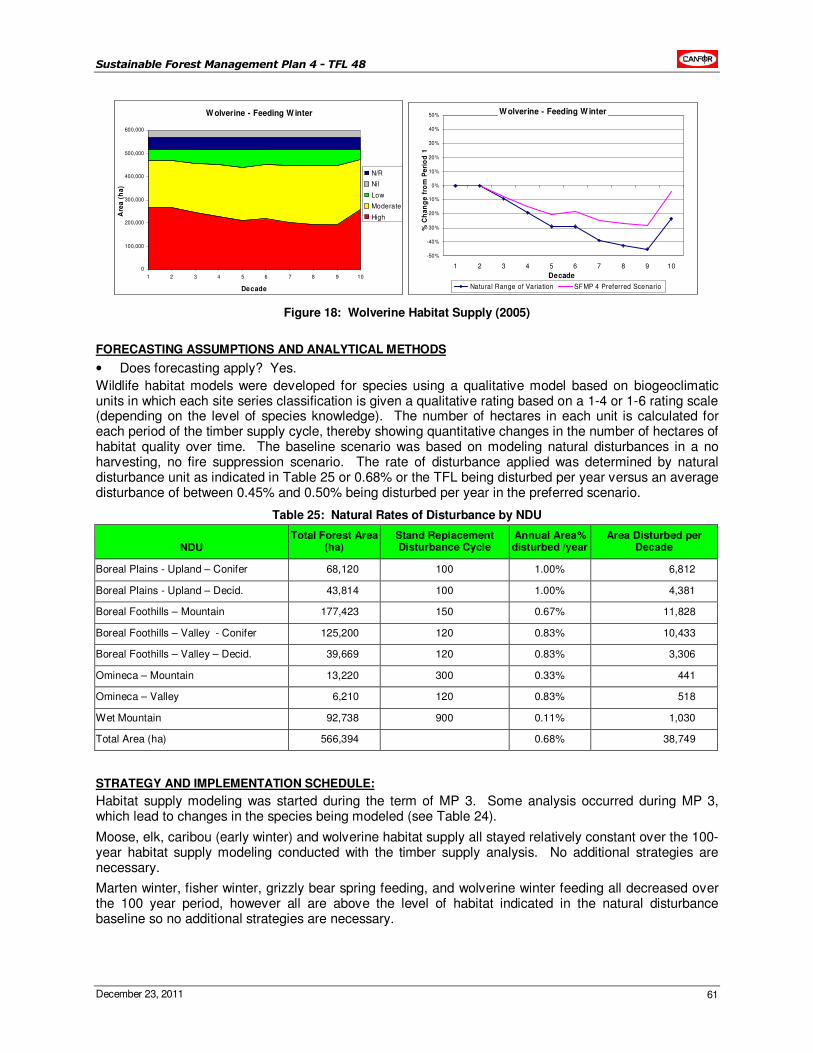
Sustainable Forest Management Plan 4 - TFL 48
December 23, 2011 61
W olverine - Feeding W inter
0
100,000
200,000
300,000
400,000
500,000
600,000
1 2 3 4 5 6 7 8 9 10
Decade
Are
a (
ha
)
N/R
Nil
Low
Moderate
High
W olverine - Feeding W inter
-50%
-40%
-30%
-20%
-10%
0%
10%
20%
30%
40%
50%
1 2 3 4 5 6 7 8 9 10
Decade
% C
ha
ng
e f
rom
Pe
rio
d 1
Natural Range of Variation SFMP 4 Preferred Scenario
Figure 18: Wolverine Habitat Supply (2005)
FORECASTING ASSUMPTIONS AND ANALYTICAL METHODS
• Does forecasting apply? Yes.
Wildlife habitat models were developed for species using a qualitative model based on biogeoclimatic units in which each site series classification is given a qualitative rating based on a 1-4 or 1-6 rating scale (depending on the level of species knowledge). The number of hectares in each unit is calculated for each period of the timber supply cycle, thereby showing quantitative changes in the number of hectares of habitat quality over time. The baseline scenario was based on modeling natural disturbances in a no harvesting, no fire suppression scenario. The rate of disturbance applied was determined by natural disturbance unit as indicated in Table 25 or 0.68% or the TFL being disturbed per year versus an average disturbance of between 0.45% and 0.50% being disturbed per year in the preferred scenario.
Table 25: Natural Rates of Disturbance by NDU
NDU Total Forest Area
(ha) Stand Replacement Disturbance Cycle
Annual Area% disturbed /year
Area Disturbed per Decade
Boreal Plains - Upland – Conifer 68,120 100 1.00% 6,812
Boreal Plains - Upland – Decid. 43,814 100 1.00% 4,381
Boreal Foothills – Mountain 177,423 150 0.67% 11,828
Boreal Foothills – Valley - Conifer 125,200 120 0.83% 10,433
Boreal Foothills – Valley – Decid. 39,669 120 0.83% 3,306
Omineca – Mountain 13,220 300 0.33% 441
Omineca – Valley 6,210 120 0.83% 518
Wet Mountain 92,738 900 0.11% 1,030
Total Area (ha) 566,394 0.68% 38,749
STRATEGY AND IMPLEMENTATION SCHEDULE:
Habitat supply modeling was started during the term of MP 3. Some analysis occurred during MP 3, which lead to changes in the species being modeled (see Table 24).
Moose, elk, caribou (early winter) and wolverine habitat supply all stayed relatively constant over the 100-year habitat supply modeling conducted with the timber supply analysis. No additional strategies are necessary.
Marten winter, fisher winter, grizzly bear spring feeding, and wolverine winter feeding all decreased over the 100 year period, however all are above the level of habitat indicated in the natural disturbance baseline so no additional strategies are necessary.
Sustainable Forest Management Plan 4 - TFL 48
December 23, 2011 62
Caribou late winter habitat is modeled as increasing over the 100-year natural baseline however the preferred scenario does not increase to be within the acceptable variance. Canfor is continuing to work with BC Environment to implement Ungulate Winter Range strategies for caribou within TFL 48 (see Section 3.9). Ungulate winter ranges and wildlife habitat areas for caribou are expected to be completed by the end of 2006.
MONITORING PROCEDURE
Habitat models are run as new timber supply analysis is conducted through the management planning cycle, or when changes (e.g., large natural disturbance events) require changes in timber supply modeling.
LINKAGES TO OPERATIONAL PLANS:
If habitat supply is within the allowed range of variance no change in operational plans is required (however, site specific measures as driven by practice or other indicators may require change, e.g., road deactivation may be conducted for specific wildlife concerns). If habitat supply is not within the range of variance Canfor will investigate the causes and implement stand level management strategies consistent with section 3.11.
3.11 Species of Management Concern
Criterion 1: Element(s): 1.2
Biological Diversity Species Diversity
CSA Core Indicator(s): 1.2.1: Degree of habitat protection for selected focal species, including species at risk
1.2.2: Degree of suitable habitat in the long term for selected focal species, including species at risk
Indicator Statement Target Statement
Percent consistency with management strategies for species of management concern
On an annual basis, 100% of the management strategies for species of management concern are consistently being implemented as scheduled
Value(s): Native Species Richness
SFM Objective:
We will sustain sufficient and appropriately distributed suitable habitat elements to maintain native species richness.
Linkage to TFL 48 Licence: For the purposes of sections 2.27(f) and (g) of the TFL 48 Licence this SFM Objective(s), Indicator Statement, Target Statement, Acceptable Variance, and Strategy and Implementation Schedule are submitted to the MoFR for approval.
Canfor common indicator statement: Percent of forest management activities consistent with management strategies for Species of Management Concern
ACCEPTABLE VARIANCE
Annually a 5% variance down to 95% of the management strategies for species of management concern are consistently being implemented as scheduled is acceptable.
WHAT IS THIS INDICATOR AND WHY IS IT IMPORTANT?
Application of landscape, (coarse filter) and stand level (medium filter) biodiversity management measures contribute to the maintenance of most of the biodiversity needs in the planning area. However, coarse and medium filter guidelines may not be sufficient to ensure the conservation of all species. These species will require fine filter management to ensure that they are maintained within our ecosystems. This indicator will ensure that specific management strategies are in place to conserve and manage specific habitat needs for species of management concern.
The habitat requirements of most species of management concern are sufficiently known to prescribe activities that will minimize the impact to these species. The management strategies will be based on information already in place (e.g., National Recovery Teams of Environment Canada, Identified Wildlife Management Strategy) and on scientific literature. Management strategies will be implemented in operational plans to ensure the development/maintenance of species’ habitats.
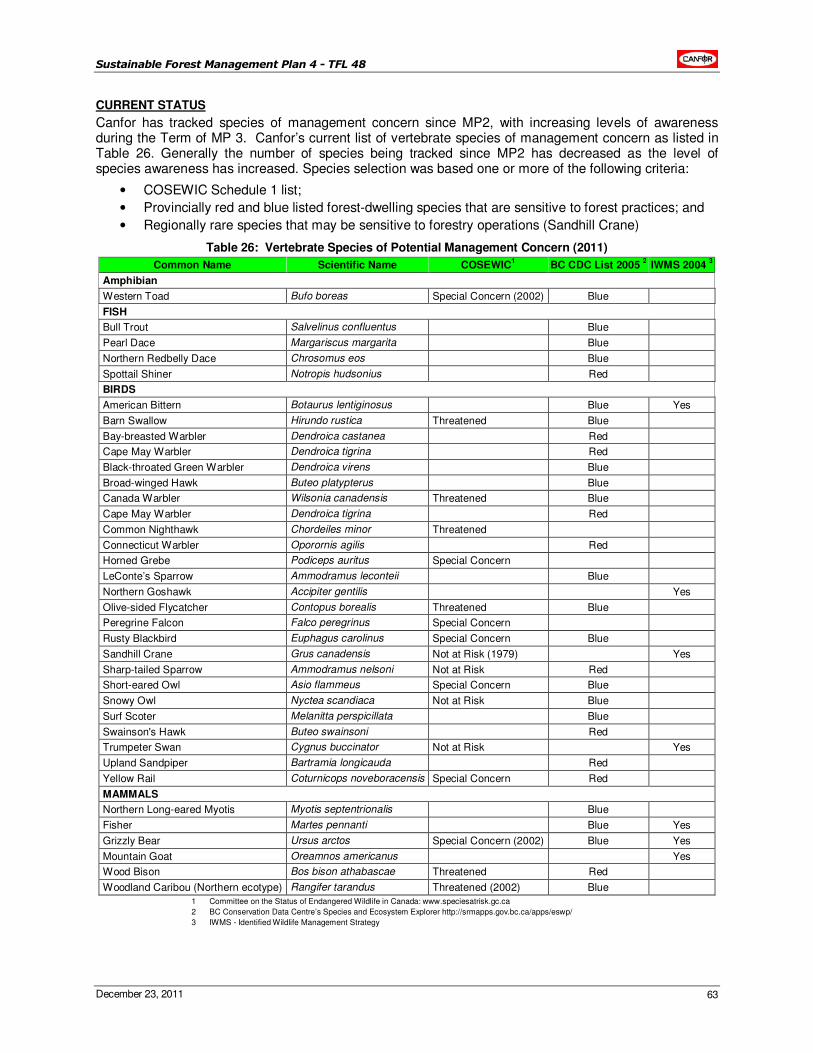
Sustainable Forest Management Plan 4 - TFL 48
December 23, 2011 63
CURRENT STATUS
Canfor has tracked species of management concern since MP2, with increasing levels of awareness during the Term of MP 3. Canfor’s current list of vertebrate species of management concern as listed in Table 26. Generally the number of species being tracked since MP2 has decreased as the level of species awareness has increased. Species selection was based one or more of the following criteria:
• COSEWIC Schedule 1 list;
• Provincially red and blue listed forest-dwelling species that are sensitive to forest practices; and
• Regionally rare species that may be sensitive to forestry operations (Sandhill Crane)
Table 26: Vertebrate Species of Potential Management Concern (2011)
Common Name Scientific Name COSEWIC1 BC CDC List 2005
2 IWMS 2004
3
Amphibian
Western Toad Bufo boreas Special Concern (2002) Blue
FISH
Bull Trout Salvelinus confluentus Blue
Pearl Dace Margariscus margarita Blue
Northern Redbelly Dace Chrosomus eos Blue
Spottail Shiner Notropis hudsonius Red
BIRDS
American Bittern Botaurus lentiginosus Blue Yes
Barn Swallow Hirundo rustica Threatened Blue
Bay-breasted Warbler Dendroica castanea Red
Cape May Warbler Dendroica tigrina Red
Black-throated Green Warbler Dendroica virens Blue
Broad-winged Hawk Buteo platypterus Blue
Canada Warbler Wilsonia canadensis Threatened Blue
Cape May Warbler Dendroica tigrina Red
Common Nighthawk Chordeiles minor Threatened
Connecticut Warbler Oporornis agilis Red
Horned Grebe Podiceps auritus Special Concern
LeConte’s Sparrow Ammodramus leconteii Blue
Northern Goshawk Accipiter gentilis Yes
Olive-sided Flycatcher Contopus borealis Threatened Blue
Peregrine Falcon Falco peregrinus Special Concern
Rusty Blackbird Euphagus carolinus Special Concern Blue
Sandhill Crane Grus canadensis Not at Risk (1979) Yes
Sharp-tailed Sparrow Ammodramus nelsoni Not at Risk Red
Short-eared Owl Asio flammeus Special Concern Blue
Snowy Owl Nyctea scandiaca Not at Risk Blue
Surf Scoter Melanitta perspicillata Blue
Swainson's Hawk Buteo swainsoni Red
Trumpeter Swan Cygnus buccinator Not at Risk Yes
Upland Sandpiper Bartramia longicauda Red
Yellow Rail Coturnicops noveboracensis Special Concern Red
MAMMALS
Northern Long-eared Myotis Myotis septentrionalis Blue
Fisher Martes pennanti Blue Yes
Grizzly Bear Ursus arctos Special Concern (2002) Blue Yes
Mountain Goat Oreamnos americanus Yes
Wood Bison Bos bison athabascae Threatened Red
Woodland Caribou (Northern ecotype) Rangifer tarandus Threatened (2002) Blue
1 Committee on the Status of Endangered Wildlife in Canada: www.speciesatrisk.gc.ca
2 BC Conservation Data Centre’s Species and Ecosystem Explorer http://srmapps.gov.bc.ca/apps/eswp/
3 IWMS - Identified Wildlife Management Strategy
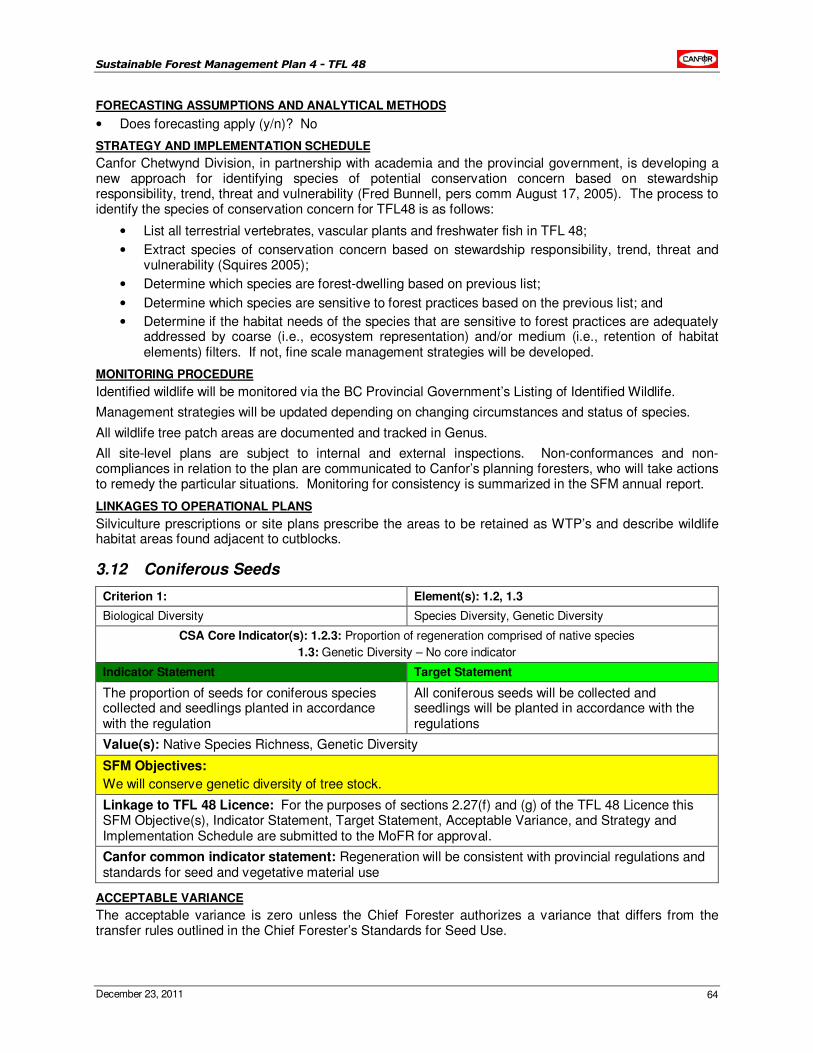
Sustainable Forest Management Plan 4 - TFL 48
December 23, 2011 64
FORECASTING ASSUMPTIONS AND ANALYTICAL METHODS
• Does forecasting apply (y/n)? No
STRATEGY AND IMPLEMENTATION SCHEDULE
Canfor Chetwynd Division, in partnership with academia and the provincial government, is developing a new approach for identifying species of potential conservation concern based on stewardship responsibility, trend, threat and vulnerability (Fred Bunnell, pers comm August 17, 2005). The process to identify the species of conservation concern for TFL48 is as follows:
• List all terrestrial vertebrates, vascular plants and freshwater fish in TFL 48;
• Extract species of conservation concern based on stewardship responsibility, trend, threat and vulnerability (Squires 2005);
• Determine which species are forest-dwelling based on previous list;
• Determine which species are sensitive to forest practices based on the previous list; and
• Determine if the habitat needs of the species that are sensitive to forest practices are adequately addressed by coarse (i.e., ecosystem representation) and/or medium (i.e., retention of habitat elements) filters. If not, fine scale management strategies will be developed.
MONITORING PROCEDURE
Identified wildlife will be monitored via the BC Provincial Government’s Listing of Identified Wildlife.
Management strategies will be updated depending on changing circumstances and status of species.
All wildlife tree patch areas are documented and tracked in Genus.
All site-level plans are subject to internal and external inspections. Non-conformances and non-compliances in relation to the plan are communicated to Canfor’s planning foresters, who will take actions to remedy the particular situations. Monitoring for consistency is summarized in the SFM annual report.
LINKAGES TO OPERATIONAL PLANS
Silviculture prescriptions or site plans prescribe the areas to be retained as WTP’s and describe wildlife habitat areas found adjacent to cutblocks.
3.12 Coniferous Seeds
Criterion 1: Element(s): 1.2, 1.3
Biological Diversity Species Diversity, Genetic Diversity
CSA Core Indicator(s): 1.2.3: Proportion of regeneration comprised of native species
1.3: Genetic Diversity – No core indicator
Indicator Statement Target Statement
The proportion of seeds for coniferous species collected and seedlings planted in accordance with the regulation
All coniferous seeds will be collected and seedlings will be planted in accordance with the regulations
Value(s): Native Species Richness, Genetic Diversity
SFM Objectives:
We will conserve genetic diversity of tree stock.
Linkage to TFL 48 Licence: For the purposes of sections 2.27(f) and (g) of the TFL 48 Licence this SFM Objective(s), Indicator Statement, Target Statement, Acceptable Variance, and Strategy and Implementation Schedule are submitted to the MoFR for approval.
Canfor common indicator statement: Regeneration will be consistent with provincial regulations and standards for seed and vegetative material use
ACCEPTABLE VARIANCE
The acceptable variance is zero unless the Chief Forester authorizes a variance that differs from the transfer rules outlined in the Chief Forester’s Standards for Seed Use.

Sustainable Forest Management Plan 4 - TFL 48
December 23, 2011 65
WHAT IS THIS INDICATOR AND WHY IS IT IMPORTANT?
Genetic diversity of seedlings used for reforestation is ensured through the ministry’s seedlot registration policies and standards. Cones and seed obtained from wild forest stands must be collected from a minimum of 10 trees. The ministry licences tree seed orchards to ensure that their design and management practices maintain genetic diversity. Seed derived from licensed orchards must also contain a minimum level of genetic diversity - or effective population size (Ne) – as measured by the quantity of pollen and cones from each contributing tree in the orchard. Orchard seedlots must have a minimum Ne of 10. Similar registration requirements also apply to vegetatively propagated reforestation materials. These rules ensure that planted forests contain sufficient genetic diversity so they are able to withstand any biotic (e.g. insect or disease) or abiotic (e.g. wind, snow, frost, or climate change) event as well as a naturally regenerated forest.”
Transfer guidelines minimize the risks of maladaptation or growth loss associated with moving seed or vegetative material from its source to another location. Exceeding the transfer limits may decrease productivity or increase susceptibility to frost, insects or disease. Poor survival or outright mortality may occur when seed is transferred past its ecological tolerance; however, losses in productivity can be substantial even over relatively short distances, particularly where elevation is concerned (Ministry of Forests and Range Tree Improvement Branch publication).
CURRENT STATUS
All (100%) seedlots grown and planted within the DFA are registered in accordance with the Forest Planning and Practices Regulation and the Chief Forester’s Seed Use Standards effective April 1, 2005.
All seeds have been registered with and tracked by Tree Improvement Branch of the Ministry of Forests and Range.
In 2010 all coniferous seeds were collected and seedlings were planted in accordance with the regulations (The Tree Cone, Seed and Vegetative Material Regulation (BC Reg 164/95)).
FORECASTING ASSUMPTIONS AND ANALYTICAL METHODS
• Does forecasting apply (y/n)? No
STRATEGY AND IMPLEMENTATION SCHEDULE
Seeds will be collected and planted in accordance with the Forest Planning and Practices Regulation and the Chief Forester’s Seed Use Standards effective April 1, 2005. Based upon the seedlot registration information, seeds are planted only where they are genetically and ecologically appropriate for the site.
MONITORING PROCEDURE
All reforestation activities are documented and tracked in Genus. Seedlots are tracked and recorded for every area planted.
LINKAGES TO OPERATIONAL PLANS
Silviculture prescriptions and site plans prescribe the areas to be reforested. Silviculture staff uses this information to allocate the appropriate seedlots to conform to the transfer guidelines.
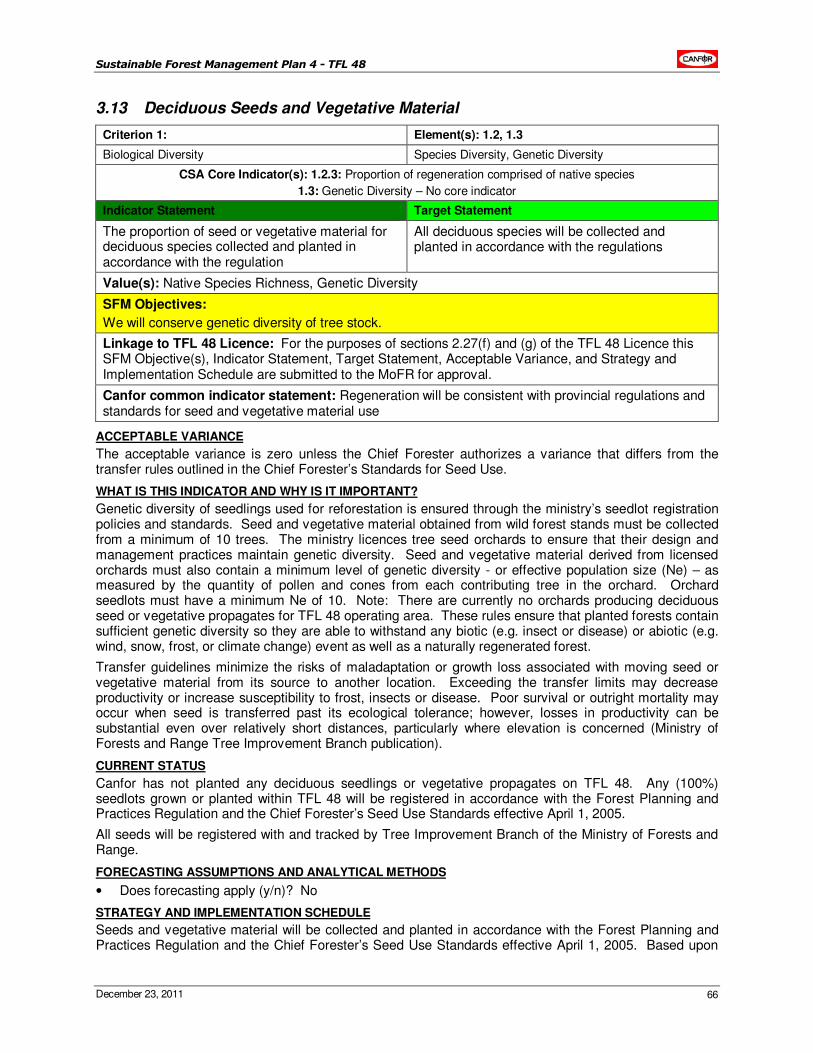
Sustainable Forest Management Plan 4 - TFL 48
December 23, 2011 66
3.13 Deciduous Seeds and Vegetative Material
Criterion 1: Element(s): 1.2, 1.3
Biological Diversity Species Diversity, Genetic Diversity
CSA Core Indicator(s): 1.2.3: Proportion of regeneration comprised of native species
1.3: Genetic Diversity – No core indicator
Indicator Statement Target Statement
The proportion of seed or vegetative material for deciduous species collected and planted in accordance with the regulation
All deciduous species will be collected and planted in accordance with the regulations
Value(s): Native Species Richness, Genetic Diversity
SFM Objectives:
We will conserve genetic diversity of tree stock.
Linkage to TFL 48 Licence: For the purposes of sections 2.27(f) and (g) of the TFL 48 Licence this SFM Objective(s), Indicator Statement, Target Statement, Acceptable Variance, and Strategy and Implementation Schedule are submitted to the MoFR for approval.
Canfor common indicator statement: Regeneration will be consistent with provincial regulations and standards for seed and vegetative material use
ACCEPTABLE VARIANCE
The acceptable variance is zero unless the Chief Forester authorizes a variance that differs from the transfer rules outlined in the Chief Forester’s Standards for Seed Use.
WHAT IS THIS INDICATOR AND WHY IS IT IMPORTANT?
Genetic diversity of seedlings used for reforestation is ensured through the ministry’s seedlot registration policies and standards. Seed and vegetative material obtained from wild forest stands must be collected from a minimum of 10 trees. The ministry licences tree seed orchards to ensure that their design and management practices maintain genetic diversity. Seed and vegetative material derived from licensed orchards must also contain a minimum level of genetic diversity - or effective population size (Ne) – as measured by the quantity of pollen and cones from each contributing tree in the orchard. Orchard seedlots must have a minimum Ne of 10. Note: There are currently no orchards producing deciduous seed or vegetative propagates for TFL 48 operating area. These rules ensure that planted forests contain sufficient genetic diversity so they are able to withstand any biotic (e.g. insect or disease) or abiotic (e.g. wind, snow, frost, or climate change) event as well as a naturally regenerated forest.
Transfer guidelines minimize the risks of maladaptation or growth loss associated with moving seed or vegetative material from its source to another location. Exceeding the transfer limits may decrease productivity or increase susceptibility to frost, insects or disease. Poor survival or outright mortality may occur when seed is transferred past its ecological tolerance; however, losses in productivity can be substantial even over relatively short distances, particularly where elevation is concerned (Ministry of Forests and Range Tree Improvement Branch publication).
CURRENT STATUS
Canfor has not planted any deciduous seedlings or vegetative propagates on TFL 48. Any (100%) seedlots grown or planted within TFL 48 will be registered in accordance with the Forest Planning and Practices Regulation and the Chief Forester’s Seed Use Standards effective April 1, 2005.
All seeds will be registered with and tracked by Tree Improvement Branch of the Ministry of Forests and Range.
FORECASTING ASSUMPTIONS AND ANALYTICAL METHODS
• Does forecasting apply (y/n)? No
STRATEGY AND IMPLEMENTATION SCHEDULE
Seeds and vegetative material will be collected and planted in accordance with the Forest Planning and Practices Regulation and the Chief Forester’s Seed Use Standards effective April 1, 2005. Based upon
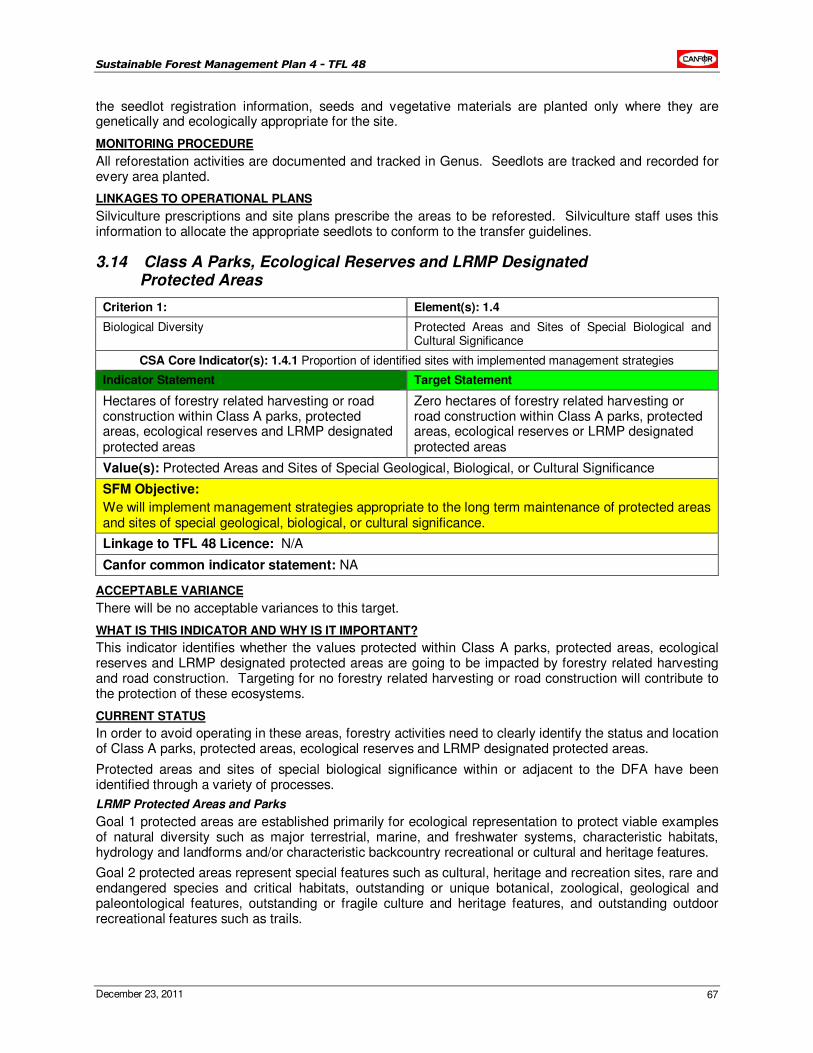
Sustainable Forest Management Plan 4 - TFL 48
December 23, 2011 67
the seedlot registration information, seeds and vegetative materials are planted only where they are genetically and ecologically appropriate for the site.
MONITORING PROCEDURE
All reforestation activities are documented and tracked in Genus. Seedlots are tracked and recorded for every area planted.
LINKAGES TO OPERATIONAL PLANS
Silviculture prescriptions and site plans prescribe the areas to be reforested. Silviculture staff uses this information to allocate the appropriate seedlots to conform to the transfer guidelines.
3.14 Class A Parks, Ecological Reserves and LRMP Designated Protected Areas
Criterion 1: Element(s): 1.4
Biological Diversity Protected Areas and Sites of Special Biological and Cultural Significance
CSA Core Indicator(s): 1.4.1 Proportion of identified sites with implemented management strategies
Indicator Statement Target Statement
Hectares of forestry related harvesting or road construction within Class A parks, protected areas, ecological reserves and LRMP designated protected areas
Zero hectares of forestry related harvesting or road construction within Class A parks, protected areas, ecological reserves or LRMP designated protected areas
Value(s): Protected Areas and Sites of Special Geological, Biological, or Cultural Significance
SFM Objective:
We will implement management strategies appropriate to the long term maintenance of protected areas and sites of special geological, biological, or cultural significance.
Linkage to TFL 48 Licence: N/A
Canfor common indicator statement: NA
ACCEPTABLE VARIANCE
There will be no acceptable variances to this target.
WHAT IS THIS INDICATOR AND WHY IS IT IMPORTANT?
This indicator identifies whether the values protected within Class A parks, protected areas, ecological reserves and LRMP designated protected areas are going to be impacted by forestry related harvesting and road construction. Targeting for no forestry related harvesting or road construction will contribute to the protection of these ecosystems.
CURRENT STATUS
In order to avoid operating in these areas, forestry activities need to clearly identify the status and location of Class A parks, protected areas, ecological reserves and LRMP designated protected areas.
Protected areas and sites of special biological significance within or adjacent to the DFA have been identified through a variety of processes.
LRMP Protected Areas and Parks
Goal 1 protected areas are established primarily for ecological representation to protect viable examples of natural diversity such as major terrestrial, marine, and freshwater systems, characteristic habitats, hydrology and landforms and/or characteristic backcountry recreational or cultural and heritage features.
Goal 2 protected areas represent special features such as cultural, heritage and recreation sites, rare and endangered species and critical habitats, outstanding or unique botanical, zoological, geological and paleontological features, outstanding or fragile culture and heritage features, and outstanding outdoor recreational features such as trails.
Sustainable Forest Management Plan 4 - TFL 48
December 23, 2011 68
Potential protected areas were initially identified through a technical team formed from government agencies (RPAT). This group delineated Areas of Interest, which met the above criteria. The Dawson Creek LRMP then used this information to finalize proposed Protected Area (PA) boundaries.
Following is a summary of the classified protected areas in or adjacent to the DFA, and their major characteristics.
Bocock Peak (1,133 ha)
Bocock Peak is located along the northwestern boundary of the planning area, south of the Peace Arm of Williston Lake and adjacent to Eleven Mile Creek in the Hart Ranges ecosection.
PAS Values:
• contains three significant karst caves (White Hole, Short Straw Cave and Lesser Sink)
Butler Ridge (6,694 ha)
The Butler Ridge Protected Area is located 20 kilometres northwest of the District of Hudson's Hope. It incorporates the easternmost portion of the Dunlevy Creek watershed north of Williston Lake and the west side of Butler Ridge. The area includes a portion of the shoreline adjacent to the east side of Dunlevy inlet on Williston Lake that is adjacent to the Dunlevy Recreation Area.
This area represents a portion of the Peace Foothills ecosection. It encompasses three biogeoclimatic zones, namely the moist, very cold Engelmann Spruce-Subalpine Fir, the Sub-Boreal Spruce, and the Black and White Boreal Spruce zones. The area provides good examples of the forests of the Rocky Mountain Foothills, and valley bottom to alpine ecosystem connectivity.
The Butler Ridge area provides critical winter range for caribou, Stone's sheep habitat as well as moose and elk winter range. These attributes contribute to the Protected Area's regionally significant value as a wildlife viewing area.
Butler Ridge has historically supported a number of recreational activities including hiking, cross-country skiing, hunting and fishing. The area is also recognized as a traditional use area for First Nations, and continues to support First Nation's cultural values.
Hole-in-the-Wall (131 ha)
Hole-in-the-Wall spring is located adjacent to the Sukunka River near Windfall Creek in the Hart Foothills ecosection.
PAS Values:
• unique underground stream appearing from the base of a limestone cliff near the Sukunka River
• unique and relatively constant water quantity and quality parameters
Klin-se-za (Twin Sisters/Beattie Peaks, 2,671 ha)
The Klin-se-za Protected Area is an area of profound spiritual significance and traditional use value to the First Nations people of northeastern B.C. It is the centre of spiritual prophecies that shape the belief systems and culture of the First Nations. The need to protect these values led to the Twin Sisters Special Management Committee Recommendations (October 21, 1997). More details regarding this protected area can be found within the Dawson Creek LRMP document. These details are not to be extracted from the LRMP document, and are therefore not within this management plan.
Peace River/Boudreau Lake (19,738 ha)
The Peace River/Boudreau Lake Protected Area is located between Hudson’s Hope and Fort St. John. It incorporates a major portion of the southerly bank of the Peace River valley; the lower Moberly River valley and the Peace River islands between Maurice Creek and the Moberly River.
This Goal 1 Protected Area is shared between the Fort St. John and Dawson Creek LRMP’s. The islands located within the Peace River that are adjacent to the Fort St. John LRMP boundary are within the Fort St. John LRMP planning area while the balance of the islands within the Protected Area are within the Dawson Creek planning area.
The Protected Area represents a portion of the moist, warm Boreal White and Black Spruce biogeoclimatic zone within the Peace Lowlands ecosection. Within it are captured the typical mixed forest types of the Peace River valley along with stands of alluvial cottonwood and spruce ecosystems.
Sustainable Forest Management Plan 4 - TFL 48
December 23, 2011 69
The area provides habitat for a number of wildlife species including critical trumpeter swan nesting sites around Boudreau Lake. High value winter range is provided for moose, deer and elk. The area also contains a number of cultural heritage sites of First Nations' and European settlements and uses. These include the first site of European settlement on mainland B.C. at Rocky Mountain Fort (1794-1804), and a historic travel corridor for First Nations, early European explorers and fur traders. This area has traditionally supported a number of recreational activities, both public and commercial, including boating, canoeing, bird watching, hunting and fishing.
Pine/LeMoray (32,975 ha)
The Pine/LeMoray Protected Area is located 70 kilometres southwest of Chetwynd in the Hart Ranges ecosection of the Rocky Mountains. It includes the Link and Mountain Creek watersheds and is bordered in the southwest by the planning area boundary and by the Pine River on the northwest and north boundaries. Heart Lake lies within the area.
This area provides good representation of the wet, cool Engelmann Spruce-Subalpine Fir biogeoclimatic zone found within the Hart Ranges of the Rocky Mountains. Located primarily on the east slope of the continental divide, it is a mountainous area of high elevation spruce-subalpine fir forest and rugged alpine terrain.
The area provides important habitat for many fish and wildlife species including Arctic grayling, high elevation caribou, moose, and wolverine; and includes high capability habitat areas for grizzly bear. The Protected Area is also significant for its fossil sites and examples of karst topography and alpine areas. Traditional use by First Nations is also recognized in this area.
The high value backcountry and wilderness recreation values associated with relatively easy access make this area a regionally significant recreation area. Hiking, hunting, fishing, and snowmobiling, as well as commercial recreation activities have traditionally occurred in the area. A Forest Service recreation site exists at Heart Lake.
Adjacent to this proposed Protected Area is an Area of Interest located within the Mackenzie LRMP area.
A few parks also exist within or adjacent to TFL 48. The parks are described below.
Butler Ridge Provincial Park (6,145 ha) is located in the Peace Foothill ecosection just east of the Rocky Mountains. The area provides important winter range for caribou and stone sheep habitat in the higher elevations as well as moose and elk winter range in the lower elevations. A blue-listed species, the Arkansas rose, has been recorded in the park.
Gwillim Lake Provincial Park (32,458 ha) is located in the Hart Foothills ecosection. Gwillim Lake Provincial Park houses a diverse array of both coniferous and deciduous tree species. Lodgepole pine, white spruce, trembling aspen, paper birch and balsam poplar are found along the lakeshore intermixed with low wetlands of black spruce, willow and alder. Forests at higher elevations consist of Engelmann spruce and subalpine fir that open up into parklands and alpine meadows higher up.
Sukunka Falls Provincial Park (423 ha). Boreal white and black spruce is characteristic of the valley bottom with stands of aspen, cottonwood, and poplar. The Sukunka valley has been identified as key winter range for moose and deer.
Monkman Provincial Park (62,896 ha) Lower elevations in the park are dominated by mature sub-alpine fir, white spruce and lodgepole pine. The higher elevations support growths of Engelmann spruce, sub-alpine fir and white spruce. Above the tree line, only plants adapted to the conditions are to be found. Monkman Provincial Park conserves representative areas of the Central Rocky Mountains and Foothills. Lower elevations in the park are dominated by mature sub-alpine fir, white spruce and lodgepole pine. The higher elevations support growth of Engelmann spruce, sub-alpine fir and white spruce. Above tree line, the trees become dwarfed and twisted. Alpine meadows of heathers, grasses and wildflowers, such as white rhododendron, arctic lupine, glacier lily and Indian paintbrush cover large areas and are intermixed with shrubs.
Ecological Reserves
Ecological reserves are areas selected to preserve representative and special natural ecosystems, plant and animal species, features and phenomena. The key role of ecological reserves is to contribute to the maintenance of biological diversity and the protection of genetic materials. Scientific research and educational purposes are the principle uses of ecological reserves. The benefits of these areas are to
Sustainable Forest Management Plan 4 - TFL 48
December 23, 2011 70
provide for the maintenance of biological diversity, they provide outdoor laboratories and classrooms for studies, and they can act as benchmarks against which environmental changes can be measured.
Currently there are no Ecological Reserves within or adjacent to the TFL.
FORECASTING ASSUMPTIONS AND ANALYTICAL METHODS
• Does forecasting apply (y/n)? No
STRATEGY AND IMPLEMENTATION SCHEDULE
Within one month of the identification and declaration of a new area for protection, detailed location and management information will be requested from the government by the Planning Superintendent.
Map information will be digitally stored by the GIS Supervisor within 1 month of this information being made available by the government, and planning maps will display this information, provided the data is not considered sensitive (e.g. Some WHA’s will not be shown on public maps).
Applicable management information will be circulated to affected staff by the Planning Supervisor for consideration in all planning activities within 1 month of receipt of this information from government.
MONITORING PROCEDURE
Changes to protected areas will be reported in future annual reports.
LINKAGES TO OPERATIONAL PLANS
Staff members will refer to base maps to locate protected areas when preparing operational plans. When planned activities are in the general vicinity of the identified areas, staff members will ensure operational plans are consistent with any management guidelines for these protected areas.
3.15 Known Values and Uses Addressed in Operational Planning
Criterion 1: Element(s): 1.4, 6.1, 6.2
Biological Diversity Protected Areas and Sites of Special Biological and Cultural Significance; Aboriginal and Treaty Rights; Respect for Aboriginal Forest Values, Knowledge and Uses
CSA Core Indicator(s): 1.4.2 Protection of identified sacred and culturally important sites
6.1.3: Level of management and/or protection of areas where culturally important practices and activities (hunting, fishing, gathering) occur
6.2.1: Evidence of understanding and use of Aboriginal knowledge through the engagement of willing Aboriginal communities, using a process that identifies and manages culturally important resources and values
Indicator Statement Target Statement
Percentage of known traditional site-specific aboriginal values and uses identified during SFMP, FDP, FSP, or PMP referrals addressed in operational plans
100% of known traditional site-specific aboriginal values and uses identified during SFMP, FDP, FSP, or PMP referrals will be addressed in operational plans
Value(s): Protected Areas and Sites of Special Geological, Biological, or Cultural Significance; Treaty and Aboriginal Rights; Aboriginal Forest Values and Uses
SFM Objective:
We will implement management strategies appropriate to the long term maintenance of protected areas and sites of special geological, biological, or cultural significance.
We will recognize and respect Treaty 8 rights.
We will respect known traditional Aboriginal forest values, and uses.
Linkage to TFL 48 Licence: For the purposes of sections 2.27(f) and (g) of the TFL 48 Licence this SFM Objective(s), Indicator Statement, Target Statement, Acceptable Variance, and Strategy and Implementation Schedule are submitted to the MoFR for approval.
Canfor common indicator statement: Percent of identified Aboriginal forest values, knowledge and uses considered in forestry planning processes
Sustainable Forest Management Plan 4 - TFL 48
December 23, 2011 71
ACCEPTABLE VARIANCE
None.
WHAT IS THIS INDICATOR AND WHY IS IT IMPORTANT?
The indicator is a measure of Canfor’s recognition and response to the traditional aboriginal values and uses that are made known in a timely manner during referral processes. The requirement for site-specificity enables both Canfor and First Nations to best qualify and/or quantify the effects of forest development and the strategies required to manage for the development.
This indicator contributes to respecting the social, cultural, heritage and spiritual needs of aboriginal people who traditionally and currently use the DFA for the maintenance of traditional aspects of their lifestyle. Working with aboriginal peoples to identify, define and develop management strategies for traditional values and uses is an important component of the forest industry’s sustainable forest management plans.
This indicator does not apply to values, which may otherwise be well represented in the same general area, or sites where information cannot be validated through traditional or scientific knowledge sources from both within and outside of the First Nations.
CURRENT STATUS
Following a review of FSP blocks, the District Manager currently directs Canfor to conduct Archaeological Impact Assessments (AIA) on areas with high potential, as determined from an Archaeological Overview Assessment. In addition to MoFR direction, Canfor has initiated contracts with a third-party archaeologist to further evaluate a number of proposed FSP cutblocks using a detailed risk-rating process for archaeological potential. The process adds resolution to the older AOA, and will assist in providing direction regarding cultural heritage resources.
Canfor has an obligation to not damage any resource feature, including cultural heritage features. Canfor has made a number of adjustments to operational plans for local First Nations values brought to their attention. For example, WTP’s have been amended to include CMT’s, riparian and lake buffers have been widened to accommodate traditional use areas, and vegetation management buffers have been extended to avoid berry-picking patches.
A 1998 report summarizes a number of Traditional Use Studies (TUS’s), which were carried out by First Nations in the DFA. Canfor and government currently do not have any access to the information or data due to the confidential nature of much of the information. Canfor’s ability to effectively manage for traditional values and uses may be dependent upon the First Nation(s) providing access to some levels of confidential information.
FORECASTING ASSUMPTIONS AND ANALYTICAL METHODS
• Does forecasting apply (y/n)? No
STRATEGY AND IMPLEMENTATION SCHEDULE
• Canfor will continue with ongoing relationship building processes with First Nations, to encourage meaningful engagement and input to the development of SFMP, FSP and PMP’s.
• Canfor will engage in and record all communications and meetings with First Nations (including attempts) to garner input on the development of operational plans
• Canfor will seek to gain access to site-specific information about traditional values and uses (subject to confidentiality agreements) at the SFMP, FSP and PMP stages.
• Canfor will work with First Nations in an attempt to develop joint agreement on operational strategies to manage for site-specific traditional values and uses.
• Canfor will implement strategies in operational plans to address all site specific known values and uses included in the scope of this indicator that are identified during referrals of these major plans.
• Detailed planning will occur after referral comment periods for major plans expire. Information provided subsequent to these referral review and comment periods will be considered and addressed to the extent Canfor is able to without unduly disrupting ongoing operations.
Sustainable Forest Management Plan 4 - TFL 48
December 23, 2011 72
MONITORING PROCEDURE
Canfor will record the number of opportunities for communication, meetings and input into each plan.
Canfor will record the adoption of all strategies used to manage for known site-specific traditional values and uses in operational plans (and will be adopted for strategic plans as required). This information will be summarized in operational planning processes subject to confidentiality agreements.
Information from Archaeological Impact Assessments (AIA) required by the District Manager, will be monitored through Canfor’s GIS system, also subject to confidentiality agreements.
LINKAGES TO OPERATIONAL PLANS
Operational plans will be consistent with jointly agreed upon strategies between Canfor and First Nations. Information from AIA’s will guide the development of operational plans.
3.16 Conformance to Elements Pertinent to Treaty Rights
Criterion 1: Element(s): 1.4, 6.1
Biological Diversity Protected Areas and Sites of Special Biological and Cultural Significance; Aboriginal and Treaty Rights
CSA Core Indicator(s): 1.4.2 Protection of identified sacred and culturally important sites
6.1.3: Level of management and/or protection of areas where culturally important practices and activities (hunting, fishing, gathering) occur
Indicator Statement Target Statement
% conformance to SFM elements pertinent to treaty rights (i.e., hunting, fishing and trapping) defined in Treaty 8
100% conformance to the SFM indicators and targets of the SFM Elements pertinent to sustaining hunting, fishing and trapping, as follows:
• Element 1.1 Ecosystem Diversity (Indicators 3.1, 3.2, 3.3, and 3.4), and Element 1.2 Species Diversity (Habitat Elements) Indicators (3.5, 3.6, 3.7, 3.8, and 3.10),
• Element 3.1 Soil Quality and Quantity (Indicator 27), and
• Element 3.2 Water Quality and Quantity Indicators (3.28, 3.29, 3.30, 3.31, and 3.32)
Value(s): Protected Areas and Sites of Special Geological, Biological, or Cultural Significance; Treaty and Aboriginal Rights
SFM Objective:
We will implement management strategies appropriate to the long term maintenance of protected areas and sites of special geological, biological, or cultural significance.
We will recognize and respect Treaty 8 rights.
Linkage to TFL 48 Licence: N/A
Canfor common indicator statement: NA
ACCEPTABLE VARIANCE
Variances provided in the specific indicators will apply.
WHAT IS THIS INDICATOR AND WHY IS IT IMPORTANT?
The DFA is within a larger area of Treaty 8 of 1899, which established hunting, fishing and trapping as treaty rights for the local aboriginal First Nations communities. The rights as such are available across the treaty area and have no site specificity or quantum. The following four First Nations have known traditional territory in the DFA whose treaty rights are protected under Treaty 8, Halfway River, West Moberly, Saulteau, and McLeod Lake.
Aboriginal rights are affirmed in the Canadian Constitution (S. 35), but have not been proven through judicial processes in the DFA.
Sustainable Forest Management Plan 4 - TFL 48
December 23, 2011 73
The indicator identifies and measures Canfor’s effectiveness in recognizing and respecting existing treaty rights. In doing so Canfor can demonstrate its role of recognizing and respecting societies commitment to sustain core traditional values and ways of life for First Nations in the DFA, as follows:
• Hunting and trapping rights are generally upheld by meeting Criterion 1 – Conservation of Biological Diversity, Element 1.1 Ecosystem Diversity – specifically ecosystem representation, forest type, late seral forest, and patch size, and Element 1.2 Species Diversity more specifically by meeting the objective of suitable habitat elements and its relevant indicators: snags/live tree retention, coarse woody debris, riparian, shrubs, wildlife tree patches and habitat supply.
• Fishing rights are generally upheld by meeting Criterion 3 – Conservation of Soil and Water Resources, Element 3.2 Water Quality and Quantity, and more specifically by meeting the objectives and indicators of maintaining water quality and water quantity.
• Canfor desires good working relationships and communications with the First Nations in the DFA in order to meaningfully consider and plan for site-specific information related to treaty or aboriginal rights in forest development (and stewardship) plans. This aspect is further covered in Indicator 3.15.
CURRENT STATUS
Canfor refers Forest Stewardship Plans (FSP’s) and Pest Management Plans (PMP’s) to First Nations for comment and input on planned development. Canfor often calls for a meeting to provide clarification and answer questions. Capacity is often cited as a reason that First Nations cannot better address the effect of forest development on treaty (or aboriginal) rights. Government has a fiduciary obligation and carries out the role of meeting consultation requirements. Currently there is an expectation of Canfor to carry a greater role in the consultation and accommodation process, as noted in recent judicial decisions although this is being challenged.
Canfor also has a developing relationship, capacity building and consultation processes underway with the local First Nations, in particular the Dunne-za joint venture agreement that includes a small-pine license for 100,000 cubic metres per year for 20 years in the Dawson Creek TSA.
See also Indicators (3.1 – 3.8, 3.10) for current status about the biological diversity and species diversity (habitat element) indicators.
See also Indicator (3.27) for current status about the soil quality and quantity indicator.
See also Indicators (3.28 through 3.32) for current status about the water quality and quantity indicators.
FORECASTING ASSUMPTIONS AND ANALYTICAL METHODS
• Does forecasting apply (y/n)? No
STRATEGY AND IMPLEMENTATION SCHEDULE
• Continue with the relationship, capacity building and consultation processes as noted above.
• Continue to engage with First Nations in the development of strategic and operational plans.
• Report annually on the performance of the Indicators noted for SFM Elements 1.1, 1.2, 3.1 and 3.2, as noted above.
• Review legal compliance to aboriginal rights as duly established in law and accepted by government and summarize for each annual report.
MONITORING PROCEDURE
Canfor will maintain an annual record of performance.
LINKAGES TO OPERATIONAL PLANS
Operational plans will be consistent with the strategies to manage for the indicators and targets for SFM Element 1.1 (Ecosystem Diversity), SFM Element 1.2 (Species Diversity), SFM Element 3.1 (Soil Quality and Quantity) and SFM Element 3.2 (Water Quality and Quantity).
Sustainable Forest Management Plan 4 - TFL 48
December 23, 2011 74
3.17 Free Growing Stands
Criterion 2: Element(s): 2.1
Ecosystem Condition and Productivity Forest Ecosystem Resilience
CSA Core Indicator(s): 2.1.1 Reforestation success
Indicator Statement Target Statement
Proportion of area harvested that has free growing stands re-established
100% of the area harvested will meet the free growing requirements identified in the silviculture prescriptions/site plans
Value(s): Ecosystem Resilience
SFM Objectives:
We will sustain a natural range of variability in ecosystem function, composition and structure which allows ecosystems to recover from disturbance and stress.
Linkage to TFL 48 Licence: For the purposes of sections 2.27(f) and (g) of the TFL 48 Licence this SFM Objective(s), Indicator Statement, Target Statement, Acceptable Variance, and Strategy and Implementation Schedule are submitted to the MoFR for approval.
Canfor common indicator statement: NA
ACCEPTABLE VARIANCE
None.
WHAT IS THIS INDICATOR AND WHY IS IT IMPORTANT?
Canfor is obligated to establish free growing stands on all areas harvested in accordance with the regulations and site plans/silviculture prescriptions. The standards for which a free growing stand must be established are defined in the site plans/silviculture prescriptions. For blocks exempted from site plans under the Bark Beetle Regulations, the requirements for free growing stands are defined in the regulation. A free growing stand is established on a standard unit and will meet the requirements for acceptable species, minimum specie tree heights, and minimum well spaced density. The individual trees accepted as free growing will also be healthy and be free of deleterious competition.
The net area to be reforested (NAR), as defined in the site plan or silviculture prescription, will describe the proportion of area harvested that will have a free growing stand re-established.
Establishing free growing stands is an important indicator because it ensures healthy and productive forests are being replaced after harvesting. Ensuring that harvested stands meet the prescribed free growing requirements is an indication that the harvested area has maintained the ability to recover from a disturbance and thereby maintaining its resiliency and productive capacity. Failure or delays in establishing a free growing stand will negatively impact future growth and harvest levels as well as impact other ecosystem processes that rely on forest replacement.
CURRENT STATUS
100% of the blocks have achieved their free growing requirements within the timeframe identified in the Silviculture Prescription/Site Plans (Canfor and BCTS; calculated to December 31, 2010).
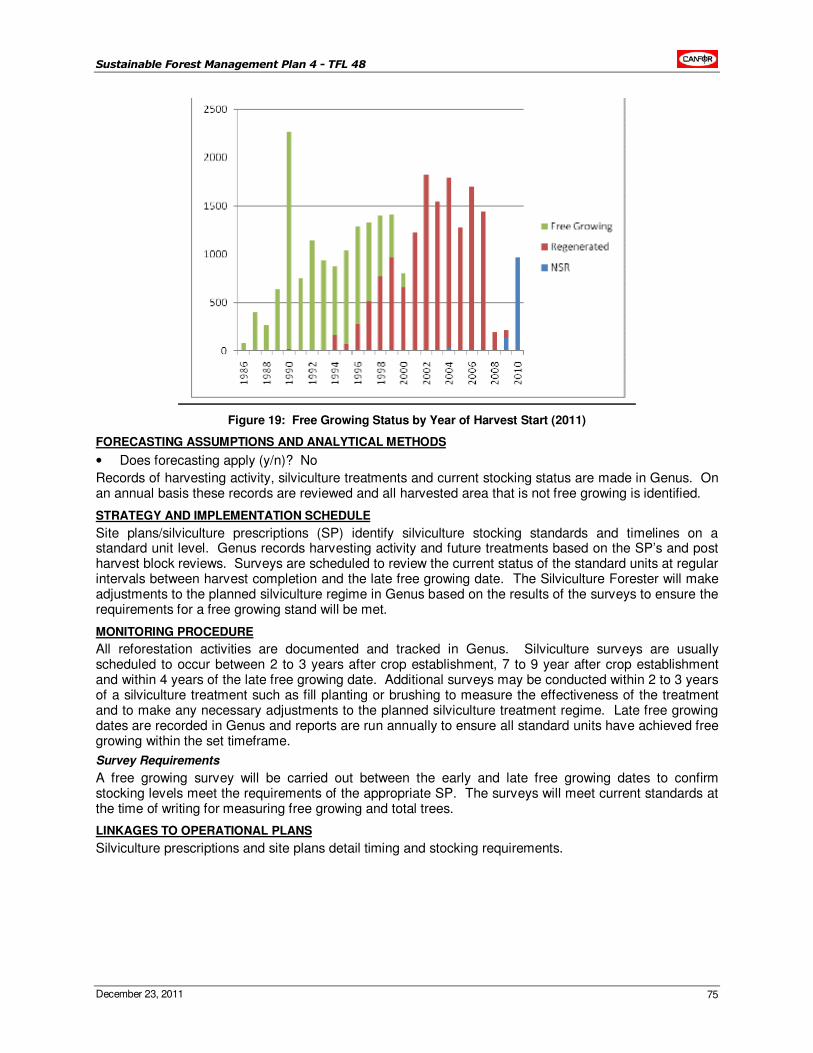
Sustainable Forest Management Plan 4 - TFL 48
December 23, 2011 75
Figure 19: Free Growing Status by Year of Harvest Start (2011)
FORECASTING ASSUMPTIONS AND ANALYTICAL METHODS
• Does forecasting apply (y/n)? No
Records of harvesting activity, silviculture treatments and current stocking status are made in Genus. On an annual basis these records are reviewed and all harvested area that is not free growing is identified.
STRATEGY AND IMPLEMENTATION SCHEDULE
Site plans/silviculture prescriptions (SP) identify silviculture stocking standards and timelines on a standard unit level. Genus records harvesting activity and future treatments based on the SP’s and post harvest block reviews. Surveys are scheduled to review the current status of the standard units at regular intervals between harvest completion and the late free growing date. The Silviculture Forester will make adjustments to the planned silviculture regime in Genus based on the results of the surveys to ensure the requirements for a free growing stand will be met.
MONITORING PROCEDURE
All reforestation activities are documented and tracked in Genus. Silviculture surveys are usually scheduled to occur between 2 to 3 years after crop establishment, 7 to 9 year after crop establishment and within 4 years of the late free growing date. Additional surveys may be conducted within 2 to 3 years of a silviculture treatment such as fill planting or brushing to measure the effectiveness of the treatment and to make any necessary adjustments to the planned silviculture treatment regime. Late free growing dates are recorded in Genus and reports are run annually to ensure all standard units have achieved free growing within the set timeframe.
Survey Requirements
A free growing survey will be carried out between the early and late free growing dates to confirm stocking levels meet the requirements of the appropriate SP. The surveys will meet current standards at the time of writing for measuring free growing and total trees.
LINKAGES TO OPERATIONAL PLANS
Silviculture prescriptions and site plans detail timing and stocking requirements.
Sustainable Forest Management Plan 4 - TFL 48
December 23, 2011 76
3.18 Regeneration Declaration
Criterion 2: Element(s): 2.1, 4.1
Ecosystem Condition and Productivity Forest Ecosystem Resilience; Carbon Uptake and Storage
CSA Core Indicator(s): 2.1.1 Reforestation success
Indicator Statement Target Statement
Area weighted average time delay from harvesting starting and initial restocking of harvest area by DFA
Average delay will be no more than 2 years
Value(s): Ecosystem Resilience, Carbon Uptake and Storage
SFM Objectives:
We will sustain a natural range of variability in ecosystem function, composition and structure which allows ecosystems to recover from disturbance and stress.
We will maintain the processes for carbon uptake and storage within the natural range of variation.
Linkage to TFL 48 Licence: For the purposes of sections 2.27(f) and (g) of the TFL 48 Licence this SFM Objective(s), Indicator Statement, Target Statement, Acceptable Variance, and Strategy and Implementation Schedule are submitted to the MoFR for approval.
Canfor common indicator statement: Average regeneration delay for stands established annually
ACCEPTABLE VARIANCE
To allow for variations in site preparation requirements, access and delays in harvest the acceptable variance for regeneration delay is one half year.
WHAT IS THIS INDICATOR AND WHY IS IT IMPORTANT?
Regeneration delay is the period from the start of harvest on the area to be reforested to the completion of initial regeneration of future tree species as required in the SP (site plan or silviculture prescription).
The regeneration delay is usually within two years where planting is prescribed and five years where the stand is expected to reforest naturally. Ensuring that harvested stands meet the prescribed regeneration delay is an indication that the harvested area has maintained the ability to recover from a disturbance and thereby maintaining its resiliency and productive capacity. Delays in the replacement of harvested species negatively impact future growth and harvest levels
CURRENT STATUS
1.45 years for conifer (arithmetic average between 2006 and 2010)
FORECASTING ASSUMPTIONS AND ANALYTICAL METHODS
• Does forecasting apply (y/n)? No
The timber supply analysis for SFMP 4 will use a 2-year regeneration delay.
The regeneration delay is reviewed annually by summarizing data from Genus on all unstocked cutblocks and calculating the area weighted average age of unstocked area. Calculations will be based on the month of completion of surveys and entire cutblock net reforestable area will be used in the calculations if any or all of the cutblock NAR is unstocked.
Records of harvesting activity and silviculture treatments are made in Genus.
STRATEGY AND IMPLEMENTATION SCHEDULE
We carry out basic silviculture activities to:
• Establish and tend new stands that suit the ecological characteristics and productivity estimates of each site,
• Optimize the timing of management activities that positively influence the stand’s development, and
• Produce a diverse and sustainable flow of species and products.
Sustainable Forest Management Plan 4 - TFL 48
December 23, 2011 77
Our basic silviculture strategy incorporates the following standards:
• Preferred species are those tree species that are ecologically suited to the site and management activities are primarily aimed at their establishment and growth. The characteristics of these species are consistent with the desired timber and non-timber objectives for the site.
• Stocking standards set out target numbers of trees per hectare to ensure full site occupancy. Minimum standards are set in accordance with legislation. Stocking method outlines recommended treatments to achieve target stocking.
• Minimum inter-tree distance sets out the prescribed inter-tree spacing which in combination with average spacing will result in target stocking with a good distribution. During planting operations, plantable spot decisions will be based on microsite quality rather than measured distances to ensure maximum seedling survival and production. On difficult sites, inter-tree spacing may be reduced to take advantage of limited plantable spots.
• Regeneration delay sets the allowable delay or “fallow period” for a given area measured from commencement of primary harvesting operations. The regeneration delay specified in the tables sets the administrative period which allows for completion of harvest, restocking, surveys and reporting. The vast majority of areas are restocked within 1 year of harvest completion (i.e. cutblocks are fallow for no more than one growing season).
• Free-growing age defines the period measured from commencement of primary harvesting where a stand must meet free-growing requirements and is usually defined as a range (earliest to latest). (See section 3.17 for description of Free Growing Strategies)
• Free-growing height defines for each species on a site, the minimum height that must be attained for a given tree to be considered free growing.
Blocks planted will have a survey of well spaced carried out during the same growing season as establishment to confirm stocking levels meet the requirements of the appropriate SP. A further survey of well spaced will be carried out within three growing seasons to confirm stocking is maintained above minimum levels.
Although 100% of cutblocks harvested on TFL 48 are planned to be planted, natural regeneration may be prescribed where the post harvest assessment indicates that it is a suitable treatment option. A survey of well spaced will be carried out during the three growing seasons post harvest to confirm stocking levels meet the requirements of the appropriate SP.
All surveys will follow current “Stocking and Free Growing Procedures Manual - May 2002” guidelines. Site plans/silviculture prescriptions (SP) identify silviculture stocking standards and timelines on a standard unit level. Genus records harvesting activity and future treatments based on the SP’s and post harvest block reviews.
MONITORING PROCEDURE
All reforestation activities are documented and tracked in Genus. The silviculture forester reviews regeneration delay annually by summarizing data from Genus on all unstocked cutblocks and calculating the area weighted average age of unstocked area. Calculations will be based on the month of completion of surveys and entire cutblock net reforestable area will be used in the calculations if any or all of the cutblock NAR is unstocked.
Survey Requirements
A free growing survey will be carried out between the early and late free growing dates to confirm stocking levels meet the requirements of the appropriate SP. The surveys will meet current standards at the time of writing for measuring free growing and total trees.
LINKAGES TO OPERATIONAL PLANS
Silviculture prescriptions and site plans detail timing and stocking requirements.
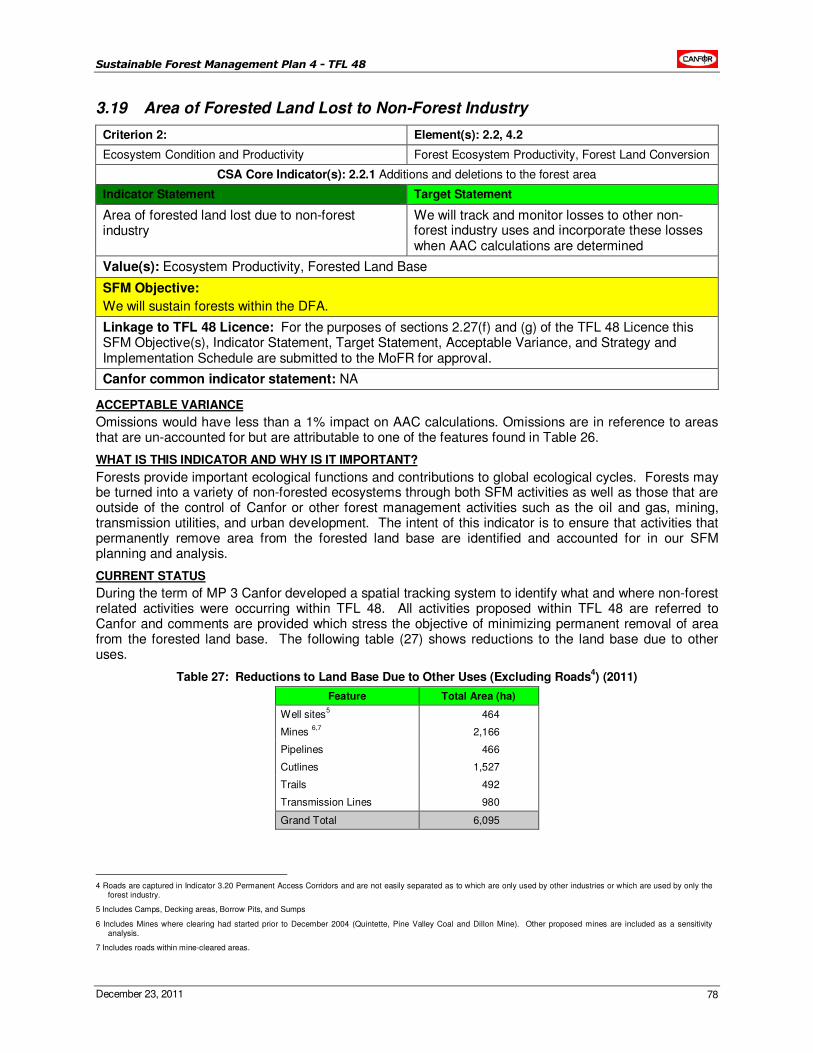
Sustainable Forest Management Plan 4 - TFL 48
December 23, 2011 78
3.19 Area of Forested Land Lost to Non-Forest Industry
Criterion 2: Element(s): 2.2, 4.2
Ecosystem Condition and Productivity Forest Ecosystem Productivity, Forest Land Conversion
CSA Core Indicator(s): 2.2.1 Additions and deletions to the forest area
Indicator Statement Target Statement
Area of forested land lost due to non-forest industry
We will track and monitor losses to other non-forest industry uses and incorporate these losses when AAC calculations are determined
Value(s): Ecosystem Productivity, Forested Land Base
SFM Objective:
We will sustain forests within the DFA.
Linkage to TFL 48 Licence: For the purposes of sections 2.27(f) and (g) of the TFL 48 Licence this SFM Objective(s), Indicator Statement, Target Statement, Acceptable Variance, and Strategy and Implementation Schedule are submitted to the MoFR for approval.
Canfor common indicator statement: NA
ACCEPTABLE VARIANCE
Omissions would have less than a 1% impact on AAC calculations. Omissions are in reference to areas that are un-accounted for but are attributable to one of the features found in Table 26.
WHAT IS THIS INDICATOR AND WHY IS IT IMPORTANT?
Forests provide important ecological functions and contributions to global ecological cycles. Forests may be turned into a variety of non-forested ecosystems through both SFM activities as well as those that are outside of the control of Canfor or other forest management activities such as the oil and gas, mining, transmission utilities, and urban development. The intent of this indicator is to ensure that activities that permanently remove area from the forested land base are identified and accounted for in our SFM planning and analysis.
CURRENT STATUS
During the term of MP 3 Canfor developed a spatial tracking system to identify what and where non-forest related activities were occurring within TFL 48. All activities proposed within TFL 48 are referred to Canfor and comments are provided which stress the objective of minimizing permanent removal of area from the forested land base. The following table (27) shows reductions to the land base due to other uses.
Table 27: Reductions to Land Base Due to Other Uses (Excluding Roads4) (2011)
Feature Total Area (ha)
Well sites5 464
Mines 6,7
2,166
Pipelines 466
Cutlines 1,527
Trails 492
Transmission Lines 980
Grand Total 6,095
4 Roads are captured in Indicator 3.20 Permanent Access Corridors and are not easily separated as to which are only used by other industries or which are used by only the
forest industry.
5 Includes Camps, Decking areas, Borrow Pits, and Sumps
6 Includes Mines where clearing had started prior to December 2004 (Quintette, Pine Valley Coal and Dillon Mine). Other proposed mines are included as a sensitivity analysis.
7 Includes roads within mine-cleared areas.
Sustainable Forest Management Plan 4 - TFL 48
December 23, 2011 79
FORECASTING ASSUMPTIONS AND ANALYTICAL METHODS
• Does forecasting apply (y/n)? No
No forecasting is completed for this indicator with the exception of planned activities that have not yet been initiated. This is completed as a sensitivity analysis as part of the timber supply analysis (See Appendix 5 – Timber Supply Analysis Information Package).
STRATEGY AND IMPLEMENTATION SCHEDULE
Where applicable existing cutlines or trails are upgraded for forestry access in an attempt to minimize the amount of land base permanently removed from the forested land base. Referrals stress the requirement to ensure road alignments and grades are suitable for forest management purposes as well to reduce the amount of additional roads to constructed. This indicator has been tracked since MP 3.
MONITORING PROCEDURE
These features will be identified and incorporated into the vegetation update and removed from the timber harvesting land base in each timber supply analysis in support of the Management Plans. The identification methods will be through a combination of sources including but not limited to remote sensing, GPS, or data exchange with other industries or agencies. The status will be reported in conjunction with each Management Plan or Timber Supply Analysis.
LINKAGES TO OPERATIONAL PLANS
Where applicable existing cutlines or trails are upgraded for forestry access in an attempt to minimize the amount of land base permanently removed from the forested land base. Referrals stress the requirement to ensure road alignments and grades are suitable for forest management purposes as well to reduce the amount of additional roads to constructed.
3.20 Permanent Access Corridors
Criterion 2: Element(s): 2.2, 4.2
Ecosystem Condition and Productivity Forest Ecosystem Productivity; Forest Land Conversion
CSA Core Indicator(s): 2.2.1 Additions and deletions to the forest area
Indicator Statement Target Statement
Percent of area of the DFA occupied by permanent access corridors associated with forest management activities
We will limit impacts on the land base due to the presence of permanent access corridors to less than 2.4% of the gross land base of the DFA
Value(s): Ecosystem Productivity, Forested Land Base
SFM Objective:
We will sustain forests within the DFA.
Linkage to TFL 48 Licence: For the purposes of sections 2.27(f) and (g) of the TFL 48 Licence this SFM Objective(s), Indicator Statement, Target Statement, Acceptable Variance, and Strategy and Implementation Schedule are submitted to the MoFR for approval.
Canfor common indicator statement: Percent of gross forested land base in the DFA converted to non-forest land use
ACCEPTABLE VARIANCE
Acceptable variance to a maximum of 3.0%.
WHAT IS THIS INDICATOR AND WHY IS IT IMPORTANT?
Permanent Access Corridors (PAC) is defined as those access corridors that are not planned to be returned to a forested state. Some of these roads or corridors may be managed to meet access strategies but are still classed as a permanent reduction in forest area.
PAC include roads, landings, trails borrow pits, quarry or other similar structure within a cut block or provides access to cutblocks. These permanent access corridors are also used to provide access to other tenure holders and industrial uses as well as providing access for public recreation and fire protection activities. The PAC use and/or construction material (e.g. hard gravel substrate) precludes the
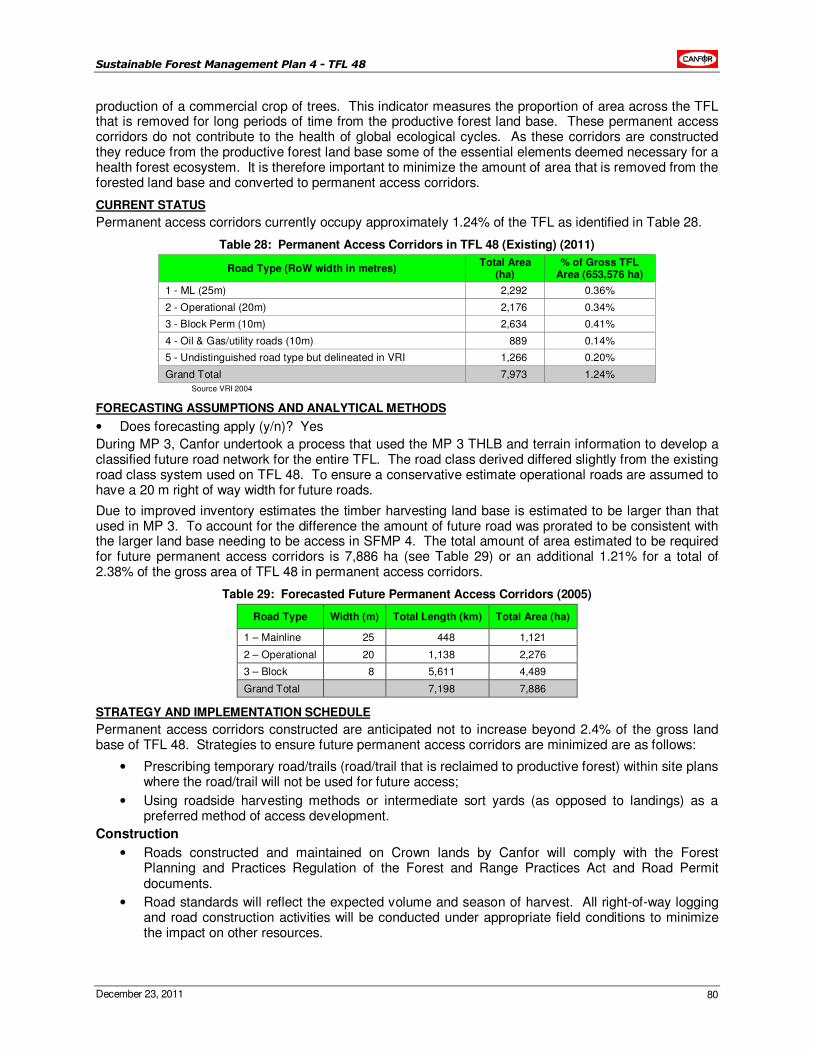
Sustainable Forest Management Plan 4 - TFL 48
December 23, 2011 80
production of a commercial crop of trees. This indicator measures the proportion of area across the TFL that is removed for long periods of time from the productive forest land base. These permanent access corridors do not contribute to the health of global ecological cycles. As these corridors are constructed they reduce from the productive forest land base some of the essential elements deemed necessary for a health forest ecosystem. It is therefore important to minimize the amount of area that is removed from the forested land base and converted to permanent access corridors.
CURRENT STATUS
Permanent access corridors currently occupy approximately 1.24% of the TFL as identified in Table 28.
Table 28: Permanent Access Corridors in TFL 48 (Existing) (2011)
Road Type (RoW width in metres) Total Area
(ha) % of Gross TFL
Area (653,576 ha)
1 - ML (25m) 2,292 0.36%
2 - Operational (20m) 2,176 0.34%
3 - Block Perm (10m) 2,634 0.41%
4 - Oil & Gas/utility roads (10m) 889 0.14%
5 - Undistinguished road type but delineated in VRI 1,266 0.20%
Grand Total 7,973 1.24%
Source VRI 2004
FORECASTING ASSUMPTIONS AND ANALYTICAL METHODS
• Does forecasting apply (y/n)? Yes
During MP 3, Canfor undertook a process that used the MP 3 THLB and terrain information to develop a classified future road network for the entire TFL. The road class derived differed slightly from the existing road class system used on TFL 48. To ensure a conservative estimate operational roads are assumed to have a 20 m right of way width for future roads.
Due to improved inventory estimates the timber harvesting land base is estimated to be larger than that used in MP 3. To account for the difference the amount of future road was prorated to be consistent with the larger land base needing to be access in SFMP 4. The total amount of area estimated to be required for future permanent access corridors is 7,886 ha (see Table 29) or an additional 1.21% for a total of 2.38% of the gross area of TFL 48 in permanent access corridors.
Table 29: Forecasted Future Permanent Access Corridors (2005)
Road Type Width (m) Total Length (km) Total Area (ha)
1 – Mainline 25 448 1,121
2 – Operational 20 1,138 2,276
3 – Block 8 5,611 4,489
Grand Total 7,198 7,886
STRATEGY AND IMPLEMENTATION SCHEDULE
Permanent access corridors constructed are anticipated not to increase beyond 2.4% of the gross land base of TFL 48. Strategies to ensure future permanent access corridors are minimized are as follows:
• Prescribing temporary road/trails (road/trail that is reclaimed to productive forest) within site plans where the road/trail will not be used for future access;
• Using roadside harvesting methods or intermediate sort yards (as opposed to landings) as a preferred method of access development.
Construction
• Roads constructed and maintained on Crown lands by Canfor will comply with the Forest Planning and Practices Regulation of the Forest and Range Practices Act and Road Permit documents.
• Road standards will reflect the expected volume and season of harvest. All right-of-way logging and road construction activities will be conducted under appropriate field conditions to minimize the impact on other resources.
Sustainable Forest Management Plan 4 - TFL 48
December 23, 2011 81
• Maintaining road widths to a minimum while providing for safe and effective access;
• Coordinating access development with other industrial users to minimize total access development. This is achieved through referrals received by other users and providing comments concerning status and standard of access construction to make access useable to multiple users.
Maintenance
• Road maintenance will be conducted on a regular schedule on all roads where we have maintenance responsibilities.
• All maintenance activities will be carried out in a timely manner to minimize risk to the road, its users and the environment.
• Required maintenance activities will be determined from information documented during regular inspections as well as from information reported by users of the road.
Deactivation
• Deactivation of all inactive roads and logging trails will be conducted in a timely manner to protect the integrity of the road or structures and to protect non-timber values.
• Measures will be taken to stabilize roads during periods of inactivity, including the control of runoff, the removal of sidecast where necessary, and the re-establishment of vegetation for semi-permanent and permanently deactivated roads.
Road Rehabilitation
• We rehabilitate temporary roads to maximize the land base available for timber production.
MONITORING PROCEDURE
All roads constructed on TFL 48 are tracked in Genus. Information about road class, construction date, deactivation status etc. is tracked. This information is used to buffer and remove area from the productive forest land base and assign it to a road designation. Permanent access corridors are identified in our VRI database as having a Non Veg Cover Type of “RP” greater than 15% or a polygon type of one of the road types described in Table 27.
The percent of the TFL land base occupied by permanent access corridors is described by the following formula. This indicator is reported on at each Management Plan.
Formula:
% PACor = (PACor / DFA) * 100
Variables:
PACor Amount of area within permanent access corridors on TFL 48
DFA Gross area of TFL 48
% PACor Percent of gross land base within permanent access corridors on TFL 48
LINKAGES TO OPERATIONAL PLANS
Forest Stewardship Plans consider the overall forest resource and long term timber harvesting land base and the need for permanent access corridors. Site plans identify which roads are permanent and which are temporary and will be rehabilitated.
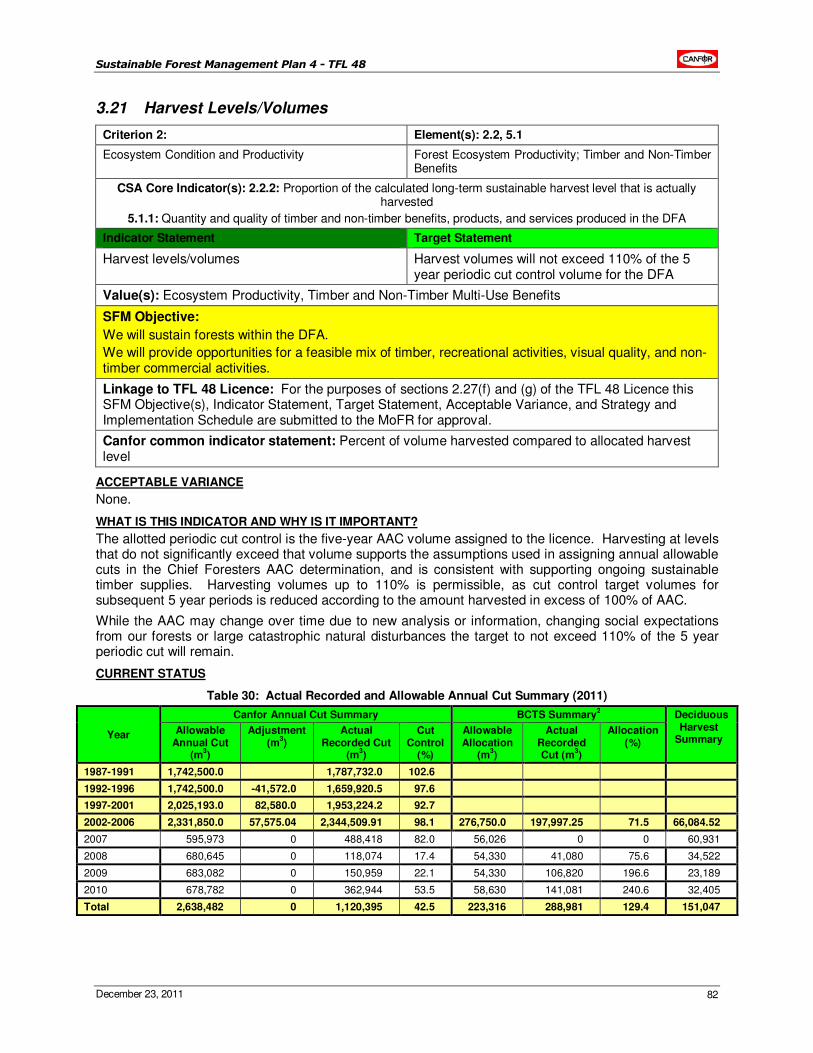
Sustainable Forest Management Plan 4 - TFL 48
December 23, 2011 82
3.21 Harvest Levels/Volumes
Criterion 2: Element(s): 2.2, 5.1
Ecosystem Condition and Productivity Forest Ecosystem Productivity; Timber and Non-Timber Benefits
CSA Core Indicator(s): 2.2.2: Proportion of the calculated long-term sustainable harvest level that is actually harvested
5.1.1: Quantity and quality of timber and non-timber benefits, products, and services produced in the DFA
Indicator Statement Target Statement
Harvest levels/volumes Harvest volumes will not exceed 110% of the 5 year periodic cut control volume for the DFA
Value(s): Ecosystem Productivity, Timber and Non-Timber Multi-Use Benefits
SFM Objective:
We will sustain forests within the DFA.
We will provide opportunities for a feasible mix of timber, recreational activities, visual quality, and non-timber commercial activities.
Linkage to TFL 48 Licence: For the purposes of sections 2.27(f) and (g) of the TFL 48 Licence this SFM Objective(s), Indicator Statement, Target Statement, Acceptable Variance, and Strategy and Implementation Schedule are submitted to the MoFR for approval.
Canfor common indicator statement: Percent of volume harvested compared to allocated harvest level
ACCEPTABLE VARIANCE
None.
WHAT IS THIS INDICATOR AND WHY IS IT IMPORTANT?
The allotted periodic cut control is the five-year AAC volume assigned to the licence. Harvesting at levels that do not significantly exceed that volume supports the assumptions used in assigning annual allowable cuts in the Chief Foresters AAC determination, and is consistent with supporting ongoing sustainable timber supplies. Harvesting volumes up to 110% is permissible, as cut control target volumes for subsequent 5 year periods is reduced according to the amount harvested in excess of 100% of AAC.
While the AAC may change over time due to new analysis or information, changing social expectations from our forests or large catastrophic natural disturbances the target to not exceed 110% of the 5 year periodic cut will remain.
CURRENT STATUS
Table 30: Actual Recorded and Allowable Annual Cut Summary (2011)
Year
Canfor Annual Cut Summary BCTS Summary2 Deciduous
Harvest Summary
Allowable Annual Cut
(m3)
Adjustment (m
3)
Actual Recorded Cut
(m3)
Cut Control
(%)
Allowable Allocation
(m3)
Actual Recorded Cut (m
3)
Allocation (%)
1987-1991 1,742,500.0 1,787,732.0 102.6
1992-1996 1,742,500.0 -41,572.0 1,659,920.5 97.6
1997-2001 2,025,193.0 82,580.0 1,953,224.2 92.7
2002-2006 2,331,850.0 57,575.04 2,344,509.91 98.1 276,750.0 197,997.25 71.5 66,084.52
2007 595,973 0 488,418 82.0 56,026 0 0 60,931
2008 680,645 0 118,074 17.4 54,330 41,080 75.6 34,522
2009 683,082 0 150,959 22.1 54,330 106,820 196.6 23,189
2010 678,782 0 362,944 53.5 58,630 141,081 240.6 32,405
Total 2,638,482 0 1,120,395 42.5 223,316 288,981 129.4 151,047
Sustainable Forest Management Plan 4 - TFL 48
December 23, 2011 83
FORECASTING ASSUMPTIONS AND ANALYTICAL METHODS
• Does forecasting apply (y/n)? No
STRATEGY AND IMPLEMENTATION SCHEDULE
We will prepare harvest plans that are consistent with the licenses five year cut control volumes. The cut control volumes are monitored annually and revisions to plans made if needed to ensure the five-year targets are attainable.
MONITORING PROCEDURE
Harvest plans use the best available information to project volumes logged, for comparison to target cut levels. Scale information is used to monitor the actual deliveries compared to planned deliveries. The Ministry of Forests and Range provides annual summaries of actual cut control performance to the licencees.
Annual harvested volumes, and progress towards five-year periodic cut control levels will be reported in annual reports.
LINKAGES TO OPERATIONAL PLANS
SP’s and cruise compilations are used for annual harvest plans to more accurately project the volumes to be delivered in the next year.
3.22 Allowable Annual Cut
Criterion 2: Element(s): 2.2
Ecosystem Condition and Productivity Forest Ecosystem Productivity
CSA Core Indicator(s): 2.2.2 Proportion of the calculated long-term sustainable harvest level that is actually harvested
Indicator Statement Target Statement
Allowable Annual Cut (AAC) We will ensure that the Allowable Annual Cut will not adversely impact Long Term Harvest Level
Value(s): Ecosystem Productivity
SFM Objective:
We will sustain forests within the DFA.
Linkage to TFL 48 Licence: For the purposes of sections 2.27(f) and (g) of the TFL 48 Licence this SFM Objective(s), Indicator Statement, Target Statement, Acceptable Variance, and Strategy and Implementation Schedule are submitted to the MoFR for approval.
Canfor common indicator statement: NA
ACCEPTABLE VARIANCE
AAC increases as a result of natural disturbances (e.g. Mountain Pine Beetle) are an acceptable variance.
Canfor proposes an AAC however, the Chief Forester (Ministry of Forests and Range) determines the AAC for the management unit.
WHAT IS THIS INDICATOR AND WHY IS IT IMPORTANT?
The LTHL is the harvest level that can be maintained indefinitely given a specified timber harvesting land base and associated management regime within the TFL. The analysis that accompanies the timber Supply Review (TSR) is based on the best available information and provides a timber supply forecast for the next 250 years. Timber Supply Reviews are generally conducted every five years during which the assessment of the long term sustainable harvest level can be reviewed in the context of current socio-economic condition, ecological consideration and also with updated inventory and forest management information.
It is Canfor’s responsibility to prepare and conduct the Timber Supply Analysis information for review by the MoFR. The AAC determination is conducted by the Chief Forester of BC and is generally within the long-term harvest level forecasts in order to ensure sustainable forest productivity.
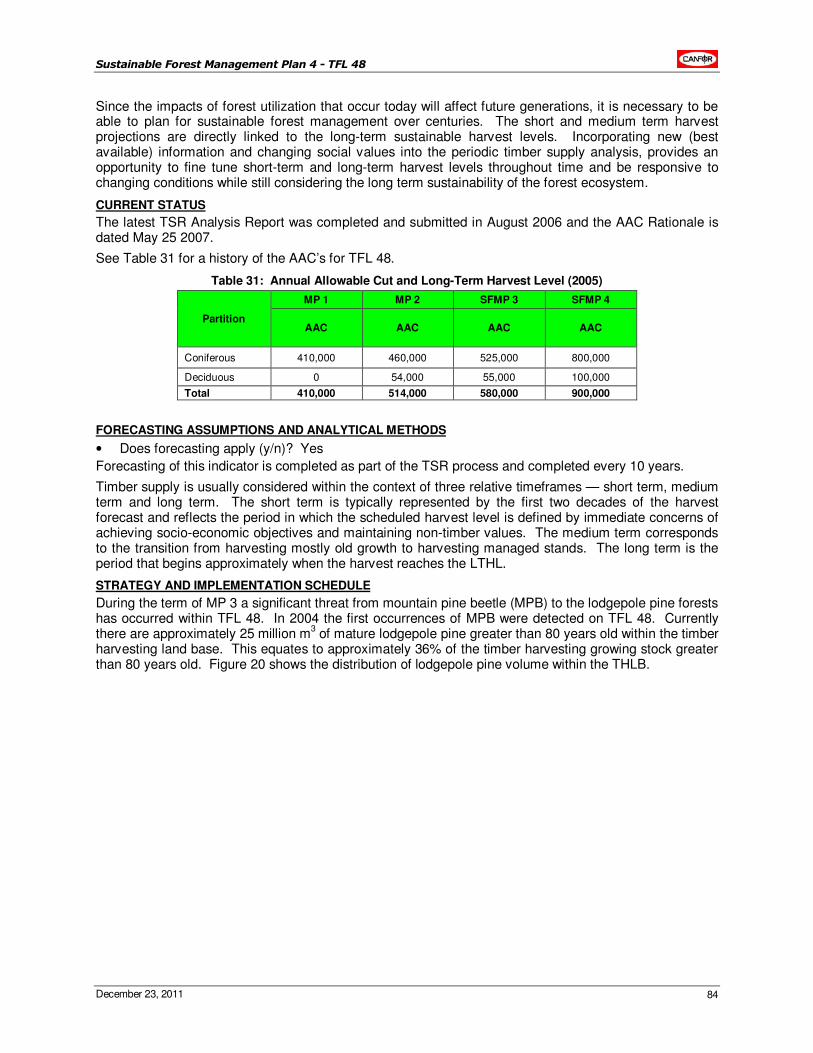
Sustainable Forest Management Plan 4 - TFL 48
December 23, 2011 84
Since the impacts of forest utilization that occur today will affect future generations, it is necessary to be able to plan for sustainable forest management over centuries. The short and medium term harvest projections are directly linked to the long-term sustainable harvest levels. Incorporating new (best available) information and changing social values into the periodic timber supply analysis, provides an opportunity to fine tune short-term and long-term harvest levels throughout time and be responsive to changing conditions while still considering the long term sustainability of the forest ecosystem.
CURRENT STATUS
The latest TSR Analysis Report was completed and submitted in August 2006 and the AAC Rationale is dated May 25 2007.
See Table 31 for a history of the AAC’s for TFL 48.
Table 31: Annual Allowable Cut and Long-Term Harvest Level (2005)
Partition
MP 1 MP 2 SFMP 3 SFMP 4
AAC AAC AAC AAC
Coniferous 410,000 460,000 525,000 800,000
Deciduous 0 54,000 55,000 100,000
Total 410,000 514,000 580,000 900,000
FORECASTING ASSUMPTIONS AND ANALYTICAL METHODS
• Does forecasting apply (y/n)? Yes
Forecasting of this indicator is completed as part of the TSR process and completed every 10 years.
Timber supply is usually considered within the context of three relative timeframes — short term, medium term and long term. The short term is typically represented by the first two decades of the harvest forecast and reflects the period in which the scheduled harvest level is defined by immediate concerns of achieving socio-economic objectives and maintaining non-timber values. The medium term corresponds to the transition from harvesting mostly old growth to harvesting managed stands. The long term is the period that begins approximately when the harvest reaches the LTHL.
STRATEGY AND IMPLEMENTATION SCHEDULE
During the term of MP 3 a significant threat from mountain pine beetle (MPB) to the lodgepole pine forests has occurred within TFL 48. In 2004 the first occurrences of MPB were detected on TFL 48. Currently there are approximately 25 million m
3 of mature lodgepole pine greater than 80 years old within the timber
harvesting land base. This equates to approximately 36% of the timber harvesting growing stock greater than 80 years old. Figure 20 shows the distribution of lodgepole pine volume within the THLB.
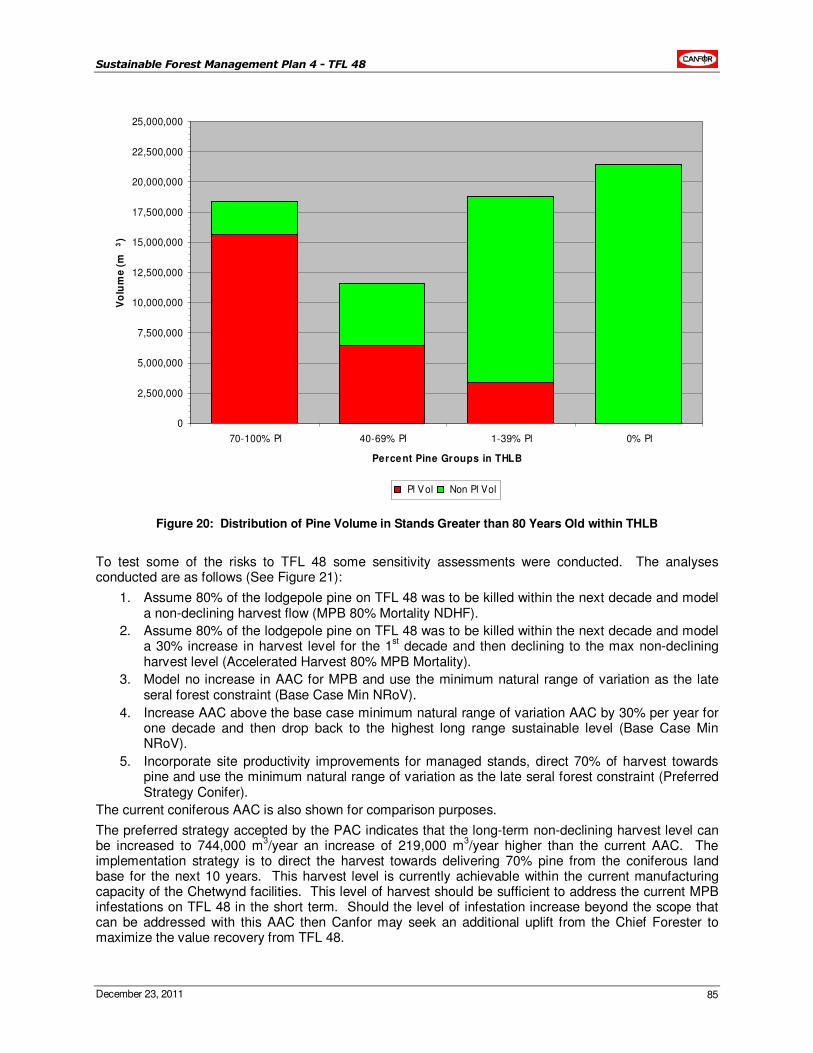
Sustainable Forest Management Plan 4 - TFL 48
December 23, 2011 85
0
2,500,000
5,000,000
7,500,000
10,000,000
12,500,000
15,000,000
17,500,000
20,000,000
22,500,000
25,000,000
70-100% Pl 40-69% Pl 1-39% Pl 0% Pl
Percent Pine Groups in THLB
Vo
lum
e (
m3)
Pl Vol Non Pl Vol
Figure 20: Distribution of Pine Volume in Stands Greater than 80 Years Old within THLB
To test some of the risks to TFL 48 some sensitivity assessments were conducted. The analyses conducted are as follows (See Figure 21):
1. Assume 80% of the lodgepole pine on TFL 48 was to be killed within the next decade and model a non-declining harvest flow (MPB 80% Mortality NDHF).
2. Assume 80% of the lodgepole pine on TFL 48 was to be killed within the next decade and model a 30% increase in harvest level for the 1
st decade and then declining to the max non-declining
harvest level (Accelerated Harvest 80% MPB Mortality).
3. Model no increase in AAC for MPB and use the minimum natural range of variation as the late seral forest constraint (Base Case Min NRoV).
4. Increase AAC above the base case minimum natural range of variation AAC by 30% per year for one decade and then drop back to the highest long range sustainable level (Base Case Min NRoV).
5. Incorporate site productivity improvements for managed stands, direct 70% of harvest towards pine and use the minimum natural range of variation as the late seral forest constraint (Preferred Strategy Conifer).
The current coniferous AAC is also shown for comparison purposes.
The preferred strategy accepted by the PAC indicates that the long-term non-declining harvest level can be increased to 744,000 m
3/year an increase of 219,000 m
3/year higher than the current AAC. The
implementation strategy is to direct the harvest towards delivering 70% pine from the coniferous land base for the next 10 years. This harvest level is currently achievable within the current manufacturing capacity of the Chetwynd facilities. This level of harvest should be sufficient to address the current MPB infestations on TFL 48 in the short term. Should the level of infestation increase beyond the scope that can be addressed with this AAC then Canfor may seek an additional uplift from the Chief Forester to maximize the value recovery from TFL 48.
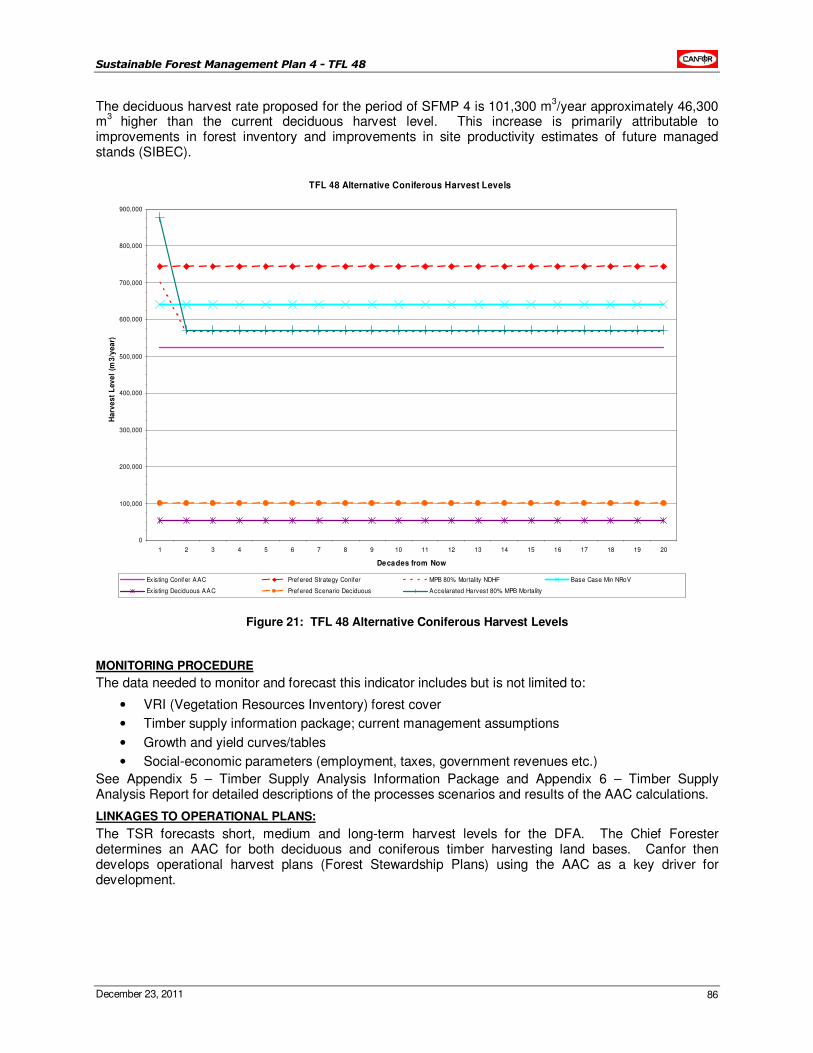
Sustainable Forest Management Plan 4 - TFL 48
December 23, 2011 86
The deciduous harvest rate proposed for the period of SFMP 4 is 101,300 m3/year approximately 46,300
m3
higher than the current deciduous harvest level. This increase is primarily attributable to improvements in forest inventory and improvements in site productivity estimates of future managed stands (SIBEC).
TFL 48 Alternative Coniferous Harvest Levels
0
100,000
200,000
300,000
400,000
500,000
600,000
700,000
800,000
900,000
1 2 3 4 5 6 7 8 9 10 11 12 13 14 15 16 17 18 19 20
Decades from Now
Ha
rve
st
Lev
el
(m3
/ye
ar)
Existing Conif er AAC Pref ered Strategy Conifer MPB 80% Mortality NDHF Base Case Min NRoV
Existing Deciduous AAC Pref ered Scenario Deciduous Accelarated Harvest 80% MPB Mortality
Figure 21: TFL 48 Alternative Coniferous Harvest Levels
MONITORING PROCEDURE
The data needed to monitor and forecast this indicator includes but is not limited to:
• VRI (Vegetation Resources Inventory) forest cover
• Timber supply information package; current management assumptions
• Growth and yield curves/tables
• Social-economic parameters (employment, taxes, government revenues etc.)
See Appendix 5 – Timber Supply Analysis Information Package and Appendix 6 – Timber Supply Analysis Report for detailed descriptions of the processes scenarios and results of the AAC calculations.
LINKAGES TO OPERATIONAL PLANS:
The TSR forecasts short, medium and long-term harvest levels for the DFA. The Chief Forester determines an AAC for both deciduous and coniferous timber harvesting land bases. Canfor then develops operational harvest plans (Forest Stewardship Plans) using the AAC as a key driver for development.
Sustainable Forest Management Plan 4 - TFL 48
December 23, 2011 87
3.23 Soil Degradation
Criterion 3: Element(s): 3.1
Soil and Water Soil Quality and Quantity
CSA Core Indicator(s): 3.1.1 Level of soil disturbance
Indicator Statement Target Statement
Soil degradation We will not exceed site degradation guidelines as defined in site plans
Value(s): Soil Productivity
SFM Objective:
We will protect soil resources to sustain productive forests.
Linkage to TFL 48 Licence: For the purposes of sections 2.27(f) and (g) of the TFL 48 Licence this SFM Objective(s), Indicator Statement, Target Statement, Acceptable Variance, and Strategy and Implementation Schedule are submitted to the MoFR for approval.
Canfor common indicator statement: NA
ACCEPTABLE VARIANCE
None. Limits and exceptions will be already identified in site plans.
WHAT IS THIS INDICATOR AND WHY IS IT IMPORTANT?
Soil degradation refers to the reduction of the capacity of the soil to productively grow trees. The majority of soil degradation results from the construction of permanent access structures (PAS) required to harvest the block. PAS include roads, landings, trails, borrow pits, quarry or other similar structure in a cutblock that are developed for timber harvesting or other forest management activities, and whose use and/or construction material precludes the production of a commercial crop of trees. Roads are also used to provide access to other tenure holders and industrial users as well as providing access for public recreation and fire protection activities. This indicator measures the proportion of area that is removed for long periods of time from the productive forest land base within harvested cutblocks. These PAS do not contribute to maintaining forest ecosystem condition and productivity nor do they contribute to the health of global ecological cycles. As these structures are constructed they reduce from the productive forest land base some of the essential elements deemed necessary for a healthy forest ecosystem.
CURRENT STATUS
The limits as set in the site plans have been met for all blocks harvested in 2000 – 2010 inclusive.
FORECASTING ASSUMPTIONS AND ANALYTICAL METHODS
• Does forecasting apply (y/n)? No
The forest development plan, the twenty year plan, and the timber supply analysis for the TFL consider and evaluate future requirements for permanent roads. Areas occupied by permanent access structures do not contribute to the THLB.
STRATEGY AND IMPLEMENTATION SCHEDULE
Disturbed road surface widths are actively monitored for compliance to the plan during road construction operations. The road widths are measured again following completion and a total disturbed area is calculated and compared against the plan. Compliance to the plan is then tracked and reported. This monitoring and tracking occurs constantly with the active operations.
MONITORING PROCEDURE
Road and harvest inspections and post-harvest assessments are conducted to ensure operations are within the prescribed limits.
LINKAGES TO OPERATIONAL PLANS
Operational plans as prepared by forest planners will continue to prescribe the most appropriate methods to reduce the losses to the forest landbase and will be responsible to ensure that over all planned road and landing development will not be disproportionate to the area to be harvested. In other words, the

Sustainable Forest Management Plan 4 - TFL 48
December 23, 2011 88
prescribing forester will only plan what is necessary to get the entire block harvested, typically larger blocks require less overall development percentage wise as opposed to smaller blocks.
3.24 Soil Disturbance Surveys
Criterion 3: Element(s): 3.1
Soil and Water Soil Quality and Quantity
CSA Core Indicator(s): 3.1.1 Level of soil disturbance
Indicator Statement Target Statement
Soil disturbance surveys We will not exceed soil disturbance limits within cutblocks as defined in site plans
Value(s): Soil Productivity
SFM Objective:
We will protect soil resources to sustain productive forests.
Linkage to TFL 48 Licence: For the purposes of sections 2.27(f) and (g) of the TFL 48 Licence this SFM Objective(s), Indicator Statement, Target Statement, Acceptable Variance, and Strategy and Implementation Schedule are submitted to the MoFR for approval.
Canfor common indicator statement: Percent of harvested blocks meeting soil disturbance objectives identified in plans
ACCEPTABLE VARIANCE
None. Limits and exceptions will be already identified in site plans.
WHAT IS THIS INDICATOR AND WHY IS IT IMPORTANT?
The following are types of soil disturbance possible on a cutblock as a result of harvesting
• Mass wasting from road and trail cut and fill failures
• Surface soil erosion
• Soil displacement
• Soil compaction
• Forest floor displacement
It is important to minimize soil disturbance as it may have a direct impact on the capacity of the soil to sustain a productive forest. While some disturbance is natural and even required to regenerate certain species, excessive unnatural disturbance is not desirable. When soil disturbance is excessive, some of the essential elements deemed necessary for a healthy forest ecosystem are removed.
CURRENT STATUS
All 2000-2010 harvested areas were within allowable soil disturbance limits. Sensitive sites are either harvested with low ground pressure equipment, cable yarders or helicopters. Table 32 outlines soil disturbance guidelines.
Table 32: Recommended Allowable Soil Disturbance Within the Net Area to be Reforested (NAR)
Leading soil disturbance hazard Soil sensitivity ratinga
Allowable dispersed soil disturbance (% NAR)
Mass wastingb VH, H 5
Surface soil erosion VH 5
Soil displacement VH 5
Soil compaction VH 5
Mass wasting M, L 10
Surface soil erosion H, M, L 10
Soil displacement H, M, L 10
Soil compaction H, M, L 10
Forest floor displacement VH, H, M, L 10 a VH = Very High; H = High; M = Moderate; L = Low
b Mass wasting hazard refers to the potential for cut and fill failures, and should not be confused with terrain stability, which refers to the likelihood of landslides.
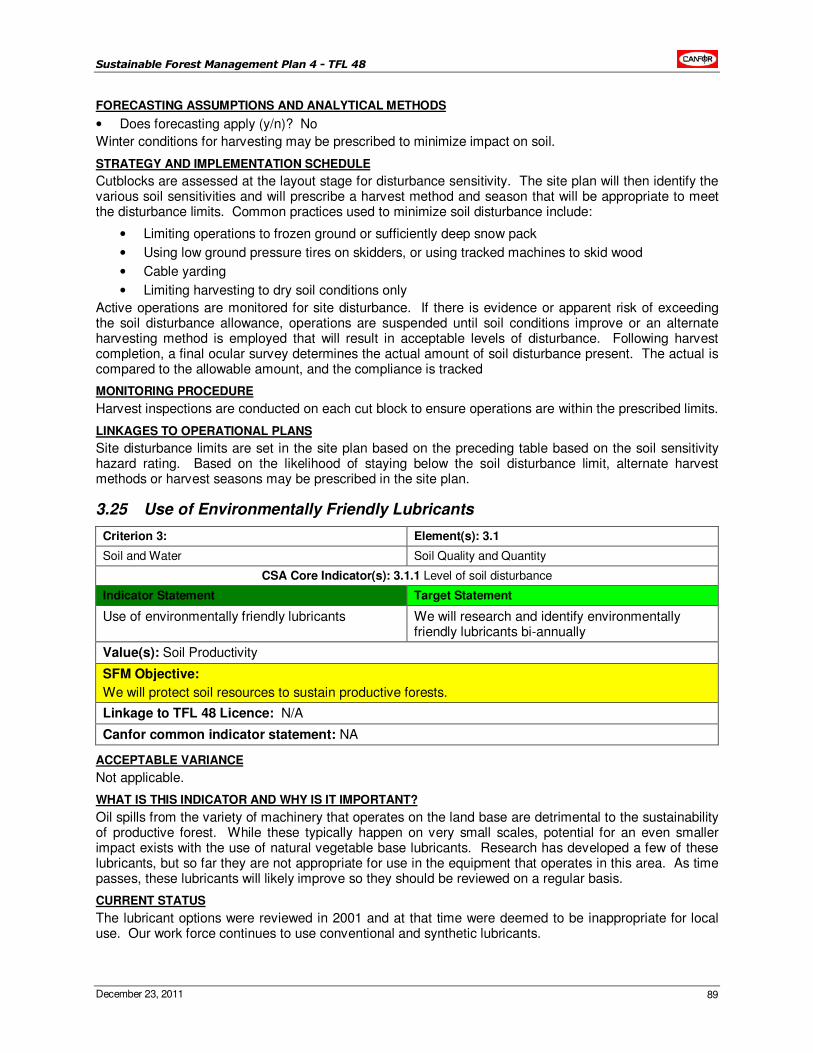
Sustainable Forest Management Plan 4 - TFL 48
December 23, 2011 89
FORECASTING ASSUMPTIONS AND ANALYTICAL METHODS
• Does forecasting apply (y/n)? No
Winter conditions for harvesting may be prescribed to minimize impact on soil.
STRATEGY AND IMPLEMENTATION SCHEDULE
Cutblocks are assessed at the layout stage for disturbance sensitivity. The site plan will then identify the various soil sensitivities and will prescribe a harvest method and season that will be appropriate to meet the disturbance limits. Common practices used to minimize soil disturbance include:
• Limiting operations to frozen ground or sufficiently deep snow pack
• Using low ground pressure tires on skidders, or using tracked machines to skid wood
• Cable yarding
• Limiting harvesting to dry soil conditions only
Active operations are monitored for site disturbance. If there is evidence or apparent risk of exceeding the soil disturbance allowance, operations are suspended until soil conditions improve or an alternate harvesting method is employed that will result in acceptable levels of disturbance. Following harvest completion, a final ocular survey determines the actual amount of soil disturbance present. The actual is compared to the allowable amount, and the compliance is tracked
MONITORING PROCEDURE
Harvest inspections are conducted on each cut block to ensure operations are within the prescribed limits.
LINKAGES TO OPERATIONAL PLANS
Site disturbance limits are set in the site plan based on the preceding table based on the soil sensitivity hazard rating. Based on the likelihood of staying below the soil disturbance limit, alternate harvest methods or harvest seasons may be prescribed in the site plan.
3.25 Use of Environmentally Friendly Lubricants
Criterion 3: Element(s): 3.1
Soil and Water Soil Quality and Quantity
CSA Core Indicator(s): 3.1.1 Level of soil disturbance
Indicator Statement Target Statement
Use of environmentally friendly lubricants We will research and identify environmentally friendly lubricants bi-annually
Value(s): Soil Productivity
SFM Objective:
We will protect soil resources to sustain productive forests.
Linkage to TFL 48 Licence: N/A
Canfor common indicator statement: NA
ACCEPTABLE VARIANCE
Not applicable.
WHAT IS THIS INDICATOR AND WHY IS IT IMPORTANT?
Oil spills from the variety of machinery that operates on the land base are detrimental to the sustainability of productive forest. While these typically happen on very small scales, potential for an even smaller impact exists with the use of natural vegetable base lubricants. Research has developed a few of these lubricants, but so far they are not appropriate for use in the equipment that operates in this area. As time passes, these lubricants will likely improve so they should be reviewed on a regular basis.
CURRENT STATUS
The lubricant options were reviewed in 2001 and at that time were deemed to be inappropriate for local use. Our work force continues to use conventional and synthetic lubricants.
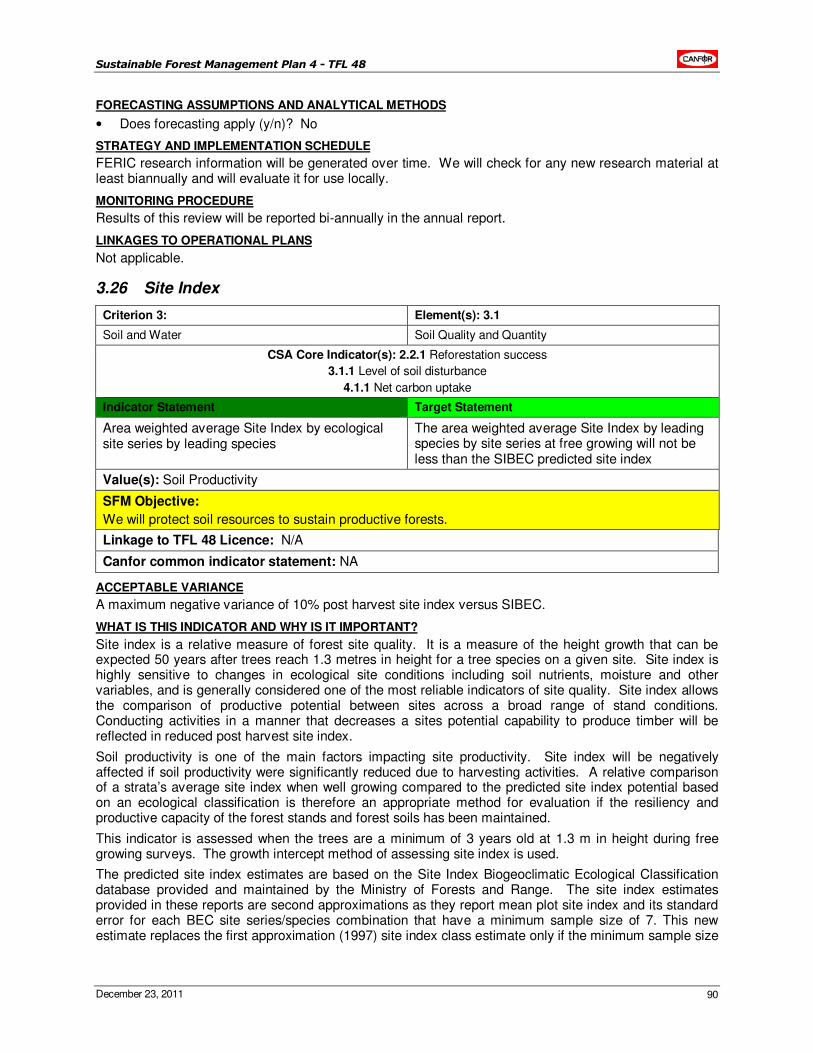
Sustainable Forest Management Plan 4 - TFL 48
December 23, 2011 90
FORECASTING ASSUMPTIONS AND ANALYTICAL METHODS
• Does forecasting apply (y/n)? No
STRATEGY AND IMPLEMENTATION SCHEDULE
FERIC research information will be generated over time. We will check for any new research material at least biannually and will evaluate it for use locally.
MONITORING PROCEDURE
Results of this review will be reported bi-annually in the annual report.
LINKAGES TO OPERATIONAL PLANS
Not applicable.
3.26 Site Index
Criterion 3: Element(s): 3.1
Soil and Water Soil Quality and Quantity
CSA Core Indicator(s): 2.2.1 Reforestation success
3.1.1 Level of soil disturbance
4.1.1 Net carbon uptake
Indicator Statement Target Statement
Area weighted average Site Index by ecological site series by leading species
The area weighted average Site Index by leading species by site series at free growing will not be less than the SIBEC predicted site index
Value(s): Soil Productivity
SFM Objective:
We will protect soil resources to sustain productive forests.
Linkage to TFL 48 Licence: N/A
Canfor common indicator statement: NA
ACCEPTABLE VARIANCE
A maximum negative variance of 10% post harvest site index versus SIBEC.
WHAT IS THIS INDICATOR AND WHY IS IT IMPORTANT?
Site index is a relative measure of forest site quality. It is a measure of the height growth that can be expected 50 years after trees reach 1.3 metres in height for a tree species on a given site. Site index is highly sensitive to changes in ecological site conditions including soil nutrients, moisture and other variables, and is generally considered one of the most reliable indicators of site quality. Site index allows the comparison of productive potential between sites across a broad range of stand conditions. Conducting activities in a manner that decreases a sites potential capability to produce timber will be reflected in reduced post harvest site index.
Soil productivity is one of the main factors impacting site productivity. Site index will be negatively affected if soil productivity were significantly reduced due to harvesting activities. A relative comparison of a strata’s average site index when well growing compared to the predicted site index potential based on an ecological classification is therefore an appropriate method for evaluation if the resiliency and productive capacity of the forest stands and forest soils has been maintained.
This indicator is assessed when the trees are a minimum of 3 years old at 1.3 m in height during free growing surveys. The growth intercept method of assessing site index is used.
The predicted site index estimates are based on the Site Index Biogeoclimatic Ecological Classification database provided and maintained by the Ministry of Forests and Range. The site index estimates provided in these reports are second approximations as they report mean plot site index and its standard error for each BEC site series/species combination that have a minimum sample size of 7. This new estimate replaces the first approximation (1997) site index class estimate only if the minimum sample size
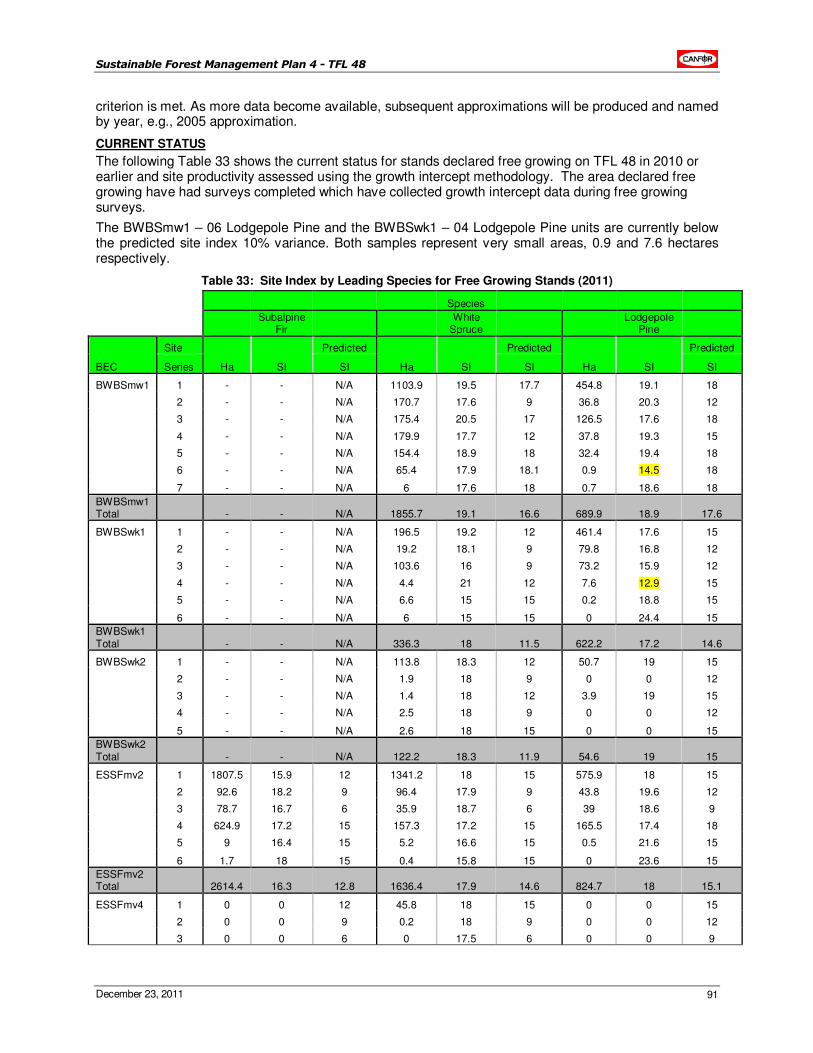
Sustainable Forest Management Plan 4 - TFL 48
December 23, 2011 91
criterion is met. As more data become available, subsequent approximations will be produced and named by year, e.g., 2005 approximation.
CURRENT STATUS
The following Table 33 shows the current status for stands declared free growing on TFL 48 in 2010 or earlier and site productivity assessed using the growth intercept methodology. The area declared free growing have had surveys completed which have collected growth intercept data during free growing surveys.
The BWBSmw1 – 06 Lodgepole Pine and the BWBSwk1 – 04 Lodgepole Pine units are currently below the predicted site index 10% variance. Both samples represent very small areas, 0.9 and 7.6 hectares respectively.
Table 33: Site Index by Leading Species for Free Growing Stands (2011)
Species
Subalpine
Fir White
Spruce Lodgepole
Pine
BEC
Site
Ha SI
Predicted
Ha SI
Predicted
Ha SI
Predicted
Series SI SI SI
BWBSmw1 1 - - N/A 1103.9 19.5 17.7 454.8 19.1 18
2 - - N/A 170.7 17.6 9 36.8 20.3 12
3 - - N/A 175.4 20.5 17 126.5 17.6 18
4 - - N/A 179.9 17.7 12 37.8 19.3 15
5 - - N/A 154.4 18.9 18 32.4 19.4 18
6 - - N/A 65.4 17.9 18.1 0.9 14.5 18
7 - - N/A 6 17.6 18 0.7 18.6 18
BWBSmw1 Total - - N/A 1855.7 19.1 16.6 689.9 18.9 17.6
BWBSwk1 1 - - N/A 196.5 19.2 12 461.4 17.6 15
2 - - N/A 19.2 18.1 9 79.8 16.8 12
3 - - N/A 103.6 16 9 73.2 15.9 12
4 - - N/A 4.4 21 12 7.6 12.9 15
5 - - N/A 6.6 15 15 0.2 18.8 15
6 - - N/A 6 15 15 0 24.4 15
BWBSwk1 Total - - N/A 336.3 18 11.5 622.2 17.2 14.6
BWBSwk2 1 - - N/A 113.8 18.3 12 50.7 19 15
2 - - N/A 1.9 18 9 0 0 12
3 - - N/A 1.4 18 12 3.9 19 15
4 - - N/A 2.5 18 9 0 0 12
5 - - N/A 2.6 18 15 0 0 15
BWBSwk2 Total - - N/A 122.2 18.3 11.9 54.6 19 15
ESSFmv2 1 1807.5 15.9 12 1341.2 18 15 575.9 18 15
2 92.6 18.2 9 96.4 17.9 9 43.8 19.6 12
3 78.7 16.7 6 35.9 18.7 6 39 18.6 9
4 624.9 17.2 15 157.3 17.2 15 165.5 17.4 18
5 9 16.4 15 5.2 16.6 15 0.5 21.6 15
6 1.7 18 15 0.4 15.8 15 0 23.6 15
ESSFmv2 Total 2614.4 16.3 12.8 1636.4 17.9 14.6 824.7 18 15.1
ESSFmv4 1 0 0 12 45.8 18 15 0 0 15
2 0 0 9 0.2 18 9 0 0 12
3 0 0 6 0 17.5 6 0 0 9
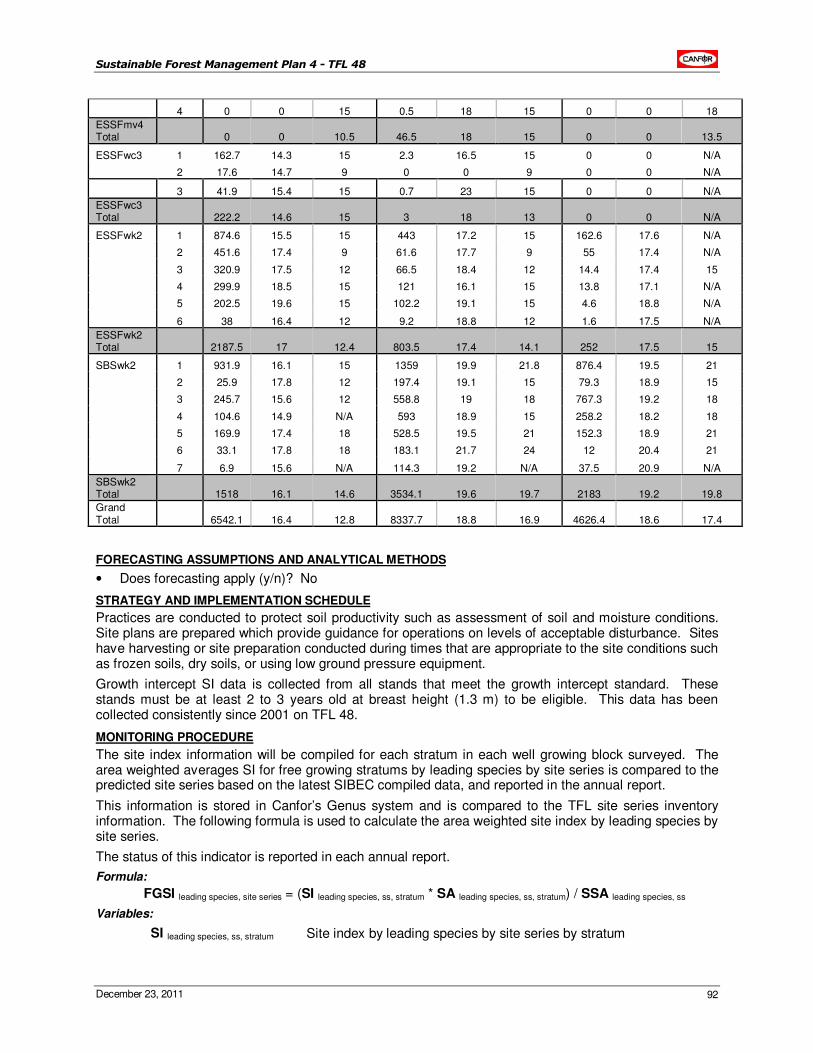
Sustainable Forest Management Plan 4 - TFL 48
December 23, 2011 92
4 0 0 15 0.5 18 15 0 0 18
ESSFmv4 Total 0 0 10.5 46.5 18 15 0 0 13.5
ESSFwc3 1 162.7 14.3 15 2.3 16.5 15 0 0 N/A
2 17.6 14.7 9 0 0 9 0 0 N/A
3 41.9 15.4 15 0.7 23 15 0 0 N/A
ESSFwc3 Total 222.2 14.6 15 3 18 13 0 0 N/A
ESSFwk2 1 874.6 15.5 15 443 17.2 15 162.6 17.6 N/A
2 451.6 17.4 9 61.6 17.7 9 55 17.4 N/A
3 320.9 17.5 12 66.5 18.4 12 14.4 17.4 15
4 299.9 18.5 15 121 16.1 15 13.8 17.1 N/A
5 202.5 19.6 15 102.2 19.1 15 4.6 18.8 N/A
6 38 16.4 12 9.2 18.8 12 1.6 17.5 N/A
ESSFwk2 Total 2187.5 17 12.4 803.5 17.4 14.1 252 17.5 15
SBSwk2 1 931.9 16.1 15 1359 19.9 21.8 876.4 19.5 21
2 25.9 17.8 12 197.4 19.1 15 79.3 18.9 15
3 245.7 15.6 12 558.8 19 18 767.3 19.2 18
4 104.6 14.9 N/A 593 18.9 15 258.2 18.2 18
5 169.9 17.4 18 528.5 19.5 21 152.3 18.9 21
6 33.1 17.8 18 183.1 21.7 24 12 20.4 21
7 6.9 15.6 N/A 114.3 19.2 N/A 37.5 20.9 N/A
SBSwk2 Total 1518 16.1 14.6 3534.1 19.6 19.7 2183 19.2 19.8
Grand Total 6542.1 16.4 12.8 8337.7 18.8 16.9 4626.4 18.6 17.4
FORECASTING ASSUMPTIONS AND ANALYTICAL METHODS
• Does forecasting apply (y/n)? No
STRATEGY AND IMPLEMENTATION SCHEDULE
Practices are conducted to protect soil productivity such as assessment of soil and moisture conditions. Site plans are prepared which provide guidance for operations on levels of acceptable disturbance. Sites have harvesting or site preparation conducted during times that are appropriate to the site conditions such as frozen soils, dry soils, or using low ground pressure equipment.
Growth intercept SI data is collected from all stands that meet the growth intercept standard. These stands must be at least 2 to 3 years old at breast height (1.3 m) to be eligible. This data has been collected consistently since 2001 on TFL 48.
MONITORING PROCEDURE
The site index information will be compiled for each stratum in each well growing block surveyed. The area weighted averages SI for free growing stratums by leading species by site series is compared to the predicted site series based on the latest SIBEC compiled data, and reported in the annual report.
This information is stored in Canfor’s Genus system and is compared to the TFL site series inventory information. The following formula is used to calculate the area weighted site index by leading species by site series.
The status of this indicator is reported in each annual report.
Formula:
FGSI leading species, site series = (SI leading species, ss, stratum * SA leading species, ss, stratum) / SSA leading species, ss
Variables:
SI leading species, ss, stratum Site index by leading species by site series by stratum
Sustainable Forest Management Plan 4 - TFL 48
December 23, 2011 93
SA leading species, ss, stratum Area of stratum by leading species by site series
SSA leading species, ss Total area by leading species by site series
FGSI leading species, site series Area weighted site index at free growing by leading species by site series
LINKAGES TO OPERATIONAL PLANS
Site plans describe acceptable strategies or practices to achieve the objectives. Indicators 3.23 and 3.24 track the adherence to these plans. This indicator provides a long-term assessment that soil productivity has not been compromised and provides feedback to management over time.
3.27 Coarse Woody Debris
Criterion 3: Element(s): 3.1
Soil and Water Soil Quality and Quantity
CSA Core Indicator(s): 3.1.2 Level of downed woody debris
Indicator Statement Target Statement
Average Coarse Woody debris size and m3/ha on
blocks harvested on the TFL since Jan 1, 2004 Average retention level over the TFL since Jan 1, 2004 will be at least 92 m
3/ha of which a minimum
of 46 m3/ha will be greater than 17.5cm in
diameter
Value(s): Ecosystem Productivity
SFM Objective:
We will protect soil resources to sustain productive forests.
Linkage to TFL 48 Licence: N/A
Canfor common indicator statement: NA
ACCEPTABLE VARIANCE
No less than 74 m3/ha for average vol/ha over the TFL and no less than 28 m
3/ha will be greater than
17.5 cm in diameter.
WHAT IS THIS INDICATOR AND WHY IS IT IMPORTANT?
Coarse woody debris is used by rodents, small carnivores and amphibians for cover, nesting, denning and foraging. Woody debris also provides substrate for non-vertebrates, lichen and fungi, and influences such ecosystem processes as nutrient cycling, water retention and stream morphology (Bunnell et al. 2003). Important attributes of downed woody debris include size, decay state and density or distribution (Bunnell et al. 2003). Large pieces of CWD persist longer, providing shelter to larger vertebrates and breeding substrates for amphibians. A range of decay states is essential to support the succession of organisms that require different decay levels. Variability in CWD density and distribution provides subnivean rest sites for mammals in the winter (Porter 2002) and foraging sites for species preferring low volumes of CWD, and supports fungi and bryophytes that favour high volumes of downed wood. Managing and monitoring for these attributes is critical, as downed wood is the most likely habitat element to appear abundant initially after harvest, but become limiting through time (Bunnell et al. 2003). The occurrence of CWD following harvesting, therefore, is also an indicator of the ability of the ecosystem to recover from disturbance.
Based on 131 phase 2 VRI plots located in natural stands 92 m3/ha was the average amount of CWD,
thus has become the target for average retention levels in the future. To address the need for ecologically valuable large CWD, 50% of the target (46 m
3/ha) will be greater than 17.5cm diameter. Due
to the large variation of volumes of CWD occurring naturally over the TFL, the target amount reflects an average over the TFL land base and does not apply as a target to be achieved in all locations at all times.
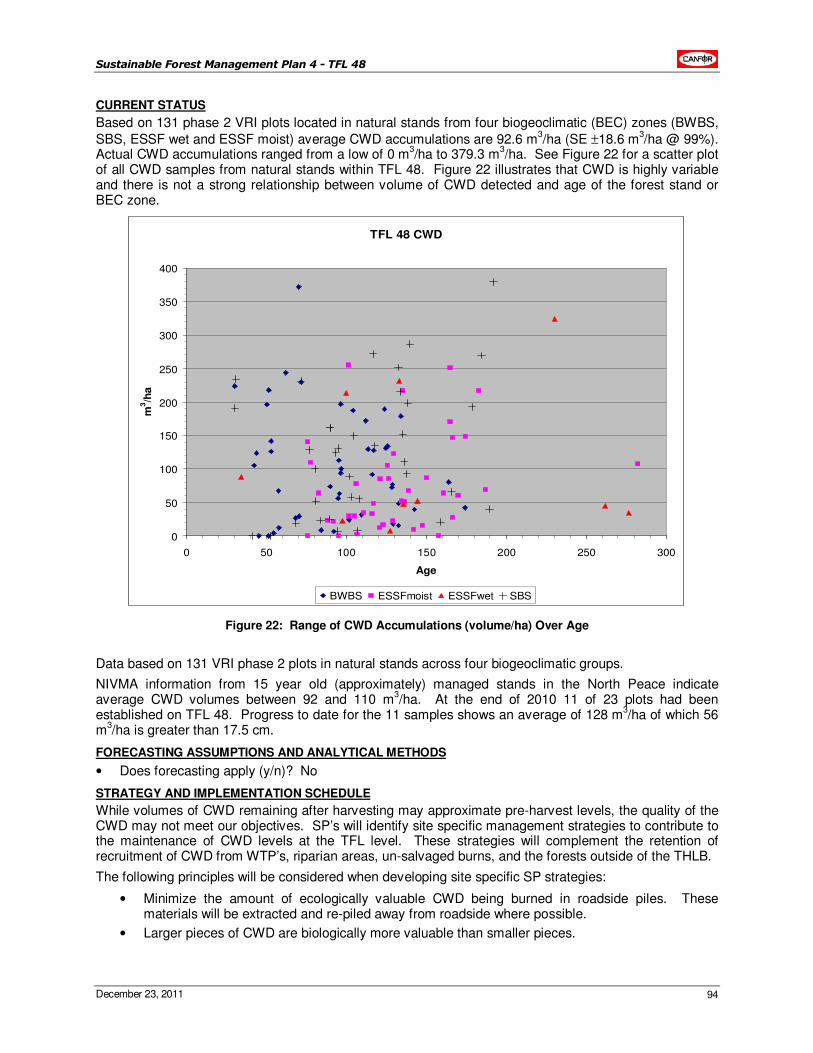
Sustainable Forest Management Plan 4 - TFL 48
December 23, 2011 94
CURRENT STATUS
Based on 131 phase 2 VRI plots located in natural stands from four biogeoclimatic (BEC) zones (BWBS,
SBS, ESSF wet and ESSF moist) average CWD accumulations are 92.6 m3/ha (SE ±18.6 m
3/ha @ 99%).
Actual CWD accumulations ranged from a low of 0 m3/ha to 379.3 m
3/ha. See Figure 22 for a scatter plot
of all CWD samples from natural stands within TFL 48. Figure 22 illustrates that CWD is highly variable and there is not a strong relationship between volume of CWD detected and age of the forest stand or BEC zone.
TFL 48 CWD
0
50
100
150
200
250
300
350
400
0 50 100 150 200 250 300
Age
m3/h
a
BWBS ESSFmoist ESSFwet SBS
Figure 22: Range of CWD Accumulations (volume/ha) Over Age
Data based on 131 VRI phase 2 plots in natural stands across four biogeoclimatic groups.
NIVMA information from 15 year old (approximately) managed stands in the North Peace indicate average CWD volumes between 92 and 110 m
3/ha. At the end of 2010 11 of 23 plots had been
established on TFL 48. Progress to date for the 11 samples shows an average of 128 m3/ha of which 56
m3/ha is greater than 17.5 cm.
FORECASTING ASSUMPTIONS AND ANALYTICAL METHODS
• Does forecasting apply (y/n)? No
STRATEGY AND IMPLEMENTATION SCHEDULE
While volumes of CWD remaining after harvesting may approximate pre-harvest levels, the quality of the CWD may not meet our objectives. SP’s will identify site specific management strategies to contribute to the maintenance of CWD levels at the TFL level. These strategies will complement the retention of recruitment of CWD from WTP’s, riparian areas, un-salvaged burns, and the forests outside of the THLB.
The following principles will be considered when developing site specific SP strategies:
• Minimize the amount of ecologically valuable CWD being burned in roadside piles. These materials will be extracted and re-piled away from roadside where possible.
• Larger pieces of CWD are biologically more valuable than smaller pieces.
Sustainable Forest Management Plan 4 - TFL 48
December 23, 2011 95
• Maintaining a wide range of decay and diameter classes is ecologically desirable.
• Retention of a variety of species is advantageous.
• Standing live and dead trees and/or stubs retained on cutblocks can provide important sources of CWD recruitment.
• CWD within riparian areas can be particularly beneficial ecologically.
• The retention of CWD should be harmonized with other silvicultural objectives.
• Maintain variability in the levels of CWD at the landscape level.
• Measures should include retention of CWD in both concentrations and dispersed patterns, as different organisms favour each of these strategies. Concentrating solely on one method could disadvantage some groups of species (Bunnell 1999).
Monitoring of CWD will begin during the 2006 field season and will include establishment of plots in stands harvested prior to 1991 as part of the managed stand monitoring (see section 2.8). Monitoring of current performance will also begin in 2006 with the establishment of a CWD plot in all areas harvested since Jan 1, 2004, which fall on a 2 km grid sample point.
MONITORING PROCEDURE
Average post harvest CWD will be estimated from measurements taken at the 2 km long-term monitoring points during a silviculture survey subsequent to harvesting of these sample locations. Sampling methodology will follow the Resource Inventory Committee standard described in the Vegetation Resource Inventory ground sampling procedures. The average CWD volume will be monitored annually and depending on the results of this monitoring, revisions to the prescribed management practices within the SP’s may need to be implemented to achieve the SFM targets.
The average CWD volume attained at all 2 km sample points in blocks logged from Jan 1, 2004 until the next SFMP will be reported in the next SFMP.
LINKAGES TO OPERATIONAL PLANS
Site plans or site level plans will identify site-specific management strategies to retain CWD. Annual reviews of CWD plot information will provide feedback on the suitability of SP CWD management measures, and changes to procedures can be made accordingly.
3.28 Stream Crossing Quality Index
Criterion 3: Element(s): 3.2
Soil and Water Water Quality and Quantity
CSA Core Indicator(s): 3.2.1 Proportion of watershed or water management areas with recent stand-replacing disturbance
Indicator Statement Target Statement
Maximum Stream Crossing Quality Index (SCQI) by watershed
The maximum SCQI score is 0.40 by watershed
Value(s): Water Quality and Quantity
SFM Objective:
We will maintain water quality and quantity.
Linkage to TFL 48 Licence: For the purposes of sections 2.27(f) and (g) of the TFL 48 Licence this SFM Objective(s), Indicator Statement, Target Statement, Acceptable Variance, and Strategy and Implementation Schedule are submitted to the MoFR for approval.
Canfor common indicator statement: NA
ACCEPTABLE VARIANCE
There is no acceptable variance for this indicator.
Sustainable Forest Management Plan 4 - TFL 48
December 23, 2011 96
WHAT IS THIS INDICATOR AND WHY IS IT IMPORTANT?
Sediment from forestry practices is generated mainly from the following three sources: roads, landslides and stream bank instability. Significant increases in sediment concentration in streams over natural levels can have a negative effect on fish and fish habitat (Slaney et al. 1977; Government of BC 1995; Hall et al. 1987; Hartman and Scrivener1990; Phillips 1971; Scrivener and Tripp 1998.). Sediment can also reduce the value of water for domestic and agricultural use (Government of BC 1995).
Sediment yields from logging roads can show a 2 to 50-fold increase over historical levels (Reid 1993). The main point of road sediment delivery to streams is at crossings such as culverts and bridges (Brownlee et al. 1988; Government of BC 1995). While it is recognized that roads are not the only source of sediment related to forestry practices, they are considered to be the most significant causes of increased sedimentation (Beschta 1978; Brownlee et al. 1988; Government of BC 1995; Reid and Dunne 1984). Through the proper layout, construction, deactivation and use of erosion and sediment control (ESC) measures, the impact that roads have on water quality can be significantly reduced (Beaudry 1998; Government of BC 1995). In an effort to assess the impact that stream crossings are having on the water quality within TFL 48, a field based assessment, known as the Stream Crossing Quality Assessment (SCQA) was developed.
The SCQA method is a subjective type of assessment, yet it is systematic in its approach. There are no detailed quantitative measures that must be made (e.g. length and depth of erosion rills). The SCQA method was designed with the assumption that it is better to assess a much larger number of crossings in a qualitative way (i.e. a significant proportion of the crossings within a watershed), than it is to assess only a few crossings in a very detailed, quantitative way. A balance between effectiveness and efficiency has been developed when performing the SCQA field assessments. The SCQA method was designed to be conducted relatively quickly (10 to 15 minutes per crossing) so that a maximum number of crossings can be assessed within an area of interest.
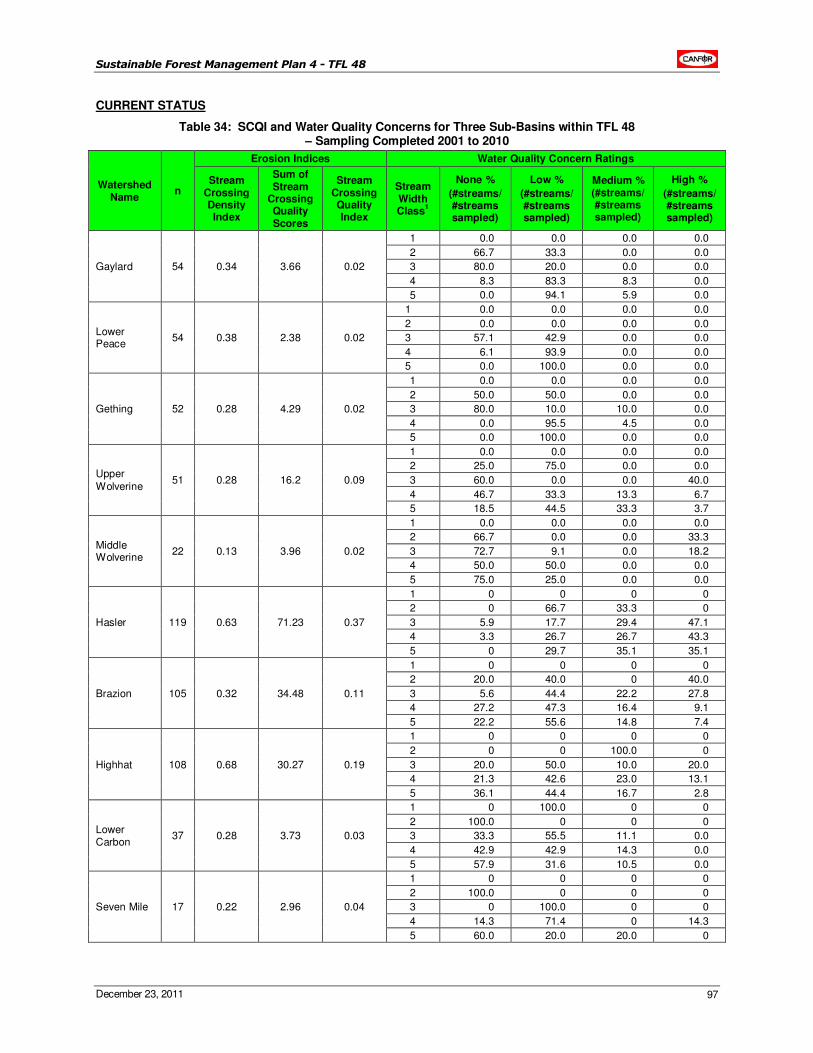
Sustainable Forest Management Plan 4 - TFL 48
December 23, 2011 97
CURRENT STATUS
Table 34: SCQI and Water Quality Concerns for Three Sub-Basins within TFL 48 – Sampling Completed 2001 to 2010
Watershed Name
n
Erosion Indices Water Quality Concern Ratings
Stream Crossing Density Index
Sum of Stream
Crossing Quality Scores
Stream Crossing Quality Index
Stream Width Class
1
None %
(#streams/ #streams sampled)
Low %
(#streams/ #streams sampled)
Medium % (#streams/ #streams sampled)
High %
(#streams/ #streams sampled)
Gaylard 54 0.34 3.66 0.02
1 0.0 0.0 0.0 0.0
2 66.7 33.3 0.0 0.0
3 80.0 20.0 0.0 0.0
4 8.3 83.3 8.3 0.0
5 0.0 94.1 5.9 0.0
Lower Peace
54 0.38 2.38 0.02
1 0.0 0.0 0.0 0.0
2 0.0 0.0 0.0 0.0
3 57.1 42.9 0.0 0.0
4 6.1 93.9 0.0 0.0
5 0.0 100.0 0.0 0.0
Gething 52 0.28 4.29 0.02
1 0.0 0.0 0.0 0.0
2 50.0 50.0 0.0 0.0
3 80.0 10.0 10.0 0.0
4 0.0 95.5 4.5 0.0
5 0.0 100.0 0.0 0.0
Upper Wolverine
51 0.28 16.2 0.09
1 0.0 0.0 0.0 0.0
2 25.0 75.0 0.0 0.0
3 60.0 0.0 0.0 40.0
4 46.7 33.3 13.3 6.7
5 18.5 44.5 33.3 3.7
Middle Wolverine
22 0.13 3.96 0.02
1 0.0 0.0 0.0 0.0
2 66.7 0.0 0.0 33.3
3 72.7 9.1 0.0 18.2
4 50.0 50.0 0.0 0.0
5 75.0 25.0 0.0 0.0
Hasler 119 0.63 71.23 0.37
1 0 0 0 0
2 0 66.7 33.3 0
3 5.9 17.7 29.4 47.1
4 3.3 26.7 26.7 43.3
5 0 29.7 35.1 35.1
Brazion 105 0.32 34.48 0.11
1 0 0 0 0
2 20.0 40.0 0 40.0
3 5.6 44.4 22.2 27.8
4 27.2 47.3 16.4 9.1
5 22.2 55.6 14.8 7.4
Highhat 108 0.68 30.27 0.19
1 0 0 0 0
2 0 0 100.0 0
3 20.0 50.0 10.0 20.0
4 21.3 42.6 23.0 13.1
5 36.1 44.4 16.7 2.8
Lower Carbon
37 0.28 3.73 0.03
1 0 100.0 0 0
2 100.0 0 0 0
3 33.3 55.5 11.1 0.0
4 42.9 42.9 14.3 0.0
5 57.9 31.6 10.5 0.0
Seven Mile 17 0.22 2.96 0.04
1 0 0 0 0
2 100.0 0 0 0
3 0 100.0 0 0
4 14.3 71.4 0 14.3
5 60.0 20.0 20.0 0
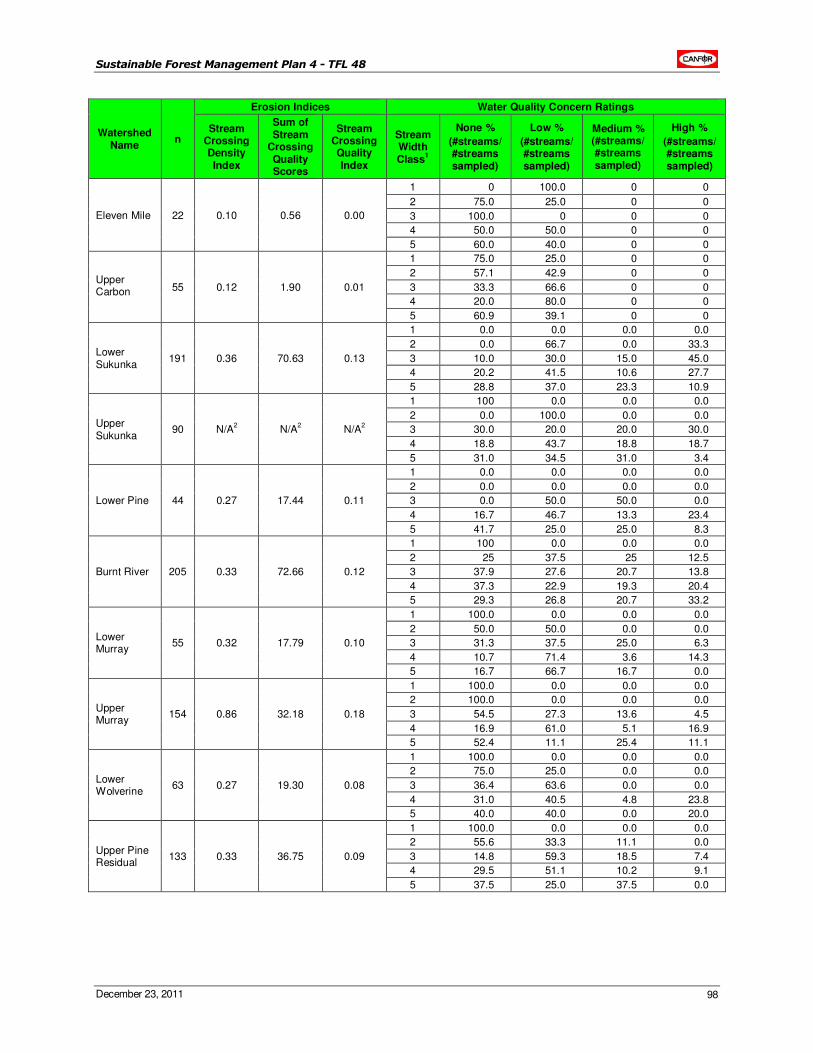
Sustainable Forest Management Plan 4 - TFL 48
December 23, 2011 98
Watershed Name
n
Erosion Indices Water Quality Concern Ratings
Stream Crossing Density Index
Sum of Stream
Crossing Quality Scores
Stream Crossing Quality Index
Stream Width Class
1
None %
(#streams/ #streams sampled)
Low %
(#streams/ #streams sampled)
Medium % (#streams/ #streams sampled)
High %
(#streams/ #streams sampled)
Eleven Mile 22 0.10 0.56 0.00
1 0 100.0 0 0
2 75.0 25.0 0 0
3 100.0 0 0 0
4 50.0 50.0 0 0
5 60.0 40.0 0 0
Upper Carbon 55 0.12 1.90 0.01
1 75.0 25.0 0 0
2 57.1 42.9 0 0
3 33.3 66.6 0 0
4 20.0 80.0 0 0
5 60.9 39.1 0 0
Lower Sukunka
191 0.36 70.63 0.13
1 0.0 0.0 0.0 0.0
2 0.0 66.7 0.0 33.3
3 10.0 30.0 15.0 45.0
4 20.2 41.5 10.6 27.7
5 28.8 37.0 23.3 10.9
Upper Sukunka
90 N/A2 N/A
2 N/A
2
1 100 0.0 0.0 0.0
2 0.0 100.0 0.0 0.0
3 30.0 20.0 20.0 30.0
4 18.8 43.7 18.8 18.7
5 31.0 34.5 31.0 3.4
Lower Pine 44 0.27 17.44 0.11
1 0.0 0.0 0.0 0.0
2 0.0 0.0 0.0 0.0
3 0.0 50.0 50.0 0.0
4 16.7 46.7 13.3 23.4
5 41.7 25.0 25.0 8.3
Burnt River 205 0.33 72.66 0.12
1 100 0.0 0.0 0.0
2 25 37.5 25 12.5
3 37.9 27.6 20.7 13.8
4 37.3 22.9 19.3 20.4
5 29.3 26.8 20.7 33.2
Lower Murray
55 0.32 17.79 0.10
1 100.0 0.0 0.0 0.0
2 50.0 50.0 0.0 0.0
3 31.3 37.5 25.0 6.3
4 10.7 71.4 3.6 14.3
5 16.7 66.7 16.7 0.0
Upper Murray
154 0.86 32.18 0.18
1 100.0 0.0 0.0 0.0
2 100.0 0.0 0.0 0.0
3 54.5 27.3 13.6 4.5
4 16.9 61.0 5.1 16.9
5 52.4 11.1 25.4 11.1
Lower Wolverine
63 0.27 19.30 0.08
1 100.0 0.0 0.0 0.0
2 75.0 25.0 0.0 0.0
3 36.4 63.6 0.0 0.0
4 31.0 40.5 4.8 23.8
5 40.0 40.0 0.0 20.0
Upper Pine Residual
133 0.33 36.75 0.09
1 100.0 0.0 0.0 0.0
2 55.6 33.3 11.1 0.0
3 14.8 59.3 18.5 7.4
4 29.5 51.1 10.2 9.1
5 37.5 25.0 37.5 0.0
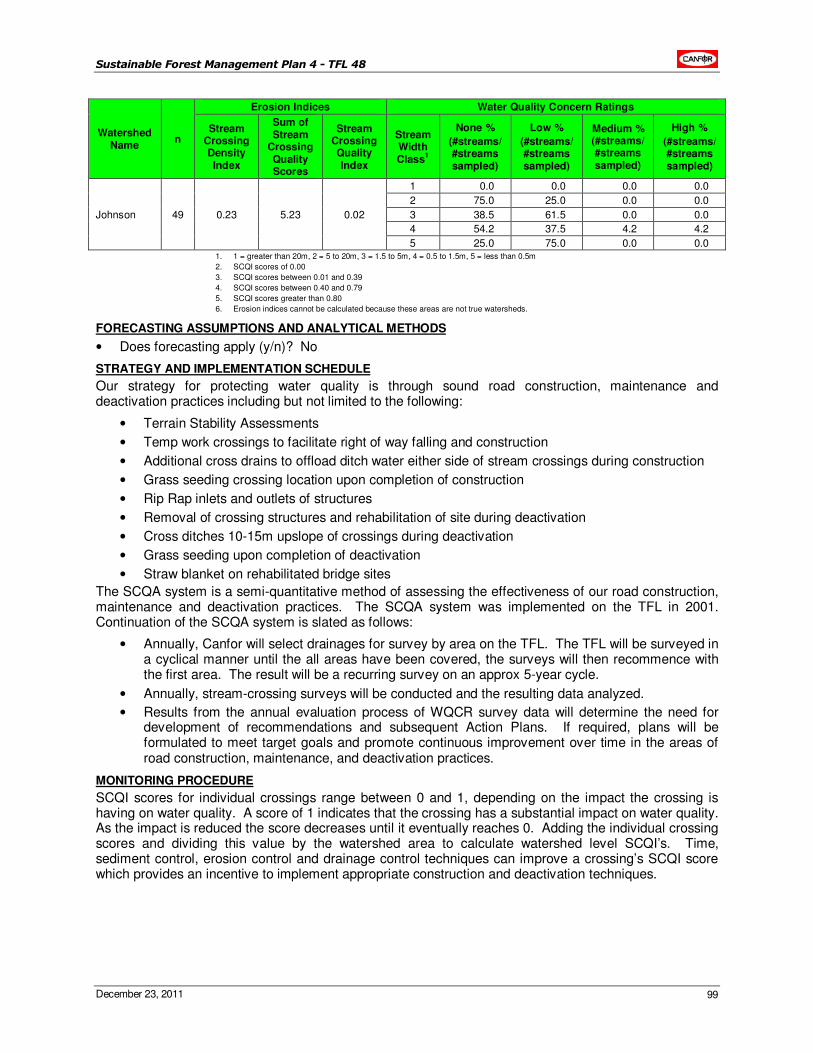
Sustainable Forest Management Plan 4 - TFL 48
December 23, 2011 99
Watershed Name
n
Erosion Indices Water Quality Concern Ratings
Stream Crossing Density Index
Sum of Stream
Crossing Quality Scores
Stream Crossing Quality Index
Stream Width Class
1
None %
(#streams/ #streams sampled)
Low %
(#streams/ #streams sampled)
Medium % (#streams/ #streams sampled)
High %
(#streams/ #streams sampled)
Johnson 49 0.23 5.23 0.02
1 0.0 0.0 0.0 0.0
2 75.0 25.0 0.0 0.0
3 38.5 61.5 0.0 0.0
4 54.2 37.5 4.2 4.2
5 25.0 75.0 0.0 0.0 1. 1 = greater than 20m, 2 = 5 to 20m, 3 = 1.5 to 5m, 4 = 0.5 to 1.5m, 5 = less than 0.5m
2. SCQI scores of 0.00
3. SCQI scores between 0.01 and 0.39
4. SCQI scores between 0.40 and 0.79
5. SCQI scores greater than 0.80
6. Erosion indices cannot be calculated because these areas are not true watersheds.
FORECASTING ASSUMPTIONS AND ANALYTICAL METHODS
• Does forecasting apply (y/n)? No
STRATEGY AND IMPLEMENTATION SCHEDULE
Our strategy for protecting water quality is through sound road construction, maintenance and deactivation practices including but not limited to the following:
• Terrain Stability Assessments
• Temp work crossings to facilitate right of way falling and construction
• Additional cross drains to offload ditch water either side of stream crossings during construction
• Grass seeding crossing location upon completion of construction
• Rip Rap inlets and outlets of structures
• Removal of crossing structures and rehabilitation of site during deactivation
• Cross ditches 10-15m upslope of crossings during deactivation
• Grass seeding upon completion of deactivation
• Straw blanket on rehabilitated bridge sites
The SCQA system is a semi-quantitative method of assessing the effectiveness of our road construction, maintenance and deactivation practices. The SCQA system was implemented on the TFL in 2001. Continuation of the SCQA system is slated as follows:
• Annually, Canfor will select drainages for survey by area on the TFL. The TFL will be surveyed in a cyclical manner until the all areas have been covered, the surveys will then recommence with the first area. The result will be a recurring survey on an approx 5-year cycle.
• Annually, stream-crossing surveys will be conducted and the resulting data analyzed.
• Results from the annual evaluation process of WQCR survey data will determine the need for development of recommendations and subsequent Action Plans. If required, plans will be formulated to meet target goals and promote continuous improvement over time in the areas of road construction, maintenance, and deactivation practices.
MONITORING PROCEDURE
SCQI scores for individual crossings range between 0 and 1, depending on the impact the crossing is having on water quality. A score of 1 indicates that the crossing has a substantial impact on water quality. As the impact is reduced the score decreases until it eventually reaches 0. Adding the individual crossing scores and dividing this value by the watershed area to calculate watershed level SCQI’s. Time, sediment control, erosion control and drainage control techniques can improve a crossing’s SCQI score which provides an incentive to implement appropriate construction and deactivation techniques.
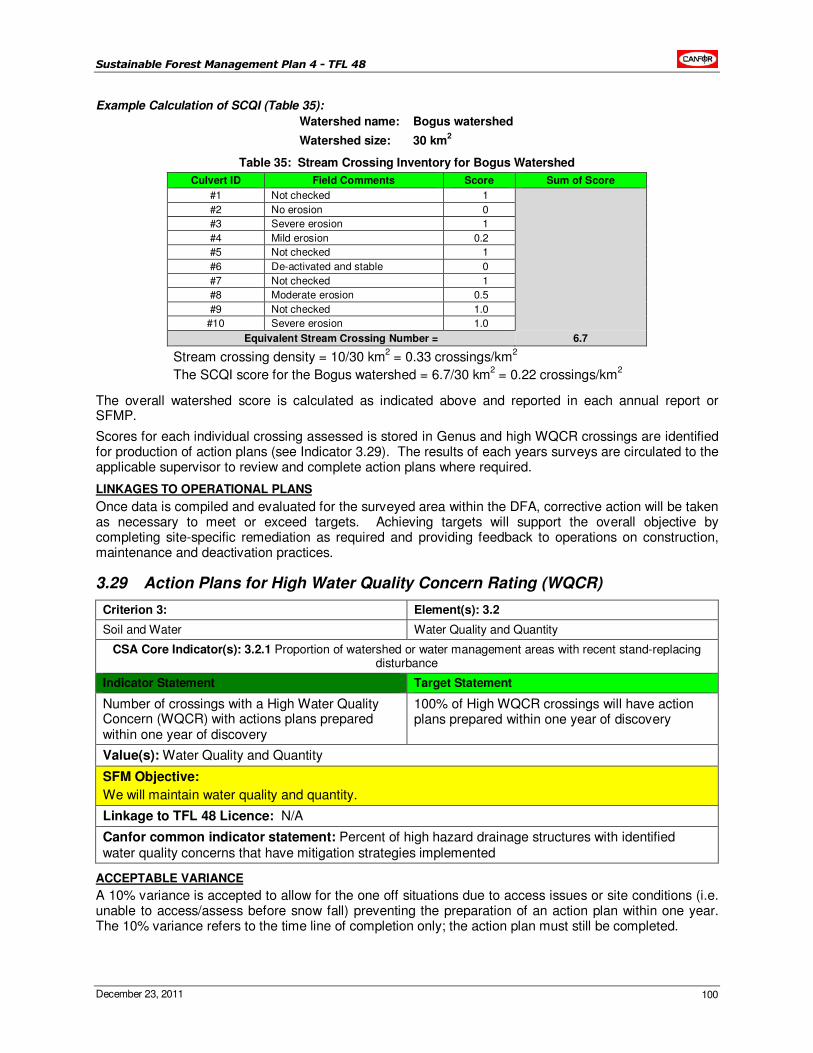
Sustainable Forest Management Plan 4 - TFL 48
December 23, 2011 100
Example Calculation of SCQI (Table 35):
Watershed name: Bogus watershed
Watershed size: 30 km2
Table 35: Stream Crossing Inventory for Bogus Watershed
Culvert ID Field Comments Score Sum of Score
#1 Not checked 1
#2 No erosion 0
#3 Severe erosion 1
#4 Mild erosion 0.2
#5 Not checked 1
#6 De-activated and stable 0
#7 Not checked 1
#8 Moderate erosion 0.5
#9 Not checked 1.0
#10 Severe erosion 1.0
Equivalent Stream Crossing Number = 6.7
Stream crossing density = 10/30 km2 = 0.33 crossings/km
2
The SCQI score for the Bogus watershed = 6.7/30 km2 = 0.22 crossings/km
2
The overall watershed score is calculated as indicated above and reported in each annual report or SFMP.
Scores for each individual crossing assessed is stored in Genus and high WQCR crossings are identified for production of action plans (see Indicator 3.29). The results of each years surveys are circulated to the applicable supervisor to review and complete action plans where required.
LINKAGES TO OPERATIONAL PLANS
Once data is compiled and evaluated for the surveyed area within the DFA, corrective action will be taken as necessary to meet or exceed targets. Achieving targets will support the overall objective by completing site-specific remediation as required and providing feedback to operations on construction, maintenance and deactivation practices.
3.29 Action Plans for High Water Quality Concern Rating (WQCR)
Criterion 3: Element(s): 3.2
Soil and Water Water Quality and Quantity
CSA Core Indicator(s): 3.2.1 Proportion of watershed or water management areas with recent stand-replacing disturbance
Indicator Statement Target Statement
Number of crossings with a High Water Quality Concern (WQCR) with actions plans prepared within one year of discovery
100% of High WQCR crossings will have action plans prepared within one year of discovery
Value(s): Water Quality and Quantity
SFM Objective:
We will maintain water quality and quantity.
Linkage to TFL 48 Licence: N/A
Canfor common indicator statement: Percent of high hazard drainage structures with identified water quality concerns that have mitigation strategies implemented
ACCEPTABLE VARIANCE
A 10% variance is accepted to allow for the one off situations due to access issues or site conditions (i.e. unable to access/assess before snow fall) preventing the preparation of an action plan within one year. The 10% variance refers to the time line of completion only; the action plan must still be completed.
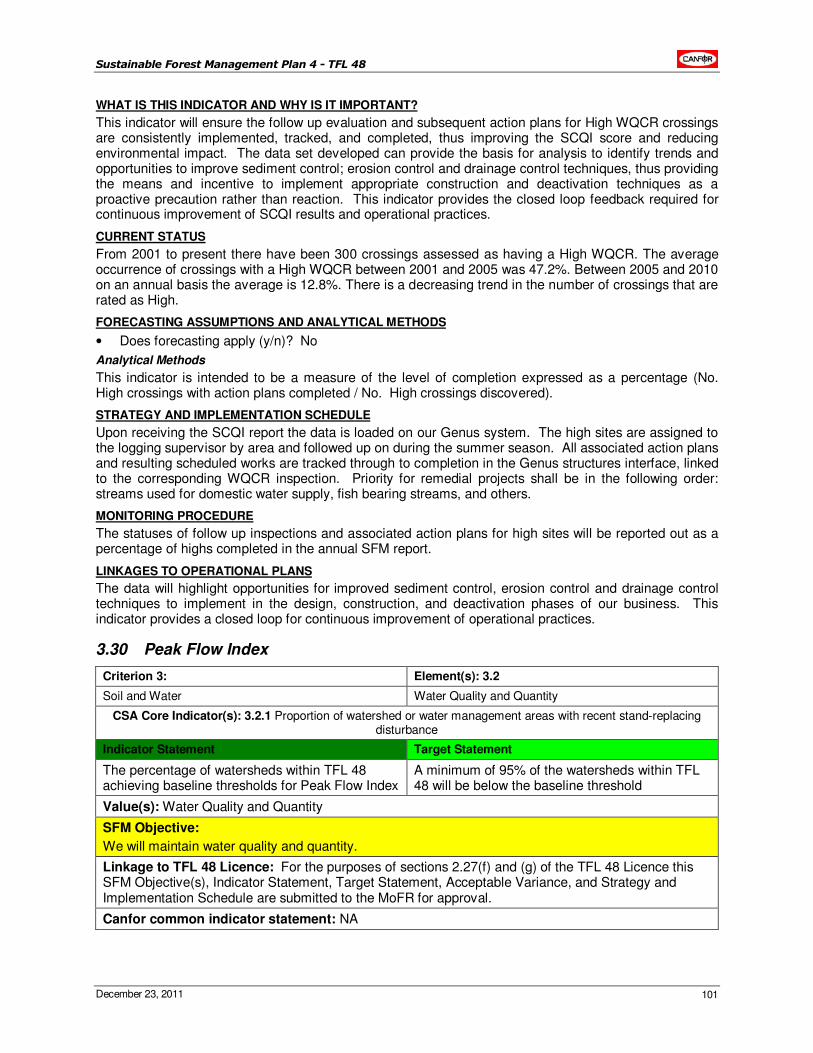
Sustainable Forest Management Plan 4 - TFL 48
December 23, 2011 101
WHAT IS THIS INDICATOR AND WHY IS IT IMPORTANT?
This indicator will ensure the follow up evaluation and subsequent action plans for High WQCR crossings are consistently implemented, tracked, and completed, thus improving the SCQI score and reducing environmental impact. The data set developed can provide the basis for analysis to identify trends and opportunities to improve sediment control; erosion control and drainage control techniques, thus providing the means and incentive to implement appropriate construction and deactivation techniques as a proactive precaution rather than reaction. This indicator provides the closed loop feedback required for continuous improvement of SCQI results and operational practices.
CURRENT STATUS
From 2001 to present there have been 300 crossings assessed as having a High WQCR. The average occurrence of crossings with a High WQCR between 2001 and 2005 was 47.2%. Between 2005 and 2010 on an annual basis the average is 12.8%. There is a decreasing trend in the number of crossings that are rated as High.
FORECASTING ASSUMPTIONS AND ANALYTICAL METHODS
• Does forecasting apply (y/n)? No
Analytical Methods
This indicator is intended to be a measure of the level of completion expressed as a percentage (No. High crossings with action plans completed / No. High crossings discovered).
STRATEGY AND IMPLEMENTATION SCHEDULE
Upon receiving the SCQI report the data is loaded on our Genus system. The high sites are assigned to the logging supervisor by area and followed up on during the summer season. All associated action plans and resulting scheduled works are tracked through to completion in the Genus structures interface, linked to the corresponding WQCR inspection. Priority for remedial projects shall be in the following order: streams used for domestic water supply, fish bearing streams, and others.
MONITORING PROCEDURE
The statuses of follow up inspections and associated action plans for high sites will be reported out as a percentage of highs completed in the annual SFM report.
LINKAGES TO OPERATIONAL PLANS
The data will highlight opportunities for improved sediment control, erosion control and drainage control techniques to implement in the design, construction, and deactivation phases of our business. This indicator provides a closed loop for continuous improvement of operational practices.
3.30 Peak Flow Index
Criterion 3: Element(s): 3.2
Soil and Water Water Quality and Quantity
CSA Core Indicator(s): 3.2.1 Proportion of watershed or water management areas with recent stand-replacing disturbance
Indicator Statement Target Statement
The percentage of watersheds within TFL 48 achieving baseline thresholds for Peak Flow Index
A minimum of 95% of the watersheds within TFL 48 will be below the baseline threshold
Value(s): Water Quality and Quantity
SFM Objective:
We will maintain water quality and quantity.
Linkage to TFL 48 Licence: For the purposes of sections 2.27(f) and (g) of the TFL 48 Licence this SFM Objective(s), Indicator Statement, Target Statement, Acceptable Variance, and Strategy and Implementation Schedule are submitted to the MoFR for approval.
Canfor common indicator statement: NA
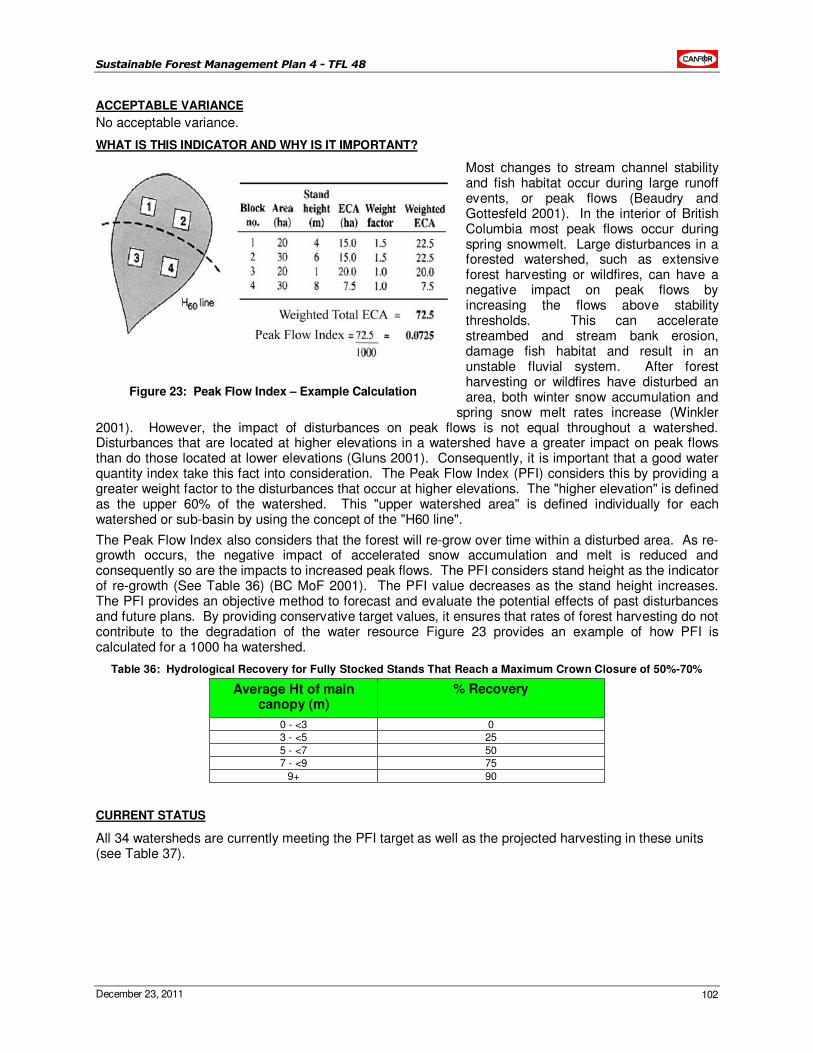
Sustainable Forest Management Plan 4 - TFL 48
December 23, 2011 102
ACCEPTABLE VARIANCE
No acceptable variance.
WHAT IS THIS INDICATOR AND WHY IS IT IMPORTANT?
Most changes to stream channel stability and fish habitat occur during large runoff events, or peak flows (Beaudry and Gottesfeld 2001). In the interior of British Columbia most peak flows occur during spring snowmelt. Large disturbances in a forested watershed, such as extensive forest harvesting or wildfires, can have a negative impact on peak flows by increasing the flows above stability thresholds. This can accelerate streambed and stream bank erosion, damage fish habitat and result in an unstable fluvial system. After forest harvesting or wildfires have disturbed an area, both winter snow accumulation and
spring snow melt rates increase (Winkler 2001). However, the impact of disturbances on peak flows is not equal throughout a watershed. Disturbances that are located at higher elevations in a watershed have a greater impact on peak flows than do those located at lower elevations (Gluns 2001). Consequently, it is important that a good water quantity index take this fact into consideration. The Peak Flow Index (PFI) considers this by providing a greater weight factor to the disturbances that occur at higher elevations. The "higher elevation" is defined as the upper 60% of the watershed. This "upper watershed area" is defined individually for each watershed or sub-basin by using the concept of the "H60 line".
The Peak Flow Index also considers that the forest will re-grow over time within a disturbed area. As re-growth occurs, the negative impact of accelerated snow accumulation and melt is reduced and consequently so are the impacts to increased peak flows. The PFI considers stand height as the indicator of re-growth (See Table 36) (BC MoF 2001). The PFI value decreases as the stand height increases. The PFI provides an objective method to forecast and evaluate the potential effects of past disturbances and future plans. By providing conservative target values, it ensures that rates of forest harvesting do not contribute to the degradation of the water resource Figure 23 provides an example of how PFI is calculated for a 1000 ha watershed.
Table 36: Hydrological Recovery for Fully Stocked Stands That Reach a Maximum Crown Closure of 50%-70%
Average Ht of main canopy (m)
% Recovery
0 - <3 0 3 - <5 25
5 - <7 50 7 - <9 75
9+ 90
CURRENT STATUS
All 34 watersheds are currently meeting the PFI target as well as the projected harvesting in these units (see Table 37).
Figure 23: Peak Flow Index – Example Calculation
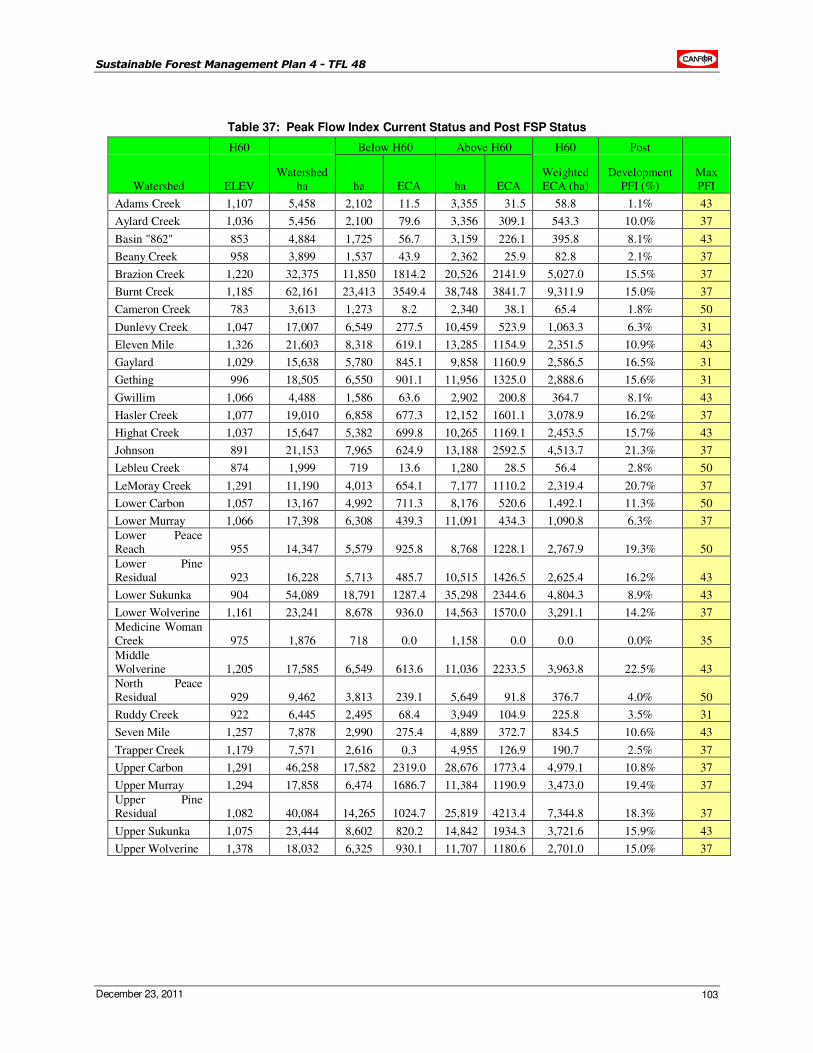
Sustainable Forest Management Plan 4 - TFL 48
December 23, 2011 103
Table 37: Peak Flow Index Current Status and Post FSP Status
H60 Below H60 Above H60 H60 Post
Watershed ELEV Watershed
ha ha ECA ha ECA Weighted ECA (ha)
Development PFI (%)
Max PFI
Adams Creek 1,107 5,458 2,102 11.5 3,355 31.5 58.8 1.1% 43
Aylard Creek 1,036 5,456 2,100 79.6 3,356 309.1 543.3 10.0% 37
Basin "862" 853 4,884 1,725 56.7 3,159 226.1 395.8 8.1% 43
Beany Creek 958 3,899 1,537 43.9 2,362 25.9 82.8 2.1% 37
Brazion Creek 1,220 32,375 11,850 1814.2 20,526 2141.9 5,027.0 15.5% 37
Burnt Creek 1,185 62,161 23,413 3549.4 38,748 3841.7 9,311.9 15.0% 37
Cameron Creek 783 3,613 1,273 8.2 2,340 38.1 65.4 1.8% 50
Dunlevy Creek 1,047 17,007 6,549 277.5 10,459 523.9 1,063.3 6.3% 31
Eleven Mile 1,326 21,603 8,318 619.1 13,285 1154.9 2,351.5 10.9% 43
Gaylard 1,029 15,638 5,780 845.1 9,858 1160.9 2,586.5 16.5% 31
Gething 996 18,505 6,550 901.1 11,956 1325.0 2,888.6 15.6% 31
Gwillim 1,066 4,488 1,586 63.6 2,902 200.8 364.7 8.1% 43
Hasler Creek 1,077 19,010 6,858 677.3 12,152 1601.1 3,078.9 16.2% 37
Highat Creek 1,037 15,647 5,382 699.8 10,265 1169.1 2,453.5 15.7% 43
Johnson 891 21,153 7,965 624.9 13,188 2592.5 4,513.7 21.3% 37
Lebleu Creek 874 1,999 719 13.6 1,280 28.5 56.4 2.8% 50
LeMoray Creek 1,291 11,190 4,013 654.1 7,177 1110.2 2,319.4 20.7% 37
Lower Carbon 1,057 13,167 4,992 711.3 8,176 520.6 1,492.1 11.3% 50
Lower Murray 1,066 17,398 6,308 439.3 11,091 434.3 1,090.8 6.3% 37
Lower Peace Reach 955 14,347 5,579 925.8 8,768 1228.1 2,767.9 19.3% 50
Lower Pine Residual 923 16,228 5,713 485.7 10,515 1426.5 2,625.4 16.2% 43
Lower Sukunka 904 54,089 18,791 1287.4 35,298 2344.6 4,804.3 8.9% 43
Lower Wolverine 1,161 23,241 8,678 936.0 14,563 1570.0 3,291.1 14.2% 37
Medicine Woman Creek 975 1,876 718 0.0 1,158 0.0 0.0 0.0% 35
Middle Wolverine 1,205 17,585 6,549 613.6 11,036 2233.5 3,963.8 22.5% 43
North Peace Residual 929 9,462 3,813 239.1 5,649 91.8 376.7 4.0% 50
Ruddy Creek 922 6,445 2,495 68.4 3,949 104.9 225.8 3.5% 31
Seven Mile 1,257 7,878 2,990 275.4 4,889 372.7 834.5 10.6% 43
Trapper Creek 1,179 7,571 2,616 0.3 4,955 126.9 190.7 2.5% 37
Upper Carbon 1,291 46,258 17,582 2319.0 28,676 1773.4 4,979.1 10.8% 37
Upper Murray 1,294 17,858 6,474 1686.7 11,384 1190.9 3,473.0 19.4% 37
Upper Pine Residual 1,082 40,084 14,265 1024.7 25,819 4213.4 7,344.8 18.3% 37
Upper Sukunka 1,075 23,444 8,602 820.2 14,842 1934.3 3,721.6 15.9% 43
Upper Wolverine 1,378 18,032 6,325 930.1 11,707 1180.6 2,701.0 15.0% 37
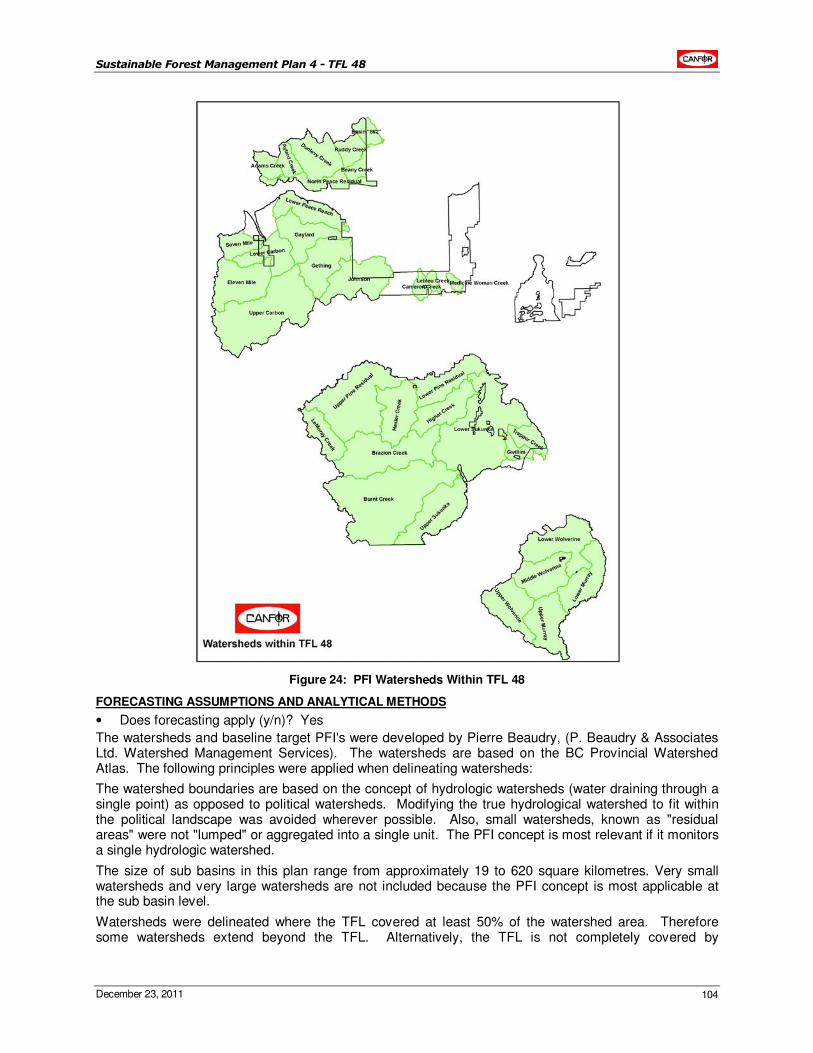
Sustainable Forest Management Plan 4 - TFL 48
December 23, 2011 104
Figure 24: PFI Watersheds Within TFL 48
FORECASTING ASSUMPTIONS AND ANALYTICAL METHODS
• Does forecasting apply (y/n)? Yes
The watersheds and baseline target PFI's were developed by Pierre Beaudry, (P. Beaudry & Associates Ltd. Watershed Management Services). The watersheds are based on the BC Provincial Watershed Atlas. The following principles were applied when delineating watersheds:
The watershed boundaries are based on the concept of hydrologic watersheds (water draining through a single point) as opposed to political watersheds. Modifying the true hydrological watershed to fit within the political landscape was avoided wherever possible. Also, small watersheds, known as "residual areas" were not "lumped" or aggregated into a single unit. The PFI concept is most relevant if it monitors a single hydrologic watershed.
The size of sub basins in this plan range from approximately 19 to 620 square kilometres. Very small watersheds and very large watersheds are not included because the PFI concept is most applicable at the sub basin level.
Watersheds were delineated where the TFL covered at least 50% of the watershed area. Therefore some watersheds extend beyond the TFL. Alternatively, the TFL is not completely covered by
Sustainable Forest Management Plan 4 - TFL 48
December 23, 2011 105
watersheds. Despite these physical limitations the majority of the planning area is covered by watersheds (90.3%).
Watersheds were named according to the local name of the water body, where applicable. A basin name was also added to provide a geographic reference.
Once all watersheds were delineated, a baseline target was determined for each of the watersheds. The setting of an absolute PFI target is very difficult and can lead to significant controversy. Although there is no single widely accepted threshold value, conservative targets are suggested. Although we don’t know what the physical and biological impacts from increased peak flows will be, we do know that there will be increased flows caused by the removal of a large percentage of the forest canopy. Consequently, a maximum target is set with the overall goal of maintaining the sustainability of the aquatic resource without being overly conservative. The targets must consider the type of watershed and type and stability of the fluvial system. The idea behind setting a baseline target is not to prevent changes in peak flows to occur, but to maintain flows within levels that will not unduly accelerated rates of streambed and stream bank erosion and degrade fish habitat. The suggested target PFI values are partly subjective and are based on a combination of professional opinion, scientific literature and 20 years of personal involvement in research projects investigating peak flows by Pierre Beaudry. Further details on the development of peak flow indices can be found in the report provided to Canfor by Pierre Beaudry, "Peak Flow Index (PFI) Targets for TFL 48 DFA Canadian Forest Products Ltd. Chetwynd Division, November, 2001”.
Long term forecasting was completed over the full 250 year planning horizon for this indicator. Due to complexities in modeling the direct PFI index because of difficulties in tracking the area above and below the H60 line and applying the constraints a simplified forecasting was done using Equivalent Clearcut Area (ECA) targets. ECA targets were developed by Pierre Beaudry as well as PFI targets. The ECA targets are set lower to reflect the lack of consideration for increased flows coming from above the H60 line within a watershed. All targets were met over the 250-year planning horizon.
STRATEGY AND IMPLEMENTATION SCHEDULE
As stated above, the PFI is intended to be a coarse filter so that if we are planning to exceed the baseline target we take a closer look at the specific watershed to ensure that water values are maintained. The indicator for Peak Flow Index is established to provide the number of watersheds with PFI’s that may exist above the baseline PFI at any point in time. The target was determined from a review of the number of watersheds currently above the baseline target and the number that are expected to be above the baseline target after the Forest Development Plans or Forest Stewardship Plans are implemented.
MONITORING PROCEDURE
The status of this indicator is reported during each Management Plan. Assessments are made at each FSP to ensure that the targets will be met.
Formula:
PFI% = (WSmet / WStot) * 100
Variables:
WSmet Number of watersheds where the peak flow index is below the maximum
WStot Total number of watersheds assessed.
PFI% Percentage of watersheds where the peak flow index is below the maximum threshold.
For details on the calculation of the PFI for each watershed see Figure 23: Peak Flow Index – Example Calculation.
LINKAGES TO OPERATIONAL PLANS
When new harvesting is proposed in a FSP an assessment is made to determine if the new activity is consistent with the targets for PFI.
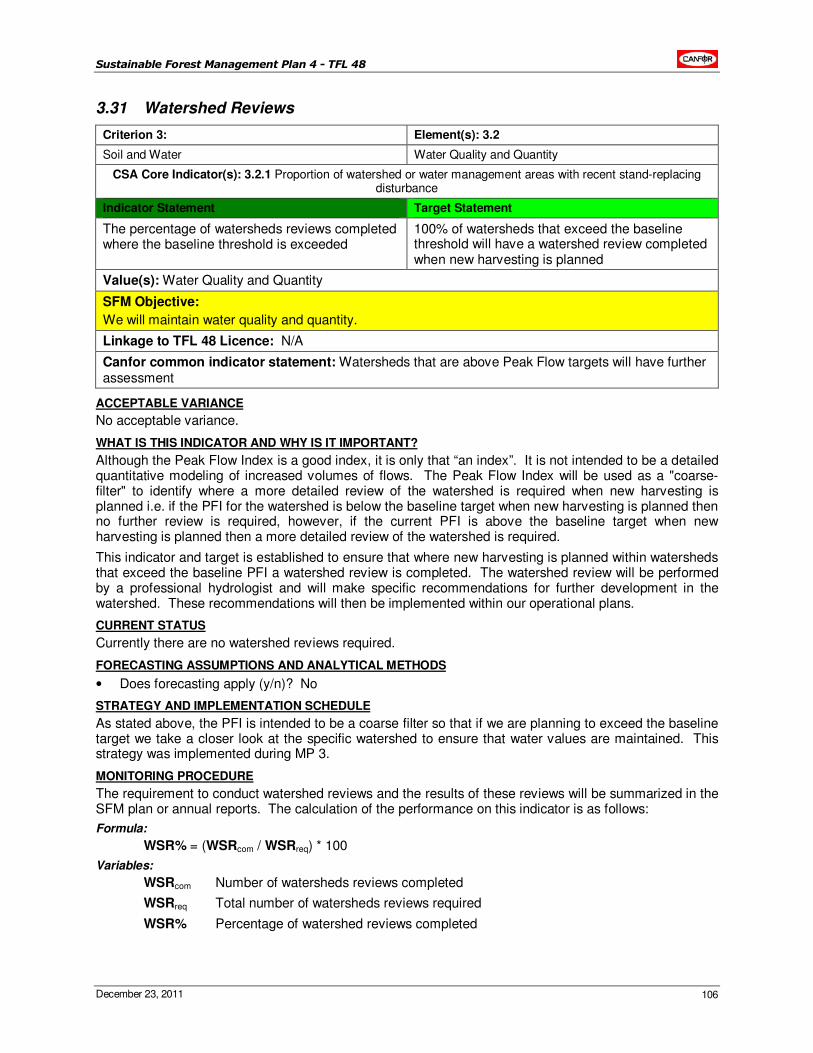
Sustainable Forest Management Plan 4 - TFL 48
December 23, 2011 106
3.31 Watershed Reviews
Criterion 3: Element(s): 3.2
Soil and Water Water Quality and Quantity
CSA Core Indicator(s): 3.2.1 Proportion of watershed or water management areas with recent stand-replacing disturbance
Indicator Statement Target Statement
The percentage of watersheds reviews completed where the baseline threshold is exceeded
100% of watersheds that exceed the baseline threshold will have a watershed review completed when new harvesting is planned
Value(s): Water Quality and Quantity
SFM Objective:
We will maintain water quality and quantity.
Linkage to TFL 48 Licence: N/A
Canfor common indicator statement: Watersheds that are above Peak Flow targets will have further assessment
ACCEPTABLE VARIANCE
No acceptable variance.
WHAT IS THIS INDICATOR AND WHY IS IT IMPORTANT?
Although the Peak Flow Index is a good index, it is only that “an index”. It is not intended to be a detailed quantitative modeling of increased volumes of flows. The Peak Flow Index will be used as a "coarse-filter" to identify where a more detailed review of the watershed is required when new harvesting is planned i.e. if the PFI for the watershed is below the baseline target when new harvesting is planned then no further review is required, however, if the current PFI is above the baseline target when new harvesting is planned then a more detailed review of the watershed is required.
This indicator and target is established to ensure that where new harvesting is planned within watersheds that exceed the baseline PFI a watershed review is completed. The watershed review will be performed by a professional hydrologist and will make specific recommendations for further development in the watershed. These recommendations will then be implemented within our operational plans.
CURRENT STATUS
Currently there are no watershed reviews required.
FORECASTING ASSUMPTIONS AND ANALYTICAL METHODS
• Does forecasting apply (y/n)? No
STRATEGY AND IMPLEMENTATION SCHEDULE
As stated above, the PFI is intended to be a coarse filter so that if we are planning to exceed the baseline target we take a closer look at the specific watershed to ensure that water values are maintained. This strategy was implemented during MP 3.
MONITORING PROCEDURE
The requirement to conduct watershed reviews and the results of these reviews will be summarized in the SFM plan or annual reports. The calculation of the performance on this indicator is as follows:
Formula:
WSR% = (WSRcom / WSRreq) * 100
Variables:
WSRcom Number of watersheds reviews completed
WSRreq Total number of watersheds reviews required
WSR% Percentage of watershed reviews completed
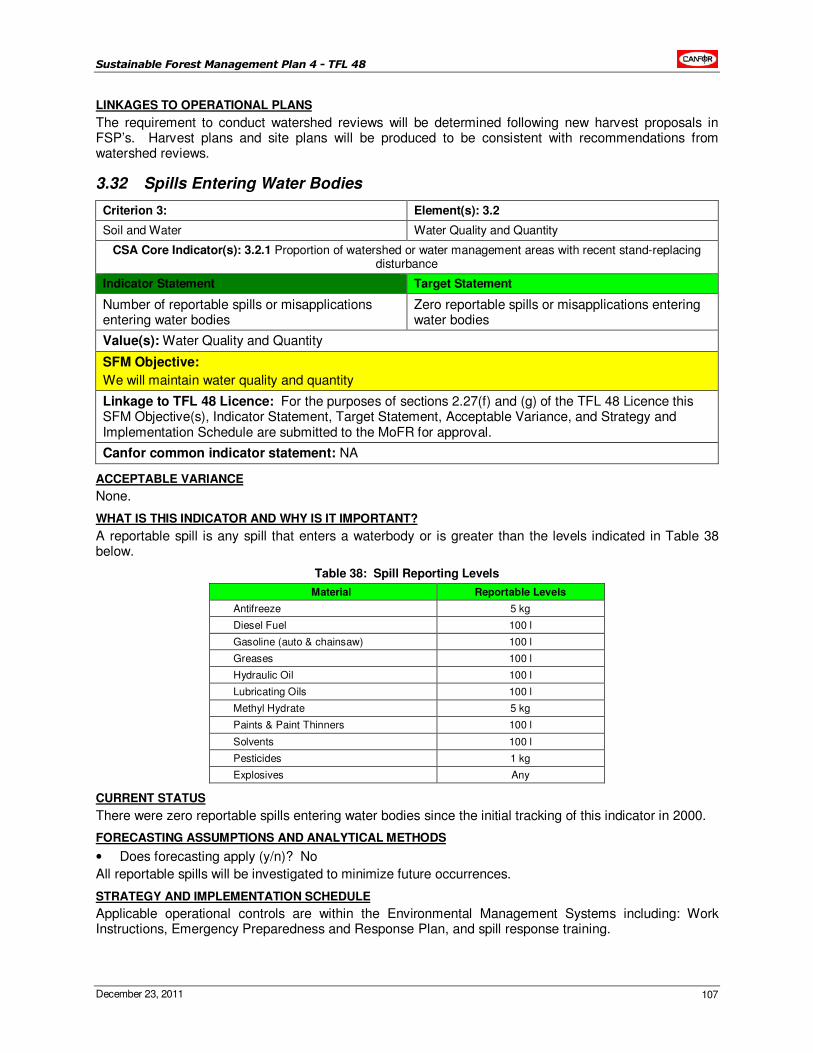
Sustainable Forest Management Plan 4 - TFL 48
December 23, 2011 107
LINKAGES TO OPERATIONAL PLANS
The requirement to conduct watershed reviews will be determined following new harvest proposals in FSP’s. Harvest plans and site plans will be produced to be consistent with recommendations from watershed reviews.
3.32 Spills Entering Water Bodies
Criterion 3: Element(s): 3.2
Soil and Water Water Quality and Quantity
CSA Core Indicator(s): 3.2.1 Proportion of watershed or water management areas with recent stand-replacing disturbance
Indicator Statement Target Statement
Number of reportable spills or misapplications entering water bodies
Zero reportable spills or misapplications entering water bodies
Value(s): Water Quality and Quantity
SFM Objective:
We will maintain water quality and quantity
Linkage to TFL 48 Licence: For the purposes of sections 2.27(f) and (g) of the TFL 48 Licence this SFM Objective(s), Indicator Statement, Target Statement, Acceptable Variance, and Strategy and Implementation Schedule are submitted to the MoFR for approval.
Canfor common indicator statement: NA
ACCEPTABLE VARIANCE
None.
WHAT IS THIS INDICATOR AND WHY IS IT IMPORTANT?
A reportable spill is any spill that enters a waterbody or is greater than the levels indicated in Table 38 below.
Table 38: Spill Reporting Levels
Material Reportable Levels
Antifreeze 5 kg
Diesel Fuel 100 l
Gasoline (auto & chainsaw) 100 l
Greases 100 l
Hydraulic Oil 100 l
Lubricating Oils 100 l
Methyl Hydrate 5 kg
Paints & Paint Thinners 100 l
Solvents 100 l
Pesticides 1 kg
Explosives Any
CURRENT STATUS
There were zero reportable spills entering water bodies since the initial tracking of this indicator in 2000.
FORECASTING ASSUMPTIONS AND ANALYTICAL METHODS
• Does forecasting apply (y/n)? No
All reportable spills will be investigated to minimize future occurrences.
STRATEGY AND IMPLEMENTATION SCHEDULE
Applicable operational controls are within the Environmental Management Systems including: Work Instructions, Emergency Preparedness and Response Plan, and spill response training.
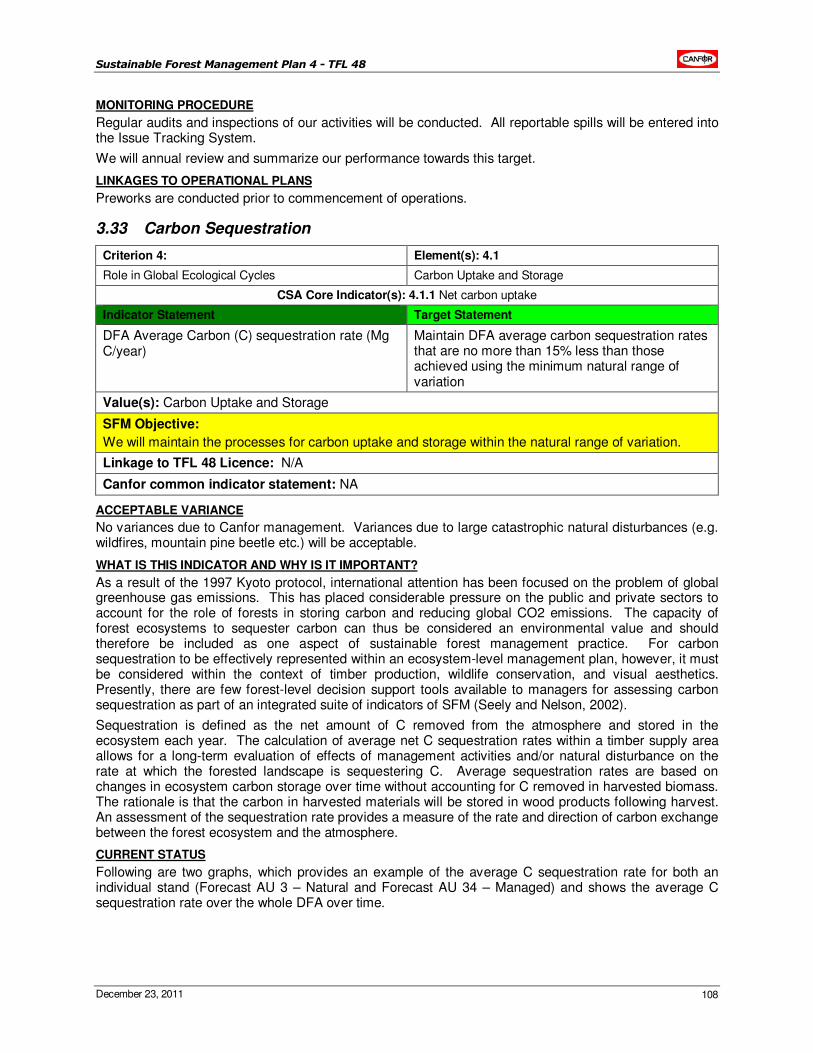
Sustainable Forest Management Plan 4 - TFL 48
December 23, 2011 108
MONITORING PROCEDURE
Regular audits and inspections of our activities will be conducted. All reportable spills will be entered into the Issue Tracking System.
We will annual review and summarize our performance towards this target.
LINKAGES TO OPERATIONAL PLANS
Preworks are conducted prior to commencement of operations.
3.33 Carbon Sequestration
Criterion 4: Element(s): 4.1
Role in Global Ecological Cycles Carbon Uptake and Storage
CSA Core Indicator(s): 4.1.1 Net carbon uptake
Indicator Statement Target Statement
DFA Average Carbon (C) sequestration rate (Mg C/year)
Maintain DFA average carbon sequestration rates that are no more than 15% less than those achieved using the minimum natural range of variation
Value(s): Carbon Uptake and Storage
SFM Objective:
We will maintain the processes for carbon uptake and storage within the natural range of variation.
Linkage to TFL 48 Licence: N/A
Canfor common indicator statement: NA
ACCEPTABLE VARIANCE
No variances due to Canfor management. Variances due to large catastrophic natural disturbances (e.g. wildfires, mountain pine beetle etc.) will be acceptable.
WHAT IS THIS INDICATOR AND WHY IS IT IMPORTANT?
As a result of the 1997 Kyoto protocol, international attention has been focused on the problem of global greenhouse gas emissions. This has placed considerable pressure on the public and private sectors to account for the role of forests in storing carbon and reducing global CO2 emissions. The capacity of forest ecosystems to sequester carbon can thus be considered an environmental value and should therefore be included as one aspect of sustainable forest management practice. For carbon sequestration to be effectively represented within an ecosystem-level management plan, however, it must be considered within the context of timber production, wildlife conservation, and visual aesthetics. Presently, there are few forest-level decision support tools available to managers for assessing carbon sequestration as part of an integrated suite of indicators of SFM (Seely and Nelson, 2002).
Sequestration is defined as the net amount of C removed from the atmosphere and stored in the ecosystem each year. The calculation of average net C sequestration rates within a timber supply area allows for a long-term evaluation of effects of management activities and/or natural disturbance on the rate at which the forested landscape is sequestering C. Average sequestration rates are based on changes in ecosystem carbon storage over time without accounting for C removed in harvested biomass. The rationale is that the carbon in harvested materials will be stored in wood products following harvest. An assessment of the sequestration rate provides a measure of the rate and direction of carbon exchange between the forest ecosystem and the atmosphere.
CURRENT STATUS
Following are two graphs, which provides an example of the average C sequestration rate for both an individual stand (Forecast AU 3 – Natural and Forecast AU 34 – Managed) and shows the average C sequestration rate over the whole DFA over time.
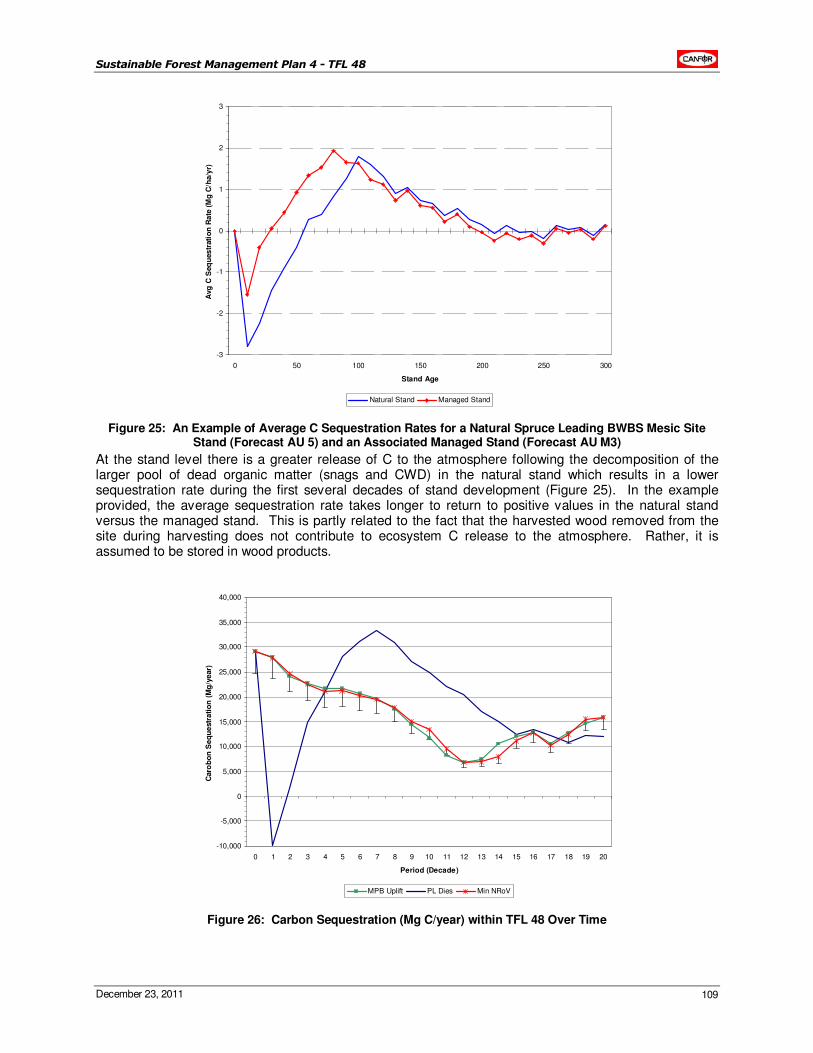
Sustainable Forest Management Plan 4 - TFL 48
December 23, 2011 109
-3
-2
-1
0
1
2
3
0 50 100 150 200 250 300
Stand Age
Avg
C S
eq
ues
trati
on
Ra
te (
Mg
C/h
a/y
r)
Natural Stand Managed Stand
Figure 25: An Example of Average C Sequestration Rates for a Natural Spruce Leading BWBS Mesic Site Stand (Forecast AU 5) and an Associated Managed Stand (Forecast AU M3)
At the stand level there is a greater release of C to the atmosphere following the decomposition of the larger pool of dead organic matter (snags and CWD) in the natural stand which results in a lower sequestration rate during the first several decades of stand development (Figure 25). In the example provided, the average sequestration rate takes longer to return to positive values in the natural stand versus the managed stand. This is partly related to the fact that the harvested wood removed from the site during harvesting does not contribute to ecosystem C release to the atmosphere. Rather, it is assumed to be stored in wood products.
-10,000
-5,000
0
5,000
10,000
15,000
20,000
25,000
30,000
35,000
40,000
0 1 2 3 4 5 6 7 8 9 10 11 12 13 14 15 16 17 18 19 20
Period (Decade)
Caro
bo
n S
eq
ue
str
ati
on
(M
g/y
ear)
MPB Uplift PL Dies Min NRoV
Figure 26: Carbon Sequestration (Mg C/year) within TFL 48 Over Time
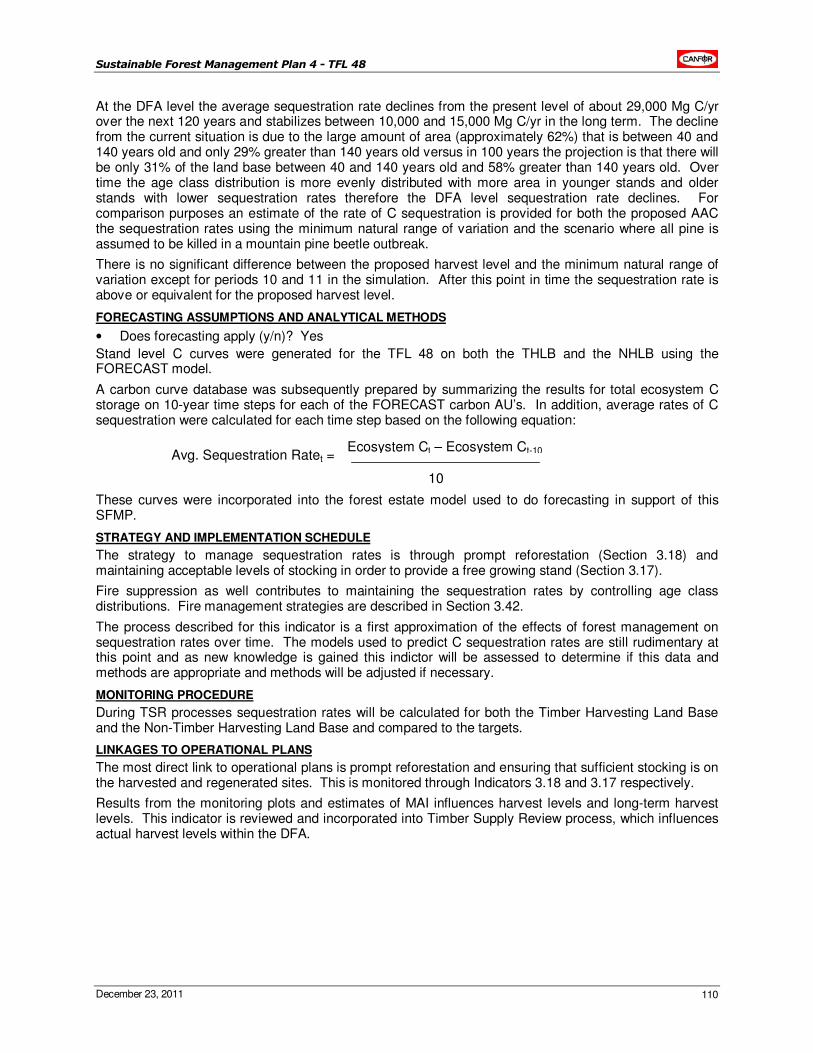
Sustainable Forest Management Plan 4 - TFL 48
December 23, 2011 110
At the DFA level the average sequestration rate declines from the present level of about 29,000 Mg C/yr over the next 120 years and stabilizes between 10,000 and 15,000 Mg C/yr in the long term. The decline from the current situation is due to the large amount of area (approximately 62%) that is between 40 and 140 years old and only 29% greater than 140 years old versus in 100 years the projection is that there will be only 31% of the land base between 40 and 140 years old and 58% greater than 140 years old. Over time the age class distribution is more evenly distributed with more area in younger stands and older stands with lower sequestration rates therefore the DFA level sequestration rate declines. For comparison purposes an estimate of the rate of C sequestration is provided for both the proposed AAC the sequestration rates using the minimum natural range of variation and the scenario where all pine is assumed to be killed in a mountain pine beetle outbreak.
There is no significant difference between the proposed harvest level and the minimum natural range of variation except for periods 10 and 11 in the simulation. After this point in time the sequestration rate is above or equivalent for the proposed harvest level.
FORECASTING ASSUMPTIONS AND ANALYTICAL METHODS
• Does forecasting apply (y/n)? Yes
Stand level C curves were generated for the TFL 48 on both the THLB and the NHLB using the FORECAST model.
A carbon curve database was subsequently prepared by summarizing the results for total ecosystem C storage on 10-year time steps for each of the FORECAST carbon AU’s. In addition, average rates of C sequestration were calculated for each time step based on the following equation:
Ecosystem Ct – Ecosystem Ct-10
10
Avg. Sequestration Ratet =
These curves were incorporated into the forest estate model used to do forecasting in support of this SFMP.
STRATEGY AND IMPLEMENTATION SCHEDULE
The strategy to manage sequestration rates is through prompt reforestation (Section 3.18) and maintaining acceptable levels of stocking in order to provide a free growing stand (Section 3.17).
Fire suppression as well contributes to maintaining the sequestration rates by controlling age class distributions. Fire management strategies are described in Section 3.42.
The process described for this indicator is a first approximation of the effects of forest management on sequestration rates over time. The models used to predict C sequestration rates are still rudimentary at this point and as new knowledge is gained this indictor will be assessed to determine if this data and methods are appropriate and methods will be adjusted if necessary.
MONITORING PROCEDURE
During TSR processes sequestration rates will be calculated for both the Timber Harvesting Land Base and the Non-Timber Harvesting Land Base and compared to the targets.
LINKAGES TO OPERATIONAL PLANS
The most direct link to operational plans is prompt reforestation and ensuring that sufficient stocking is on the harvested and regenerated sites. This is monitored through Indicators 3.18 and 3.17 respectively.
Results from the monitoring plots and estimates of MAI influences harvest levels and long-term harvest levels. This indicator is reviewed and incorporated into Timber Supply Review process, which influences actual harvest levels within the DFA.
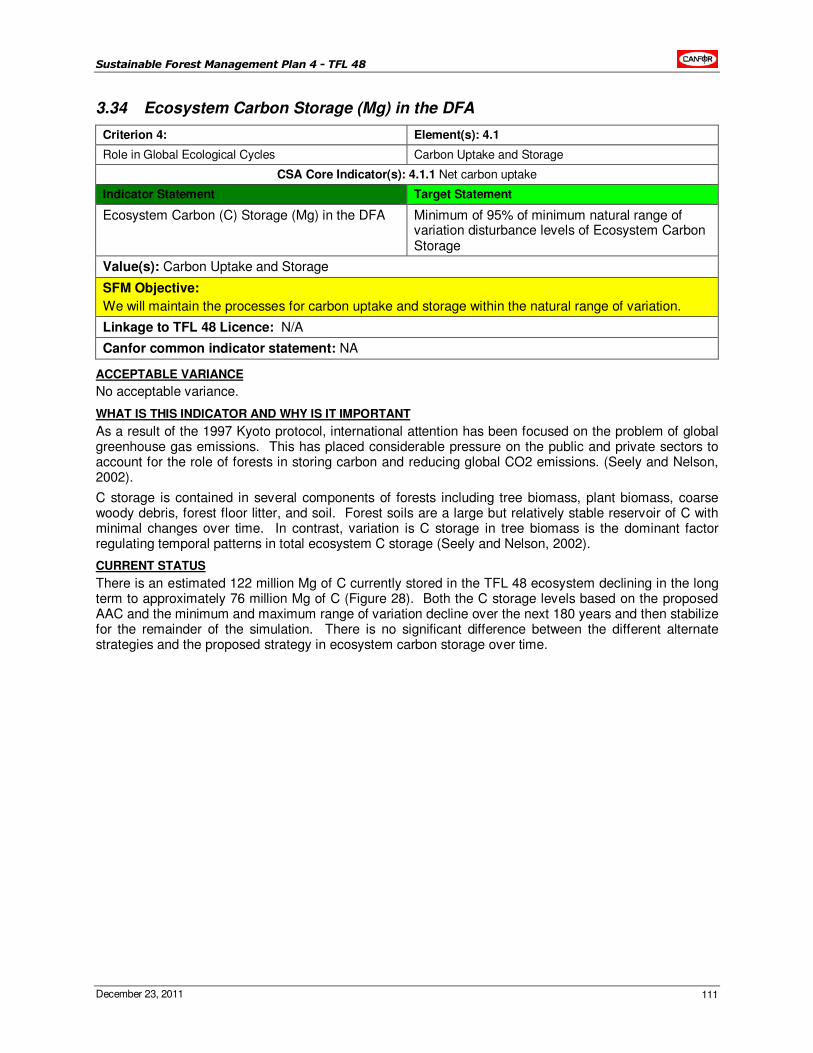
Sustainable Forest Management Plan 4 - TFL 48
December 23, 2011 111
3.34 Ecosystem Carbon Storage (Mg) in the DFA
Criterion 4: Element(s): 4.1
Role in Global Ecological Cycles Carbon Uptake and Storage
CSA Core Indicator(s): 4.1.1 Net carbon uptake
Indicator Statement Target Statement
Ecosystem Carbon (C) Storage (Mg) in the DFA Minimum of 95% of minimum natural range of variation disturbance levels of Ecosystem Carbon Storage
Value(s): Carbon Uptake and Storage
SFM Objective:
We will maintain the processes for carbon uptake and storage within the natural range of variation.
Linkage to TFL 48 Licence: N/A
Canfor common indicator statement: NA
ACCEPTABLE VARIANCE
No acceptable variance.
WHAT IS THIS INDICATOR AND WHY IS IT IMPORTANT
As a result of the 1997 Kyoto protocol, international attention has been focused on the problem of global greenhouse gas emissions. This has placed considerable pressure on the public and private sectors to account for the role of forests in storing carbon and reducing global CO2 emissions. (Seely and Nelson, 2002).
C storage is contained in several components of forests including tree biomass, plant biomass, coarse woody debris, forest floor litter, and soil. Forest soils are a large but relatively stable reservoir of C with minimal changes over time. In contrast, variation is C storage in tree biomass is the dominant factor regulating temporal patterns in total ecosystem C storage (Seely and Nelson, 2002).
CURRENT STATUS
There is an estimated 122 million Mg of C currently stored in the TFL 48 ecosystem declining in the long term to approximately 76 million Mg of C (Figure 28). Both the C storage levels based on the proposed AAC and the minimum and maximum range of variation decline over the next 180 years and then stabilize for the remainder of the simulation. There is no significant difference between the different alternate strategies and the proposed strategy in ecosystem carbon storage over time.
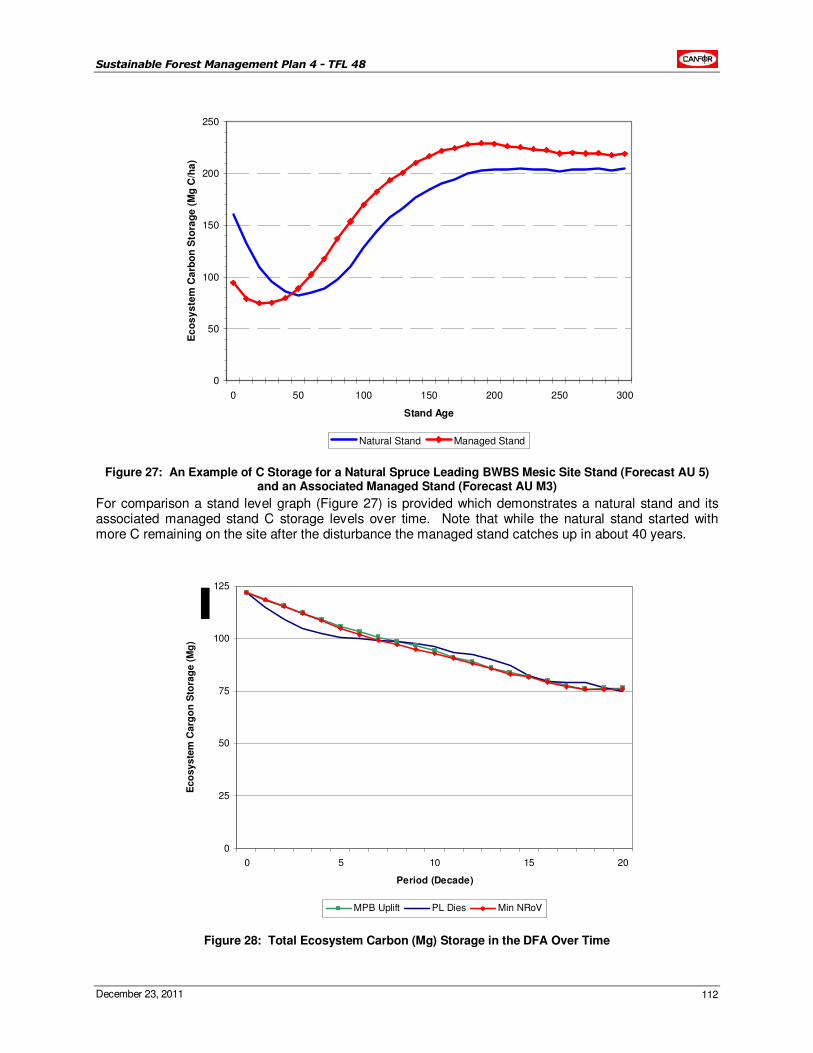
Sustainable Forest Management Plan 4 - TFL 48
December 23, 2011 112
0
50
100
150
200
250
0 50 100 150 200 250 300
Stand Age
Ec
os
ys
tem
Ca
rbo
n S
tora
ge
(M
g C
/ha
)
Natural Stand Managed Stand
Figure 27: An Example of C Storage for a Natural Spruce Leading BWBS Mesic Site Stand (Forecast AU 5) and an Associated Managed Stand (Forecast AU M3)
For comparison a stand level graph (Figure 27) is provided which demonstrates a natural stand and its associated managed stand C storage levels over time. Note that while the natural stand started with more C remaining on the site after the disturbance the managed stand catches up in about 40 years.
0
25
50
75
100
125
0 5 10 15 20
Period (Decade)
Ec
os
ys
tem
Ca
rgo
n S
tora
ge
(M
g)
MPB Uplift PL Dies Min NRoV
Figure 28: Total Ecosystem Carbon (Mg) Storage in the DFA Over Time
Sustainable Forest Management Plan 4 - TFL 48
December 23, 2011 113
FORECASTING ASSUMPTIONS AND ANALYTICAL METHODS
• Does forecasting apply (y/n)? Yes
See Indicator 3.33 for details on how the C indicators were forecasted and analyzed. The exception being for Indicator 3.34 that total ecosystem C storage is tracked rather than sequestration rates.
STRATEGY AND IMPLEMENTATION SCHEDULE
The strategy to manage C storage is through prompt reforestation (Section 3.18) and maintaining acceptable levels of stocking over the landscape on previously harvested and regenerated sites (Section 3.17).
Fire suppression as well contributes to maintaining C storage by controlling age class distributions and minimizing C release into the atmosphere through wildfires. Fire management strategies are described in Section 3.42.
The process described for this indicator is a first approximation of the effects of forest management on C storage in comparison to a natural disturbance regime. The models and inventory used to predict C storage are still rudimentary at this point and as new knowledge is gained this indictor will be assessed to determine if this data and methods are appropriate and methods will be adjusted if necessary.
MONITORING PROCEDURE
During TSR processes C storage will be calculated for both the Timber Harvesting Land Base and the Non-Timber Harvesting Land Base and compared to the targets.
LINKAGES TO OPERATIONAL PLANS
Forestry activities influence total C storage through fire prevention policies, prompt reforestation, and harvest levels, which are, monitored through Indicators 3.42, 3.18,and 3.21.
3.35 Range Opportunities
Criterion 5: Element(s): 5.1, 6.3
Economic and Social Benefits Timber and Non-Timber Benefits; Forest Community Well-Being and Resilience
CSA Core Indicator(s): 5.1.1 Quantity and quality of timber and non-timber benefits, products, and services produced in the DFA
6.3.1 Evidence that the organization has co-operated with other forest-dependant businesses, forest users, and the local community to strengthen and diversify the local economy
Indicator Statement Target Statement
Annual minimum number of Animal Unit Months opportunity
We will maintain an annual minimum of 1500 Animal Unit Months (excludes brush control by sheep grazing)
Value(s): Timber and Non-Timber Multi-use Benefits, Strengthening and Diversifying Community Businesses and Business Opportunities
SFM Objective:
We will provide opportunities for a feasible mix of timber, recreational activities, visual quality, and non-timber commercial activities.
We will provide opportunities for local economic development.
Linkage to TFL 48 Licence: For the purposes of sections 2.27(f) and (g) of the TFL 48 Licence this SFM Objective(s), Indicator Statement, Target Statement, Acceptable Variance, and Strategy and Implementation Schedule are submitted to the MoFR for approval.
Canfor common indicator statement: NA
ACCEPTABLE VARIANCE
None.
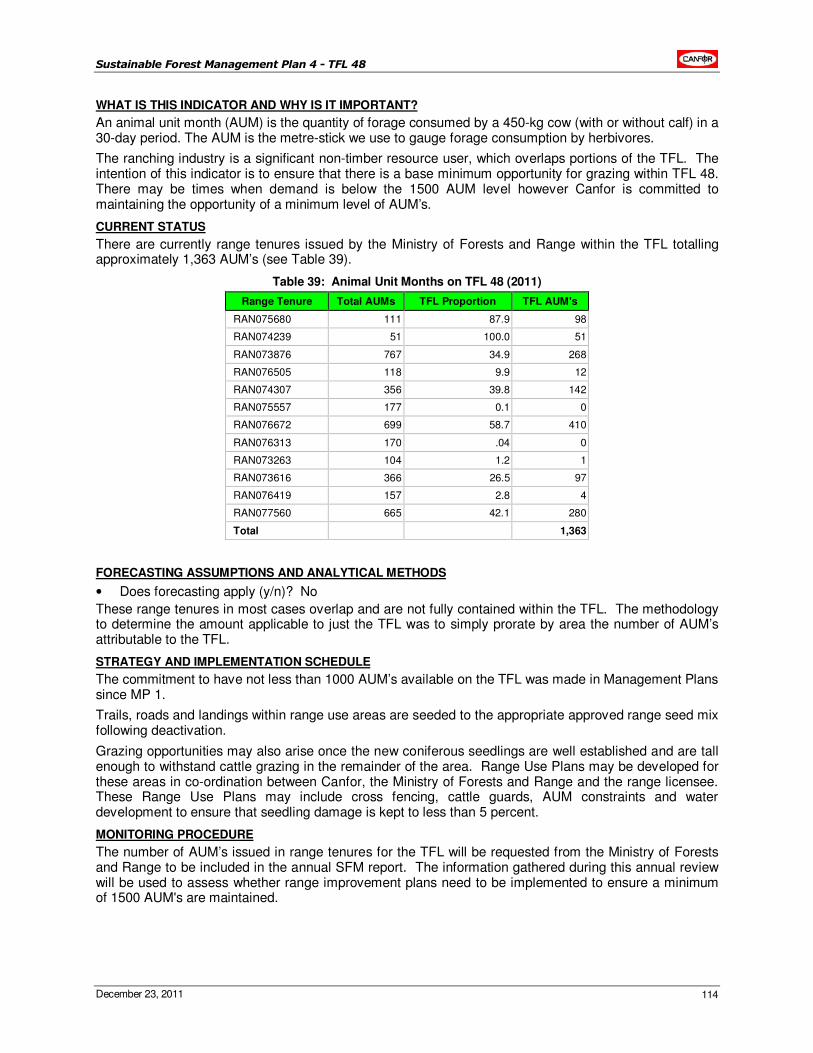
Sustainable Forest Management Plan 4 - TFL 48
December 23, 2011 114
WHAT IS THIS INDICATOR AND WHY IS IT IMPORTANT?
An animal unit month (AUM) is the quantity of forage consumed by a 450-kg cow (with or without calf) in a 30-day period. The AUM is the metre-stick we use to gauge forage consumption by herbivores.
The ranching industry is a significant non-timber resource user, which overlaps portions of the TFL. The intention of this indicator is to ensure that there is a base minimum opportunity for grazing within TFL 48. There may be times when demand is below the 1500 AUM level however Canfor is committed to maintaining the opportunity of a minimum level of AUM’s.
CURRENT STATUS
There are currently range tenures issued by the Ministry of Forests and Range within the TFL totalling approximately 1,363 AUM’s (see Table 39).
Table 39: Animal Unit Months on TFL 48 (2011)
Range Tenure Total AUMs TFL Proportion TFL AUM's
RAN075680 111 87.9 98
RAN074239 51 100.0 51
RAN073876 767 34.9 268
RAN076505 118 9.9 12
RAN074307 356 39.8 142
RAN075557 177 0.1 0
RAN076672 699 58.7 410
RAN076313 170 .04 0
RAN073263 104 1.2 1
RAN073616 366 26.5 97
RAN076419 157 2.8 4
RAN077560 665 42.1 280
Total 1,363
FORECASTING ASSUMPTIONS AND ANALYTICAL METHODS
• Does forecasting apply (y/n)? No
These range tenures in most cases overlap and are not fully contained within the TFL. The methodology to determine the amount applicable to just the TFL was to simply prorate by area the number of AUM’s attributable to the TFL.
STRATEGY AND IMPLEMENTATION SCHEDULE
The commitment to have not less than 1000 AUM’s available on the TFL was made in Management Plans since MP 1.
Trails, roads and landings within range use areas are seeded to the appropriate approved range seed mix following deactivation.
Grazing opportunities may also arise once the new coniferous seedlings are well established and are tall enough to withstand cattle grazing in the remainder of the area. Range Use Plans may be developed for these areas in co-ordination between Canfor, the Ministry of Forests and Range and the range licensee. These Range Use Plans may include cross fencing, cattle guards, AUM constraints and water development to ensure that seedling damage is kept to less than 5 percent.
MONITORING PROCEDURE
The number of AUM’s issued in range tenures for the TFL will be requested from the Ministry of Forests and Range to be included in the annual SFM report. The information gathered during this annual review will be used to assess whether range improvement plans need to be implemented to ensure a minimum of 1500 AUM's are maintained.
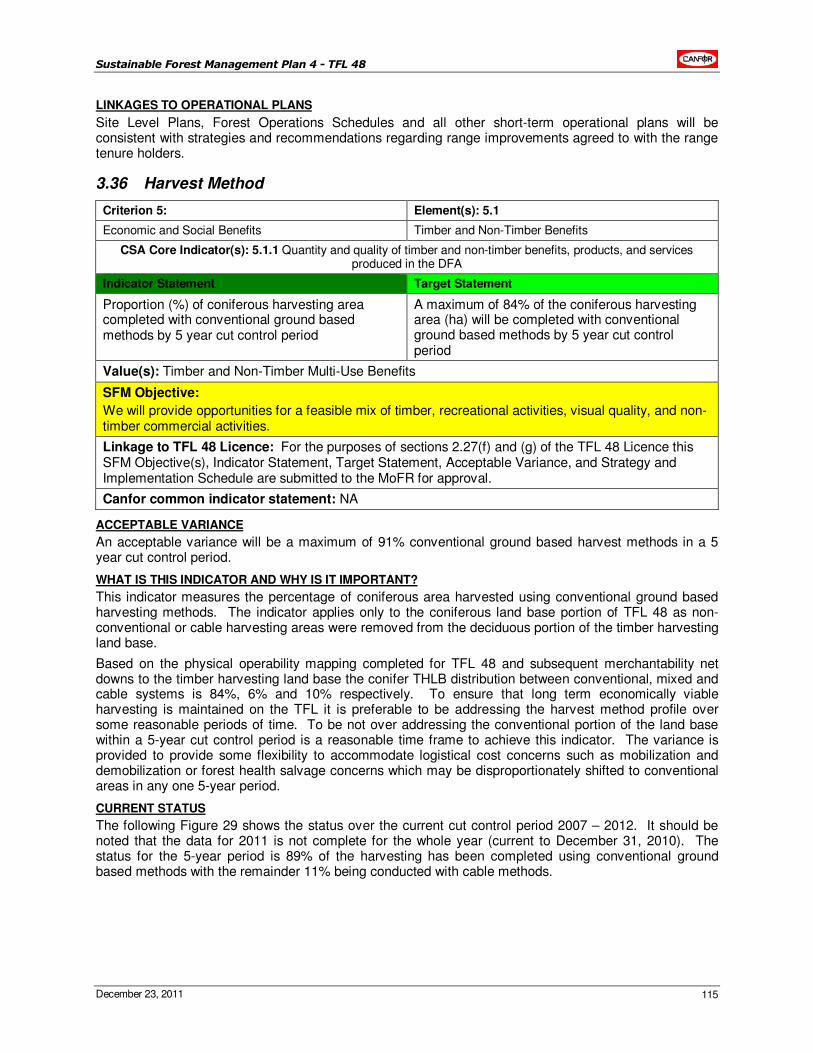
Sustainable Forest Management Plan 4 - TFL 48
December 23, 2011 115
LINKAGES TO OPERATIONAL PLANS
Site Level Plans, Forest Operations Schedules and all other short-term operational plans will be consistent with strategies and recommendations regarding range improvements agreed to with the range tenure holders.
3.36 Harvest Method
Criterion 5: Element(s): 5.1
Economic and Social Benefits Timber and Non-Timber Benefits
CSA Core Indicator(s): 5.1.1 Quantity and quality of timber and non-timber benefits, products, and services produced in the DFA
Indicator Statement Target Statement
Proportion (%) of coniferous harvesting area completed with conventional ground based methods by 5 year cut control period
A maximum of 84% of the coniferous harvesting area (ha) will be completed with conventional ground based methods by 5 year cut control period
Value(s): Timber and Non-Timber Multi-Use Benefits
SFM Objective:
We will provide opportunities for a feasible mix of timber, recreational activities, visual quality, and non-timber commercial activities.
Linkage to TFL 48 Licence: For the purposes of sections 2.27(f) and (g) of the TFL 48 Licence this SFM Objective(s), Indicator Statement, Target Statement, Acceptable Variance, and Strategy and Implementation Schedule are submitted to the MoFR for approval.
Canfor common indicator statement: NA
ACCEPTABLE VARIANCE
An acceptable variance will be a maximum of 91% conventional ground based harvest methods in a 5 year cut control period.
WHAT IS THIS INDICATOR AND WHY IS IT IMPORTANT?
This indicator measures the percentage of coniferous area harvested using conventional ground based harvesting methods. The indicator applies only to the coniferous land base portion of TFL 48 as non-conventional or cable harvesting areas were removed from the deciduous portion of the timber harvesting land base.
Based on the physical operability mapping completed for TFL 48 and subsequent merchantability net downs to the timber harvesting land base the conifer THLB distribution between conventional, mixed and cable systems is 84%, 6% and 10% respectively. To ensure that long term economically viable harvesting is maintained on the TFL it is preferable to be addressing the harvest method profile over some reasonable periods of time. To be not over addressing the conventional portion of the land base within a 5-year cut control period is a reasonable time frame to achieve this indicator. The variance is provided to provide some flexibility to accommodate logistical cost concerns such as mobilization and demobilization or forest health salvage concerns which may be disproportionately shifted to conventional areas in any one 5-year period.
CURRENT STATUS
The following Figure 29 shows the status over the current cut control period 2007 – 2012. It should be noted that the data for 2011 is not complete for the whole year (current to December 31, 2010). The status for the 5-year period is 89% of the harvesting has been completed using conventional ground based methods with the remainder 11% being conducted with cable methods.
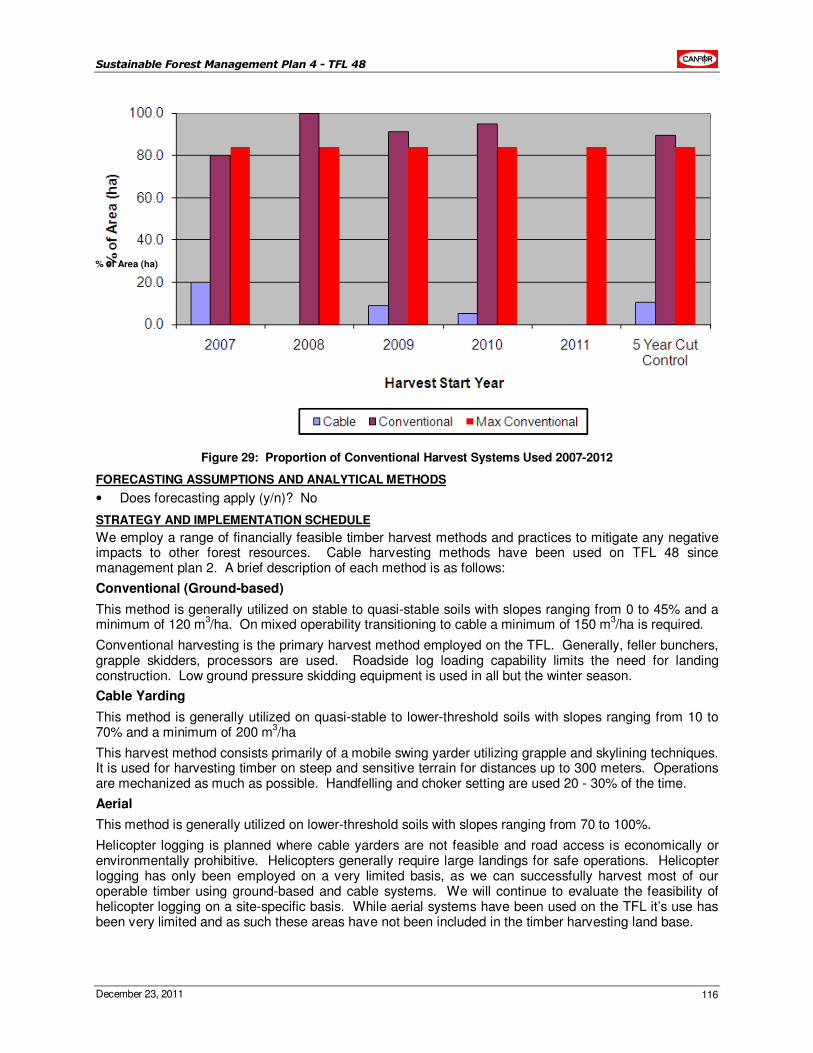
Sustainable Forest Management Plan 4 - TFL 48
December 23, 2011 116
Figure 29: Proportion of Conventional Harvest Systems Used 2007-2012
FORECASTING ASSUMPTIONS AND ANALYTICAL METHODS
• Does forecasting apply (y/n)? No
STRATEGY AND IMPLEMENTATION SCHEDULE
We employ a range of financially feasible timber harvest methods and practices to mitigate any negative impacts to other forest resources. Cable harvesting methods have been used on TFL 48 since management plan 2. A brief description of each method is as follows:
Conventional (Ground-based)
This method is generally utilized on stable to quasi-stable soils with slopes ranging from 0 to 45% and a minimum of 120 m
3/ha. On mixed operability transitioning to cable a minimum of 150 m
3/ha is required.
Conventional harvesting is the primary harvest method employed on the TFL. Generally, feller bunchers, grapple skidders, processors are used. Roadside log loading capability limits the need for landing construction. Low ground pressure skidding equipment is used in all but the winter season.
Cable Yarding
This method is generally utilized on quasi-stable to lower-threshold soils with slopes ranging from 10 to 70% and a minimum of 200 m
3/ha
This harvest method consists primarily of a mobile swing yarder utilizing grapple and skylining techniques. It is used for harvesting timber on steep and sensitive terrain for distances up to 300 meters. Operations are mechanized as much as possible. Handfelling and choker setting are used 20 - 30% of the time.
Aerial
This method is generally utilized on lower-threshold soils with slopes ranging from 70 to 100%.
Helicopter logging is planned where cable yarders are not feasible and road access is economically or environmentally prohibitive. Helicopters generally require large landings for safe operations. Helicopter logging has only been employed on a very limited basis, as we can successfully harvest most of our operable timber using ground-based and cable systems. We will continue to evaluate the feasibility of helicopter logging on a site-specific basis. While aerial systems have been used on the TFL it’s use has been very limited and as such these areas have not been included in the timber harvesting land base.
% of Area (ha)
Sustainable Forest Management Plan 4 - TFL 48
December 23, 2011 117
MONITORING PROCEDURE
Harvest method is tracked for each harvest unit within Genus. Annually the proportion of conventional ground based harvesting area will be reported for blocks, which had harvesting start in the year in question. Determination of meeting the target is made at the end of the cut control period for blocks, which had harvesting start within the period. The following formula describes how the proportions are calculated.
Formula:
CON% = (CON area / HARV area) * 100
Variables:
CON area Area of conventional harvesting started within 5 year cut control period.
HARV area Total area of harvesting started within 5 year cut control period.
CON% Percentage of conventional harvesting started within 5 year cut control period.
LINKAGES TO OPERATIONAL PLANS
Harvest method is determined through detailed on ground assessments, which consider safety, costs, harvest system limitations, soil conditions, and slope stability. The harvest method is indicated in silviculture prescriptions / site plans and on logging maps.
3.37 Proportion of Harvesting Consistent with Visual Quality Objective
Criterion 5: Element(s): 5.1
Economic and Social Benefits Timber and Non-Timber Benefits
CSA Core Indicator(s): 5.1.1 Quantity and quality of timber and non-timber benefits, products, and services produced in the DFA
Indicator Statement Target Statement
Proportion of harvesting within known visual areas that are consistent with the Visual Quality Objective (VQO)
100% of harvesting within visual areas will be consistent with the Visual Quality Objective
Value(s): Timber and Non-Timber Multi-Use Benefits
SFM Objective:
We will provide opportunities for a feasible mix of timber, recreational activities, visual quality, and non-timber commercial activities.
Linkage to TFL 48 Licence: For the purposes of sections 2.27(f) and (g) of the TFL 48 Licence this SFM Objective(s), Indicator Statement, Target Statement, Acceptable Variance, and Strategy and Implementation Schedule are submitted to the MoFR for approval.
Canfor common indicator statement: NA
ACCEPTABLE VARIANCE
Variances to achieving the established Visual Quality Objectives (VQO’s) that have a supporting rationale and are approved by the District Manager are acceptable.
WHAT IS THIS INDICATOR AND WHY IS IT IMPORTANT?
The Visual Landscape Inventory will identify visually sensitive areas visible from communities, public use areas, travel corridors and viewpoints that have been identified through a visual landscape planning process. The Visual Quality Objective is a resource management objective established by the district manager or contained in a higher-level plan; these objectives reflect the desired level of visual quality based on the physical characteristics and social concern for the area.
Being consistent with the visual quality objective is important in order to maintain the visual values of the landscape.
Sustainable Forest Management Plan 4 - TFL 48
December 23, 2011 118
CURRENT STATUS
All blocks harvested to date are consistent with VQO’s and VIA’s.
FORECASTING ASSUMPTIONS AND ANALYTICAL METHODS
• Does forecasting apply (y/n)? Yes.
Harvest levels are constrained based on the VQO constraints applied in the timber supply analysis. This ensures that harvest levels are achievable within the visual or scenic objects for TFL 48.
STRATEGY AND IMPLEMENTATION SCHEDULE
Pre-harvest visual impact assessments and landscape design processes are done within areas identified as being visually sensitive in the 2005 consolidated VLI. Where variances to achieving the VQO are necessary to achieve other forest management objectives (e.g. salvage of damaged timber), a rationale for the variance is submitted and a variance is requested from the district manager. A copy of the variance and the district manager approval is kept.
Post-harvest reviews are conducted within one year of harvest completion and compared to the VIA to ensure that the completed development is consistent with the VQO.
MONITORING PROCEDURE
Post-harvest reviews and their results kept on file and are tracked in Genus.
LINKAGES TO OPERATIONAL PLANS
Staff members will refer to base maps to locate visual polygons when preparing plans. When planned activities are in the general vicinity of the identified areas, staff members will ensure plans are consistent with visual quality objectives or acceptable variances.
Silviculture prescriptions or site plans identify the visual polygons and describe visual quality objectives and measures to achieve the objectives.
3.38 Back Country Condition
Criterion 5: Element(s): 5.1
Economic and Social Benefits Timber and Non-Timber Benefits
CSA Core Indicator(s): 5.1.1 Quantity and quality of timber and non-timber benefits, products, and services produced in the DFA
Indicator Statement Target Statement
Proportion (%)of back country areas (ha) that are in a semi-primitive recreation opportunity spectrum (ROS) class
We will maintain or increase semi-primitive ROS in Klin-se-za, Bocock, Butler Ridge, Pine/Lemoray, Peace River/Boudreau and Elephant Ridge/Gwillim Protected Areas and manage Special Management Zones (Klin se za, North Burnt, Dunlevy) as per LRMP (See Table 39 for baseline)
Value(s): Timber and Non-Timber Multi-Use Benefits
SFM Objective:
We will provide opportunities for a feasible mix of timber, recreational activities, visual quality, and non-timber commercial activities.
Linkage to TFL 48 Licence: For the purposes of sections 2.27(f) and (g) of the TFL 48 Licence this SFM Objective(s), Indicator Statement, Target Statement, Acceptable Variance, and Strategy and Implementation Schedule are submitted to the MoFR for approval.
Canfor common indicator statement: NA
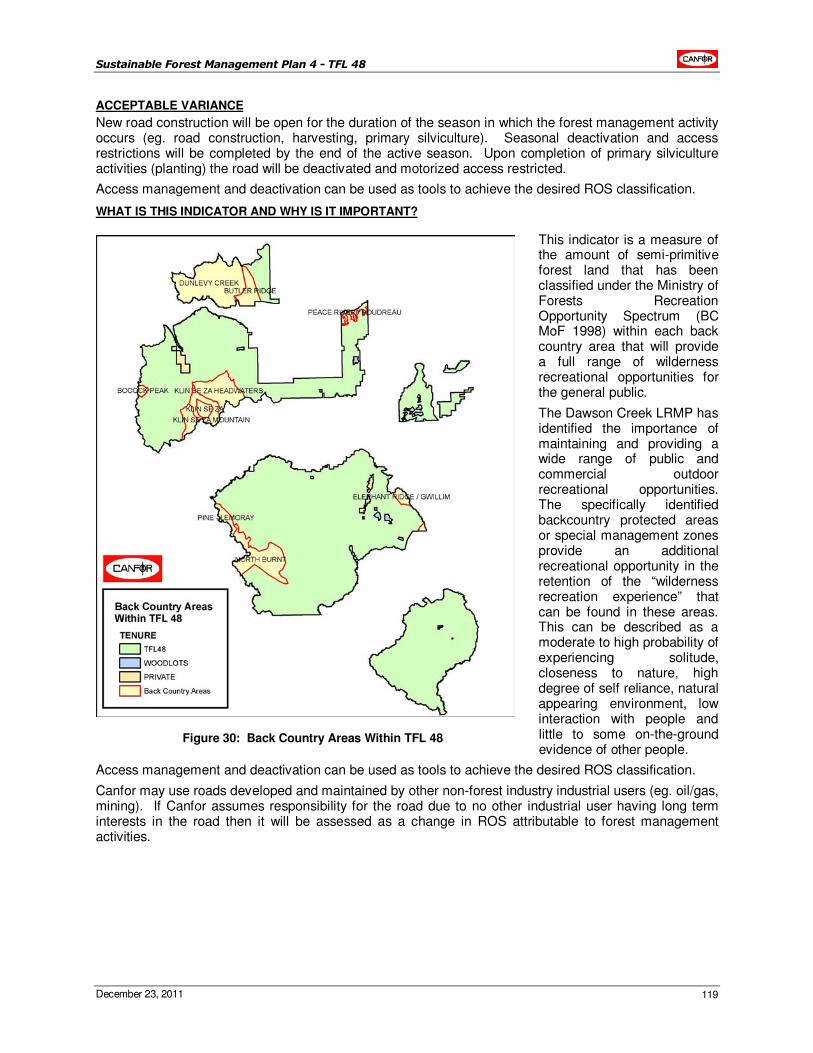
Sustainable Forest Management Plan 4 - TFL 48
December 23, 2011 119
ACCEPTABLE VARIANCE
New road construction will be open for the duration of the season in which the forest management activity occurs (eg. road construction, harvesting, primary silviculture). Seasonal deactivation and access restrictions will be completed by the end of the active season. Upon completion of primary silviculture activities (planting) the road will be deactivated and motorized access restricted.
Access management and deactivation can be used as tools to achieve the desired ROS classification.
WHAT IS THIS INDICATOR AND WHY IS IT IMPORTANT?
This indicator is a measure of the amount of semi-primitive forest land that has been classified under the Ministry of Forests Recreation Opportunity Spectrum (BC MoF 1998) within each back country area that will provide a full range of wilderness recreational opportunities for the general public.
The Dawson Creek LRMP has identified the importance of maintaining and providing a wide range of public and commercial outdoor recreational opportunities. The specifically identified backcountry protected areas or special management zones provide an additional recreational opportunity in the retention of the “wilderness recreation experience” that can be found in these areas. This can be described as a moderate to high probability of experiencing solitude, closeness to nature, high degree of self reliance, natural appearing environment, low interaction with people and little to some on-the-ground evidence of other people.
Access management and deactivation can be used as tools to achieve the desired ROS classification.
Canfor may use roads developed and maintained by other non-forest industry industrial users (eg. oil/gas, mining). If Canfor assumes responsibility for the road due to no other industrial user having long term interests in the road then it will be assessed as a change in ROS attributable to forest management activities.
Figure 30: Back Country Areas Within TFL 48
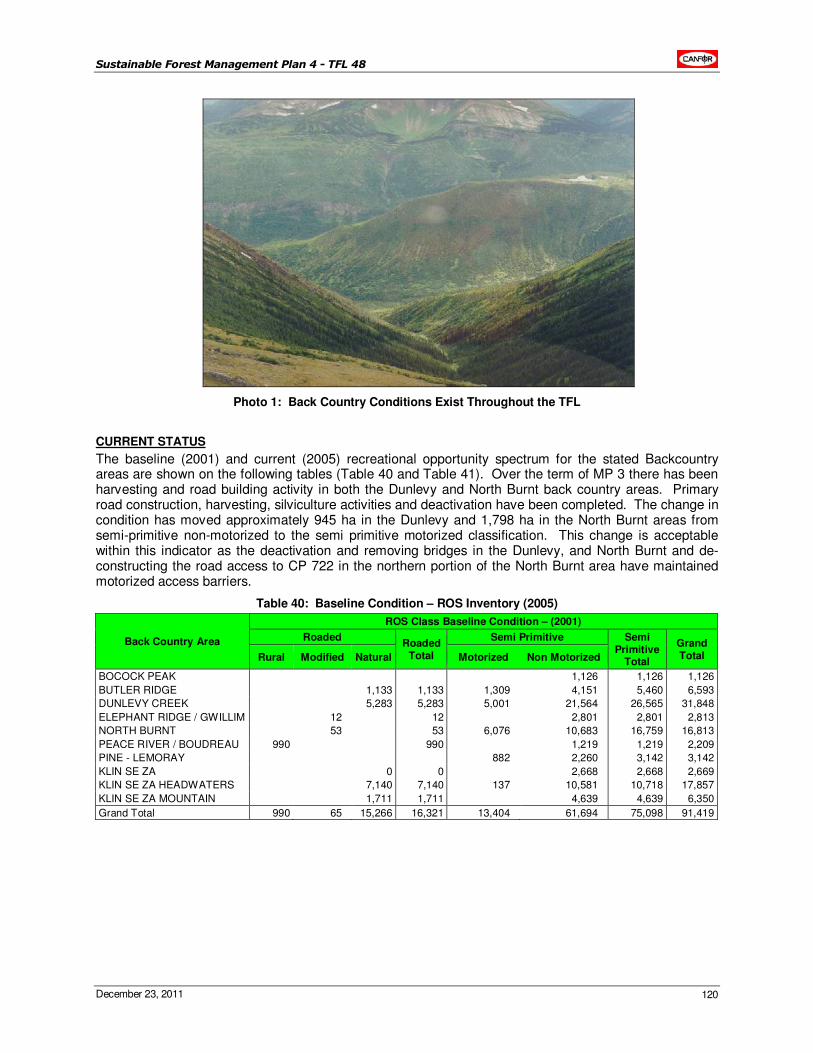
Sustainable Forest Management Plan 4 - TFL 48
December 23, 2011 120
Photo 1: Back Country Conditions Exist Throughout the TFL
CURRENT STATUS
The baseline (2001) and current (2005) recreational opportunity spectrum for the stated Backcountry areas are shown on the following tables (Table 40 and Table 41). Over the term of MP 3 there has been harvesting and road building activity in both the Dunlevy and North Burnt back country areas. Primary road construction, harvesting, silviculture activities and deactivation have been completed. The change in condition has moved approximately 945 ha in the Dunlevy and 1,798 ha in the North Burnt areas from semi-primitive non-motorized to the semi primitive motorized classification. This change is acceptable within this indicator as the deactivation and removing bridges in the Dunlevy, and North Burnt and de-constructing the road access to CP 722 in the northern portion of the North Burnt area have maintained motorized access barriers.
Table 40: Baseline Condition – ROS Inventory (2005)
Back Country Area
ROS Class Baseline Condition – (2001)
Roaded Roaded
Total
Semi Primitive Semi Primitive
Total
Grand Total Rural Modified Natural Motorized Non Motorized
BOCOCK PEAK 1,126 1,126 1,126
BUTLER RIDGE 1,133 1,133 1,309 4,151 5,460 6,593
DUNLEVY CREEK 5,283 5,283 5,001 21,564 26,565 31,848
ELEPHANT RIDGE / GWILLIM 12 12 2,801 2,801 2,813
NORTH BURNT 53 53 6,076 10,683 16,759 16,813
PEACE RIVER / BOUDREAU 990 990 1,219 1,219 2,209
PINE - LEMORAY 882 2,260 3,142 3,142
KLIN SE ZA 0 0 2,668 2,668 2,669
KLIN SE ZA HEADWATERS 7,140 7,140 137 10,581 10,718 17,857
KLIN SE ZA MOUNTAIN 1,711 1,711 4,639 4,639 6,350
Grand Total 990 65 15,266 16,321 13,404 61,694 75,098 91,419
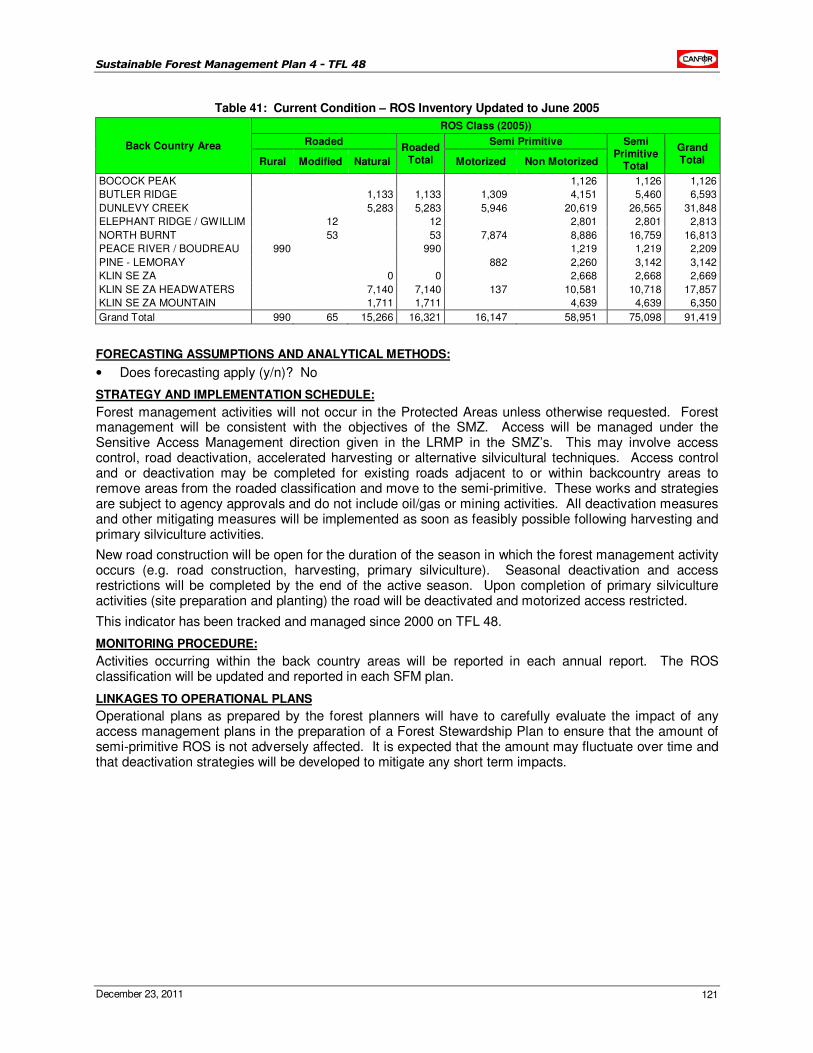
Sustainable Forest Management Plan 4 - TFL 48
December 23, 2011 121
Table 41: Current Condition – ROS Inventory Updated to June 2005
Back Country Area
ROS Class (2005))
Roaded Roaded
Total
Semi Primitive Semi Primitive
Total
Grand Total Rural Modified Natural Motorized Non Motorized
BOCOCK PEAK 1,126 1,126 1,126
BUTLER RIDGE 1,133 1,133 1,309 4,151 5,460 6,593
DUNLEVY CREEK 5,283 5,283 5,946 20,619 26,565 31,848
ELEPHANT RIDGE / GWILLIM 12 12 2,801 2,801 2,813
NORTH BURNT 53 53 7,874 8,886 16,759 16,813
PEACE RIVER / BOUDREAU 990 990 1,219 1,219 2,209
PINE - LEMORAY 882 2,260 3,142 3,142
KLIN SE ZA 0 0 2,668 2,668 2,669
KLIN SE ZA HEADWATERS 7,140 7,140 137 10,581 10,718 17,857
KLIN SE ZA MOUNTAIN 1,711 1,711 4,639 4,639 6,350
Grand Total 990 65 15,266 16,321 16,147 58,951 75,098 91,419
FORECASTING ASSUMPTIONS AND ANALYTICAL METHODS:
• Does forecasting apply (y/n)? No
STRATEGY AND IMPLEMENTATION SCHEDULE:
Forest management activities will not occur in the Protected Areas unless otherwise requested. Forest management will be consistent with the objectives of the SMZ. Access will be managed under the Sensitive Access Management direction given in the LRMP in the SMZ’s. This may involve access control, road deactivation, accelerated harvesting or alternative silvicultural techniques. Access control and or deactivation may be completed for existing roads adjacent to or within backcountry areas to remove areas from the roaded classification and move to the semi-primitive. These works and strategies are subject to agency approvals and do not include oil/gas or mining activities. All deactivation measures and other mitigating measures will be implemented as soon as feasibly possible following harvesting and primary silviculture activities.
New road construction will be open for the duration of the season in which the forest management activity occurs (e.g. road construction, harvesting, primary silviculture). Seasonal deactivation and access restrictions will be completed by the end of the active season. Upon completion of primary silviculture activities (site preparation and planting) the road will be deactivated and motorized access restricted.
This indicator has been tracked and managed since 2000 on TFL 48.
MONITORING PROCEDURE:
Activities occurring within the back country areas will be reported in each annual report. The ROS classification will be updated and reported in each SFM plan.
LINKAGES TO OPERATIONAL PLANS
Operational plans as prepared by the forest planners will have to carefully evaluate the impact of any access management plans in the preparation of a Forest Stewardship Plan to ensure that the amount of semi-primitive ROS is not adversely affected. It is expected that the amount may fluctuate over time and that deactivation strategies will be developed to mitigate any short term impacts.
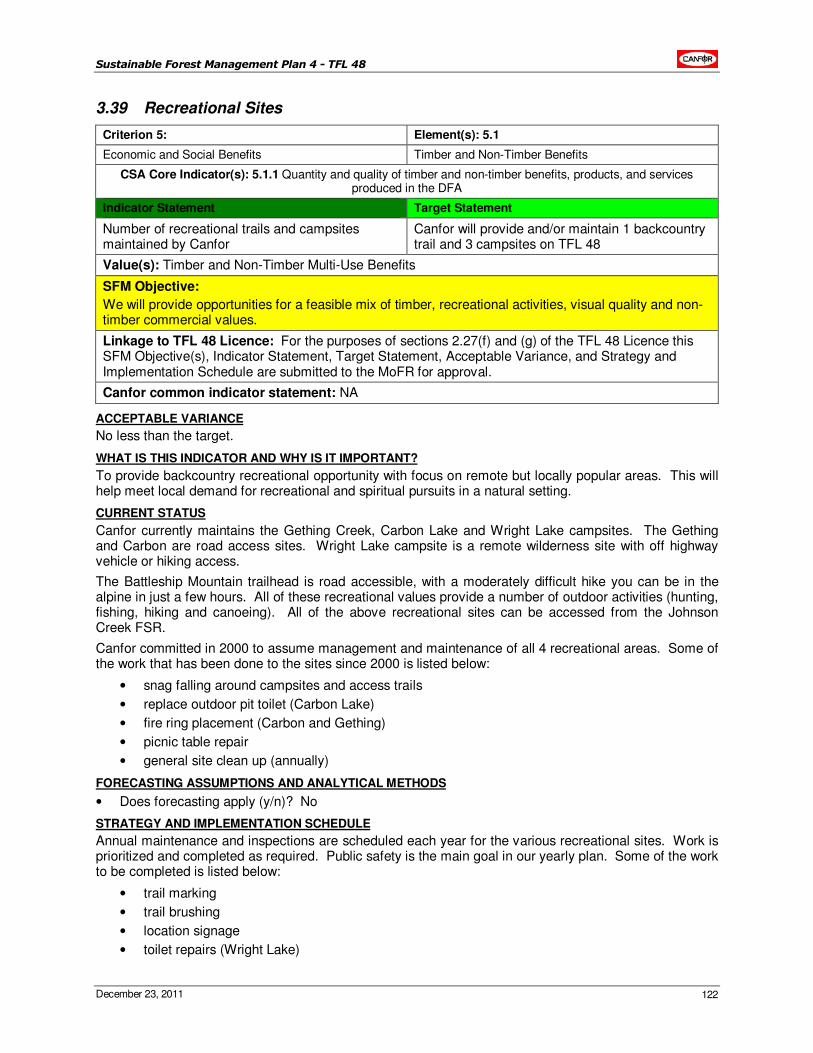
Sustainable Forest Management Plan 4 - TFL 48
December 23, 2011 122
3.39 Recreational Sites
Criterion 5: Element(s): 5.1
Economic and Social Benefits Timber and Non-Timber Benefits
CSA Core Indicator(s): 5.1.1 Quantity and quality of timber and non-timber benefits, products, and services produced in the DFA
Indicator Statement Target Statement
Number of recreational trails and campsites maintained by Canfor
Canfor will provide and/or maintain 1 backcountry trail and 3 campsites on TFL 48
Value(s): Timber and Non-Timber Multi-Use Benefits
SFM Objective:
We will provide opportunities for a feasible mix of timber, recreational activities, visual quality and non-timber commercial values.
Linkage to TFL 48 Licence: For the purposes of sections 2.27(f) and (g) of the TFL 48 Licence this SFM Objective(s), Indicator Statement, Target Statement, Acceptable Variance, and Strategy and Implementation Schedule are submitted to the MoFR for approval.
Canfor common indicator statement: NA
ACCEPTABLE VARIANCE
No less than the target.
WHAT IS THIS INDICATOR AND WHY IS IT IMPORTANT?
To provide backcountry recreational opportunity with focus on remote but locally popular areas. This will help meet local demand for recreational and spiritual pursuits in a natural setting.
CURRENT STATUS
Canfor currently maintains the Gething Creek, Carbon Lake and Wright Lake campsites. The Gething and Carbon are road access sites. Wright Lake campsite is a remote wilderness site with off highway vehicle or hiking access.
The Battleship Mountain trailhead is road accessible, with a moderately difficult hike you can be in the alpine in just a few hours. All of these recreational values provide a number of outdoor activities (hunting, fishing, hiking and canoeing). All of the above recreational sites can be accessed from the Johnson Creek FSR.
Canfor committed in 2000 to assume management and maintenance of all 4 recreational areas. Some of the work that has been done to the sites since 2000 is listed below:
• snag falling around campsites and access trails
• replace outdoor pit toilet (Carbon Lake)
• fire ring placement (Carbon and Gething)
• picnic table repair
• general site clean up (annually)
FORECASTING ASSUMPTIONS AND ANALYTICAL METHODS
• Does forecasting apply (y/n)? No
STRATEGY AND IMPLEMENTATION SCHEDULE
Annual maintenance and inspections are scheduled each year for the various recreational sites. Work is prioritized and completed as required. Public safety is the main goal in our yearly plan. Some of the work to be completed is listed below:
• trail marking
• trail brushing
• location signage
• toilet repairs (Wright Lake)
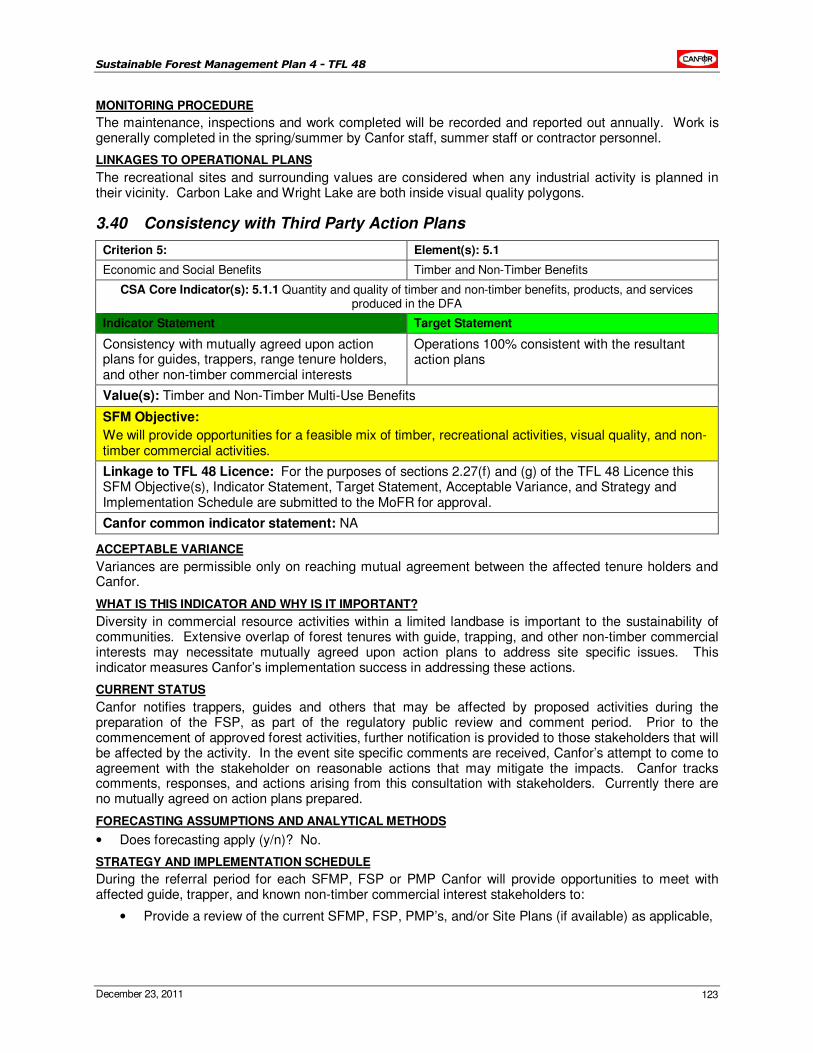
Sustainable Forest Management Plan 4 - TFL 48
December 23, 2011 123
MONITORING PROCEDURE
The maintenance, inspections and work completed will be recorded and reported out annually. Work is generally completed in the spring/summer by Canfor staff, summer staff or contractor personnel.
LINKAGES TO OPERATIONAL PLANS
The recreational sites and surrounding values are considered when any industrial activity is planned in their vicinity. Carbon Lake and Wright Lake are both inside visual quality polygons.
3.40 Consistency with Third Party Action Plans
Criterion 5: Element(s): 5.1
Economic and Social Benefits Timber and Non-Timber Benefits
CSA Core Indicator(s): 5.1.1 Quantity and quality of timber and non-timber benefits, products, and services produced in the DFA
Indicator Statement Target Statement
Consistency with mutually agreed upon action plans for guides, trappers, range tenure holders, and other non-timber commercial interests
Operations 100% consistent with the resultant action plans
Value(s): Timber and Non-Timber Multi-Use Benefits
SFM Objective:
We will provide opportunities for a feasible mix of timber, recreational activities, visual quality, and non-timber commercial activities.
Linkage to TFL 48 Licence: For the purposes of sections 2.27(f) and (g) of the TFL 48 Licence this SFM Objective(s), Indicator Statement, Target Statement, Acceptable Variance, and Strategy and Implementation Schedule are submitted to the MoFR for approval.
Canfor common indicator statement: NA
ACCEPTABLE VARIANCE
Variances are permissible only on reaching mutual agreement between the affected tenure holders and Canfor.
WHAT IS THIS INDICATOR AND WHY IS IT IMPORTANT?
Diversity in commercial resource activities within a limited landbase is important to the sustainability of communities. Extensive overlap of forest tenures with guide, trapping, and other non-timber commercial interests may necessitate mutually agreed upon action plans to address site specific issues. This indicator measures Canfor’s implementation success in addressing these actions.
CURRENT STATUS
Canfor notifies trappers, guides and others that may be affected by proposed activities during the preparation of the FSP, as part of the regulatory public review and comment period. Prior to the commencement of approved forest activities, further notification is provided to those stakeholders that will be affected by the activity. In the event site specific comments are received, Canfor’s attempt to come to agreement with the stakeholder on reasonable actions that may mitigate the impacts. Canfor tracks comments, responses, and actions arising from this consultation with stakeholders. Currently there are no mutually agreed on action plans prepared.
FORECASTING ASSUMPTIONS AND ANALYTICAL METHODS
• Does forecasting apply (y/n)? No.
STRATEGY AND IMPLEMENTATION SCHEDULE
During the referral period for each SFMP, FSP or PMP Canfor will provide opportunities to meet with affected guide, trapper, and known non-timber commercial interest stakeholders to:
• Provide a review of the current SFMP, FSP, PMP’s, and/or Site Plans (if available) as applicable,
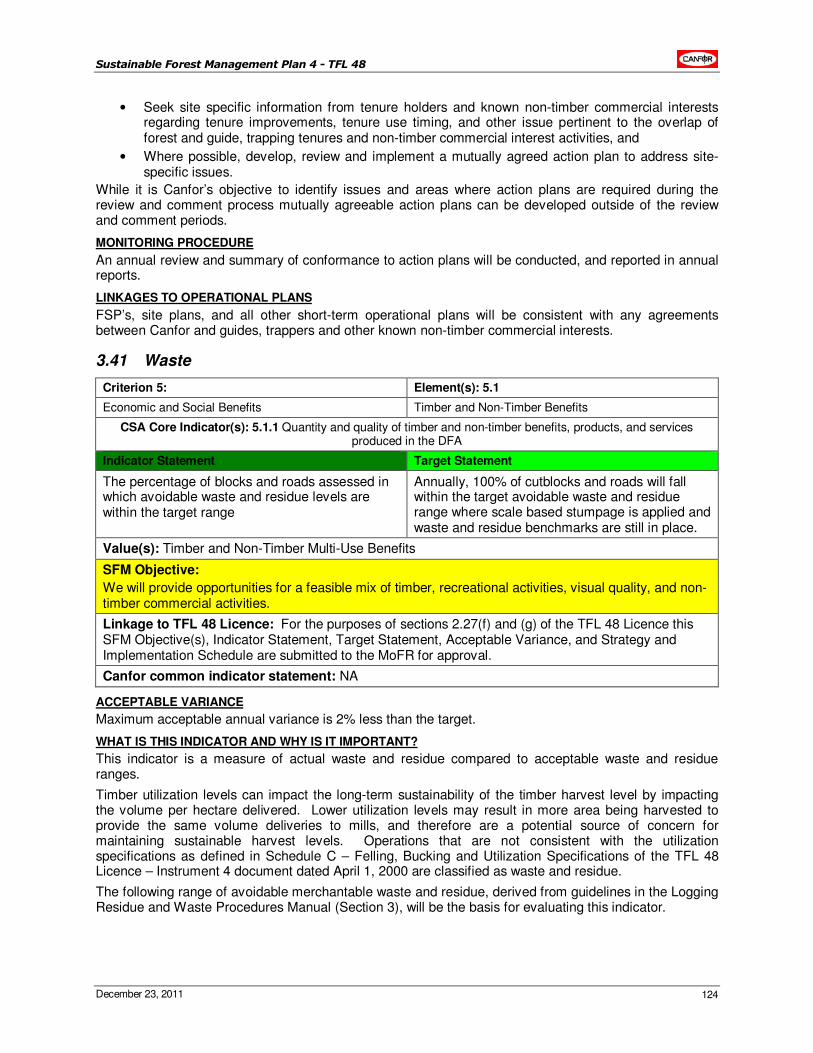
Sustainable Forest Management Plan 4 - TFL 48
December 23, 2011 124
• Seek site specific information from tenure holders and known non-timber commercial interests regarding tenure improvements, tenure use timing, and other issue pertinent to the overlap of forest and guide, trapping tenures and non-timber commercial interest activities, and
• Where possible, develop, review and implement a mutually agreed action plan to address site-specific issues.
While it is Canfor’s objective to identify issues and areas where action plans are required during the review and comment process mutually agreeable action plans can be developed outside of the review and comment periods.
MONITORING PROCEDURE
An annual review and summary of conformance to action plans will be conducted, and reported in annual reports.
LINKAGES TO OPERATIONAL PLANS
FSP’s, site plans, and all other short-term operational plans will be consistent with any agreements between Canfor and guides, trappers and other known non-timber commercial interests.
3.41 Waste
Criterion 5: Element(s): 5.1
Economic and Social Benefits Timber and Non-Timber Benefits
CSA Core Indicator(s): 5.1.1 Quantity and quality of timber and non-timber benefits, products, and services produced in the DFA
Indicator Statement Target Statement
The percentage of blocks and roads assessed in which avoidable waste and residue levels are within the target range
Annually, 100% of cutblocks and roads will fall within the target avoidable waste and residue range where scale based stumpage is applied and waste and residue benchmarks are still in place.
Value(s): Timber and Non-Timber Multi-Use Benefits
SFM Objective:
We will provide opportunities for a feasible mix of timber, recreational activities, visual quality, and non-timber commercial activities.
Linkage to TFL 48 Licence: For the purposes of sections 2.27(f) and (g) of the TFL 48 Licence this SFM Objective(s), Indicator Statement, Target Statement, Acceptable Variance, and Strategy and Implementation Schedule are submitted to the MoFR for approval.
Canfor common indicator statement: NA
ACCEPTABLE VARIANCE
Maximum acceptable annual variance is 2% less than the target.
WHAT IS THIS INDICATOR AND WHY IS IT IMPORTANT?
This indicator is a measure of actual waste and residue compared to acceptable waste and residue ranges.
Timber utilization levels can impact the long-term sustainability of the timber harvest level by impacting the volume per hectare delivered. Lower utilization levels may result in more area being harvested to provide the same volume deliveries to mills, and therefore are a potential source of concern for maintaining sustainable harvest levels. Operations that are not consistent with the utilization specifications as defined in Schedule C – Felling, Bucking and Utilization Specifications of the TFL 48 Licence – Instrument 4 document dated April 1, 2000 are classified as waste and residue.
The following range of avoidable merchantable waste and residue, derived from guidelines in the Logging Residue and Waste Procedures Manual (Section 3), will be the basis for evaluating this indicator.
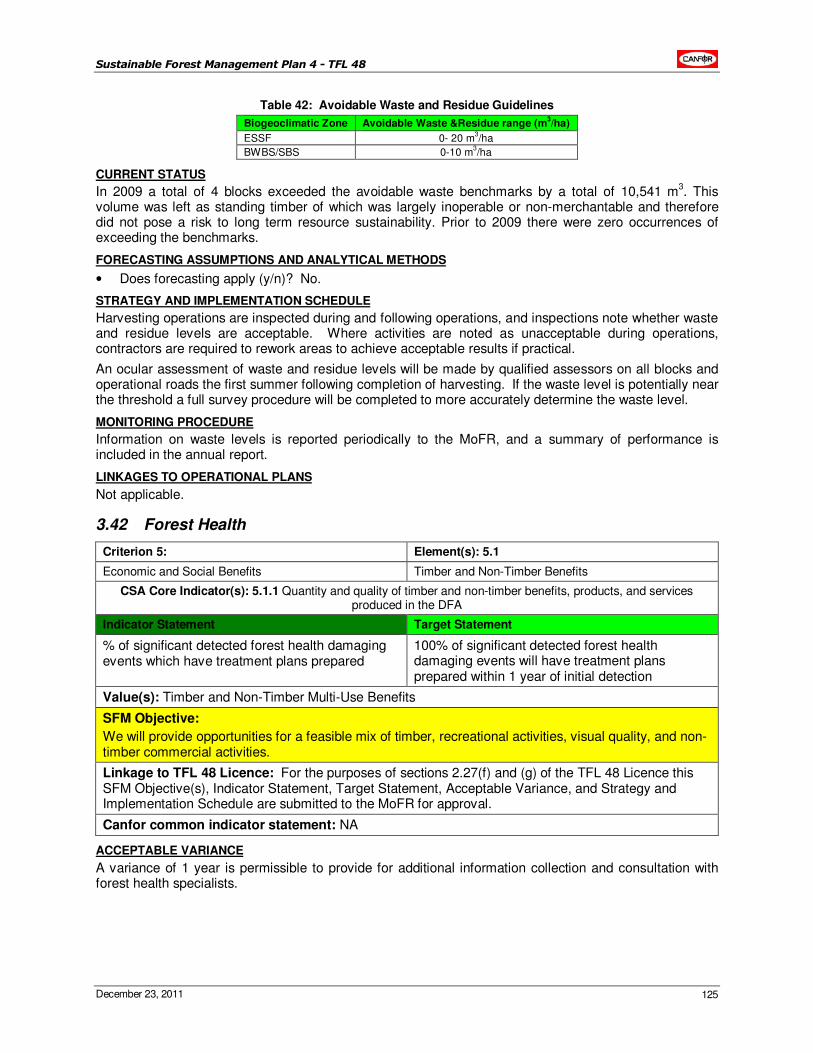
Sustainable Forest Management Plan 4 - TFL 48
December 23, 2011 125
Table 42: Avoidable Waste and Residue Guidelines
Biogeoclimatic Zone Avoidable Waste &Residue range (m3/ha)
ESSF 0- 20 m3/ha
BWBS/SBS 0-10 m3/ha
CURRENT STATUS
In 2009 a total of 4 blocks exceeded the avoidable waste benchmarks by a total of 10,541 m3. This
volume was left as standing timber of which was largely inoperable or non-merchantable and therefore did not pose a risk to long term resource sustainability. Prior to 2009 there were zero occurrences of exceeding the benchmarks.
FORECASTING ASSUMPTIONS AND ANALYTICAL METHODS
• Does forecasting apply (y/n)? No.
STRATEGY AND IMPLEMENTATION SCHEDULE
Harvesting operations are inspected during and following operations, and inspections note whether waste and residue levels are acceptable. Where activities are noted as unacceptable during operations, contractors are required to rework areas to achieve acceptable results if practical.
An ocular assessment of waste and residue levels will be made by qualified assessors on all blocks and operational roads the first summer following completion of harvesting. If the waste level is potentially near the threshold a full survey procedure will be completed to more accurately determine the waste level.
MONITORING PROCEDURE
Information on waste levels is reported periodically to the MoFR, and a summary of performance is included in the annual report.
LINKAGES TO OPERATIONAL PLANS
Not applicable.
3.42 Forest Health
Criterion 5: Element(s): 5.1
Economic and Social Benefits Timber and Non-Timber Benefits
CSA Core Indicator(s): 5.1.1 Quantity and quality of timber and non-timber benefits, products, and services produced in the DFA
Indicator Statement Target Statement
% of significant detected forest health damaging events which have treatment plans prepared
100% of significant detected forest health damaging events will have treatment plans prepared within 1 year of initial detection
Value(s): Timber and Non-Timber Multi-Use Benefits
SFM Objective:
We will provide opportunities for a feasible mix of timber, recreational activities, visual quality, and non-timber commercial activities.
Linkage to TFL 48 Licence: For the purposes of sections 2.27(f) and (g) of the TFL 48 Licence this SFM Objective(s), Indicator Statement, Target Statement, Acceptable Variance, and Strategy and Implementation Schedule are submitted to the MoFR for approval.
Canfor common indicator statement: NA
ACCEPTABLE VARIANCE
A variance of 1 year is permissible to provide for additional information collection and consultation with forest health specialists.
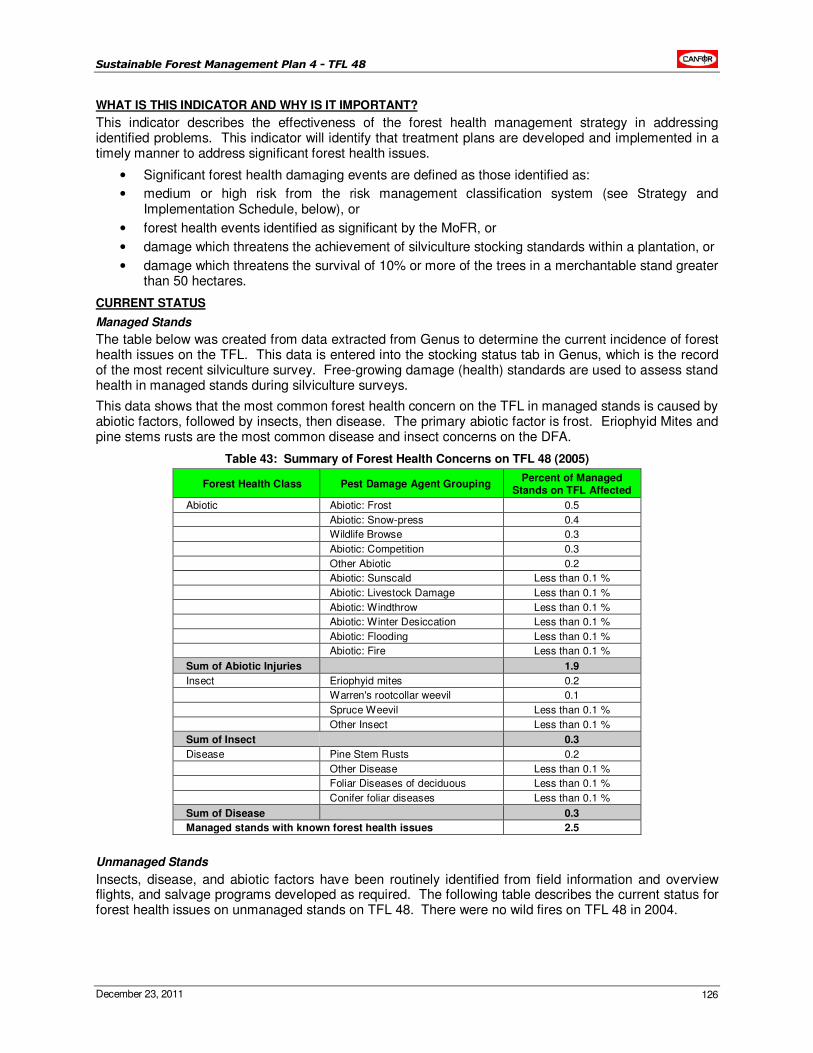
Sustainable Forest Management Plan 4 - TFL 48
December 23, 2011 126
WHAT IS THIS INDICATOR AND WHY IS IT IMPORTANT?
This indicator describes the effectiveness of the forest health management strategy in addressing identified problems. This indicator will identify that treatment plans are developed and implemented in a timely manner to address significant forest health issues.
• Significant forest health damaging events are defined as those identified as:
• medium or high risk from the risk management classification system (see Strategy and Implementation Schedule, below), or
• forest health events identified as significant by the MoFR, or
• damage which threatens the achievement of silviculture stocking standards within a plantation, or
• damage which threatens the survival of 10% or more of the trees in a merchantable stand greater than 50 hectares.
CURRENT STATUS
Managed Stands
The table below was created from data extracted from Genus to determine the current incidence of forest health issues on the TFL. This data is entered into the stocking status tab in Genus, which is the record of the most recent silviculture survey. Free-growing damage (health) standards are used to assess stand health in managed stands during silviculture surveys.
This data shows that the most common forest health concern on the TFL in managed stands is caused by abiotic factors, followed by insects, then disease. The primary abiotic factor is frost. Eriophyid Mites and pine stems rusts are the most common disease and insect concerns on the DFA.
Table 43: Summary of Forest Health Concerns on TFL 48 (2005)
Forest Health Class Pest Damage Agent Grouping Percent of Managed
Stands on TFL Affected
Abiotic Abiotic: Frost 0.5
Abiotic: Snow-press 0.4
Wildlife Browse 0.3
Abiotic: Competition 0.3
Other Abiotic 0.2
Abiotic: Sunscald Less than 0.1 %
Abiotic: Livestock Damage Less than 0.1 %
Abiotic: Windthrow Less than 0.1 %
Abiotic: Winter Desiccation Less than 0.1 %
Abiotic: Flooding Less than 0.1 %
Abiotic: Fire Less than 0.1 %
Sum of Abiotic Injuries 1.9
Insect Eriophyid mites 0.2
Warren's rootcollar weevil 0.1
Spruce Weevil Less than 0.1 %
Other Insect Less than 0.1 %
Sum of Insect 0.3
Disease Pine Stem Rusts 0.2
Other Disease Less than 0.1 %
Foliar Diseases of deciduous Less than 0.1 %
Conifer foliar diseases Less than 0.1 %
Sum of Disease 0.3
Managed stands with known forest health issues 2.5
Unmanaged Stands
Insects, disease, and abiotic factors have been routinely identified from field information and overview flights, and salvage programs developed as required. The following table describes the current status for forest health issues on unmanaged stands on TFL 48. There were no wild fires on TFL 48 in 2004.
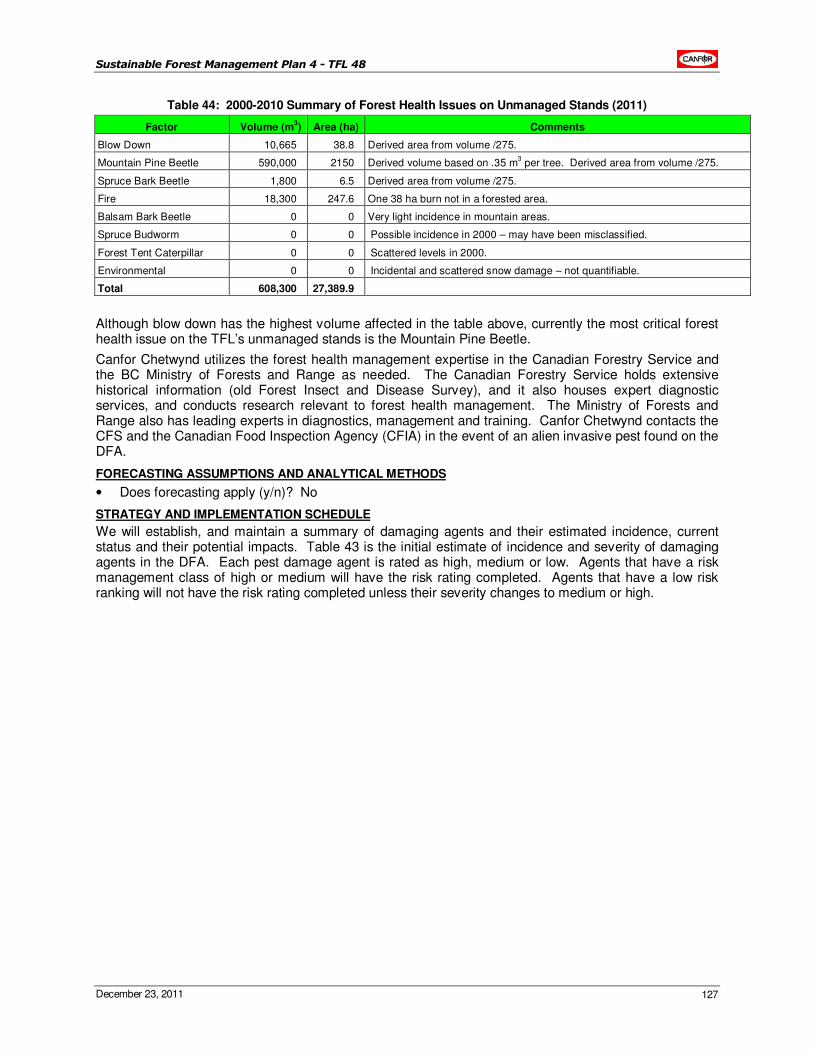
Sustainable Forest Management Plan 4 - TFL 48
December 23, 2011 127
Table 44: 2000-2010 Summary of Forest Health Issues on Unmanaged Stands (2011)
Factor Volume (m3) Area (ha) Comments
Blow Down 10,665 38.8 Derived area from volume /275.
Mountain Pine Beetle 590,000 2150 Derived volume based on .35 m3 per tree. Derived area from volume /275.
Spruce Bark Beetle 1,800 6.5 Derived area from volume /275.
Fire 18,300 247.6 One 38 ha burn not in a forested area.
Balsam Bark Beetle 0 0 Very light incidence in mountain areas.
Spruce Budworm 0 0 Possible incidence in 2000 – may have been misclassified.
Forest Tent Caterpillar 0 0 Scattered levels in 2000.
Environmental 0 0 Incidental and scattered snow damage – not quantifiable.
Total 608,300 27,389.9
Although blow down has the highest volume affected in the table above, currently the most critical forest health issue on the TFL’s unmanaged stands is the Mountain Pine Beetle.
Canfor Chetwynd utilizes the forest health management expertise in the Canadian Forestry Service and the BC Ministry of Forests and Range as needed. The Canadian Forestry Service holds extensive historical information (old Forest Insect and Disease Survey), and it also houses expert diagnostic services, and conducts research relevant to forest health management. The Ministry of Forests and Range also has leading experts in diagnostics, management and training. Canfor Chetwynd contacts the CFS and the Canadian Food Inspection Agency (CFIA) in the event of an alien invasive pest found on the DFA.
FORECASTING ASSUMPTIONS AND ANALYTICAL METHODS
• Does forecasting apply (y/n)? No
STRATEGY AND IMPLEMENTATION SCHEDULE
We will establish, and maintain a summary of damaging agents and their estimated incidence, current status and their potential impacts. Table 43 is the initial estimate of incidence and severity of damaging agents in the DFA. Each pest damage agent is rated as high, medium or low. Agents that have a risk management class of high or medium will have the risk rating completed. Agents that have a low risk ranking will not have the risk rating completed unless their severity changes to medium or high.
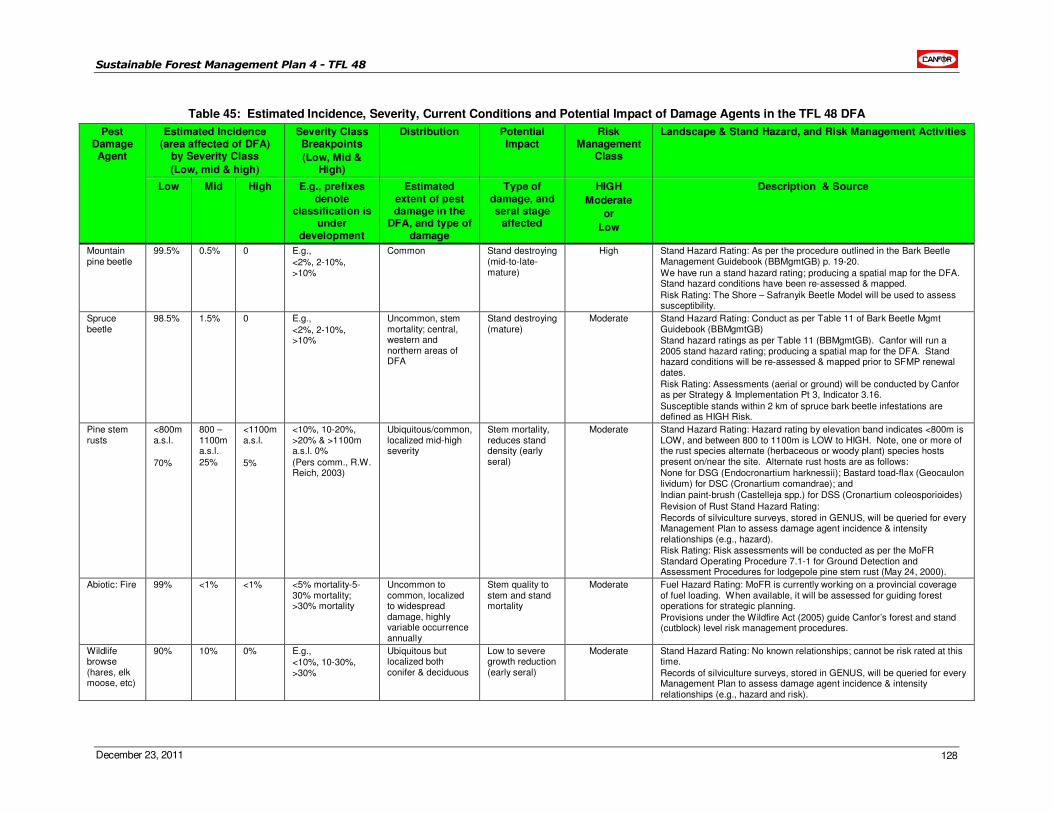
Sustainable Forest Management Plan 4 - TFL 48
December 23, 2011 128
Table 45: Estimated Incidence, Severity, Current Conditions and Potential Impact of Damage Agents in the TFL 48 DFA
Pest Damage Agent
Estimated Incidence (area affected of DFA)
by Severity Class
(Low, mid & high)
Severity Class Breakpoints
(Low, Mid & High)
Distribution Potential Impact
Risk Management
Class
Landscape & Stand Hazard, and Risk Management Activities
Low Mid High E.g., prefixes denote
classification is under
development
Estimated extent of pest damage in the
DFA, and type of damage
Type of damage, and seral stage
affected
HIGH
Moderate
or
Low
Description & Source
Mountain pine beetle
99.5% 0.5% 0 E.g.,
<2%, 2-10%, >10%
Common Stand destroying (mid-to-late-mature)
High Stand Hazard Rating: As per the procedure outlined in the Bark Beetle Management Guidebook (BBMgmtGB) p. 19-20.
We have run a stand hazard rating; producing a spatial map for the DFA. Stand hazard conditions have been re-assessed & mapped.
Risk Rating: The Shore – Safranyik Beetle Model will be used to assess susceptibility.
Spruce beetle
98.5% 1.5% 0 E.g.,
<2%, 2-10%, >10%
Uncommon, stem mortality; central, western and northern areas of DFA
Stand destroying (mature)
Moderate Stand Hazard Rating: Conduct as per Table 11 of Bark Beetle Mgmt Guidebook (BBMgmtGB) Stand hazard ratings as per Table 11 (BBMgmtGB). Canfor will run a 2005 stand hazard rating; producing a spatial map for the DFA. Stand hazard conditions will be re-assessed & mapped prior to SFMP renewal dates.
Risk Rating: Assessments (aerial or ground) will be conducted by Canfor as per Strategy & Implementation Pt 3, Indicator 3.16.
Susceptible stands within 2 km of spruce bark beetle infestations are defined as HIGH Risk.
Pine stem rusts
<800m a.s.l.
70%
800 – 1100m a.s.l.
25%
<1100m a.s.l.
5%
<10%, 10-20%, >20% & >1100m a.s.l. 0%
(Pers comm., R.W. Reich, 2003)
Ubiquitous/common, localized mid-high severity
Stem mortality, reduces stand density (early seral)
Moderate Stand Hazard Rating: Hazard rating by elevation band indicates <800m is LOW, and between 800 to 1100m is LOW to HIGH. Note, one or more of the rust species alternate (herbaceous or woody plant) species hosts present on/near the site. Alternate rust hosts are as follows: None for DSG (Endocronartium harknessii); Bastard toad-flax (Geocaulon lividum) for DSC (Cronartium comandrae); and Indian paint-brush (Castelleja spp.) for DSS (Cronartium coleosporioides)
Revision of Rust Stand Hazard Rating:
Records of silviculture surveys, stored in GENUS, will be queried for every Management Plan to assess damage agent incidence & intensity relationships (e.g., hazard). Risk Rating: Risk assessments will be conducted as per the MoFR Standard Operating Procedure 7.1-1 for Ground Detection and Assessment Procedures for lodgepole pine stem rust (May 24, 2000).
Abiotic: Fire 99% <1% <1% <5% mortality-5-30% mortality; >30% mortality
Uncommon to common, localized to widespread damage, highly variable occurrence annually
Stem quality to stem and stand mortality
Moderate Fuel Hazard Rating: MoFR is currently working on a provincial coverage of fuel loading. When available, it will be assessed for guiding forest operations for strategic planning.
Provisions under the Wildfire Act (2005) guide Canfor’s forest and stand (cutblock) level risk management procedures.
Wildlife browse (hares, elk moose, etc)
90% 10% 0% E.g., <10%, 10-30%, >30%
Ubiquitous but localized both conifer & deciduous
Low to severe growth reduction (early seral)
Moderate Stand Hazard Rating: No known relationships; cannot be risk rated at this time.
Records of silviculture surveys, stored in GENUS, will be queried for every Management Plan to assess damage agent incidence & intensity relationships (e.g., hazard and risk).
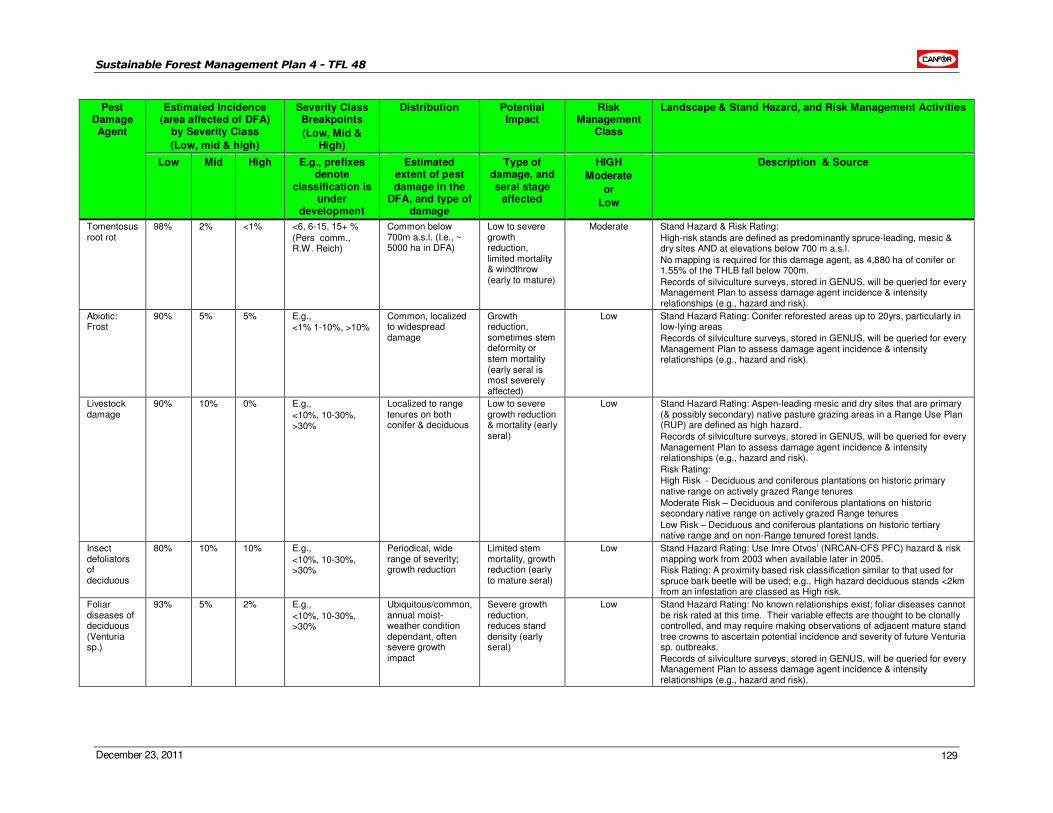
Sustainable Forest Management Plan 4 - TFL 48
December 23, 2011 129
Pest Damage Agent
Estimated Incidence (area affected of DFA)
by Severity Class
(Low, mid & high)
Severity Class Breakpoints
(Low, Mid & High)
Distribution Potential Impact
Risk Management
Class
Landscape & Stand Hazard, and Risk Management Activities
Low Mid High E.g., prefixes denote
classification is under
development
Estimated extent of pest damage in the
DFA, and type of damage
Type of damage, and seral stage
affected
HIGH
Moderate
or
Low
Description & Source
Tomentosus root rot
98% 2% <1% <6, 6-15, 15+ %
(Pers comm., R.W. Reich)
Common below 700m a.s.l. (I.e., ~ 5000 ha in DFA)
Low to severe growth reduction, limited mortality & windthrow (early to mature)
Moderate
Stand Hazard & Risk Rating:
High-risk stands are defined as predominantly spruce-leading, mesic & dry sites AND at elevations below 700 m a.s.l.
No mapping is required for this damage agent, as 4,880 ha of conifer or 1.55% of the THLB fall below 700m.
Records of silviculture surveys, stored in GENUS, will be queried for every Management Plan to assess damage agent incidence & intensity relationships (e.g., hazard and risk).
Abiotic: Frost
90% 5% 5% E.g., <1% 1-10%, >10%
Common, localized to widespread damage
Growth reduction, sometimes stem deformity or stem mortality (early seral is most severely affected)
Low Stand Hazard Rating: Conifer reforested areas up to 20yrs, particularly in low-lying areas
Records of silviculture surveys, stored in GENUS, will be queried for every Management Plan to assess damage agent incidence & intensity relationships (e.g., hazard and risk).
Livestock damage
90% 10% 0% E.g.,
<10%, 10-30%, >30%
Localized to range tenures on both conifer & deciduous
Low to severe growth reduction & mortality (early seral)
Low Stand Hazard Rating: Aspen-leading mesic and dry sites that are primary (& possibly secondary) native pasture grazing areas in a Range Use Plan (RUP) are defined as high hazard.
Records of silviculture surveys, stored in GENUS, will be queried for every Management Plan to assess damage agent incidence & intensity relationships (e.g., hazard and risk).
Risk Rating: High Risk - Deciduous and coniferous plantations on historic primary native range on actively grazed Range tenures
Moderate Risk – Deciduous and coniferous plantations on historic secondary native range on actively grazed Range tenures
Low Risk – Deciduous and coniferous plantations on historic tertiary native range and on non-Range tenured forest lands.
Insect defoliators of deciduous
80% 10% 10% E.g.,
<10%, 10-30%, >30%
Periodical, wide range of severity; growth reduction
Limited stem mortality, growth reduction (early to mature seral)
Low Stand Hazard Rating: Use Imre Otvos’ (NRCAN-CFS PFC) hazard & risk mapping work from 2003 when available later in 2005. Risk Rating: A proximity based risk classification similar to that used for spruce bark beetle will be used; e.g., High hazard deciduous stands <2km from an infestation are classed as High risk.
Foliar diseases of deciduous (Venturia sp.)
93% 5% 2% E.g.,
<10%, 10-30%, >30%
Ubiquitous/common, annual moist-weather condition dependant, often severe growth impact
Severe growth reduction, reduces stand density (early seral)
Low Stand Hazard Rating: No known relationships exist; foliar diseases cannot be risk rated at this time. Their variable effects are thought to be clonally controlled, and may require making observations of adjacent mature stand tree crowns to ascertain potential incidence and severity of future Venturia sp. outbreaks.
Records of silviculture surveys, stored in GENUS, will be queried for every Management Plan to assess damage agent incidence & intensity relationships (e.g., hazard and risk).
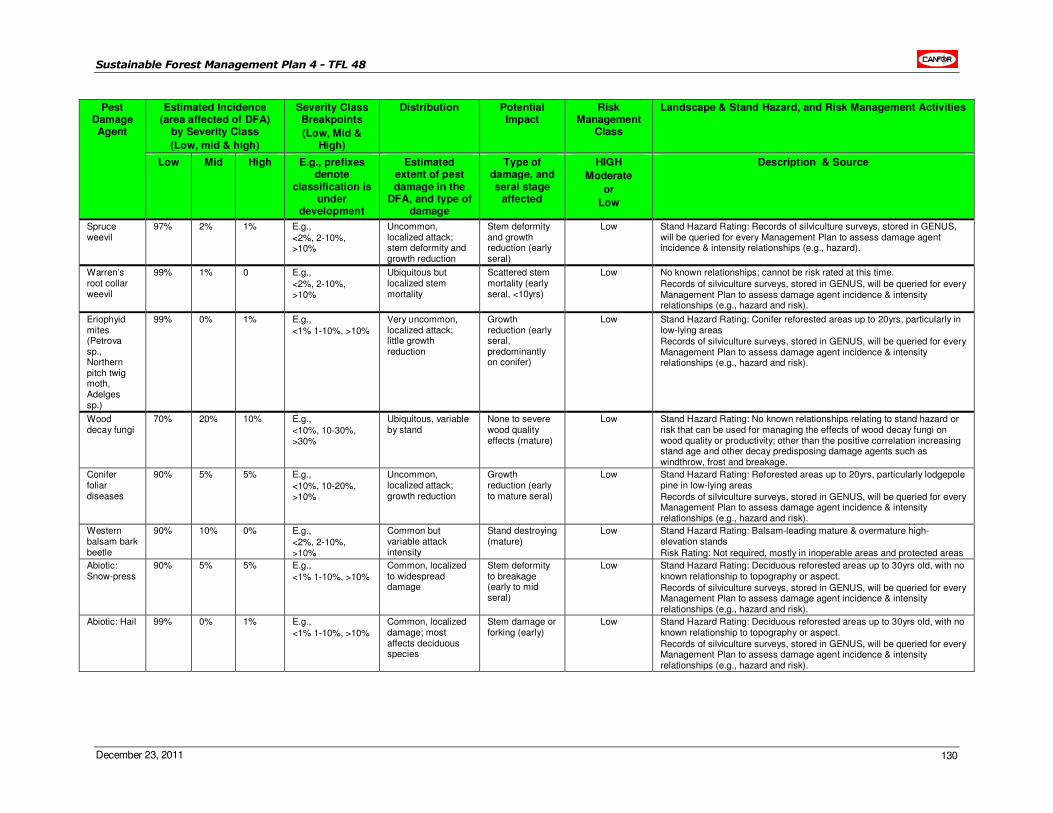
Sustainable Forest Management Plan 4 - TFL 48
December 23, 2011 130
Pest Damage Agent
Estimated Incidence (area affected of DFA)
by Severity Class
(Low, mid & high)
Severity Class Breakpoints
(Low, Mid & High)
Distribution Potential Impact
Risk Management
Class
Landscape & Stand Hazard, and Risk Management Activities
Low Mid High E.g., prefixes denote
classification is under
development
Estimated extent of pest damage in the
DFA, and type of damage
Type of damage, and seral stage
affected
HIGH
Moderate
or
Low
Description & Source
Spruce weevil
97% 2% 1% E.g.,
<2%, 2-10%, >10%
Uncommon, localized attack; stem deformity and growth reduction
Stem deformity and growth reduction (early seral)
Low Stand Hazard Rating: Records of silviculture surveys, stored in GENUS, will be queried for every Management Plan to assess damage agent incidence & intensity relationships (e.g., hazard).
Warren’s root collar weevil
99% 1% 0 E.g.,
<2%, 2-10%, >10%
Ubiquitous but localized stem mortality
Scattered stem mortality (early seral, <10yrs)
Low No known relationships; cannot be risk rated at this time.
Records of silviculture surveys, stored in GENUS, will be queried for every Management Plan to assess damage agent incidence & intensity relationships (e.g., hazard and risk).
Eriophyid mites (Petrova sp., Northern pitch twig moth, Adelges sp.)
99% 0% 1% E.g.,
<1% 1-10%, >10%
Very uncommon, localized attack; little growth reduction
Growth reduction (early seral, predominantly on conifer)
Low Stand Hazard Rating: Conifer reforested areas up to 20yrs, particularly in low-lying areas Records of silviculture surveys, stored in GENUS, will be queried for every Management Plan to assess damage agent incidence & intensity relationships (e.g., hazard and risk).
Wood decay fungi
70% 20% 10% E.g.,
<10%, 10-30%, >30%
Ubiquitous, variable by stand
None to severe wood quality effects (mature)
Low Stand Hazard Rating: No known relationships relating to stand hazard or risk that can be used for managing the effects of wood decay fungi on wood quality or productivity; other than the positive correlation increasing stand age and other decay predisposing damage agents such as windthrow, frost and breakage.
Conifer foliar diseases
90% 5% 5% E.g.,
<10%, 10-20%, >10%
Uncommon, localized attack; growth reduction
Growth reduction (early to mature seral)
Low Stand Hazard Rating: Reforested areas up to 20yrs, particularly lodgepole pine in low-lying areas
Records of silviculture surveys, stored in GENUS, will be queried for every Management Plan to assess damage agent incidence & intensity relationships (e.g., hazard and risk).
Western balsam bark beetle
90% 10% 0% E.g.,
<2%, 2-10%, >10%
Common but variable attack intensity
Stand destroying (mature)
Low Stand Hazard Rating: Balsam-leading mature & overmature high-elevation stands
Risk Rating: Not required, mostly in inoperable areas and protected areas
Abiotic: Snow-press
90% 5% 5% E.g.,
<1% 1-10%, >10%
Common, localized to widespread damage
Stem deformity to breakage (early to mid seral)
Low Stand Hazard Rating: Deciduous reforested areas up to 30yrs old, with no known relationship to topography or aspect.
Records of silviculture surveys, stored in GENUS, will be queried for every Management Plan to assess damage agent incidence & intensity relationships (e.g., hazard and risk).
Abiotic: Hail 99% 0% 1% E.g.,
<1% 1-10%, >10%
Common, localized damage; most affects deciduous species
Stem damage or forking (early)
Low Stand Hazard Rating: Deciduous reforested areas up to 30yrs old, with no known relationship to topography or aspect.
Records of silviculture surveys, stored in GENUS, will be queried for every Management Plan to assess damage agent incidence & intensity relationships (e.g., hazard and risk).
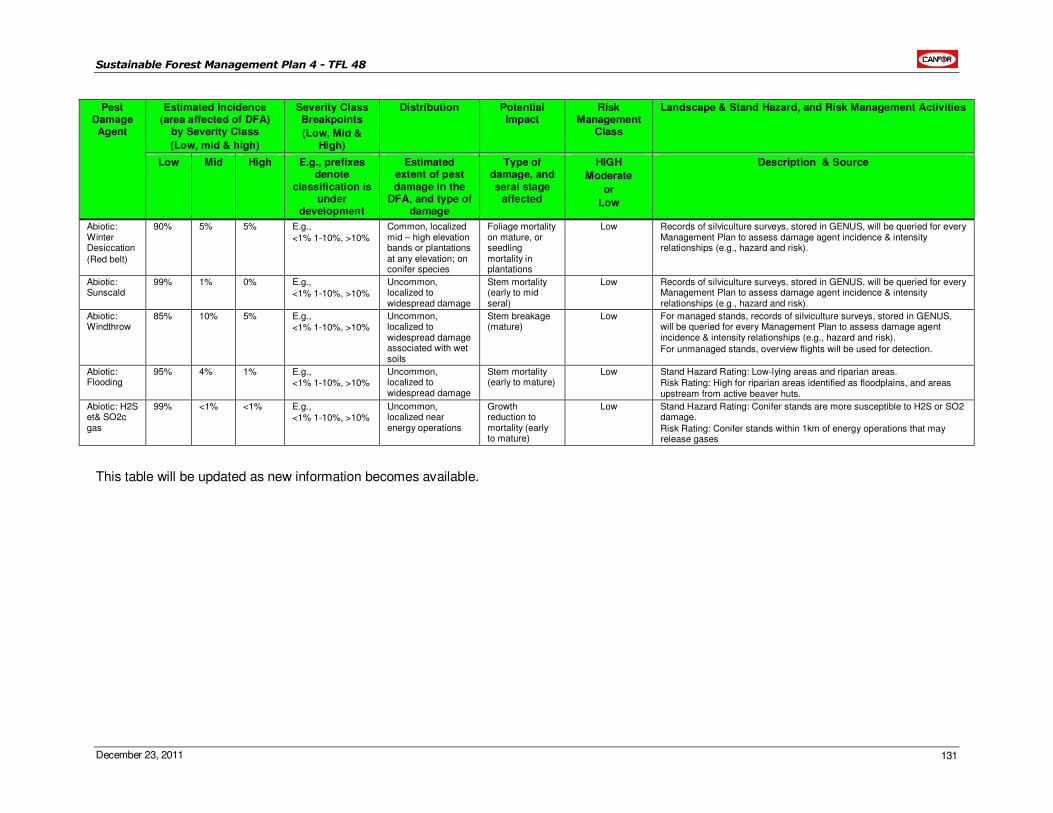
Sustainable Forest Management Plan 4 - TFL 48
December 23, 2011 131
Pest Damage Agent
Estimated Incidence (area affected of DFA)
by Severity Class
(Low, mid & high)
Severity Class Breakpoints
(Low, Mid & High)
Distribution Potential Impact
Risk Management
Class
Landscape & Stand Hazard, and Risk Management Activities
Low Mid High E.g., prefixes denote
classification is under
development
Estimated extent of pest damage in the
DFA, and type of damage
Type of damage, and seral stage
affected
HIGH
Moderate
or
Low
Description & Source
Abiotic: Winter Desiccation
(Red belt)
90% 5% 5% E.g.,
<1% 1-10%, >10%
Common, localized mid – high elevation bands or plantations at any elevation; on conifer species
Foliage mortality on mature, or seedling mortality in plantations
Low Records of silviculture surveys, stored in GENUS, will be queried for every Management Plan to assess damage agent incidence & intensity relationships (e.g., hazard and risk).
Abiotic: Sunscald
99% 1% 0% E.g.,
<1% 1-10%, >10%
Uncommon, localized to widespread damage
Stem mortality (early to mid seral)
Low Records of silviculture surveys, stored in GENUS, will be queried for every Management Plan to assess damage agent incidence & intensity relationships (e.g., hazard and risk).
Abiotic: Windthrow
85% 10% 5% E.g., <1% 1-10%, >10%
Uncommon, localized to widespread damage associated with wet soils
Stem breakage (mature)
Low For managed stands, records of silviculture surveys, stored in GENUS, will be queried for every Management Plan to assess damage agent incidence & intensity relationships (e.g., hazard and risk).
For unmanaged stands, overview flights will be used for detection.
Abiotic: Flooding
95% 4% 1% E.g., <1% 1-10%, >10%
Uncommon, localized to widespread damage
Stem mortality (early to mature)
Low Stand Hazard Rating: Low-lying areas and riparian areas. Risk Rating: High for riparian areas identified as floodplains, and areas upstream from active beaver huts.
Abiotic: H2S et& SO2c gas
99% <1% <1% E.g., <1% 1-10%, >10%
Uncommon, localized near energy operations
Growth reduction to mortality (early to mature)
Low Stand Hazard Rating: Conifer stands are more susceptible to H2S or SO2 damage.
Risk Rating: Conifer stands within 1km of energy operations that may release gases
This table will be updated as new information becomes available.
Sustainable Forest Management Plan 4 - TFL 48
December 23, 2011 132
We will maintain a detection and monitoring program for damaging agents that are not at epidemic levels or at pre-epidemic
8 levels over the land base by:
• continuing to conduct aerial and ground surveys in management zones in which forest operations will be proposed during the term of this plan if there is an identified forest health issue
• utilizing data from pest surveys conducted by the MoFR and Forestry Canada
• continue to operate a spruce beetle detection program
• following MoFR standards and guidelines for the prevention and control of Warren’s Root Collar Weevil, planting of alternate species and other control measures where required
• following accepted cultural practices in the control or eradication of root disease (e.g., Tomentosus root rot) as part of our silviculture program
• monitoring any increase in spruce weevil infestations
• developing models to identify high risk areas
• annually fly the DFA to determine where forest health concerns exist. A GPS coordinate will be taken of these points, so that they can be later mapped, and incorporated into our treatment plans
• where models are available, carry out hazard rating analysis to determine which stands are at the greatest risk for forest health disturbances
• ensure appropriate forest workers, consultants and industry staff, are competent at identifying specific forest health concerns within the DFA
• maintain a record of agent incidence and intensity
We will develop treatment plans for significant forest health events. Treatment plans will identify the location of the significant concern, and an implementation schedule for the proposed treatments. Treatment plans will be developed using forest health specialists as needed. Plans will consider the risk presented by the damaging agent, and the cost: benefits of a range of available options. Some of the more common options which may be employed are:
• relocating harvesting activities to meet forest health management requirements,
• pheromone baiting and lethal trap programs (trap trees in forested conditions, and lethal traps in mill yard conditions),
• incorporating forest health requirements into cutblock designs where necessary to prevent the development of forest health problems (e.g., cold air drainage for frost potential, or block design to minimize potential for windthrow),
• fill-planting or species conversion for plantation related problems,
• maintain natural ecological processes, if so warranted by the level of risk and cost/benefit analysis (the latter to be developed, as part of treatment plans).
The strategy of maintaining natural processes will be applied in some areas where there is little risk to adjacent stands. In these areas suppression (not including fire) and salvage activities will not occur in order to allow for natural stand initiating events to take place. Stand-initiating disturbances are those processes that largely terminate the existing forest stand and initiate secondary succession in order to produce a new stand. The disturbance agents are mostly wildfires, windstorms and, to a lesser extent, insects and landslides (Ministry of Forests, 1995). Disturbance and succession are the foundation for more complex processes that occur at higher levels of organization where interactions among organisms, and between organisms and their environment occur (Lindgren and Lewis, 1997). Many human activities have disrupted the way that natural disturbances help maintain healthy, sustainable ecosystems (Rocky Mountain Research Station, 1999). By allowing some natural disturbances to run their cycle on the Defined Forest Area, we are contributing to maintaining healthier, sustainable ecosystems.
General measures to be implemented for potential significant problems, for endemic and pre-endemic populations of disease and pests, depending on site conditions, are summarized in Table 43.
8 Pre-epidemic levels are defined as levels where without aggressive suppression activities, an epidemic may occur
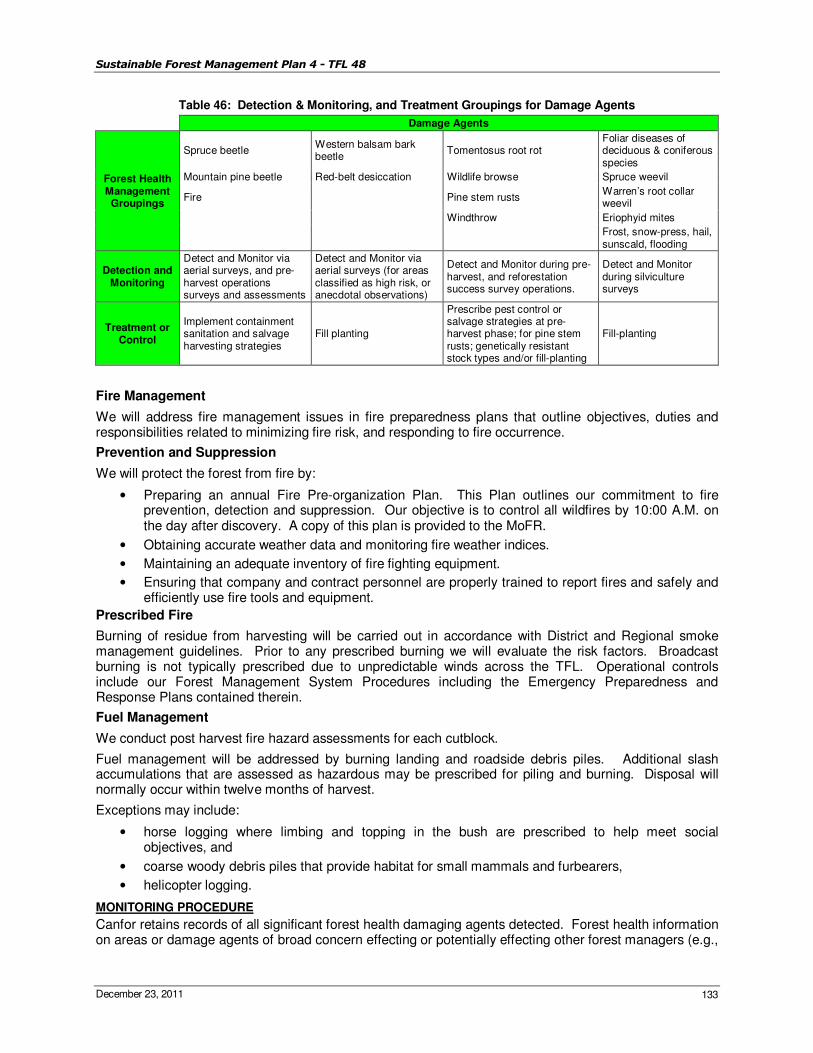
Sustainable Forest Management Plan 4 - TFL 48
December 23, 2011 133
Table 46: Detection & Monitoring, and Treatment Groupings for Damage Agents
Damage Agents
Forest Health Management Groupings
Spruce beetle Western balsam bark beetle
Tomentosus root rot Foliar diseases of deciduous & coniferous species
Mountain pine beetle Red-belt desiccation Wildlife browse Spruce weevil
Fire Pine stem rusts Warren’s root collar weevil
Windthrow Eriophyid mites
Frost, snow-press, hail, sunscald, flooding
Detection and Monitoring
Detect and Monitor via aerial surveys, and pre-harvest operations surveys and assessments
Detect and Monitor via aerial surveys (for areas classified as high risk, or anecdotal observations)
Detect and Monitor during pre-harvest, and reforestation success survey operations.
Detect and Monitor during silviculture surveys
Treatment or Control
Implement containment sanitation and salvage harvesting strategies
Fill planting
Prescribe pest control or salvage strategies at pre-harvest phase; for pine stem rusts; genetically resistant stock types and/or fill-planting
Fill-planting
Fire Management
We will address fire management issues in fire preparedness plans that outline objectives, duties and responsibilities related to minimizing fire risk, and responding to fire occurrence.
Prevention and Suppression
We will protect the forest from fire by:
• Preparing an annual Fire Pre-organization Plan. This Plan outlines our commitment to fire prevention, detection and suppression. Our objective is to control all wildfires by 10:00 A.M. on the day after discovery. A copy of this plan is provided to the MoFR.
• Obtaining accurate weather data and monitoring fire weather indices.
• Maintaining an adequate inventory of fire fighting equipment.
• Ensuring that company and contract personnel are properly trained to report fires and safely and efficiently use fire tools and equipment.
Prescribed Fire
Burning of residue from harvesting will be carried out in accordance with District and Regional smoke management guidelines. Prior to any prescribed burning we will evaluate the risk factors. Broadcast burning is not typically prescribed due to unpredictable winds across the TFL. Operational controls include our Forest Management System Procedures including the Emergency Preparedness and Response Plans contained therein.
Fuel Management
We conduct post harvest fire hazard assessments for each cutblock.
Fuel management will be addressed by burning landing and roadside debris piles. Additional slash accumulations that are assessed as hazardous may be prescribed for piling and burning. Disposal will normally occur within twelve months of harvest.
Exceptions may include:
• horse logging where limbing and topping in the bush are prescribed to help meet social objectives, and
• coarse woody debris piles that provide habitat for small mammals and furbearers,
• helicopter logging.
MONITORING PROCEDURE
Canfor retains records of all significant forest health damaging agents detected. Forest health information on areas or damage agents of broad concern effecting or potentially effecting other forest managers (e.g.,
Sustainable Forest Management Plan 4 - TFL 48
December 23, 2011 134
mountain pine beetle, spruce bark beetle) will be forwarded to the MoFR. Canfor will notify the MoFR following treatment action on high-risk damage agents. A summary of significant pest conditions and treatment plans will be presented in each annual report.
LINKAGES TO OPERATIONAL PLANS
Site level plans will identify significant forest health concerns and proposed treatment options. Forest Stewardship Plans are modified as needed to relocate harvesting to address forest health issues.
3.43 Proportion of Completed Forest Health Action Plans
Criterion 5: Element(s): 5.1
Economic and Social Benefits Timber and Non-Timber Benefits
CSA Core Indicator(s): 5.1.1 Quantity and quality of timber and non-timber benefits, products, and services produced in the DFA
Indicator Statement Target Statement
Proportion of required actions completed as per forest health treatment plans
100% of required actions will be completed as per forest health treatment plans
Value(s): Timber and Non-Timber Multi-Use Benefits
SFM Objective:
We will provide opportunities for a feasible mix of timber, recreational activities, visual quality, and non-timber commercial activities.
Linkage to TFL 48 Licence: For the purposes of sections 2.27(f) and (g) of the TFL 48 Licence this SFM Objective(s), Indicator Statement, Target Statement, Acceptable Variance, and Strategy and Implementation Schedule are submitted to the MoFR for approval.
Canfor common indicator statement: NA
ACCEPTABLE VARIANCE
Environmental constraints such as road/bridge wash outs may make action plans unachievable.
WHAT IS THIS INDICATOR AND WHY IS IT IMPORTANT?
This indicator will ensure that treatment plans are implemented in a timely manner to address significant forest health issues.
CURRENT STATUS
Managed Stands
The following activities are applied on the TFL to minimize negative impacts from forest health factors:
• Fill-planting is the most commonly applied treatment for damage to plantations from forest health factors.
• During brushing and spacing activities, crews are advised to remove crop trees at a level that prevents them from being free growing.
• For blocks with known Tomentosus issues, planting crews are advised keep trees away from stumps to avoid inoculation.
Unmanaged Stands
Mountain Pine Beetle is currently the greatest forest health threat to our unmanaged stands. Detection was in February 2004. All actions taken to date to suppress the population are as follows:
• Aerial detection (Blocks 4 and 5 of the TFL)
• Probing
• Fall and burn (2917 trees)
• Shifting harvesting plans to ensure infested wood and susceptible wood is targeted for harvest
• Emergence study to determine peak flight, so that appropriate hauling arrangements can be made
Sustainable Forest Management Plan 4 - TFL 48
December 23, 2011 135
• Log yard pheromone studies to determine the amount of beetle that flies from the log decks
• Baiting to concentrate Mountain Pine Beetle in areas that are scheduled for harvest
• Joint effort with other licensees to suppress populations
Blowdown, Spruce Bark Beetle and fire are the next significant forest health factors affecting the DFA. Harvesting is currently the most commonly applied treatment and control for protecting mature timber inventories from these factors, as it is the most effective and economical means of management.
FORECASTING ASSUMPTIONS AND ANALYTICAL METHODS
• Does forecasting apply (y/n)? No
STRATEGY AND IMPLEMENTATION SCHEDULE
Managed stands
The extent of forest health damaging agents will be determined during Silviculture surveys. Surveys will occur by the schedule set out in Genus by the Silviculture Forester. Fill planting will be used to restock sites that fall below acceptable stocking levels. Fill planting activities will be scheduled in Genus by the Silviculture Forester.
Brushing or thinning treatments will be determined during the silviculture survey. The survey will note any rust issues, and will be recorded in Genus. Depending on the extent of the forest health factor, the Silviculture Forester will decide if sanitation will be done in conjunction with the brushing or thinning treatments.
Unmanaged Stands
Once significant forest health factors are detected in unmanaged stands, they will be recorded in our forest health treatment plan database. This database will be started in the fall of 2005 after the overview flights for Mountain Pine Beetle are complete.
MONITORING PROCEDURE
The status of implementation will be monitored annually to ensure that we meet our 100% obligation for treatment plan actions.
LINKAGES TO OPERATIONAL PLANS
Site plans will identify significant forest health concerns and prescribed treatment plans.
3.44 Community Donations
Criterion 5: Element(s): 5.2
Economic and Social Benefits Communities and Sustainability
CSA Core Indicator(s): 5.2.1 Level of investment in initiatives that contribute to community sustainability
Indicator Statement Target Statement
Canfor community donations per year A minimum of $7,000/year will be made available for community donations
Value(s): Local Employment
SFM Objective:
We will ensure local communities and contractors have the opportunity to share in benefits such as jobs, contracts and sales.
Linkage to TFL 48 Licence: N/A
Canfor common indicator statement: NA
ACCEPTABLE VARIANCE
No less than 95% of the target will be achieved. This indicator is only applicable to Canfor.
WHAT IS THIS INDICATOR AND WHY IS IT IMPORTANT?
At Canfor, we have a long tradition of investing in the communities that we call home. Canfor's Corporate Sponsorship and Donation Program serves as the principal funding entity for the company's charitable

Sustainable Forest Management Plan 4 - TFL 48
December 23, 2011 136
contributions. The program approves and allocates funding for organizations and events in an equitable manner in communities where we operate.
Canfor's Sponsorship & Donations program funds charitable organizations that deliver innovative community programs focusing on:
• Youth and Education
• Community Enhancement
• Forestry and Environment
• Amateur Sports
• Health and Wellness
The amount of money donated to local causes, scholarships and charities is a quantifiable measure of the amount of financial support provided to a community outside of the major contributions of employment and taxes.
In addition to those locally quantifiable donations that Canfor makes there are other larger though less quantifiable donations that Canfor makes at the regional level which provide a benefit to the residents of the region as a whole however is not reported on in this indicator. These include donations or sponsorship of things like the Medical facility at UNBC or larger corporate donations through the United Way and the Salvation Army – BC North and Yukon.
CURRENT STATUS
This indicator has not been met in 2007, 2008, and 2010 and was suspended in 2009 due to shutdown of the operations.
FORECASTING ASSUMPTIONS AND ANALYTICAL METHODS
• Does forecasting apply (y/n)? No
STRATEGY AND IMPLEMENTATION SCHEDULE
As individuals receive requests, or have ideas for donations, requests are made to the plant manager for approval.
The target level is reviewed and may be adjusted annually.
MONITORING PROCEDURE
Once approved, a record of the donation is made and tracked. Progress towards the target is monitored periodically through-out the year to ensure the target is achieved by year end.
LINKAGES TO OPERATIONAL PLANS
Not applicable.
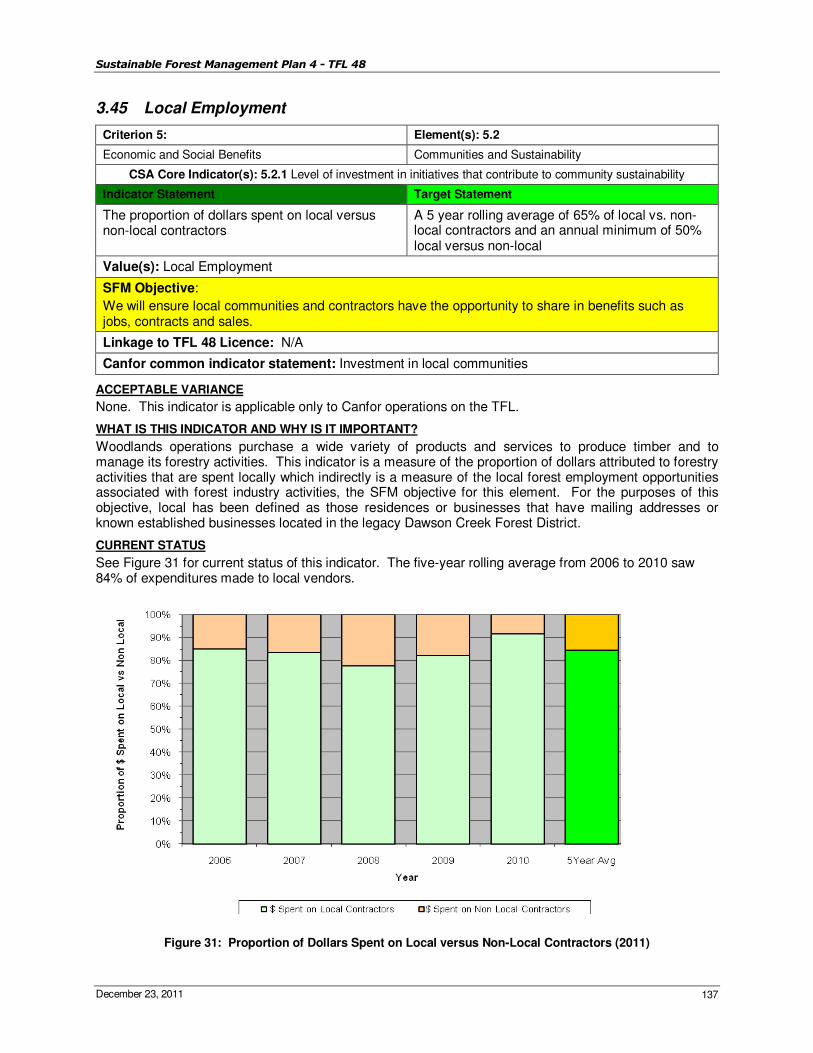
Sustainable Forest Management Plan 4 - TFL 48
December 23, 2011 137
3.45 Local Employment
Criterion 5: Element(s): 5.2
Economic and Social Benefits Communities and Sustainability
CSA Core Indicator(s): 5.2.1 Level of investment in initiatives that contribute to community sustainability
Indicator Statement Target Statement
The proportion of dollars spent on local versus non-local contractors
A 5 year rolling average of 65% of local vs. non-local contractors and an annual minimum of 50% local versus non-local
Value(s): Local Employment
SFM Objective:
We will ensure local communities and contractors have the opportunity to share in benefits such as jobs, contracts and sales.
Linkage to TFL 48 Licence: N/A
Canfor common indicator statement: Investment in local communities
ACCEPTABLE VARIANCE
None. This indicator is applicable only to Canfor operations on the TFL.
WHAT IS THIS INDICATOR AND WHY IS IT IMPORTANT?
Woodlands operations purchase a wide variety of products and services to produce timber and to manage its forestry activities. This indicator is a measure of the proportion of dollars attributed to forestry activities that are spent locally which indirectly is a measure of the local forest employment opportunities associated with forest industry activities, the SFM objective for this element. For the purposes of this objective, local has been defined as those residences or businesses that have mailing addresses or known established businesses located in the legacy Dawson Creek Forest District.
CURRENT STATUS
See Figure 31 for current status of this indicator. The five-year rolling average from 2006 to 2010 saw 84% of expenditures made to local vendors.
Figure 31: Proportion of Dollars Spent on Local versus Non-Local Contractors (2011)
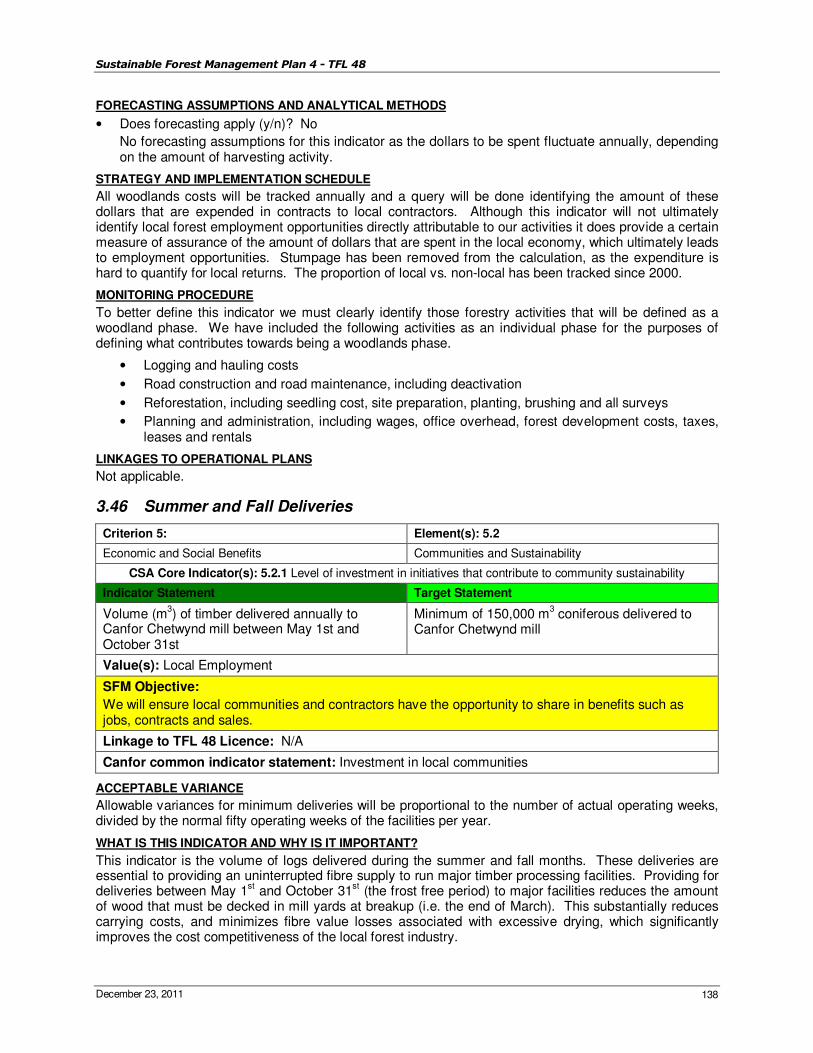
Sustainable Forest Management Plan 4 - TFL 48
December 23, 2011 138
FORECASTING ASSUMPTIONS AND ANALYTICAL METHODS
• Does forecasting apply (y/n)? No
No forecasting assumptions for this indicator as the dollars to be spent fluctuate annually, depending on the amount of harvesting activity.
STRATEGY AND IMPLEMENTATION SCHEDULE
All woodlands costs will be tracked annually and a query will be done identifying the amount of these dollars that are expended in contracts to local contractors. Although this indicator will not ultimately identify local forest employment opportunities directly attributable to our activities it does provide a certain measure of assurance of the amount of dollars that are spent in the local economy, which ultimately leads to employment opportunities. Stumpage has been removed from the calculation, as the expenditure is hard to quantify for local returns. The proportion of local vs. non-local has been tracked since 2000.
MONITORING PROCEDURE
To better define this indicator we must clearly identify those forestry activities that will be defined as a woodland phase. We have included the following activities as an individual phase for the purposes of defining what contributes towards being a woodlands phase.
• Logging and hauling costs
• Road construction and road maintenance, including deactivation
• Reforestation, including seedling cost, site preparation, planting, brushing and all surveys
• Planning and administration, including wages, office overhead, forest development costs, taxes, leases and rentals
LINKAGES TO OPERATIONAL PLANS
Not applicable.
3.46 Summer and Fall Deliveries
Criterion 5: Element(s): 5.2
Economic and Social Benefits Communities and Sustainability
CSA Core Indicator(s): 5.2.1 Level of investment in initiatives that contribute to community sustainability
Indicator Statement Target Statement
Volume (m3) of timber delivered annually to
Canfor Chetwynd mill between May 1st and October 31st
Minimum of 150,000 m3 coniferous delivered to
Canfor Chetwynd mill
Value(s): Local Employment
SFM Objective:
We will ensure local communities and contractors have the opportunity to share in benefits such as jobs, contracts and sales.
Linkage to TFL 48 Licence: N/A
Canfor common indicator statement: Investment in local communities
ACCEPTABLE VARIANCE
Allowable variances for minimum deliveries will be proportional to the number of actual operating weeks, divided by the normal fifty operating weeks of the facilities per year.
WHAT IS THIS INDICATOR AND WHY IS IT IMPORTANT?
This indicator is the volume of logs delivered during the summer and fall months. These deliveries are essential to providing an uninterrupted fibre supply to run major timber processing facilities. Providing for deliveries between May 1
st and October 31
st (the frost free period) to major facilities reduces the amount
of wood that must be decked in mill yards at breakup (i.e. the end of March). This substantially reduces carrying costs, and minimizes fibre value losses associated with excessive drying, which significantly improves the cost competitiveness of the local forest industry.

Sustainable Forest Management Plan 4 - TFL 48
December 23, 2011 139
These deliveries provide summer employment opportunities, which increase the length of the work season for harvesting and road contractors. This improves the contractor’s efficiency, and supports more stable employment, thereby also contributing to the stability of local communities.
Variances to the target are required to reflect situations where facilities may be closed for reasons other than lack of fibre supply.
CURRENT STATUS
In 2010, the volume delivered between May 1 and October 31 was 172,420m3. In 2008 and 2009 this
indicator was suspended due to shutdown in operations and previous to the shutdown there has been consistent achievement of this target.
FORECASTING ASSUMPTIONS AND ANALYTICAL METHODS
• Does forecasting apply (y/n)? No
STRATEGY AND IMPLEMENTATION SCHEDULE
Areas that are suitable for harvesting operations during frost free conditions are relatively limited within the TFL. Harvest planning therefore needs to emphasize the identification and development of these areas.
Implementing this strategy will require careful assessment of all areas that may have potential for summer or fall logging, the identification of potential constraints, and development scheduling to support this strategy accordingly. Management practices on areas planned for summer harvesting will be implemented to ensure site productivity is not compromised by this strategy. Proposed blocks will be assessed to determine if moisture regime, soil conditions, and access opportunities are potentially conducive to operations during frost free periods. In potential summer or fall harvest areas, the following measures will be implemented to minimize environmental risks.
Careful monitoring of ongoing operations will determine when ground conditions become unfavourable due to excessive moisture, at which time harvesting operations will cease until conditions dry out.
Low ground pressure equipment will be used on fine textured soils to reduce compaction risks. This requirement will not apply when sufficient frost conditions or a compressible snow pack exists to prevent compaction.
“Boot survey” ocular site degradation assessments will be implemented where and when needed to monitor site degradation and provide guidance on when to cease operations.
Streams and wet areas will be identified, and measures identified in SP’s to protect these areas during summer harvest conditions will be implemented.
If the access conditions are favourable, but site conditions preclude summer harvesting activities on the block, timber may be winter logged and decked in the block on landings or at roadside for summer load and haul.
MONITORING PROCEDURE
The volume delivered to the mills from May 1 to October 31 of each year will be determined from company scale information and reported in annual reports, along with information on the number of weeks of mill operations.
LINKAGES TO OPERATIONAL PLANS
The location of blocks identified in the FDP will, among other criteria, be based on the potential for summer harvesting. The proposed target volumes will provide guidance to the development of these plans.
SP’s will note site conditions and the relative opportunities for summer harvesting or hauling in cutblocks, as well as identify potential issues to consider when determining if summer harvesting is feasible.
Annual harvesting plans will utilize information in these plans to assign season and year of harvest to blocks.
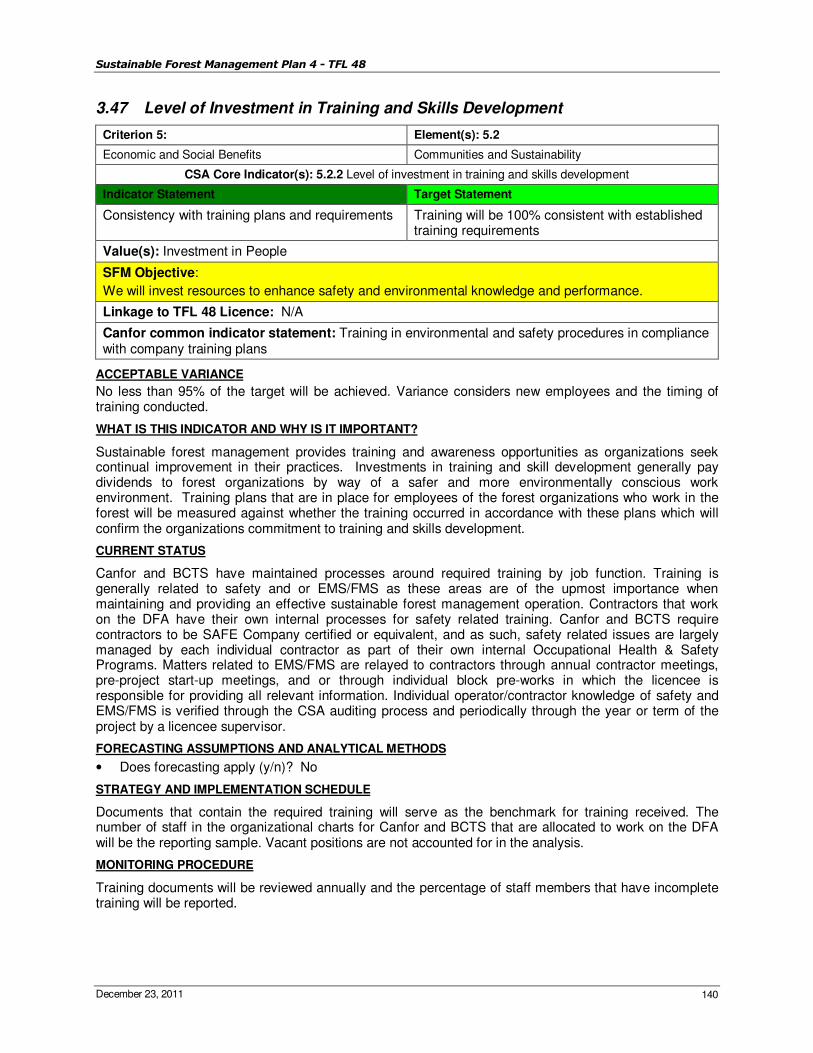
Sustainable Forest Management Plan 4 - TFL 48
December 23, 2011 140
3.47 Level of Investment in Training and Skills Development
Criterion 5: Element(s): 5.2
Economic and Social Benefits Communities and Sustainability
CSA Core Indicator(s): 5.2.2 Level of investment in training and skills development
Indicator Statement Target Statement
Consistency with training plans and requirements Training will be 100% consistent with established training requirements
Value(s): Investment in People
SFM Objective:
We will invest resources to enhance safety and environmental knowledge and performance.
Linkage to TFL 48 Licence: N/A
Canfor common indicator statement: Training in environmental and safety procedures in compliance with company training plans
ACCEPTABLE VARIANCE
No less than 95% of the target will be achieved. Variance considers new employees and the timing of training conducted.
WHAT IS THIS INDICATOR AND WHY IS IT IMPORTANT?
Sustainable forest management provides training and awareness opportunities as organizations seek continual improvement in their practices. Investments in training and skill development generally pay dividends to forest organizations by way of a safer and more environmentally conscious work environment. Training plans that are in place for employees of the forest organizations who work in the forest will be measured against whether the training occurred in accordance with these plans which will confirm the organizations commitment to training and skills development.
CURRENT STATUS
Canfor and BCTS have maintained processes around required training by job function. Training is generally related to safety and or EMS/FMS as these areas are of the upmost importance when maintaining and providing an effective sustainable forest management operation. Contractors that work on the DFA have their own internal processes for safety related training. Canfor and BCTS require contractors to be SAFE Company certified or equivalent, and as such, safety related issues are largely managed by each individual contractor as part of their own internal Occupational Health & Safety Programs. Matters related to EMS/FMS are relayed to contractors through annual contractor meetings, pre-project start-up meetings, and or through individual block pre-works in which the licencee is responsible for providing all relevant information. Individual operator/contractor knowledge of safety and EMS/FMS is verified through the CSA auditing process and periodically through the year or term of the project by a licencee supervisor.
FORECASTING ASSUMPTIONS AND ANALYTICAL METHODS
• Does forecasting apply (y/n)? No
STRATEGY AND IMPLEMENTATION SCHEDULE
Documents that contain the required training will serve as the benchmark for training received. The number of staff in the organizational charts for Canfor and BCTS that are allocated to work on the DFA will be the reporting sample. Vacant positions are not accounted for in the analysis.
MONITORING PROCEDURE
Training documents will be reviewed annually and the percentage of staff members that have incomplete training will be reported.
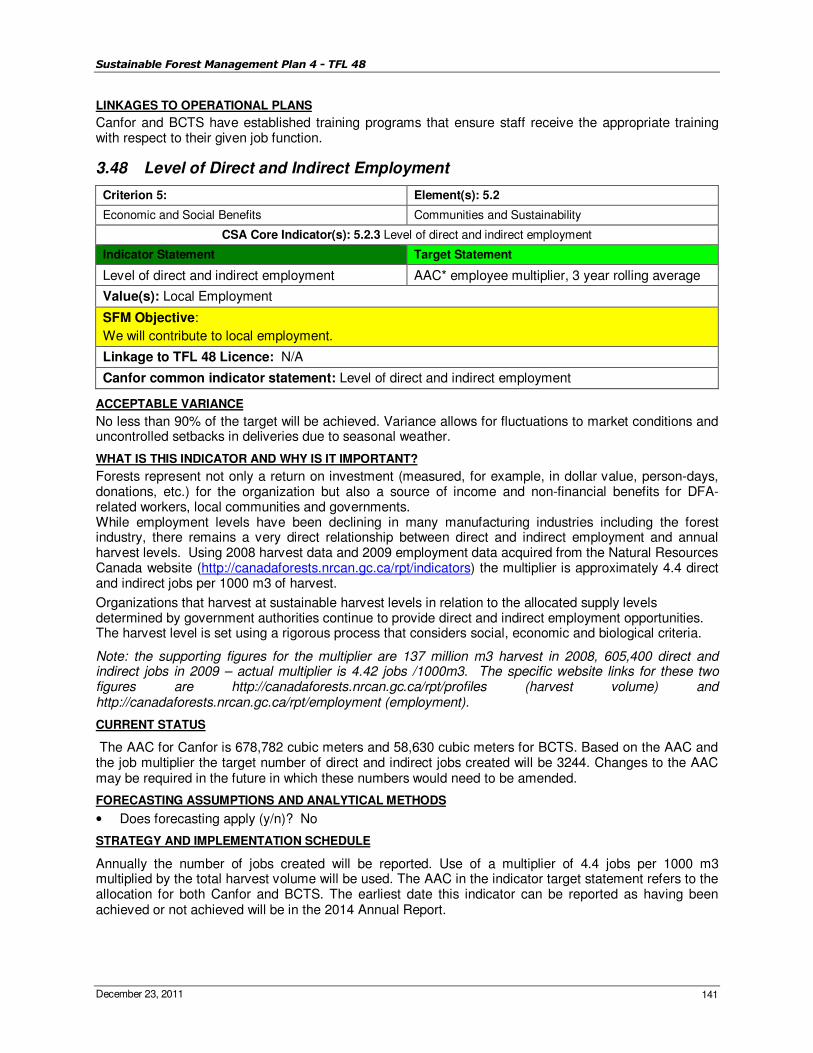
Sustainable Forest Management Plan 4 - TFL 48
December 23, 2011 141
LINKAGES TO OPERATIONAL PLANS
Canfor and BCTS have established training programs that ensure staff receive the appropriate training with respect to their given job function.
3.48 Level of Direct and Indirect Employment
Criterion 5: Element(s): 5.2
Economic and Social Benefits Communities and Sustainability
CSA Core Indicator(s): 5.2.3 Level of direct and indirect employment
Indicator Statement Target Statement
Level of direct and indirect employment AAC* employee multiplier, 3 year rolling average
Value(s): Local Employment
SFM Objective:
We will contribute to local employment.
Linkage to TFL 48 Licence: N/A
Canfor common indicator statement: Level of direct and indirect employment
ACCEPTABLE VARIANCE
No less than 90% of the target will be achieved. Variance allows for fluctuations to market conditions and uncontrolled setbacks in deliveries due to seasonal weather.
WHAT IS THIS INDICATOR AND WHY IS IT IMPORTANT?
Forests represent not only a return on investment (measured, for example, in dollar value, person-days, donations, etc.) for the organization but also a source of income and non-financial benefits for DFA-related workers, local communities and governments. While employment levels have been declining in many manufacturing industries including the forest industry, there remains a very direct relationship between direct and indirect employment and annual harvest levels. Using 2008 harvest data and 2009 employment data acquired from the Natural Resources Canada website (http://canadaforests.nrcan.gc.ca/rpt/indicators) the multiplier is approximately 4.4 direct and indirect jobs per 1000 m3 of harvest.
Organizations that harvest at sustainable harvest levels in relation to the allocated supply levels determined by government authorities continue to provide direct and indirect employment opportunities. The harvest level is set using a rigorous process that considers social, economic and biological criteria.
Note: the supporting figures for the multiplier are 137 million m3 harvest in 2008, 605,400 direct and indirect jobs in 2009 – actual multiplier is 4.42 jobs /1000m3. The specific website links for these two figures are http://canadaforests.nrcan.gc.ca/rpt/profiles (harvest volume) and http://canadaforests.nrcan.gc.ca/rpt/employment (employment).
CURRENT STATUS
The AAC for Canfor is 678,782 cubic meters and 58,630 cubic meters for BCTS. Based on the AAC and the job multiplier the target number of direct and indirect jobs created will be 3244. Changes to the AAC may be required in the future in which these numbers would need to be amended.
FORECASTING ASSUMPTIONS AND ANALYTICAL METHODS
• Does forecasting apply (y/n)? No
STRATEGY AND IMPLEMENTATION SCHEDULE
Annually the number of jobs created will be reported. Use of a multiplier of 4.4 jobs per 1000 m3 multiplied by the total harvest volume will be used. The AAC in the indicator target statement refers to the allocation for both Canfor and BCTS. The earliest date this indicator can be reported as having been achieved or not achieved will be in the 2014 Annual Report.
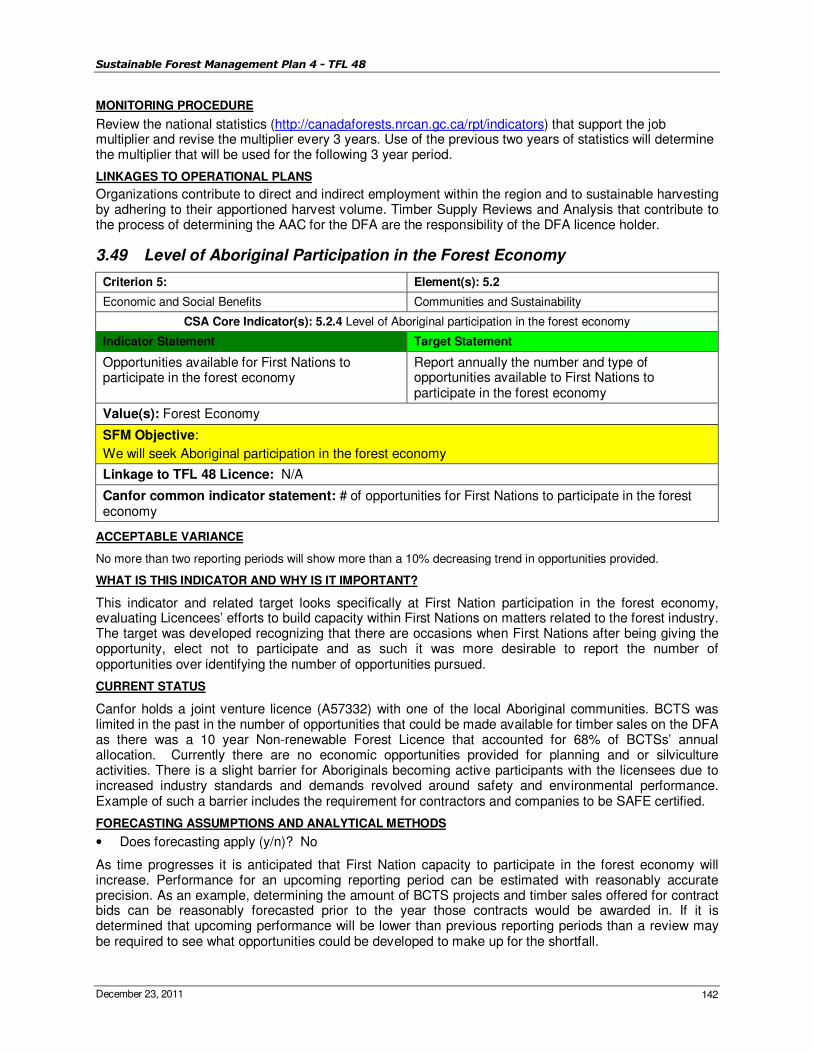
Sustainable Forest Management Plan 4 - TFL 48
December 23, 2011 142
MONITORING PROCEDURE
Review the national statistics (http://canadaforests.nrcan.gc.ca/rpt/indicators) that support the job multiplier and revise the multiplier every 3 years. Use of the previous two years of statistics will determine the multiplier that will be used for the following 3 year period.
LINKAGES TO OPERATIONAL PLANS
Organizations contribute to direct and indirect employment within the region and to sustainable harvesting by adhering to their apportioned harvest volume. Timber Supply Reviews and Analysis that contribute to the process of determining the AAC for the DFA are the responsibility of the DFA licence holder.
3.49 Level of Aboriginal Participation in the Forest Economy
Criterion 5: Element(s): 5.2
Economic and Social Benefits Communities and Sustainability
CSA Core Indicator(s): 5.2.4 Level of Aboriginal participation in the forest economy
Indicator Statement Target Statement
Opportunities available for First Nations to participate in the forest economy
Report annually the number and type of opportunities available to First Nations to participate in the forest economy
Value(s): Forest Economy
SFM Objective:
We will seek Aboriginal participation in the forest economy
Linkage to TFL 48 Licence: N/A
Canfor common indicator statement: # of opportunities for First Nations to participate in the forest economy
ACCEPTABLE VARIANCE
No more than two reporting periods will show more than a 10% decreasing trend in opportunities provided.
WHAT IS THIS INDICATOR AND WHY IS IT IMPORTANT?
This indicator and related target looks specifically at First Nation participation in the forest economy, evaluating Licencees’ efforts to build capacity within First Nations on matters related to the forest industry. The target was developed recognizing that there are occasions when First Nations after being giving the opportunity, elect not to participate and as such it was more desirable to report the number of opportunities over identifying the number of opportunities pursued.
CURRENT STATUS
Canfor holds a joint venture licence (A57332) with one of the local Aboriginal communities. BCTS was limited in the past in the number of opportunities that could be made available for timber sales on the DFA as there was a 10 year Non-renewable Forest Licence that accounted for 68% of BCTSs’ annual allocation. Currently there are no economic opportunities provided for planning and or silviculture activities. There is a slight barrier for Aboriginals becoming active participants with the licensees due to increased industry standards and demands revolved around safety and environmental performance. Example of such a barrier includes the requirement for contractors and companies to be SAFE certified.
FORECASTING ASSUMPTIONS AND ANALYTICAL METHODS
• Does forecasting apply (y/n)? No
As time progresses it is anticipated that First Nation capacity to participate in the forest economy will increase. Performance for an upcoming reporting period can be estimated with reasonably accurate precision. As an example, determining the amount of BCTS projects and timber sales offered for contract bids can be reasonably forecasted prior to the year those contracts would be awarded in. If it is determined that upcoming performance will be lower than previous reporting periods than a review may be required to see what opportunities could be developed to make up for the shortfall.

Sustainable Forest Management Plan 4 - TFL 48
December 23, 2011 143
STRATEGY AND IMPLEMENTATION SCHEDULE
Annually the number of BCTS timber sales that are put up for sale on the DFA will be reported. BCTS will also report out on the number of opportunities provided for the silviculture contracts for works issued on the DFA. Canfor will report out the number of opportunities provided in all aspects of economic opportunity. The total number of opportunities in which Aboriginals were able to participate in the forest economy will also be reported on annually but will be for information purposes only.
MONITORING PROCEDURE
Annual Reports will indicate the level of performance for the following year. Assessment of the expected number of opportunities provided by both BCTS and Canfor may be done prior to a new fiscal year and beginning of the new reporting period.
LINKAGES TO OPERATIONAL PLANS
Silviculture and harvesting activities/plans can incorporate the use of First Nation contractors where feasible.
3.50 First Nations Awareness Training
Criterion 6: Element(s): 6.1
Society’s Responsibility Aboriginal and Treaty Rights
CSA Core Indicator(s): 6.1.1 Evidence of a good understanding of the nature of Aboriginal title and rights
Indicator Statement Target Statement
First Nations awareness training. 100% of Canfor and BCTS staff involved with First Nations shall receive First Nations awareness training.
Value(s): Treaty and Aboriginal Rights
SFM Objective:
We will recognize and respect Treaty 8 Rights.
Linkage to TFL 48 Licence: N/A
Canfor common indicator statement: Employees will receive First Nations awareness training
ACCEPTABLE VARIANCE
No less than 90% of staff will have received training to achieve the indicator and target. Variance accounts for new hires and the timing training is conducted.
WHAT IS THIS INDICATOR AND WHY IS IT IMPORTANT?
Section 35 of the Constitution Act states “The existing aboriginal and treaty rights of Aboriginal Peoples of Canada are hereby recognized and affirmed”. Some examples of the rights that Section 35 has been found to protect include hunting, fishing, trapping, gathering, sacred and spiritual practices, and title. SFM requirements are not in any way intended to define, limit, interpret, or prejudice ongoing or future discussions and negotiations regarding these legal rights and do not stipulate how to deal with Aboriginal title and rights, and treaty rights.
The first step toward respecting Aboriginal title and rights, and treaty rights is compliance with the law. Section 7.3.3 of the CSA Z809 Standard reinforces legal requirements for many reasons, including the reality that demonstrating respect for Aboriginal title and rights, and treaty rights can be challenging in Canada’s fluid legislative landscape and therefore it is important to identify these legal requirements as a starting point. It is important for companies to have an understanding of applicable Aboriginal title and rights, and treaty rights, as well as the Aboriginal interests that relate to the DFA.
Both the desire of licencees to comply with laws and open communication with local First Nations requires that company staff members have a good understanding of Aboriginal title and rights and treaty rights.
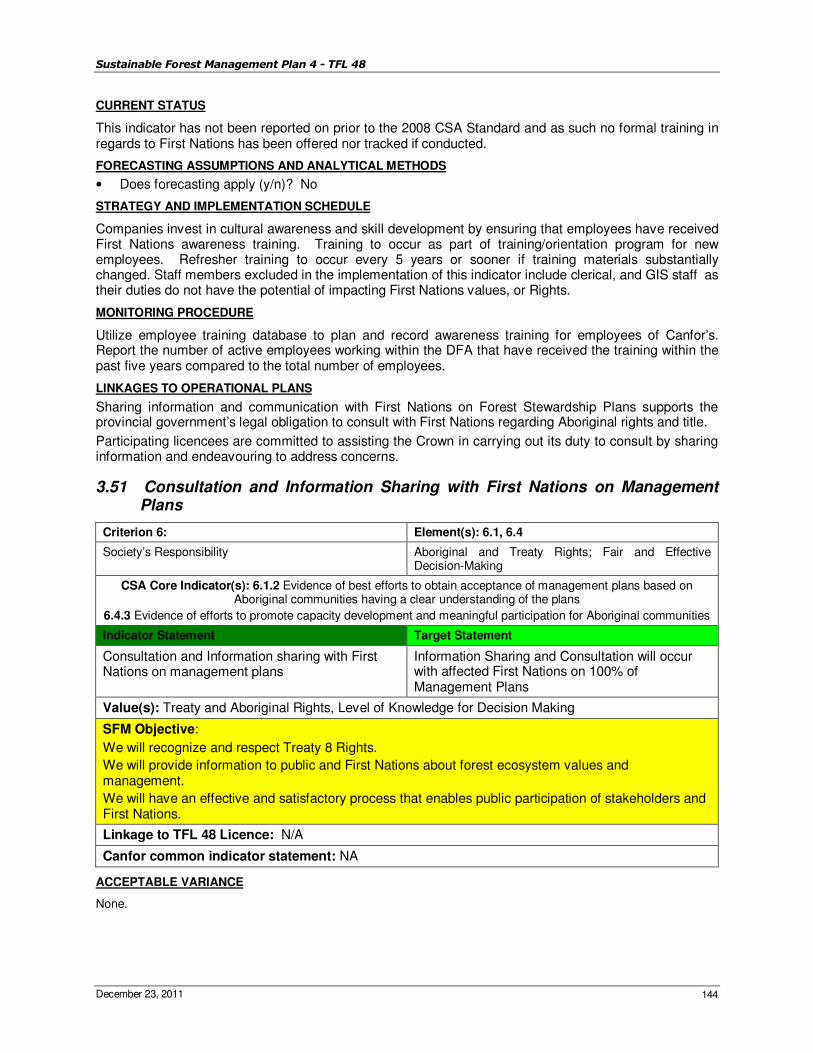
Sustainable Forest Management Plan 4 - TFL 48
December 23, 2011 144
CURRENT STATUS
This indicator has not been reported on prior to the 2008 CSA Standard and as such no formal training in regards to First Nations has been offered nor tracked if conducted.
FORECASTING ASSUMPTIONS AND ANALYTICAL METHODS
• Does forecasting apply (y/n)? No
STRATEGY AND IMPLEMENTATION SCHEDULE
Companies invest in cultural awareness and skill development by ensuring that employees have received First Nations awareness training. Training to occur as part of training/orientation program for new employees. Refresher training to occur every 5 years or sooner if training materials substantially changed. Staff members excluded in the implementation of this indicator include clerical, and GIS staff as their duties do not have the potential of impacting First Nations values, or Rights.
MONITORING PROCEDURE
Utilize employee training database to plan and record awareness training for employees of Canfor’s. Report the number of active employees working within the DFA that have received the training within the past five years compared to the total number of employees.
LINKAGES TO OPERATIONAL PLANS
Sharing information and communication with First Nations on Forest Stewardship Plans supports the provincial government’s legal obligation to consult with First Nations regarding Aboriginal rights and title.
Participating licencees are committed to assisting the Crown in carrying out its duty to consult by sharing information and endeavouring to address concerns.
3.51 Consultation and Information Sharing with First Nations on Management Plans
Criterion 6: Element(s): 6.1, 6.4
Society’s Responsibility Aboriginal and Treaty Rights; Fair and Effective Decision-Making
CSA Core Indicator(s): 6.1.2 Evidence of best efforts to obtain acceptance of management plans based on Aboriginal communities having a clear understanding of the plans
6.4.3 Evidence of efforts to promote capacity development and meaningful participation for Aboriginal communities
Indicator Statement Target Statement
Consultation and Information sharing with First Nations on management plans
Information Sharing and Consultation will occur with affected First Nations on 100% of Management Plans
Value(s): Treaty and Aboriginal Rights, Level of Knowledge for Decision Making
SFM Objective:
We will recognize and respect Treaty 8 Rights.
We will provide information to public and First Nations about forest ecosystem values and management.
We will have an effective and satisfactory process that enables public participation of stakeholders and First Nations.
Linkage to TFL 48 Licence: N/A
Canfor common indicator statement: NA
ACCEPTABLE VARIANCE
None.
Sustainable Forest Management Plan 4 - TFL 48
December 23, 2011 145
WHAT IS THIS INDICATOR AND WHY IS IT IMPORTANT?
Open, respectful communication with local First Nations includes not only the organization understanding the First Nations rights and interests but for First Nations to understand the forest management plans of organizations. Making those plans available to First Nations for review allows them to have a better understanding of forest management practices enabling them to make informed decisions and review comments.
CURRENT STATUS
The Forest Stewardship Plan (2007-2012) has gone through the consultation process prior to its approval by government. This SFMP which also serves as the Tree Farm Licence Management Plan have also been through a public review process which included First Nations participation. Annual Management Plans that are made available to First Nations for information sharing include the Notification of Intent to Treat (NIT) for herbicide applications; the Annual Operating Plan(s) (AOP) for proposed cutblocks, and; the SFMP Annual Report.
FORECASTING ASSUMPTIONS AND ANALYTICAL METHODS
• Does forecasting apply (y/n)? No
STRATEGY AND IMPLEMENTATION SCHEDULE
Consultation and public review processes are largely determined through various Acts and Regulations which apply to any particular Management Plan. Timing of referrals along with referral duration are all pre-determined in forest legislation. Canfor is the primary holder of the various Management Plans that pertain to the DFA and therefore are largely responsible for ensuring those plans are consulted on to the appropriate standard. Not all management plans will require annual review, such as the FSP, therefore only management plans where consultation/information sharing is required to occur will constitute a plan that is applicable to meet the target. Information sharing will occur with designated representatives such as Forest Managers from each First Nations community that falls within the DFA or is impacted by the activities carried out on it.
MONITORING PROCEDURE
Canfor utilizes a web-based application called COPI to track public correspondence. COPI will be utilized to identify which stakeholders were consulted with.
LINKAGES TO OPERATIONAL PLANS
The Forest Stewardship Plan (FSP), Tree Farm Licence Management Plan (MP), Sustainable Forest Management Plan (SFMP), SFMP Annual Report, Pest Management Plan (PMP), Notification of Intent to Treat (NIT), and Annual Operating Plan (AOP) are the plans that will be shared with affected First Nation communities.
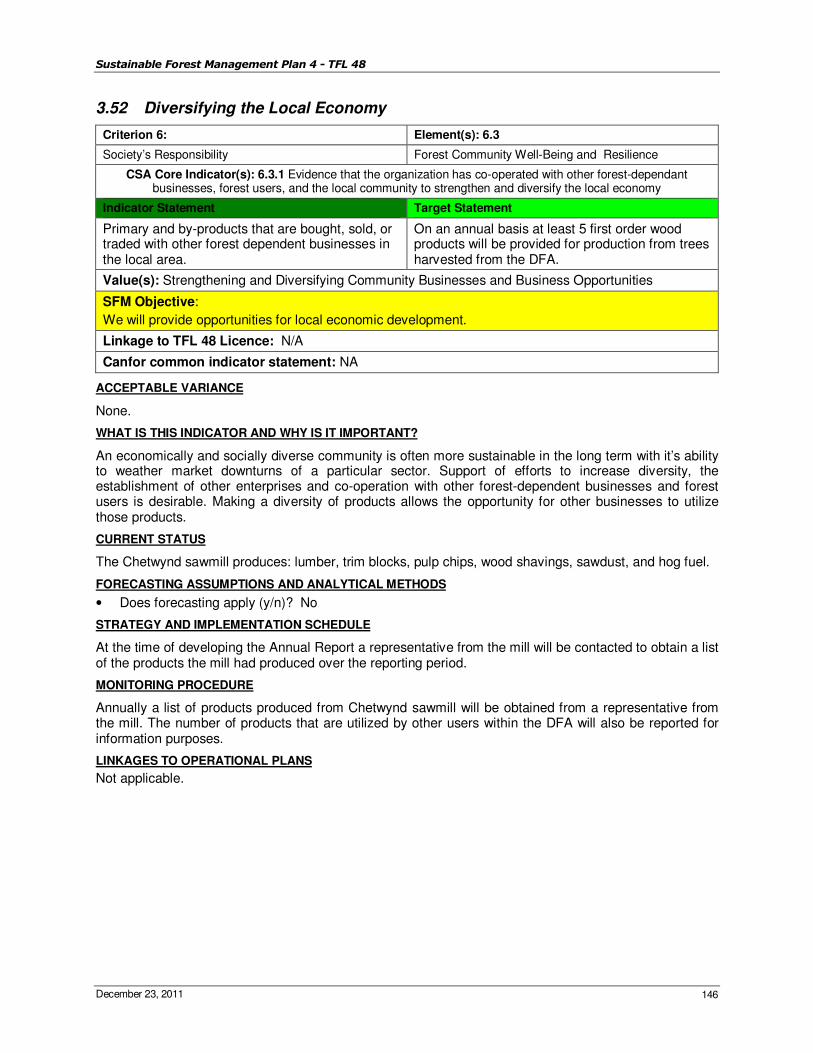
Sustainable Forest Management Plan 4 - TFL 48
December 23, 2011 146
3.52 Diversifying the Local Economy
Criterion 6: Element(s): 6.3
Society’s Responsibility Forest Community Well-Being and Resilience
CSA Core Indicator(s): 6.3.1 Evidence that the organization has co-operated with other forest-dependant businesses, forest users, and the local community to strengthen and diversify the local economy
Indicator Statement Target Statement
Primary and by-products that are bought, sold, or traded with other forest dependent businesses in the local area.
On an annual basis at least 5 first order wood products will be provided for production from trees harvested from the DFA.
Value(s): Strengthening and Diversifying Community Businesses and Business Opportunities
SFM Objective:
We will provide opportunities for local economic development.
Linkage to TFL 48 Licence: N/A
Canfor common indicator statement: NA
ACCEPTABLE VARIANCE
None.
WHAT IS THIS INDICATOR AND WHY IS IT IMPORTANT?
An economically and socially diverse community is often more sustainable in the long term with it’s ability to weather market downturns of a particular sector. Support of efforts to increase diversity, the establishment of other enterprises and co-operation with other forest-dependent businesses and forest users is desirable. Making a diversity of products allows the opportunity for other businesses to utilize those products.
CURRENT STATUS
The Chetwynd sawmill produces: lumber, trim blocks, pulp chips, wood shavings, sawdust, and hog fuel.
FORECASTING ASSUMPTIONS AND ANALYTICAL METHODS
• Does forecasting apply (y/n)? No
STRATEGY AND IMPLEMENTATION SCHEDULE
At the time of developing the Annual Report a representative from the mill will be contacted to obtain a list of the products the mill had produced over the reporting period.
MONITORING PROCEDURE
Annually a list of products produced from Chetwynd sawmill will be obtained from a representative from the mill. The number of products that are utilized by other users within the DFA will also be reported for information purposes.
LINKAGES TO OPERATIONAL PLANS
Not applicable.
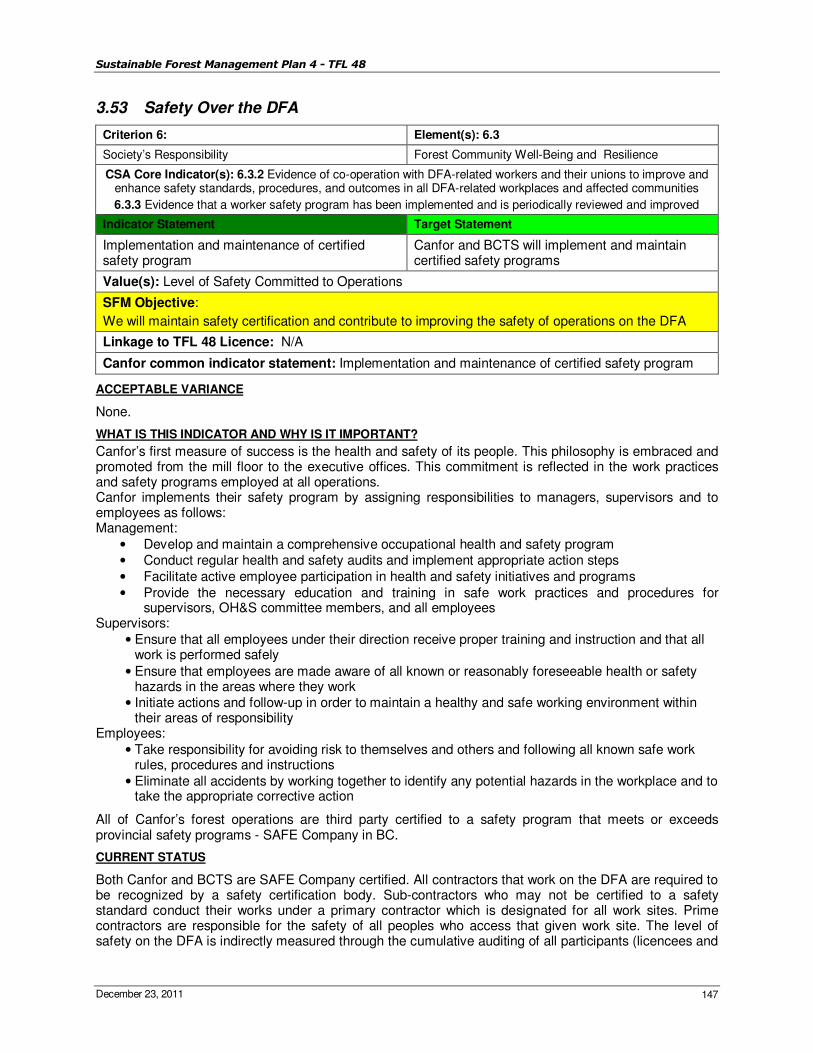
Sustainable Forest Management Plan 4 - TFL 48
December 23, 2011 147
3.53 Safety Over the DFA
Criterion 6: Element(s): 6.3
Society’s Responsibility Forest Community Well-Being and Resilience
CSA Core Indicator(s): 6.3.2 Evidence of co-operation with DFA-related workers and their unions to improve and enhance safety standards, procedures, and outcomes in all DFA-related workplaces and affected communities
6.3.3 Evidence that a worker safety program has been implemented and is periodically reviewed and improved
Indicator Statement Target Statement
Implementation and maintenance of certified safety program
Canfor and BCTS will implement and maintain certified safety programs
Value(s): Level of Safety Committed to Operations
SFM Objective:
We will maintain safety certification and contribute to improving the safety of operations on the DFA
Linkage to TFL 48 Licence: N/A
Canfor common indicator statement: Implementation and maintenance of certified safety program
ACCEPTABLE VARIANCE
None.
WHAT IS THIS INDICATOR AND WHY IS IT IMPORTANT?
Canfor’s first measure of success is the health and safety of its people. This philosophy is embraced and promoted from the mill floor to the executive offices. This commitment is reflected in the work practices and safety programs employed at all operations. Canfor implements their safety program by assigning responsibilities to managers, supervisors and to employees as follows: Management:
• Develop and maintain a comprehensive occupational health and safety program • Conduct regular health and safety audits and implement appropriate action steps • Facilitate active employee participation in health and safety initiatives and programs • Provide the necessary education and training in safe work practices and procedures for
supervisors, OH&S committee members, and all employees Supervisors:
• Ensure that all employees under their direction receive proper training and instruction and that all work is performed safely
• Ensure that employees are made aware of all known or reasonably foreseeable health or safety hazards in the areas where they work
• Initiate actions and follow-up in order to maintain a healthy and safe working environment within their areas of responsibility
Employees: • Take responsibility for avoiding risk to themselves and others and following all known safe work
rules, procedures and instructions • Eliminate all accidents by working together to identify any potential hazards in the workplace and to
take the appropriate corrective action
All of Canfor’s forest operations are third party certified to a safety program that meets or exceeds provincial safety programs - SAFE Company in BC.
CURRENT STATUS
Both Canfor and BCTS are SAFE Company certified. All contractors that work on the DFA are required to be recognized by a safety certification body. Sub-contractors who may not be certified to a safety standard conduct their works under a primary contractor which is designated for all work sites. Prime contractors are responsible for the safety of all peoples who access that given work site. The level of safety on the DFA is indirectly measured through the cumulative auditing of all participants (licencees and
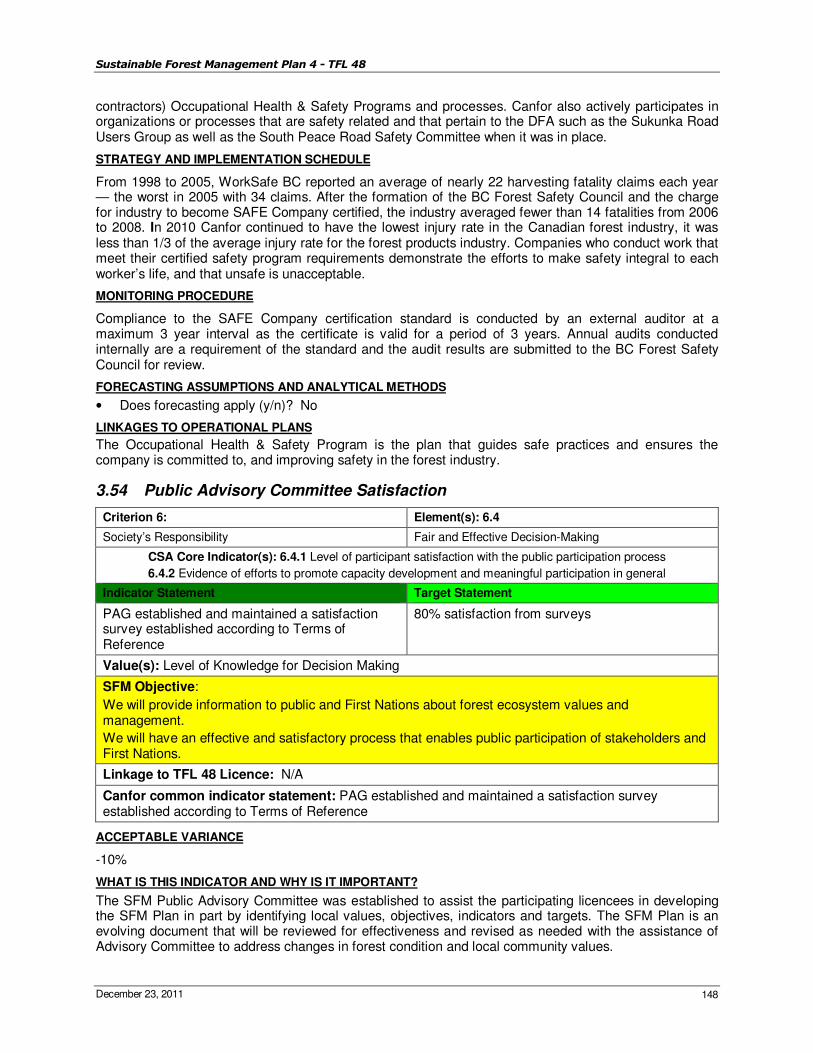
Sustainable Forest Management Plan 4 - TFL 48
December 23, 2011 148
contractors) Occupational Health & Safety Programs and processes. Canfor also actively participates in organizations or processes that are safety related and that pertain to the DFA such as the Sukunka Road Users Group as well as the South Peace Road Safety Committee when it was in place.
STRATEGY AND IMPLEMENTATION SCHEDULE
From 1998 to 2005, WorkSafe BC reported an average of nearly 22 harvesting fatality claims each year — the worst in 2005 with 34 claims. After the formation of the BC Forest Safety Council and the charge for industry to become SAFE Company certified, the industry averaged fewer than 14 fatalities from 2006 to 2008. In 2010 Canfor continued to have the lowest injury rate in the Canadian forest industry, it was less than 1/3 of the average injury rate for the forest products industry. Companies who conduct work that meet their certified safety program requirements demonstrate the efforts to make safety integral to each worker’s life, and that unsafe is unacceptable.
MONITORING PROCEDURE
Compliance to the SAFE Company certification standard is conducted by an external auditor at a maximum 3 year interval as the certificate is valid for a period of 3 years. Annual audits conducted internally are a requirement of the standard and the audit results are submitted to the BC Forest Safety Council for review.
FORECASTING ASSUMPTIONS AND ANALYTICAL METHODS
• Does forecasting apply (y/n)? No
LINKAGES TO OPERATIONAL PLANS
The Occupational Health & Safety Program is the plan that guides safe practices and ensures the company is committed to, and improving safety in the forest industry.
3.54 Public Advisory Committee Satisfaction
Criterion 6: Element(s): 6.4
Society’s Responsibility Fair and Effective Decision-Making
CSA Core Indicator(s): 6.4.1 Level of participant satisfaction with the public participation process
6.4.2 Evidence of efforts to promote capacity development and meaningful participation in general
Indicator Statement Target Statement
PAG established and maintained a satisfaction survey established according to Terms of Reference
80% satisfaction from surveys
Value(s): Level of Knowledge for Decision Making
SFM Objective:
We will provide information to public and First Nations about forest ecosystem values and management.
We will have an effective and satisfactory process that enables public participation of stakeholders and First Nations.
Linkage to TFL 48 Licence: N/A
Canfor common indicator statement: PAG established and maintained a satisfaction survey established according to Terms of Reference
ACCEPTABLE VARIANCE
-10%
WHAT IS THIS INDICATOR AND WHY IS IT IMPORTANT?
The SFM Public Advisory Committee was established to assist the participating licencees in developing the SFM Plan in part by identifying local values, objectives, indicators and targets. The SFM Plan is an evolving document that will be reviewed for effectiveness and revised as needed with the assistance of Advisory Committee to address changes in forest condition and local community values.
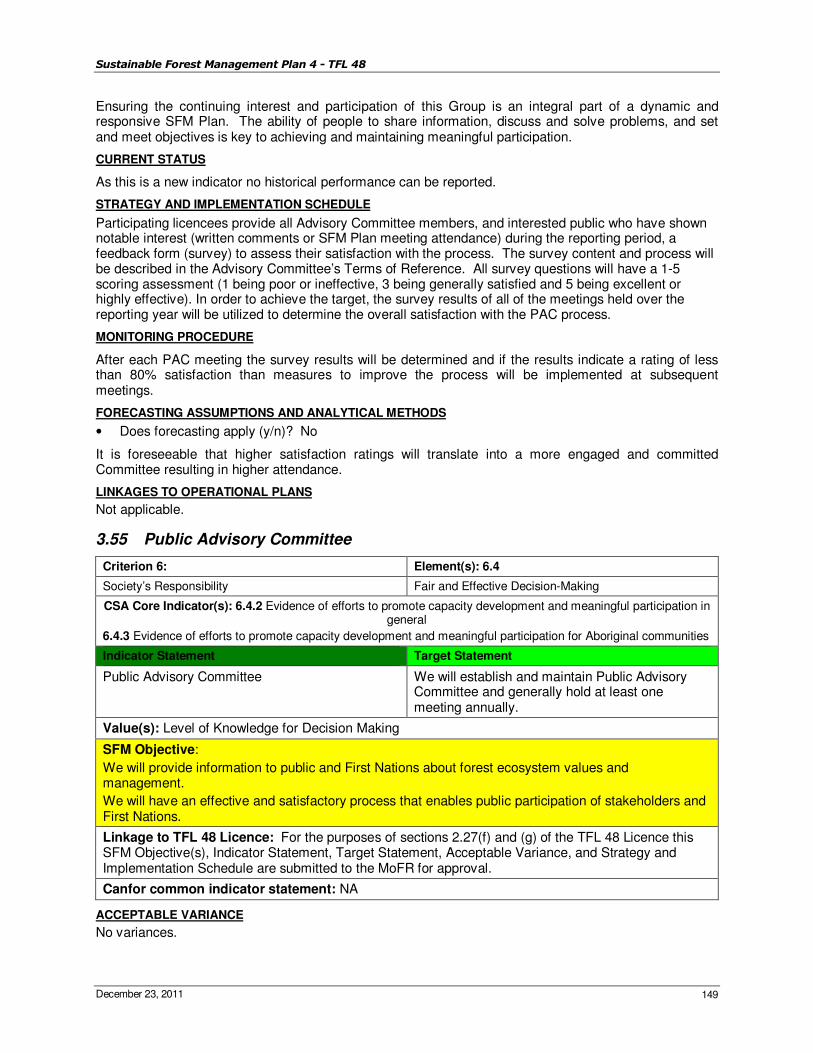
Sustainable Forest Management Plan 4 - TFL 48
December 23, 2011 149
Ensuring the continuing interest and participation of this Group is an integral part of a dynamic and responsive SFM Plan. The ability of people to share information, discuss and solve problems, and set and meet objectives is key to achieving and maintaining meaningful participation.
CURRENT STATUS
As this is a new indicator no historical performance can be reported.
STRATEGY AND IMPLEMENTATION SCHEDULE
Participating licencees provide all Advisory Committee members, and interested public who have shown notable interest (written comments or SFM Plan meeting attendance) during the reporting period, a feedback form (survey) to assess their satisfaction with the process. The survey content and process will be described in the Advisory Committee’s Terms of Reference. All survey questions will have a 1-5 scoring assessment (1 being poor or ineffective, 3 being generally satisfied and 5 being excellent or highly effective). In order to achieve the target, the survey results of all of the meetings held over the reporting year will be utilized to determine the overall satisfaction with the PAC process.
MONITORING PROCEDURE
After each PAC meeting the survey results will be determined and if the results indicate a rating of less than 80% satisfaction than measures to improve the process will be implemented at subsequent meetings.
FORECASTING ASSUMPTIONS AND ANALYTICAL METHODS
• Does forecasting apply (y/n)? No
It is foreseeable that higher satisfaction ratings will translate into a more engaged and committed Committee resulting in higher attendance.
LINKAGES TO OPERATIONAL PLANS
Not applicable.
3.55 Public Advisory Committee
Criterion 6: Element(s): 6.4
Society’s Responsibility Fair and Effective Decision-Making
CSA Core Indicator(s): 6.4.2 Evidence of efforts to promote capacity development and meaningful participation in general
6.4.3 Evidence of efforts to promote capacity development and meaningful participation for Aboriginal communities
Indicator Statement Target Statement
Public Advisory Committee We will establish and maintain Public Advisory Committee and generally hold at least one meeting annually.
Value(s): Level of Knowledge for Decision Making
SFM Objective:
We will provide information to public and First Nations about forest ecosystem values and management.
We will have an effective and satisfactory process that enables public participation of stakeholders and First Nations.
Linkage to TFL 48 Licence: For the purposes of sections 2.27(f) and (g) of the TFL 48 Licence this SFM Objective(s), Indicator Statement, Target Statement, Acceptable Variance, and Strategy and Implementation Schedule are submitted to the MoFR for approval.
Canfor common indicator statement: NA
ACCEPTABLE VARIANCE
No variances.
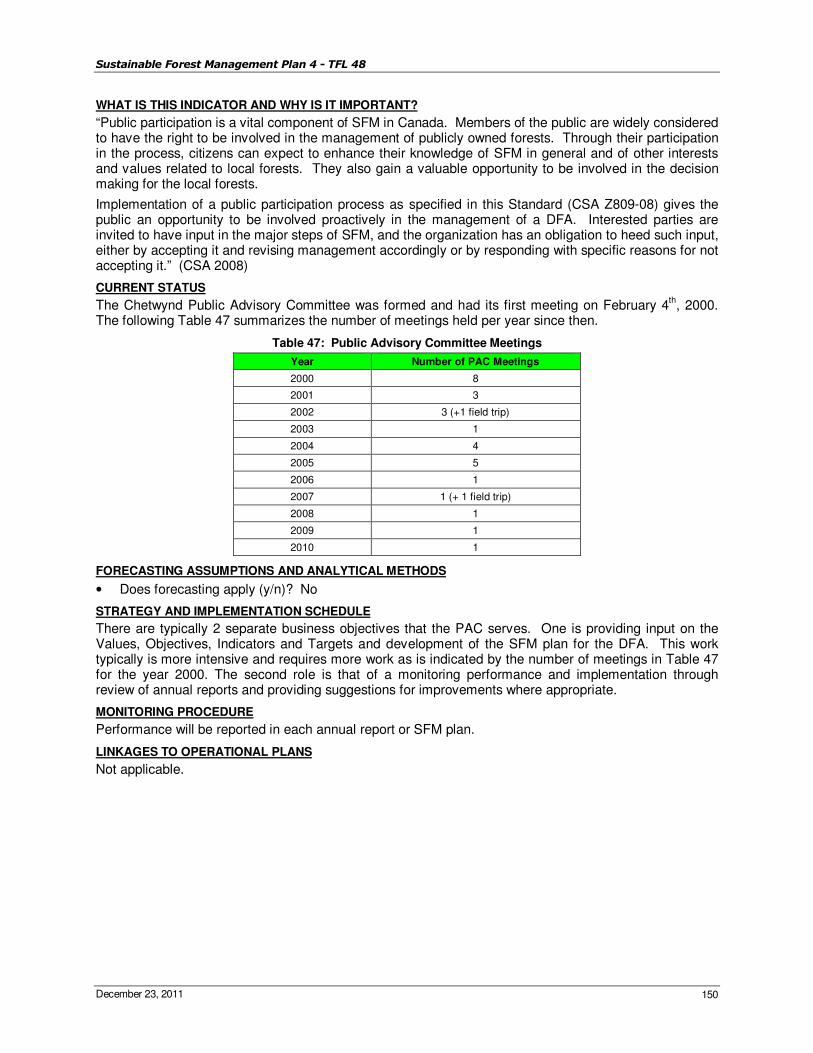
Sustainable Forest Management Plan 4 - TFL 48
December 23, 2011 150
WHAT IS THIS INDICATOR AND WHY IS IT IMPORTANT?
“Public participation is a vital component of SFM in Canada. Members of the public are widely considered to have the right to be involved in the management of publicly owned forests. Through their participation in the process, citizens can expect to enhance their knowledge of SFM in general and of other interests and values related to local forests. They also gain a valuable opportunity to be involved in the decision making for the local forests.
Implementation of a public participation process as specified in this Standard (CSA Z809-08) gives the public an opportunity to be involved proactively in the management of a DFA. Interested parties are invited to have input in the major steps of SFM, and the organization has an obligation to heed such input, either by accepting it and revising management accordingly or by responding with specific reasons for not accepting it.” (CSA 2008)
CURRENT STATUS
The Chetwynd Public Advisory Committee was formed and had its first meeting on February 4th, 2000.
The following Table 47 summarizes the number of meetings held per year since then.
Table 47: Public Advisory Committee Meetings
Year Number of PAC Meetings
2000 8
2001 3
2002 3 (+1 field trip)
2003 1
2004 4
2005 5
2006 1
2007 1 (+ 1 field trip)
2008 1
2009 1
2010 1
FORECASTING ASSUMPTIONS AND ANALYTICAL METHODS
• Does forecasting apply (y/n)? No
STRATEGY AND IMPLEMENTATION SCHEDULE
There are typically 2 separate business objectives that the PAC serves. One is providing input on the Values, Objectives, Indicators and Targets and development of the SFM plan for the DFA. This work typically is more intensive and requires more work as is indicated by the number of meetings in Table 47 for the year 2000. The second role is that of a monitoring performance and implementation through review of annual reports and providing suggestions for improvements where appropriate.
MONITORING PROCEDURE
Performance will be reported in each annual report or SFM plan.
LINKAGES TO OPERATIONAL PLANS
Not applicable.
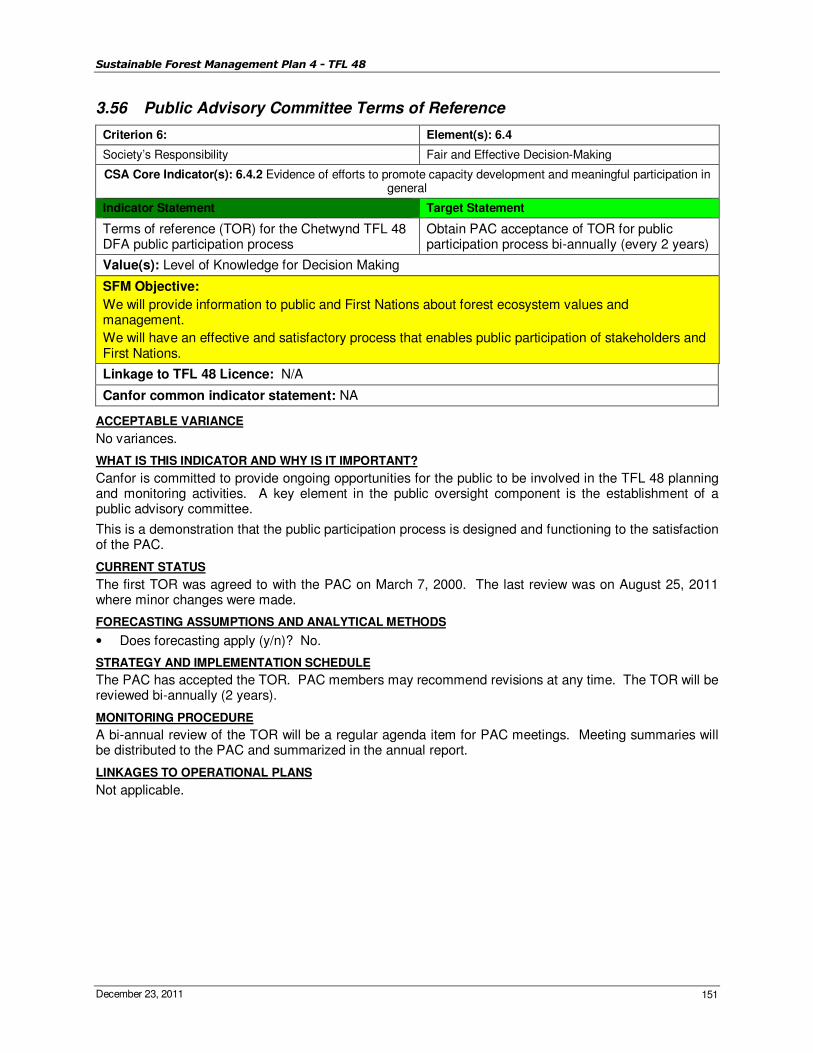
Sustainable Forest Management Plan 4 - TFL 48
December 23, 2011 151
3.56 Public Advisory Committee Terms of Reference
Criterion 6: Element(s): 6.4
Society’s Responsibility Fair and Effective Decision-Making
CSA Core Indicator(s): 6.4.2 Evidence of efforts to promote capacity development and meaningful participation in general
Indicator Statement Target Statement
Terms of reference (TOR) for the Chetwynd TFL 48 DFA public participation process
Obtain PAC acceptance of TOR for public participation process bi-annually (every 2 years)
Value(s): Level of Knowledge for Decision Making
SFM Objective:
We will provide information to public and First Nations about forest ecosystem values and management.
We will have an effective and satisfactory process that enables public participation of stakeholders and First Nations.
Linkage to TFL 48 Licence: N/A
Canfor common indicator statement: NA
ACCEPTABLE VARIANCE
No variances.
WHAT IS THIS INDICATOR AND WHY IS IT IMPORTANT?
Canfor is committed to provide ongoing opportunities for the public to be involved in the TFL 48 planning and monitoring activities. A key element in the public oversight component is the establishment of a public advisory committee.
This is a demonstration that the public participation process is designed and functioning to the satisfaction of the PAC.
CURRENT STATUS
The first TOR was agreed to with the PAC on March 7, 2000. The last review was on August 25, 2011 where minor changes were made.
FORECASTING ASSUMPTIONS AND ANALYTICAL METHODS
• Does forecasting apply (y/n)? No.
STRATEGY AND IMPLEMENTATION SCHEDULE
The PAC has accepted the TOR. PAC members may recommend revisions at any time. The TOR will be reviewed bi-annually (2 years).
MONITORING PROCEDURE
A bi-annual review of the TOR will be a regular agenda item for PAC meetings. Meeting summaries will be distributed to the PAC and summarized in the annual report.
LINKAGES TO OPERATIONAL PLANS
Not applicable.
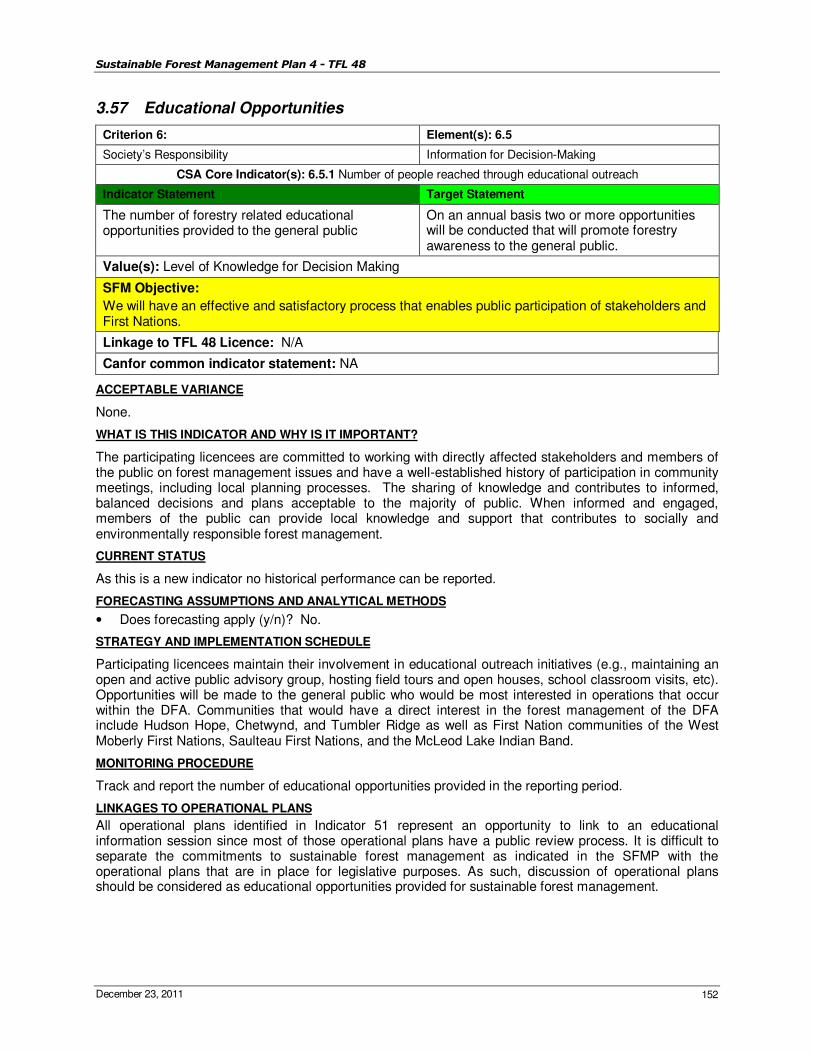
Sustainable Forest Management Plan 4 - TFL 48
December 23, 2011 152
3.57 Educational Opportunities
Criterion 6: Element(s): 6.5
Society’s Responsibility Information for Decision-Making
CSA Core Indicator(s): 6.5.1 Number of people reached through educational outreach
Indicator Statement Target Statement
The number of forestry related educational opportunities provided to the general public
On an annual basis two or more opportunities will be conducted that will promote forestry awareness to the general public.
Value(s): Level of Knowledge for Decision Making
SFM Objective:
We will have an effective and satisfactory process that enables public participation of stakeholders and First Nations.
Linkage to TFL 48 Licence: N/A
Canfor common indicator statement: NA
ACCEPTABLE VARIANCE
None.
WHAT IS THIS INDICATOR AND WHY IS IT IMPORTANT?
The participating licencees are committed to working with directly affected stakeholders and members of the public on forest management issues and have a well-established history of participation in community meetings, including local planning processes. The sharing of knowledge and contributes to informed, balanced decisions and plans acceptable to the majority of public. When informed and engaged, members of the public can provide local knowledge and support that contributes to socially and environmentally responsible forest management.
CURRENT STATUS
As this is a new indicator no historical performance can be reported.
FORECASTING ASSUMPTIONS AND ANALYTICAL METHODS
• Does forecasting apply (y/n)? No.
STRATEGY AND IMPLEMENTATION SCHEDULE
Participating licencees maintain their involvement in educational outreach initiatives (e.g., maintaining an open and active public advisory group, hosting field tours and open houses, school classroom visits, etc). Opportunities will be made to the general public who would be most interested in operations that occur within the DFA. Communities that would have a direct interest in the forest management of the DFA include Hudson Hope, Chetwynd, and Tumbler Ridge as well as First Nation communities of the West Moberly First Nations, Saulteau First Nations, and the McLeod Lake Indian Band.
MONITORING PROCEDURE
Track and report the number of educational opportunities provided in the reporting period.
LINKAGES TO OPERATIONAL PLANS
All operational plans identified in Indicator 51 represent an opportunity to link to an educational information session since most of those operational plans have a public review process. It is difficult to separate the commitments to sustainable forest management as indicated in the SFMP with the operational plans that are in place for legislative purposes. As such, discussion of operational plans should be considered as educational opportunities provided for sustainable forest management.
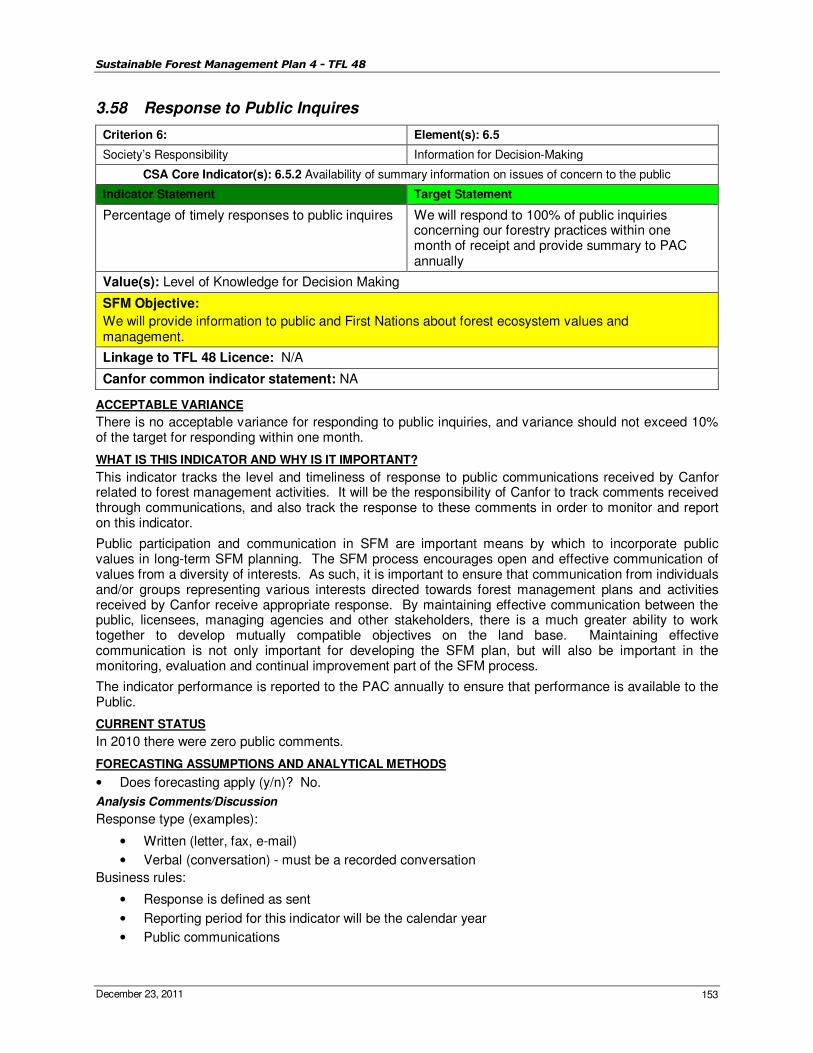
Sustainable Forest Management Plan 4 - TFL 48
December 23, 2011 153
3.58 Response to Public Inquires
Criterion 6: Element(s): 6.5
Society’s Responsibility Information for Decision-Making
CSA Core Indicator(s): 6.5.2 Availability of summary information on issues of concern to the public
Indicator Statement Target Statement
Percentage of timely responses to public inquires We will respond to 100% of public inquiries concerning our forestry practices within one month of receipt and provide summary to PAC annually
Value(s): Level of Knowledge for Decision Making
SFM Objective:
We will provide information to public and First Nations about forest ecosystem values and management.
Linkage to TFL 48 Licence: N/A
Canfor common indicator statement: NA
ACCEPTABLE VARIANCE
There is no acceptable variance for responding to public inquiries, and variance should not exceed 10% of the target for responding within one month.
WHAT IS THIS INDICATOR AND WHY IS IT IMPORTANT?
This indicator tracks the level and timeliness of response to public communications received by Canfor related to forest management activities. It will be the responsibility of Canfor to track comments received through communications, and also track the response to these comments in order to monitor and report on this indicator.
Public participation and communication in SFM are important means by which to incorporate public values in long-term SFM planning. The SFM process encourages open and effective communication of values from a diversity of interests. As such, it is important to ensure that communication from individuals and/or groups representing various interests directed towards forest management plans and activities received by Canfor receive appropriate response. By maintaining effective communication between the public, licensees, managing agencies and other stakeholders, there is a much greater ability to work together to develop mutually compatible objectives on the land base. Maintaining effective communication is not only important for developing the SFM plan, but will also be important in the monitoring, evaluation and continual improvement part of the SFM process.
The indicator performance is reported to the PAC annually to ensure that performance is available to the Public.
CURRENT STATUS
In 2010 there were zero public comments.
FORECASTING ASSUMPTIONS AND ANALYTICAL METHODS
• Does forecasting apply (y/n)? No.
Analysis Comments/Discussion
Response type (examples):
• Written (letter, fax, e-mail)
• Verbal (conversation) - must be a recorded conversation
Business rules:
• Response is defined as sent
• Reporting period for this indicator will be the calendar year
• Public communications
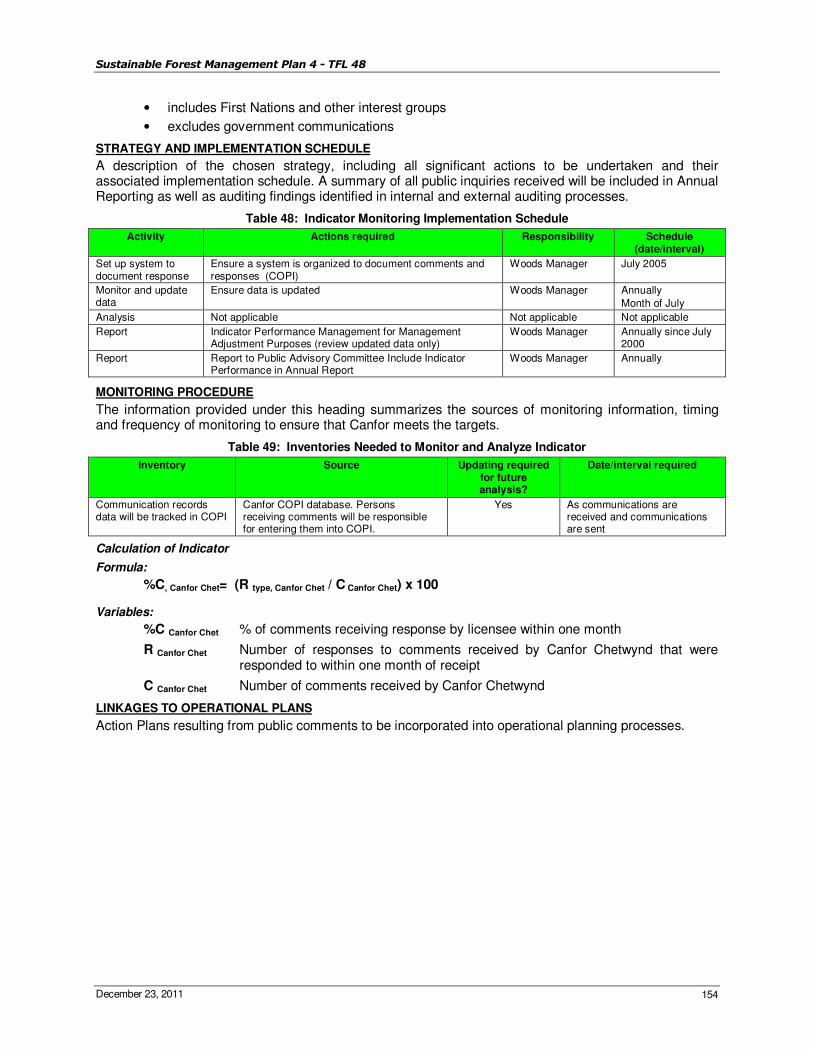
Sustainable Forest Management Plan 4 - TFL 48
December 23, 2011 154
• includes First Nations and other interest groups
• excludes government communications
STRATEGY AND IMPLEMENTATION SCHEDULE
A description of the chosen strategy, including all significant actions to be undertaken and their associated implementation schedule. A summary of all public inquiries received will be included in Annual Reporting as well as auditing findings identified in internal and external auditing processes.
Table 48: Indicator Monitoring Implementation Schedule
Activity Actions required Responsibility Schedule (date/interval)
Set up system to document response
Ensure a system is organized to document comments and responses (COPI)
Woods Manager July 2005
Monitor and update data
Ensure data is updated Woods Manager Annually
Month of July
Analysis Not applicable Not applicable Not applicable
Report Indicator Performance Management for Management Adjustment Purposes (review updated data only)
Woods Manager Annually since July 2000
Report Report to Public Advisory Committee Include Indicator Performance in Annual Report
Woods Manager Annually
MONITORING PROCEDURE
The information provided under this heading summarizes the sources of monitoring information, timing and frequency of monitoring to ensure that Canfor meets the targets.
Table 49: Inventories Needed to Monitor and Analyze Indicator
Inventory Source Updating required for future analysis?
Date/interval required
Communication records data will be tracked in COPI
Canfor COPI database. Persons receiving comments will be responsible for entering them into COPI.
Yes As communications are received and communications are sent
Calculation of Indicator
Formula:
%C, Canfor Chet= (R type, Canfor Chet / C Canfor Chet) x 100
Variables:
%C Canfor Chet % of comments receiving response by licensee within one month
R Canfor Chet Number of responses to comments received by Canfor Chetwynd that were responded to within one month of receipt
C Canfor Chet Number of comments received by Canfor Chetwynd
LINKAGES TO OPERATIONAL PLANS
Action Plans resulting from public comments to be incorporated into operational planning processes.
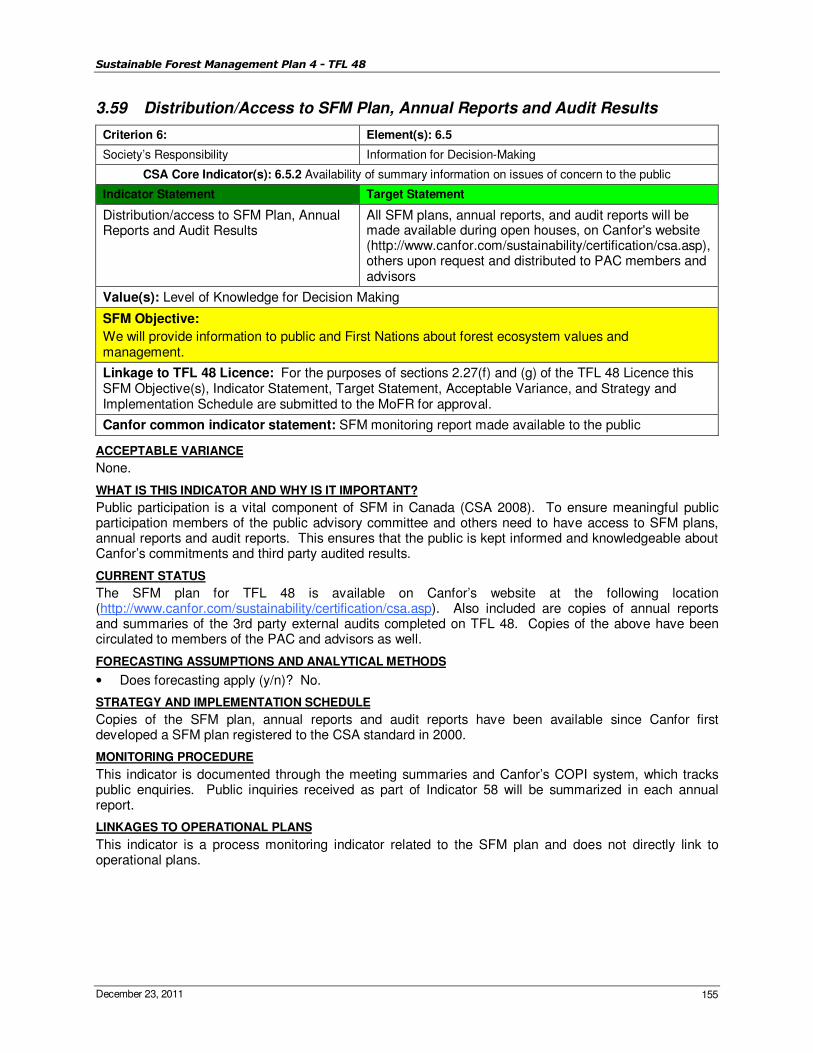
Sustainable Forest Management Plan 4 - TFL 48
December 23, 2011 155
3.59 Distribution/Access to SFM Plan, Annual Reports and Audit Results
Criterion 6: Element(s): 6.5
Society’s Responsibility Information for Decision-Making
CSA Core Indicator(s): 6.5.2 Availability of summary information on issues of concern to the public
Indicator Statement Target Statement
Distribution/access to SFM Plan, Annual Reports and Audit Results
All SFM plans, annual reports, and audit reports will be made available during open houses, on Canfor's website (http://www.canfor.com/sustainability/certification/csa.asp), others upon request and distributed to PAC members and advisors
Value(s): Level of Knowledge for Decision Making
SFM Objective:
We will provide information to public and First Nations about forest ecosystem values and management.
Linkage to TFL 48 Licence: For the purposes of sections 2.27(f) and (g) of the TFL 48 Licence this SFM Objective(s), Indicator Statement, Target Statement, Acceptable Variance, and Strategy and Implementation Schedule are submitted to the MoFR for approval.
Canfor common indicator statement: SFM monitoring report made available to the public
ACCEPTABLE VARIANCE
None.
WHAT IS THIS INDICATOR AND WHY IS IT IMPORTANT?
Public participation is a vital component of SFM in Canada (CSA 2008). To ensure meaningful public participation members of the public advisory committee and others need to have access to SFM plans, annual reports and audit reports. This ensures that the public is kept informed and knowledgeable about Canfor’s commitments and third party audited results.
CURRENT STATUS
The SFM plan for TFL 48 is available on Canfor’s website at the following location (http://www.canfor.com/sustainability/certification/csa.asp). Also included are copies of annual reports and summaries of the 3rd party external audits completed on TFL 48. Copies of the above have been circulated to members of the PAC and advisors as well.
FORECASTING ASSUMPTIONS AND ANALYTICAL METHODS
• Does forecasting apply (y/n)? No.
STRATEGY AND IMPLEMENTATION SCHEDULE
Copies of the SFM plan, annual reports and audit reports have been available since Canfor first developed a SFM plan registered to the CSA standard in 2000.
MONITORING PROCEDURE
This indicator is documented through the meeting summaries and Canfor’s COPI system, which tracks public enquiries. Public inquiries received as part of Indicator 58 will be summarized in each annual report.
LINKAGES TO OPERATIONAL PLANS
This indicator is a process monitoring indicator related to the SFM plan and does not directly link to operational plans.
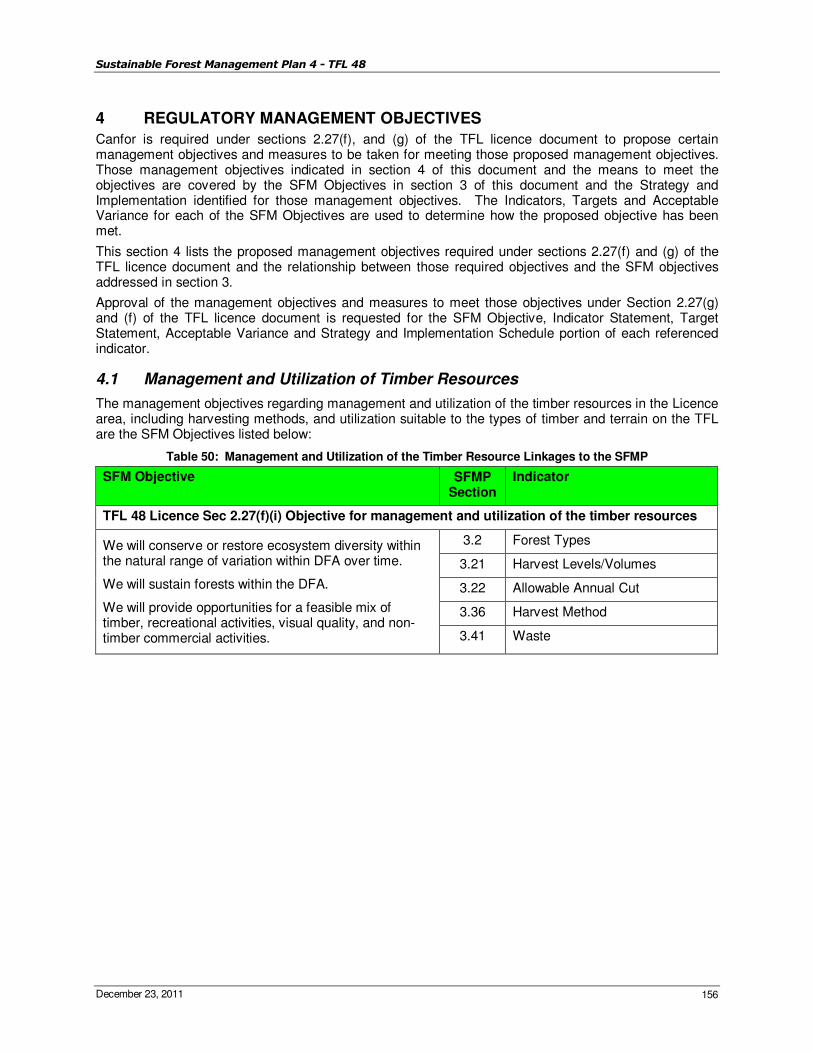
Sustainable Forest Management Plan 4 - TFL 48
December 23, 2011 156
4 REGULATORY MANAGEMENT OBJECTIVES
Canfor is required under sections 2.27(f), and (g) of the TFL licence document to propose certain management objectives and measures to be taken for meeting those proposed management objectives. Those management objectives indicated in section 4 of this document and the means to meet the objectives are covered by the SFM Objectives in section 3 of this document and the Strategy and Implementation identified for those management objectives. The Indicators, Targets and Acceptable Variance for each of the SFM Objectives are used to determine how the proposed objective has been met.
This section 4 lists the proposed management objectives required under sections 2.27(f) and (g) of the TFL licence document and the relationship between those required objectives and the SFM objectives addressed in section 3.
Approval of the management objectives and measures to meet those objectives under Section 2.27(g) and (f) of the TFL licence document is requested for the SFM Objective, Indicator Statement, Target Statement, Acceptable Variance and Strategy and Implementation Schedule portion of each referenced indicator.
4.1 Management and Utilization of Timber Resources
The management objectives regarding management and utilization of the timber resources in the Licence area, including harvesting methods, and utilization suitable to the types of timber and terrain on the TFL are the SFM Objectives listed below:
Table 50: Management and Utilization of the Timber Resource Linkages to the SFMP
SFM Objective SFMP Section
Indicator
TFL 48 Licence Sec 2.27(f)(i) Objective for management and utilization of the timber resources
We will conserve or restore ecosystem diversity within the natural range of variation within DFA over time.
We will sustain forests within the DFA.
We will provide opportunities for a feasible mix of timber, recreational activities, visual quality, and non-timber commercial activities.
3.2 Forest Types
3.21 Harvest Levels/Volumes
3.22 Allowable Annual Cut
3.36 Harvest Method
3.41 Waste
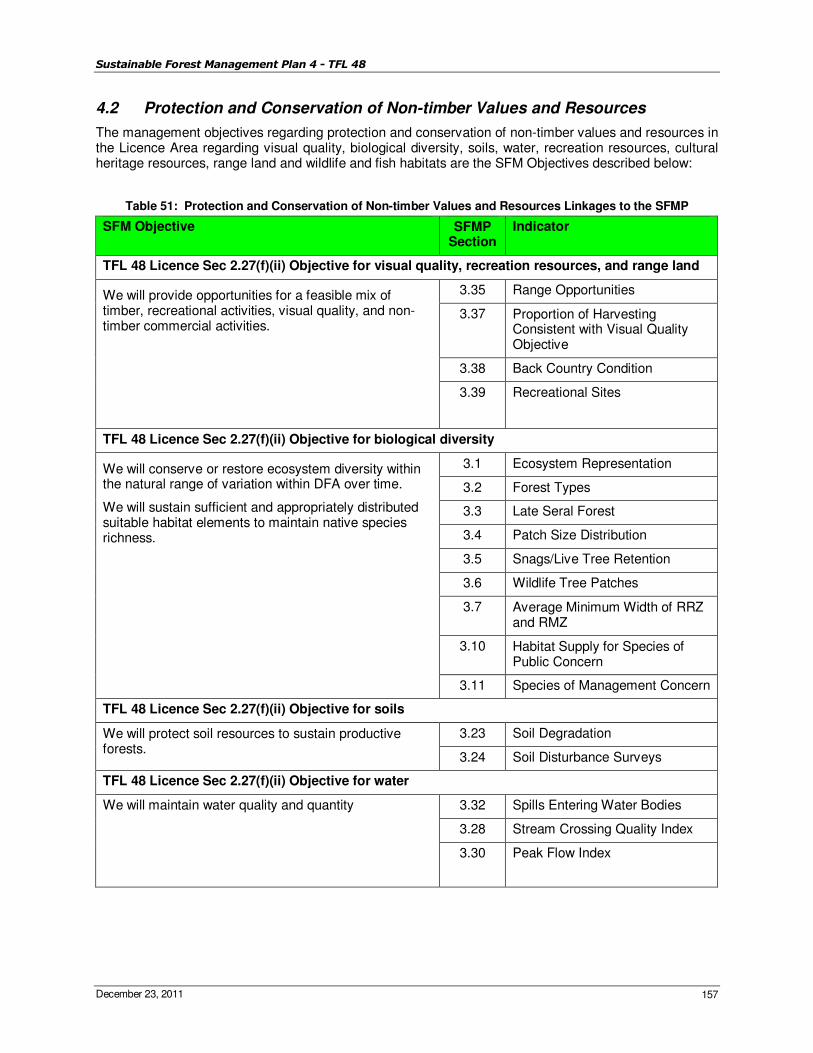
Sustainable Forest Management Plan 4 - TFL 48
December 23, 2011 157
4.2 Protection and Conservation of Non-timber Values and Resources
The management objectives regarding protection and conservation of non-timber values and resources in the Licence Area regarding visual quality, biological diversity, soils, water, recreation resources, cultural heritage resources, range land and wildlife and fish habitats are the SFM Objectives described below:
Table 51: Protection and Conservation of Non-timber Values and Resources Linkages to the SFMP
SFM Objective SFMP Section
Indicator
TFL 48 Licence Sec 2.27(f)(ii) Objective for visual quality, recreation resources, and range land
We will provide opportunities for a feasible mix of timber, recreational activities, visual quality, and non-timber commercial activities.
3.35 Range Opportunities
3.37 Proportion of Harvesting Consistent with Visual Quality Objective
3.38 Back Country Condition
3.39 Recreational Sites
TFL 48 Licence Sec 2.27(f)(ii) Objective for biological diversity
We will conserve or restore ecosystem diversity within the natural range of variation within DFA over time.
We will sustain sufficient and appropriately distributed suitable habitat elements to maintain native species richness.
3.1 Ecosystem Representation
3.2 Forest Types
3.3 Late Seral Forest
3.4 Patch Size Distribution
3.5 Snags/Live Tree Retention
3.6 Wildlife Tree Patches
3.7 Average Minimum Width of RRZ and RMZ
3.10 Habitat Supply for Species of Public Concern
3.11 Species of Management Concern
TFL 48 Licence Sec 2.27(f)(ii) Objective for soils
We will protect soil resources to sustain productive forests.
3.23 Soil Degradation
3.24 Soil Disturbance Surveys
TFL 48 Licence Sec 2.27(f)(ii) Objective for water
We will maintain water quality and quantity 3.32 Spills Entering Water Bodies
3.28 Stream Crossing Quality Index
3.30 Peak Flow Index

Sustainable Forest Management Plan 4 - TFL 48
December 23, 2011 158
SFM Objective SFMP Section
Indicator
TFL 48 Licence Sec 2.27(f)(ii) Objective for cultural heritage resources
We will implement management strategies appropriate to the long term maintenance of protected areas and sites of special geological, biological, or cultural significance.
We will recognize and respect Treaty 8 rights.
3.15 Known Values and Uses Addressed in Operational Planning
TFL 48 Licence Sec 2.27(f)(ii) Objective for fish and wildlife habitat
We will maintain water quality and quantity.
We will sustain sufficient and appropriately distributed suitable habitat elements to maintain native species richness.
We will implement management strategies appropriate to the long term maintenance of protected areas and sites of special geological, biological, or cultural significance.
3.7 Average Minimum Width of RRZ and RMZ
3.9 Wildlife Habitat Areas, Ungulate Winter Ranges and Dunlevy Creek Management Plan
3.10 Habitat Supply for Species of Public Concern
3.11 Species of Management Concern
4.3 Integration of Harvesting Activities with Non-timber Uses
The management objectives regarding the integration of harvesting activities in the Licence Area for purposes other than timber production are the SFM Objectives described below:
Table 52: Integration of Harvesting Activities with Non-timber Use Linkages to the SFMP
SFM Objective SFMP Section
Indicator
TFL 48 Licence Sec 2.27(f)(iii)(A) Objective for integration of harvesting activities with trappers, guide outfitters, range tenure holders, and other licensed resource users
We will sustain sufficient and appropriately distributed suitable habitat elements to maintain native species richness.
We will sustain forests within the DFA.
We will provide opportunities for a feasible mix of timber, recreational activities, visual quality, and non-timber commercial activities.
We will provide information to public and First Nations about forest ecosystem values and management.
We will have an effective and satisfactory process that enables public participation of stakeholders and First Nations.
3.10 Habitat Supply for Species of Public Concern
3.19 Area of Forested Land Lost to Non-Forest Industry
3.35 Range Opportunities
3.40 Consistency with Third Party Action Plans
3.55 Public Advisory Committee
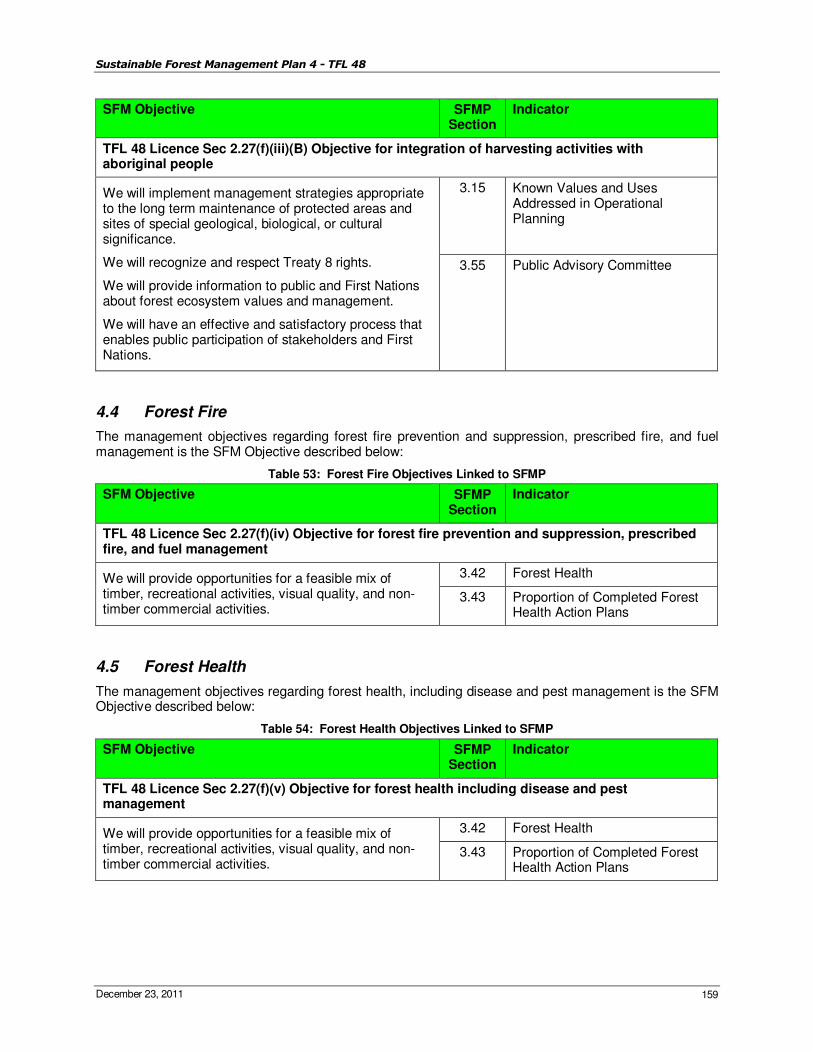
Sustainable Forest Management Plan 4 - TFL 48
December 23, 2011 159
SFM Objective SFMP Section
Indicator
TFL 48 Licence Sec 2.27(f)(iii)(B) Objective for integration of harvesting activities with aboriginal people
We will implement management strategies appropriate to the long term maintenance of protected areas and sites of special geological, biological, or cultural significance.
We will recognize and respect Treaty 8 rights.
We will provide information to public and First Nations about forest ecosystem values and management.
We will have an effective and satisfactory process that enables public participation of stakeholders and First Nations.
3.15 Known Values and Uses Addressed in Operational Planning
3.55 Public Advisory Committee
4.4 Forest Fire
The management objectives regarding forest fire prevention and suppression, prescribed fire, and fuel management is the SFM Objective described below:
Table 53: Forest Fire Objectives Linked to SFMP
SFM Objective SFMP Section
Indicator
TFL 48 Licence Sec 2.27(f)(iv) Objective for forest fire prevention and suppression, prescribed fire, and fuel management
We will provide opportunities for a feasible mix of timber, recreational activities, visual quality, and non-timber commercial activities.
3.42 Forest Health
3.43 Proportion of Completed Forest Health Action Plans
4.5 Forest Health
The management objectives regarding forest health, including disease and pest management is the SFM Objective described below:
Table 54: Forest Health Objectives Linked to SFMP
SFM Objective SFMP Section
Indicator
TFL 48 Licence Sec 2.27(f)(v) Objective for forest health including disease and pest management
We will provide opportunities for a feasible mix of timber, recreational activities, visual quality, and non-timber commercial activities.
3.42 Forest Health
3.43 Proportion of Completed Forest Health Action Plans
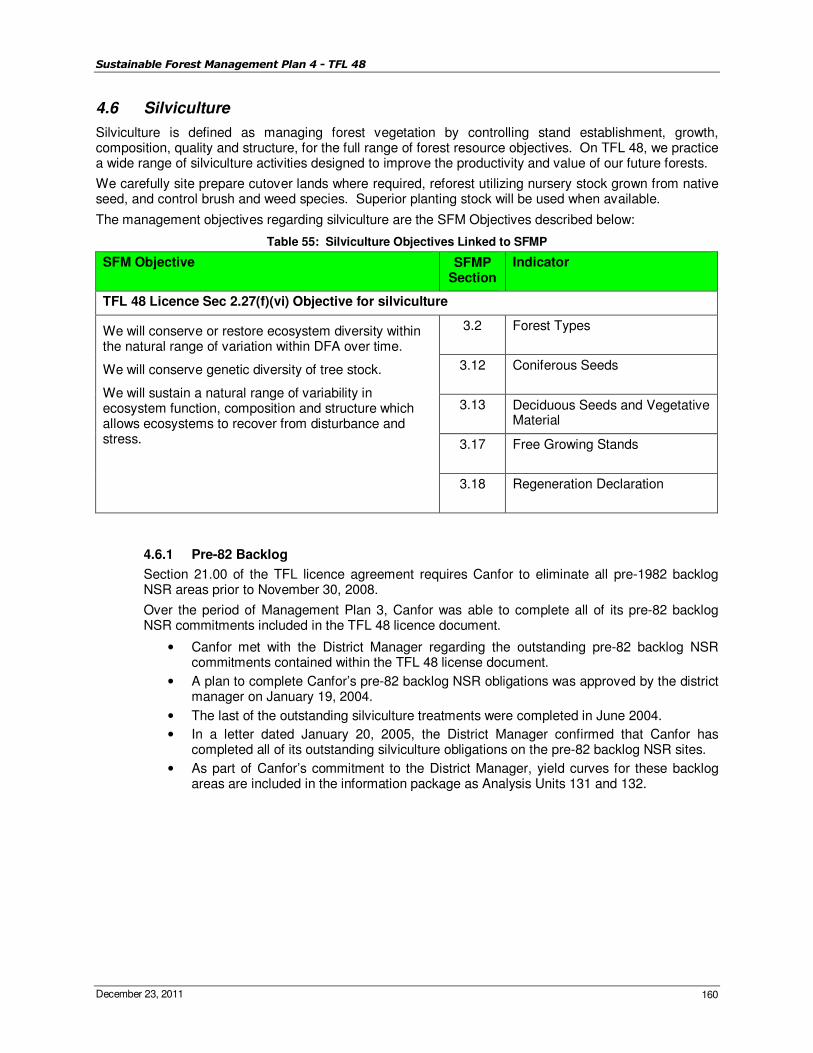
Sustainable Forest Management Plan 4 - TFL 48
December 23, 2011 160
4.6 Silviculture
Silviculture is defined as managing forest vegetation by controlling stand establishment, growth, composition, quality and structure, for the full range of forest resource objectives. On TFL 48, we practice a wide range of silviculture activities designed to improve the productivity and value of our future forests.
We carefully site prepare cutover lands where required, reforest utilizing nursery stock grown from native seed, and control brush and weed species. Superior planting stock will be used when available.
The management objectives regarding silviculture are the SFM Objectives described below:
Table 55: Silviculture Objectives Linked to SFMP
SFM Objective SFMP Section
Indicator
TFL 48 Licence Sec 2.27(f)(vi) Objective for silviculture
We will conserve or restore ecosystem diversity within the natural range of variation within DFA over time.
We will conserve genetic diversity of tree stock.
We will sustain a natural range of variability in ecosystem function, composition and structure which allows ecosystems to recover from disturbance and stress.
3.2 Forest Types
3.12 Coniferous Seeds
3.13 Deciduous Seeds and Vegetative Material
3.17 Free Growing Stands
3.18 Regeneration Declaration
4.6.1 Pre-82 Backlog
Section 21.00 of the TFL licence agreement requires Canfor to eliminate all pre-1982 backlog NSR areas prior to November 30, 2008.
Over the period of Management Plan 3, Canfor was able to complete all of its pre-82 backlog NSR commitments included in the TFL 48 licence document.
• Canfor met with the District Manager regarding the outstanding pre-82 backlog NSR commitments contained within the TFL 48 license document.
• A plan to complete Canfor’s pre-82 backlog NSR obligations was approved by the district manager on January 19, 2004.
• The last of the outstanding silviculture treatments were completed in June 2004.
• In a letter dated January 20, 2005, the District Manager confirmed that Canfor has completed all of its outstanding silviculture obligations on the pre-82 backlog NSR sites.
• As part of Canfor’s commitment to the District Manager, yield curves for these backlog areas are included in the information package as Analysis Units 131 and 132.
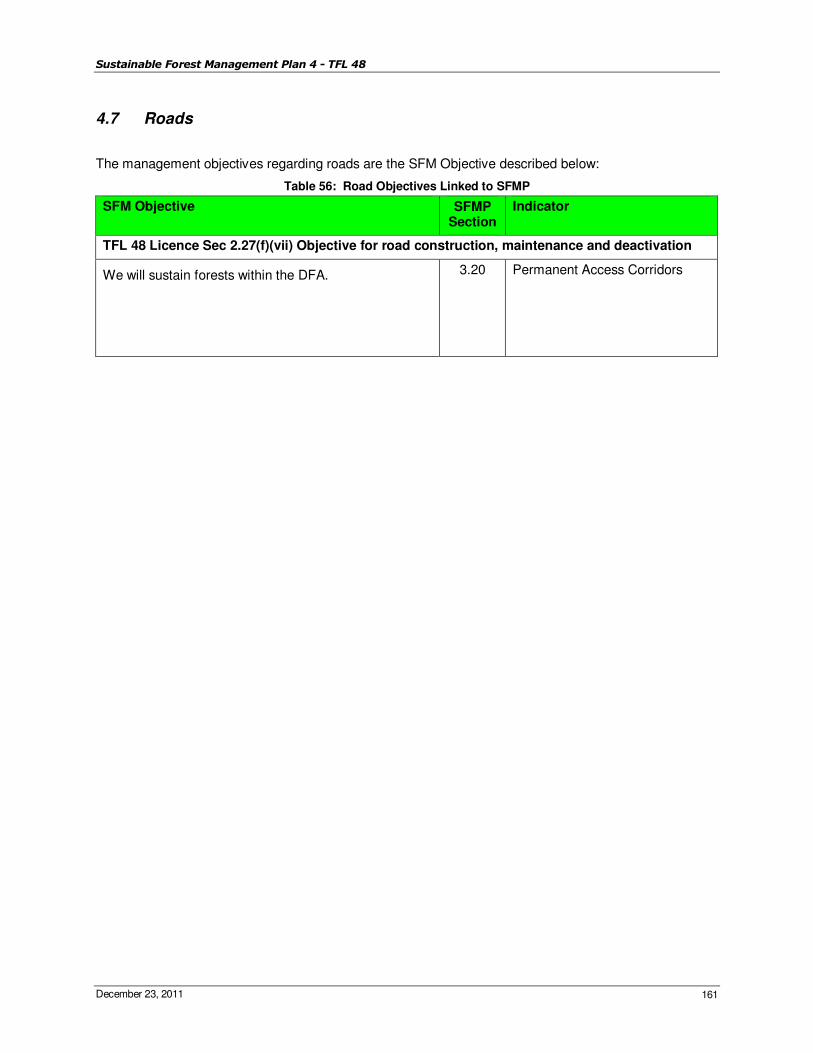
Sustainable Forest Management Plan 4 - TFL 48
December 23, 2011 161
4.7 Roads
The management objectives regarding roads are the SFM Objective described below:
Table 56: Road Objectives Linked to SFMP
SFM Objective SFMP Section
Indicator
TFL 48 Licence Sec 2.27(f)(vii) Objective for road construction, maintenance and deactivation
We will sustain forests within the DFA. 3.20 Permanent Access Corridors
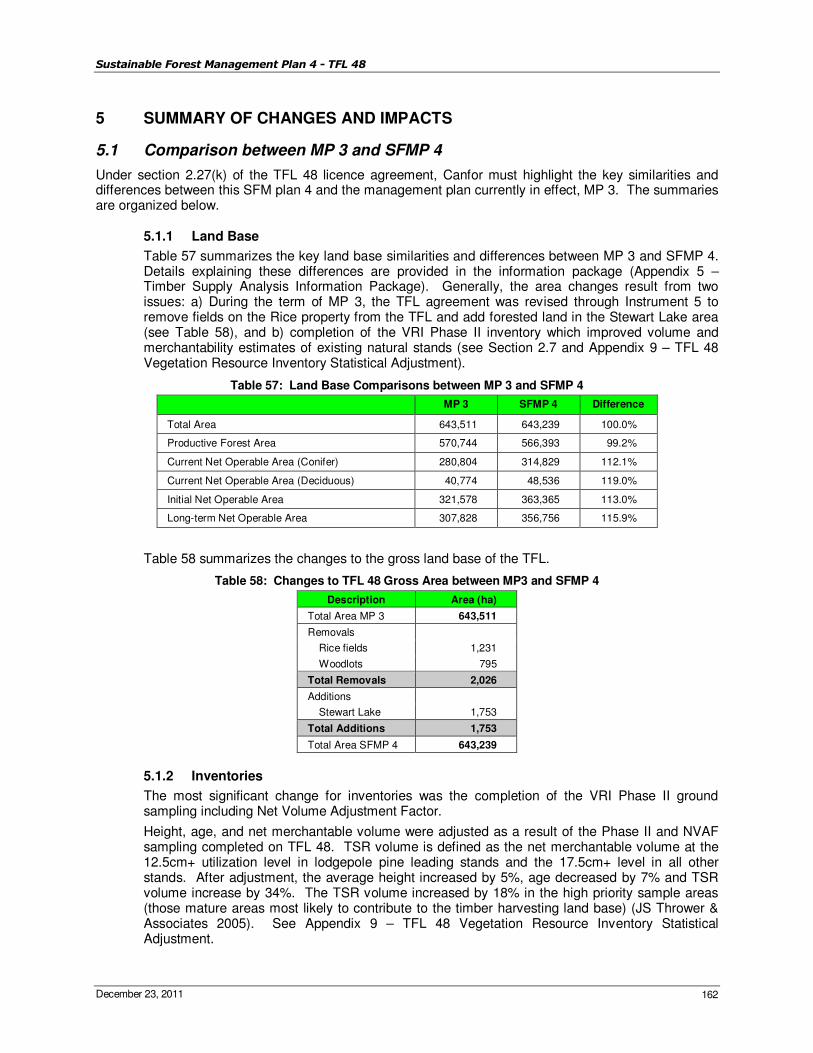
Sustainable Forest Management Plan 4 - TFL 48
December 23, 2011 162
5 SUMMARY OF CHANGES AND IMPACTS
5.1 Comparison between MP 3 and SFMP 4
Under section 2.27(k) of the TFL 48 licence agreement, Canfor must highlight the key similarities and differences between this SFM plan 4 and the management plan currently in effect, MP 3. The summaries are organized below.
5.1.1 Land Base
Table 57 summarizes the key land base similarities and differences between MP 3 and SFMP 4. Details explaining these differences are provided in the information package (Appendix 5 – Timber Supply Analysis Information Package). Generally, the area changes result from two issues: a) During the term of MP 3, the TFL agreement was revised through Instrument 5 to remove fields on the Rice property from the TFL and add forested land in the Stewart Lake area (see Table 58), and b) completion of the VRI Phase II inventory which improved volume and merchantability estimates of existing natural stands (see Section 2.7 and Appendix 9 – TFL 48 Vegetation Resource Inventory Statistical Adjustment).
Table 57: Land Base Comparisons between MP 3 and SFMP 4
MP 3 SFMP 4 Difference
Total Area 643,511 643,239 100.0%
Productive Forest Area 570,744 566,393 99.2%
Current Net Operable Area (Conifer) 280,804 314,829 112.1%
Current Net Operable Area (Deciduous) 40,774 48,536 119.0%
Initial Net Operable Area 321,578 363,365 113.0%
Long-term Net Operable Area 307,828 356,756 115.9%
Table 58 summarizes the changes to the gross land base of the TFL.
Table 58: Changes to TFL 48 Gross Area between MP3 and SFMP 4
Description Area (ha)
Total Area MP 3 643,511
Removals
Rice fields 1,231
Woodlots 795
Total Removals 2,026
Additions
Stewart Lake 1,753
Total Additions 1,753
Total Area SFMP 4 643,239
5.1.2 Inventories
The most significant change for inventories was the completion of the VRI Phase II ground sampling including Net Volume Adjustment Factor.
Height, age, and net merchantable volume were adjusted as a result of the Phase II and NVAF sampling completed on TFL 48. TSR volume is defined as the net merchantable volume at the 12.5cm+ utilization level in lodgepole pine leading stands and the 17.5cm+ level in all other stands. After adjustment, the average height increased by 5%, age decreased by 7% and TSR volume increase by 34%. The TSR volume increased by 18% in the high priority sample areas (those mature areas most likely to contribute to the timber harvesting land base) (JS Thrower & Associates 2005). See Appendix 9 – TFL 48 Vegetation Resource Inventory Statistical Adjustment.
Sustainable Forest Management Plan 4 - TFL 48
December 23, 2011 163
5.1.3 Planning
During the term of MP 3, Canfor has implemented three significant planning initiatives:
• Implementation of the Dunlevy Creek Management Plan which sets allowable amounts of harvest and timing of entries by decade for each sub unit within the DCMP area (see Section 2.4.2 and 3.9
• Implementation of a more structured and scientifically credible approach to sustaining biological richness as described in Section 2.5
• Adoption of Natural Disturbance Units strategies (see Section 2.6) is a significant change in the way seral constraints and patch targets are developed and implemented in comparison to the MSRM Old Growth Order.
• CSA Sustainable Forestry System Standard CAN/CSA Z809-08 (see Section 2.2.2).
5.1.4 Mountain Pine Beetle
During the term of MP 3 a significant threat from mountain pine beetle (MPB) to the lodgepole pine forests has occurred within TFL 48. In 2004 the first occurrences of MPB were detected on TFL 48. Currently there are approximately 25 million m
3 of mature lodgepole pine greater than 80
years old within the timber harvesting land base. The impact of rapid expansion of the MPB in other parts of the province draws attention to the potential for a similar situation on TFL 48.
As a result of the incidence of MPB on TFL 48 a short-term increase in the harvest level is proposed to allow more management flexibility to reduce MPB infested and susceptible mature lodgepole pine forests. See Section 3.22 for a detailed discussion on the impacts and strategies associated with this proposal.
5.2 Impact Summary of Implementing MP 3
5.2.1 Harvest Levels
The harvest rate increased for the period of MP 3 by 65,000m3 higher for conifer stands and
1,000m3 higher for deciduous stands than the harvest level during MP 2.
5.2.2 Economic Opportunities
Economic opportunities provided from TFL 48 are partly related to the allowable annual cut determined by the provincial Chief Forester. Certainly, economic opportunities are more a function of the costs associated with manufacturing, marketing and delivering products to our customers and the sales price these customers are willing or able to pay.
By preparing MP 3 and fulfilling the requirements of our TFL 48 agreement, the stability of this tenure has supported shareholder confidence, assisted in securing long-term contracts with customers and provided a basis from which to explore new markets.
In developing MP 3, we improved several inventories, which have allowed us to refine our estimates of, monitor and incorporate the economic operability of timber resources within our timber supply analysis. This has helped us to identify and explore new opportunities.
5.2.3 Employee and Contractor Opportunities
The number of persons directly and indirectly employed from TFL 48 operations is partly related to the allowable annual cut determined by the provincial Chief Forester. The approved harvest rate for MP 3 has supported a stable employee and contractor workforce during the term of MP 3.
5.2.4 Non-timber Values
The approved AAC incorporated spatial constraints for timber harvesting and protecting non-timber resources. The improvements in forest resource inventories have helped us to plan and ensure that non-timber values are protected. This is further expanded and improved with the
Sustainable Forest Management Plan 4 - TFL 48
December 23, 2011 164
draft SFMP 4. The AAC approved in MP 3 have not precluded the protection of non-timber values within TFL 48.
5.3 Impact and Summary of Implementing SFMP 4
Forest law, all relevant legislation, standards and procedures, and the objectives proposed in the Dawson Creek LRMP are fundamental to management practices and standards on TFL 48. Constraints imposed by these references are considered within our proposed Sustainable Forest Management Plan. Consequently, changes to these constraints may, in turn, affect the expected impacts on these factors.
5.3.1 Harvest Levels
The conifer harvest rate proposed for the period of SFMP 4 (Section 3.22) is 744,000 m3/year
approximately 219,000m3 higher than the current coniferous harvest level. This increase is
primarily attributable to improvements in forest inventory and improvements in site productivity estimates of future managed stands (SIBEC). It is proposed that 70% of the total coniferous harvest level will be targeted towards pine in the first 10 years to address the growing mountain pine beetle infestation.
The deciduous harvest rate proposed for the period of SFMP 4 (Section 3.22) is 101,300 m3/year
approximately 46,300 m3
higher than the current deciduous harvest level. This increase is primarily attributable to improvements in forest inventory and improvements in site productivity estimates of future managed stands (SIBEC)
5.3.2 Economic Opportunities
Economic opportunities provided from TFL 48 are partly related to the allowable annual cut determined by the provincial Chief Forester. Certainly, economic opportunities are more a function of the costs associated with manufacturing, marketing and delivering products to our customers and the sales price these customers are willing or able to pay.
The short term (10 year) strategy is to aggressively attack the MPB infestation on TFL 48, the intent is to protect the long-term economic opportunity offered by TFL 48 to the communities in the Peace area as well as employees and contractors. The increase in AAC will provide more flexibility within the harvest levels to aggressively attack mountain pine beetle infestations while protecting the long-term sustainable harvest levels.
5.3.3 Employee and Contractor Opportunities
The number of persons directly and indirectly employed from TFL 48 operations is partly related to the allowable annual cut determined by the provincial Chief Forester. The proposed harvest rate for SFMP 4 will support an increase of employment in the short-term and in the long-term.
5.3.4 Non-timber Values
SFMP 4 includes a comprehensive and balanced approach to protecting non-timber values (see Sections 2.5, 2.6 and Section 3). The proposed AAC (Section 3.22) does not require a compromise in non-timber values in the short or long term.
Sustainable Forest Management Plan 4 - TFL 48
December 23, 2011 165
6 PUBLIC REVIEW OF SFMP 4
6.1 Chetwynd Public Advisory Committee
In February 2000 Canfor formed a Public Advisory Committee (PAC) to develop sustainable forest management indicators and objectives for Tree Farm Licence (TFL) 48.
The PAC helps ensure that sustainable forest “decisions are made as a result of informed, inclusive, and fair consultation with local people who are directly affected by or have an interest in sustainable forest management decisions”. The PAC represents the diverse range of interests in the TFL and:
• provides input on:
� values, objectives, indicators and targets as related to CSA
� design of Sustainable Forest Management (SFM) system, monitoring system, and evaluation process
• reviews performance evaluations and make recommendations for improvement
• provides input to the communication strategy to provide feedback to interested parties about the defined forest area, particularly the results of performance evaluations related to the critical elements of the Canadian Council of Forest Ministers (CCFM) criteria
• refines and implements the public involvement program
The PAC was comprised of the following interests during the term of development of the draft Sustainable Management Plan 4 (2004/2005):
• Communities, Environment, Forest Workers, Independent Forest Operators, McLeod Lake Indian Band, Oil and Gas, Recreation, Saulteau First Nation, and West Moberly First Nation
In addition, the following acted as advisors to the Committee:
• BC Timber Sales, Canfor, Ministry of Forests and Range, Ministry of Agriculture and Lands, BC Environment, Northern Lights College, Tembec, Louisiana-Pacific
Members of the public were welcome to attend each PAC meeting, and provisions were made for public comment at the meetings. Notices of each PAC meeting were sent to the PAC members, advisors, the Chetwynd Echo, Chetwynd Coffee Talk Express, and members of the public who expressed interest.
During the development of the draft Sustainable Forest Management Plan 4, seven PAC meetings were held between October 2004 and September 2005 to work on updated values, objectives, indicators and targets within the context of the new CSA Standard CAN/CSA-Z809-02. A significant positive development since MP 3 has been the ongoing involvement of two First Nations groups with local interests, West Moberly First Nation and Moberly Lake Indian Band. With the exception of Saulteau First Nation, all PAC interests attended at least 3 meetings, with most interests being represented at 4 or more meetings.
During the development of the draft Sustainable Forest Management Plan 4, three PAC meetings were held between February 2011 and September 2011 to work on updated values, objectives, indicators and targets within the context of the new CSA Standard CAN/CSA-Z809-08. Prior to the transition of the SFM Plan to the new 2008 CSA Standard a recruitment of PAC members for interests that had been no longer represented on a continual basis was conducted. The recruitment of a representative for Environment, Independent Forest Operator, and Trapping/Guide-Outfitting was successful. Unfortunately the West Moberly First Nations were not represented at the Public Advisory Committee meetings however the draft plan was given to the Land Use Manager for review and comment.
Input by the PAC on the values, objectives, indicators and targets as related to CSA have been directly incorporated into the Sustainable Forest Management Plan. The PAC will remain active by meeting at least once annually to be kept apprised of progress on values, objectives, indicators and targets, and to provide input on key forest management activities within the TFL. Canfor will continue to develop news releases so that the general public is aware of the progress in relation to sustainable forest management.
See Appendix 3 – Chetwynd Public Advisory Committee Terms of Reference for the current terms of reference for the Chetwynd Public Advisory Committee.
Sustainable Forest Management Plan 4 - TFL 48
December 23, 2011 166
6.2 Summary of Public Review Opportunities
Our objective was to solicit public input regarding the draft SFMP 4 and incorporate results into SFMP 4 submitted to the provincial Chief Forester.
In addition to the extensive public involvement with the Chetwynd Public Advisory Committee as described above we invited the public to comment on our draft SFMP 4 by advertising in local newspapers in the fall of 2005. As well, individual notification letters were sent to stakeholders and special interest groups. The draft Management Plan was available for public viewing at Canfor’s Chetwynd and Vancouver offices as well as posted to our company external website (http://www.canfor.com/sustainability/certification/csa.asp).
The Chetwynd Public Advisory Committee reviewed the Draft Sustainable Forest Management Plan on September 20, 2005.
Transition of SFMP 4 from CSA Z809-02 to Z809-08 involved the establishment of nine new indicators. None of the MP indicators had been changed and therefore the extent of public involvement was the attendance at the Public Advisory Committee meetings. Public notices were published in the local newspaper for all PAC meetings. There was no public attendance outside of the PAC members.
6.3 Summary of Comments Received from Review of SFMP 4
There were no public comments specific to the content of draft SFMP 4 that required any revisions to the Management Plan.
A thorough review of draft SFMP 4 by MoFR district, regional and branch staff identified several wording problems and pointed out several items that required clarification in the text. Correspondence from the Regional Manager identified some issues to be addressed. Where appropriate, these issues were incorporated into the proposed MP.
For SFMP 4 compliant with the CSA Z809-08 Standard, there were no public comments and or PAC member comments. There was no further review by government authorities as the changes that were made to the plan did not involve sections requiring approval.
6.4 First Nations
First Nations with a defined area of interest within TFL 48 include West Moberly First Nation (WMFN), Saulteau First Nation (SFN) and McLeod Lake Indian Band (MLIB). WMFN and MLIB Band participated in the Chetwynd Public Advisory Committee (PAC) and attended meetings dealing with the development of SFMP 4.
Written and verbal invitations to all PAC meetings followed with meeting summaries documenting the results from each meeting were sent to each First Nation. A copy of the draft SFMP 4 was sent to each First Nation and comments and recommendations are encouraged. A meeting was arranged with First Nations to review the draft SFMP 4 on October 3, 2005 prior to the public review and comment process. This meeting was attended by WMFN. A second meeting was organized for November 4, 2005. This meeting was attended by MLIB and WMFN. No written comments were received as a result of these meetings or through the review and comment period. Canfor is pleased to provide an overview of the SFMP at any time with First Nation groups.
During the process to transition SFMP 4 from CSA Z809-02 to the Z809-08 Standard, the WMFNs were the only band not to participate in the Public Advisory Committee process. This may have been in large part due to the recent departure of their employed forester and thus the decrease in capacity to attend the meetings. The Draft plan was sent out to all First Nation groups for review and comment. After the plan was sent out for review the WMFN indicated that the plan should be consulted on as per the Forests and Range Resource Management Agreement signed between the WMFN and the Provincial Government. Clarification from various provincial government staff indicates the SFM Plan does not need to follow the consultation process as per the Agreement as revisions to the plan do not require government approval.
Annual reports are provided which report on the conformance and implementation of the SFMP. Opportunities to provide input during this annual review are also encouraged.
Sustainable Forest Management Plan 4 - TFL 48
December 23, 2011 167
7 REFERENCES
Beaudry P and A. Gottesfeld 2001. Effects of Forest-Harvest rates on Stream Channel Changes in the Central Interior of British Columbia. In. Toews, D. and S. Chatwin (editors). 2001. Watershed Assessment in the Southern Interior of British Columbia. Res. Br., B.C. Min For., Victoria B.C. Work Pap. 57/2001.
Bunnell, F.L., L.L. Kremsater and E. Wind. 1999. Managing to Sustain Vertebrate Richness in Forests of the Pacific Northwest: Relationships Within Stands. Environmental Review 7: 97-146.
Bunnell, F.L. 2002. Establishing objectives and evaluating success. Chapter 2 in Sustaining biological diversity on TFL-48. Review draft prepared for Canfor TFL-48. Chetwynd, B.C. 19pp.
Bunnell, F.L. 2005. A Species Accounting System for Northeastern British Columbia. Prepared for Canadian Forest Products Ltd. February 1, 2005. 15pp
Canadian Standards Association. 2002 CAN/CSA-Z809-02 Sustainable Forest Management: Requirements and Guidance. Canadian Standards Association, Mississauga, Ont. pp78 URL: http://www.csa.ca/.
Cooper, J.M., K.A. Enns, and M.G. Sheppard (1997) Status of the Black-throated Green Warbler in British Columbia. Ministry of Environment, Lands and Parks, Wildlife Working Report No. Wr-80 Victoria, BC 24 pp.
Delong, C. 2002. Natural Disturbance Units of the Prince George Forest Region: Guidance for Sustainable Forest Management. Ministry of Forests. Prince George Forest Region. Prince George, B.C.
DeLong, S. Craig. (1998) Natural Disturbance Rate and Patch Size Distribution of Forests in Northern British Columbia: Implications for Forest Management. Northwest Science, Vol 72, Special Issue 1998: 35-48
DeLong, S. Craig. (unpublished manuscript) Natural Disturbance Strategic Plan- Background Document. 15 pp.
DeLong, S.C. and D. Tanner. (1996) Managing the Pattern of Forest Harvest: Lessons from Wildfire. Biod. and Cons. 5: 1191-1205.
Canadian Standards Association. (2002) CAN/CSA-Z809-02 Sustainable Forest Management: Requirements and Guidance. Canadian Standards Association, Ontario, Canada 51 pp.
Grindal, S.D., Weir, R.D., and A. de Vries. In Review. Winter Habitat use by Martens in Young Aspen Stands in British Columbia. Proceedings of the 3rd International Martes Symposium, Cornerbrook, NF, Canada.
Harper, Fred E. 1988. Regional Wildlife Plan for the Peace Sub-region, Northern Region. Wildlife Branch, Ministry of Environment and Parks. March 1988. 212 pp.
Heard, D.C. and K.L. Vagt. 1998. Caribou in British Columbia: a 1996 Status Report Rangifer, Special Issue No. 10.
Hoyt, J.S. and Hannon, S.J. 2002. Habitat association of black-backed and three-toed woodpeckers in the boreal forest of Alberta, Canadian Journal of Forest Research. 32: 1881-1888. URL http://cjfr.nrc.ca/
JS Thrower & Associates (2005) Tree Farm Licence 48 Vegetation Resources Inventory Statistical Adjustment. Prepared for Canadian Forest Products Ltd. J.S. Thrower and Associates Ltd. 25 pp.
Lindgren and Lewis, 1997. Ecological Processes in the McGregor Model Forest: Interactions with Insects and Pathogens. Unpublished http://www.mcgregor.bc.ca/publications/InteractionsWithInsectsAndPathogens.pdf
Sustainable Forest Management Plan 4 - TFL 48
December 23, 2011 168
McElligott., Paul. (1998) Studies of the Biology of Harlequin Ducks in Tree Farm Licence 48, Northeastern British Columbia. Prepared for Canadian Forest Products Ltd. by Aquatic Resources Limited. 89 pp.
Ministry of Forests, 1995. Biodiversity Guidebook Government of British Columbia, Crown Publications.
Ministry of Forests (BC MoF). 1998. Recreation Opportunity Spectrum Inventory – Procedures and Standards Manual. The Province of British Columbia, Resources Inventory Committee Victoria, BC 30 pp URL: http://srmwww.gov.bc.ca/risc/pubs/culture/ros/index.htm
Ministry of Forests (1998) TFL Management Plan Guidelines. Victoria, BC. 147 pp.
Ministry of Forests and Ministry of Environment, Lands and Parks (1999) Landscape Unit Planning Guide. Victoria, British Columbia. 101 pp.
Ministry of Forests (BC MoF). 2001. Watershed Assessment Procedure Guidebook. 2nd
ed., Version 2.1. For. Prac. Br. Mon. For., Victoria, BC. Forest Practices Code of British Columbia Guidebook.
Ministry of Forests, 2003. Assigning Strategies to Beetle Management Units. Unpublished http://www.for.gov.bc.ca/hfp/forsite/fhdata/bmucriteria.htm
Ministry of Sustainable Resource Management (2002). Dunlevy Creek Management Plan. Prince George, British Columbia. January 24, 2002. 72pp
Porter, Aswea Dawn, 2002. Habitat selection by American Marten (Martes americana) at the Element, Patch and Stand Scales in a Young Deciduous Forest in Northern British Columbia. Thesis, University of Alberta, Edmonton Alberta.
Rocky Mountain Research Station. (1999, February 24). Homepage of Rocky Mountain Research Station, Forest Service, U.S. Department of Agriculture, [Online]. Available: http://www.fs.fed.us/rm/main/themes/disturb.html
Schuetz, Robert (2005) Tree Farm Licence #48 Timber Supply Analysis Report in Support of Sustainable Forest Management Plan 4 (Version 1b). Prepared for Canadian Forest Products Ltd. by Industrial Forestry Service Ltd. 82 pp.
Setterington, M and A. de Vries. Yellow Rail Sighting in BC, Rare Birds in Canada in 1997. Birders Journal Vol 7 (5): 257.
Setterington, M. and J. Boulanger (2000) Bird Use of Group Selection Harvested Riparian Management Areas in the Halfway River Watershed, Northeastern British Columbia - The Horseshoe Creek Project – 1999 Report-. Prepared for Canadian Forest Products Ltd. by Axys Environmental Consulting Ltd. and Integrated Ecological Research, April 2000. 78 pp.
Wells, R.W., Houde, I., Kellner, M., and Haag, D., (2003a). Local Level Indicators for Biodiversity: A preliminary evaluation of the McGregor Model Forest. Report prepared for the McGregor Model Forest Association, Prince George, BC.
Wells, R. W., Isabelle, I., Mandy, M. and Haag, D. (2003b). Local Level Indicators for Biodiversity: A preliminary evaluation of the Prince George TSA (McGregor Model Forest).
Wells, Ralph W. and Haag, Devon (2003c) Ecological Representation in TFL 48. Prepared for Canadian Forest Products Ltd. by Center for Applied Conservation Research, Department of Forest Sciences, University of British Columbia, Vancouver, BC. 22 pp.
Sustainable Forest Management Plan 4 - TFL 48
December 23, 2011 169
8 ABBREVIATIONS AND DEFINITIONS
AAC Annual Allowable Cut
AOA Archaeological Overview Assessment
AIA Archaeological Impact Assessment
AUM An animal unit month (AUM) is the quantity of forage consumed by a 450-kg cow (with or without calf) in a 30-day period.
BEC Biogeoclimatic Ecological Classification
BWBS Boreal White and Black Spruce BEC zone
CMI Change Monitoring Inventory plots used to assess long term performance of managed stands
CMT Culturally Modified Tree
COSEWIC Committee on Status of Endangered Wildlife in Canada
DCMP Dunlevy Creek Management Plan
DFA Defined Forest Area. Used interchangeably with TFL or TFL 48
ESSF Engleman Spruce Subalpine Fir BEC zone
FDP Forest Development Plan
FSP Forest Stewardship Plan. Replaces FDP under the Forest and Range Practices Act
Genus Canfor’s forest information management system. Includes both spatial and attribute information for our operational data including harvest areas, roads, and silviculture.
GPS Global Positioning System
GY Growth and Yield
LRMP Land and Resource Management Plan
LTHL Long Term Harvest Level
LTSY Long Term Sustained Yield
LU Landscape Unit
MoFR Ministry of Forests and Range
NDU Natural Disturbance Units
NVAF Net Volume Adjustment Factor
OSB Oriented Strand Board
PAC • Permanent Access Corridors (also Permanent Access Structures is used)
• Public Advisory Committee
Phase 2 plots Unbiased ground sample plots completed as part of the Vegetation Resource Inventory for TFL 48.
http://srmwww.gov.bc.ca/vri/standards/index.html - vri
ROS Recreation Opportunity Spectrum
RMZ Riparian Management Zone
Sustainable Forest Management Plan 4 - TFL 48
December 23, 2011 170
RRZ Riparian Reserve Zone
SBS Sub Boreal Spruce BEC zone
SFM Sustainable Forest Management
SP Site Plan/Silviculture Prescription (Forest and Range Practices Act/Forest Practices Code Act of BC)
TFL Tree Farm Licence
TSA Timber Supply Area
TSR Timber Supply Review
TUS Traditional Use Study
VQO Visual Quality Objective
VIA Visual Impact Assessment
VLI Visual Landscape Inventory
VRI Vegetation Resource Inventory
VSC Visual Sensitivity Class
WCB Workers Compensation Board
WTP Wildlife Tree Patch
Sustainable Forest Management Plan 4 - TFL 48
December 23, 2011 171
9 APPENDICES
Appendix 1 – Sustainable Forest Management Matrix ..................................................................... 173
Appendix 2 – BCTS SFM Policies .................................................................................................... 175 Appendix 3 – Chetwynd Public Advisory Committee Terms of Reference ....................................... 177 Appendix 4 – Cross-Reference of MoFR and CSA Requirements ................................................... 179 Appendix 5 – Timber Supply Analysis Information Package ............................................................ 185
Appendix 6 – Timber Supply Analysis Report .................................................................................. 187 Appendix 7 – Twenty Year Plan ....................................................................................................... 189 Appendix 8 – Chief Forester’s Rationale for AAC Determination ..................................................... 191 Appendix 9 – TFL 48 Vegetation Resource Inventory Statistical Adjustment ................................... 193
Appendix 10 – TFL 48 Change Monitoring Inventory Sample Plan .................................................. 195 Appendix 11 – Linkages of SFMP 4 to Dawson Creek LRMP.......................................................... 197 Appendix 12 – Map Folio .................................................................................................................. 198

Sustainable Forest Management Plan 4 - TFL 48
December 23, 2011 173
Appendix 1 – Sustainable Forest Management Matrix


Sustainable Forest Management Plan 4 - TFL 48
December 23, 2011 175
Appendix 2 – BCTS SFM Policies

Sustainable Forest Management Plan 4 - TFL 48
December 23, 2011 177
Appendix 3 – Chetwynd Public Advisory Committee Terms of Reference

Sustainable Forest Management Plan 4 - TFL 48
December 23, 2011 179
Appendix 4 – Cross-Reference of MoFR and CSA Requirements

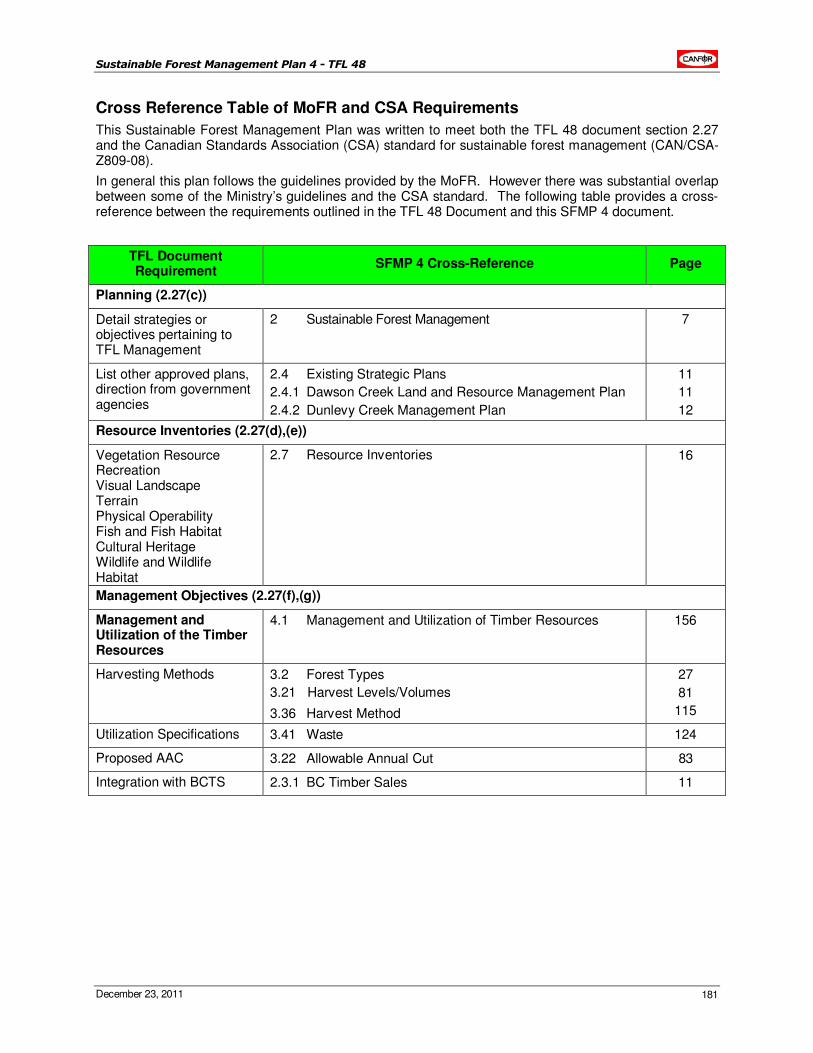
Sustainable Forest Management Plan 4 - TFL 48
December 23, 2011 181
Cross Reference Table of MoFR and CSA Requirements
This Sustainable Forest Management Plan was written to meet both the TFL 48 document section 2.27 and the Canadian Standards Association (CSA) standard for sustainable forest management (CAN/CSA-Z809-08).
In general this plan follows the guidelines provided by the MoFR. However there was substantial overlap between some of the Ministry’s guidelines and the CSA standard. The following table provides a cross-reference between the requirements outlined in the TFL 48 Document and this SFMP 4 document.
TFL Document Requirement
SFMP 4 Cross-Reference Page
Planning (2.27(c))
Detail strategies or objectives pertaining to TFL Management
2 Sustainable Forest Management 7
List other approved plans, direction from government agencies
2.4 Existing Strategic Plans
2.4.1 Dawson Creek Land and Resource Management Plan
2.4.2 Dunlevy Creek Management Plan
11
11
12
Resource Inventories (2.27(d),(e))
Vegetation Resource Recreation Visual Landscape Terrain Physical Operability Fish and Fish Habitat Cultural Heritage Wildlife and Wildlife Habitat
2.7 Resource Inventories 16
Management Objectives (2.27(f),(g))
Management and Utilization of the Timber Resources
4.1 Management and Utilization of Timber Resources 156
Harvesting Methods 3.2 Forest Types
3.21 Harvest Levels/Volumes
3.36 Harvest Method
27
81
115
Utilization Specifications 3.41 Waste 124
Proposed AAC 3.22 Allowable Annual Cut 83
Integration with BCTS 2.3.1 BC Timber Sales 11
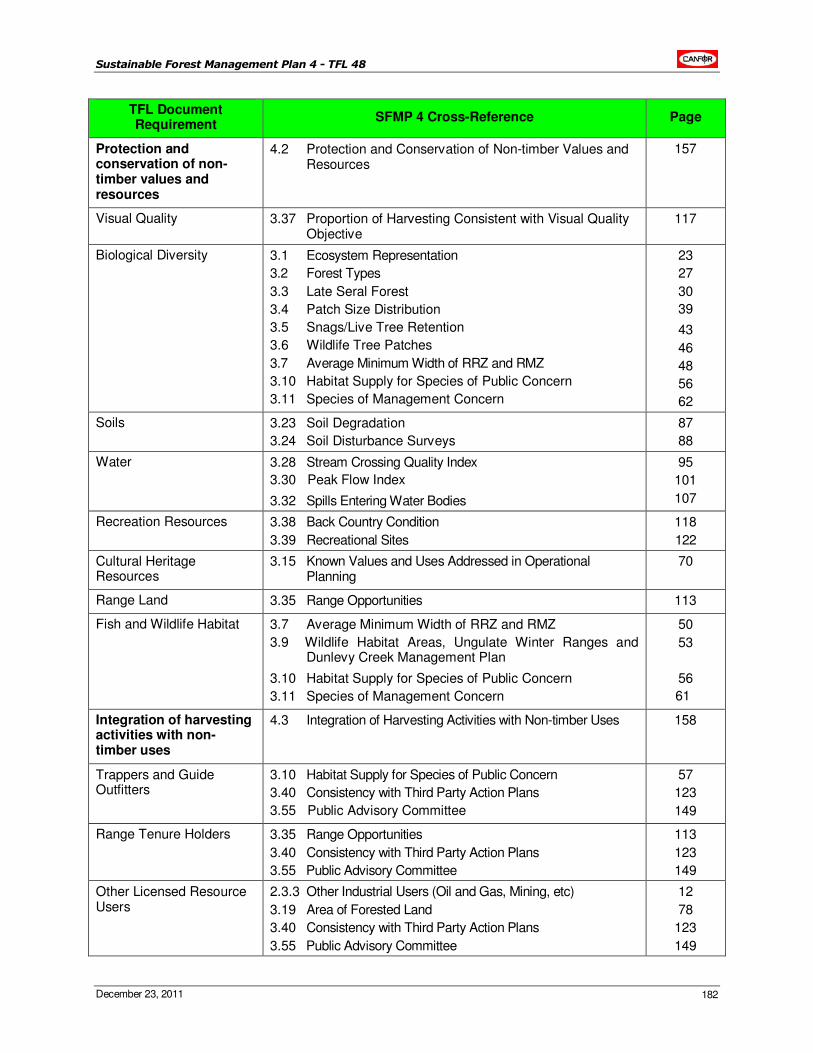
Sustainable Forest Management Plan 4 - TFL 48
December 23, 2011 182
TFL Document Requirement
SFMP 4 Cross-Reference Page
Protection and conservation of non-timber values and resources
4.2 Protection and Conservation of Non-timber Values and Resources
157
Visual Quality 3.37 Proportion of Harvesting Consistent with Visual Quality Objective
117
Biological Diversity 3.1 Ecosystem Representation
3.2 Forest Types
3.3 Late Seral Forest
3.4 Patch Size Distribution
3.5 Snags/Live Tree Retention
3.6 Wildlife Tree Patches
3.7 Average Minimum Width of RRZ and RMZ
3.10 Habitat Supply for Species of Public Concern
3.11 Species of Management Concern
23
27
30
39
43
46
48
56
62
Soils 3.23 Soil Degradation
3.24 Soil Disturbance Surveys
87
88
Water 3.28 Stream Crossing Quality Index
3.30 Peak Flow Index
3.32 Spills Entering Water Bodies
95
101
107
Recreation Resources 3.38 Back Country Condition
3.39 Recreational Sites
118
122
Cultural Heritage Resources
3.15 Known Values and Uses Addressed in Operational Planning
70
Range Land 3.35 Range Opportunities 113
Fish and Wildlife Habitat 3.7 Average Minimum Width of RRZ and RMZ
3.9 Wildlife Habitat Areas, Ungulate Winter Ranges and Dunlevy Creek Management Plan
3.10 Habitat Supply for Species of Public Concern
3.11 Species of Management Concern
50
53
56
61
Integration of harvesting activities with non-timber uses
4.3 Integration of Harvesting Activities with Non-timber Uses 158
Trappers and Guide Outfitters
3.10 Habitat Supply for Species of Public Concern
3.40 Consistency with Third Party Action Plans
3.55 Public Advisory Committee
57
123
149
Range Tenure Holders 3.35 Range Opportunities
3.40 Consistency with Third Party Action Plans
3.55 Public Advisory Committee
113
123
149
Other Licensed Resource Users
2.3.3 Other Industrial Users (Oil and Gas, Mining, etc)
3.19 Area of Forested Land
3.40 Consistency with Third Party Action Plans
3.55 Public Advisory Committee
12
78
123
149
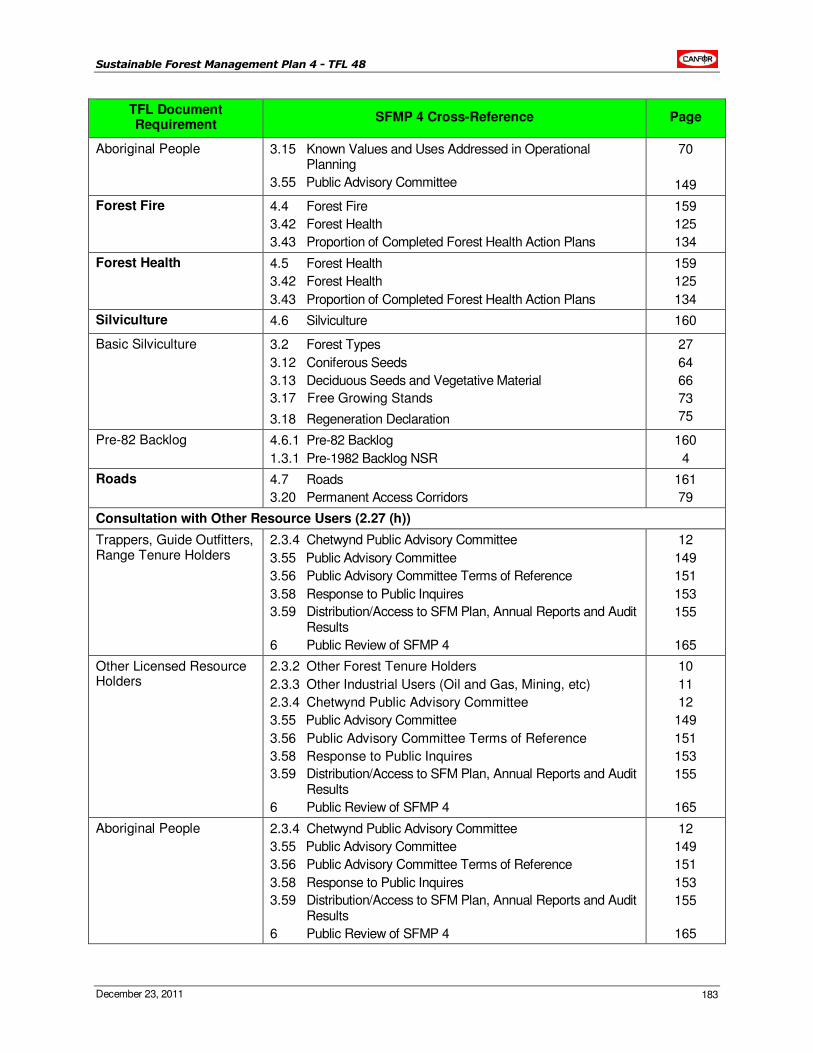
Sustainable Forest Management Plan 4 - TFL 48
December 23, 2011 183
TFL Document Requirement
SFMP 4 Cross-Reference Page
Aboriginal People 3.15 Known Values and Uses Addressed in Operational Planning
3.55 Public Advisory Committee
70
149
Forest Fire 4.4 Forest Fire
3.42 Forest Health
3.43 Proportion of Completed Forest Health Action Plans
159
125
134
Forest Health 4.5 Forest Health
3.42 Forest Health
3.43 Proportion of Completed Forest Health Action Plans
159
125
134
Silviculture 4.6 Silviculture 160
Basic Silviculture 3.2 Forest Types
3.12 Coniferous Seeds
3.13 Deciduous Seeds and Vegetative Material
3.17 Free Growing Stands
3.18 Regeneration Declaration
27
64
66
73
75
Pre-82 Backlog 4.6.1 Pre-82 Backlog
1.3.1 Pre-1982 Backlog NSR
160
4
Roads 4.7 Roads
3.20 Permanent Access Corridors
161
79
Consultation with Other Resource Users (2.27 (h))
Trappers, Guide Outfitters, Range Tenure Holders
2.3.4 Chetwynd Public Advisory Committee
3.55 Public Advisory Committee
3.56 Public Advisory Committee Terms of Reference
3.58 Response to Public Inquires
3.59 Distribution/Access to SFM Plan, Annual Reports and Audit Results
6 Public Review of SFMP 4
12
149
151
153
155
165
Other Licensed Resource Holders
2.3.2 Other Forest Tenure Holders
2.3.3 Other Industrial Users (Oil and Gas, Mining, etc)
2.3.4 Chetwynd Public Advisory Committee
3.55 Public Advisory Committee
3.56 Public Advisory Committee Terms of Reference
3.58 Response to Public Inquires
3.59 Distribution/Access to SFM Plan, Annual Reports and Audit Results
6 Public Review of SFMP 4
10
11
12
149
151
153
155
165
Aboriginal People 2.3.4 Chetwynd Public Advisory Committee
3.55 Public Advisory Committee
3.56 Public Advisory Committee Terms of Reference
3.58 Response to Public Inquires
3.59 Distribution/Access to SFM Plan, Annual Reports and Audit Results
6 Public Review of SFMP 4
12
149
151
153
155
165
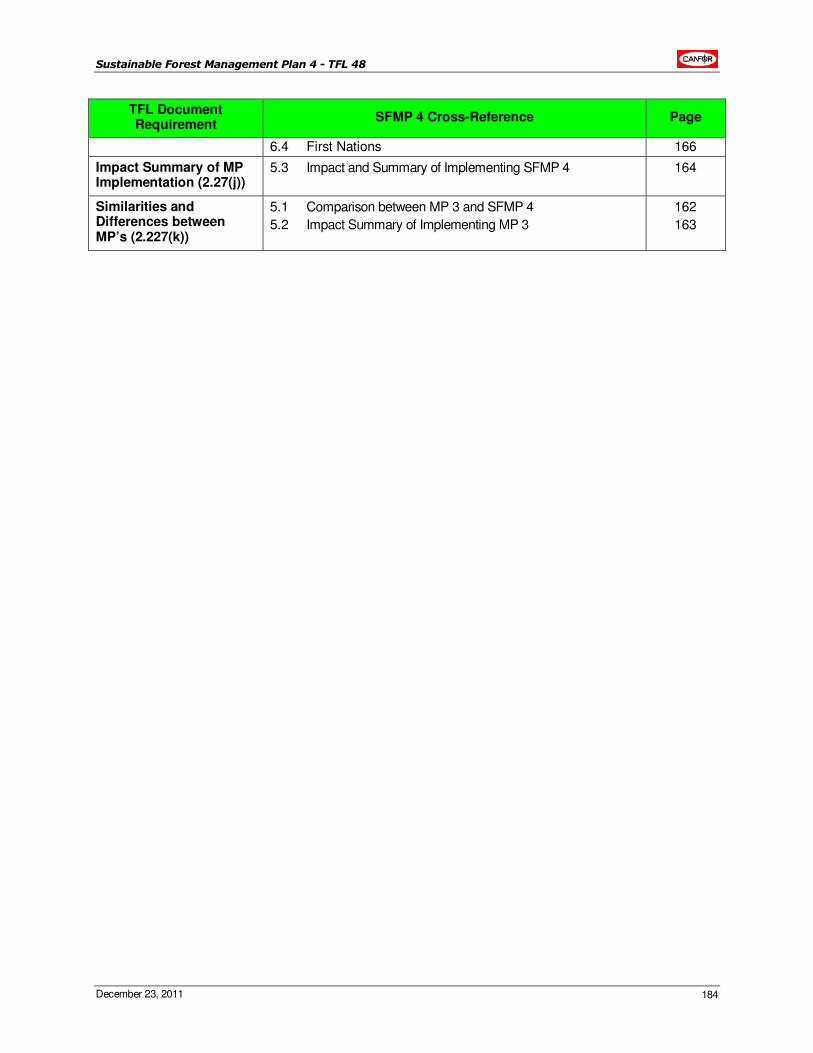
Sustainable Forest Management Plan 4 - TFL 48
December 23, 2011 184
TFL Document Requirement
SFMP 4 Cross-Reference Page
6.4 First Nations 166
Impact Summary of MP Implementation (2.27(j))
5.3 Impact and Summary of Implementing SFMP 4 164
Similarities and Differences between MP’s (2.227(k))
5.1 Comparison between MP 3 and SFMP 4
5.2 Impact Summary of Implementing MP 3
162
163
Sustainable Forest Management Plan 4 - TFL 48
December 23, 2011 185
Appendix 5 – Timber Supply Analysis Information Package


Sustainable Forest Management Plan 4 - TFL 48
December 23, 2011 187
Appendix 6 – Timber Supply Analysis Report


Sustainable Forest Management Plan 4 - TFL 48
December 23, 2011 189
Appendix 7 – Twenty Year Plan

Sustainable Forest Management Plan 4 - TFL 48
December 23, 2011 191
Appendix 8 – Chief Forester’s Rationale for AAC Determination
(Not included with Proposed SFMP)

Sustainable Forest Management Plan 4 - TFL 48
December 23, 2011 193
Appendix 9 – TFL 48 Vegetation Resource Inventory Statistical Adjustment

Sustainable Forest Management Plan 4 - TFL 48
December 23, 2011 195
Appendix 10 – TFL 48 Change Monitoring Inventory Sample Plan

Sustainable Forest Management Plan 4 - TFL 48
December 23, 2011 197
Appendix 11 – Linkages of SFMP 4 to Dawson Creek LRMP

Sustainable Forest Management Plan 4 - TFL 48
December 23, 2011 198
Appendix 12 – Map Folio