Embed Size (px)
Citation preview
Sustainable Energy for All
Global Tracking Framework 2015
WORKSHOP ON Capacity Development for Mainstreaming Energy Sustainable Development Goals (SDGs), Targets and Indicators into Statistical Programmes in Selected Latin American Countries
Dr. Gabriela Elizondo Azuela, World Bank Panama City, Panama February 5th, 2015
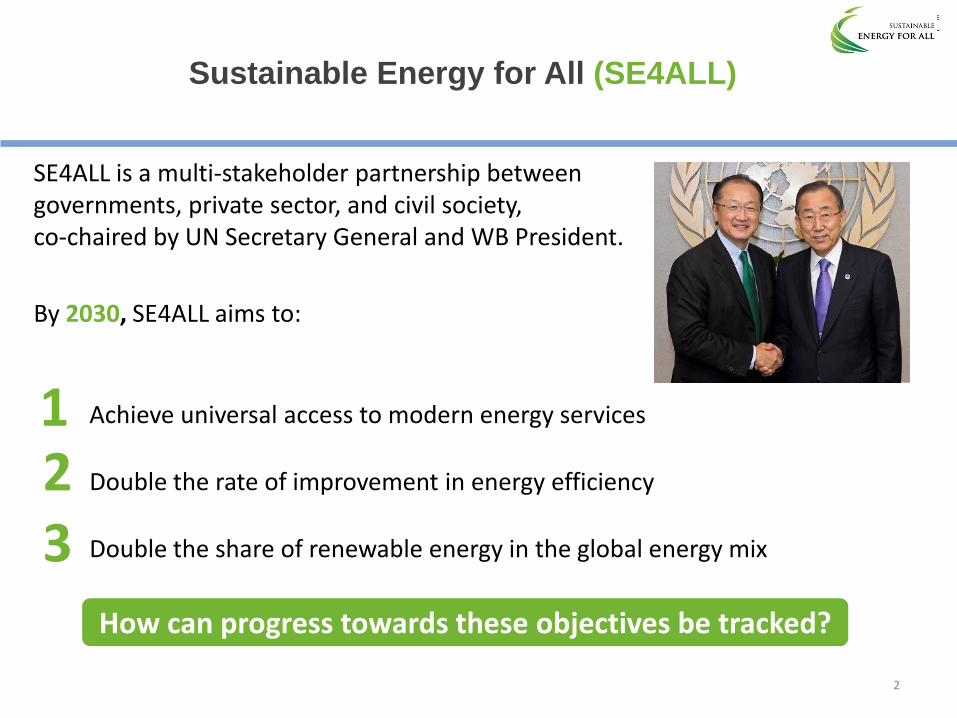
Sustainable Energy for All (SE4ALL)
SE4ALL is a multi-stakeholder partnership between governments, private sector, and civil society, co-chaired by UN Secretary General and WB President.
By 2030, SE4ALL aims to:
Achieve universal access to modern energy services
Double the rate of improvement in energy efficiency
Double the share of renewable energy in the global energy mix
1 2 3
How can progress towards these objectives be tracked?
2
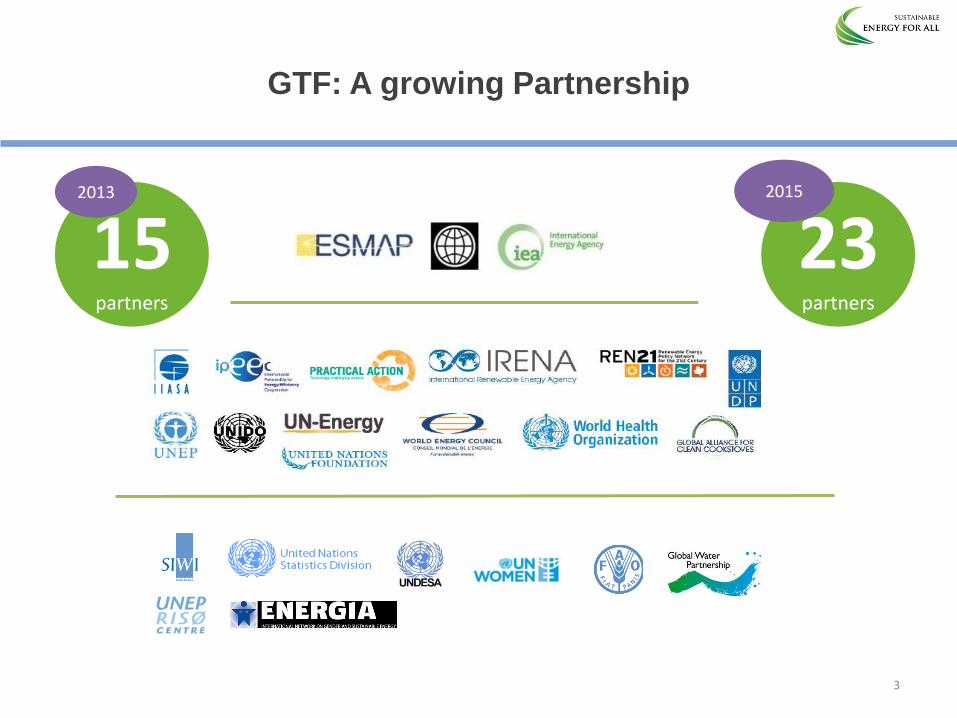
15
partners
2013
23
partners
2015
GTF: A growing Partnership
3
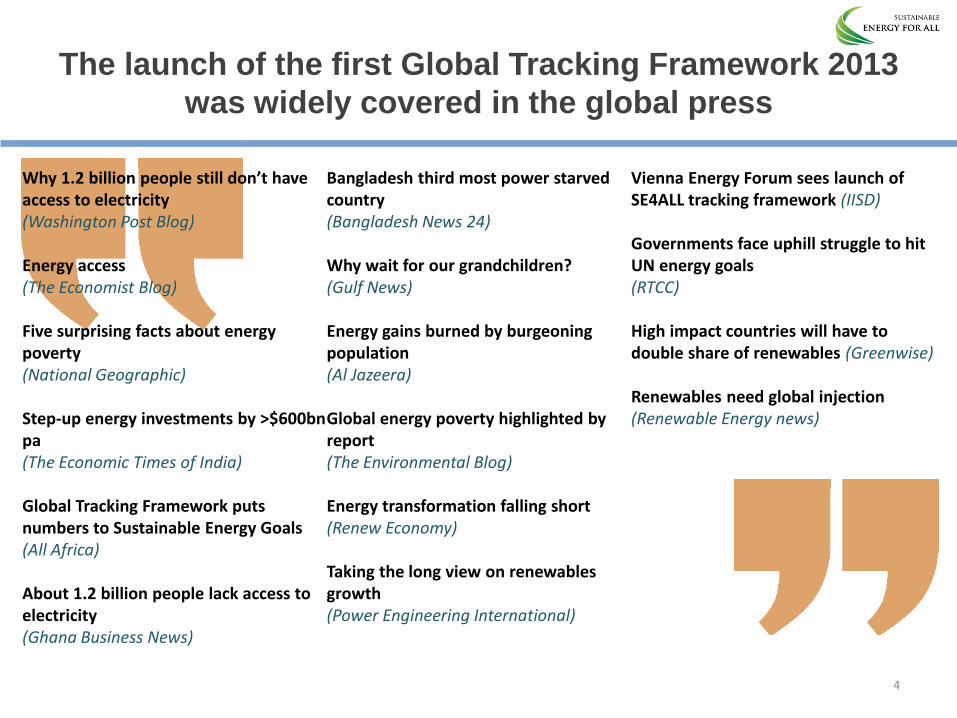
The launch of the first Global Tracking Framework 2013
was widely covered in the global press
4
Why 1.2 billion people still don’t have access to electricity (Washington Post Blog) Energy access (The Economist Blog) Five surprising facts about energy poverty (National Geographic) Step-up energy investments by >$600bn pa (The Economic Times of India) Global Tracking Framework puts numbers to Sustainable Energy Goals (All Africa) About 1.2 billion people lack access to electricity (Ghana Business News)
Bangladesh third most power starved country (Bangladesh News 24) Why wait for our grandchildren? (Gulf News) Energy gains burned by burgeoning population (Al Jazeera) Global energy poverty highlighted by report (The Environmental Blog) Energy transformation falling short (Renew Economy) Taking the long view on renewables growth (Power Engineering International)
Vienna Energy Forum sees launch of SE4ALL tracking framework (IISD) Governments face uphill struggle to hit UN energy goals (RTCC) High impact countries will have to double share of renewables (Greenwise) Renewables need global injection (Renewable Energy news)
What is the Global Tracking Framework
5
The GTF is an initial system for regular reporting based on indicators that are technically rigorous and feasible to compute from existing global data bases, and that offer scope for progressive improvement over time.
El Marco de Seguimiento Global propone un sistema para seguimiento periodico de los objectivos del SE4ALL basado en indicadores cuya medicion es factible via metodologias rigurosas, y que ademas ofrece una plataforma para el mejoramiento progresivo de este sistema
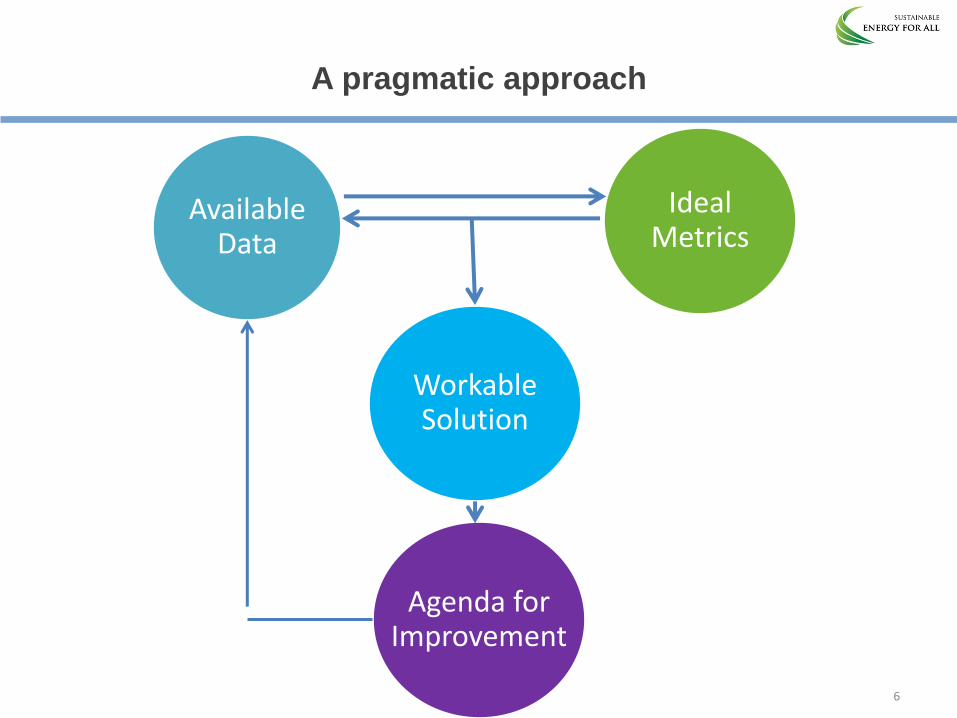
A pragmatic approach
6
Ideal Metrics
Workable Solution
Available Data
Agenda for Improvement
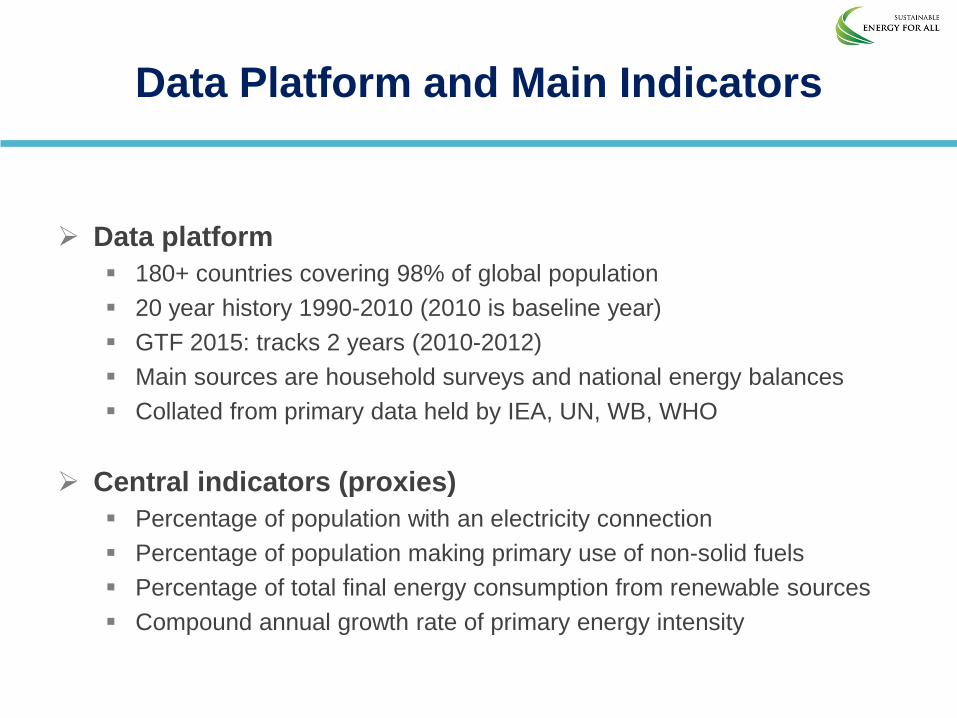
Data Platform and Main Indicators
Data platform
180+ countries covering 98% of global population
20 year history 1990-2010 (2010 is baseline year)
GTF 2015: tracks 2 years (2010-2012)
Main sources are household surveys and national energy balances
Collated from primary data held by IEA, UN, WB, WHO
Central indicators (proxies)
Percentage of population with an electricity connection
Percentage of population making primary use of non-solid fuels
Percentage of total final energy consumption from renewable sources
Compound annual growth rate of primary energy intensity
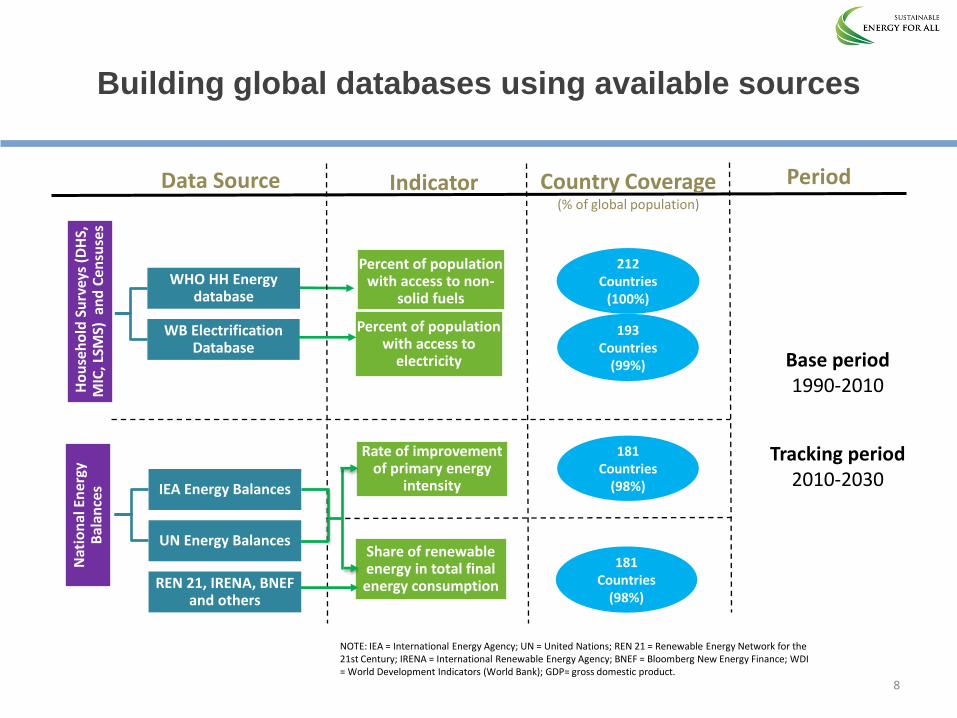
Building global databases using available sources H
ou
seh
old
Su
rvey
s (D
HS,
M
IC, L
SMS)
an
d C
en
suse
s
WHO HH Energy database
Percent of population with access to non-
solid fuels
WB Electrification Database
Nat
ion
al E
ner
gy
Bal
ance
s
Rate of improvement of primary energy
intensity IEA Energy Balances
UN Energy Balances
REN 21, IRENA, BNEF and others
Share of renewable energy in total final energy consumption
Indicator Data Source Country Coverage (% of global population)
212 Countries
(100%)
193 Countries
(99%)
181 Countries
(98%)
NOTE: IEA = International Energy Agency; UN = United Nations; REN 21 = Renewable Energy Network for the 21st Century; IRENA = International Renewable Energy Agency; BNEF = Bloomberg New Energy Finance; WDI = World Development Indicators (World Bank); GDP= gross domestic product.
181 Countries
(98%)
Period
Percent of population with access to
electricity Base period 1990-2010
Tracking period 2010-2030
8
ENERGY
ACCESS
9
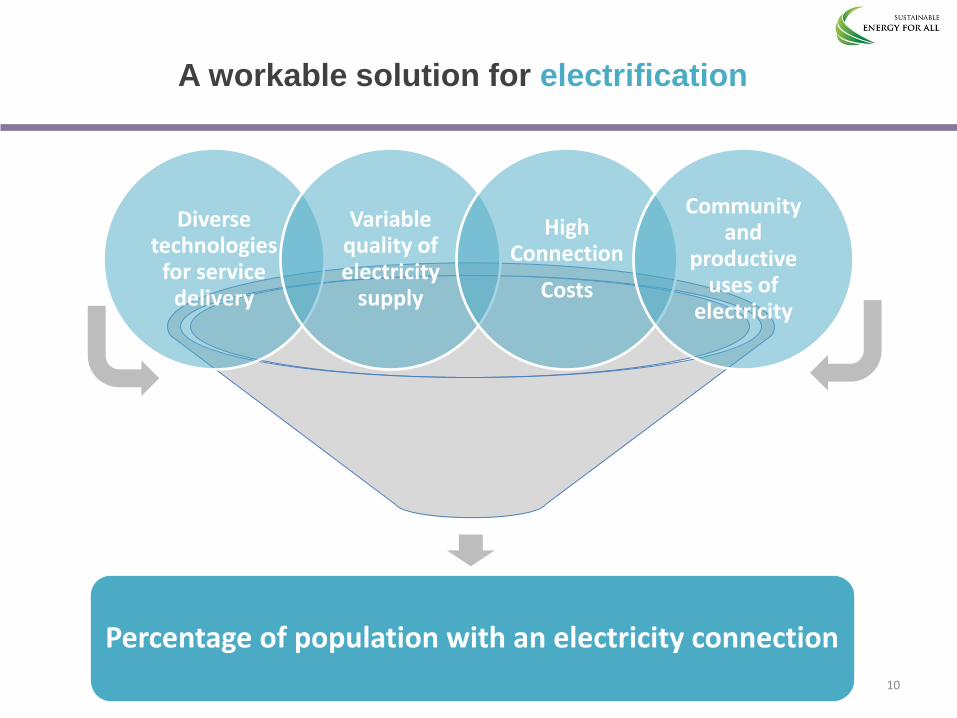
A workable solution for electrification
Diverse technologies
for service delivery
Variable quality of electricity
supply
High Connection
Costs
Community and
productive uses of
electricity
Percentage of population with an electricity connection
10
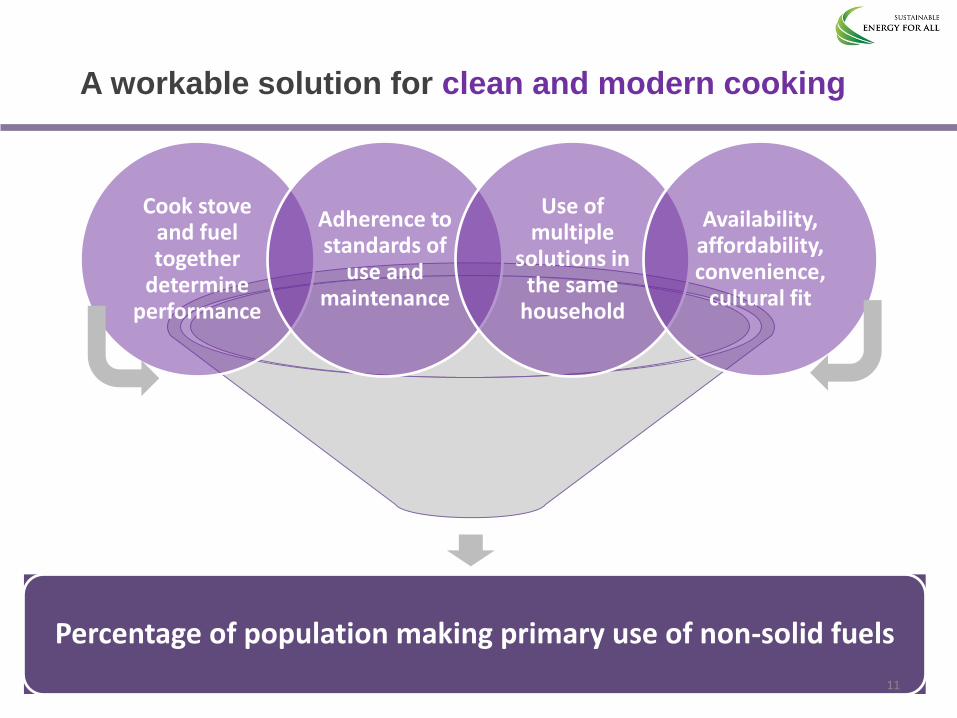
A workable solution for clean and modern cooking
Cook stove and fuel together
determine performance
Adherence to standards of
use and maintenance
Use of multiple
solutions in the same
household
Availability, affordability, convenience,
cultural fit
Percentage of population making primary use of non-solid fuels
11
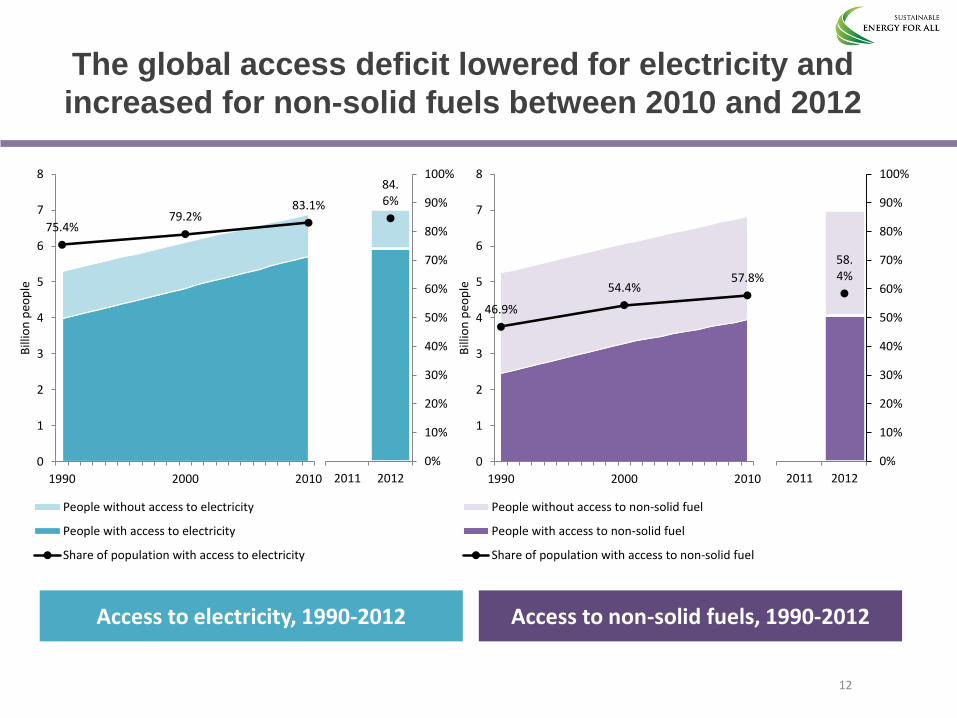
The global access deficit lowered for electricity and
increased for non-solid fuels between 2010 and 2012
Access to electricity, 1990-2012
75.4% 79.2%
83.1%
0
1
2
3
4
5
6
7
8
1990 2000 2010
Bill
ion
peo
ple
People without access to electricity
People with access to electricity
Share of population with access to electricity
Access to non-solid fuels, 1990-2012
46.9%
54.4% 57.8%
0
1
2
3
4
5
6
7
8
1990 2000 2010B
illio
n p
eop
le
People without access to non-solid fuel
People with access to non-solid fuel
Share of population with access to non-solid fuel
84.6%
0%
10%
20%
30%
40%
50%
60%
70%
80%
90%
100%
2011 2012
58.4%
0%
10%
20%
30%
40%
50%
60%
70%
80%
90%
100%
2011 2012
12
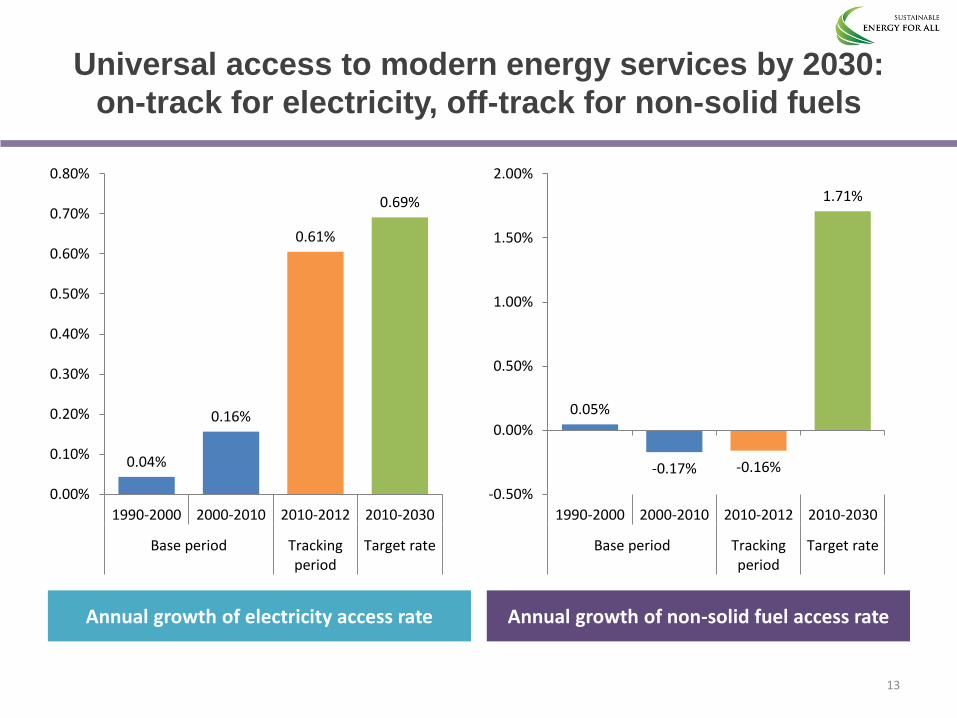
Universal access to modern energy services by 2030:
on-track for electricity, off-track for non-solid fuels
Annual growth of electricity access rate Annual growth of non-solid fuel access rate
13
0.04%
0.16%
0.61%
0.69%
0.00%
0.10%
0.20%
0.30%
0.40%
0.50%
0.60%
0.70%
0.80%
1990-2000 2000-2010 2010-2012 2010-2030
Base period Trackingperiod
Target rate
0.05%
-0.17% -0.16%
1.71%
-0.50%
0.00%
0.50%
1.00%
1.50%
2.00%
1990-2000 2000-2010 2010-2012 2010-2030
Base period Trackingperiod
Target rate
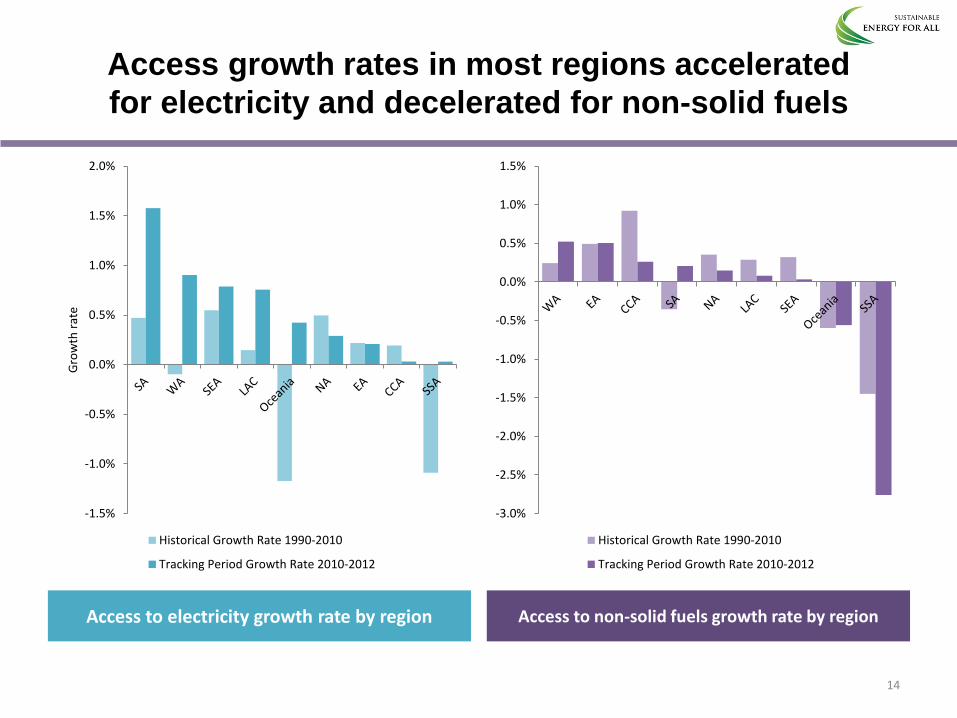
Access growth rates in most regions accelerated
for electricity and decelerated for non-solid fuels
Access to electricity growth rate by region Access to non-solid fuels growth rate by region
14
-1.5%
-1.0%
-0.5%
0.0%
0.5%
1.0%
1.5%
2.0%
Gro
wth
rat
e
Historical Growth Rate 1990-2010
Tracking Period Growth Rate 2010-2012
-3.0%
-2.5%
-2.0%
-1.5%
-1.0%
-0.5%
0.0%
0.5%
1.0%
1.5%
Historical Growth Rate 1990-2010
Tracking Period Growth Rate 2010-2012
15
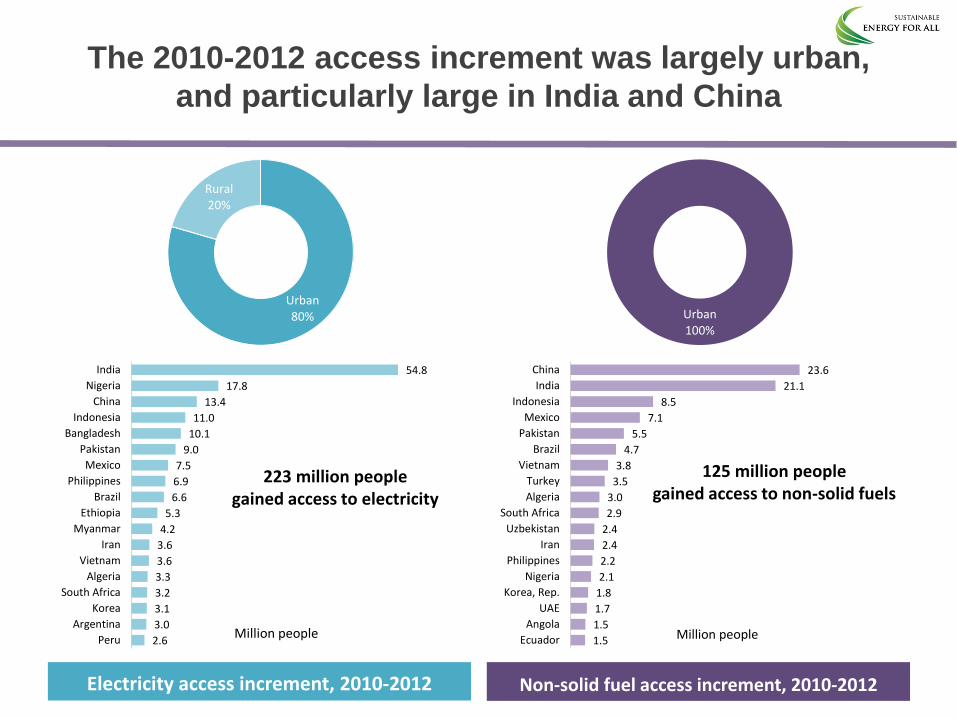
The 2010-2012 access increment was largely urban,
and particularly large in India and China
Electricity access increment, 2010-2012
Urban 80%
Rural 20%
Non-solid fuel access increment, 2010-2012
1.5
1.5
1.7
1.8
2.1
2.2
2.4
2.4
2.9
3.0
3.5
3.8
4.7
5.5
7.1
8.5
21.1
23.6
Ecuador
Angola
UAE
Korea, Rep.
Nigeria
Philippines
Iran
Uzbekistan
South Africa
Algeria
Turkey
Vietnam
Brazil
Pakistan
Mexico
Indonesia
India
China
Million people
125 million people gained access to non-solid fuels
223 million people gained access to electricity
Urban 100%
2.6
3.0
3.1
3.2
3.3
3.6
3.6
4.2
5.3
6.6
6.9
7.5
9.0
10.1
11.0
13.4
17.8
54.8
Peru
Argentina
Korea
South Africa
Algeria
Vietnam
Iran
Myanmar
Ethiopia
Brazil
Philippines
Mexico
Pakistan
Bangladesh
Indonesia
China
Nigeria
India
Million people
223 million people gained access to electricity
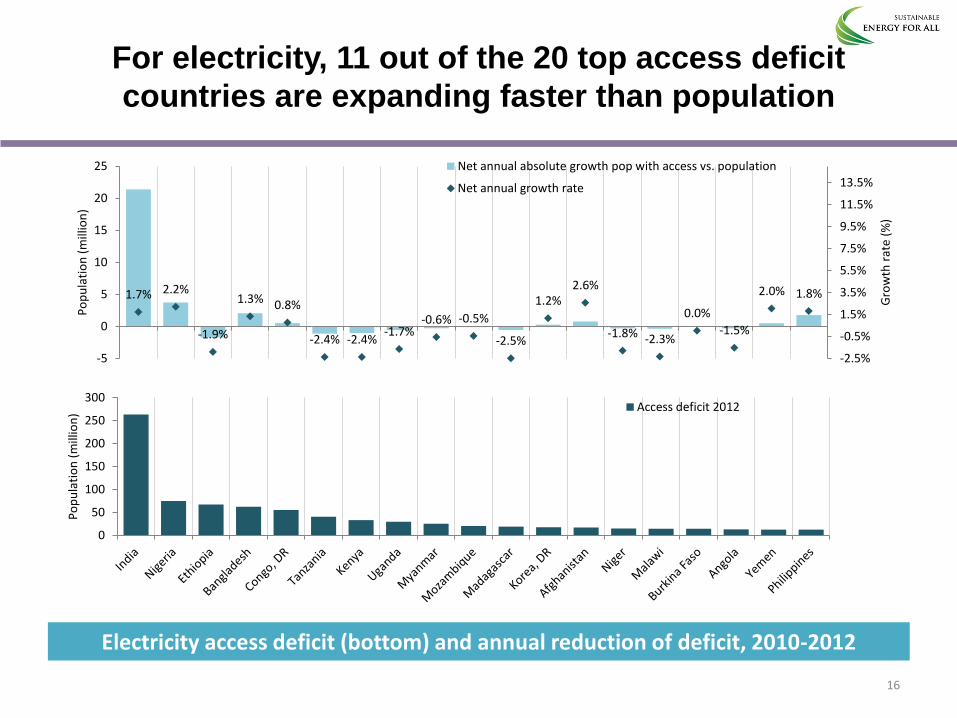
For electricity, 11 out of the 20 top access deficit
countries are expanding faster than population
Electricity access deficit (bottom) and annual reduction of deficit, 2010-2012
16
1.7% 2.2%
-1.9%
1.3% 0.8%
-2.4% -2.4% -1.7%
-0.6% -0.5%
-2.5%
1.2% 2.6%
-1.8% -2.3%
0.0%
-1.5%
2.0% 1.8%
-2.5%
-0.5%
1.5%
3.5%
5.5%
7.5%
9.5%
11.5%
13.5%
-5
0
5
10
15
20
25
Gro
wth
rat
e (%
)
Po
pu
lati
on
(m
illio
n)
Net annual absolute growth pop with access vs. population
Net annual growth rate
0
50
100
150
200
250
300
Po
pu
lati
on
(m
illio
n) Access deficit 2012
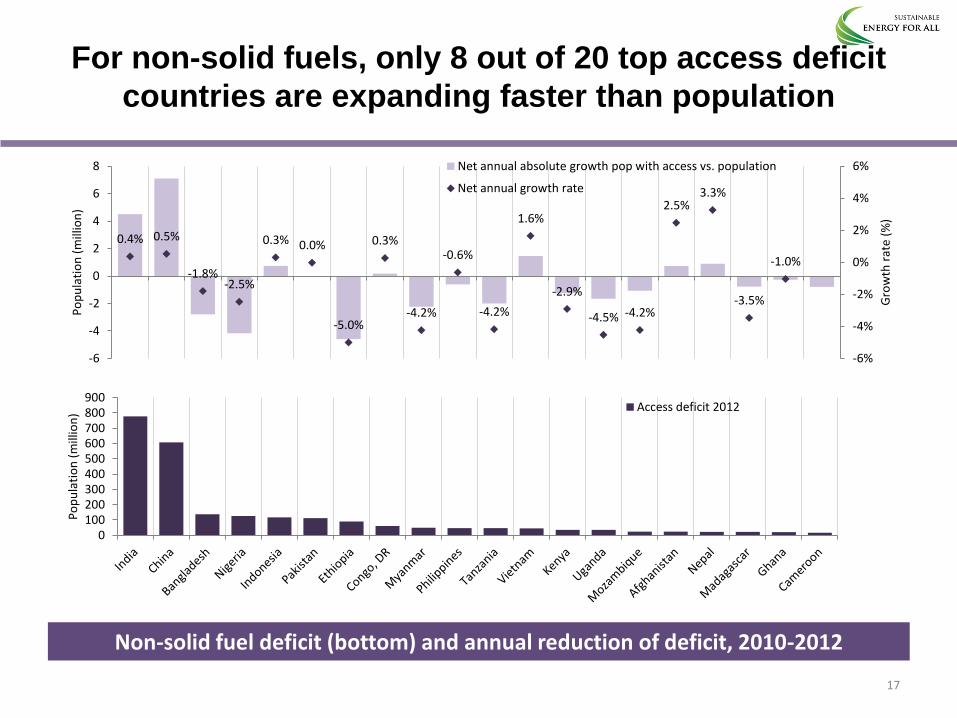
For non-solid fuels, only 8 out of 20 top access deficit
countries are expanding faster than population
Non-solid fuel deficit (bottom) and annual reduction of deficit, 2010-2012
17
0100200300400500600700800900
Po
pu
lati
on
(m
illio
n) Access deficit 2012
0.4% 0.5%
-1.8% -2.5%
0.3% 0.0%
-5.0%
0.3%
-4.2%
-0.6%
-4.2%
1.6%
-2.9%
-4.5% -4.2%
2.5% 3.3%
-3.5%
-1.0%
-6%
-4%
-2%
0%
2%
4%
6%
-6
-4
-2
0
2
4
6
8
Gro
wth
rat
e (%
)
Po
pu
lati
on
(m
illio
n)
Net annual absolute growth pop with access vs. population
Net annual growth rate
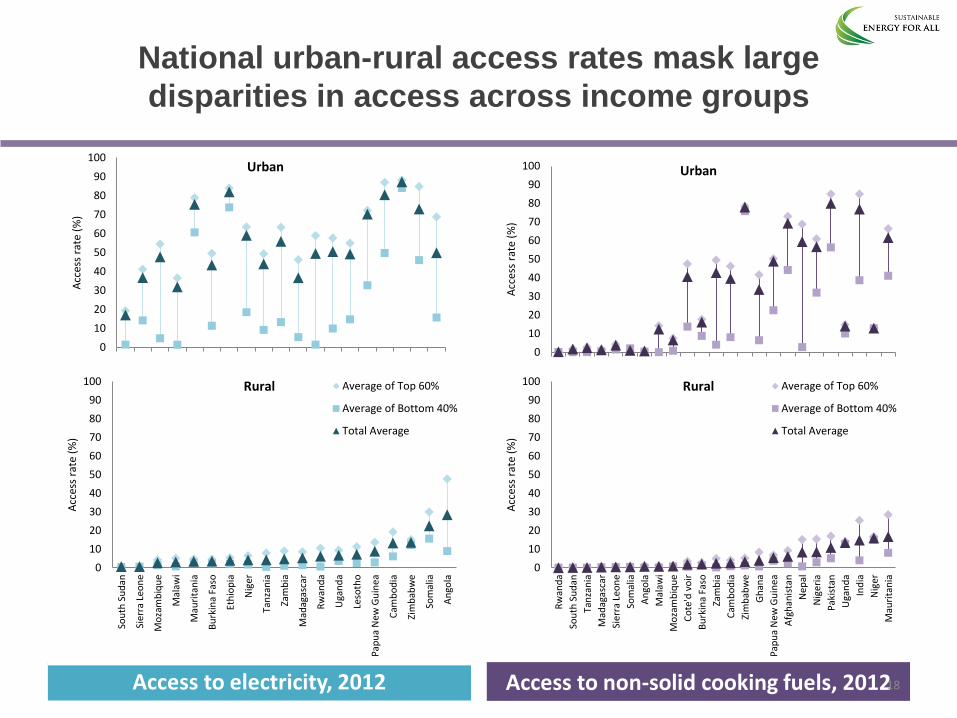
National urban-rural access rates mask large
disparities in access across income groups
Access to electricity, 2012
0
10
20
30
40
50
60
70
80
90
100
Acc
ess
rate
(%
)
Urban
Access to non-solid cooking fuels, 2012
0
10
20
30
40
50
60
70
80
90
100
Acc
ess
rate
(%
)
Urban
0
10
20
30
40
50
60
70
80
90
100
Rw
and
a
Sou
th S
ud
an
Tan
zan
ia
Mad
agas
car
Sier
ra L
eon
e
Som
alia
An
gola
Mal
awi
Mo
zam
biq
ue
Co
te'd
vo
ir
Bu
rkin
a Fa
so
Zam
bia
Cam
bo
dia
Zim
bab
we
Gh
ana
Pap
ua
New
Gu
inea
Afg
han
ista
n
Nep
al
Nig
eria
Pak
ista
n
Uga
nd
a
Ind
ia
Nig
er
Mau
rita
nia
Acc
ess
rate
(%
)
Rural Average of Top 60%
Average of Bottom 40%
Total Average
18
0
10
20
30
40
50
60
70
80
90
100
Sou
th S
ud
an
Sier
ra L
eon
e
Mo
zam
biq
ue
Mal
awi
Mau
rita
nia
Bu
rkin
a Fa
so
Eth
iop
ia
Nig
er
Tan
zan
ia
Zam
bia
Mad
agas
car
Rw
and
a
Uga
nd
a
Leso
tho
Pap
ua
New
Gu
inea
Cam
bo
dia
Zim
bab
we
Som
alia
An
gola
Acc
ess
rate
(%
)
Rural Average of Top 60%
Average of Bottom 40%
Total Average
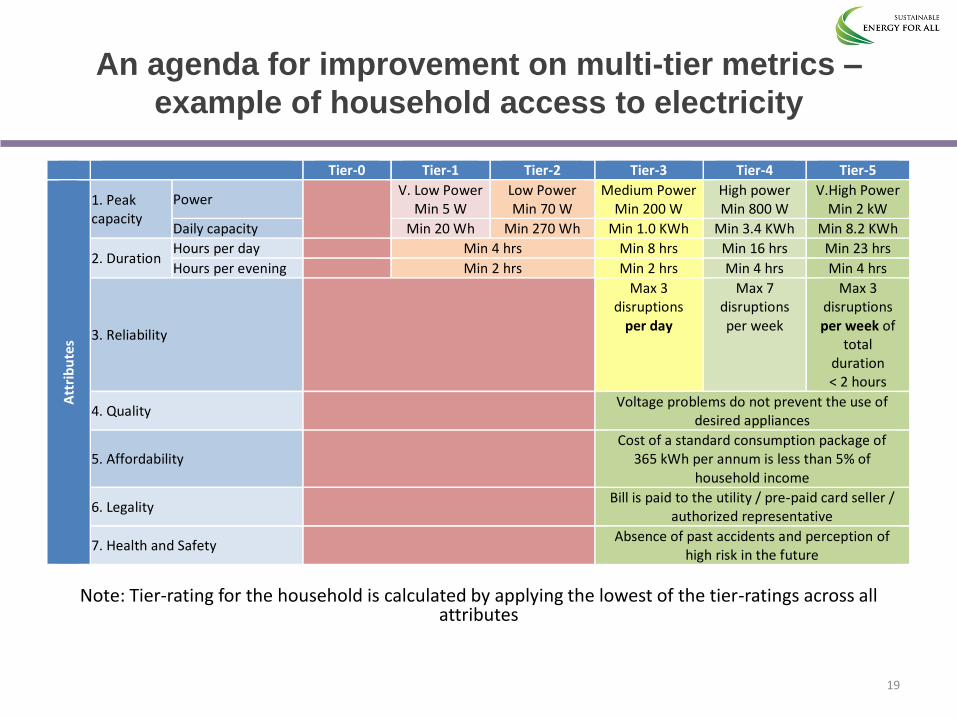
An agenda for improvement on multi-tier metrics –
example of household access to electricity
Note: Tier-rating for the household is calculated by applying the lowest of the tier-ratings across all attributes
19
Tier-0 Tier-1 Tier-2 Tier-3 Tier-4 Tier-5
Att
rib
ute
s
1. Peak capacity
Power
V. Low Power Min 5 W
Low Power Min 70 W
Medium Power Min 200 W
High power Min 800 W
V.High Power Min 2 kW
Daily capacity Min 20 Wh Min 270 Wh Min 1.0 KWh Min 3.4 KWh Min 8.2 KWh
2. Duration Hours per day Min 4 hrs Min 8 hrs Min 16 hrs Min 23 hrs
Hours per evening Min 2 hrs Min 2 hrs Min 4 hrs Min 4 hrs
3. Reliability
Max 3 disruptions
per day
Max 7 disruptions per week
Max 3 disruptions per week of
total duration < 2 hours
4. Quality Voltage problems do not prevent the use of
desired appliances
5. Affordability Cost of a standard consumption package of
365 kWh per annum is less than 5% of household income
6. Legality Bill is paid to the utility / pre-paid card seller /
authorized representative
7. Health and Safety Absence of past accidents and perception of
high risk in the future
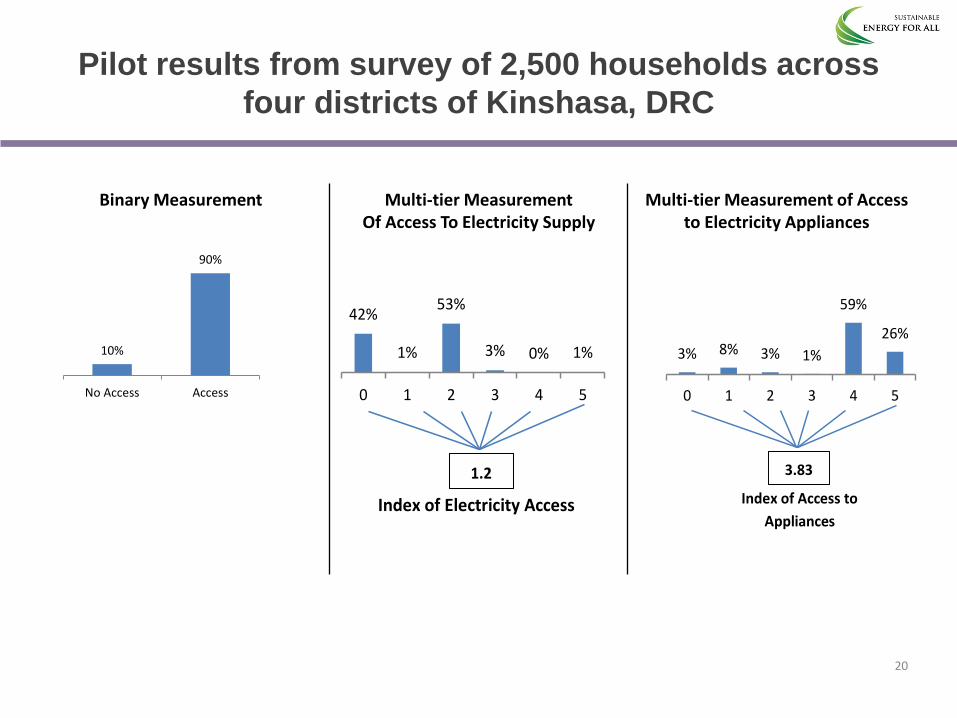
42%
1%
53%
3% 0% 1%
0 1 2 3 4 5
Index of Electricity Access
1.2
3% 8% 3% 1%
59%
26%
0 1 2 3 4 5
Index of Access to
Appliances
3.83
10%
90%
No Access Access
Binary Measurement
Multi-tier Measurement Of Access To Electricity Supply
Multi-tier Measurement of Access to Electricity Appliances
Pilot results from survey of 2,500 households across
four districts of Kinshasa, DRC
20
21
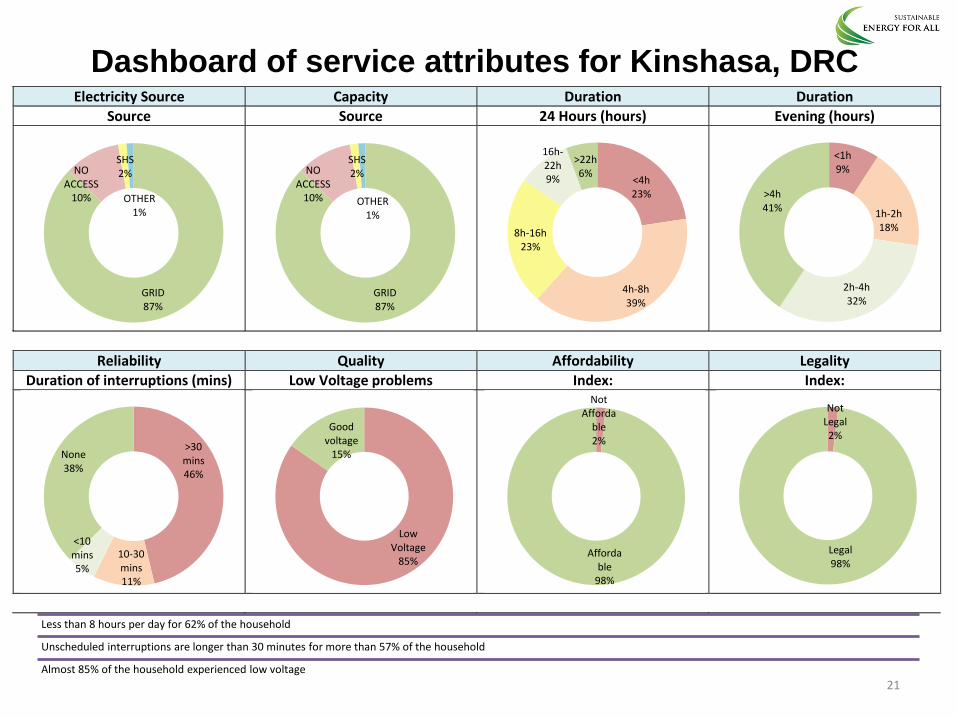
Electricity Source Capacity Duration Duration
Source Source 24 Hours (hours) Evening (hours)
Reliability Quality Affordability Legality
Duration of interruptions (mins) Low Voltage problems Index: Index:
GRID 87%
NO ACCESS
10%
SHS2%
OTHER1%
GRID 87%
NO ACCESS
10%
SHS2%
OTHER1%
<4h23%
4h-8h39%
8h-16h23%
16h-22h9%
>22h6%
<1h9%
1h-2h18%
2h-4h32%
>4h41%
>30 mins46%
10-30 mins11%
<10 mins5%
None38%
Low Voltage
85%
Good voltage
15%
Not Afforda
ble2%
Affordable
98%
Not Legal2%
Legal98%
Dashboard of service attributes for Kinshasa, DRC
Less than 8 hours per day for 62% of the household
Unscheduled interruptions are longer than 30 minutes for more than 57% of the household
Almost 85% of the household experienced low voltage
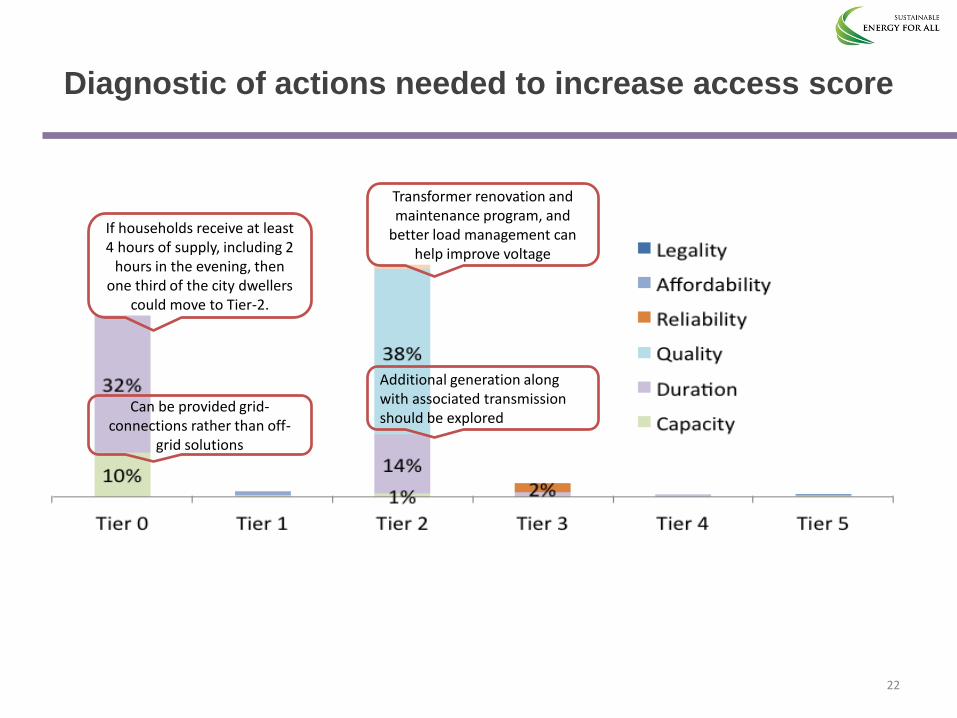
Diagnostic of actions needed to increase access score
22
Can be provided grid-connections rather than off-
grid solutions
If households receive at least 4 hours of supply, including 2
hours in the evening, then one third of the city dwellers
could move to Tier-2.
Transformer renovation and maintenance program, and
better load management can help improve voltage
Additional generation along with associated transmission should be explored
ENERGY EFFICIENCY
23
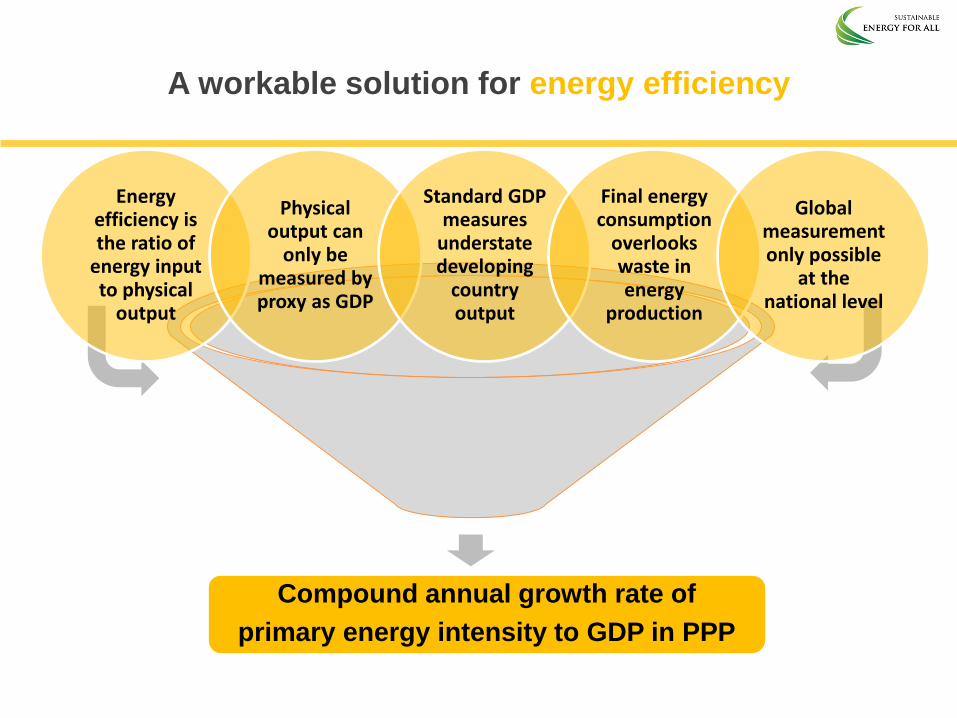
A workable solution for energy efficiency
Compound annual growth rate of
primary energy intensity to GDP in PPP
Energy efficiency is the ratio of
energy input to physical
output
Physical output can
only be measured by proxy as GDP
Standard GDP measures
understate developing
country output
Final energy consumption
overlooks waste in energy
production
Global measurement only possible
at the national level
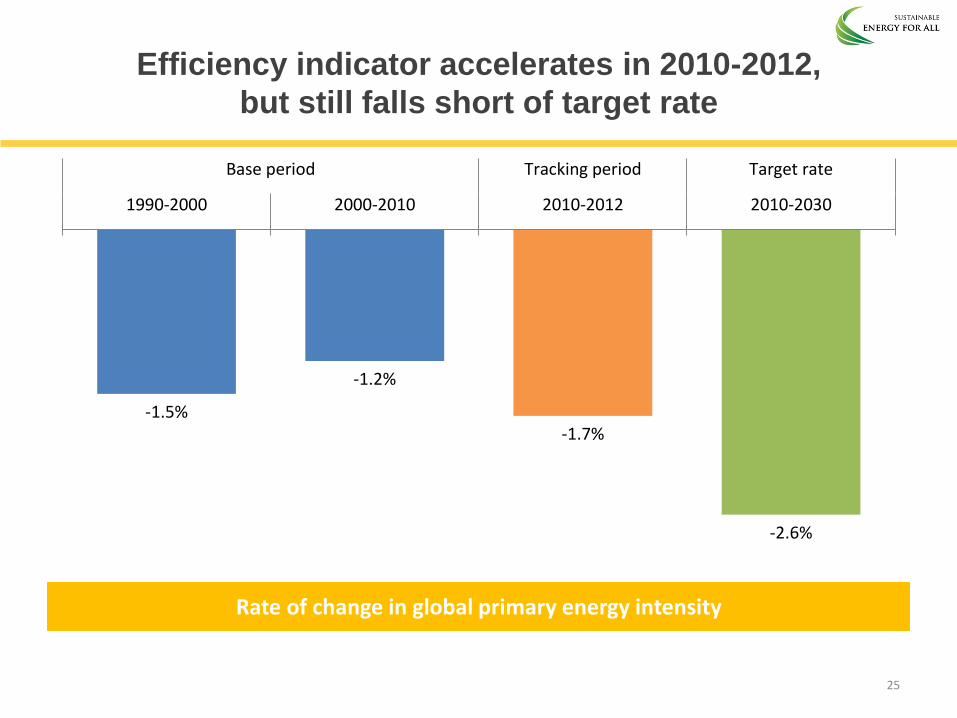
Efficiency indicator accelerates in 2010-2012,
but still falls short of target rate
Rate of change in global primary energy intensity
-1.5%
-1.2%
-1.7%
-2.6%
1990-2000 2000-2010 2010-2012 2010-2030
Base period Tracking period Target rate
25
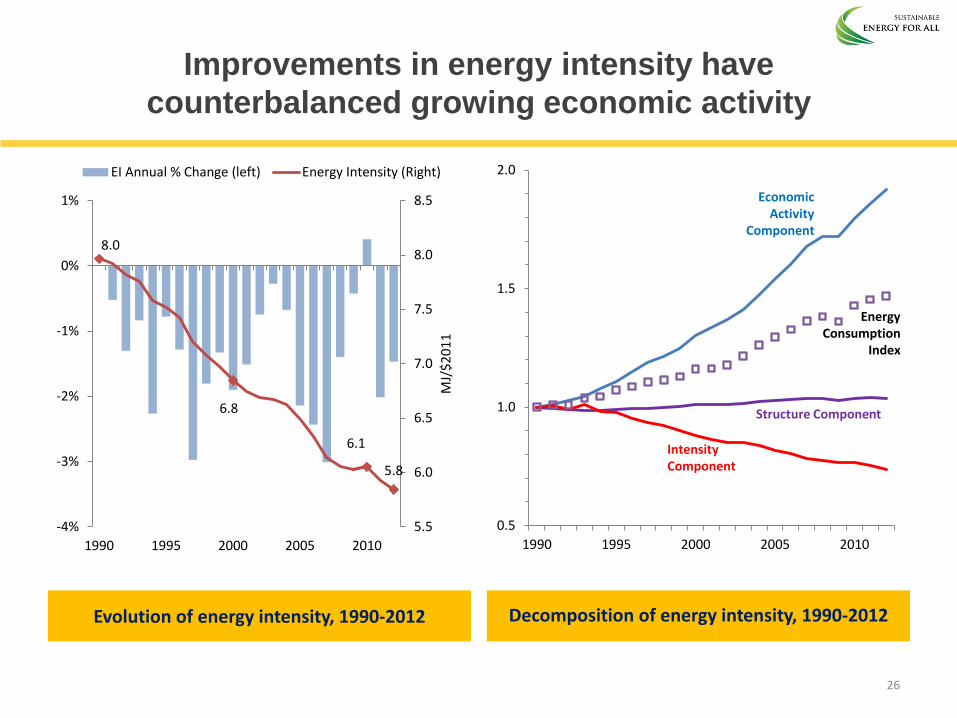
Improvements in energy intensity have
counterbalanced growing economic activity
Evolution of energy intensity, 1990-2012 Decomposition of energy intensity, 1990-2012
8.0
6.8
6.1
5.8
5.5
6.0
6.5
7.0
7.5
8.0
8.5
-4%
-3%
-2%
-1%
0%
1%
1990 1995 2000 2005 2010
MJ/
$2
01
1
EI Annual % Change (left) Energy Intensity (Right)
0.5
1.0
1.5
2.0
1990 1995 2000 2005 2010
Economic Activity
Component
Structure Component
Intensity Component
Energy Consumption
Index
26
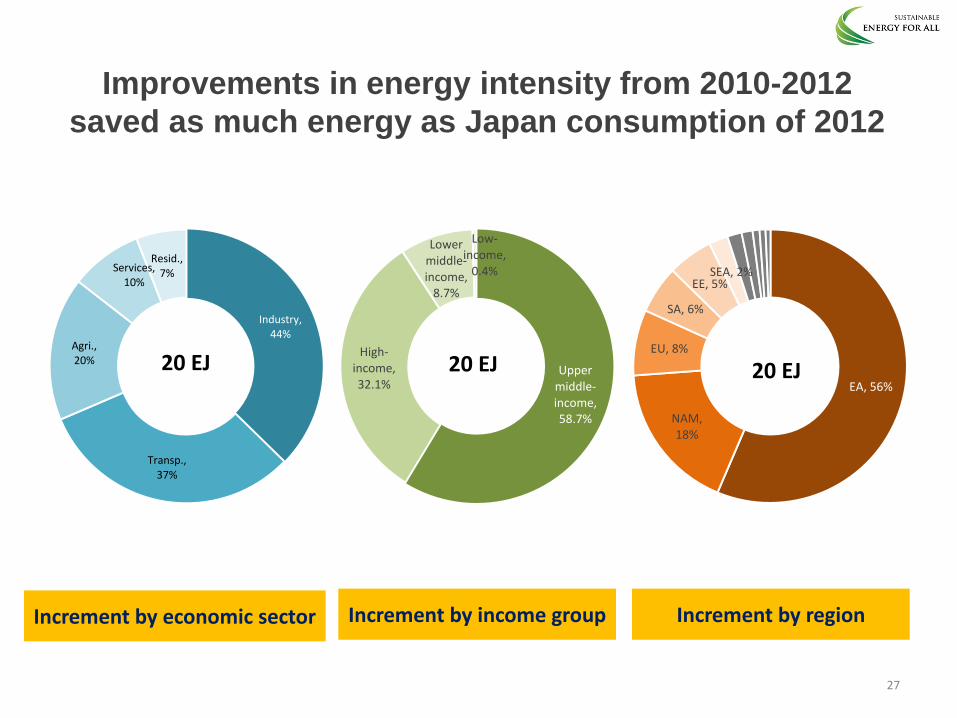
Improvements in energy intensity from 2010-2012
saved as much energy as Japan consumption of 2012
Increment by economic sector Increment by income group
27
Increment by region
EA, 56%
NAM, 18%
EU, 8%
SA, 6%
EE, 5% SEA, 2%
20 EJ Upper middle-income, 58.7%
High-income, 32.1%
Lower middle-income,
8.7%
Low-income,
0.4%
20 EJ
Industry, 44%
Transp., 37%
Agri., 20%
Services, 10%
Resid., 7%
20 EJ
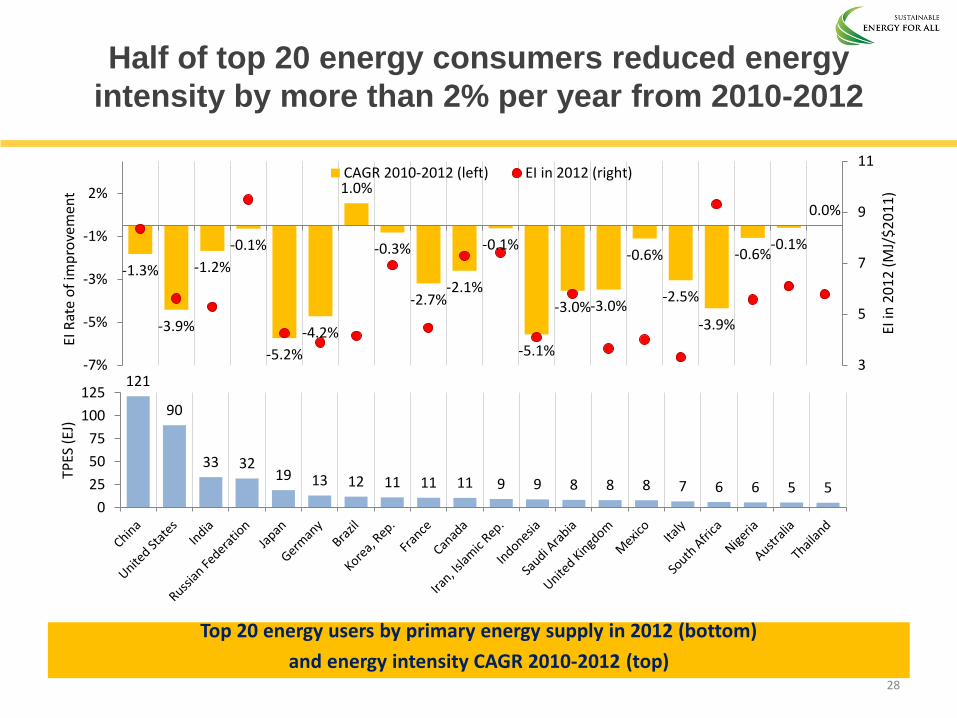
Half of top 20 energy consumers reduced energy
intensity by more than 2% per year from 2010-2012
Top 20 energy users by primary energy supply in 2012 (bottom)
and energy intensity CAGR 2010-2012 (top) 28
121
90
33 32 19 13 12 11 11 11 9 9 8 8 8 7 6 6 5 5
0
25
50
75
100
125
TPES
(EJ
)
-1.3%
-3.9%
-1.2%
-0.1%
-5.2%
-4.2%
1.0%
-0.3%
-2.7% -2.1%
-0.1%
-5.1%
-3.0% -3.0%
-0.6%
-2.5%
-3.9%
-0.6% -0.1%
0.0%
3
5
7
9
11
-7%
-5%
-3%
-1%
2%
EI in
20
12
(M
J/$
20
11
)
EI R
ate
of
imp
rove
men
t
CAGR 2010-2012 (left) EI in 2012 (right)
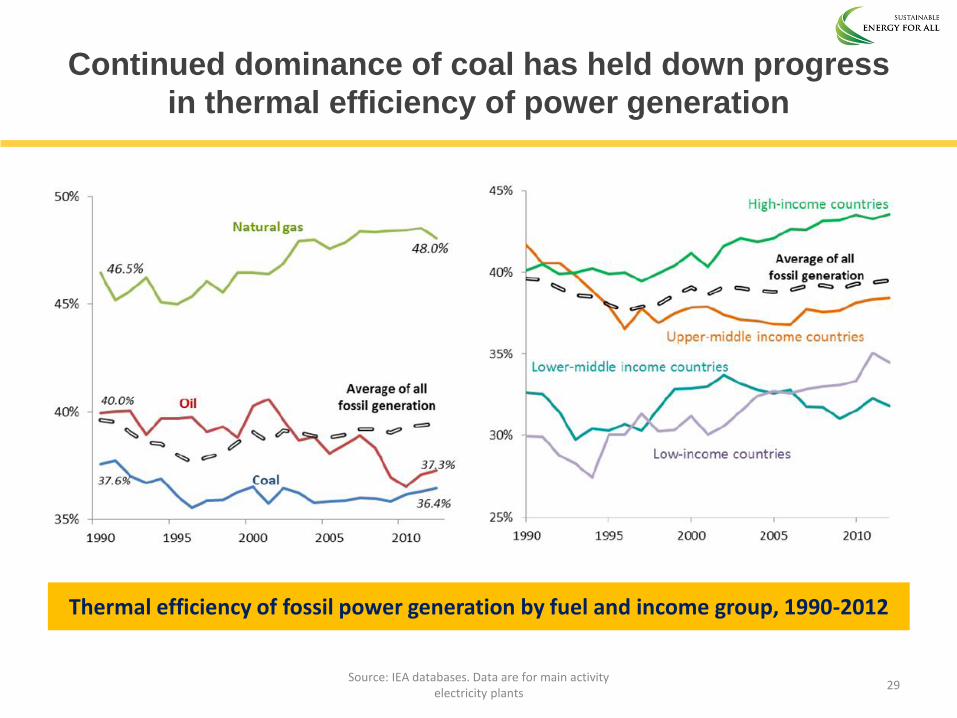
Continued dominance of coal has held down progress
in thermal efficiency of power generation
Thermal efficiency of fossil power generation by fuel and income group, 1990-2012
29 Source: IEA databases. Data are for main activity
electricity plants
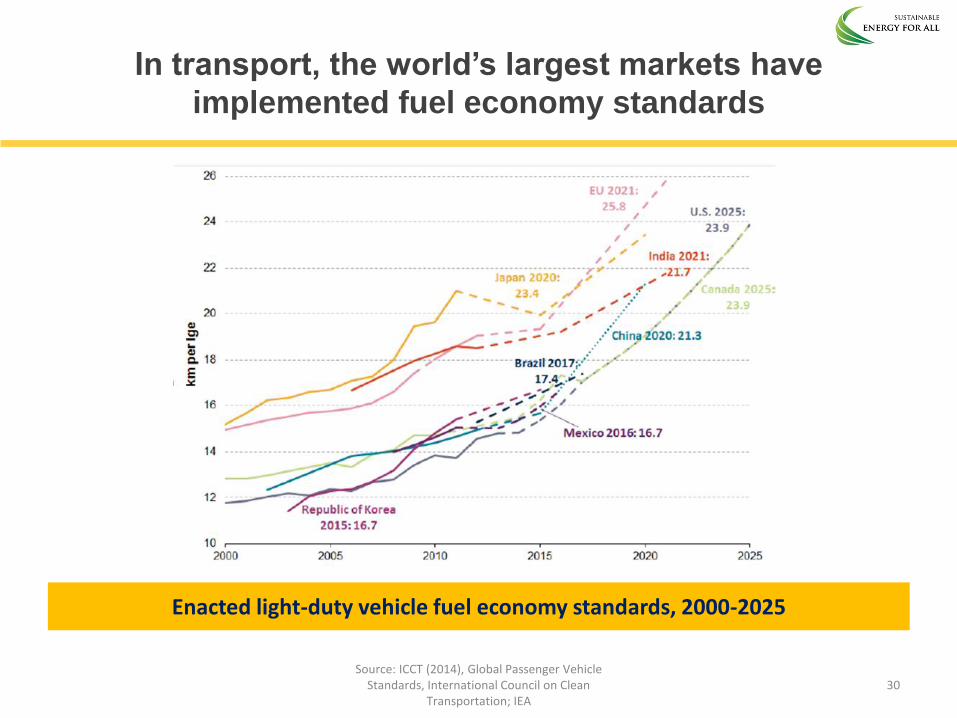
In transport, the world’s largest markets have
implemented fuel economy standards
Enacted light-duty vehicle fuel economy standards, 2000-2025
Source: ICCT (2014), Global Passenger Vehicle Standards, International Council on Clean
Transportation; IEA 30
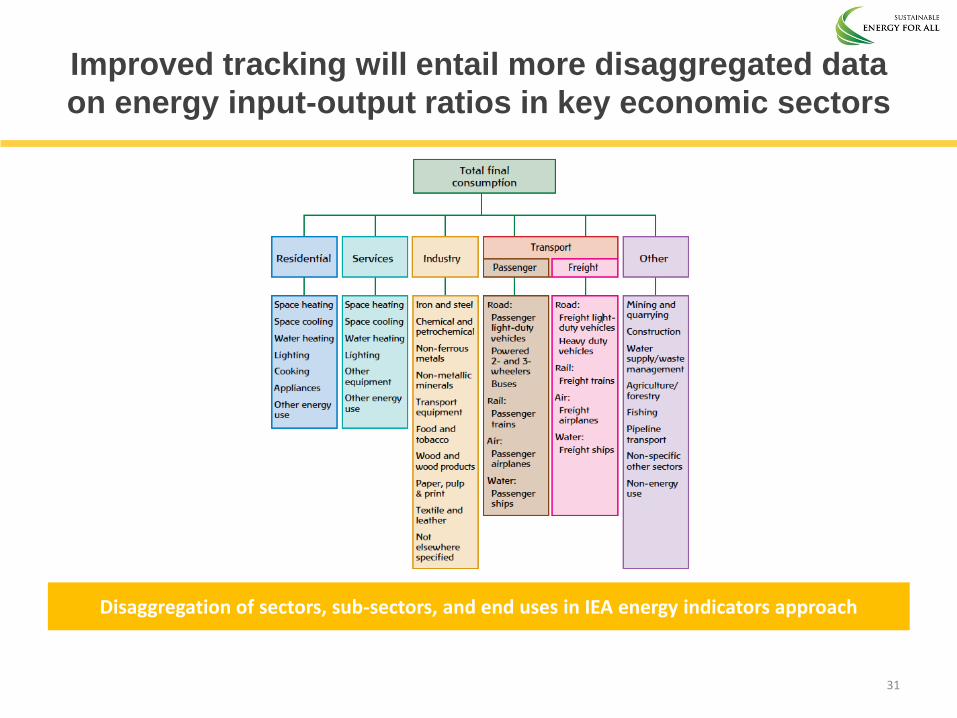
Improved tracking will entail more disaggregated data
on energy input-output ratios in key economic sectors
Disaggregation of sectors, sub-sectors, and end uses in IEA energy indicators approach
31
32
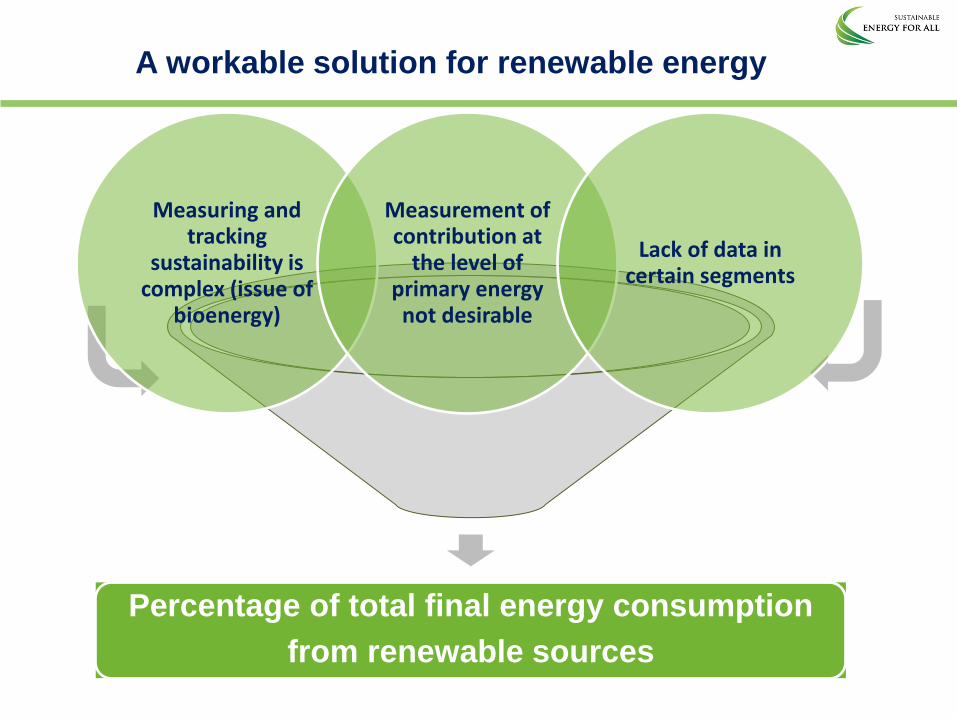
A workable solution for renewable energy
Percentage of total final energy consumption
from renewable sources
Measuring and tracking
sustainability is complex (issue of
bioenergy)
Measurement of contribution at
the level of primary energy not desirable
Lack of data in certain segments
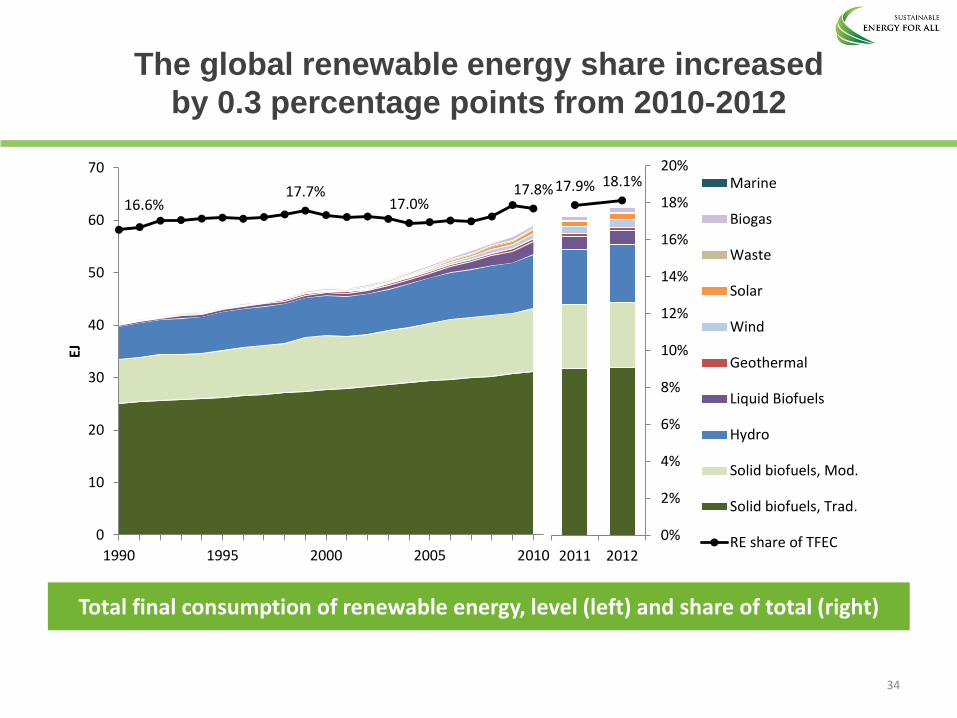
The global renewable energy share increased
by 0.3 percentage points from 2010-2012
Total final consumption of renewable energy, level (left) and share of total (right)
16.6% 17.7%
17.0% 17.8%
0
10
20
30
40
50
60
70
1990 1995 2000 2005 2010
EJ
34
17.9% 18.1%
0%
2%
4%
6%
8%
10%
12%
14%
16%
18%
20%
2011 2012
Marine
Biogas
Waste
Solar
Wind
Geothermal
Liquid Biofuels
Hydro
Solid biofuels, Mod.
Solid biofuels, Trad.
RE share of TFEC
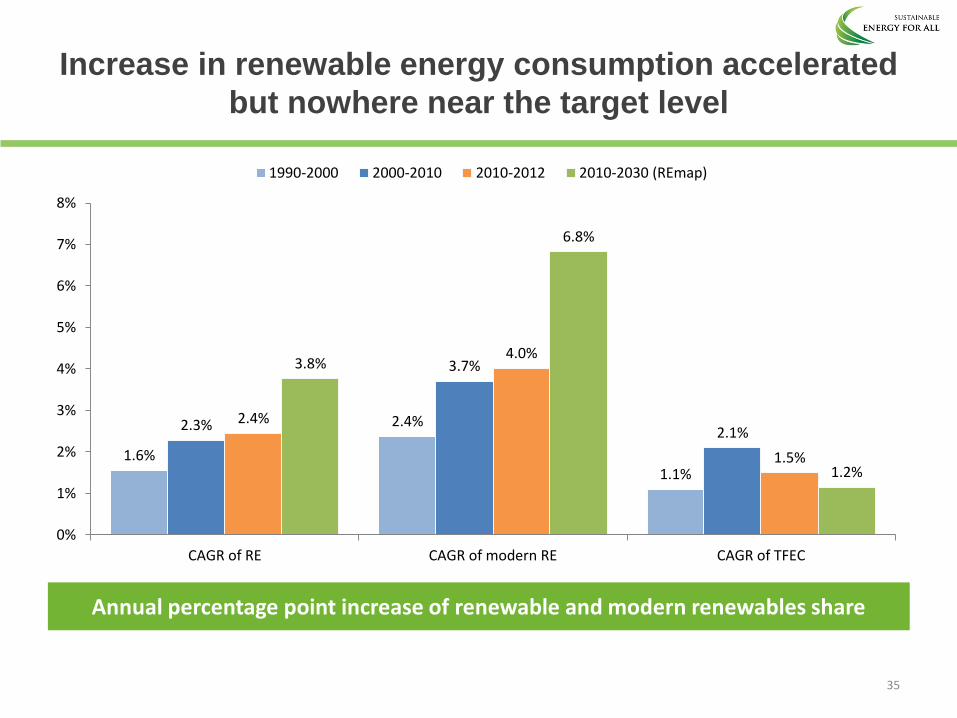
Increase in renewable energy consumption accelerated
but nowhere near the target level
Annual percentage point increase of renewable and modern renewables share
35
1.6%
2.4%
1.1%
2.3%
3.7%
2.1% 2.4%
4.0%
1.5%
3.8%
6.8%
1.2%
0%
1%
2%
3%
4%
5%
6%
7%
8%
CAGR of RE CAGR of modern RE CAGR of TFEC
1990-2000 2000-2010 2010-2012 2010-2030 (REmap)
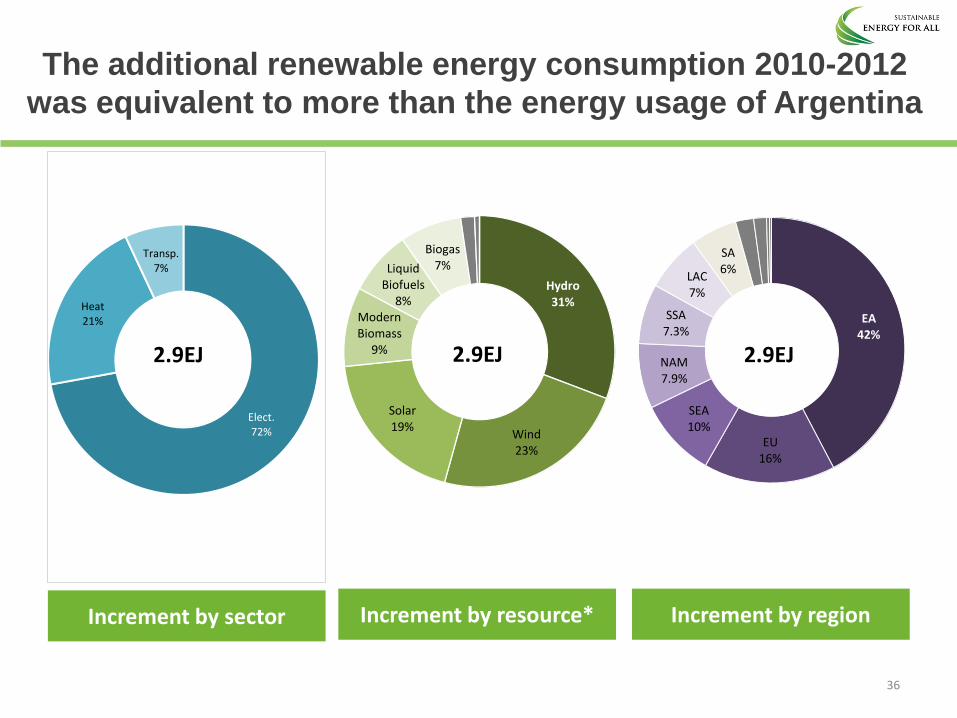
The additional renewable energy consumption 2010-2012
was equivalent to more than the energy usage of Argentina
Increment by sector Increment by resource*
36
Increment by region
EA 42%
EU 16%
SEA 10%
NAM 7.9%
SSA 7.3%
LAC 7%
SA 6%
2.9EJ
Hydro 31%
Wind 23%
Solar 19%
Modern Biomass
9%
Liquid Biofuels
8%
Biogas 7%
2.9EJ
Elect. 72%
Heat 21%
Transp. 7%
2.9EJ
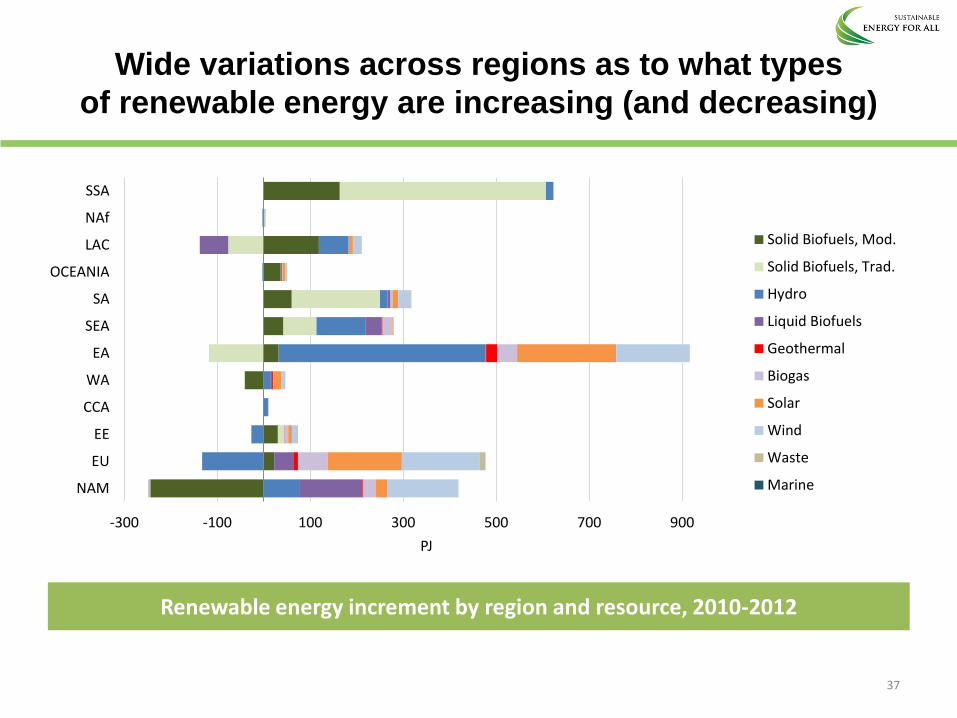
Wide variations across regions as to what types
of renewable energy are increasing (and decreasing)
Renewable energy increment by region and resource, 2010-2012
37
-300 -100 100 300 500 700 900
NAM
EU
EE
CCA
WA
EA
SEA
SA
OCEANIA
LAC
NAf
SSA
PJ
Solid Biofuels, Mod.
Solid Biofuels, Trad.
Hydro
Liquid Biofuels
Geothermal
Biogas
Solar
Wind
Waste
Marine
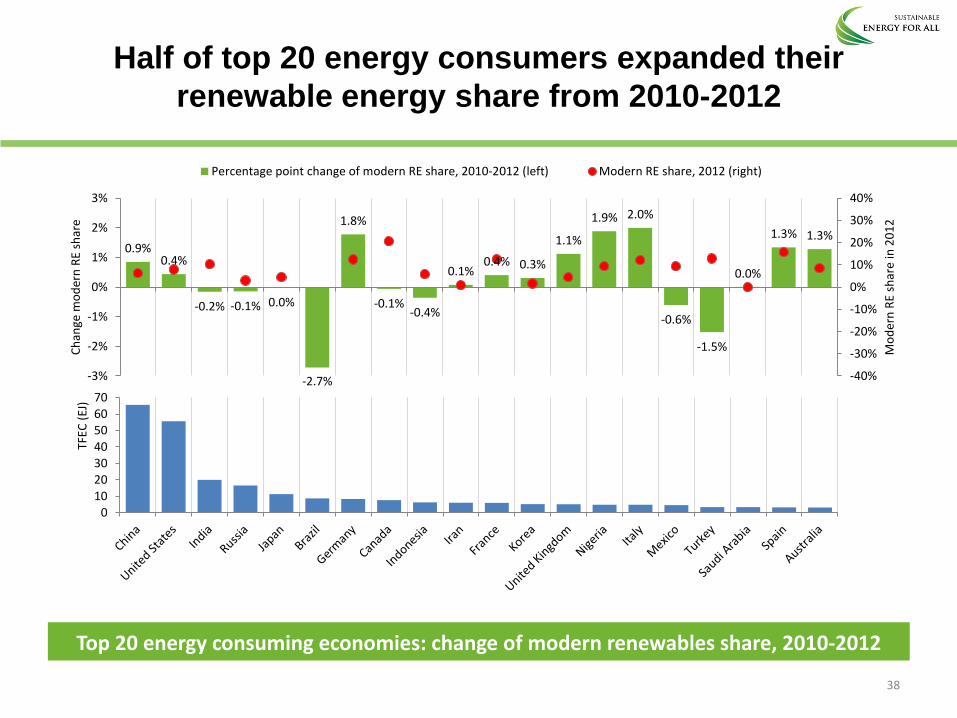
Half of top 20 energy consumers expanded their
renewable energy share from 2010-2012
Top 20 energy consuming economies: change of modern renewables share, 2010-2012
38
010203040506070
TFEC
(EJ
)
0.9% 0.4%
-0.2% -0.1% 0.0%
-2.7%
1.8%
-0.1% -0.4%
0.1% 0.4% 0.3%
1.1%
1.9% 2.0%
-0.6%
-1.5%
0.0%
1.3% 1.3%
-40%
-30%
-20%
-10%
0%
10%
20%
30%
40%
-3%
-2%
-1%
0%
1%
2%
3%
Mo
der
n R
E sh
are
in 2
01
2
Ch
ange
mo
der
n R
E sh
are
Percentage point change of modern RE share, 2010-2012 (left) Modern RE share, 2012 (right)
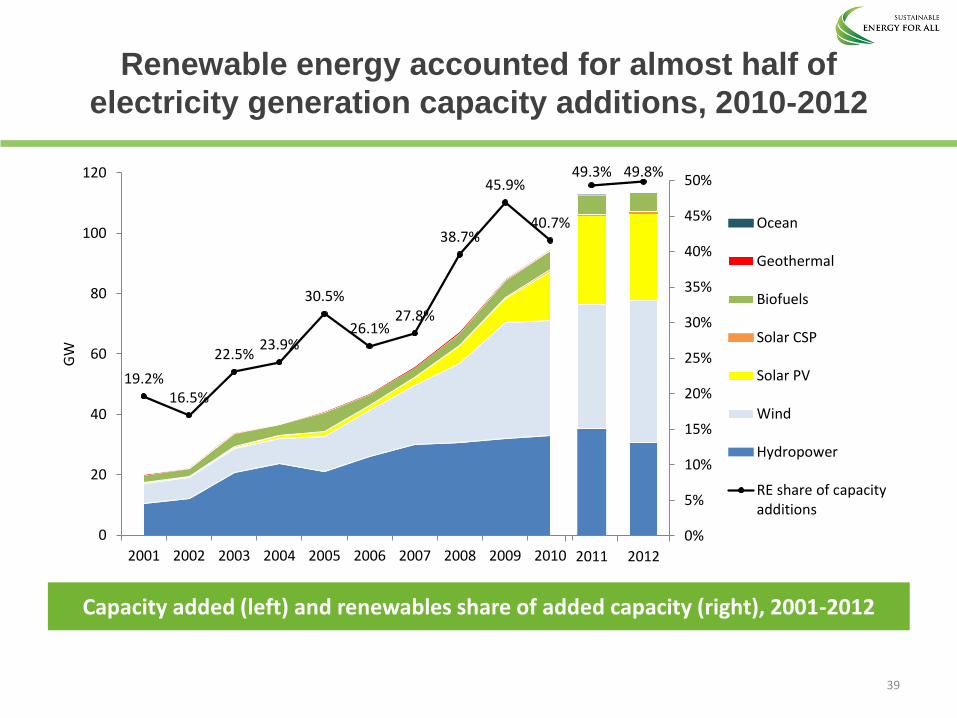
Renewable energy accounted for almost half of
electricity generation capacity additions, 2010-2012
Capacity added (left) and renewables share of added capacity (right), 2001-2012
39
49.3% 49.8%
0%
5%
10%
15%
20%
25%
30%
35%
40%
45%
50%
2011 2012
Ocean
Geothermal
Biofuels
Solar CSP
Solar PV
Wind
Hydropower
RE share of capacityadditions
19.2% 16.5%
22.5% 23.9%
30.5%
26.1% 27.8%
38.7%
45.9%
40.7%
0
20
40
60
80
100
120
2001 2002 2003 2004 2005 2006 2007 2008 2009 2010
GW
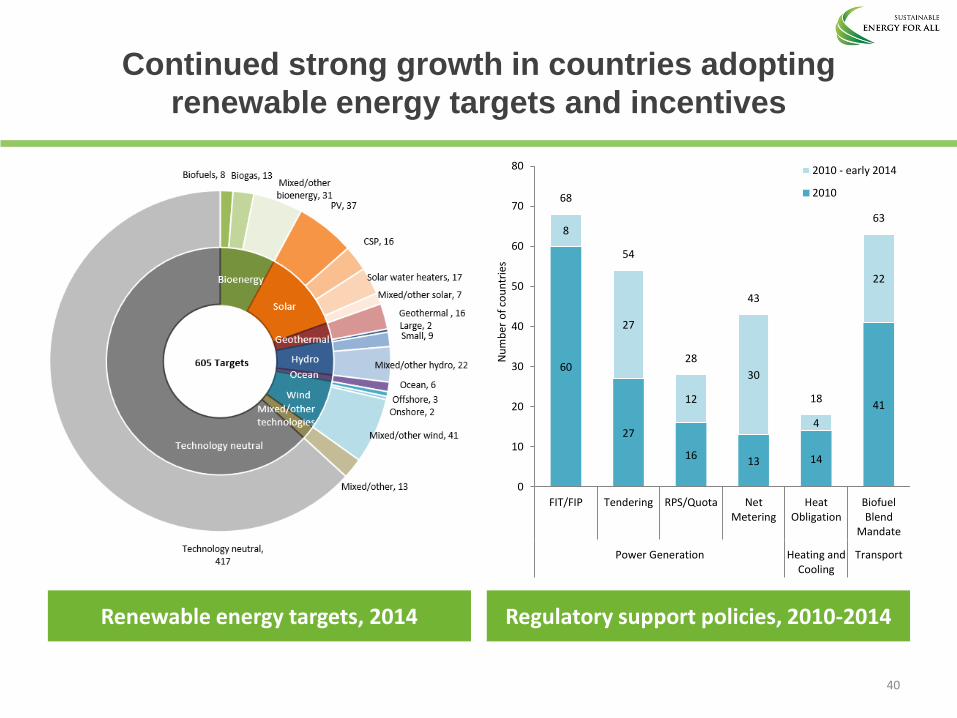
Continued strong growth in countries adopting
renewable energy targets and incentives
Renewable energy targets, 2014 Regulatory support policies, 2010-2014
60
27
16 13 14
41
8
27
12
30
4
22
68
54
28
43
18
63
0
10
20
30
40
50
60
70
80
FIT/FIP Tendering RPS/Quota NetMetering
HeatObligation
BiofuelBlend
Mandate
Power Generation Heating andCooling
Transport
Nu
mb
er o
f co
un
trie
s
2010 - early 2014
2010
40
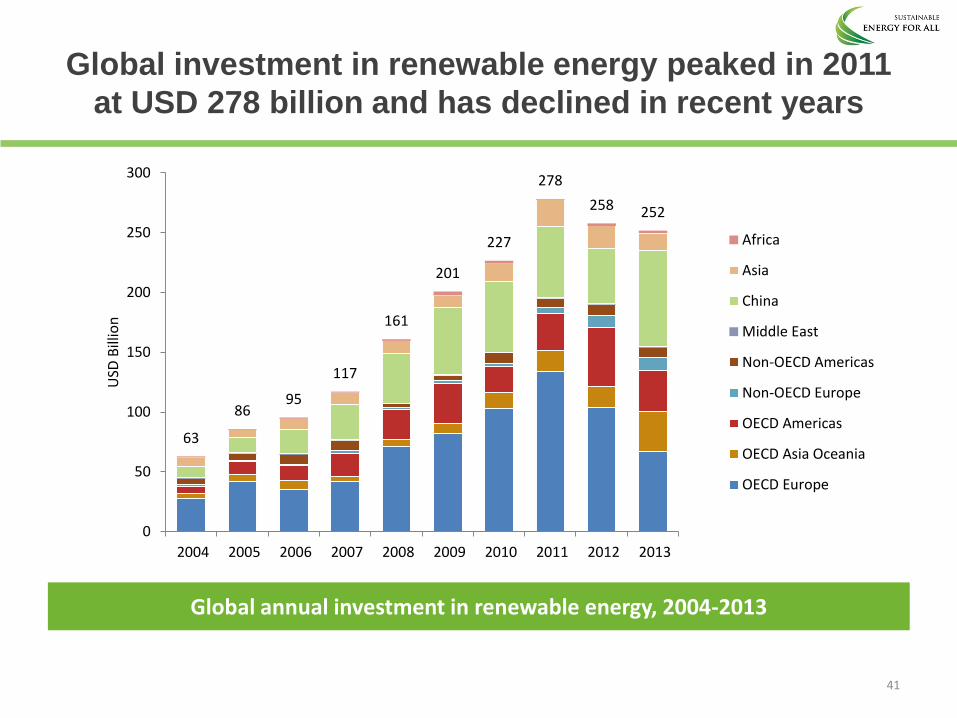
Global investment in renewable energy peaked in 2011
at USD 278 billion and has declined in recent years
Global annual investment in renewable energy, 2004-2013
63
86 95
117
161
201
227
278
258 252
0
50
100
150
200
250
300
2004 2005 2006 2007 2008 2009 2010 2011 2012 2013
USD
Bill
ion
Africa
Asia
China
Middle East
Non-OECD Americas
Non-OECD Europe
OECD Americas
OECD Asia Oceania
OECD Europe
41
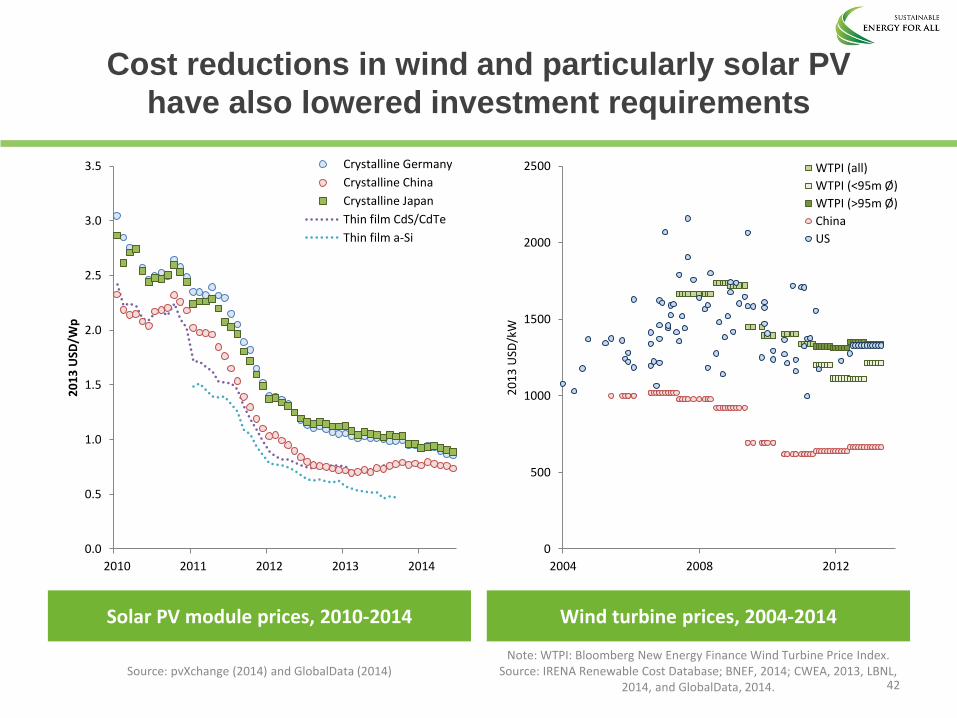
Cost reductions in wind and particularly solar PV
have also lowered investment requirements
Solar PV module prices, 2010-2014 Wind turbine prices, 2004-2014
Source: pvXchange (2014) and GlobalData (2014) 42
0.0
0.5
1.0
1.5
2.0
2.5
3.0
3.5
2010 2011 2012 2013 2014
20
13
USD
/Wp
Crystalline Germany
Crystalline China
Crystalline Japan
Thin film CdS/CdTe
Thin film a-Si
0
500
1000
1500
2000
2500
2004 2008 2012
20
13
USD
/kW
WTPI (all)
WTPI (<95m Ø)
WTPI (>95m Ø)
China
US
Note: WTPI: Bloomberg New Energy Finance Wind Turbine Price Index. Source: IRENA Renewable Cost Database; BNEF, 2014; CWEA, 2013, LBNL,
2014, and GlobalData, 2014.
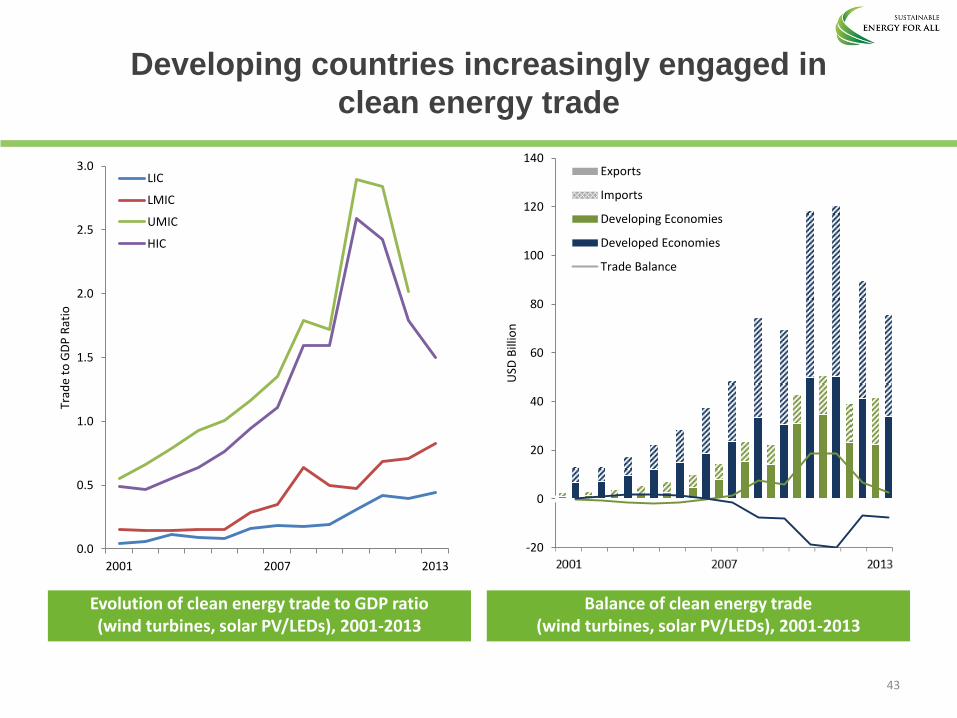
Developing countries increasingly engaged in
clean energy trade
Evolution of clean energy trade to GDP ratio (wind turbines, solar PV/LEDs), 2001-2013
0.0
0.5
1.0
1.5
2.0
2.5
3.0
2001 2007 2013
Trad
e to
GD
P R
atio
LIC
LMIC
UMIC
HIC
Balance of clean energy trade (wind turbines, solar PV/LEDs), 2001-2013
43
-20
0
20
40
60
80
100
120
140
USD
Bill
ion
Exports
Imports
Developing Economies
Developed Economies
Trade Balance
Towards a better understanding of solid biofuels for
traditional energy uses
• Traditional solid biofuels accounted for 53% of global renewable energy consumption in 2012 (modern solid biofuels for about 18%, so together 70%)
• To answer whether traditional solid biofuel consumption is sustainable we must first define sustainability itself
• Sustainability has environmental, economic and social dimensions, a full tracking of which is not possible
• Yet semi-quantitative indicators (e.g. coverage of certification schemes) and qualitative indicators (e.g. those developed by the Global Bioenergy Partnership) exist which, when tracked over time, can help distinguish progress towards sustainable use of solid biofuels.
44

THE WAY FORWARD
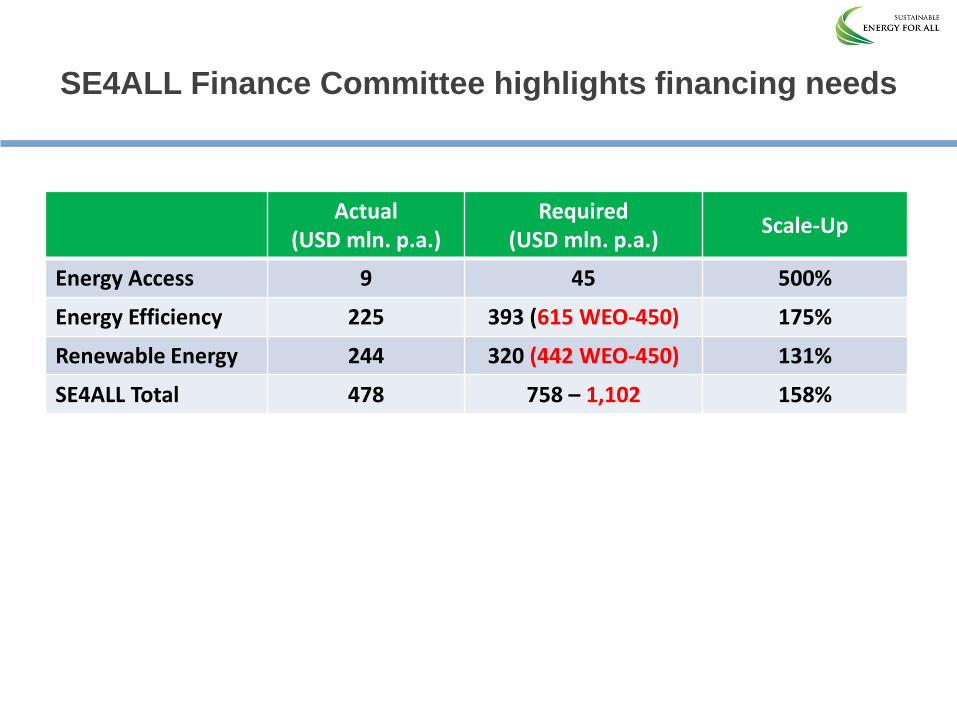
SE4ALL Finance Committee highlights financing needs
Actual (USD mln. p.a.)
Required (USD mln. p.a.)
Scale-Up
Energy Access 9 45 500%
Energy Efficiency 225 393 (615 WEO-450) 175%
Renewable Energy 244 320 (442 WEO-450) 131%
SE4ALL Total 478 758 – 1,102 158%
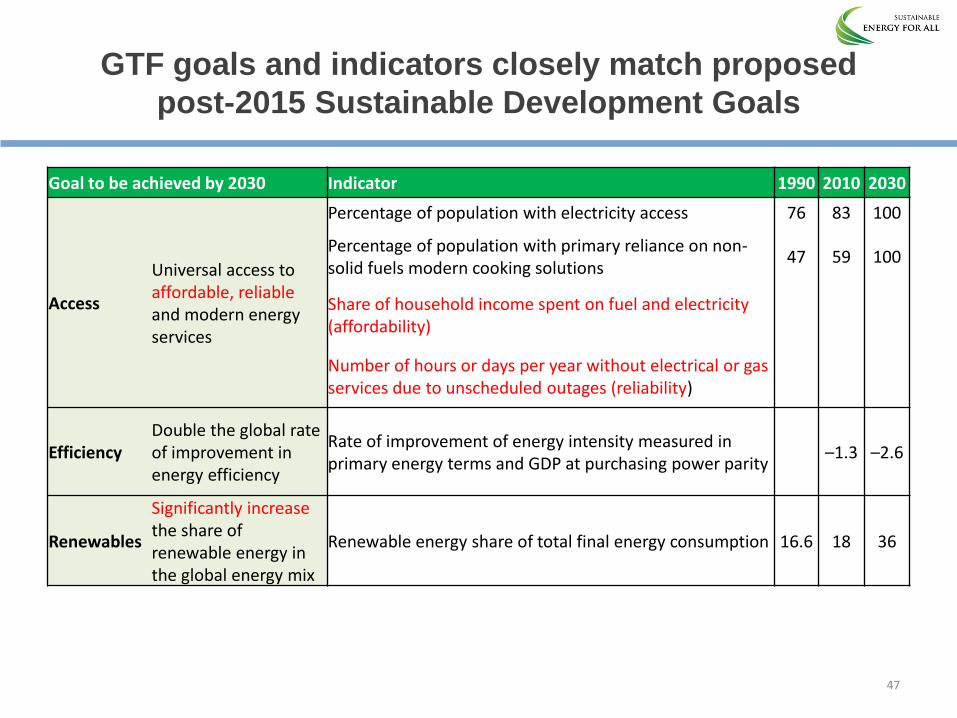
GTF goals and indicators closely match proposed
post-2015 Sustainable Development Goals
Goal to be achieved by 2030 Indicator 1990 2010 2030
Access
Universal access to affordable, reliable and modern energy services
Percentage of population with electricity access 76 83 100
Percentage of population with primary reliance on non-solid fuels modern cooking solutions
47 59 100
Share of household income spent on fuel and electricity (affordability)
Number of hours or days per year without electrical or gas services due to unscheduled outages (reliability)
Efficiency Double the global rate of improvement in energy efficiency
Rate of improvement of energy intensity measured in primary energy terms and GDP at purchasing power parity
–1.3 –2.6
Renewables
Significantly increase the share of renewable energy in the global energy mix
Renewable energy share of total final energy consumption 16.6 18 36
47
Next steps
• SE4ALL Global Tracking Framework 2015 Update on track for publication in the spring
• Global Tracking Framework consortium interacting closely with UN Technical Teams working on SDG indicators
• Plans for a Global Energy Access Survey to be launched in 2015 applying multitier framework to all major access deficit countries
• Plans for a global rollout of RISE (Readiness for Investment in Sustainable Energy)
• Consortium committed to next update of Global Tracking Framework in 2017
48
49
Energy and Water
• Water and energy resources are inextricably linked. In the energy sector, water is used for generating hydropower, cooling thermal power plants, extracting, processing and transporting energy resources, and growing energy crops. Conversely the water sector needs energy to extract, treat and transport water, as well as for irrigation and desalination
• SE4ALL
– Water is necessary for reaching universal access to energy
– Water use varies by renewable energy technology
– Increasing energy efficiency can contribute to improving water efficiency
• Indicators
– Reliable and comprehensive data on the energy-water nexus is scarce.
– Indicators must track water withdrawal, consumption and discharge, over time and space (at the power plant level)
50
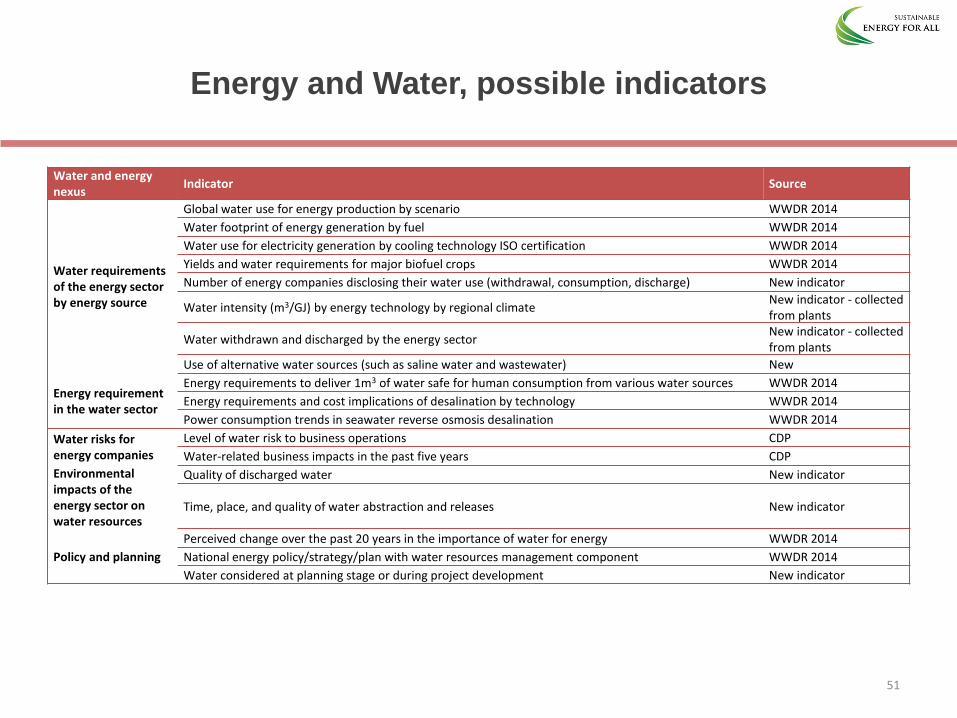
Energy and Water, possible indicators
Water and energy nexus
Indicator Source
Water requirements of the energy sector by energy source
Global water use for energy production by scenario WWDR 2014
Water footprint of energy generation by fuel WWDR 2014
Water use for electricity generation by cooling technology ISO certification WWDR 2014
Yields and water requirements for major biofuel crops WWDR 2014
Number of energy companies disclosing their water use (withdrawal, consumption, discharge) New indicator
Water intensity (m3/GJ) by energy technology by regional climate New indicator - collected from plants
Water withdrawn and discharged by the energy sector New indicator - collected from plants
Use of alternative water sources (such as saline water and wastewater) New
Energy requirement in the water sector
Energy requirements to deliver 1m3 of water safe for human consumption from various water sources WWDR 2014
Energy requirements and cost implications of desalination by technology WWDR 2014
Power consumption trends in seawater reverse osmosis desalination WWDR 2014
Water risks for energy companies
Level of water risk to business operations CDP
Water-related business impacts in the past five years CDP
Environmental impacts of the energy sector on water resources
Quality of discharged water New indicator
Time, place, and quality of water abstraction and releases New indicator
Policy and planning
Perceived change over the past 20 years in the importance of water for energy WWDR 2014
National energy policy/strategy/plan with water resources management component WWDR 2014
Water considered at planning stage or during project development New indicator
51
Energy and Food Security
• Energy has a key enabling role in achieving food security which “exists when all people, at all times, have physical and economic access to sufficient, safe and nutritious food to meet their dietary needs and food preferences for an active and healthy life”.
• SE4ALL
– Access to modern energy services in the agriculture sector contributes to increasing food production and food availability, while often improving farm income.
– The uptake of renewable energy in agri-food systems helps decoupling the agricultural production from the fossil fuels market.
– Energy efficiency in agriculture and agri-food systems usually has a positive effect on economic returns of food production in the long run through savings on energy costs.
• Indicators
– Data already exists on inputs to “behind the farm gate” operations, use of traditional fuels and the effect of bioenergy development on food supply and prices.
– Complementary indicators would include energy used to manufacture agri-food chain inputs, energy use beyond the farm gate, and renewable energy produced along agri-food chains.
52
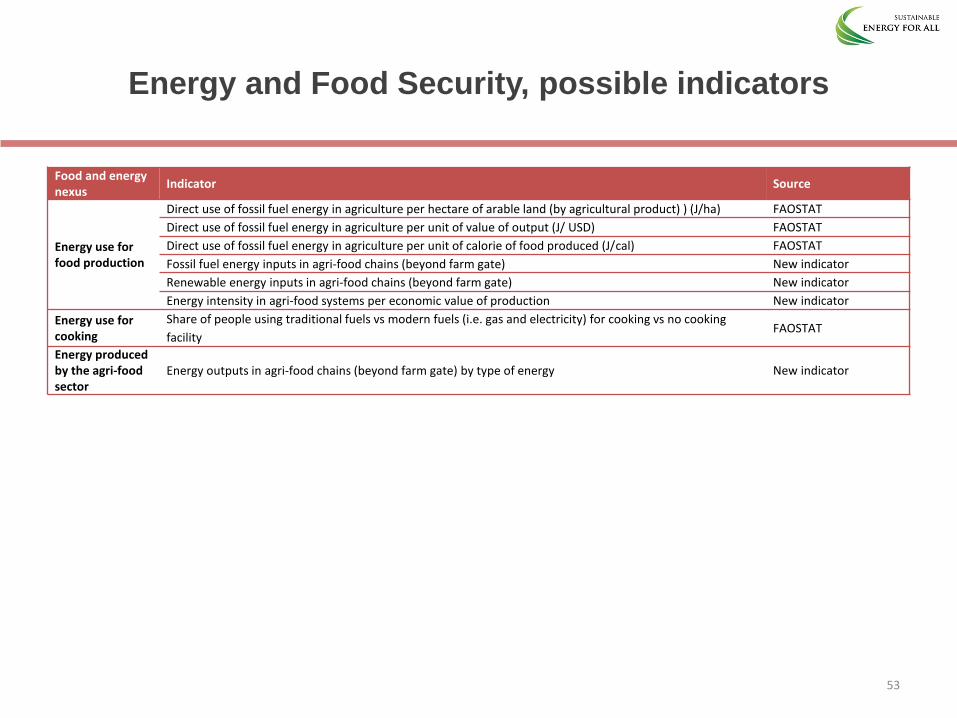
Energy and Food Security, possible indicators
Food and energy nexus
Indicator Source
Energy use for food production
Direct use of fossil fuel energy in agriculture per hectare of arable land (by agricultural product) ) (J/ha) FAOSTAT
Direct use of fossil fuel energy in agriculture per unit of value of output (J/ USD) FAOSTAT
Direct use of fossil fuel energy in agriculture per unit of calorie of food produced (J/cal) FAOSTAT
Fossil fuel energy inputs in agri-food chains (beyond farm gate) New indicator
Renewable energy inputs in agri-food chains (beyond farm gate) New indicator
Energy intensity in agri-food systems per economic value of production New indicator
Energy use for cooking
Share of people using traditional fuels vs modern fuels (i.e. gas and electricity) for cooking vs no cooking
facility FAOSTAT
Energy produced by the agri-food sector
Energy outputs in agri-food chains (beyond farm gate) by type of energy New indicator
53
Energy and Gender
• Energy interventions are likely to impact women and men differently
• SE4ALL
– Access to affordable modern energy services can reduce both time and effort spent in reproductive and productive labor, improve women’s mobility and maternal health care
– Women can, together with men, play a significant role as energy providers, expanding energy access to the poor and ‘hard to reach’ customers
– Women and men respond differently to energy efficiency incentives and energy use alternatives
• Indicators
– Existing surveys and databases shed light on the relationships between gender and energy, providing information on time poverty, women's economic empowerment, mortality and morbidity rates
– However a quantitative assessment of differential impacts of energy on the lives of women, men, girls and boys is limited.
54
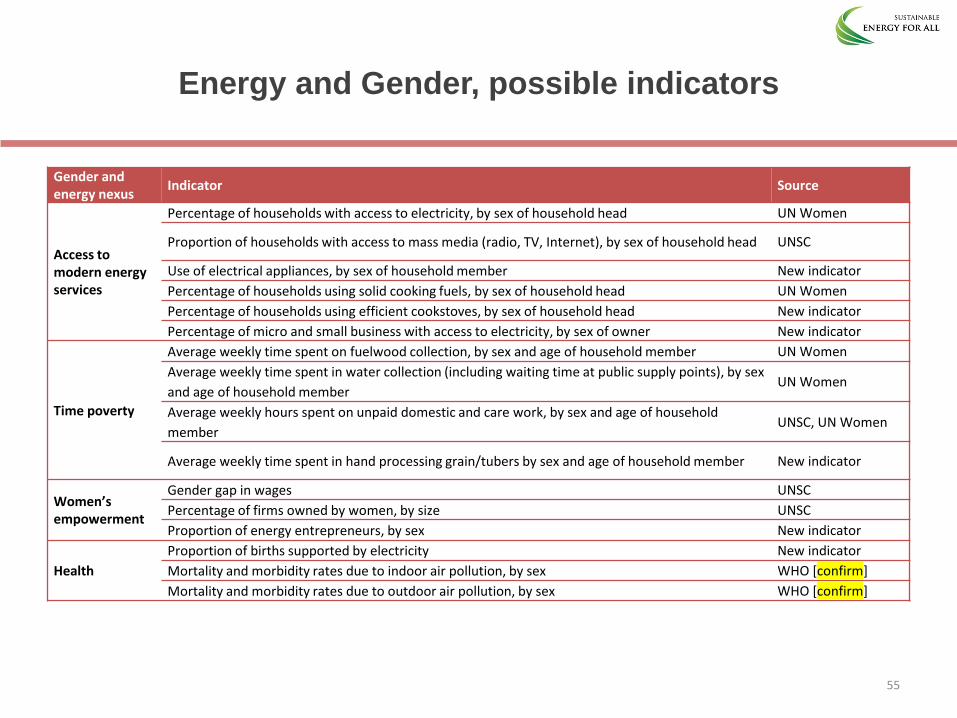
Energy and Gender, possible indicators
Gender and energy nexus
Indicator Source
Access to modern energy services
Percentage of households with access to electricity, by sex of household head UN Women
Proportion of households with access to mass media (radio, TV, Internet), by sex of household head UNSC
Use of electrical appliances, by sex of household member New indicator
Percentage of households using solid cooking fuels, by sex of household head UN Women
Percentage of households using efficient cookstoves, by sex of household head New indicator
Percentage of micro and small business with access to electricity, by sex of owner New indicator
Time poverty
Average weekly time spent on fuelwood collection, by sex and age of household member UN Women
Average weekly time spent in water collection (including waiting time at public supply points), by sex
and age of household member UN Women
Average weekly hours spent on unpaid domestic and care work, by sex and age of household
member UNSC, UN Women
Average weekly time spent in hand processing grain/tubers by sex and age of household member New indicator
Women’s empowerment
Gender gap in wages UNSC
Percentage of firms owned by women, by size UNSC
Proportion of energy entrepreneurs, by sex New indicator
Health
Proportion of births supported by electricity New indicator
Mortality and morbidity rates due to indoor air pollution, by sex WHO [confirm]
Mortality and morbidity rates due to outdoor air pollution, by sex WHO [confirm]
55
Energy and Health
• Energy is both an essential pre-requisite of good health, as well as a source of many serious health risks – most notably air pollution.
• SE4ALL
– Access to reliable and affordable modern energy services can significantly reduce the burden of disease related to household (indoor) air pollution and plays a critical role in health care provision
– Wider uptake of renewable energy, particularly for electricity, hot water heating and space heating of homes and health facilities, also have the potential to reduce indoor air pollution and enhance health care provision.
– Energy efficiency improvements in power generation, transport and buildings can yield a range of health benefits, including reduction of urban air pollution
• Indicators
– Existing indicators approximate exposure and burden of disease from indoor and outdoor air pollution. Measurement of electricity access in health care facilities is also being developed.
– Ongoing efforts to improve energy-health nexus indicators, including development of safety standards for cooking solutions, exposure rates to indoor air pollution from heating and lighting
56
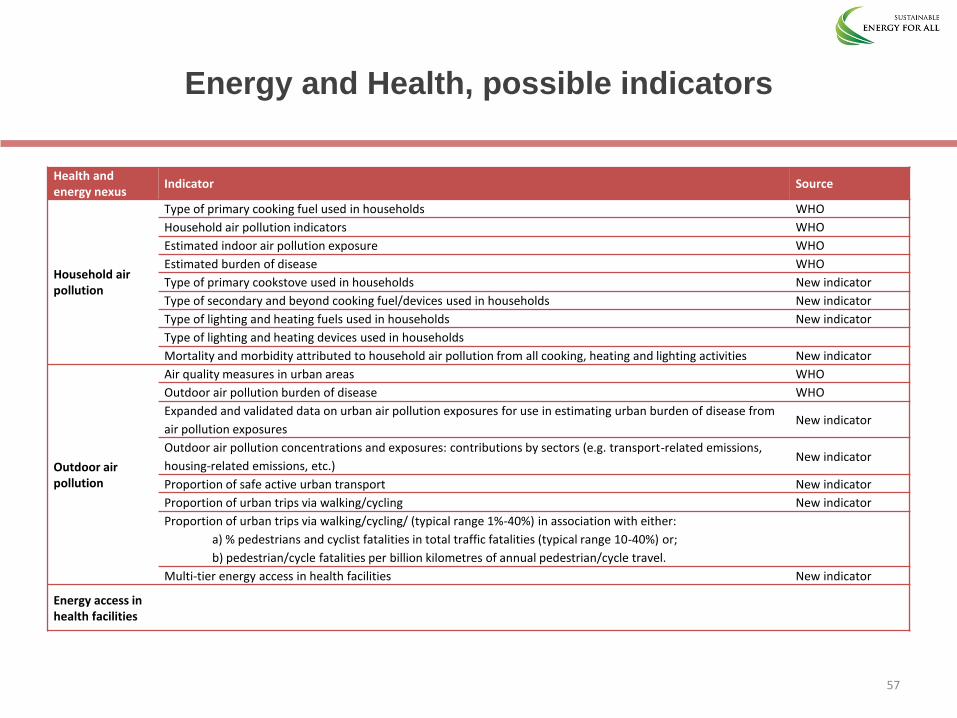
Energy and Health, possible indicators
Health and energy nexus
Indicator Source
Household air pollution
Type of primary cooking fuel used in households WHO
Household air pollution indicators WHO
Estimated indoor air pollution exposure WHO
Estimated burden of disease WHO
Type of primary cookstove used in households New indicator
Type of secondary and beyond cooking fuel/devices used in households New indicator
Type of lighting and heating fuels used in households New indicator
Type of lighting and heating devices used in households
Mortality and morbidity attributed to household air pollution from all cooking, heating and lighting activities New indicator
Outdoor air pollution
Air quality measures in urban areas WHO
Outdoor air pollution burden of disease WHO
Expanded and validated data on urban air pollution exposures for use in estimating urban burden of disease from
air pollution exposures New indicator
Outdoor air pollution concentrations and exposures: contributions by sectors (e.g. transport-related emissions,
housing-related emissions, etc.) New indicator
Proportion of safe active urban transport New indicator
Proportion of urban trips via walking/cycling New indicator
Proportion of urban trips via walking/cycling/ (typical range 1%-40%) in association with either:
a) % pedestrians and cyclist fatalities in total traffic fatalities (typical range 10-40%) or;
b) pedestrian/cycle fatalities per billion kilometres of annual pedestrian/cycle travel.
Multi-tier energy access in health facilities New indicator
Energy access in health facilities
57

ANNEX 2: FINANCE
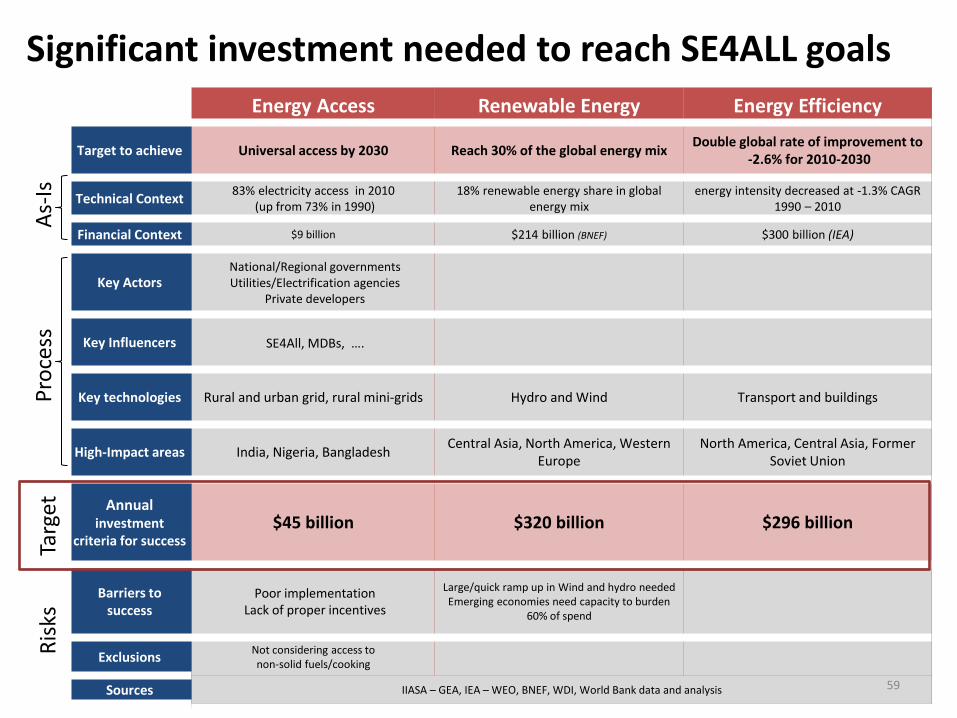
Energy Access Renewable Energy Energy Efficiency
Target to achieve Universal access by 2030 Reach 30% of the global energy mix Double global rate of improvement to
-2.6% for 2010-2030
Technical Context 83% electricity access in 2010
(up from 73% in 1990) 18% renewable energy share in global
energy mix energy intensity decreased at -1.3% CAGR
1990 – 2010
Financial Context $9 billion $214 billion (BNEF) $300 billion (IEA)
Key Actors National/Regional governments Utilities/Electrification agencies
Private developers
Key Influencers SE4All, MDBs, ….
Key technologies Rural and urban grid, rural mini-grids Hydro and Wind Transport and buildings
High-Impact areas India, Nigeria, Bangladesh Central Asia, North America, Western
Europe North America, Central Asia, Former
Soviet Union
Annual investment
criteria for success $45 billion $320 billion $296 billion
Barriers to success
Poor implementation Lack of proper incentives
Large/quick ramp up in Wind and hydro needed Emerging economies need capacity to burden
60% of spend
Exclusions Not considering access to non-solid fuels/cooking
Sources IIASA – GEA, IEA – WEO, BNEF, WDI, World Bank data and analysis
As-
Is
Pro
cess
Ta
rget
R
isks
Significant investment needed to reach SE4ALL goals
59
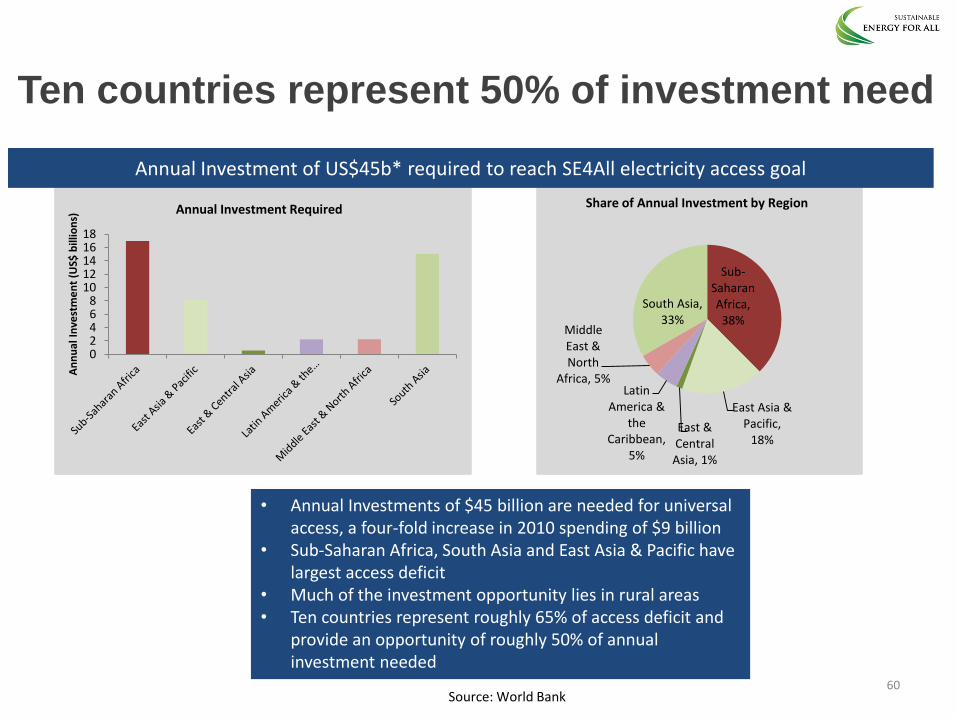
Sub-Saharan Africa, 38%
East Asia & Pacific,
18% East & Central Asia, 1%
Latin America &
the Caribbean,
5%
Middle East & North
Africa, 5%
South Asia, 33%
Share of Annual Investment by Region
Ten countries represent 50% of investment need
• Annual Investments of $45 billion are needed for universal access, a four-fold increase in 2010 spending of $9 billion
• Sub-Saharan Africa, South Asia and East Asia & Pacific have largest access deficit
• Much of the investment opportunity lies in rural areas • Ten countries represent roughly 65% of access deficit and
provide an opportunity of roughly 50% of annual investment needed
Annual Investment of US$45b* required to reach SE4All electricity access goal
02468
1012141618
An
nu
al I
nve
stm
en
t (U
S$ b
illio
ns)
Annual Investment Required
60 Source: World Bank
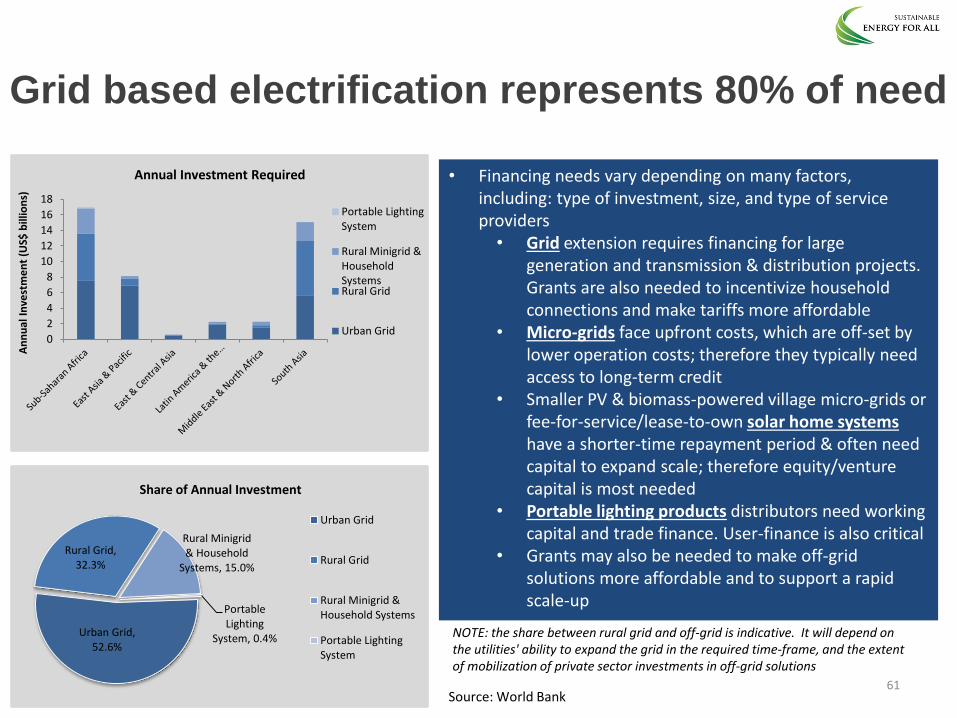
Grid based electrification represents 80% of need
• Financing needs vary depending on many factors, including: type of investment, size, and type of service providers • Grid extension requires financing for large
generation and transmission & distribution projects. Grants are also needed to incentivize household connections and make tariffs more affordable
• Micro-grids face upfront costs, which are off-set by lower operation costs; therefore they typically need access to long-term credit
• Smaller PV & biomass-powered village micro-grids or fee-for-service/lease-to-own solar home systems have a shorter-time repayment period & often need capital to expand scale; therefore equity/venture capital is most needed
• Portable lighting products distributors need working capital and trade finance. User-finance is also critical
• Grants may also be needed to make off-grid solutions more affordable and to support a rapid scale-up
61 Source: World Bank
NOTE: the share between rural grid and off-grid is indicative. It will depend on the utilities' ability to expand the grid in the required time-frame, and the extent of mobilization of private sector investments in off-grid solutions
0
2
4
6
8
10
12
14
16
18
An
nu
al I
nve
stm
en
t (U
S$ b
illio
ns)
Annual Investment Required
Portable LightingSystem
Rural Minigrid &HouseholdSystemsRural Grid
Urban Grid
Urban Grid, 52.6%
Rural Grid, 32.3%
Rural Minigrid & Household
Systems, 15.0%
Portable Lighting
System, 0.4%
Share of Annual Investment
Urban Grid
Rural Grid
Rural Minigrid &Household Systems
Portable LightingSystem
0
10
20
30
40
50
60
An
nu
al I
nve
stm
en
t (U
S$ b
illio
ns)
Avg. Annual Demand-Side Investment Required
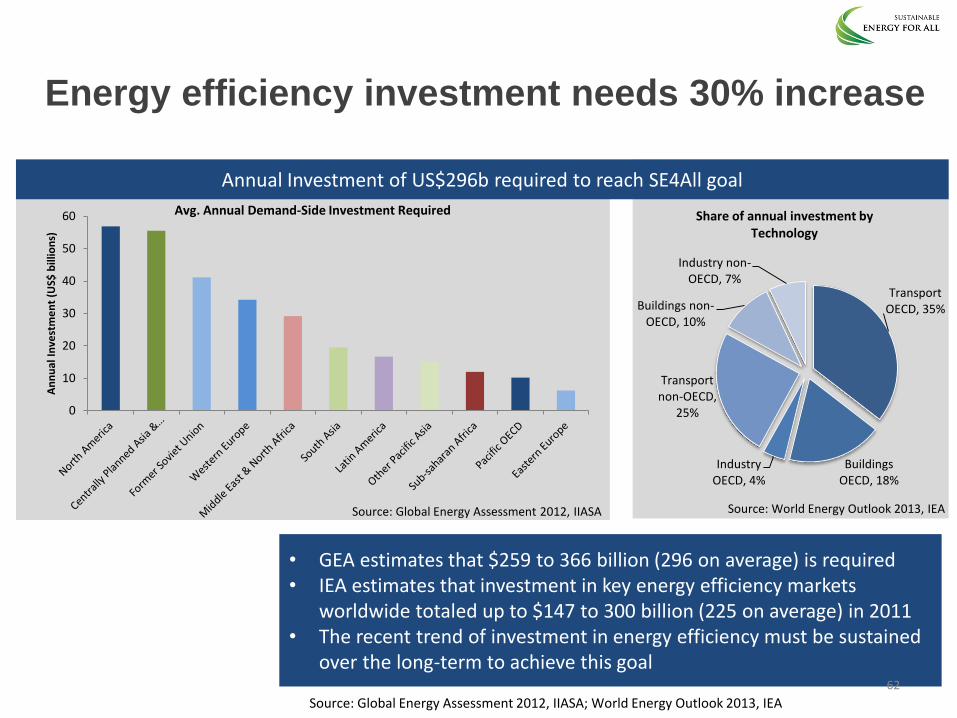
Energy efficiency investment needs 30% increase
• GEA estimates that $259 to 366 billion (296 on average) is required • IEA estimates that investment in key energy efficiency markets
worldwide totaled up to $147 to 300 billion (225 on average) in 2011 • The recent trend of investment in energy efficiency must be sustained
over the long-term to achieve this goal
Transport OECD, 35%
Buildings OECD, 18%
Industry OECD, 4%
Transport non-OECD,
25%
Buildings non-OECD, 10%
Industry non-OECD, 7%
Share of annual investment by Technology
Source: World Energy Outlook 2013, IEA
62
Annual Investment of US$296b required to reach SE4All goal
Source: Global Energy Assessment 2012, IIASA
Source: Global Energy Assessment 2012, IIASA; World Energy Outlook 2013, IEA
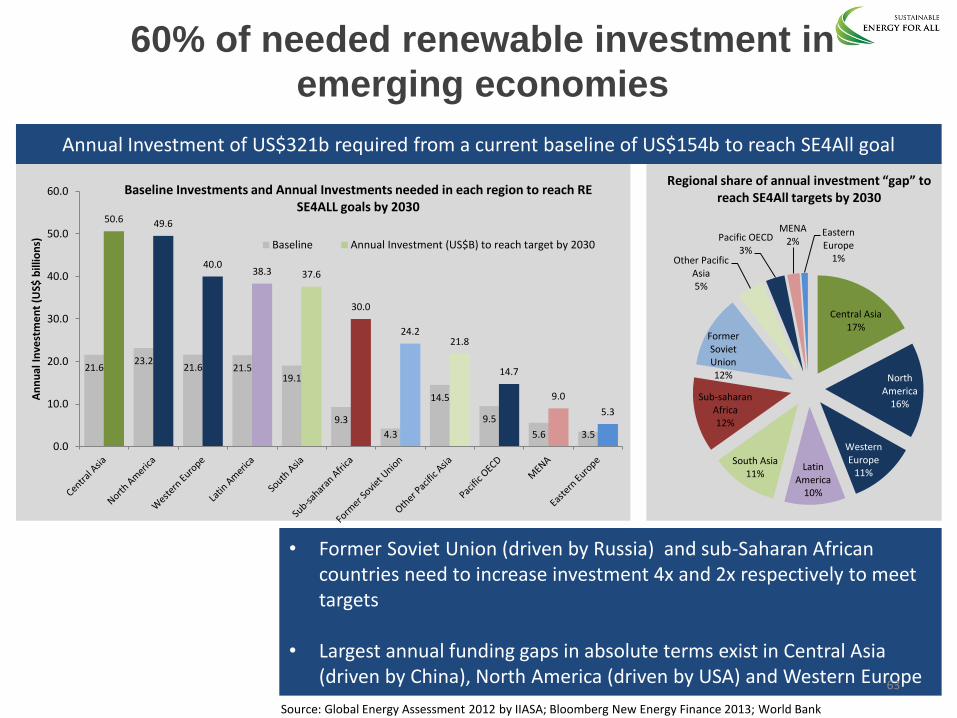
60% of needed renewable investment in
emerging economies
21.6 23.2
21.6 21.5 19.1
9.3
4.3
14.5
9.5
5.6 3.5
50.6 49.6
40.0 38.3 37.6
30.0
24.2 21.8
14.7
9.0
5.3
0.0
10.0
20.0
30.0
40.0
50.0
60.0
An
nu
al I
nve
stm
en
t (U
S$ b
illio
ns)
Baseline Investments and Annual Investments needed in each region to reach RE SE4ALL goals by 2030
Baseline Annual Investment (US$B) to reach target by 2030
Central Asia 17%
North America
16%
Western Europe
11% Latin
America 10%
South Asia 11%
Sub-saharan Africa 12%
Former Soviet Union 12%
Other Pacific Asia 5%
Pacific OECD 3%
MENA 2%
Eastern Europe
1%
Regional share of annual investment “gap” to reach SE4All targets by 2030
• Former Soviet Union (driven by Russia) and sub-Saharan African countries need to increase investment 4x and 2x respectively to meet targets
• Largest annual funding gaps in absolute terms exist in Central Asia
(driven by China), North America (driven by USA) and Western Europe
Annual Investment of US$321b required from a current baseline of US$154b to reach SE4All goal
63
Source: Global Energy Assessment 2012 by IIASA; Bloomberg New Energy Finance 2013; World Bank
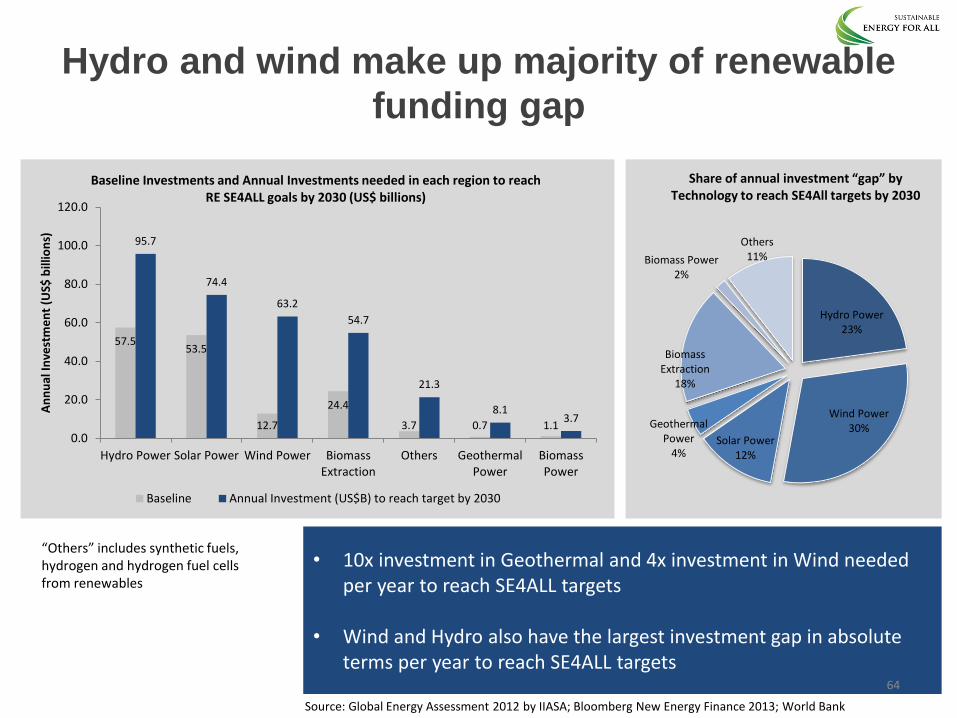
Hydro Power 23%
Wind Power 30%
Solar Power 12%
Geothermal Power
4%
Biomass Extraction
18%
Biomass Power 2%
Others 11%
Share of annual investment “gap” by Technology to reach SE4All targets by 2030
Hydro and wind make up majority of renewable
funding gap
• 10x investment in Geothermal and 4x investment in Wind needed per year to reach SE4ALL targets
• Wind and Hydro also have the largest investment gap in absolute terms per year to reach SE4ALL targets
“Others” includes synthetic fuels, hydrogen and hydrogen fuel cells from renewables
57.5 53.5
12.7
24.4
3.7 0.7 1.1
95.7
74.4
63.2
54.7
21.3
8.1 3.7
0.0
20.0
40.0
60.0
80.0
100.0
120.0
Hydro Power Solar Power Wind Power BiomassExtraction
Others GeothermalPower
BiomassPower
An
nu
al In
vest
me
nt
(US$
bill
ion
s)
Baseline Investments and Annual Investments needed in each region to reach RE SE4ALL goals by 2030 (US$ billions)
Baseline Annual Investment (US$B) to reach target by 2030
64
Source: Global Energy Assessment 2012 by IIASA; Bloomberg New Energy Finance 2013; World Bank
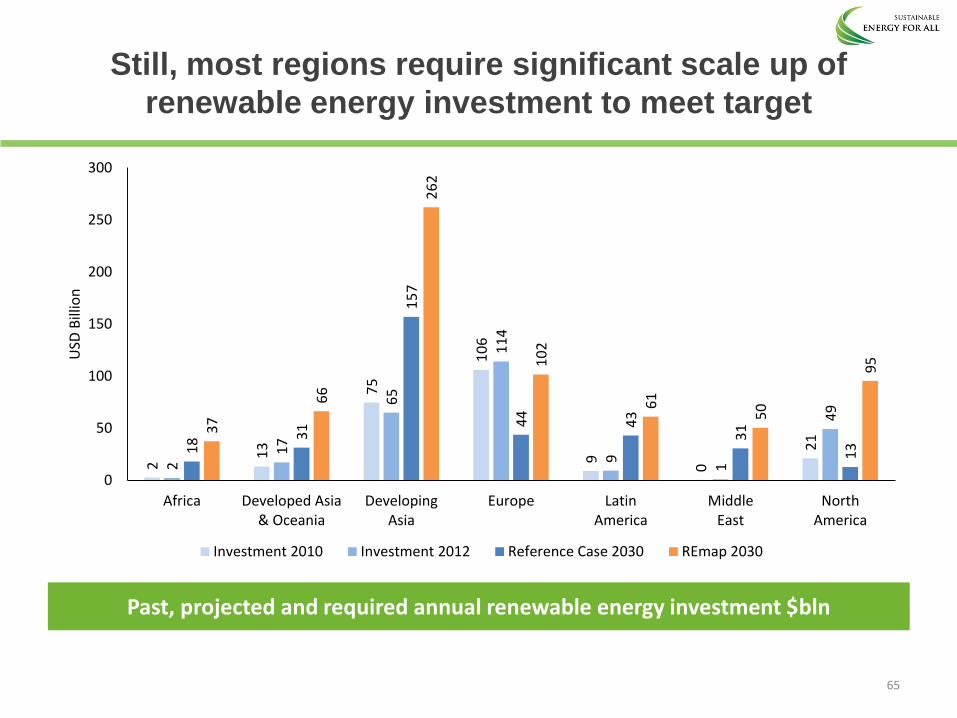
Still, most regions require significant scale up of
renewable energy investment to meet target
Past, projected and required annual renewable energy investment $bln
2 1
3
75
10
6
9
0
21
2 1
7
65
11
4
9
1
49
18
31
15
7
44
43
31
13
37
66
26
2
10
2
61
50
95
0
50
100
150
200
250
300
Africa Developed Asia& Oceania
DevelopingAsia
Europe LatinAmerica
MiddleEast
NorthAmerica
USD
Bill
ion
Investment 2010 Investment 2012 Reference Case 2030 REmap 2030
65