Embed Size (px)
Citation preview
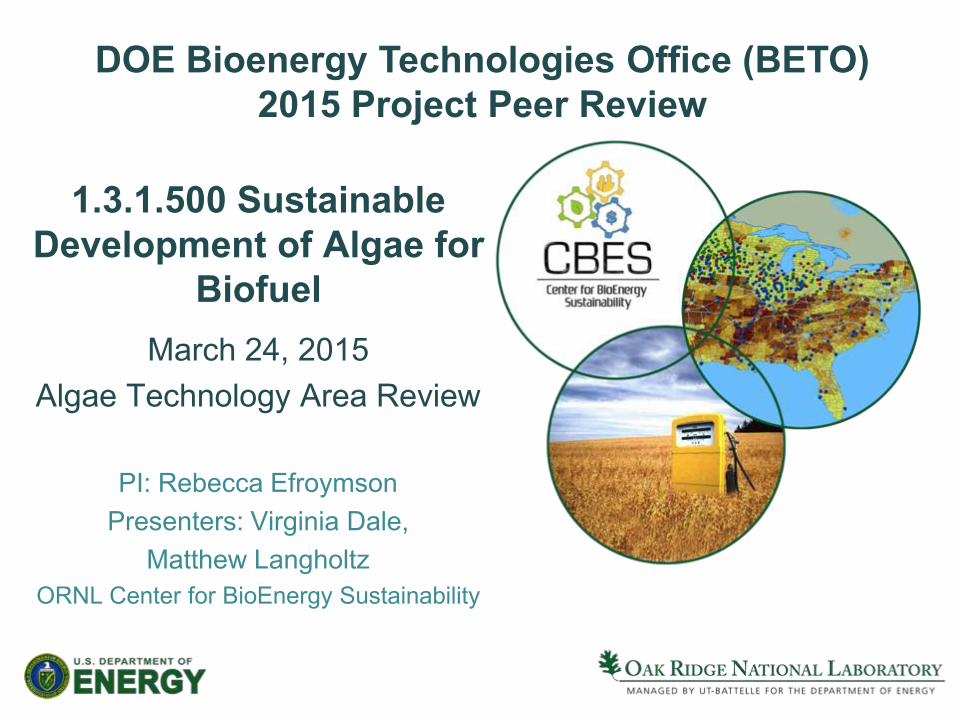
March 24, 2015 Algae Technology Area Review
PI: Rebecca Efroymson
Presenters: Virginia Dale, Matthew Langholtz
ORNL Center for BioEnergy Sustainability
1.3.1.500 Sustainable
Development of Algae for Biofuel
DOE Bioenergy Technologies Office (BETO) 2015 Project Peer Review

Goal Statement To conduct 1) Sustainability studies (evaluate indicators and develop best practices) 2) Resource analysis (quantify supply of ‘low-hanging fruit’ biomass) 3) Experimental work on algal polycultures to increase yield Relevant to DOE Algae Technology Area goals To develop production and logistics technologies that could support production of 5
billion gallons per year of sustainable, reliable, & affordable algal biofuels by 2030 • By 2017, model sustainable supply of 1 million metric tonnes ash free dry weight (AFDW)
cultivated algal biomass (task 1 and 2) • By 2018, demonstrate annual algal biomass productivity of 20-30 g/m2/day AFDW (task 3) • By 2022, model sustainable supply of 20 million metric tonnes AFDW cultivated algal
biomass (task 1 and 2)
Relevant to DOE Sustainability Area goals To understand and promote positive economic, social, and environmental effects and
reduce potential negative impacts of bioenergy production • By 2022, evaluate environmental and socioeconomic indicators across supply chain for algal
bioenergy production systems to validate 50% GHG reduction, socioeconomic benefits, water consumption equal to that for petroleum, and wastewater and air emissions that meet federal regulations (task 1)

3
Quad Chart Overview
• Project start date: FY13 • Project end date: FY18 • Percent complete: 14%
(as of Feb 2015)
Timeline
Budget
Barriers
Partners
• Aft-A. Biomass Availability and Cost (lack of credible data on potential price, location, environmental sustainability & quantity of algal biomass feedstock)
• Aft-B. Sustainable Algae Production (lack of data on environmental effects; need to address productivity issues and liner use)
• St-D. Implementing Indicators and methodology for evaluating and improving sustainability
• St-E. Best Practices and Systems for sustainable bioenergy production
Contractor: Longitude 122 West Academic: (U Tennessee, UC San Diego, U Kansas) National labs: (PNNL, INL, SNL) Industry (in kind): Sapphire Energy, Algenol Biofuels, Bioprocess Algae Algae Biomass Organization
Costs (K)
FY 10-12
FY 13
FY 14 FY 15
FY 16-18
DOE Funds
0 263 183 800* 3078**
Cost Share
0 0 0 0 0
* Budget **Planned funding level

Project Overview Objectives and History (2.5 of 3 tasks are new) • Task 1. Sustainability
– Began FY13, grew out of participation in NRC committee on sustainable algal biofuels
– Identified indicators and targets and moving toward best management practices
– New subtask on pond bioliners in FY15 • Task 2. Resource analysis
– Grew out of • Collaboration with PNNL • Industry request to consider algae in Billion Ton studies
– Identifying co-location opportunities and develop algae supply curves
– New direction following Go/No-go, end of FY14 • Task 3. Polycultures
– Grew out of research need to go beyond monocultures – Optimizing conditions for increased yield of algae – New task in FY15
4
PNNL photo
San Diego Center for Algal Biotechnology
5
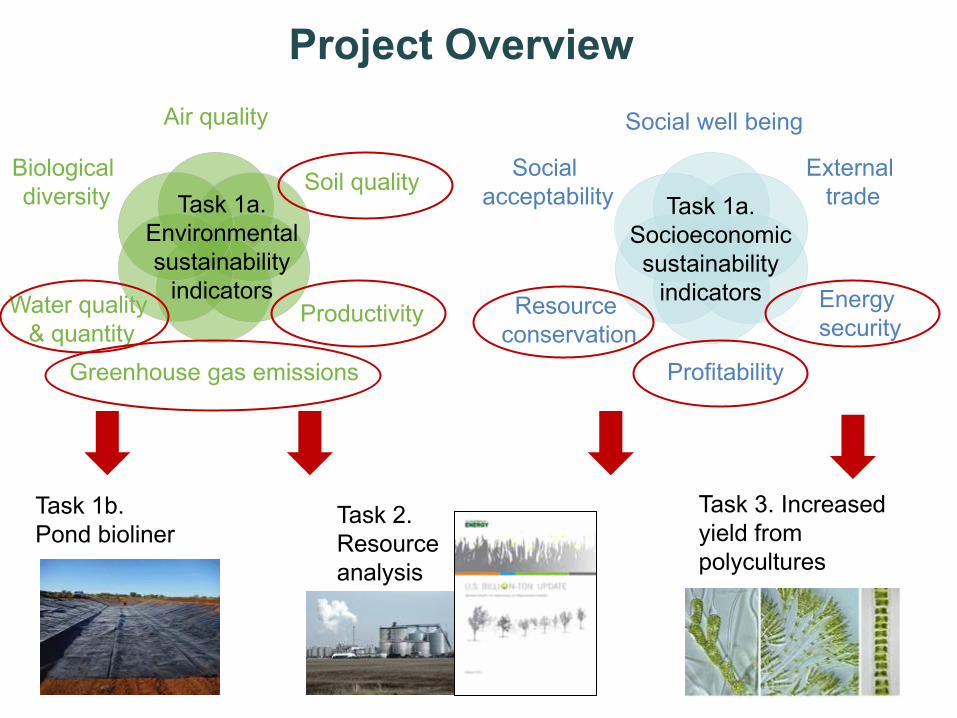
Project Overview
Greenhouse gas emissions
Soil quality
Water quality & quantity
Air quality
Biological diversity
Productivity
Social well being
External trade
Energy security
Profitability
Resource conservation
Social acceptability Task 1a.
Environmental sustainability
indicators
Task 1a. Socioeconomic sustainability
indicators
Task 1b. Pond bioliner
Task 3. Increased yield from polycultures
Task 2. Resource analysis
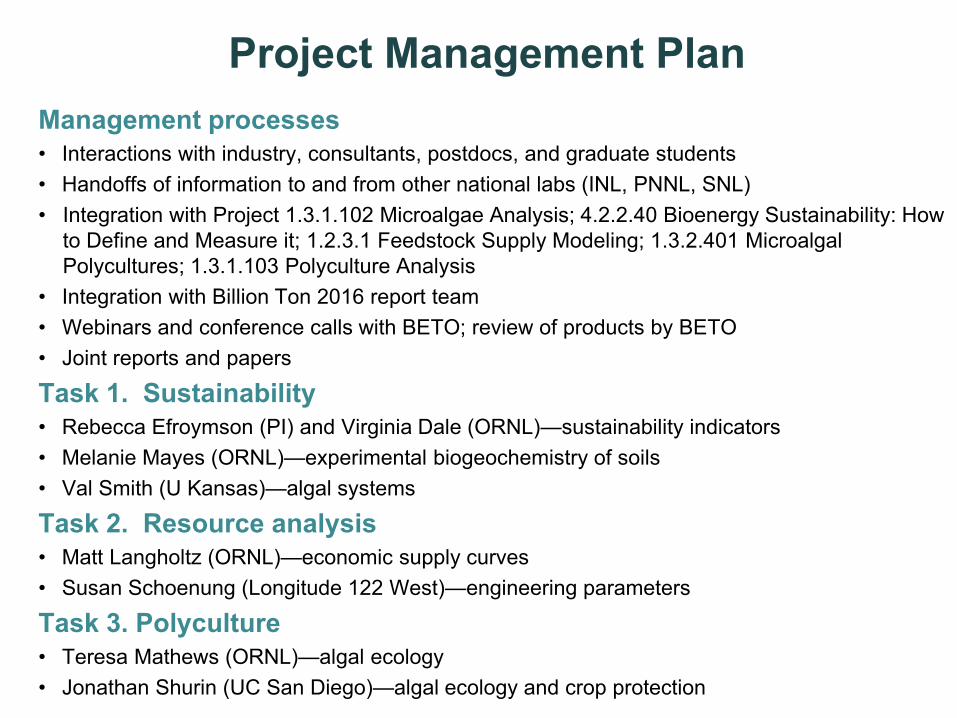
Project Management Plan Management processes • Interactions with industry, consultants, postdocs, and graduate students • Handoffs of information to and from other national labs (INL, PNNL, SNL) • Integration with Project 1.3.1.102 Microalgae Analysis; 4.2.2.40 Bioenergy Sustainability: How
to Define and Measure it; 1.2.3.1 Feedstock Supply Modeling; 1.3.2.401 Microalgal Polycultures; 1.3.1.103 Polyculture Analysis
• Integration with Billion Ton 2016 report team • Webinars and conference calls with BETO; review of products by BETO • Joint reports and papers
Task 1. Sustainability • Rebecca Efroymson (PI) and Virginia Dale (ORNL)—sustainability indicators • Melanie Mayes (ORNL)—experimental biogeochemistry of soils • Val Smith (U Kansas)—algal systems
Task 2. Resource analysis • Matt Langholtz (ORNL)—economic supply curves • Susan Schoenung (Longitude 122 West)—engineering parameters
Task 3. Polyculture • Teresa Mathews (ORNL)—algal ecology • Jonathan Shurin (UC San Diego)—algal ecology and crop protection

Objectives—Task 1. Sustainability
Development of pond bioliners as alternative for HDPE • Improve profitability • Maintain water quality and quantity
Potential cost savings for avoiding HDPE liners • 25% of cultivation/processing costs1 • 24% of capital costs for a facility2
• 75% of capital costs for a facility3
Uses of sustainability indicators • Modeling future effects • Energy comparisons • Units for life-cycle analysis • Certification
Case studies
1 Davis et al. 2014. Environ Sci Technol 48:6035-6042 2 Rogers et al. 2014. Algal Research 4:76-88 3 Coleman et al. 2014. Algal Research 5:79-94
Fig. 2.38 from BETO’s Multi-Year Program Plan (MYPP)

8 8
Approach—Task 1a. Sustainability
Strain selection criteria
Resource requirements
Infrastructure
Cultivation media
Supply chain steps
Practical, science-based set of sustainability indicators for algal biofuel
NRC algae
metrics
Global Bioenergy
Partnership indicators
Roundtable on Sustainable Biomaterials
indicators
ORNL/BETO bioenergy
sustainability indicators
Case studies Case studies

Technical accomplishments—Task 1a. Environmental sustainability indicators
9 Efroymson RA, VH Dale. 2015. Environmental indicators for sustainable production of algal biofuels. Ecological Indicators 49:1-13 (published online in 2014)
Category Indicator
Soil quality 1. Bulk density
Water quality 2. Nitrate export
3. Total P export
4. Salinity
Water quantity 5. Peak storm flow
6. Minimum base flow
7. Consumptive water use
Greenhouse gases
8. CO2 equivalent emissions (CO2 and N2O)
Category Indicator
Biodiversity 9. Presence of taxa of special concern
10. Habitat area of taxa of special concern
11. Abundance of released algae
Air quality 12. Tropospheric ozone
13. Carbon monoxide
14. Total particulate matter less than 2.5μm diam
15. Total particulate matter less than 10μm diam
Productivity 16. Primary productivity or yield
Red ovals indicate differences from general bioenergy sustainability indicators

10
Technical accomplishments—Task 1a. Socioeconomic sustainability indicators
Efroymson et al. submitted. Socioeconomic indicators for sustainable production of algal biofuels. Ecological Indicators
Category Indicator
Social well-being
1. Employment
2. Household income
3. Workdays lost to injury
4. Food security
Energy security
5. Energy security premium
6. Fuel price volatility
External trade 7. Terms of trade
8. Trade volume
Profitability 9. Return on investment
10. Net present value
Category Indicator
Resource conservation
11. Depletion of non-renewable energy resources 12. Fossil energy return on investment
Social acceptability
13. Public opinion
14. Transparency
15. Effective stakeholder participation
16. Risk of catastrophe
Identical to indicators developed for bioenergy in general

Technical accomplishments—Task 1a. Industry interactions
• Queries of industry regarding – Their ongoing measurements of environmental sustainability – Interest in categories of sustainability that they are not already measuring – Interest in potential cases studies – Industry data available to support case studies – Possibility of using case study to help site selection
11
• Preliminary conclusions – Industry is measuring sustainability – Industry has prioritized on-site sustainability
over regional environmental sustainability – Accident scenario case study involving off-site
transport of algae and nutrients would be useful
– Challenge: availability of data to support case study, given confidentiality concerns

12
Approach—Task 1b. Pond bioliner
flow
Goal is to avoid costly HDPE liners in algal facilities by creating conditions for native soils to form pond bioliners
Lab-scale soil column experiments designed to promote soil pore clogging through particle movement & biofilm growth
Biological and physical processes reduce soil hydraulic conductivity to protect underlying groundwater (~10-7 cm/s)
Approach: Need to identify critical soil properties required for pond bioliner formation
Critical success factor:
• While approach works in other types of waste holding facilities, will it work with algae?
• Need to test diverse soil particle size distributions to be applicable to many sites (not only clay soils)
Potential challenges:
Example soil: Deep clay from
phosphate-mined lands

Phase I
Mar-June 2015
flow
flow
flow
Water Chemistry Treatments
Initial soil Particle Size Distributions
Lab
experiments:
Measure effect of Water Chemistry and Particle Size on
soil hydraulic conductivity
Alternate ponding &
draining Phase II
Jul-Dec 2015
Phase III
Jan-Sep 2016
Proof-of-principle test: 5 soils, 3 water chemistries
Proof-of-principle design: column size, pond/drain frequency, etc.
(depending on Phase II results)
• Continue proof-of-principle testing, or
• Test with real and proposed facility soils
Future work—Task 1b. Pond bioliner
Criteria to minimize leakage into ground water
Locations to deploy bioliners
Outcomes:

14
Sustainability task milestone Date • Complete preliminary lab-scale experiments on pond bioliners. • Design of experimental configuration (boundary conditions,
choice of test soils, microbial growth substrates)
June 2015
• Complete report or paper on status of algal biofuel industry measurements of environmental sustainability
March 2016
• Complete pond bioliner experiments on 3 test soils with 2 microbial substrates
June 2016
• Complete report or paper on accident scenario case study December 2016
Future work—Task 1. Sustainability
14
15
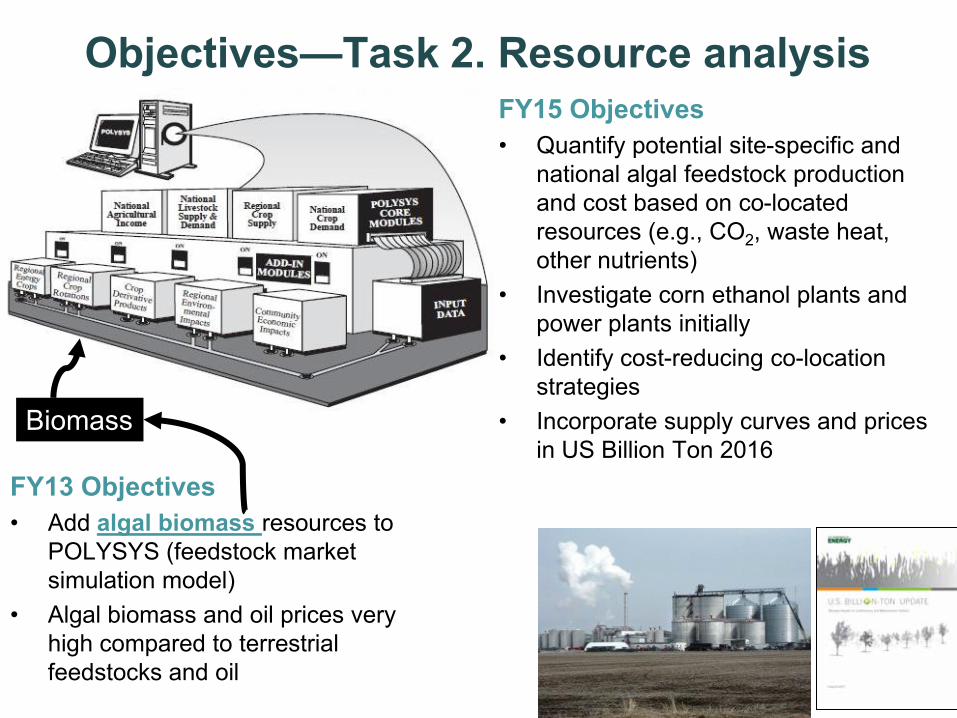
FY13 Objectives • Add algal biomass resources to
POLYSYS (feedstock market simulation model)
• Algal biomass and oil prices very high compared to terrestrial feedstocks and oil
Objectives—Task 2. Resource analysis FY15 Objectives • Quantify potential site-specific and
national algal feedstock production and cost based on co-located resources (e.g., CO2, waste heat, other nutrients)
• Investigate corn ethanol plants and power plants initially
• Identify cost-reducing co-location strategies
• Incorporate supply curves and prices in US Billion Ton 2016
Biomass

• Consult industry and scientific literature on engineering assumptions and cost • Estimate cost differential between use of co-located resources (CO2, heat,
nutrients) and base case • Consider photobioreactors and open ponds, 1000 acres of production • Transfer assumptions to PNNL to generate biophysically-based production
estimates and select priority land areas for resource co-location • Generate supply curves for dry biomass • Integrate with 1.2.3.1 Feedstock Supply Modeling to reveal post-harvest benefits of
co-location • Seek stakeholder feedback (e.g., Algae Biomass Organization) • Challenge: Identify and quantify all costs
16
Approach—Task 2. Resource analysis

17
Technical accomplishments—Task 2. Resource analysis
• In review: “Potential land competition between open-pond microalgae production and terrestrial dedicated feedstock supply systems in the U.S.” (ORNL and PNNL)
• Minimal land competition between terrestrial and algal feedstock supply
R3: $600/dt Algae ($7.06/gal Oil), $60/dt Terrestrial base yield growth: 5.2%/yr R4: $660/dt Algae ($7.76/gal Oil), $66/dt Terrestrial high yield growth: 14.7%/yr R5: $720/dt Algae ($8.47/gal Oil), $72/dt Terrestrial SWG=switchgrass

• Decision framework identifying algae production technologies best suited to co-location strategies
• Unit costs for alternative resources, transport costs per unit distance, capital costs, and cost trades for CO2 from ethanol plant
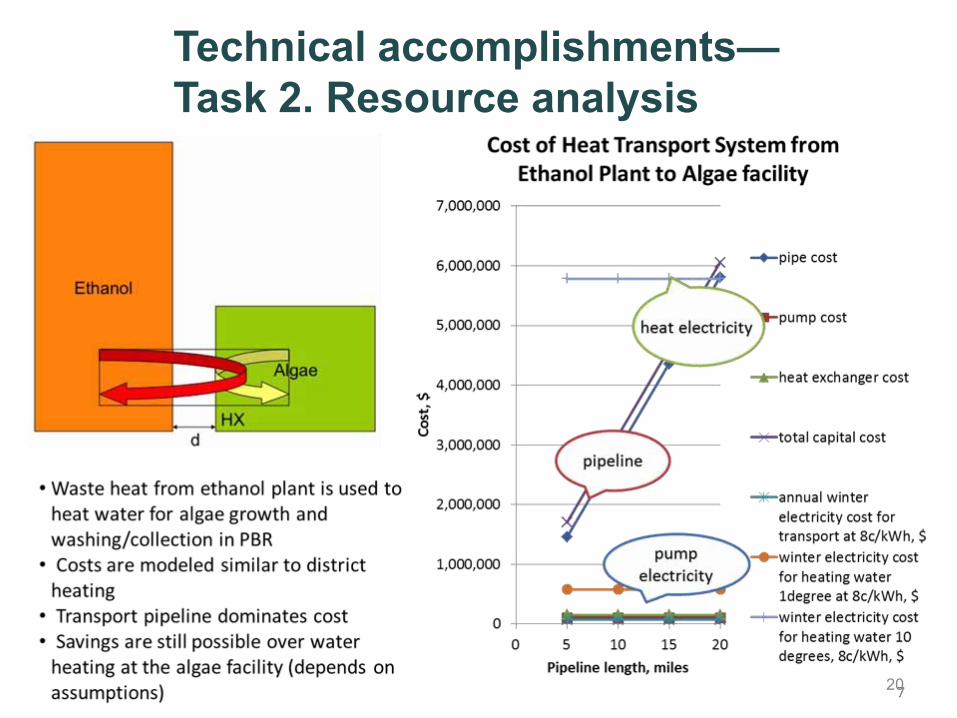
Technical accomplishments—Task 2. Resource analysis
to PNNL
• Initial results for example systems show cost savings from CO2 use from ethanol plants within about 20 miles or more and for power plants within about 5 miles

19
blower booster booster booster
To algae
~ ~ low pressure mass flow
compressor storage
To algae
~ power
high pressure mass flow
Technical accomplishments
—Task 2. Resource analysis
Examined tradeoffs between alternative designs, e.g., CO2 transport options
20
Technical accomplishments— Task 2. Resource analysis
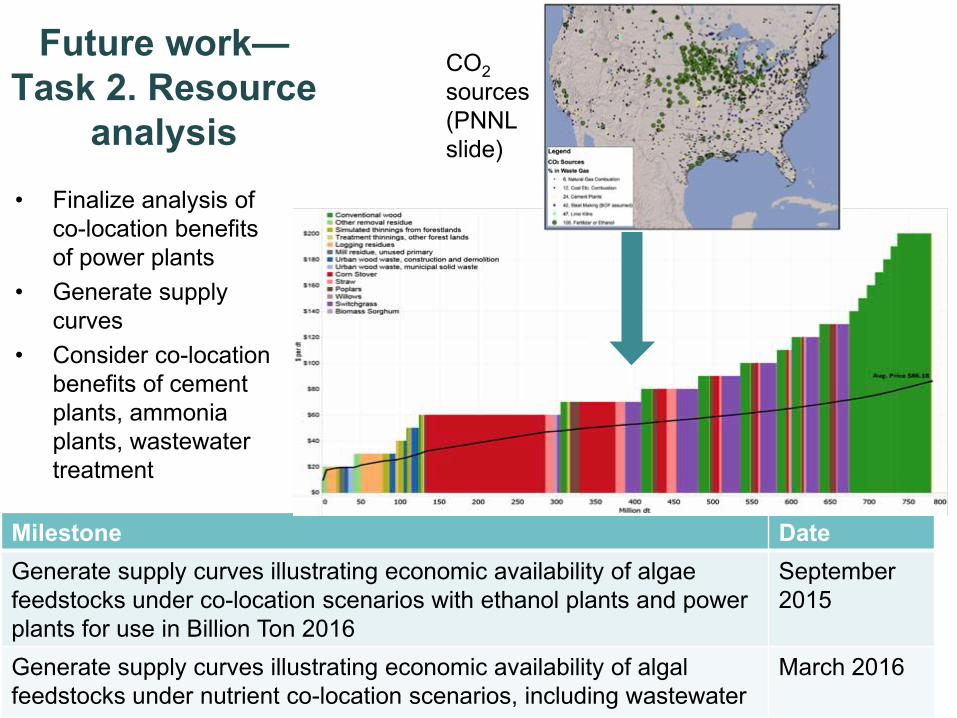
• Finalize analysis of co-location benefits of power plants
• Generate supply curves
• Consider co-location benefits of cement plants, ammonia plants, wastewater treatment
21
Future work—Task 2. Resource
analysis
Milestone Date Generate supply curves illustrating economic availability of algae feedstocks under co-location scenarios with ethanol plants and power plants for use in Billion Ton 2016
September 2015
Generate supply curves illustrating economic availability of algal feedstocks under nutrient co-location scenarios, including wastewater
March 2016
CO2 sources (PNNL slide)

Objectives—Task 3. Increased yield through algal polycultures
Objective • Increase annual biomass
production from current 13 g m2 d-1 to target of 20-30 g m2 d-1
using algal polycultures
Background • Increased biomass yields are critical for cost
effective production of algal biofuels • Crop losses are a challenge to large-scale
production in outdoor ponds and to a stable supply
• Polycultures (multispecies consortia) should be more resilient to crop losses than monocultures

23
Approach—Task 3. Algal polycultures • Multi-organizational research hub assembled to address major ecological
and engineering challenges
Characterize naturally occurring benthic algal polycultures to inform the design of planktonic polycultures (SNL)
Examine conversion performance of assembled planktonic polycultures (SNL)
Test laboratory - assembled polycultures on a meso - scale, simulating outdoor pond conditions (PNNL)
Increase growing degree days: Design planktonic algal polycultures to increase productivity during off - season (INL)
Crop protection: Design planktonic algal polycultures that are resistant to grazing and infection (ORNL)
Characterization Polyculture design Scale up Conversion

24
Future work—Task 3. Increased yield through algal polycultures
Milestone Date Submit joint review paper with national lab partners-baseline state of the art algal polycultures overyielding and resilience
March 2015
Demonstrate mesoscale polycultures performance through complementary approaches by partners
September 2015
• Characterize naturally occurring algal polycultures to
provide basis for rational assemblage (ORNL, INL, SNL) • Expose algal polycultures to stressors (e.g. grazers,
fungi) and quantify performance relative to monocultures in terms of: • Productivity (biomass) • Resilience (time to “reset” pond after stress)
• Start experiments at bench scale, informed by work at other labs in polyculture hub, but transition to meso-scale, with goal to use RAFT test beds by FY17
• Conduct handoffs between labs to accelerate progress toward scaling up and conversion

25
Summary and Relevance • Environmental, economic, and social factors can impede commercial
viability of energy technologies • Measuring indicators and mitigating unfavorable ones early will speed social
acceptance of commercialization • Based on needs of the algal biofuel community, this project has branched
into 3 major research areas that should result in sustainability solutions
1. Pond bioliners to reduce costs and maintain water quality and quantity 2. Co-location with industry and utilities to increase profitability while maintaining
productivity and reducing GHG emissions 3. Algal polycultures to increase productivity and promote a stable supply of algal
biofuel (energy security) that is not subject to crashes
The Linde Group (used with permission)

26
Additional Slides

27
Responses to Previous Reviewers’ Comments
Comment: This project should look at the sustainability of algal biofuels for
economically viable scenarios that are likely to be deployed with comparison to
current state of technology scenarios. . . . There appear to be risks of
premature dissemination of analysis results that are either based on non-viable
scenarios that will never happen, or are based on highly speculative scenarios
that are unlikely to be correct.
Response: Task 2 (resource analysis) has been refocused on co-location scenarios (e.g., obtaining CO2 from ethanol plants and power plants, obtaining nutrients from wastewater treatment plants), which should satisfy the reviewers. This also reflects a Go/No-go decision in June 2014 regarding the status and future of the resource analysis task. Task 1 is investigating the technical viability of in situ pond bioliners, which also gets us closer to economic viability.

Comment: Although it is good to get in front of sustainability issues, there is so
much uncertainty about algal strains, cultivation, harvest, extraction, and co-
products that the sustainability work will be highly speculative.
Response: We are querying representatives of industry so that sustainability case studies can represent viable supply chains. Results may be system-specific, but examples of sustainability assessments should be broadly useful.
Comment: While the importance of addressing sustainability and resource
analysis is clear, the specific approach to be taken by the team appears to lack
sufficient detail to know for sure if the plan will be successful.
Response: The project was new in 2013, and approaches were under development. Tasks are more well-defined now.
Responses to Previous Reviewers’ Comments

Acronyms and definitions
29
Term Definition
AFDW Ash-free dry weight
biofilm Thin film of microbiota (usually bacteria) that adheres to a surface, in this case to soil below pond
BETO DOE Bioenergy Technologies Office
Co-location Locating an algal biofuel production facility near a source of resources (e.g., CO2)
consortium Microbial community
EROI Energy return on investment
GHG Greenhouse gas
HDPE High density polyethylene
INL Idaho National Laboratory
In situ In place
monoculture Population of algae (single species)
NRC National Research Council
PNNL Pacific Northwest National Laboratory
ROI Return on investment
polyculture Community with multiple species of algae
resource analysis Quantification of biomass resources for bioenergy
RAFT Regional Algal Feedstock Testbed
SNL Sandia National Laboratory
supply curve Biomass or fuel product versus price

30
Publications, Presentations, Awards
Publications Efroymson RA, VH Dale. 2015. Environmental indicators for sustainable production of algal biofuels. Ecological Indicators 49:1-13 Efroymson RA, VH Dale, M Langholtz. Submitted. Socioeconomic indicators for sustainable production of algal biofuels. Ecological Indicators Langholtz M. Submitted, Potential land competition between open-pond microalgae production and dedicated feedstock supply systems in the U.S. Renewable Energy
Presentations Efroymson RA. 2014. Sustainable development of algae for biofuel: Select accomplishments and directions. Algal Biofuels Strategy Workshop, Charleston, SC. Efroymson RA and Dale VH. Environmental sustainability indicators for algal biofuels. Algae Biomass Summit. Orlando, FL, Sept-Oct 2013.
Award Melanie Mayes was elected as a Fellow of the American Association for the Advancement of Science.