Embed Size (px)
Citation preview

Sustainable Developmentin SwitzerlandFactors for an indicator system
Neuchâtel, 2000
BUWAL Bundesamt für Umwelt, Wald und LandschaftOFEFP Office fédéral de l’environnement, des forêts et du paysageUFAFP Ufficio federale dell’ambiente, delle foreste e del paesaggioSAEFL Swiss Agency for the Environment, Forests and Landscape
2 Geography and environment
A pilot study basedon the methodologyof the United NationsCommission on SustainableDevelopment (CSD)
���� ���� ���
������������������� �� ����������� ����� �� ��������������������� �� ��������������� �� ����������

The «Swiss Statistics» series published by the Swiss Federal Statistical Office (SFSO)covers the following fields:
0 General topics
1 Population
2 Geography and environment
3 Labour force
4 National Accounts
5 Prices
6 Production, trade and consumption
7 Agriculture and forestry
8 Energy
9 Construction and housing
10 Tourism
11 Transport and communications
12 Monetary policy, financial markets and banks
13 Social security and insurance
14 Health
15 Education and science
16 Culture and living conditions
17 Politics
18 Public finances
19 Law enforcement

Neuchâtel, 2000
Authors André de Montmollin, David AltweggSwiss Federal Statistical Office
Published by Swiss Federal Statistical OfficeSwiss Agency for the Environment, Forests and Landscape
Swiss Statistics
Sustainable Developmentin SwitzerlandFactors for an indicator systemA pilot study based on the methodologyof the United Nations Commissionon Sustainable Development (CSD)
���� ���� ���
������������������� �� ����������� ����� �� ��������������������� �� ��������������� �� ����������
Contacts for further information: André de Montmollin, SFSO, Phone 0041 (0)32 713 64 72e-mail: [email protected] Sotoudeh, SAEFL, Phone 0041 (0)31 323 07 33e-mail: [email protected]
Project managers: André de Montmollin, SFSO, David Altwegg, SFSOProject team: Ariane Sotoudeh, Peter Grolimund, Nicolas Perritaz, Antoine Perruchoud, SAEFL
Dominique Martin, SFSOObtainable from: Swiss Federal Statistical Office
CH-2010 NeuchâtelPhone 0041 (0)32 713 60 60 / Fax 0041 (0)32 713 3 60 61
Order number: 320-9900-01Price: Sfr. 18.–
Series: Swiss StatisticsField: 2 Geography and environment
Original text: French/GermanTranslation: SFSO and SAEFL Translation Services
Graphics /Layout: SFSOCopyright: SFSO, Neuchâtel 2000
Reproduction with mention of source authorized(except for commercial purposes)
ISBN: 3-303-02054-X

1
Contents
Preface
1 Introduction
2 Approach
3 Pilot project objectives
4 The indicators4.1 Role of indicators4.2 The CSD indicator system
5 Selection of indicators5.1 Adopted approach5.2 Results of the selection procedure5.3 Gaps in the CSD indicator system5.4 Indicators that cannot be implemented
6 Presentation and evaluation of indicators6.1 Evaluation of indicators individually6.2 Evaluation of the indicator system used6.3 Evaluation of the adopted approach6.4 Evaluation of sustainability
7 Continuation of work7.1 Development of a «hybrid solution»7.2 Presentation of results
8 Indicators (french or german)
Social aspects1 Unemployment rate2 Gini Index of income inequality3 Net migration rate4 Gross Domestic Product (GDP) spent on education5 School life expectancy6 Per capita consumption of fossil fuel by motor
vehicle transport7 Percent of population in urban areas8 Area and population of urban formal
and informal settlements9 Floor area per person
Economic aspects10 Gross Domestic Product (GDP) per capita11 Annual energy consumption
12 Share of consumption of renewable energyresources
13 Total ODA as a percentage of GNP14 External debt as a percentage of GNP
Environmental aspects15 Domestic consumption of water per capita16 Biochemical oxygen demand in water bodies17 Land use changes18 Use of agricultural pesticides19 Use of fertilisers20 Energy use in agriculture21 Arable land area per capita22 Protected area as a percentage of total area23 Threatened species as a percentage
of total native species24 Emissions of greenhouse gases25 Emissions of nitrogen oxides26 Consumption of ozone-depleting substances27 Ambient concentration of pollutants in urban areas28 Household waste disposal per capita29 Waste recycling and reuse30 Generation of hazardous wastes31 Import and export of hazardous wastes32 Area of land contaminated by hazardous wastes33 Generation of radioactive wastes
9 Bibliography
Annex 1: Full list of CSD indicators with resultsof selection stages
Annex 2: Explanations for the selection or eliminationof the 59 relevant and implementableindicators
Annex 3: Framework for presenting sustainabledevelopment indicators
Annex 4: Proposal for flagship indicatorsin the field of transport
Annex 5: Economic indicators (proposals)Environmental Management System (EMS)Ethical, social or environmental investments
2
Preface
At the 1992 Conference on Environment and Develop-ment in Rio, Switzerland undertook to design and imple-ment a policy aimed at promoting sustainable develop-ment. This commitment took practical shape initially in asustainable development strategy published by the SwissFederal Council in 1997 and subsequently through explicitmention of sustainable development in the preamble toand objectives of the new Federal Constitution adoptedby the electorate on 18 April 1999.
The concept and aims of sustainable development fuel afar-ranging debate and raise many questions in the mindsof both politicians and the general public. Are we asustainable society? And if not, are we moving towards asustainable society? Where do we stand in relation toother countries? What demands does sustainable de-velopment impose on our larger community?
To conduct a constructive discussion, we need assessmentcriteria and an instrument for measuring these criteria,which should not only permit the monitoring of sustain-able development but also contribute to an increasedawareness of its requirements and implications.
The Swiss Federal Agency for The Environment, Forestsand Landscape (SAEFL) and the Swiss Federal Statistical
Office (SFSO) have taken the initiative on laying thefoundation for such an instrument by conducting a jointpilot study on sustainable development indicators. Theobjective of this study is not to arrive at an operationalsystem of indicators but to establish an initial indicator set,thus triggering a broad debate among the main players insustainable development. Both our Offices have decidedto emphasise existing indicators and their incorporationinto an international context. For this reason, the study islargely based on the system of indicators drawn up by theUnited Nations Commission on Sustainable Development(CSD) and on existing statistical data.
This document is the fruit of close cooperation betweenthe SAEFL and the SFSO. It has benefited from the expertadvice of their staff as well as from the support of otherproducers of statistics for information purposes. We takethis opportunity to express our deep gratitude for theirassistance.
SAEFL SFSO
Arthur Mohr Michel Kammermann
Head, Sustainable Head, Spatial EconomicsDevelopment Division Division
3
1 Introduction
In June 1992, at the United Nations Conference onEnvironment and Development held in Rio, Switzerlandundertook to design and implement a national sustainabledevelopment policy and to play an active role in inter-national efforts in this field. The Agreements signed in Rioby 182 countries include Agenda 21, the general re-ference document for work on sustainable development.In its 40 chapters, this document proposes actions to beundertaken in the areas of economic and social develop-ment and the management and preservation of naturalresources as well as in the reinforcing of solidarity and theimplementation of sustainable development.
The concept of sustainable development was defined in1987 by the World Commission on Environment andDevelopment (also known as the Brundtland Commission)for which it «meets the need of the present without com-promising the ability of future generations to meet theirown needs.» Sustainable development is based on thethree pillars of social solidarity, economic efficiency andecological responsibility. It postulates that they are allequally valid and that none of the three can develop at thecost of the other two.
Agenda 21 calls on countries to draw up action plans forimplementing sustainable development at national leveland to encourage the creation of local Agenda 21 bodiesto pursue the same objective at community level.
According to Switzerland’s new Constitution (art. 2,par. 2), which was adopted by the electorate on 18 April1999, the Swiss Government is to promote sustainabledevelopment. Its objectives are set out in the legislationschedule for the period 1995–1999, which also refers tothe Federal Council’s resolve to take them into account inall areas coming within its purview. This resolve was givenconcrete shape in 1997 with a strategy that set out theactions and measures likely to promote sustainable de-velopment1). The latter include the setting up of a«Council for Sustainable Development» to advise theGovernment on such matters.
2 Approach
According to Agenda 21, the results of implementing sus-tainable development should be monitored using a systemof efficient indicators which are coordinated at interna-tional level (Agenda 21, chapter 40). These indicatorsmust be consensual and provide a representative pictureof the three dimensions of sustainable development (soci-ety, economy, environment). They must be easy for all tointerpret and understand, be comparable with othercountries and be founded on a sound scientific and tech-nical basis. They are intended both for policy-makers andfor the general public.
The Swiss Federal Agency for The Environment, Forestsand Landscape (SAEFL) and the Swiss Federal StatisticalOffice (SFSO) have taken the initiative of launching a jointpilot project in this field, with the aim not of producing adefinitive system of indicators, but rather of suggesting aninitial list, thus triggering a wide-ranging debate with theinterested parties. This project is the first step on the waytowards a more elaborate system and it meets the needfor rapid action in this field. For this reason, the twoOffices decided not to involve other Offices or institutionsdirectly in the pilot project but to conduct the work them-selves, thereby cutting down on the usual consultationprocedures to some extent. Partners of the two Officesand other interested parties will have an opportunity to airtheir views following publication of the pilot study results.
Numerous institutions and organisations are currentlydeveloping indicator systems for sustainable developmentusing approaches that sometimes differ considerably. Inthe face of this abundance of highly interesting systems,many of which are still in the research stage, the twoOffices have opted for indicators which can be rapidlyconstructed using available data, which meet public statis-tics requirements2) and which are comparable with othercountries.
The list of indicators created by the UN Commission onSustainable Development (CSD)3), designed with the aimof permitting coordinated evaluation of sustainable de-
1) Federal Council: Sustainable development in Switzerland – Strategy, Berne, 19972) The main requirements are: comparability as regards time and territory, topicality, representativity and reliability (Message concerning the Federal
Statistics Act of 30 October 1991).3) United Nations: Indicators of Sustainable Development – Framework and Methodologies, New York, 1996

4
velopment at global level, meets the requirements of thetwo Offices. Bearing these characteristics in mind togetherwith international comparability requirements and theresources available, the Offices decided to forgo develop-ing new indicators within the framework of the pilot studyand to base their work on the CSD list.
The project is being conducted in several phases (see illus-tration 1). A small working group made up of SAEFL andSFSO staff selected relevant indicators from the CSD list.These were subsequently constructed and evaluated, andthis documentation sets out the evaluation findings.Discussions will now be held with interested parties toconduct a joint evaluation of their requirements and tocollect ideas and proposals about how the work shouldcontinue.
3 Pilot project objectives
The objectives of the pilot project are:
• to evaluate and present an initial limited set of indica-tors for sustainable development that are suitable forSwitzerland and representative of the three dimensions(social, economic and environmental),
• to encourage discussion with interested parties in orderto ascertain their needs and expectations,
• to collect the experience needed to implement a moredeveloped system of indicators for sustainable develop-ment.
Illustration 1: Adopted approach
Indicator systems for sustainable development
UN system (134) Other countries’ systems Sectoral systems
SAEF
L /
SFSO
pilo
t st
ud
y
Selection of approx.thirty indicators
Applicationwith Swiss data
Conclusionsand recommendations
Evaluation:• Quality and availability of data• International comparability• Monitoring of sustainability in CH
DecisionUnsuitable
Suitable
Finalisation,developments
Introduction / regular updating
Consultations

5
Bearing in mind these objectives, international compa-rability requirements, the resources available and theabsence of a precise operational interpretation of sustain-able development, the project is governed by the follow-ing three prerequisites:
1 the study is based wholly on the 134 CSD indicators. Nonew indicators will be developed,
2 the indicators adopted can be implemented quicklyusing existing data that must be of good quality, welldocumented and regularly updated,
3 under no circumstances can the indicators quantify asociety’s sustainability in absolute terms. They can onlyindicate the direction or movement of sustainabledevelopment.
4 The indicators
4.1 Role of indicators
As tools for description and communication and for dis-closing and highlighting complex information, indicatorsare important components of any statistical system. Theyintegrate, combine or aggregate multiple data which canbe one-, two- or three-dimensional in order to make themeasier to understand.
The role of indicators in a statistical information systemcan be illustrated by the information pyramid (see illus-tration 2). The base of the pyramid is made up of primaryraw data collected through surveys, measurement net-works or administrative sources, of checked and docu-mented individual data and of fundamental aggregateddata. This data segment, the most significant in terms ofquantity, is mainly intended for experts. The upper part ofthe pyramid comprises sectoral indicators which can beincorporated into systems of indicators of sustainabledevelopment. The latter can be aggregated numericallytaking the form of composite indicators or indexes, or mayeven be integrated into a single indicator (such as socialwell-being and economic prosperity). To our knowledge,this type of integration is still in the research stage.
The base of the pyramid is not totally inaccessible to indi-cator users. Thanks to comparatively clear informationabout the source of the data (metadata), users can accessdata used to construct the indicators.
4.2 The CSD indicator system
CSD’s list of 134 indicators was created to obtain a stand-ardised information base in a large number of countrieswith varying degrees of development and to allow evalu-ation of Agenda 21 implementation at both a global leveland on a country-by-country basis.
Illustration 2: Statistical information pyramid (based on Braat, 1991)
Exp
erts
Single compositeindicator
Compositeindicators
Indicators of sustainabledevelopment
Sectoral indicators
Aggregate data
Checked individual data
Primary raw data
Cit
izen
s, d
ecis
ion
-mak
ers
6
CSD indicators are structured using two axes:
• the structure of Agenda 21’s chapters, spread over4 aspects: social (41 indicators), environmental (55),economic (23) and institutional (14),
• classification of indicators according to the «DrivingForce – State – Response» (DF–S–R) model derived fromthe «Pressures–State–Response» (P–S–R frameworkused by the OECD to construct environmental indi-cators4)) (DF: 42 indicators, S: 58, R: 34).
The logic of both the P–S–R and DF–S–R models is basedon causality. The pressure or driving force of human acti-vities directly or indirectly brings about changes in thestate of the environment, changes which cause an im-balance in the system and provoke a reaction from socialplayers in the form of technical or political measures oractions
The CSD list is currently being tested by many countriesusing a common methodology. Several reports on thesetests are already available (see bibliography). This list willcertainly be modified and supplemented on the basis ofthe reported experiences, and a new version will be issuedin 2001.
Some of the indicators have already been published byEurostat with the data available from countries of theEuropean Union5). The experiences of these countriesreveal the limitations of this approach when it comes toclear, unambiguous modelling of complex relationsbetween the areas or aspects of sustainable develop-ment6). Thus, while the DF–S–R model can easily be ap-plied to environmental indicators, the same cannot be saidfor social or economic indicators where the distinctionbetween driving force and state is difficult to establish.Moreover, the model does not take account of the risks,exposition or irreversible nature of dysfunctioning of thesystem7).
Several sector-based systems for social or environmentalindicators in respect to sustainable development arecurrently being designed by agencies in the Swiss federaladministration or within the framework of researchprojects. These indicators cover, inter alia, forestry, agri-culture and the environment, biodiversity and transport.The SFSO regularly publishes indicators for education,technology and health. The pilot project fits into a globalcontext and in no way competes with these more spe-cialised sector-based systems. It aims instead to observe
sustainable development trends and does not intend tofine-tune such policy or suggest sectoral measures. Linksor overlaps with these projects can nevertheless be es-tablished to allow indicator users to move easily betweensystems, depending on their needs, avoiding duplicationsand conflicting results.
5 Selection of indicators
The concept of sustainable development is defined at aglobal level, so its interpretation depends to a great extenton national, regional and local particularities or presentand future needs, as well as on the sensitivity and opinionsof those involved in the process. Thus, a list of sustainabledevelopment indicators will necessarily be subjective andpartial, and cannot satisfy all expectations.
5.1 Approach used
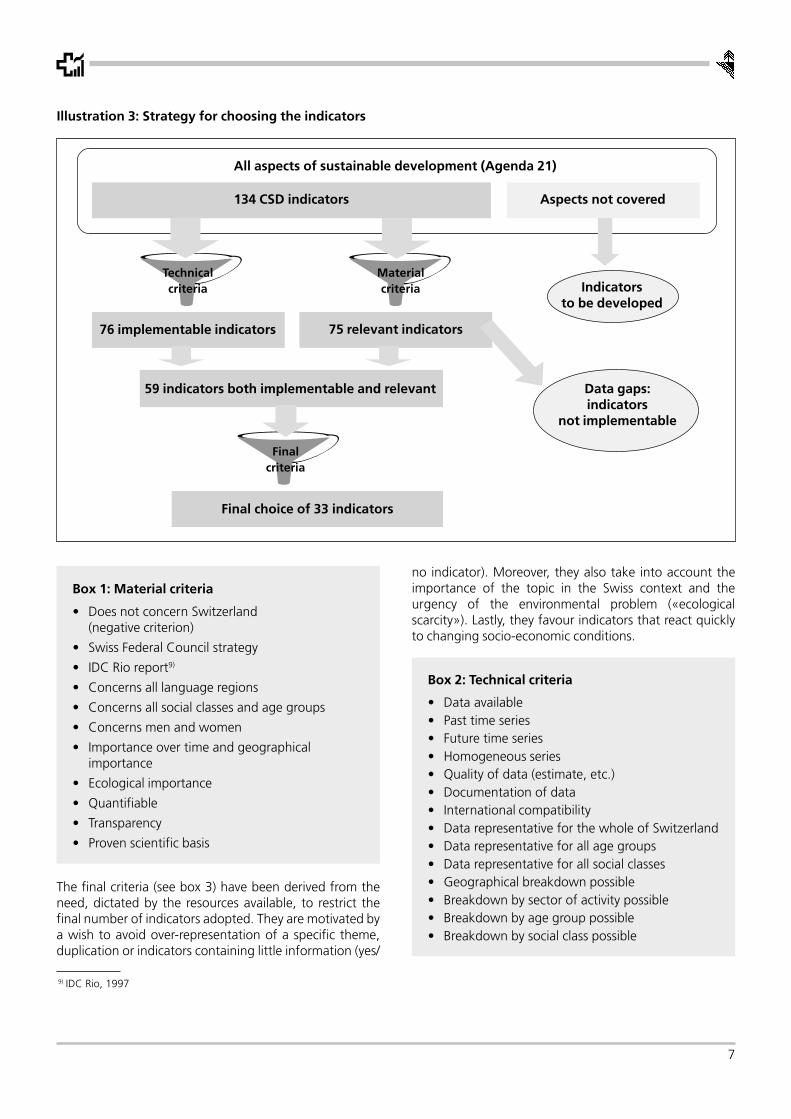
A strategy for indicator selection was designed on thebasis of clearly defined criteria in order to guarantee theclarity and objectivity of the selection process (see illustra-tion 3).
All 134 CSD indicators were filtered using two sets ofcriteria: one material and the other technical.
The material criteria (see box 1), which take account of themessage or content of each indicator, were developed incompliance with the general principles of sustainabledevelopment, taking into consideration Swiss Govern-ment strategy as well as the report of the Interdepart-mental Committee Rio (IDC Rio)8). Both the geographicalimportance and importance over time of the problemsdescribed by the indicators, as well as their environmental,social and economic scope, were also taken into account.The indicators were not chosen according to their classifi-cation in the DF–S–R framework. As we have alreadyseen, this approach, which is mainly used for constructingenvironmental indicators, does not seem suitable formodelling the components of sustainable development.
For the technical criteria (see box 2), the main considera-tion was data availability as well as the requirements ofofficial statistics (see footnote 2). In actual fact, the firstcriterion – data availability – was often decisive forselecting an indicator.
4) OECD, 19935) Eurostat, 19976) Eurostat, 19987) Blanchet and November, 1998:308) IDC Rio: Sustainable development in Switzerland – State of implementation, Berne, 1997
7
Box 1: Material criteria
• Does not concern Switzerland(negative criterion)
• Swiss Federal Council strategy
• IDC Rio report9)
• Concerns all language regions
• Concerns all social classes and age groups
• Concerns men and women
• Importance over time and geographicalimportance
• Ecological importance
• Quantifiable
• Transparency
• Proven scientific basis
The final criteria (see box 3) have been derived from theneed, dictated by the resources available, to restrict thefinal number of indicators adopted. They are motivated bya wish to avoid over-representation of a specific theme,duplication or indicators containing little information (yes/
no indicator). Moreover, they also take into account theimportance of the topic in the Swiss context and theurgency of the environmental problem («ecologicalscarcity»). Lastly, they favour indicators that react quicklyto changing socio-economic conditions.
Box 2: Technical criteria
• Data available• Past time series• Future time series• Homogeneous series• Quality of data (estimate, etc.)• Documentation of data• International compatibility• Data representative for the whole of Switzerland• Data representative for all age groups• Data representative for all social classes• Geographical breakdown possible• Breakdown by sector of activity possible• Breakdown by age group possible• Breakdown by social class possible
Finalcriteria
Illustration 3: Strategy for choosing the indicators
All aspects of sustainable development (Agenda 21)
134 CSD indicators Aspects not covered
Technicalcriteria
Materialcriteria
76 implementable indicators 75 relevant indicators
59 indicators both implementable and relevant
Final choice of 33 indicators
Indicatorsto be developed
Data gaps:indicators
not implementable
9) IDC Rio, 1997

8
The first two filters produced a set of 59 indicators whichmet both the material criteria (relevant indicators) andtechnical criteria (implementable indicators). The 59 indi-cators adopted were then filtered using the final criteria,resulting in a final restricted choice of 33 indicators. Thisfinal selection, which is mainly a pragmatic one, meetsone of the project’s initial objectives (production of alimited set of indicators). The complete list of CSD indi-cators, together with the results of the selection stages,can be found in annex 1.
Box 3: Final criteria
• Importance of topics in the Swiss context
• Balanced distribution of indicators overthe maximum possible number of topics
• No similar or duplicated indicators
• Unambiguous, widely accepted interpretationof indicator’s links to sustainable development
• Fast reaction to changing socio-economicconditions
• Important information content(no «yes/no» indicators)
• Consideration of priority tasks dependingon the urgency of the social or environmentalproblems (ecological scarcity)
• Consideration of overall aspectsand not specific problems
This selection strategy also makes it possible to identify thesustainable development areas which are not addressedby the list of CSD indicators («aspects not covered, indi-cators to be developed» in illustration 3) and to highlightindicators considered relevant but which cannot be imple-mented due to unavailable data («data gaps, indicatorsnot implementable» in illustration 3). Aspects not coveredand indicators to be developed – as well as those whichare not implementable – are discussed in Sections 5.3and 5.4.
5.2 Results of the selection procedure
The final choice comprises 33 indicators: 9 social indi-cators, 5 economic indicators and 19 environmental ones.The selection procedures were applied as objectively aspossible. As regards the technical criteria, it should benoted that some criteria, such as those concerning theavailability and quality of the data, were evaluated on anapproximate basis. Without substantial investment itwould not have been possible to establish with anycertainty whether certain data were actually available or
not. Several of the indicators adopted either could not beimplemented as planned or caused unforeseen problems.In particular this is the case for the «Gini index of incomeinequality», which generated additional work and the«Land contaminated by hazardous wastes», which couldnot be calculated due to lack of data. The list of 59 indi-cators adopted (1st stage of selection), along with explana-tions as to why they were selected or eliminated, can befound in annex 2.
At first sight, distribution of the 33 selected indicators overthe three sectors – society, economy and environment –seems to overemphasise environmental indicators. In ac-tual fact, this corresponds to the distribution of the indi-cators in both the CSD list and that drawn up by Eurostat.Moreover, certain information assigned to one categorycould just as easily pertain to another. For instance, theindicator for «Consumption of fossil fuel by motor vehicletransport» is included with the social aspects, however itcould just as easily be included in the environmental (airpollution abatement chapter) or economic (changes inconsumer behaviour chapter) sectors. The institutionalsector is not represented in the final selection becausenone of the CSD indicators in this sector passed the finalfilter (final criteria) due to their low information content(yes/no indicators) or their ambiguous interpretation.
Several important sustainable development fieldsfor which the CSD list proposes indicators are not re-presented in the final selection of 33 indicators. These are:health, forests, chemical substances and environment-threatening organisms. In the future, these fields will haveto be covered either by indicators from other systems or byindicators that have been specially developed for the task.Explanations for the rejection of indicators concerning theabove-mentioned fields are included in annex 2.
5.3 Gaps in the CSD indicator system
Two aspects of sustainable development which are impor-tant for Switzerland are not considered by the CSD indi-cator system.
• Apart from the indicator «Consumption of fossil fuel bymotor vehicle transport», transport and mobility arevirtually not touched on by CSD indicators. Moreover,they are not explicitly mentioned in Agenda 21. How-ever, transport policy is a key factor in Swiss FederalCouncil strategy. In the future, the CSD indicator list willhave to be supplemented with some indicatorsconcerning mobility and transport. Proposals along thisline can be found in annex 4.
• Actions taken by the private sector and consumersto promote sustainable development are also notaddressed in the indicators presented here. The CSD
9
economic indicators are either too heavily aggregatedor they only concern aspects that come within thepublic domain, on which the private sector has littledirect influence. Agenda 21 advocates strengtheningthe role of the economy and industry in sustainabledevelopment. Swiss Federal Council strategy providesfor measures aimed at stimulating the responsibility ofproducers in respect to sustainable development andraising consumer awareness. Two proposals for indi-cators about actions taken by private enterprise and in-vestors can be found in annex 5.
European countries participating in the official trials ofCSD indicators have reached similar conclusions about thegaps in the indicator system. In their view, the main areasthat are only inadequately or not at all covered by the UNsystem are10):
• transport,
• the role of the private sector,
• economic development,
• biotechnology,
• tourism,
• biodiversity
Although the last area is represented by two indicators, itis not dealt with comprehensively enough sincebiodiversity is a central factor in sustainable development.Moreover, it is an integral part of the latter’s definition (seechapter 1). Consequently, biodiversity merits special atten-tion, as regards both the collection of data needed for itsmonitoring and the place it should have in a system ofindicators for sustainable development.
5.4 Indicators that cannot be implemented
Four indicators on the CSD list that are regarded asparticularly important cannot currently be implemented.These are:
• Head count index of poverty: this indicator, whichdescribes the proportion of the population with astandard of living below the poverty line, cannotcurrently be implemented due to lack of adequate dataon the one hand and due to problems involved indefining the poverty line on the other. In the end, itcould supplement or replace the «Gini index of incomeinequality» indicator.
• Proportion of potentially hazardous chemicalsmonitored in food: this health indicator cannot beimplemented due to lack of adequate data.
• Environmental protection expenditure: this indi-cator would be important for describing the actiontaken by government bodies and the private sector topromote environmental protection. The data needed tocalculate this indicator have been surveyed only once(1992/1993) during a pilot survey, and so there is notime series.
• Changes in land condition: this indicator describesthe proportion of degraded land over a specific periodby type of degradation. It would be an indicator for thequalitative protection of land but cannot currently beimplemented because it requires methodological workin addition to the collection of a substantial amount ofdata.
6 Presentation and evaluationof indicators
Each indicator is presented using a set grid designed toprovide all the information necessary for comprehension,interpretation and evaluation. This grid comprises a de-tailed description of each indicator, its links to sustainabledevelopment and to federal policy. The indicator’s valuesare presented in graphic form. A detailed description ofthe grid and the content of each heading is included inannex 3. The indicator data sheets are given in chapter 8.
The indicators and the results obtained were evaluated infour stages:
1 individual evaluation of each indicator,
2 evaluation of all 33 indicators in terms of their ability todescribe the development of the main fields of sus-tainable development,
3 evaluation of the approach followed and the optionschosen,
4 evaluation of sustainability using the 33 indicators.
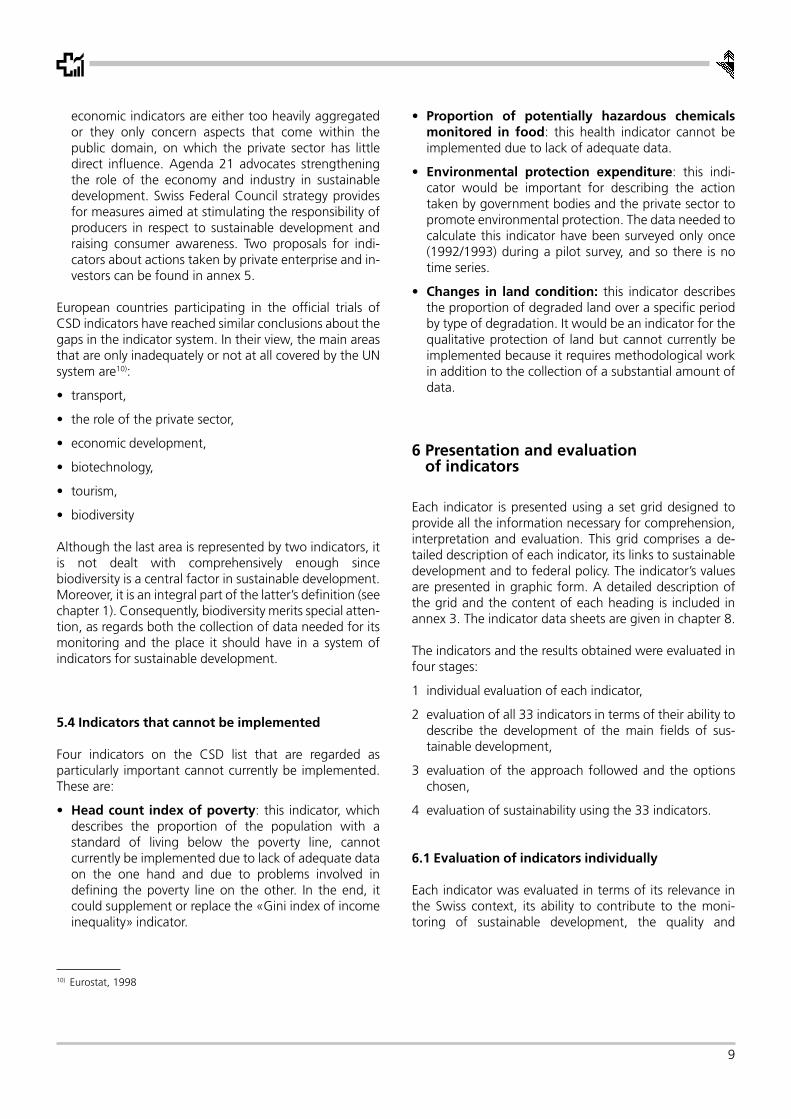
6.1 Evaluation of indicators individually
Each indicator was evaluated in terms of its relevance inthe Swiss context, its ability to contribute to the moni-toring of sustainable development, the quality and
10) Eurostat, 1998

10
availability of the data and its international compatibility.This evaluation was carried out using four classes definedand illustrated by the following symbols:
All 33 indicators selected were evaluated according to thesame framework even if, as in certain cases, it transpiredthat some of them were unsuitable. This approach wasdictated by the desire to make the evaluation and decisionprocess transparent and was also applied to the statisticaldata, which are always shown in graph form, even if theindicator is unsuitable.
Table 6.1 summarises the evaluation of all the indicators.Of the 33 indicators, 12 are suitable, 13 partially suitable,3 require development and 5 are unsuitable.
It should be recalled that this evaluation was conductedunder the terms of the objectives of this pilot project,which are first and foremost to provide information formonitoring sustainable development and encouragingdebate.
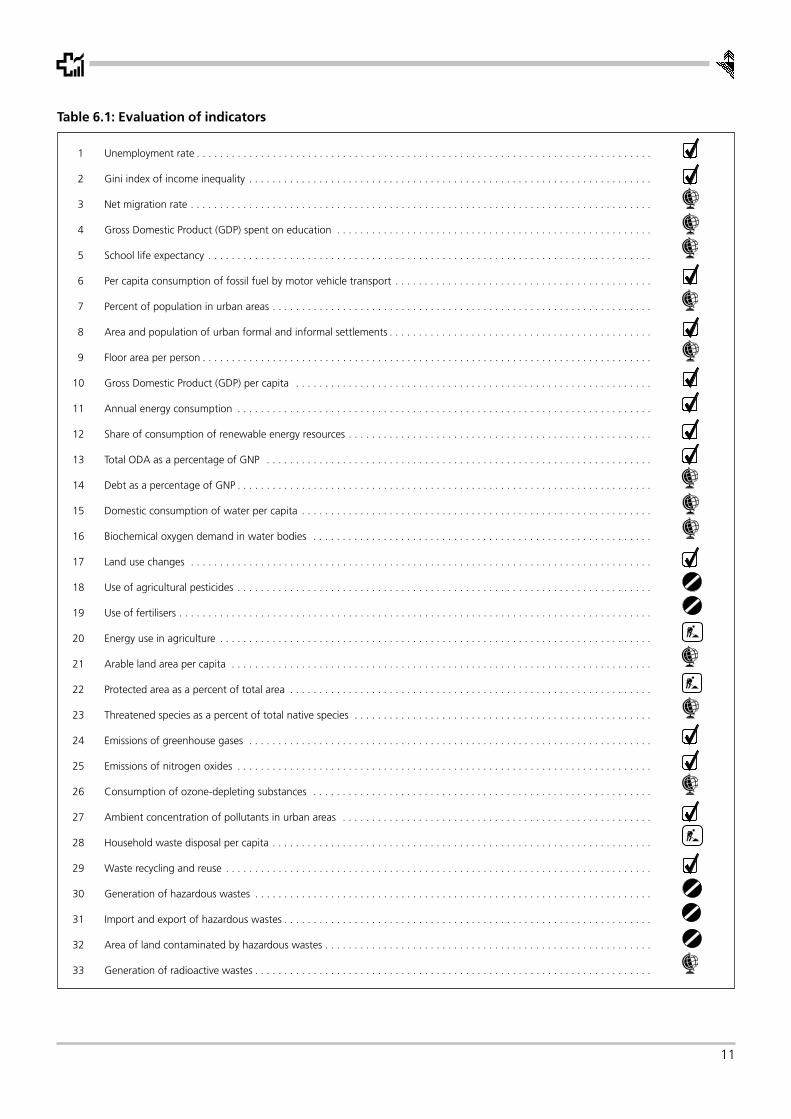
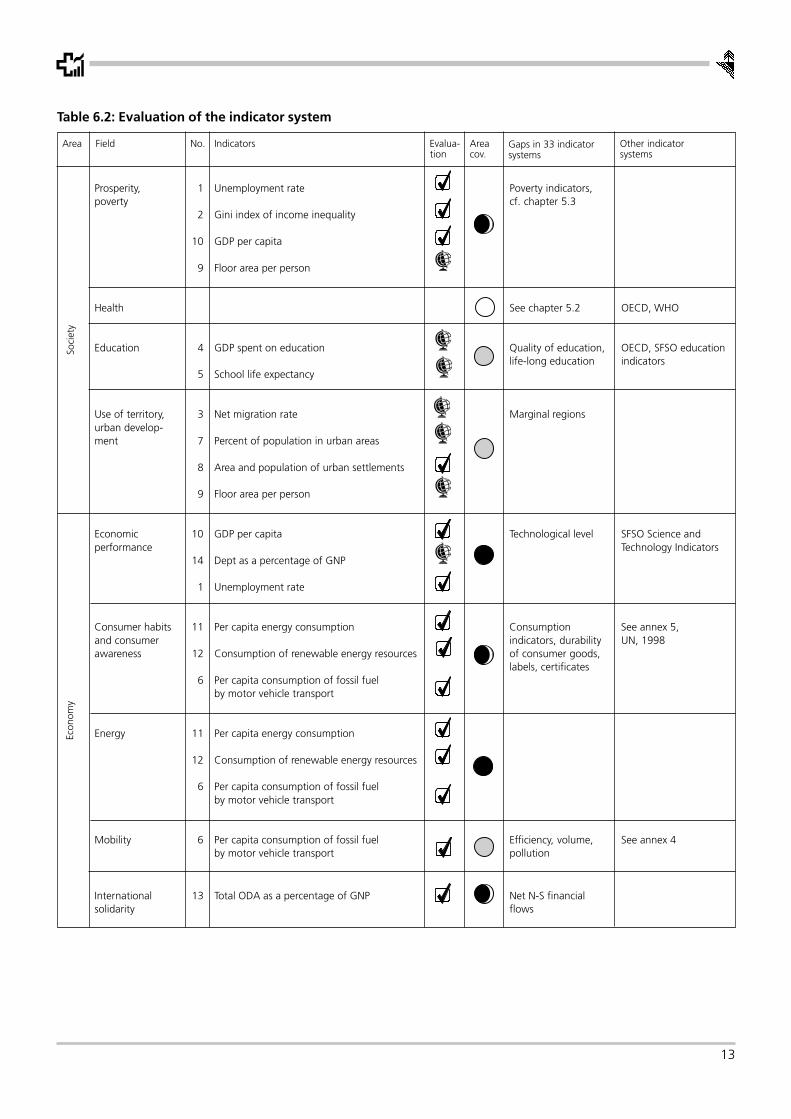
6.2 Evaluation of the indicator system used
The evaluation focuses on the degree of coverage forareas of sustainable development regarded as importantfor Switzerland. This is estimated on the basis of the
number and quality (see chapter 6.1) of the indicatorsconcerned. The list of these areas is not definitive and willundoubtedly be supplemented and amended later. Their
demarcation and assignment to a sector (social, economicor environmental) are subjective and could also be altered.Several indicators have been assigned to several areas.
The areas «Prosperity, poverty», «Health», «Education»and «Use of territory, urban development» come underthe social aspect, while the economic aspect covers«Economic performance», «Consumer habits andconsumer awareness», «Energy», «Mobility» and «Inter-national solidarity», and the environmental sector followsa broad outline of the chapters in Agenda 21.
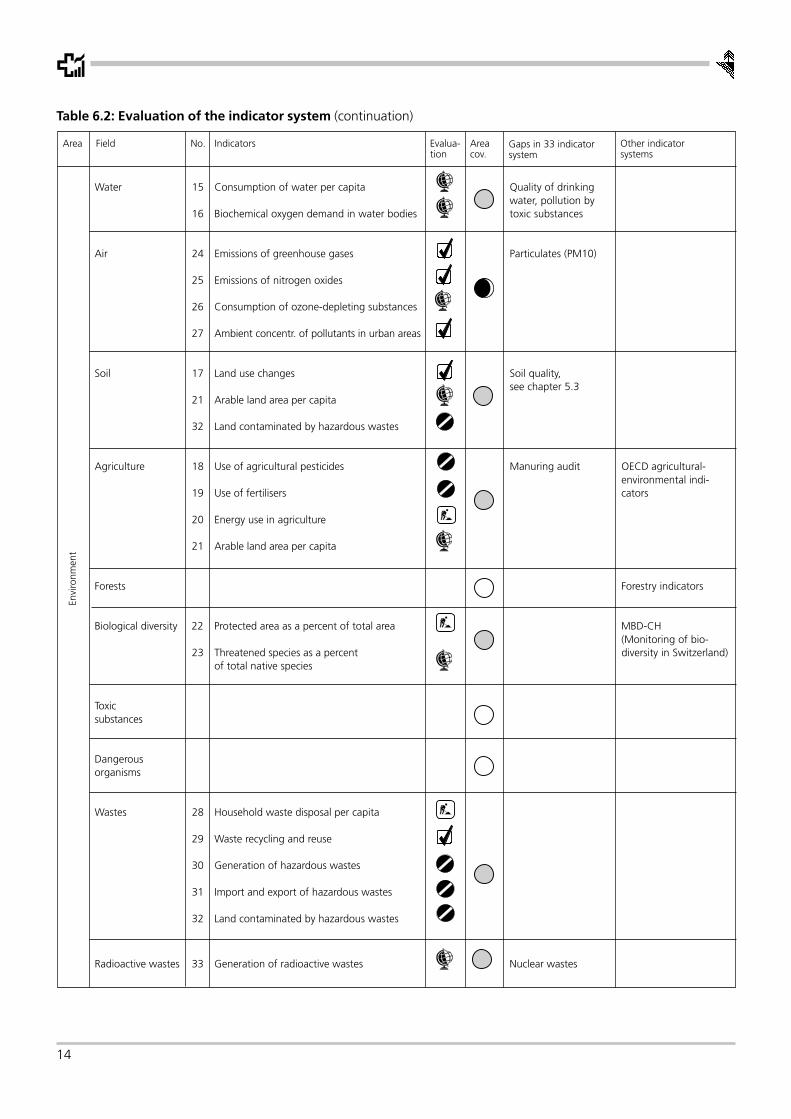
Table 6.2 summarises the evaluation and mentions themain gaps in each field and existing indicator system,certain elements of which could be used to supplementthe list, thus contributing to better coverage of the area.
The system of 33 indicators provides satisfactorycoverage of the economic aspect (as described bythe system of indicators). The social and environ-mental aspects feature gaps, some of them subs-tantial. «Energy» and «Economic performance» arewell covered, whereas «Prosperity», «Consumer
Suitable indicator: The indicator is suitable for monitoring sustainable development in Switzerlandand the data used are of good quality.
Partially suitable indicator: The indicator is better suited for international comparisonsthan for monitoring sustainable development in Switzerland.
Indicator requiring development: The problem addressed by the indicator is relevantbut the definition needs to be adapted to the Swiss context and Swiss data.
Unsuitable indicator: The indicator is not relevant or the data required are not suitablefor describing the phenomenon under study.
Suitable indicators, area well covered
Suitable indicators, area inadequately covered
Unsuitable indicators, area not covered
No indicators, area not covered
The evaluation uses 4 classes defined and illustrated by a pictogram as follows:
11
Table 6.1: Evaluation of indicators
1 Unemployment rate . . . . . . . . . . . . . . . . . . . . . . . . . . . . . . . . . . . . . . . . . . . . . . . . . . . . . . . . . . . . . . . . . . . . . . . . . . . . . .
2 Gini index of income inequality . . . . . . . . . . . . . . . . . . . . . . . . . . . . . . . . . . . . . . . . . . . . . . . . . . . . . . . . . . . . . . . . . . . . .
3 Net migration rate . . . . . . . . . . . . . . . . . . . . . . . . . . . . . . . . . . . . . . . . . . . . . . . . . . . . . . . . . . . . . . . . . . . . . . . . . . . . . . .
4 Gross Domestic Product (GDP) spent on education . . . . . . . . . . . . . . . . . . . . . . . . . . . . . . . . . . . . . . . . . . . . . . . . . . . . . .
5 School life expectancy . . . . . . . . . . . . . . . . . . . . . . . . . . . . . . . . . . . . . . . . . . . . . . . . . . . . . . . . . . . . . . . . . . . . . . . . . . . .
6 Per capita consumption of fossil fuel by motor vehicle transport . . . . . . . . . . . . . . . . . . . . . . . . . . . . . . . . . . . . . . . . . . . .
7 Percent of population in urban areas . . . . . . . . . . . . . . . . . . . . . . . . . . . . . . . . . . . . . . . . . . . . . . . . . . . . . . . . . . . . . . . . .
8 Area and population of urban formal and informal settlements . . . . . . . . . . . . . . . . . . . . . . . . . . . . . . . . . . . . . . . . . . . . .
9 Floor area per person . . . . . . . . . . . . . . . . . . . . . . . . . . . . . . . . . . . . . . . . . . . . . . . . . . . . . . . . . . . . . . . . . . . . . . . . . . . . .
10 Gross Domestic Product (GDP) per capita . . . . . . . . . . . . . . . . . . . . . . . . . . . . . . . . . . . . . . . . . . . . . . . . . . . . . . . . . . . . .
11 Annual energy consumption . . . . . . . . . . . . . . . . . . . . . . . . . . . . . . . . . . . . . . . . . . . . . . . . . . . . . . . . . . . . . . . . . . . . . . .
12 Share of consumption of renewable energy resources . . . . . . . . . . . . . . . . . . . . . . . . . . . . . . . . . . . . . . . . . . . . . . . . . . . .
13 Total ODA as a percentage of GNP . . . . . . . . . . . . . . . . . . . . . . . . . . . . . . . . . . . . . . . . . . . . . . . . . . . . . . . . . . . . . . . . . .
14 Debt as a percentage of GNP . . . . . . . . . . . . . . . . . . . . . . . . . . . . . . . . . . . . . . . . . . . . . . . . . . . . . . . . . . . . . . . . . . . . . . .
15 Domestic consumption of water per capita . . . . . . . . . . . . . . . . . . . . . . . . . . . . . . . . . . . . . . . . . . . . . . . . . . . . . . . . . . . .
16 Biochemical oxygen demand in water bodies . . . . . . . . . . . . . . . . . . . . . . . . . . . . . . . . . . . . . . . . . . . . . . . . . . . . . . . . . .
17 Land use changes . . . . . . . . . . . . . . . . . . . . . . . . . . . . . . . . . . . . . . . . . . . . . . . . . . . . . . . . . . . . . . . . . . . . . . . . . . . . . . .
18 Use of agricultural pesticides . . . . . . . . . . . . . . . . . . . . . . . . . . . . . . . . . . . . . . . . . . . . . . . . . . . . . . . . . . . . . . . . . . . . . . .
19 Use of fertilisers . . . . . . . . . . . . . . . . . . . . . . . . . . . . . . . . . . . . . . . . . . . . . . . . . . . . . . . . . . . . . . . . . . . . . . . . . . . . . . . . .
20 Energy use in agriculture . . . . . . . . . . . . . . . . . . . . . . . . . . . . . . . . . . . . . . . . . . . . . . . . . . . . . . . . . . . . . . . . . . . . . . . . . .
21 Arable land area per capita . . . . . . . . . . . . . . . . . . . . . . . . . . . . . . . . . . . . . . . . . . . . . . . . . . . . . . . . . . . . . . . . . . . . . . . .
22 Protected area as a percent of total area . . . . . . . . . . . . . . . . . . . . . . . . . . . . . . . . . . . . . . . . . . . . . . . . . . . . . . . . . . . . . .
23 Threatened species as a percent of total native species . . . . . . . . . . . . . . . . . . . . . . . . . . . . . . . . . . . . . . . . . . . . . . . . . . .
24 Emissions of greenhouse gases . . . . . . . . . . . . . . . . . . . . . . . . . . . . . . . . . . . . . . . . . . . . . . . . . . . . . . . . . . . . . . . . . . . . .
25 Emissions of nitrogen oxides . . . . . . . . . . . . . . . . . . . . . . . . . . . . . . . . . . . . . . . . . . . . . . . . . . . . . . . . . . . . . . . . . . . . . . .
26 Consumption of ozone-depleting substances . . . . . . . . . . . . . . . . . . . . . . . . . . . . . . . . . . . . . . . . . . . . . . . . . . . . . . . . . .
27 Ambient concentration of pollutants in urban areas . . . . . . . . . . . . . . . . . . . . . . . . . . . . . . . . . . . . . . . . . . . . . . . . . . . . .
28 Household waste disposal per capita . . . . . . . . . . . . . . . . . . . . . . . . . . . . . . . . . . . . . . . . . . . . . . . . . . . . . . . . . . . . . . . . .
29 Waste recycling and reuse . . . . . . . . . . . . . . . . . . . . . . . . . . . . . . . . . . . . . . . . . . . . . . . . . . . . . . . . . . . . . . . . . . . . . . . . .
30 Generation of hazardous wastes . . . . . . . . . . . . . . . . . . . . . . . . . . . . . . . . . . . . . . . . . . . . . . . . . . . . . . . . . . . . . . . . . . . .
31 Import and export of hazardous wastes . . . . . . . . . . . . . . . . . . . . . . . . . . . . . . . . . . . . . . . . . . . . . . . . . . . . . . . . . . . . . . .
32 Area of land contaminated by hazardous wastes . . . . . . . . . . . . . . . . . . . . . . . . . . . . . . . . . . . . . . . . . . . . . . . . . . . . . . . .
33 Generation of radioactive wastes . . . . . . . . . . . . . . . . . . . . . . . . . . . . . . . . . . . . . . . . . . . . . . . . . . . . . . . . . . . . . . . . . . . .

12
habits», «International solidarity» and «Air» areinadequately covered; the other areas are notcovered at all.
In conclusion, it can be said that the set of 33 indi-cators derived from the CSD list in accordance withthe procedure described in chapter 5.1 is onlypartially suited to monitoring sustainable develop-ment in Switzerland.
6.3 Evaluation of the approach adopted
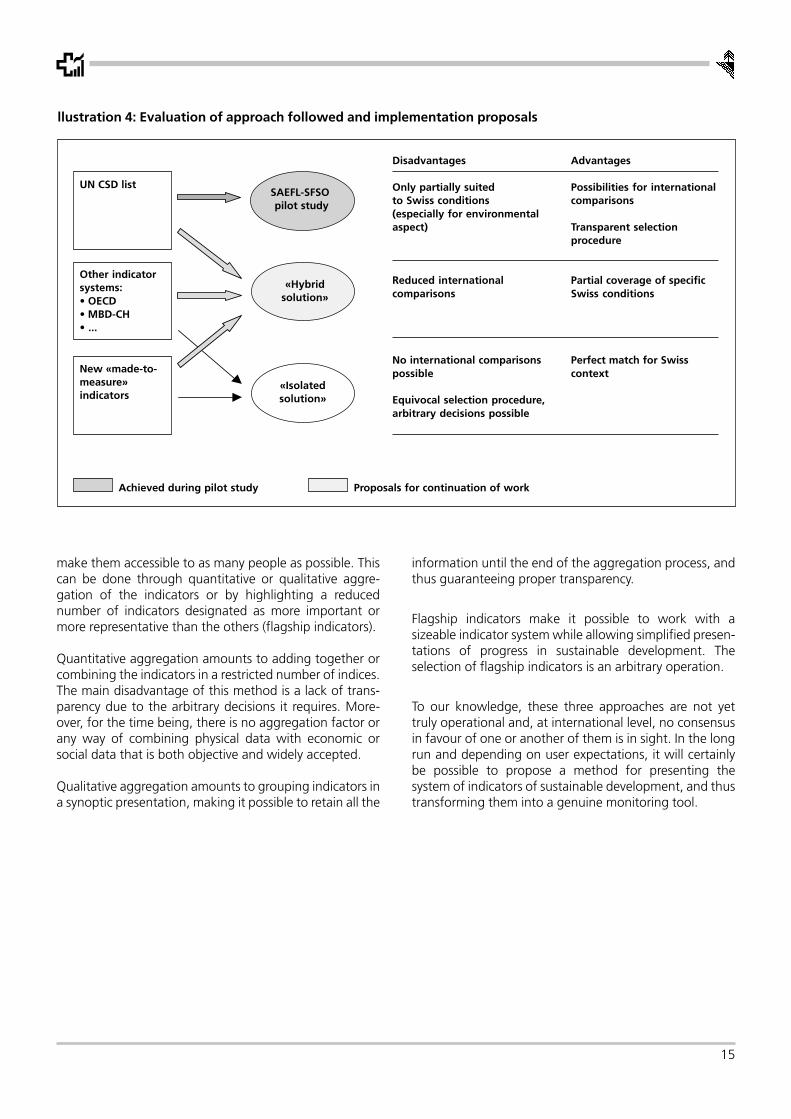
The procedure followed, together with the decision tofocus solely on the list of CSD indicators has not producedsufficiently conclusive results. The environmental aspectand several other fields are inadequately covered (seechapter 6.2). This approach has nevertheless offeredseveral advantages, such as comparability with othercountries, transparency of the selection processes andsimple, intelligible structuring of the indicators. Solutionswill have to be found to remedy the flaws of the proposedsystem.
Several possibilities can be envisaged and these are shownin illustration 4. Obviously, new «made-to-measure» indi-cators could be developed in response to Switzerland’sparticular characteristics. In this way, it might be possibleto construct indicators that satisfy federal requirementsand the needs of Agenda 21 local units. However,developing new indicators requires considerable resourcesand would take a long time. What is more, these indi-cators would still not be compatible at the internationallevel.
The «hybrid solution» shown in illustration 4 seems to bethe best choice. It would preserve international com-patibility by selecting existing indicators, most of whichhave been tested, from the lists of indicators used by otherinternational organisations or institutions. Moreover, thisapproach would guarantee links to – or conformity with –existing systems and those being developed in Switzer-land. The «hybrid solution» will, however, necessitate thedevelopment of a new approach for selecting indicators asit will no longer be possible to base this choice on thesectoral vision of Agenda 21’s chapters as used by the CSDlist.
The question of the number of indicators needed alsocrops up. It is not impossible that a future system of indi-cators for sustainable development will comprise moreindicators than the list proposed within the framework ofthe pilot project. This could raise presentation and aggre-gation problems. Too many indicators mean less trans-parency, which makes the system less intelligible, requiring
either aggregation or presentation methods or thecreation of a hierarchy of indicators (declaration of flag-ship indicators). This problem is discussed in greater depthin chapter 7.2.
6.4 Evaluation of sustainability
It is not yet possible to undertake an evaluation of sus-tainable development in Switzerland using the indicatorsselected. Some indicators are not sufficiently adapted toSwitzerland’s specific situation and sustainable develop-ment fields are imperfectly covered. This evaluation,which was not one of the pilot project’s objectives, can becarried out as soon as a more developed indicator systemis available.
7 Continuation of work
One of the objectives of this pilot study is to identify userexpectations and trigger a debate on the requirements formonitoring sustainable development and for work thatneeds to be done. This work will be dedicated not only todeveloping a system for monitoring sustainable develop-ment that is accepted by the majority and based on apragmatic approach, but also to the constructing anaggregated or simplified presentation of the results.
7.1 Development of the «hybrid solution»
In chapter 6.3, we saw that the «hybrid solution» couldconstitute a consensual, pragmatic approach that uses asimple, coherent modelling of the main areas of sus-tainable development in Switzerland. In this way, it will bepossible to choose and evaluate from among the otherindicator systems – for instance those published by theSFSO - the indicators best suited to meet future needs aswell as the present and future expectations of partners insustainable development.
In all cases, a pragmatic, realistic approach should beretained – one which draws on existing indicator systemsand is based on the available data. Lastly, indicators thatcan also be used by regional indicator systems should alsobe taken into consideration whenever possible.
7.2 Presentation of results
While an effective list of indicators is a prerequisite formonitoring sustainable development, it is also necessaryto think about the presentation of the results in order to
13
Table 6.2: Evaluation of the indicator system
Area Field No. Indicators Evalua-tion
Areacov.
Gaps in 33 indicatorsystems
Other indicatorsystems
Prosperity, 1 Unemployment rate Poverty indicators,poverty cf. chapter 5.3
2 Gini index of income inequality
10 GDP per capita
9 Floor area per person
Health See chapter 5.2 OECD, WHO
Education 4 GDP spent on education Quality of education, OECD, SFSO educationlife-long education indicators
5 School life expectancy
Use of territory, 3 Net migration rate Marginal regionsurban develop-ment 7 Percent of population in urban areas
8 Area and population of urban settlements
9 Floor area per person
Economic 10 GDP per capita Technological level SFSO Science andperformance Technology Indicators
14 Dept as a percentage of GNP
1 Unemployment rate
Consumer habits 11 Per capita energy consumption Consumption See annex 5,and consumer indicators, durability UN, 1998awareness 12 Consumption of renewable energy resources of consumer goods,
labels, certificates6 Per capita consumption of fossil fuel
by motor vehicle transport
Energy 11 Per capita energy consumption
12 Consumption of renewable energy resources
6 Per capita consumption of fossil fuelby motor vehicle transport
Mobility 6 Per capita consumption of fossil fuel Efficiency, volume, See annex 4by motor vehicle transport pollution
International 13 Total ODA as a percentage of GNP Net N-S financialsolidarity flows
Soci
ety
Econ
omy
14
Water 15 Consumption of water per capita Quality of drinkingwater, pollution by
16 Biochemical oxygen demand in water bodies toxic substances
Air 24 Emissions of greenhouse gases Particulates (PM10)
25 Emissions of nitrogen oxides
26 Consumption of ozone-depleting substances
27 Ambient concentr. of pollutants in urban areas
Soil 17 Land use changes Soil quality,see chapter 5.3
21 Arable land area per capita
32 Land contaminated by hazardous wastes
Agriculture 18 Use of agricultural pesticides Manuring audit OECD agricultural-environmental indi-
19 Use of fertilisers cators
20 Energy use in agriculture
21 Arable land area per capita
Forests Forestry indicators
Biological diversity 22 Protected area as a percent of total area MBD-CH(Monitoring of bio-
23 Threatened species as a percent diversity in Switzerland)of total native species
Toxicsubstances
Dangerousorganisms
Wastes 28 Household waste disposal per capita
29 Waste recycling and reuse
30 Generation of hazardous wastes
31 Import and export of hazardous wastes
32 Land contaminated by hazardous wastes
Radioactive wastes 33 Generation of radioactive wastes Nuclear wastes
Area Field No. Indicators Evalua-tion
Areacov.
Gaps in 33 indicatorsystem
Other indicatorsystems
Envi
ronm
ent
Table 6.2: Evaluation of the indicator system (continuation)
15
make them accessible to as many people as possible. Thiscan be done through quantitative or qualitative aggre-gation of the indicators or by highlighting a reducednumber of indicators designated as more important ormore representative than the others (flagship indicators).
Quantitative aggregation amounts to adding together orcombining the indicators in a restricted number of indices.The main disadvantage of this method is a lack of trans-parency due to the arbitrary decisions it requires. More-over, for the time being, there is no aggregation factor orany way of combining physical data with economic orsocial data that is both objective and widely accepted.
Qualitative aggregation amounts to grouping indicators ina synoptic presentation, making it possible to retain all the
information until the end of the aggregation process, andthus guaranteeing proper transparency.
Flagship indicators make it possible to work with asizeable indicator system while allowing simplified presen-tations of progress in sustainable development. Theselection of flagship indicators is an arbitrary operation.
To our knowledge, these three approaches are not yettruly operational and, at international level, no consensusin favour of one or another of them is in sight. In the longrun and depending on user expectations, it will certainlybe possible to propose a method for presenting thesystem of indicators of sustainable development, and thustransforming them into a genuine monitoring tool.
llustration 4: Evaluation of approach followed and implementation proposals
UN CSD list
Disadvantages
Only partially suitedto Swiss conditions(especially for environmentalaspect)
Reduced internationalcomparisons
No international comparisonspossible
Equivocal selection procedure,arbitrary decisions possible
Advantages
Possibilities for internationalcomparisons
Transparent selectionprocedure
Partial coverage of specificSwiss conditions
Perfect match for Swisscontext
SAEFL-SFSO pilot study
Other indicatorsystems:• OECD• MBD-CH• ...
New «made-to-measure»indicators
«Hybridsolution»
«Isolatedsolution»
Achieved during pilot study Proposals for continuation of work

16
8 IndicatorsPresentation of 33 indicators in french or in german according to the framework presented in annex 3
Attention: If there is nothing specified, the reference about the Constitution concernes the current Constitution,that is valid until the end of 1999.

17
Sorry!
The indicators are only available in French and in German.Please select one of these languages
17
9 Bibliography
Blanchet, Corinne; November, Andràs: Indicateurs dedéveloppement durable appliqués à l’aménagment duterritoire. Conseil Economique et Social. Genève, 1998
Braat, Leon: The predictive meaning of sustainability in-dicators. In: Kuik, Onno; Verbruggen Harmen (Ed.): Insearch of Indicators of Sustainable Development.Dordrecht, 1991
Ernst Basler + Partner: Measuring the Sustainability ofTransport. Materials of NRP 41 «Transport and Environ-ment», Project C5. Bern, 1998
Eurostat: Indicators of Sustainable Development – A pilotstudy following the methology of United Nations commis-sion on Sustainable Development. Luxembourg, 1997
Eurostat: Seminar of European Countries Participating inthe Testing of the CSD List of Indicators of SustainableDevelopment, 12 – 13 November 1998 in Luxembourg
Federal Council: Sustainable Development in Switzer-land - Strategy. Bern, 1997
IFEN: Test des indicateurs de développement durable desNations Unies – Rapport de la France. Etude et travauxn° 17. Orléans, 1998
Interdepartemental Committee Rio (IDC Rio): Sustain-able Development in Switzerland – State of Implemen-tation. Bern, 1997
OECD: OECD Core Set of indicators for environmentalperformance reviews. Environment Monographs N° 83.Paris, 1993
United Nations: Indicators of Sustainable Development– Framework and Methodologies. New York, 1996
United Nations: Measuring changes in Consumptionand Production Patterns – A set of Indicators. New York,1998
18
Annex 1Full list of CSD indicators
with results of selection stages
19
Chapter Agenda 21 Indicators
Rele
vant
indi
cato
rs
Impl
emen
tabl
ein
dica
tors
Ado
bted
indi
cato
rs
Fina
l cho
ice
IIndi
cato
rs n
otim
plem
enta
ble
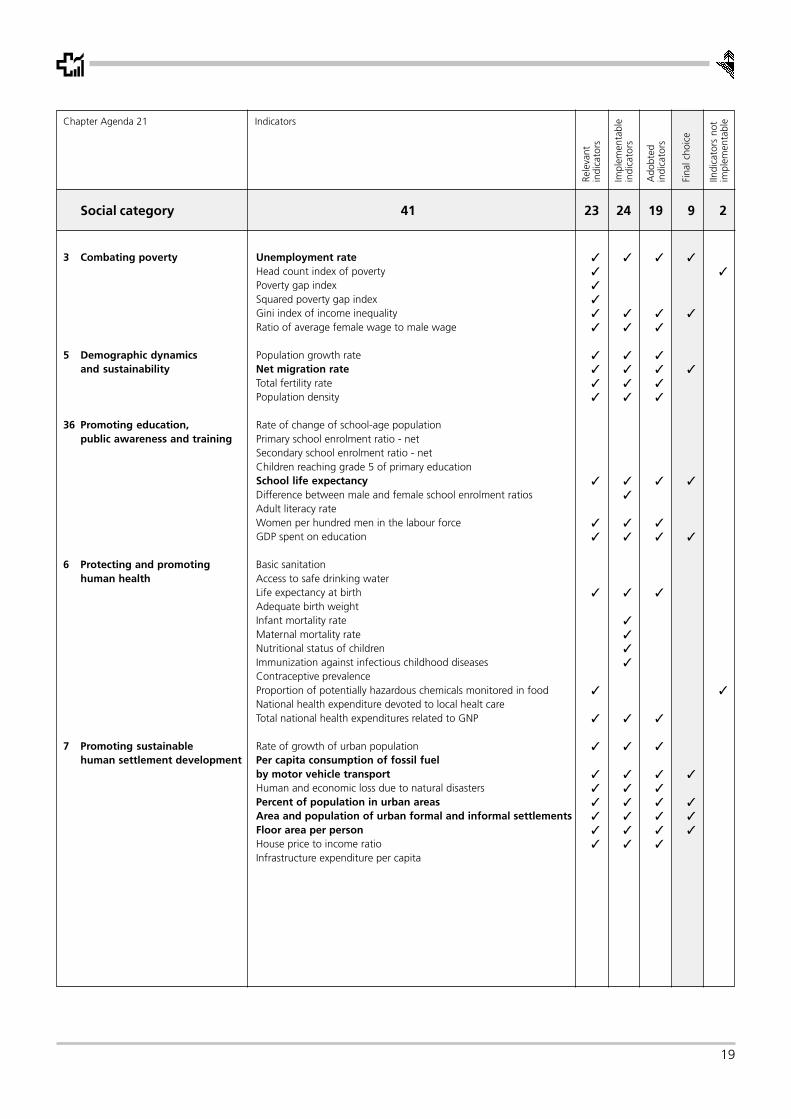
Social category 41 23 24 19 9 2
3 Combating poverty Unemployment rate ✓ ✓ ✓ ✓
Head count index of poverty ✓ ✓
Poverty gap index ✓
Squared poverty gap index ✓
Gini index of income inequality ✓ ✓ ✓ ✓
Ratio of average female wage to male wage ✓ ✓ ✓
5 Demographic dynamics Population growth rate ✓ ✓ ✓
and sustainability Net migration rate ✓ ✓ ✓ ✓
Total fertility rate ✓ ✓ ✓
Population density ✓ ✓ ✓
36 Promoting education, Rate of change of school-age populationpublic awareness and training Primary school enrolment ratio - net
Secondary school enrolment ratio - netChildren reaching grade 5 of primary educationSchool life expectancy ✓ ✓ ✓ ✓
Difference between male and female school enrolment ratios ✓
Adult literacy rateWomen per hundred men in the labour force ✓ ✓ ✓
GDP spent on education ✓ ✓ ✓ ✓
6 Protecting and promoting Basic sanitationhuman health Access to safe drinking water
Life expectancy at birth ✓ ✓ ✓
Adequate birth weightInfant mortality rate ✓
Maternal mortality rate ✓
Nutritional status of children ✓
Immunization against infectious childhood diseases ✓
Contraceptive prevalenceProportion of potentially hazardous chemicals monitored in food ✓ ✓
National health expenditure devoted to local healt careTotal national health expenditures related to GNP ✓ ✓ ✓
7 Promoting sustainable Rate of growth of urban population ✓ ✓ ✓
human settlement development Per capita consumption of fossil fuelby motor vehicle transport ✓ ✓ ✓ ✓
Human and economic loss due to natural disasters ✓ ✓ ✓
Percent of population in urban areas ✓ ✓ ✓ ✓
Area and population of urban formal and informal settlements ✓ ✓ ✓ ✓
Floor area per person ✓ ✓ ✓ ✓
House price to income ratio ✓ ✓ ✓
Infrastructure expenditure per capita

20
Chapter Agenda 21 Indicators
Rele
vant
indi
cato
rs
Impl
emen
tabl
ein
dica
tors
Ado
bted
indi
cato
rs
Fina
l cho
ice
IIndi
cato
rs n
otim
plem
enta
ble
Economic category 23 12 14 8 5 1
2 International cooperation GDP per capita ✓ ✓ ✓ ✓
Net investment share in GDP ✓ ✓ ✓
Sum of exports and imports as a percent of GDP ✓
Green GDP ✓
Share of manufactured goods in total merchandise exports ✓
4 Changing consumption patterns Annual energy consumption ✓ ✓ ✓ ✓
Share of natural resource intensive industries in value-addedProven mineral reservesProven fossil fuel energy reservesLife time of proven energy reservesShare of manufacturing value-added in GDP ✓ ✓ ✓
Share of consumption of renewable energy resources ✓ ✓ ✓ ✓
33 Financial resources Net resources transfert / GNP ✓
and mechanisms Total ODA given or received as a percentage of GNP ✓ ✓ ✓ ✓
Debt / GNP ✓ ✓ ✓ ✓
Debt service / export ✓
Amount of new or additional funding for sustainable dev. ✓
Environmental protection expenditures / GDP ✓ ✓
34 Transfer of environmentally Capital goods imports ✓
sound technology, cooperation Foreign directs investments ✓
and capacity building Share of environmentally sound capital goods imports ✓
Technical cooperation grants ✓ ✓ ✓
Environmental category 55 34 37 31 19 1
18 Protection of the quality Annual withdrawals of ground and surface water ✓
and supply of freshwater Domestic consumption of water per capita ✓ ✓ ✓ ✓
resources Groundwater reserves ✓ ✓ ✓
Concentration of faecal coliform in freshwater ✓ ✓ ✓
Biochemical oxygen demand in water bodies ✓ ✓ ✓ ✓
Waste-water treatment coverage ✓ ✓ ✓
Density of hydrological networks
17 Protection of the oceans, Population growth in coastal areasall kinds of seas Discharges of oil into coastal watersand coastal areas Release of nitrogen and phosphorus to coastal waters
Maximum sustained yield for fisheriesAlgae index ✓
10 Planing and management Land use change ✓ ✓ ✓ ✓
of land resources Changes in land condition ✓ ✓
Decentralized local-level natural resource management
12 Combating desertification Population living below poverty line in dryland areasand drought National monthly rainfall index
Satellite derived vegetation indexLand affected by desertification
21
Chapter Agenda 21 Indicators
Rele
vant
indi
cato
rs
Impl
emen
tabl
ein
dica
tors
Ado
bted
indi
cato
rs
Fina
l cho
ice
IIndi
cato
rs n
otim
plem
enta
ble
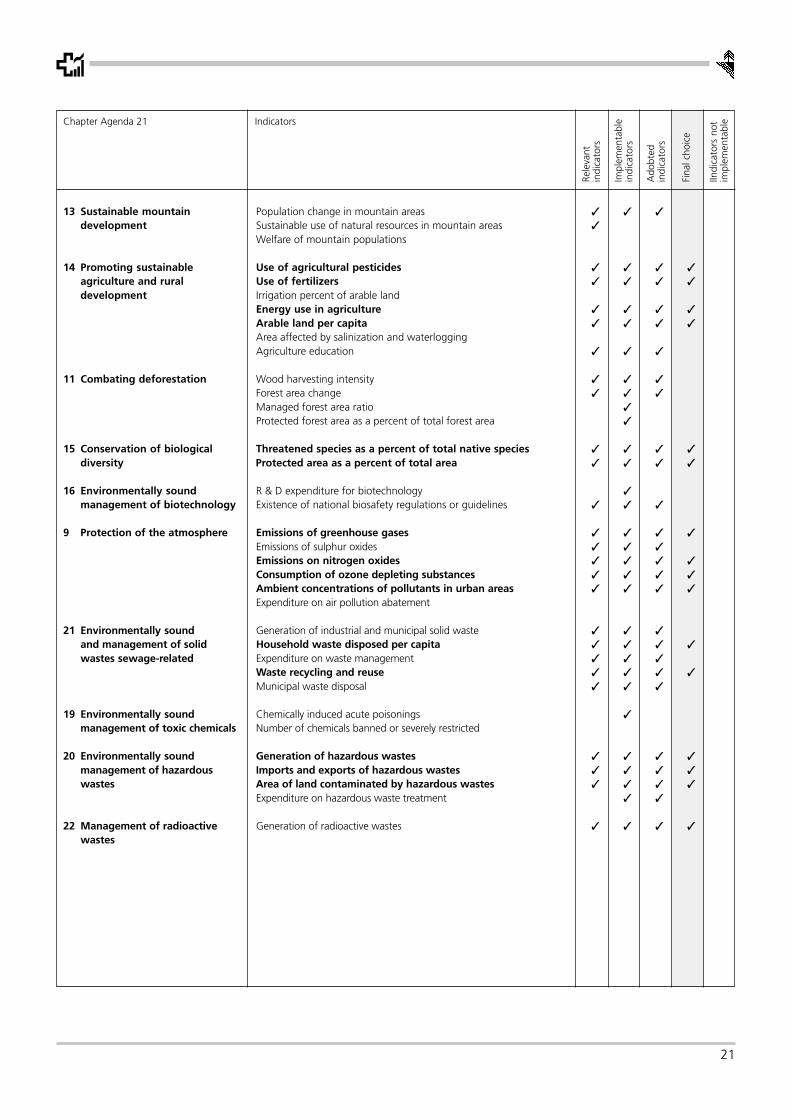
13 Sustainable mountain Population change in mountain areas ✓ ✓ ✓
development Sustainable use of natural resources in mountain areas ✓
Welfare of mountain populations
14 Promoting sustainable Use of agricultural pesticides ✓ ✓ ✓ ✓
agriculture and rural Use of fertilizers ✓ ✓ ✓ ✓
development Irrigation percent of arable landEnergy use in agriculture ✓ ✓ ✓ ✓
Arable land per capita ✓ ✓ ✓ ✓
Area affected by salinization and waterloggingAgriculture education ✓ ✓ ✓
11 Combating deforestation Wood harvesting intensity ✓ ✓ ✓
Forest area change ✓ ✓ ✓
Managed forest area ratio ✓
Protected forest area as a percent of total forest area ✓
15 Conservation of biological Threatened species as a percent of total native species ✓ ✓ ✓ ✓
diversity Protected area as a percent of total area ✓ ✓ ✓ ✓
16 Environmentally sound R & D expenditure for biotechnology ✓
management of biotechnology Existence of national biosafety regulations or guidelines ✓ ✓ ✓
9 Protection of the atmosphere Emissions of greenhouse gases ✓ ✓ ✓ ✓
Emissions of sulphur oxides ✓ ✓ ✓
Emissions on nitrogen oxides ✓ ✓ ✓ ✓
Consumption of ozone depleting substances ✓ ✓ ✓ ✓
Ambient concentrations of pollutants in urban areas ✓ ✓ ✓ ✓
Expenditure on air pollution abatement
21 Environmentally sound Generation of industrial and municipal solid waste ✓ ✓ ✓
and management of solid Household waste disposed per capita ✓ ✓ ✓ ✓
wastes sewage-related Expenditure on waste management ✓ ✓ ✓
Waste recycling and reuse ✓ ✓ ✓ ✓
Municipal waste disposal ✓ ✓ ✓
19 Environmentally sound Chemically induced acute poisonings ✓
management of toxic chemicals Number of chemicals banned or severely restricted
20 Environmentally sound Generation of hazardous wastes ✓ ✓ ✓ ✓
management of hazardous Imports and exports of hazardous wastes ✓ ✓ ✓ ✓
wastes Area of land contaminated by hazardous wastes ✓ ✓ ✓ ✓
Expenditure on hazardous waste treatment ✓ ✓
22 Management of radioactive Generation of radioactive wastes ✓ ✓ ✓ ✓
wastes

22
Summary Indicators CSD
Rele
vant
indi
cato
rs
Impl
emen
tabl
ein
dica
tors
Ado
bted
indi
cato
rs
Fina
l cho
ice
IIndi
cato
rs n
otim
plem
enta
ble
Chapter Agenda 21 Indicators
Rele
vant
indi
cato
rs
Impl
emen
tabl
ein
dica
tors
Ado
bted
indi
cato
rs
Fina
l cho
ice
IIndi
cato
rs n
otim
plem
enta
ble
Institutional category 15 6 1 1 0 0
8 Integrating environment Sustainable development strategies ✓
and development Program for integrated environmental and economic accounting ✓
in decision-making Mandated Environmental Impact AssessmentNational councils for sustainable development
35 Science for sustainable Potential scientists and engineers per million population ✓
development Scientists and engineers engaged in R & D per million populationExpenditure on research and development as a percent of GDP ✓ ✓ ✓
37 International cooperation
38 International institutionalarrangements
39 International legal instruments Ratification of global agreements ✓
and mechanisms Implementation of ratified global agreements ✓
40 Information for decision-making Main telephone lines per 100 inhabitantsAccess to informationPrograms for national environmental statistics
23 Strengthening the role Representation of major groups in national councils for SDof major Groups Ethnic minorities in national councils for sustainable development
Contribution of NGOs to sustainable development
Total 134 75 76 59 33 4

23
Annex 2Explanations about the selectionor elimination of the 59 relevant
and implementable indicators
24
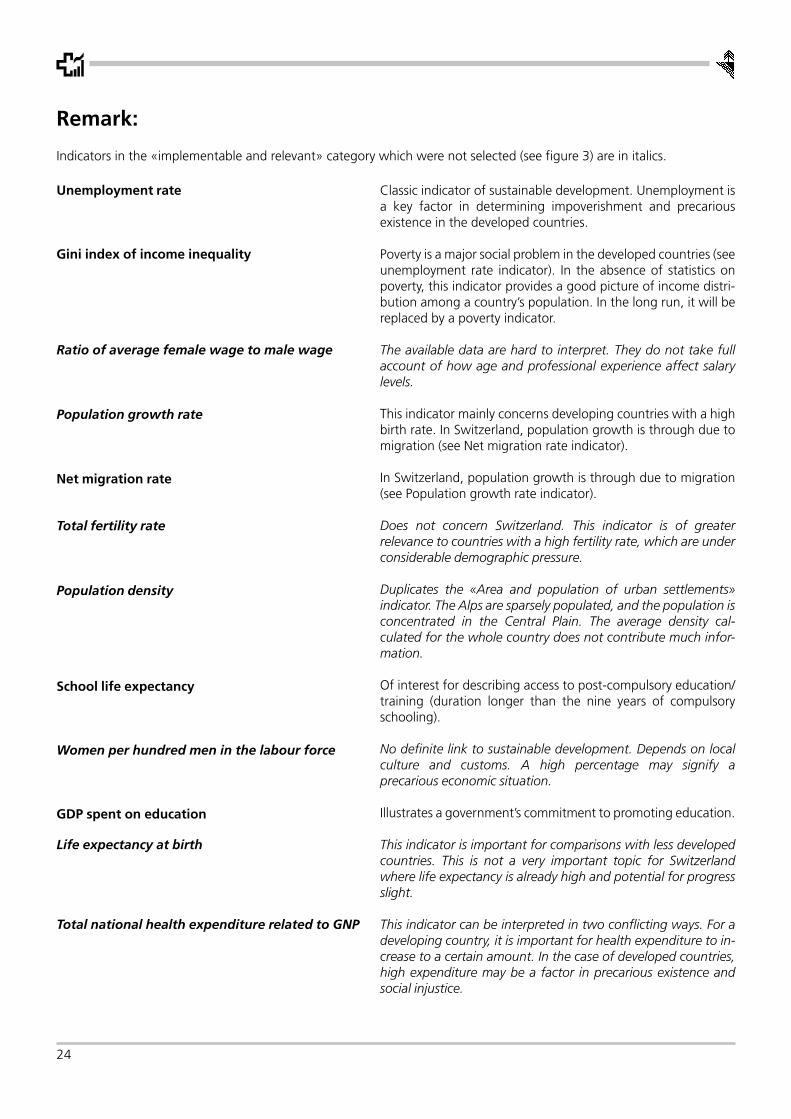
Remark:
Indicators in the «implementable and relevant» category which were not selected (see figure 3) are in italics.
Classic indicator of sustainable development. Unemployment isa key factor in determining impoverishment and precariousexistence in the developed countries.
Poverty is a major social problem in the developed countries (seeunemployment rate indicator). In the absence of statistics onpoverty, this indicator provides a good picture of income distri-bution among a country’s population. In the long run, it will bereplaced by a poverty indicator.
The available data are hard to interpret. They do not take fullaccount of how age and professional experience affect salarylevels.
This indicator mainly concerns developing countries with a highbirth rate. In Switzerland, population growth is through due tomigration (see Net migration rate indicator).
In Switzerland, population growth is through due to migration(see Population growth rate indicator).
Does not concern Switzerland. This indicator is of greaterrelevance to countries with a high fertility rate, which are underconsiderable demographic pressure.
Duplicates the «Area and population of urban settlements»indicator. The Alps are sparsely populated, and the population isconcentrated in the Central Plain. The average density cal-culated for the whole country does not contribute much infor-mation.
Of interest for describing access to post-compulsory education/training (duration longer than the nine years of compulsoryschooling).
No definite link to sustainable development. Depends on localculture and customs. A high percentage may signify aprecarious economic situation.
Illustrates a government’s commitment to promoting education.
This indicator is important for comparisons with less developedcountries. This is not a very important topic for Switzerlandwhere life expectancy is already high and potential for progressslight.
This indicator can be interpreted in two conflicting ways. For adeveloping country, it is important for health expenditure to in-crease to a certain amount. In the case of developed countries,high expenditure may be a factor in precarious existence andsocial injustice.
Unemployment rate
Gini index of income inequality
Ratio of average female wage to male wage
Population growth rate
Net migration rate
Total fertility rate
Population density
School life expectancy
Women per hundred men in the labour force
GDP spent on education
Life expectancy at birth
Total national health expenditure related to GNP

25
Duplicates the «Area and population of urban settlements» in-dicator, which also makes it possible to monitor movement ofthe urban population.
This indicator is not a social indicator a priori. It is the only indi-cator on of mobility on the CSD list and so has to be included forwant of anything better.
This topic is not important enough in the Swiss contextto feature on the list. The methodology for calculating eco-nomic data should be finalized. The link to sustainable develop-ment is doubtful.
Important for describing the problems of urban areas andagglomerations.
Important for describing the development of urban sprawl andthe resident population. Population density is important fordescribing the environmental burden it constitutes.
Could be regarded as an indicator of economic scarcity. No clearlinks with sustainable development.
The epitome of economic development indicators. Does nottake account of the «evils» of economic development in respectof to the environment or certain social aspects of society. That iswhy the CSD also advocates the use of a «green» GDP.
Account should be taken of the sustainability of investments. Asizeable investment is not necessarily a sign of sustainable de-velopment.
Important. Sizeable energy consumption is a sign of economicvitality. It is also an important source of harmful effects (pollu-tion, greenhouse gas emissions).
No clear link to sustainable development. Account should betaken of the sustainability of the industrial processes and theirconsumption of non-renewable energy resources.
Important indicator for monitoring the development of the con-sumption (and production) of renewable energy resources.
Important indicator of international solidarity. Describes acountry’s commitment to solidarity. The destination of the aid(construction, education, etc.) should be studied examined toascertain whether the aid given really actually contributes tosustainable development.
Duplicates ODA expenditure.
Use of a vital resource which could become scarce.Consumption also signifies use of energy.
Rate of growth of urban population
Per capita consumption of fossil fuelby motor vehicle transport
Human and economic lossdue to natural disasters
Percentage of population in urban areas
Area and population of urban settlements
House price to income ratio
GDP per capita
Net investment share in GDP
Annual per capita energy consumption
Share of manufacturing value-added in GDP
Share of consumption of renewableenergy resources
Total ODA given or receivedas a percentage of GNP
Technical cooperation grants
Domestic Consumption of water per capita
26
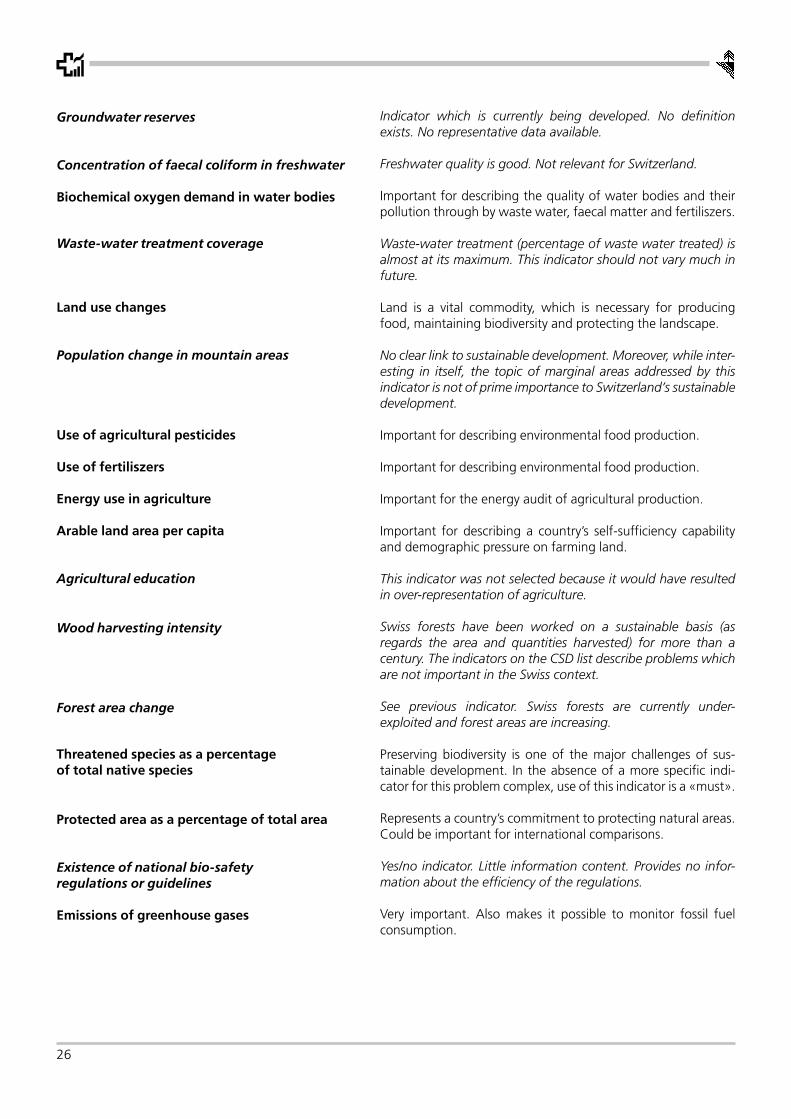
Indicator which is currently being developed. No definitionexists. No representative data available.
Freshwater quality is good. Not relevant for Switzerland.
Important for describing the quality of water bodies and theirpollution through by waste water, faecal matter and fertiliszers.
Waste-water treatment (percentage of waste water treated) isalmost at its maximum. This indicator should not vary much infuture.
Land is a vital commodity, which is necessary for producingfood, maintaining biodiversity and protecting the landscape.
No clear link to sustainable development. Moreover, while inter-esting in itself, the topic of marginal areas addressed by thisindicator is not of prime importance to Switzerland’s sustainabledevelopment.
Important for describing environmental food production.
Important for describing environmental food production.
Important for the energy audit of agricultural production.
Important for describing a country’s self-sufficiency capabilityand demographic pressure on farming land.
This indicator was not selected because it would have resultedin over-representation of agriculture.
Swiss forests have been worked on a sustainable basis (asregards the area and quantities harvested) for more than acentury. The indicators on the CSD list describe problems whichare not important in the Swiss context.
See previous indicator. Swiss forests are currently under-exploited and forest areas are increasing.
Preserving biodiversity is one of the major challenges of sus-tainable development. In the absence of a more specific indi-cator for this problem complex, use of this indicator is a «must».
Represents a country’s commitment to protecting natural areas.Could be important for international comparisons.
Yes/no indicator. Little information content. Provides no infor-mation about the efficiency of the regulations.
Very important. Also makes it possible to monitor fossil fuelconsumption.
Groundwater reserves
Concentration of faecal coliform in freshwater
Biochemical oxygen demand in water bodies
Waste-water treatment coverage
Land use changes
Population change in mountain areas
Use of agricultural pesticides
Use of fertiliszers
Energy use in agriculture
Arable land area per capita
Agricultural education
Wood harvesting intensity
Forest area change
Threatened species as a percentageof total native species
Protected area as a percentage of total area
Existence of national bio-safetyregulations or guidelines
Emissions of greenhouse gases

27
SO2 emissions are no longer an environmental problem thanksto the regulations about on the level of sulphur in diesel fuel andin heating oil. These emissions should not change. The topic isnot very important for Switzerland. Risk of over-representationof chapter 9 (Protection of the atmosphere).
Important indicator for measuring emissions caused mainly byroad transport. NOx emissions have major repercussions onhealth (summer smog, O3) as well as on biodiversity (nitrogeninput on lean meadows).
Important indicator because it concerns global, long-termproblems.
Important in the Swiss context. Considerable repercussions onhealth.
Industrial waste in Switzerland is not quantifiable. Risk of over-representation of the waste sector.
Important for sustainable use of resources and for the longevityof consumer goods. Allows monitoring of consumer behaviour.
Average importance. Ambiguous interpretation. Little dataavailable. Would lead to over-representation of the wastesector.
Important. Describes a country’s commitment to reducing theuse of resources and the pollution caused by waste.
Not important in Switzerland. In principle, all waste is disposedof properly.
Hazardous wastes are potentially dangerous for the environ-ment.
A country should be able to dispose of its own hazardouswastes.
Important for protecting the land, which is a vital asset.Contaminated land can affect drinking water and the foodchain.
Important for the risk these wastes represent for present andfuture generations.
In principle, important for describing economic developmentpotential. Does not take account of the sustainability of invest-ments and expenditure.
Emissions of sulphur oxides
Emissions of nitrogen oxides
Consumption of ozone-depleting substances
Ambient concentrations of pollutantsin urban areas
Generation of industrialand municipal solid waste
Household waste disposal per capita
Expenditure on waste management
Waste recycling and reuse
Municipal waste disposal
Generation of hazardous wastes
Imports and exports of hazardous wastes
Area of land contaminatedby hazardous wastes
Generation of radioactive wastes
R & D expenditure as a percentageof the GDP
28
Annex 3Framework for presenting sustainable
development indicators

29
Name of indicator
Official name according to UN terminology. Certainchanges have been made in order to comply with theSwiss context and terminology.
UN definition
Official definition according to the CSD manual.
Swiss definition
Definition used for calculating the indicator, which refersonly to the data used.
The indicator and sustainable development
Links between the indicator and sustainable development.Mention of the area concerned. Tie-ins with Agenda 21 orinternational agreements.
Links to Swiss federal policy
Tie-ins between the area described by the indicator andfederal policy. The following are covered (in this order):international agreements, Swiss Federal Council strategy,the Federal Constitution and the new Constitution,
federal laws and the relevant ordinances, as well asFederal Council reports, action plans and concepts. Unlessotherwise specified, references to the Constitution are tothe current Constitution which remains in effect until theend of 1999.
Links to other indicators
Number and name of other indicators included in the finalselection of 33 indicators and with a connection to theindicator in question.
Evaluation of the indicator
Evaluation of the indicator’s ability to contribute to moni-toring sustainable development or to further internationalcomparisons, irrespective of the data available. Changesto the indicator or other more appropriate indicators arementioned. The quality and availability of the data are alsodiscussed. The heading concludes with an evaluation ofthe indicator according to 4 defined classes (see section6.1). Evaluation is illustrated by a pictogram after the indi-cator title.
Evaluation of the data
Brief commentary on data movement in graphic form.
Technical information
Data production: Mention of body responsible for producing the dataSource of data: Reference to the statistics or publication from which the data is takenUnits used: Units with the standard abbreviationsAvailability of data: Beginning of time series and periodicityRegionalisation: Geographical breakdown of dataAgenda 21 chapter: Agenda 21 chapter to which the indicator refers
30
Annex 4Proposal for flagship indicators
in the field of transport

31
1 Basic situation
Transport satisfies people’s need for mobility and ensuresthe functioning of an economy that is based on the divi-sion of labour. It plays a key role in Swiss policy on sustain-able development. All negative effects of transport in eco-logical (noise, vibration, air pollution, CO2, land use, etc.),social (respiratory ailments, traffic accidents, stress,dangerous routes to school, etc.) and economic (directcosts, external costs) areas are considered harmful. But towhat extent should transport development be pursuedand what means of transport should be given prioritywithin the framework of sustainable development?Opinions diverge on these questions.
Although transport is one of the main sources of pressure(or «driving forces» according to the DF–S–R model) onthe environment, it is virtually absent from the list of UNindicators (and Eurostat indicators which are a selection ofthe UN ones). Only indicator Number 6, «Per capita con-sumption of fuel for transport» addresses a partial aspectof transport. According to the UN definition, it concernsonly the consumption of fuel in the urban environmentand is designed to illustrate living conditions in cities.
The future Swiss system of indicators will have to includeindicators about transport, namely motor vehicles, rail-ways, air transport and pipeline transportation. A list ofglobal (or key) indicators should, wherever possible, coverall important areas of sustainable development while re-maining a precise, easily comprehensible, clear and explicitmonitoring tool. Thus, in each political field and inthe main environmental sectors, the approach will beconfined to a restricted number of flagship indicators,even if this entails more comprehensive indicator systemsfor mastering certain specific fields. A set of 22 indicators1)
was developed within the framework of National Re-search Programme 41 to permit more precise analyses inthe field of transport; a set of 31 indicators2) was createdfor the same purpose by the European EnvironmentAgency.
Below, two possible variants for supplementing the lists ofglobal indicators are set out – one comprising seven indi-cators, the other two. The choice between the twovariants will depend on the maximum number of variantsto be used as well as on the reliability and availability ofdata about transport.
2 Variant with 7 indicators
The following seven indicators are intended to report onmovements in transport and on the main effects of trans-port on the environment:
1 Persons-km and tonnes-km: passenger traffic ismeasured in persons-kilometre, and goods traffic intonnes-kilometre (per year or per capita and per year).This indicator does not take into account vehicleweight, empty trips and load limits.
2 Consumption of energy for transport (in terajoules (TJ)per capita and per year).
3 Greenhouse gas emissions generated by transport:CO2, N2O and CH4 emissions converted into CO2-equivalent tonnes per capita and per year.
4 NOx emissions caused by transport (in tonnes per capitaand per year).
5 Changes in land use for transport purposes: annualpercentage increase in area devoted to transport, ab-solute value of the area devoted to transport in km2 orpercentage of the area devoted to transport in terms ofthe total area dedicated to settlements and infrastruc-ture.
6 Breathable airborne suspended particulates (PM10)caused by transport: it has yet to be checked whetherthe necessary data are available.
7 Excessive noise caused by transport: percentage ofthe population exposed to sound levels in excess of60 dB(A) in their homes (emission level for inhabitedareas during the day in accordance with the NoiseAbatement Ordinance). However, there is no noise gridfor the whole of Switzerland based on a geographicalinformation system (GIS).
Points 2, 3 and 4 could be incorporated into pilot studyindicator No 11 «Annual per capita energy consumption»,No 24 «Emissions of greenhouse gases» and No 25 «Emis-sions of nitrogen oxides» by subdividing the corres-ponding graphs by sector of activity (transport, industry/crafts/services and households/agriculture). This wouldenable identification of the source for these three forms ofenvironmental pressure. The incorporation of additionalforms of information into these graphs would, however,make them less clear and harder to read, thus defeatingthe purpose of the exercise. Moreover, this would increase
1) Cf. Ernst Basler: Measuring the Sustainability of Transport, NRP 41 «Transport and Environment», Project C5, Berne 19982) European Environment Agency: Proposed transport/environment reporting mechanism for the EU, Copenhagen, April 1998
32
the heterogeneousness of the indicator system; themajority of indicators would then be represented by asingle curve while others (like those mentioned above)would be subdivided into several curves.
3 Variant with 2 indicators
In line with the basic idea of sustainable development,which consists of satisfying growing needs withoutworsening the state of the environment (and even im-proving it), the UN uses an indicator of volume and anindicator of eco-efficiency in certain areas. The size of thepopulation, the Gross Domestic Product (GDP) and thesurface area are indicators of volume. The indicators ofeco-efficiency, which are defined in terms of indicators ofvolume, are per capita energy consumption, per capitawater consumption, the volume of per capita householdwaste, the volume of hazardous wastes in terms of theGDP and the quantity of fertilisers per hectare of arableland. This approach, which is also suitable for the socialarea (e.g. floor area per person), allows comparisonsbetween countries which differ as regards economic de-velopment, population and surface area. In principle, itwould be possible to construct an indicator system madeup of a small number of indicators of volume supple-mented by a set of indicators of efficiency.
This approach can be adopted for transport: the negativeimpact of mobility does not depend solely on the volumeof transport but also on the level of technological develop-ment of the vehicles. If technology progresses, mobilitycan be increased without worsening the condition of theenvironment. Thus a sustainable development policy canaffect one or the other of the two variables: reduction ofmobility or reduction of the specific impact on the environ-ment.
If vehicle technology does not change, the pressure on theenvironment depends mainly on the total mass trans-ported3) (passengers, goods and vehicles themselves), dis-tances covered and distribution over several vehicles. Thisapplies, for instance, to noise, energy consumption, CO2
emissions and air pollution. Consequently, the total masstransported multiplied by the number of kilometrescovered can be used as an indicator of volume for pas-senger and goods transport. We will call this value «mass-kilometre».
Transport volume is usually expressed in persons-kilometreand in tonnes-kilometre, but these units have major draw-backs for appraising sustainable development:
• A vehicle can transport varying numbers of passengers.Four people having to make a certain journey may
use a single vehicle or four different ones. In both cases,the number of persons-kilometre will be the samebut the sum of the negative effects (CO2, air pollution,accidents, noise, stress) will be different. The «mass-kilometre» variable makes it possible to accurately re-port the effect of collective transport.
• The tare weight of a vehicle used to transport a certainnumber of passengers or goods varies. This weight hasan impact on (affects) the environment but is not in-cluded in the persons-kilometre or tonnes-kilometreunits of measurement. The «mass-kilometre» unitmakes it possible to avoid this snag.
• Although they affect the environment, empty trips arenot counted in the persons-kilometre or tonnes-kilometre units of measurement but they are countedin the «mass-kilometre» unit.
• There is no plausible aggregation method for persons-kilometre and tonnes-kilometre. In contrast, the addi-tion of transport of passengers and goods expressed inmass-kilometres raises no problems.
The eco-efficiency indicator must reflect the pressures onthe environment exerted by satisfying mobility require-ments. A value which makes it possible to reflect a maxi-mum number of ecological pressures is energy consump-tion. The link is obvious for CO2, while for airborne pol-lutants, the technological level of the vehicles (engines,catalytic converters and filters) has to be consideredalongside fuel consumption. In contrast, energy consump-tion provides no indication of landscape deterioration,breaking up of habitats, accidents, stress and other harm-ful effects of mobility. Nor does it give any input aboutnoise, which is not, from the sustainability viewpoint, asimportant as the other nuisances because it does notaffect future generations. In accordance with the principleof flagship indicators, simplifications must therefore beaccepted and sectoral indicator systems must be used tomonitor a specific area or policy.
If specific energy consumption is linked to the number ofmass-kilometres, we can measure efficiency expressed injoules per mass-kilometre (J/t-km). Only an efficiency indi-cator calculated in this way is consistent with the volumeindicator proposed. By multiplying the two indicatorstogether it is easy to obtain transport energy consumptionin absolute terms.
This approach necessitates further developments, espe-cially as regards calculating the weight of vehicles andempty trips. The extent to which other countries take thetotal mass of vehicles into consideration and the impor-tance of international comparisons in this area would alsohave to be examined.
3) The word mass is used here in the sense described here, not as in physics.
33
Annex 5Economic indicators (proposals)
34
Environmental Management System (EMS)
UN definition
Does not exist.
Swiss definition
Number of ISO 14001 certified companies and number ofpeople employed in these companies.
The indicator and sustainable development
An EMS certificate indicates the presence of an efficientsystem for managing all ecological problems and risks, atboth the decision-making and operational levels of acompany. Depending on the economic and technologicalcriteria as well, an EMS makes it possible to ascertainappropriate measures for the ongoing improvement of acompany’s environmental performance that far exceedthe legal requirements. Responding to the basic principlesof sustainable development, an EMS can play a centralrole in balancing ecological and economic interests (searchfor eco-efficiency) at the micro-economic level. The ISO14001 standard is recognised worldwide. It was de-veloped by industry itself, is applied on a voluntary basisand can be adapted to companies of all types and sizes. Inparticular, an ISO 14001-compliant EMS must draw upcompany organisation, procedures, responsibilities andways and means for organising the environmental policiesand objectives set by the company itself.
Link to Swiss federal policy
Under the strategy for sustainable development inSwitzerland, the Swiss Federal Council aims to encourageEMS implementation. To this end, the Confederationmust, for instance, reinforce procurement directives so asto promote environmentally friendly products andservices, and hence, suppliers that have introduced EMS.Moreover, article 43a of the Environmental Protection Actgives the Federal Council powers to lay down regulations
about EMS introduction if necessary, naturally takingaccount of existing international standards such asISO 14001.
Evaluation of the indicator
This indicator makes it possible to evaluate the degree ofuse of a management tool which encourages ecological,sustainable corporate management. However, the mereexistence of an ISO 14001-certified EMS does not make itpossible to affirm that one company manufactures in amore environment-friendly fashion than another. An EMSguarantees both environmental awareness throughoutthe company and the establishment of procedures andmeasures that permit the identification, surveillance andminimising of its impact on the environment.
Adding up all staff employed by these companies gives anindication of their relative economic weights. In thefuture, this indicator can be further refined, for instancethrough data per branch. It would also be interesting toknow how many ISO 14001-certified companies publishtheir environmental performance and objectives. Dataabout the number of employees is taken from the 1995Federal Business Census, and some of them have beenupdated as part of another survey. Jobs in companiescreated after 1995 were not surveyed. Thus, the datagiven here do not fully reflect the actual situation.
Evaluation of the data
Since the definitive launch of the ISO 14001 standard in1996 (a provisional version was already available in 1995),there has been steady, rapid growth in the number ofISO 14001 certificates. More than 330 Swiss companieshad been awarded certificates by the end of 1998. Inconjunction with the more than 6000 Swiss companiesthat have ISO 9000 (quality management) certificates,there is tremendous growth potential through thesynergies created by ISO 9000 and ISO 14001, as wellas the cost-benefit ratio connected with obtaining theISO 14001 certificate.

35
Data production: Institute for Economics and Ecology, University of St. Gallen (IWÖ–HSG)Source of data: Certification bodiesUnits used: Number of companies and number of jobsAvailability of data: Annual, since 1995Regionalisation: NUTS III (Canton)Agenda 21 chapter: Chapter 30 Strengthening the role of economy and industry
� � � � � � � � � � � � � � � �
�
� � � � �
� � � � �
� � � �
� � � �
� � � � �
� � � � �
� � � � �
�
� �
� � �
� � �
� � �
� � �
� �
� �� � � � �
� � � � � � � � � � � � � � � � � � � � � � � � � � � � � � � � � � � � � � � � � � � � � � � � � � � � � � � � � � � � � � � � � � � � � � �
�� ��������� ������
� � � � � � � � � � � � � � � � � � � � � � � � � � � � � �
� � � � � � � � � � � � � � � � � � � � � � � � � � � �
�� �����������
36
Ethical, social or environmental investments
Definition
Does not exist.
Swiss definition
Total assets (in millions of CHF) of main investment media(funds, banks, holding companies, etc.) that take explicitaccount of ecological, ethical or social criteria.
The indicator and sustainable development
Financial resources are indispensable for achieving sus-tainable development and Agenda 21 makes explicit men-tion of the need for financial follow-up. The movement ofthese assets indicates the extent to which financial circlesinclude sustainable development criteria in their business.From this point of view, it seems expedient to take actionat the very source of any economic activity by trying toinfluence the flow of investment funds according toecological and social criteria.
Link to Swiss federal policy
In its strategy for sustainable development in Switzerland,the Federal Council affirms the need to act according tothe laws of the market, in this case the capital market, andto use them for sustainable development. Seen from thisangle, information also plays an essential role. In fact, weare witnessing the advent of new financial products suchas «eco funds», «sustainable funds», «alternative banks»or «green venture capital». Clear, transparent informationabout these new products should enable a potential in-vestor to opt for «green» or «sustainable» investments. At
present, there are no government or private labelsstipulating minimum requirements for the ecological,ethical or social character of these new financial products.
Evaluation of the indicator
This indicator lists all investment funds, banks and othercompanies or institutions in Switzerland, which offeroptions for investments that comply with the principles ofsustainable development. On this basis, the total assets ofthese «green» or «sustainable» investments can beestimated.
However, one question remains unanswered: at whatpoint can it be acknowledged that investments explicitlyand selectively (for instance through strict exclusioncriteria) meet the principles and conditions of sustainabledevelopment.
Neither the proportion of these investment funds fromabroad nor the share invested abroad is known. Thus, in aglobal financial market, it is difficult to establish un-ambiguous links between these «alternative» funds andthe development of sustainability in Switzerland.
Evaluation of the data
Over the past five years, there has been a steady increasein the number of «alternative» financial products on themarket. The amounts given are an estimate of the cumu-lative assets of investment funds and other companies orinstitutions that offer the possibility of ethical or ecologicalinvestments in Switzerland. These assets – estimated at1.3 billion CHF – remain marginal compared with some600 billions CHF, the total approximate assets available inSwitzerland in public pension schemes and investmentfunds.
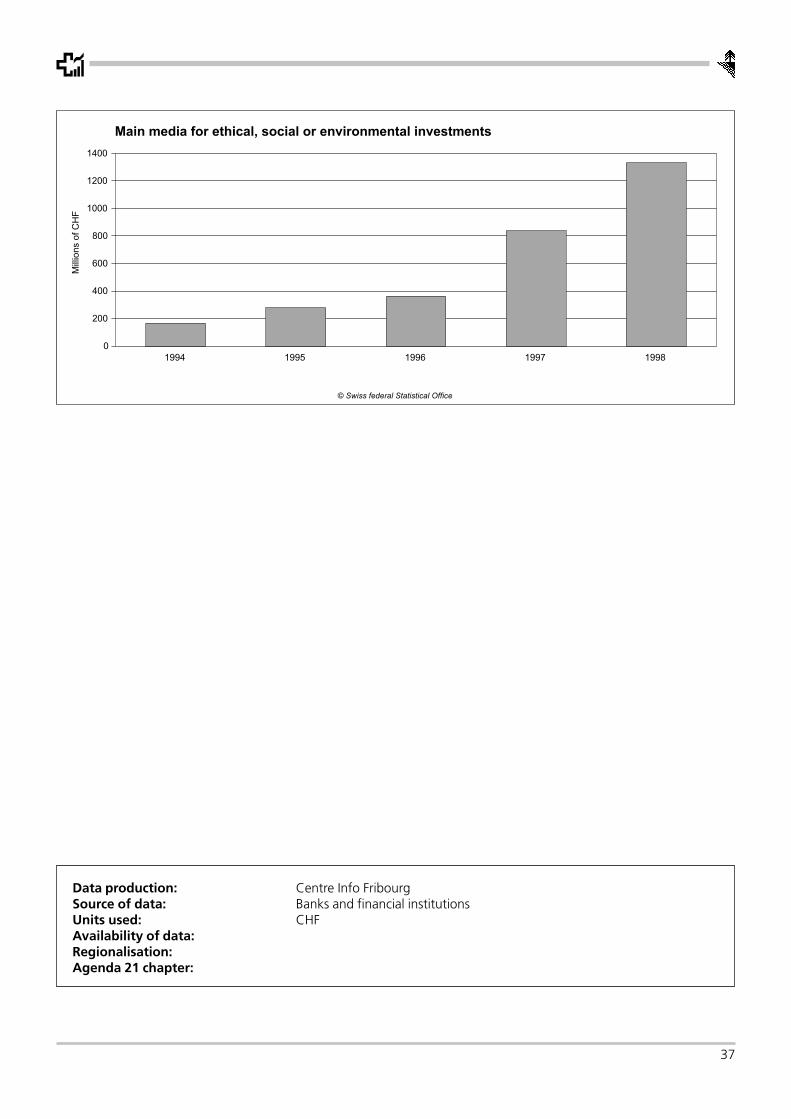
37
Data production: Centre Info FribourgSource of data: Banks and financial institutionsUnits used: CHFAvailability of data:Regionalisation:Agenda 21 chapter:
� � � � � � � � � � � � � � � � � � �
�
� � �
� �
� � �
� � �
� � � �
� � � �
� � �
� � � � � � � � � � � � � � � � � � � � � � � � � � � � � � � � � � � � � � � � � � � � � � �
���������������
� � � � � � � � � � � � � � � � � � � � � � � � � � � �
SFSO publications
As the Swiss Government's central statistics service, the Swiss Federal Statistical Office's mandate is to make statistical data available to awide range of users.
The statistical information is distributed according to subject matter (see inside cover page), using different media:
Distribution medium Call Distribution medium Call
Individual information 0041 (0)32 713 60 11
The SFSO on the Internet http://www.statistik.admin.ch
Press releases to inform the 0041 (0)32 713 60 11public about the latest findings
On-line databank 0041 (0)32 713 60 86
Publications with in-depth information 0041 (0)32 713 60 60(sometimes on diskette also)
More detailed information about the various distribution media is given in the List of Publications, which is updated every two years.To receive your free copy, see on the internet or call 0041 (0)32 713 60 60.
Geography and EnvironmentAdditional publications:
The Environment in Switzerland 1997, facts, figures, perspectives (SAEFL and SFSO eds.)Price SFr. 28.–, Order through: Swiss Federal Printing and SuppliesOffice (EDMZ), CH-Bern,Order number: German: 319.404d, French: 319.404f, Italian: 319.404i, English: 319.404eng
Information about environment statistics:
SFSO, Environment Unit, Phone: 0041 (0)32 713 62 53, Fax: 0041 (0)32 713 65 46E-Mail: [email protected]
ISBN 3-303-02054-X
In the revised Federal Constitution of 18 April 1999, Switzerland declares sustainabledevelopment as the guideline for the social, economic, and ecological future. To measurethe success of sustainable policy a suitable monitoring instrument is necessary, as e.g. aset of representative indicators.
In this publication 33 indicators are presented and evaluated. They come from thesystem of indicators of the United Commission on Sustainable Development.
The pilot study is a first step towards an efficient and capable of development systemof indicators. It will describe sustainable development in Switzerland and enable inter-national comparisons.