Embed Size (px)
Citation preview
How green is your city?
Sustainable Cities 2021:
SUSTAINABLE CITIES 2O21
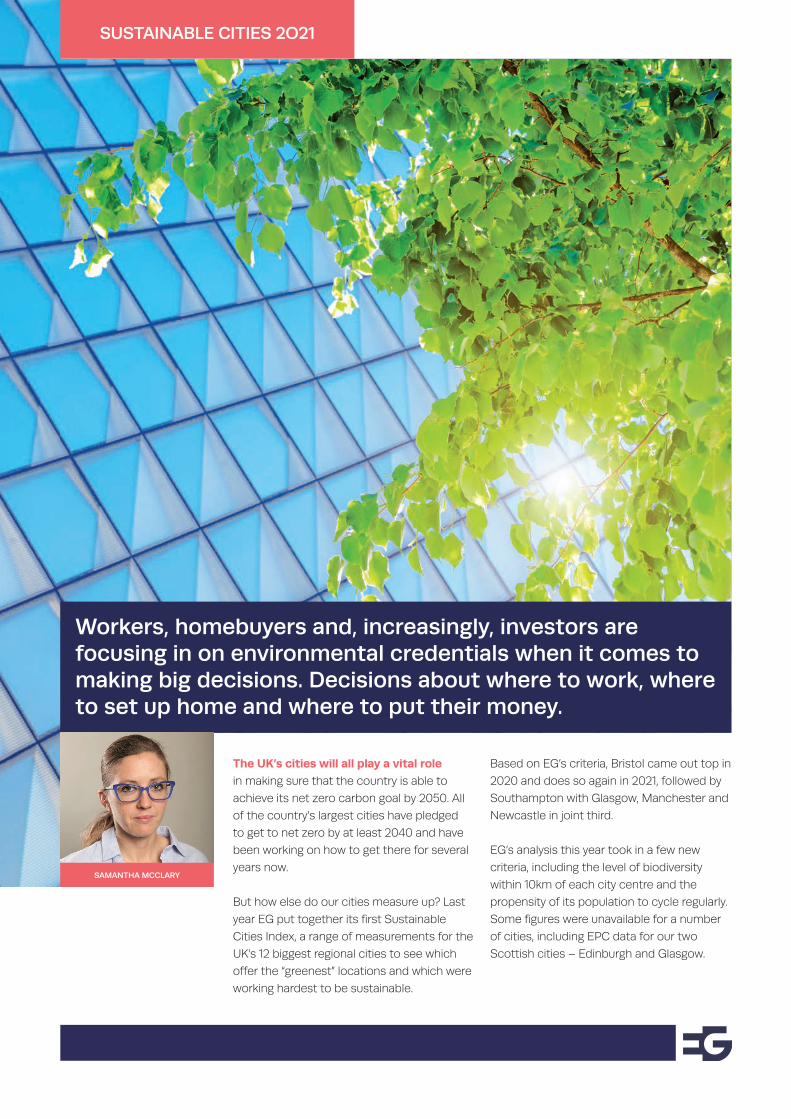
The UK’s cities will all play a vital role
in making sure that the country is able to
achieve its net zero carbon goal by 2050. All
of the country’s largest cities have pledged
to get to net zero by at least 2040 and have
been working on how to get there for several
years now.
But how else do our cities measure up? Last
year EG put together its first Sustainable
Cities Index, a range of measurements for the
UK’s 12 biggest regional cities to see which
offer the “greenest” locations and which were
working hardest to be sustainable.
Based on EG’s criteria, Bristol came out top in
2020 and does so again in 2021, followed by
Southampton with Glasgow, Manchester and
Newcastle in joint third.
EG’s analysis this year took in a few new
criteria, including the level of biodiversity
within 10km of each city centre and the
propensity of its population to cycle regularly.
Some figures were unavailable for a number
of cities, including EPC data for our two
Scottish cities – Edinburgh and Glasgow.
Workers, homebuyers and, increasingly, investors are focusing in on environmental credentials when it comes to making big decisions. Decisions about where to work, where to set up home and where to put their money.
SAMANTHA MCCLARY
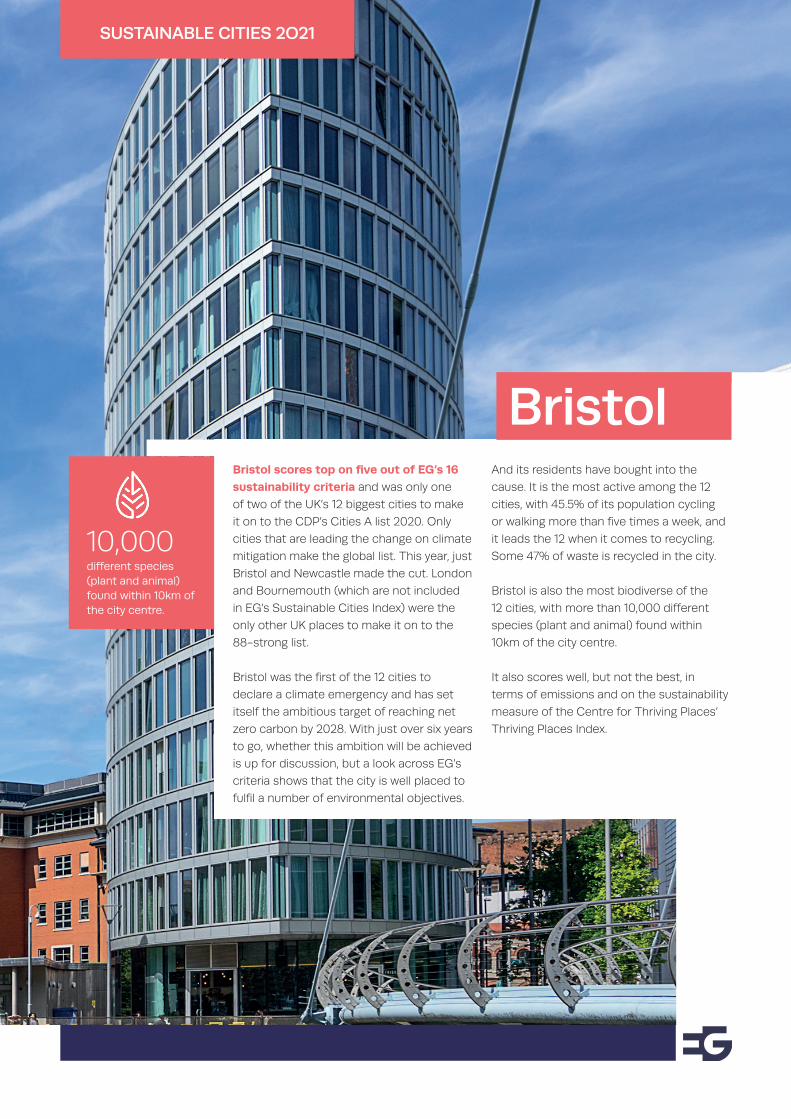
Bristol
SUSTAINABLE CITIES 2O21
Bristol scores top on five out of EG’s 16 sustainability criteria and was only one
of two of the UK’s 12 biggest cities to make
it on to the CDP’s Cities A list 2020. Only
cities that are leading the change on climate
mitigation make the global list. This year, just
Bristol and Newcastle made the cut. London
and Bournemouth (which are not included
in EG’s Sustainable Cities Index) were the
only other UK places to make it on to the
88-strong list.
Bristol was the first of the 12 cities to
declare a climate emergency and has set
itself the ambitious target of reaching net
zero carbon by 2028. With just over six years
to go, whether this ambition will be achieved
is up for discussion, but a look across EG’s
criteria shows that the city is well placed to
fulfil a number of environmental objectives.
And its residents have bought into the
cause. It is the most active among the 12
cities, with 45.5% of its population cycling
or walking more than five times a week, and
it leads the 12 when it comes to recycling.
Some 47% of waste is recycled in the city.
Bristol is also the most biodiverse of the
12 cities, with more than 10,000 different
species (plant and animal) found within
10km of the city centre.
It also scores well, but not the best, in
terms of emissions and on the sustainability
measure of the Centre for Thriving Places’
Thriving Places Index.
different species (plant and animal) found within 10km of the city centre.
10,000
SUSTAINABLE CITIES 2O21
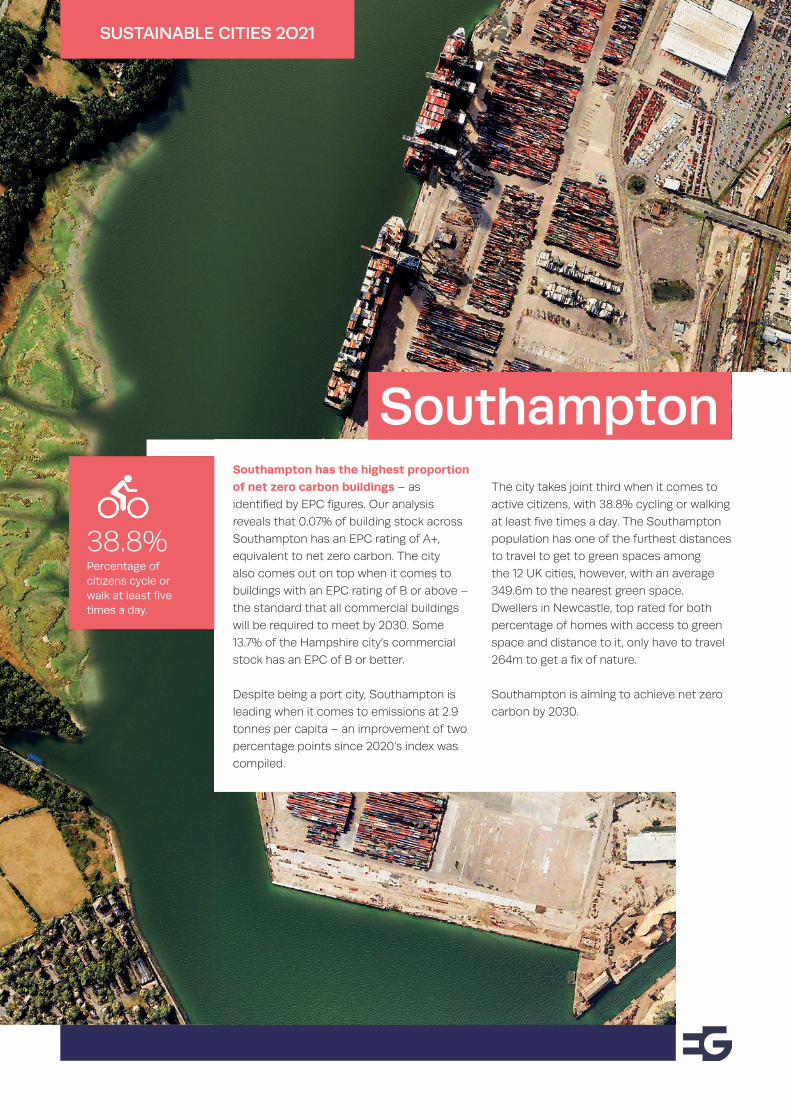
Southampton has the highest proportion of net zero carbon buildings – as
identified by EPC figures. Our analysis
reveals that 0.07% of building stock across
Southampton has an EPC rating of A+,
equivalent to net zero carbon. The city
also comes out on top when it comes to
buildings with an EPC rating of B or above –
the standard that all commercial buildings
will be required to meet by 2030. Some
13.7% of the Hampshire city’s commercial
stock has an EPC of B or better.
Despite being a port city, Southampton is
leading when it comes to emissions at 2.9
tonnes per capita – an improvement of two
percentage points since 2020’s index was
compiled.
The city takes joint third when it comes to
active citizens, with 38.8% cycling or walking
at least five times a day. The Southampton
population has one of the furthest distances
to travel to get to green spaces among
the 12 UK cities, however, with an average
349.6m to the nearest green space.
Dwellers in Newcastle, top rated for both
percentage of homes with access to green
space and distance to it, only have to travel
264m to get a fix of nature.
Southampton is aiming to achieve net zero
carbon by 2030.
Percentage of citizens cycle or walk at least five times a day.
38.8%
Southampton
SUSTAINABLE CITIES 2O21
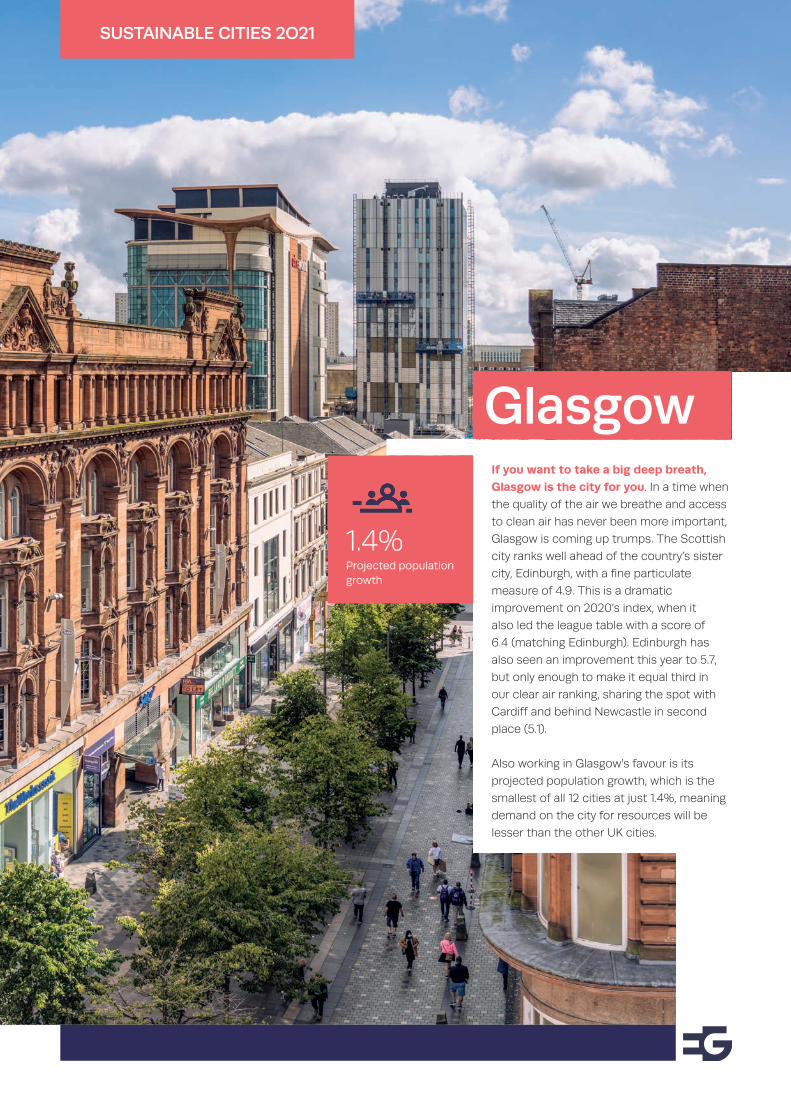
If you want to take a big deep breath, Glasgow is the city for you. In a time when
the quality of the air we breathe and access
to clean air has never been more important,
Glasgow is coming up trumps. The Scottish
city ranks well ahead of the country’s sister
city, Edinburgh, with a fine particulate
measure of 4.9. This is a dramatic
improvement on 2020’s index, when it
also led the league table with a score of
6.4 (matching Edinburgh). Edinburgh has
also seen an improvement this year to 5.7,
but only enough to make it equal third in
our clear air ranking, sharing the spot with
Cardiff and behind Newcastle in second
place (5.1).
Also working in Glasgow’s favour is its
projected population growth, which is the
smallest of all 12 cities at just 1.4%, meaning
demand on the city for resources will be
lesser than the other UK cities.
Projected population growth
1.4%
Glasgow
Manchester
SUSTAINABLE CITIES 2O21
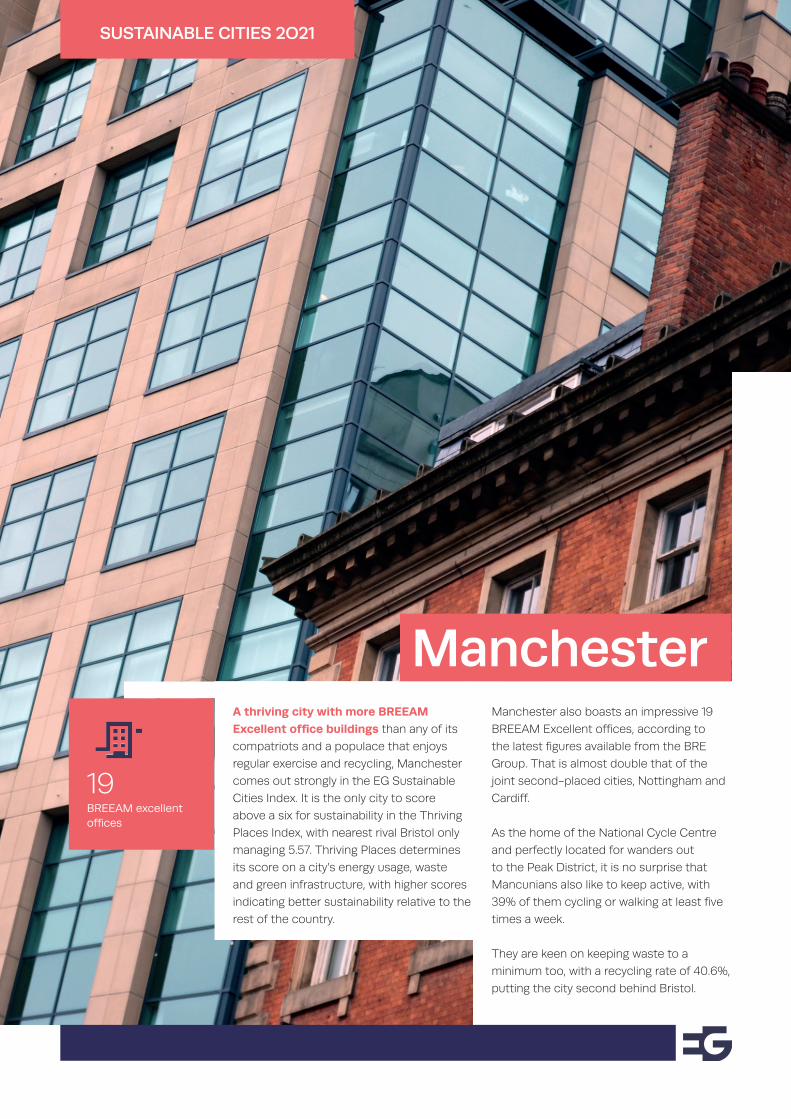
A thriving city with more BREEAM Excellent office buildings than any of its
compatriots and a populace that enjoys
regular exercise and recycling, Manchester
comes out strongly in the EG Sustainable
Cities Index. It is the only city to score
above a six for sustainability in the Thriving
Places Index, with nearest rival Bristol only
managing 5.57. Thriving Places determines
its score on a city’s energy usage, waste
and green infrastructure, with higher scores
indicating better sustainability relative to the
rest of the country.
BREEAM excellent offices
19
Manchester also boasts an impressive 19
BREEAM Excellent offices, according to
the latest figures available from the BRE
Group. That is almost double that of the
joint second-placed cities, Nottingham and
Cardiff.
As the home of the National Cycle Centre
and perfectly located for wanders out
to the Peak District, it is no surprise that
Mancunians also like to keep active, with
39% of them cycling or walking at least five
times a week.
They are keen on keeping waste to a
minimum too, with a recycling rate of 40.6%,
putting the city second behind Bristol.
Newcastle
SUSTAINABLE CITIES 2O21
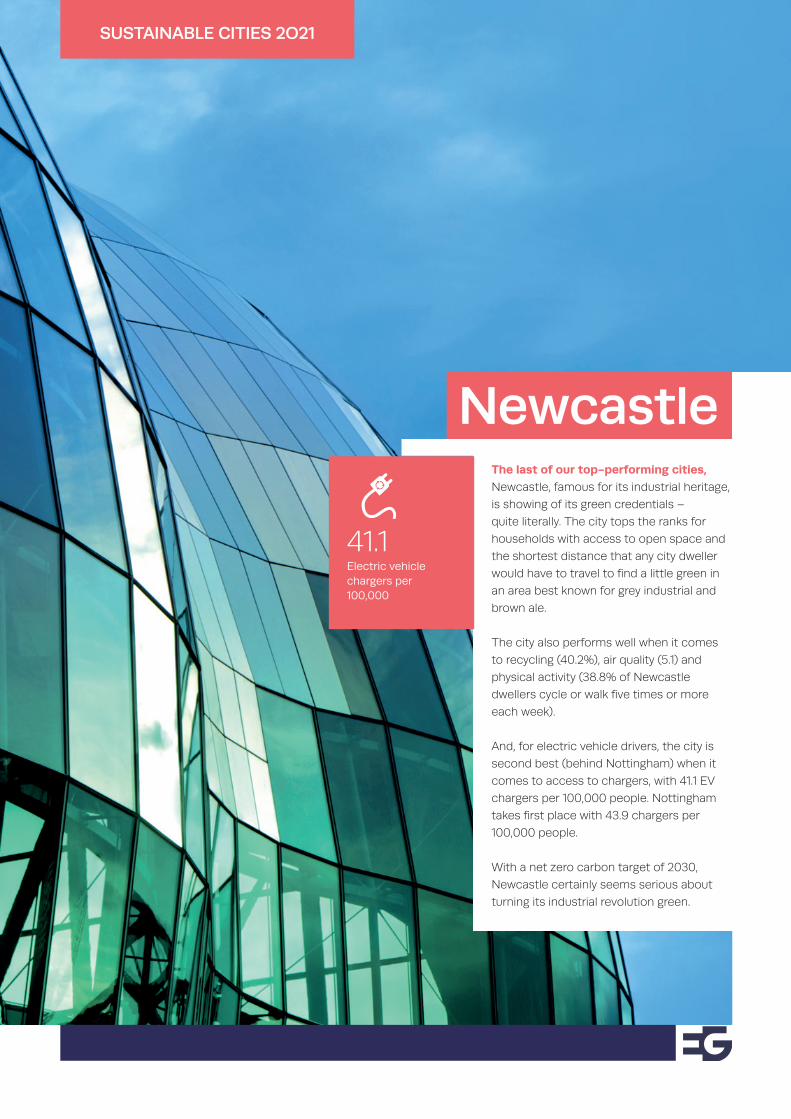
Electric vehicle chargers per 100,000
41.1
The last of our top-performing cities, Newcastle, famous for its industrial heritage,
is showing of its green credentials –
quite literally. The city tops the ranks for
households with access to open space and
the shortest distance that any city dweller
would have to travel to find a little green in
an area best known for grey industrial and
brown ale.
The city also performs well when it comes
to recycling (40.2%), air quality (5.1) and
physical activity (38.8% of Newcastle
dwellers cycle or walk five times or more
each week).
And, for electric vehicle drivers, the city is
second best (behind Nottingham) when it
comes to access to chargers, with 41.1 EV
chargers per 100,000 people. Nottingham
takes first place with 43.9 chargers per
100,000 people.
With a net zero carbon target of 2030,
Newcastle certainly seems serious about
turning its industrial revolution green.
The others
SUSTAINABLE CITIES 2O21
While every UK city is trying to do its bit in the fight against climate change, Birmingham, Cardiff, Edinburgh, Liverpool
and Sheffield all failed to come out on top
on any of the criteria for EG’s index this year.
In 2020, Cardiffians were champion
recyclers; this year they were at the bottom
of the pile. Last year, Edinburgh led the way
with Glasgow on air quality; this year it has
slipped to joint third with Cardiff.
Sheffield and Birmingham languished
towards the bottom of the index in 2020
and don’t seem to have been able to move
the dial significantly during the past 12 to
18 months. Both have big plans in place.
Birmingham’s Future City Plan seeks to re-
green the city, while Sheffield is on a mission
to become known as the UK’s outdoor city.
The clock is ticking, with less than two
decades for each of the UK’s 12 big cities
to deliver on their promises. The time for
plans is over. The time for action is now.
Use EG Radius to access properties with a lease end date within these sustainable cities to start your development opportunity search.
With over 80,000* live availabilities and over 100,000* deals recorded with an expiry date, EG Radius provides you with an extensive list of open prospects to build your lead list.
*Source: EG Radius June 2021 FIND OUT MORE
SUSTAINABLE CITIES 2O21
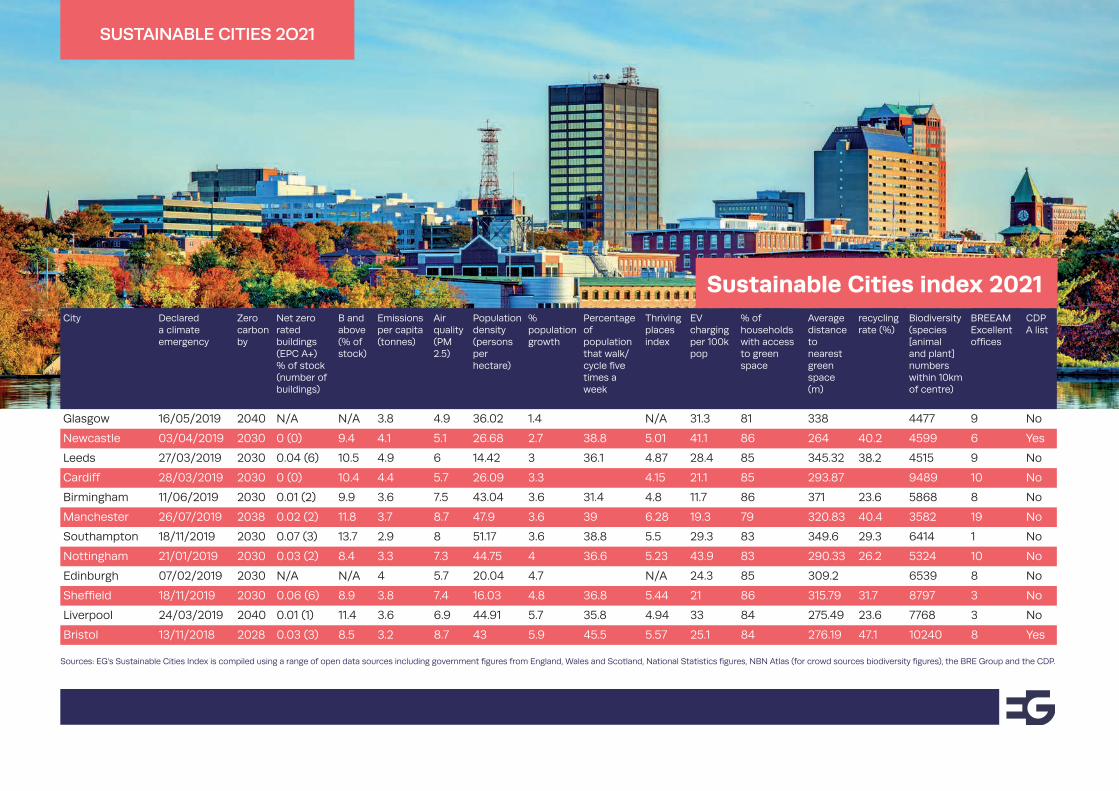
City Declared a climate emergency
Zero carbon by
Net zero rated buildings (EPC A+) % of stock (number of buildings)
B and above (% of stock)
Emissions per capita (tonnes)
Air quality (PM 2.5)
Population density (persons per hectare)
% population growth
Percentage of population that walk/cycle five times a week
Thriving places index
EV charging per 100k pop
% of households with access to green space
Average distance to nearest green space (m)
recycling rate (%)
Biodiversity (species [animal and plant] numbers within 10km of centre)
BREEAM Excellent offices
CDP A list
Glasgow 16/05/2019 2040 N/A N/A 3.8 4.9 36.02 1.4 N/A 31.3 81 338 4477 9 No
Newcastle 03/04/2019 2030 0 (0) 9.4 4.1 5.1 26.68 2.7 38.8 5.01 41.1 86 264 40.2 4599 6 Yes
Leeds 27/03/2019 2030 0.04 (6) 10.5 4.9 6 14.42 3 36.1 4.87 28.4 85 345.32 38.2 4515 9 No
Cardiff 28/03/2019 2030 0 (0) 10.4 4.4 5.7 26.09 3.3 4.15 21.1 85 293.87 9489 10 No
Birmingham 11/06/2019 2030 0.01 (2) 9.9 3.6 7.5 43.04 3.6 31.4 4.8 11.7 86 371 23.6 5868 8 No
Manchester 26/07/2019 2038 0.02 (2) 11.8 3.7 8.7 47.9 3.6 39 6.28 19.3 79 320.83 40.4 3582 19 No
Southampton 18/11/2019 2030 0.07 (3) 13.7 2.9 8 51.17 3.6 38.8 5.5 29.3 83 349.6 29.3 6414 1 No
Nottingham 21/01/2019 2030 0.03 (2) 8.4 3.3 7.3 44.75 4 36.6 5.23 43.9 83 290.33 26.2 5324 10 No
Edinburgh 07/02/2019 2030 N/A N/A 4 5.7 20.04 4.7 N/A 24.3 85 309.2 6539 8 No
Sheffield 18/11/2019 2030 0.06 (6) 8.9 3.8 7.4 16.03 4.8 36.8 5.44 21 86 315.79 31.7 8797 3 No
Liverpool 24/03/2019 2040 0.01 (1) 11.4 3.6 6.9 44.91 5.7 35.8 4.94 33 84 275.49 23.6 7768 3 No
Bristol 13/11/2018 2028 0.03 (3) 8.5 3.2 8.7 43 5.9 45.5 5.57 25.1 84 276.19 47.1 10240 8 Yes
Sustainable Cities index 2021
Sources: EG’s Sustainable Cities Index is compiled using a range of open data sources including government figures from England, Wales and Scotland, National Statistics figures, NBN Atlas (for crowd sources biodiversity figures), the BRE Group and the CDP.