Embed Size (px)
Citation preview

Sustainable Green Cities
CAIRO HOUSE
El Khayala Road, El Fostat,
Cairo, Egypt
07 – 11 February 2016

Let me introduce myself
• Laa atakallamu 'l-`arabiyya.
• My background & activities (It.Ministry for Env. – Municipality ofRome).
• This workshop as an opportunity forme to learn.
Aim of the meeting
• Identify international guidelines for greensustainable cities.
• Identify criteria for green sustainable cities.
• Evaluate the pilot project "Rehabilitation of the ElSheik Zayed city as sustainable green city".
• Identify environmental, social and economic returnsfrom the Sustainable Cities.
• Disseminate the principle of sustainable cities.

1° DaySunday, 7 February 2016
Identifying international guidelines for green sustainable cities.
Identifying environmental, social and economic returns from the
Sustainable Cities.
Defining green and sustainable cities: policies and tools
1st Question
There is no uniform definition of what constitutes a city, given the diversity of urban realities around
the world.
Every country defines cities according to its own criteria.

2nd Question
There are a lot of terms containing –city or cities.
Part if these terms are non well or clearly or uniquely defined.
3rd Question
There are a lot of keywords (ENV/EC/S) to reconnect with these terms.
Climate Change Mitigation/Adaptation (ENV/EC/S ?)
Biodiversity (ENV/EC/S ?)
Energy (ENV/EC/S ?)
Water (ENV/EC/S ?)
Food (ENV/EC/S ?)
Ecosystem Service (ENV/EC/S ?)
Mobility (ENV/EC/S ?)
Sustainable Events (ENV/EC/S ?)
Tourism (ENV/EC/S ?)

Terms including –city or cities
Sustainable Cities
Towards an environmentally,socially, and economically habitatfor existing population
Low-carbon Cities (a mitigated city?)
EcoMobile Cities (is it in Low-carbonCities?!?)
Biodiverse cities
A more specific aspect forenvironment?
Resource-efficient and ProductiveCities
A more specific aspect foreconomy? (food, water,..)

Smart Cities
More technological?!?
Resilient City
?!?!?!
Green Cities
This term is an integration of theothers?!?!?!

Policies (P) and/or Tools (T)
Sustainable Local Economy (P a/o T)
Urban Governance (P a/o T)
Sustainable City-Region Cooperation(P a/o T)
Sussidiarity Principle (P a/o T)
Sustainable Economy and Procurement (P a/o T)
Sustainability Management (P a/o T)
Sustainable / Green Procurement (P a/o T)
Sustainable / Green Public Procurement (P a/o T)

2° DayMonday, 8 February 2016
Identifying criteria for green sustainable cities

2° DayMonday, 8 February 2016
PSR and DPSIR: tools to analyse the processes involved in green and
sustainable cities.
Beyond GDP: a different point of view to understand the cities.

The Pressure-State-Response Framework
The OECD PSR framework statesthat human activities exert pressures (suchas pollution emissions or land use changes)on the environment, which can inducechanges in the state of theenvironment (for example, changes inambient pollutant levels, habitat diversity,water flows, etc.).
Society then responds to changes inpressures or state with environmental andeconomic policies and programs intendedto prevent, reduce or mitigate pressuresand / or environmental damage.
Indicators can be powerful tools to helpidentify and support PSR relationships.
The Pressure-State-Response Framework

The Pressure-State-Response Framework
Driving forces, such as industry andtransport, producePressures on the environment, such aspolluting emissions, which then degradetheState of the environment, which then……………………………………………………….
Driving Force-Pressure-State-Impact-Response Framework
…………………………………….Impacts on human health and eco-systems,causing society toRespond with various policy measures,such as regulations, information and taxes,which can be directed at any other part ofthe system.
Driving Force-Pressure-State-Impact-Response Framework

Driving Force-Pressure-State-Impact-Response Framework

GDP growth figures do not providesufficient information about social andenvironmental outcomesTop-level indicators on environmentalprotection and quality-of-life indicatorsare being developed
Beyond GDP
For policy-making and public debate,complementary environmental andsocial indicators need to be available atthe same time as GDPThe timeliness of such indicators needsto be improved
Beyond GDP

GDP per capita and its growth over time does nottell how economic benefits are shared within asociety.To enable a debate on equity and fairness, it isnecessary to know the distribution of income,health, education and environmental quality.Such data are being further developed and bettercommunicated
Beyond GDP

GDP growth rates do not indicatewhether economic development issustainable.Tools are being developed to bettermeasure and communicate overallsustainability
Beyond GDP

The central reason why traditional macro-indicators such as GDP or NDP4 do notmeasure environmental or social outcomesis that national accounts do not cover suchissues.This is being addressed by enlarging thescope of accounting to environmental andsocial issues
Beyond GDP

…. But is this debate new?Too much and too long, we seem to havesurrendered community excellence andcommunity values in the mere accumulation ofmaterial things. Our gross national product … ifwe should judge America by that – counts airpollution and cigarette advertising, andambulances to clear our highways of carnage. Itcounts special locks for our doors and the jails forthose who break them.(…)
Beyond GDP

Yet the gross national product does not allowfor the health of our children, the quality oftheir education, or the joy of their play. It doesnot include the beauty of our poetry or thestrength of our marriages; the intelligence ofour public debate or the integrity of our publicofficials. It measures neither our wit nor ourcourage; neither our wisdom nor our learning;neither our compassion nor our devotion toour country
Beyond GDP

it measures everything, in short,except that which makes lifeworthwhile. And it tells us everythingabout America except why we areproud that we are Americans.
Beyond GDP

Beyond GDP

2° DayMonday, 8 February 2016
Environmental and Architecture indicators to evaluate existing cities
as green sustainable cities
Indicators
An indicator quantifies and simplifiesphenomena and helps us understandcomplex realities. An indicator tellsus something about changes in asystem.
Indicators
Indicators are selected to provideinformation about the functioning ofa specific system, for a specificpurpose - to support decision makingand management.

Indicators
An indicator quantifies and aggregatesdata that can be measured andmonitored to determine whether changeis taking place. But in order tounderstand the process of change, theindicator needs to help decision makersunderstand why change is taking place.

Financial Indicators describe changes inthe state of individual, local or nationaleconomies; there are Poverty Indicatorsand Health Indicators, andEnvironmental and SustainableDevelopment Indicators.
Whether an indicator is useful or not isvery much dependent on a particularcontext.
Indicators

Indicators
The rate of soil loss is an importantindicator of environmental stability in theNorth American prairies, but is probablyless important or even possibly unhelpfulif used north of the arctic circle.
Indicators
A careful selection process is needed todetermine which indicators may berelevant in a given context. Similarly,indicators need to be used appropriatelyin assessment.

Performance evaluation
Indicators help evaluate performanceif a basis for comparison is clearlyidentified, for example when a targetis specified in policy processes
Thresholds
Thresholds are unique and prehaps themost important basis of assessment. Ingeneral, crossing a clearly definedsustainability threshold should send anobvious message to policy-makers and tosociety in general

Causal Loops
Indicators are important to supportclaims for causality, such as the linksbetween pressures andenvironmental conditions
Model construction and Scenario analysis
Indicators provide real data andsupport field testing of models andpossible future scenarios.

Several important points to bear in mind
- Without good data, based onmonitoring, it is not possible todevelop indicators- Performance measures imply thattargets need to be set (i.e. somethingagainst which performance can becompared)

Several important points to bear in mind
- Different people living in differentplaces have different values.- Indicators must therefore be able totake into account different locations,people, cultures and institutions- Sets of indicators evolve over time

Several important points to bear in mind
- Sets of indicators are seldom, if ever,complete- Measurement of indicators tends to reduceuncertainty, but does not eliminate it- Indicators can play an important part in theway in which human influences on theenvironment operate. Changing theindicators will most likely also change thesystem
Urban Indicators Guidelines
UN-HABITAT has adopted a holistic approachby integrating the Habitat Agenda indicatorsin the overall MDG framework. The HabitatAgenda indicators comprise of 20 keyindicators, 8 check-lists and 16 extensiveindicators which measure performances andtrends in selected key areas of the HabitatAgenda

3° DayTuesday, 9 February 2016
A case study: climate change mitigation (and adaptation?)

3° DayTuesday, 9 February 2016
09:30 - 12:00
How to calculate carbon footprint of cities and other human settlements?

Footprint
A measure of how much area of biologicallyproductive land and water an individual, populationor activity requires to produce all the resources itconsumes and to absorb the waste it generates,using prevailing technology and resourcemanagement practices.The Ecological Footprint is usually measured inglobal hectares. Because trade is global, anindividual or country's Footprint includes land or seafrom all over the world. Without furtherspecification, Ecological Footprint generally refers tothe Ecological Footprint of consumption.

Footprint
Biologically productive land and water - The landand water (both marine and inland waters) areathat supports significant photosynthetic activityand the accumulation of biomass used byhumans. Non-productive areas as well asmarginal areas with patchy vegetation are notincluded. Biomass that is not of use to humans isalso not included. The total biologicallyproductive area on land and water in 2011 wasapproximately 12 billion hectares.

Global Footprint
Today humanity uses the equivalent of 1.6planets to provide the resources we use andabsorb our waste.
Moderate UN scenarios suggest that if currentpopulation and consumption trends continue, bythe 2030s, we will need the equivalent of twoEarths to support us.
Turning resources into waste faster than wastecan be turned back into resources puts us inglobal ecological overshoot.

Global Footprint
Footprint for Nations
Global Footprint Network publishes National FootprintAccounts for more than 200 countries. National Reviewsare excellent ways to help improve the National FootprintAccounts and create opportunities for Ecological Footprintpolicy applications at the national level.
The European Commission has found the Footprint to be auseful indicator for assessing progress made toward theE.U.’s sustainability goals. The Footprint is unique amongthe indicators for its ability to relate resource use to theconcept of carrying capacity. Also the Footprint as an“intuitively appealing indicator”, easy to communicate andunderstand.

Footprint for Nations
The graph tracks the per-person Ecological Footprint andbiocapacity. Both are measured in global hectares.
Biocapacity per person varies each year with ecosystemmanagement, agricultural practices, ecosystemdegradation, and weather, and population size.
Footprint per person varies with consumption amountsand production efficiency.
While most input data for the Footprint accounts comefrom UN statistical sources, the quality of country resultsvaries. The quality of the assessment is scored on a 1-6scale.

Footprint for Nations - Egypt

Footprint for Nations - Italy

Footprint for Nations
Human Development Index and Ecological Footprint of Nations

Footprint for Cities
Ecological Footprint accounts allow governmentsto track a city or region’s demand on naturalcapital, and to compare this demand with theamount of natural capital actually available.The accounts also give governments the ability toanswer more specific questions about thedistribution of these demands within theireconomy. In other words, Ecological FootprintAccounting gives policy makers information abouttheir region’s resource metabolism.
Personal Footprint
How much land area does it take to support yourlifestyle? Complete our online personal Footprintcalculator to find out your Ecological Footprint,discover your biggest areas of resourceconsumption and learn what you can do to treadmore lightly on the earth.
Personal Footprint

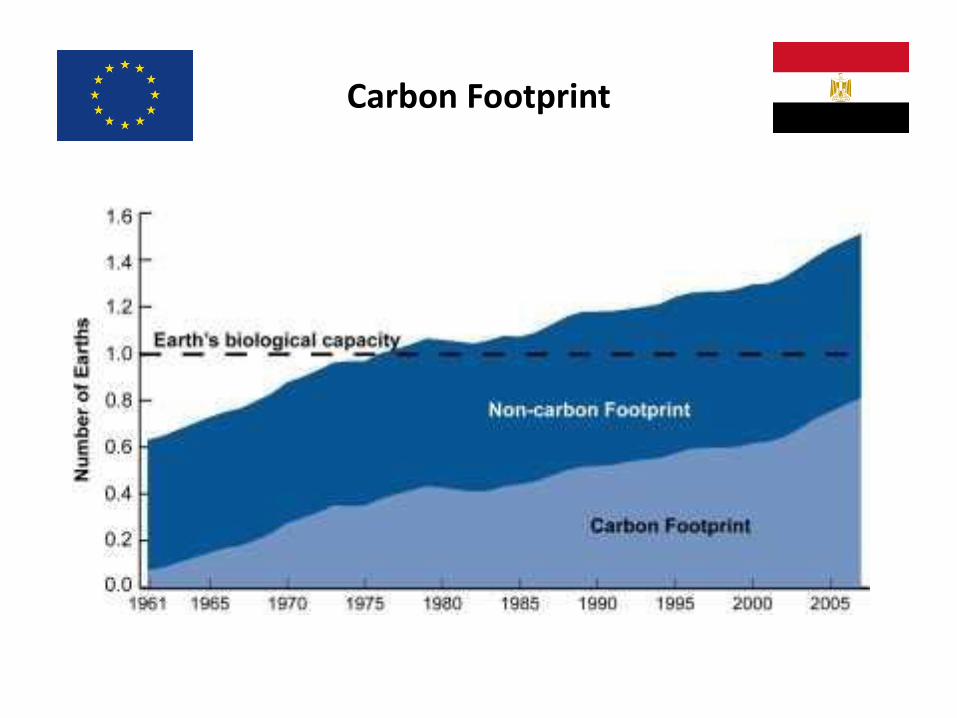
Carbon Footprint
Today, the term “carbon footprint” is often usedas shorthand for the amount of carbon beingemitted by an activity or organization.The carbon component of the EcologicalFootprint takes a slightly differing approach,translating the amount of carbon dioxide into theamount of productive land and sea area requiredto sequester carbon dioxide emissions.

Carbon Footprint
The Ecological Footprint shows us how carbonemissions compare and interact with otherelements of human demand, the quantity ofliving resources required to make the goods weconsume, and the amount of land we take out ofproduction when we pave it over to build citiesand roads.

Carbon Footprint
The carbon Footprint is 54 percent of humanity’soverall Ecological Footprint and its most rapidlygrowing component.Humanity’s carbon Footprint has increased 11-fold since 1961. Reducing humanity’s carbonFootprint is the most essential step we can taketo end overshoot and live within the means ofour planet.
Carbon Footprint
Footprint Standards
The value of the Footprint as a trusted sustainabilitymetric depends not only on the scientific integrity ofthe methodology, but also on consistent andtransparent presentation of results across analyses.It also depends on communicating results ofanalyses in a manner that does not distort ormisrepresent findings.
Global Footprint Network initiated a consensus,committee-based process for the development ofstandards governing Footprint applications, and foran ongoing scientific review of the methodology.

3° DayTuesday, 9 February 2016
13:00 - 15:00
How to reduce greenhouse gas emissions and carbon footprint of existing cities to become green sustainable cities through
MRV (Meausrement, Reporting & Verification)?
Introduction
A Sustainable Energy Action Plan (SEAP) is the keydocument in which the City outlines how it intendsto reach its CO2 reduction target. It defines theactivities and measures set up to achieve thetargets, together with time frames and assignedresponsibilities.
The SEAP document defines the concrete actions,responsibilities and timing to achieve the localauthority’s long-term energy consumption and CO2emissions reduction targets for their geographicalarea.

Introduction
To develop an effective Sustainable EnergyAction Plan (SEAP), the process has fourphases:
• initiation,
• planning,
• implementation,
• monitoring and reporting.
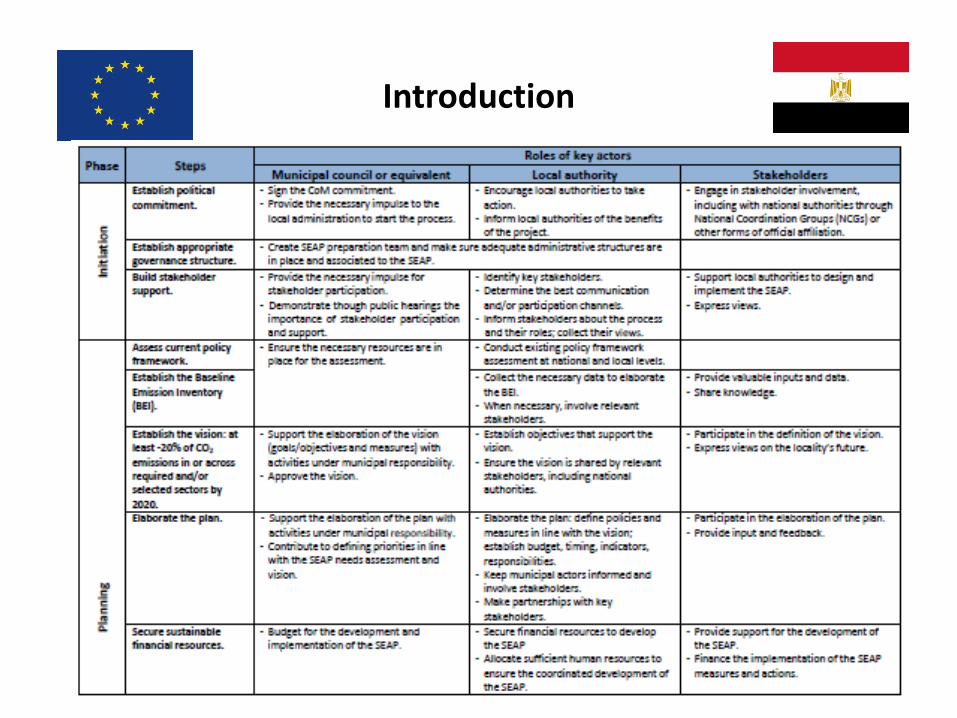
Introduction

Initiation
Establish political commitment.
Establish appropriate governancestructure.
Build stakeholder support.
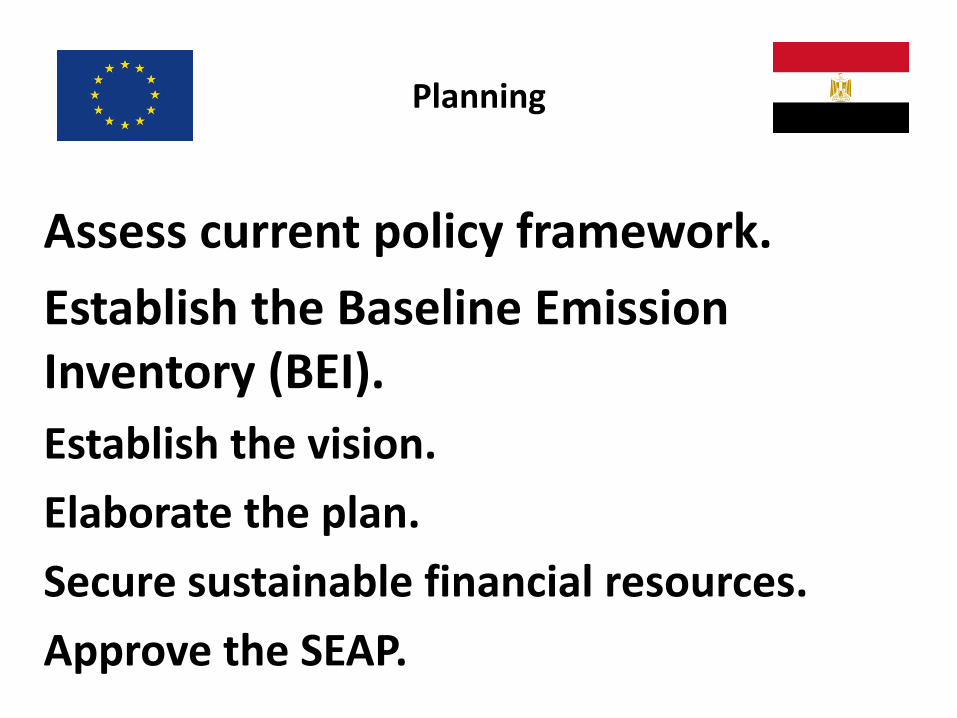
Planning
Assess current policy framework.
Establish the Baseline EmissionInventory (BEI).
Establish the vision.
Elaborate the plan.
Secure sustainable financial resources.
Approve the SEAP.

Implementation
Implement the SEAP.
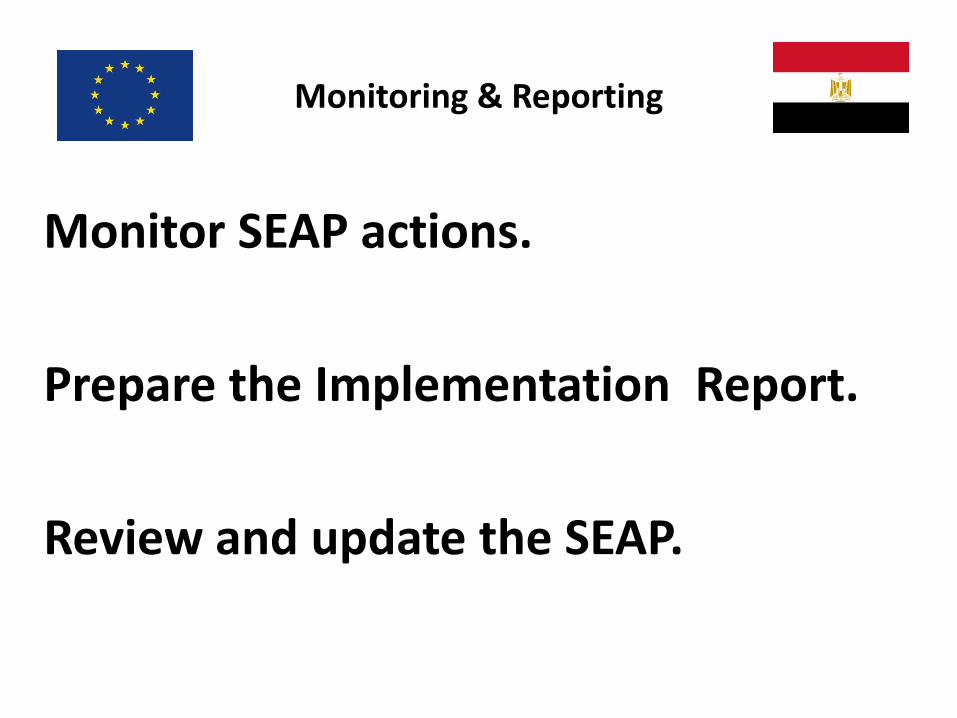
Monitoring & Reporting
Monitor SEAP actions.
Prepare the Implementation Report.
Review and update the SEAP.

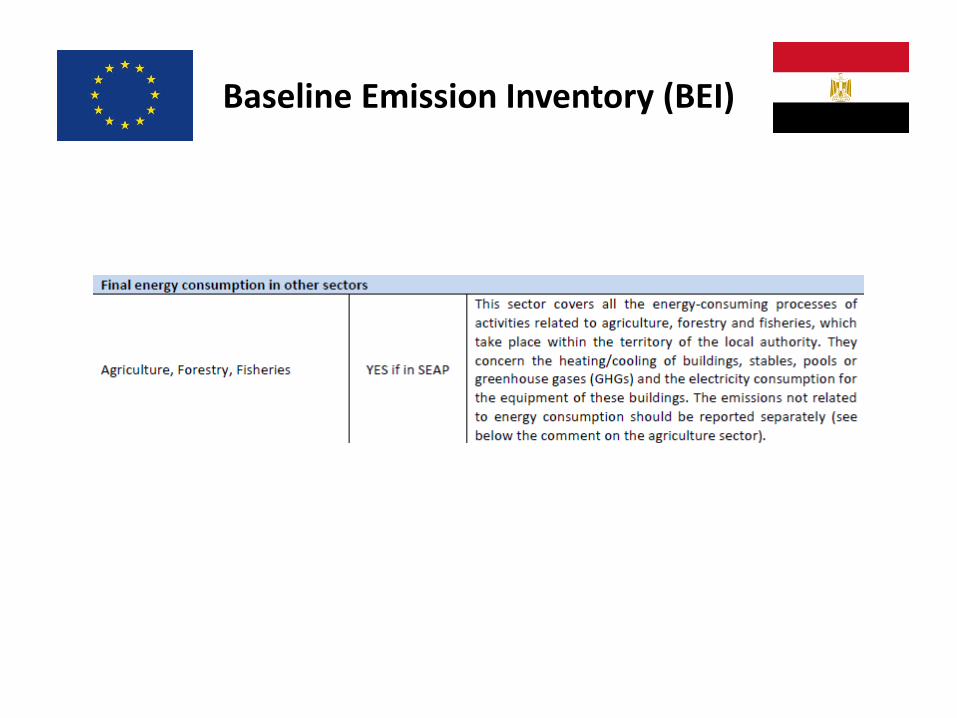
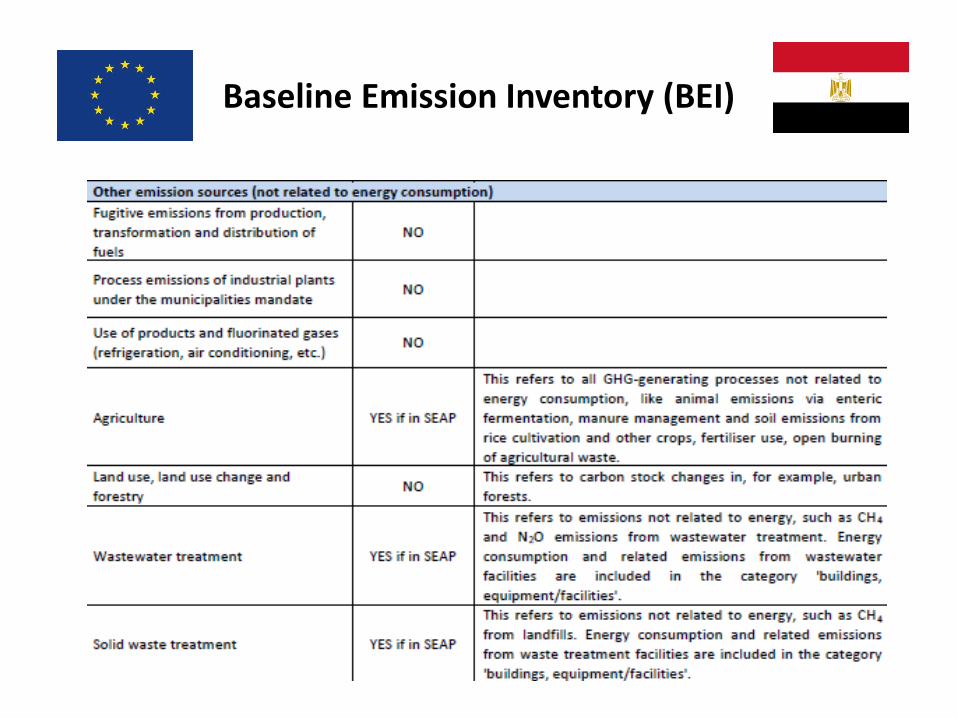
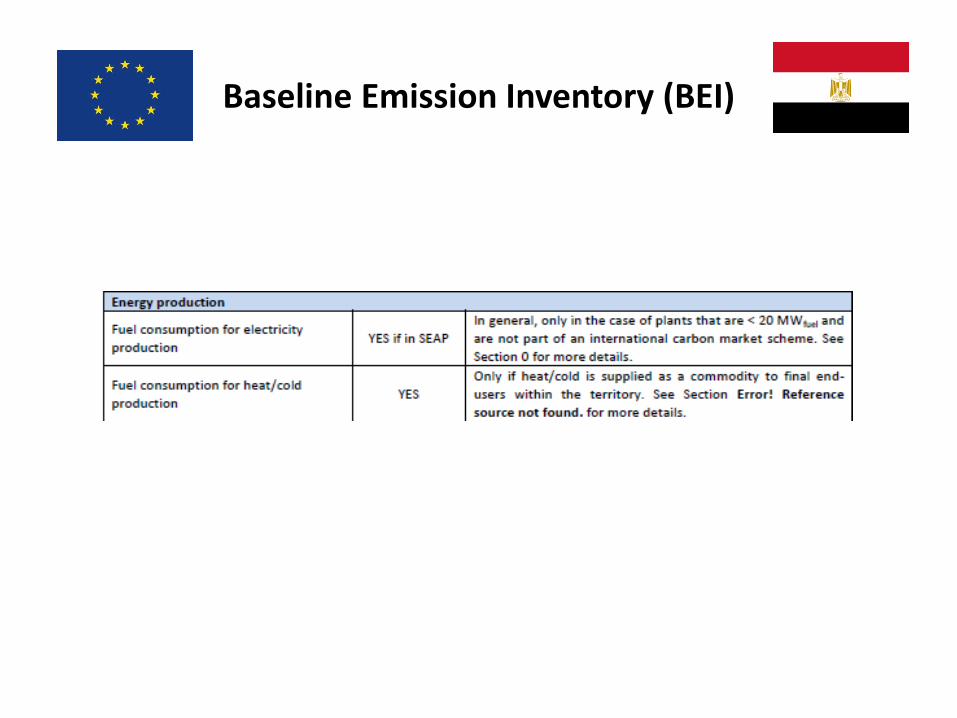
Baseline Emission Inventory (BEI)
The Baseline Emissions Inventory (BEI)quantifies the amount of carbon dioxide(CO2) emitted due to energy consumptionin the territory of the local authority in thebaseline year. It allows for identification ofthe principal anthropogenic sources of CO2emissions and to prioritize the reductionmeasures accordingly.

Baseline Emission Inventory (BEI)
The inventory will be the instrument allowing thelocal authority to measure the impact of its actionsrelated to climate change.The BEI allows for provision of a reference base yearfrom which changes in emissions and in particularreductions will be monitored in view of achievingthe local authority's objective of CO2 reduction.Emission inventories are very important elements tomaintain the motivation of all parties willing tocontribute to the local authority's CO2 reductionsobjective, allowing them to see the results of theirefforts.

Baseline Emission Inventory (BEI)
Baseline year. Baseline year is the year against which theachievements of the emissions reductions shall becompared.Activity Data. Activity data quantifies the human activitytaking place in the territory of the local authority.Emission factors. Emission factors are coefficients thatquantify the emission per unit of activity.Business-as-usual scenario. The BAU reference scenario isdefined as a continuation of the current trend of economicgrowthCO2 emission target.

Baseline Emission Inventory (BEI)

Baseline Emission Inventory (BEI)
Baseline Emission Inventory (BEI)
Baseline Emission Inventory (BEI)
Baseline Emission Inventory (BEI)
Baseline Emission Inventory (BEI)
Thank you for your attention