Embed Size (px)
Citation preview

A
Sustainable BrazilHousing market potential
SUSTAINABLE BRAZIL HOUSING MARKET POTENTIALA
Introduction 3
Housing and sustainability 4
Housing in the worldwide context 6
Needs create opportunities 12
Map of the housing business 18
Table of contents

This is the first in a series of five* publications that analyze the horizons of the Brazilian economy for the next two decades, with a special focus on its most strategic sectors, examined both from the perspective of their importance to domestic revenue generation and the business opportunities that they represent over time. In this context, the subject-matter of this publication – Housing - has a noteworthy position. This is due to its role in creating national investment and fostering enhanced quality of life for the population and, given the present sustained upswing of the Brazilian economy, to the horizon of opportunities it offers. The issues addressed in the Sustainable Brazil series are the following:
Housing market potential; Economic growth and consumption potential; Energy market challenges; Prospects for Brazilian agri-business; Horizons for industrial competitiveness.
The initial approach takes into account Brazil’s potential for interaction with the world market, with scenarios being outlined up to the year 2030. An in depth view of the behavior of the main factors determining the global scenario is a
prerequisite for making valid projections for Brazil’s growth. The survey covers a total of 100 countries, analyzed not only from the standpoint of their economic aspects, but also in regard to their demographic dynamics, quality of life and human and natural resources. For this publication, we have considered the housing indicators of 24 of these countries in detail.
This work, a joint effort between Ernst & Young Terco and the Getulio Vargas Foundation(FGV-Fundação Getulio Vargas), one of the foremost and renowned academic institutions in Brazil, also seeks to qualify the concept of development in Brazil in the decades ahead. More important than wondering whether the country will grow a lot or a little is questioning whether it will grow well, i.e. take full advantage of its possibilities without exceeding its limits. Housing, the focus of this study, is one of the pre-conditions for growing well. Considering the scale of funds required and the needs involved in housing, government and private incentive need to join forces in order to accompany the level of development desired in other areas. This publication considers some elements that companies will need both for debating this topic and for strategic planning.
Introduction
*This publication has been produced in 2008. Since then, the Sustainable Brazil series has six publications. The latest survey, titled “Sustainable Brazil - Social and Economic Impacts of the 2014 World Cup”, was launched in 2010.

SUSTAINABLE BRAZIL HOUSING MARKET POTENTIAL
Housing and sustainability
Challenges on the highway to the year 2030In the past two years, Brazil has posted considerable increases in the amount of money available to finance real estate projects, albeit the country is still far from reaching the volume recorded in 1980, in the heyday of transactions financed by the now-extinct National Housing Bank (BNH - Banco Nacional de Habitação). The method applied to analyze housing market potential shows that, in order to continue on the road to sustainable development, investments in the housing area are strategic, both for maintaining a strong pace of economic growth and for achieving higher quality of life indices for the population.
The reference scenario adopted for this study indicates significant results for the Brazilian economy, regardless of structural renewals, that could lead to making its growth exponential. Perfecting the tax system and carrying out pension reforms, for example, would expand overall income generation capacity, but even without such factors, Brazil has tremendous potential to improve its position in the worldwide context.
Obtaining quality results, on the other hand, is dependent upon the harmonious interaction of key economic variables that should
4
sustain stable growth until 2030. Therefore, for example, the Brazilian market needs to be able to meet an increased housing demand. This is in fact an enormous challenge as Brazilian families will be expanding at an average annual rate of 2% over the next 23 years.
The Mexican experience shows that it is possible for a developing country with socio-economic characteristics similar to those of Brazil to attain a higher level of real estate credit. Projections for the Mexican economy show that, in 2008, 75% of its housing needs – which involves new homes and renovations – will receive credit. In the case of Brazil, current housing needs amount to 2.1 million units, including construction, renovation, maintenance and home repair, and acquisition of lands. Offering credit to the extent that has occurred in Mexico means more than tripling the amount of financing extended in 2007, i.e. reaching 1.6 million credit operations per year.
The good news is that Brazil is highly capable of meeting the demand for housing and eliminating its housing deficit within a reasonable timeframe, taking into account the economic and institutional advances achieved since the 1990s.
The construction industry is enjoying a cycle of growth, and a significant part of the improvements required
by the different segments of the production chain are already taking place. The result, as can be observed over the last two years, is a marked expansion of housing credit and a huge volume of foreign investors involved in providing funds to Brazilian construction companies in the open market.
Presumptions for ProfitabilityDue to its momentum and potential, Brazil is viewed internationally as a great real estate market, and it is increasingly getting targeted by major investors in this sector. In this context, the foreign crisis triggered in the United States could even become a positive factor, as there are tremendous real estate opportunities now in the Brazilian market. The reference scenario allows us to estimate the size of the market up to 2030. Construction company turnover, for example, will jump from R$ 53.5 billion in 2007 to R$ 129.6 billion in 2030. Equally important for the planning of companies operating in this sector are the projections, based on demographic and socio-economic premises, for the transformations that housing demand in Brazil will undergo. As will be seen, the process for qualifying the Brazilian consumer market opens up new opportunities. Really understanding them is a condition for profiting from them.

A
1971 to1975
1976 to1980
1981 to1985
1986 to1990
1991 to1995
1996 to2000
2001 to2005
2006 to2010
2011 to2015
2016 to2020
2021 to2025
2026 to2030
(%) per year
4.4% 3.9% 4.8% 11.2%
2007
2030
Housing investment
Construction value
Construction material sales**
Real estate credit***
165.2
99.869.2
25.3
446.7
241.7
203.6
290.4
446.7
350
300
250
200
150
100
50
Brazil is viewed internationally as a great real estate market, and it is increasingly getting targeted by major investors in this sector.
1971 to1975
1976 to1980
1981 to1985
1986 to1990
1991 to1995
1996 to2000
2001 to2005
2006 to2010
2011 to2015
2016 to2020
2021 to2025
2026 to2030
(%) per year
4.4% 3.9% 4.8% 11.2%
2007
2030
Housing investment
Construction value
Construction material sales**
Real estate credit***
165.2
99.869.2
25.3
446.7
241.7
203.6
290.4
446.7
350
300
250
200
150
100
50
Housing investment in R$ billion*
The market in 2007 and in 2030, in R$ billion*
Source: Getulio Vargas Foundation( * ) 2007 prices.
Source: Getulio Vargas Foundation( * ) 2007 prices. ( ** ) For housing construction and renovations. ( *** ) Extended per year.

SUSTAINABLE BRAZIL HOUSING MARKET POTENTIAL
Housing in the worldwide context
A Differential for GrowthThe study of international experiences in the housing area underscores the importance of investments in the construction of new homes and also in the maintenance and renovation of properties for enabling countries to achieve economic growth and, even more importantly, to develop in a sustained manner. This analysis contributes to the construction of scenarios for the Brazilian market, in view of the fact that such experiences illustrate the economic factors that led some countries to succeed in this regard and indicate the respective growth possibilities for Brazil.
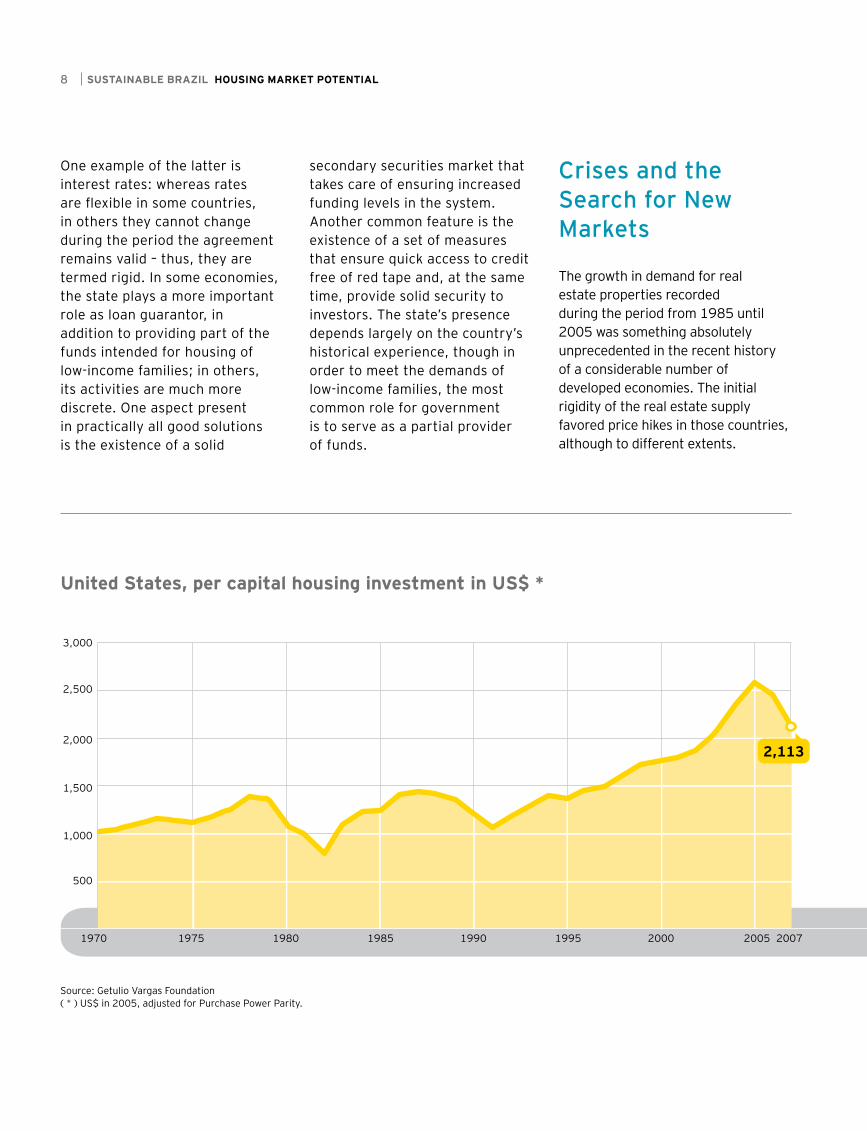
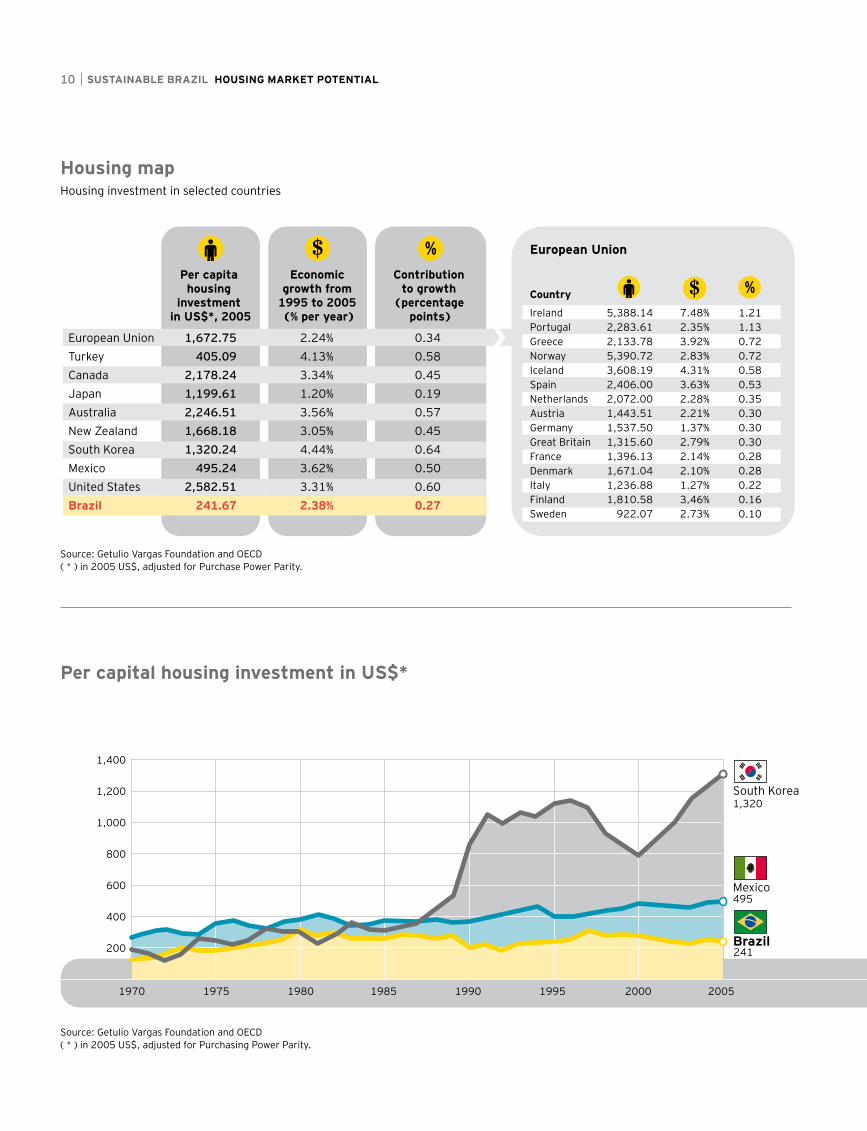
The case of South Korea, in this context, shows how a country with a huge housing deficiency was able to deal with the matter in a relatively short time span. Korea started from a per capita housing investment level of US$ 308 in 1985, and reached US$ 1,320 by 2005. In that 20-year period, housing investment contributed 0.64 percentage point to the country’s annual economic growth of 6.6% – the highest GDP growth rate among the 24 economies that this study analyzed
6
in depth. From 1985 to 1995, this number was even higher, contributing 1.20 percentage point to economic growth of 8.7% per year.
In the European Union, Spain is a perfect example. From 1985 to 2005, per capita housing investment tripled. This increase was accompanied by economic growth, stable by European standards, in the range of 3.3% per year. From 1995 to 2005, the GDP grew an average of 3.63%, and residential investment accounted for 0.53 percentage point of that growth – or for 14.5% of the total.
Ireland, for its part, is an example without precedent. Per capita housing investment grew more than eight-fold between 1985 and 2005. The impact of this growth on GDP was equally significant. Between 1995 and 2005, Irish economic growth reached an average of 7.48%, with a contribution of 1.21 percentage point from the housing area, i.e. 16% of the total.
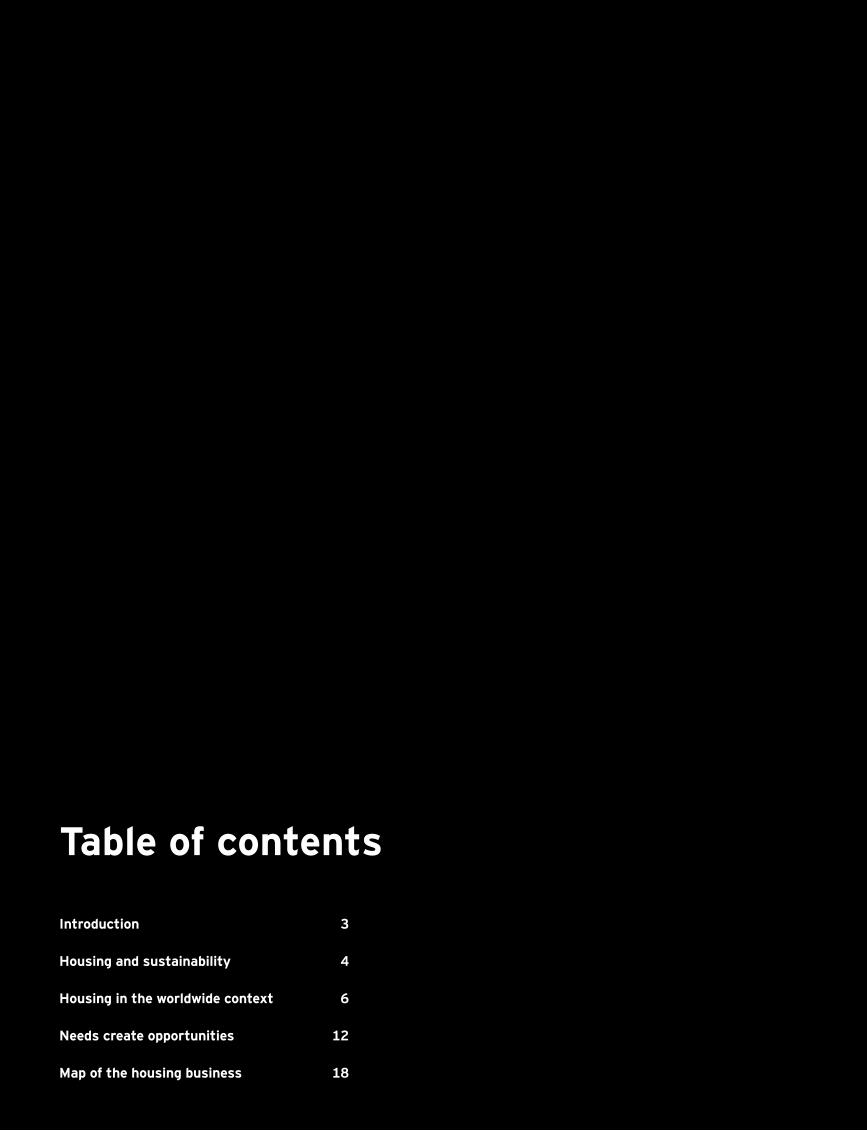
Housing investments in the United States are a special case because of its size – they represented 6.2% of American GDP in 2005 for a housing market that is bigger than those of all 15 countries of the European Union combined.

AIn every country where there was an increase in housing investment, there were previous changes that permitted improvements in financing systems.
that Mexico’s GDP growth was higher than Brazil’s, mainly due to the positive performance of its real estate market.
A comparison of the entire set of countries allows us to make one important generalization: economies with higher housing investments have higher growth rates.
The Importance of Institutional Advances
In every country where housing investments increased, important institutional changes occurred beforehand that allowed for an improvement in the functioning of their financing systems. Such improvements have occurred intensely in recent years, in a favorable global economic context that contributed to an overall increase in housing investments worldwide. It should be noted that a fair share of world economic growth was caused by the investment of funds in housing.
In the European Union, the unification of capital markets made a decisive contribution to creating an environment with greater savings
The sector grew at a surprising rate in the period of 1985-2005 and accounted for a substantial portion of the good results achieved by the American economy. Per capita housing investment more than doubled and accounted for 0.49 percentage point, or 16% of the GDP growth of 3.1%. From 1995 until 2005, the contribution from the housing segment was even higher: 0.60 percentage point, or 18% of a GDP growth of 3.31% per year.
A particularly important reference for the Brazilian context is Mexico, a country with which Brazil has many social and economic similarities. Mexican housing investments are low in comparison with those of developed economies, but its continued growth since the latter years of the 1990s permitted marked results. Housing investments increased 33% from 1995 to 2005 and accounted for 0.50 percentage point of the economic growth rate of 3.62%.
The comparison with the Brazilian economy is meaningful. Brazil’s average growth rate between 1995 and 2005 was 2.38%, with a contribution of 0.27 percentage point on the part of housing investments. The analysis shows
mobility. This process led to the creation of new production and to the reduction of interest rates, which favored the mortgage credit market. Since the mid 1980s, policies were implemented in each country’s economy that allowed for the good performance of the real estate market. In Spain, the government stressed deregulation of the mortgage market and simplification of land registration processes. In general, European Union countries eliminated interest rate controls.
Even in the consolidated market represented by America, whose housing financing model serves as a reference for a good part of the world, changes were implemented in its securitized mortgage system during that time.
Technological innovations produced quicker credit approval tools that, together with interest rate reductions, managed to popularize their use and favor the boom that lasted until 2005. Among the lessons that developed countries can teach developing ones is the importance of building a trustworthy regulatory apparatus. While there are some issues that are beyond dispute, others are arguable.
SUSTAINABLE BRAZIL HOUSING MARKET POTENTIAL
1970 1975 1980 1985 1990 1995 2000 2005 2007
3,000
2,500
2,000
1,500
1,000
500
2,113
Source: Getulio Vargas Foundation( * ) US$ in 2005, adjusted for Purchase Power Parity.
United States, per capital housing investment in US$ *
One example of the latter is interest rates: whereas rates are flexible in some countries, in others they cannot change during the period the agreement remains valid – thus, they are termed rigid. In some economies, the state plays a more important role as loan guarantor, in addition to providing part of the funds intended for housing of low-income families; in others, its activities are much more discrete. One aspect present in practically all good solutions is the existence of a solid
secondary securities market that takes care of ensuring increased funding levels in the system. Another common feature is the existence of a set of measures that ensure quick access to credit free of red tape and, at the same time, provide solid security to investors. The state’s presence depends largely on the country’s historical experience, though in order to meet the demands of low-income families, the most common role for government is to serve as a partial provider of funds.
Crises and the Search for New Markets
The growth in demand for real estate properties recorded during the period from 1985 until 2005 was something absolutely unprecedented in the recent history of a considerable number of developed economies. The initial rigidity of the real estate supply favored price hikes in those countries, although to different extents.
8

This increase stimulated the construction of new homes and the extension of credit, but this route is sometimes fraught with difficulties.
In many countries, hikes in the price of real estate reached unsustainable levels. Since the middle of 2006, the marked rise in supply ended up leading to a price slump. The “bubble” first started to burst in the biggest real estate market, the United States. The enormous facility with which loans were granted and property value was enhanced contributed to increasing American mortgage credit risk.
An important contribution to the crisis was the fact that the temporary enhancement of properties values attributed book values to the security interests on mortgage debts that was greater than the amount that could be obtained in the near future. Moreover, the situation was aggravated because loans were granted in excess of the quality of the underlying credit, which caused default and liquidity problems for banks. This subsequently caused the implosion of the high-risk market segment, the so-called subprime mortgage market.
Analyzing the American crisis, it becomes obvious that the housing market suffered an interruption in the growth process due to problems related to the manner in which loans were extended. In other words,
9
it is a financial crisis that is not linked to the exhaustion of the housing market per se, but is nevertheless one that led to a serious reduction in residential investments. The positive economic outlook for the United States through 2030 indicates recovery of investments to the extent that the adjustment of asset values is absorbed by the market.
In the context of globalized capital markets, the crisis was not restricted to the United States alone. In the European Union, in countries such as Spain and Ireland, real estate prices also started to decline, albeit not as dramatically as in the United States. The majority of European countries have a fixed interest rate system, which reduces the impact of rises in current agreements.
In addition to the strictly financial aspects, the decline that is now being observed in Europe is related to depleted demand. Population growth has stabilized in several countries – projections actually show a decline in German population, for example. In the main markets of the European Union, the end of the boom was just a matter of time.
It may be said that the great expansion cycle of housing investments in developed countries is coming to an end. If in the United States the crisis is rather cyclical, in Europe there are structural aspects that indicate something more lasting. This explains why
SUSTAINABLE BRAZIL HOUSING MARKET POTENTIAL
1970 1975 1980 1985 1990 1995 2000 2005
Brazil
Mexico
South Korea
1,400
1,200
1,000
800
600
400
200
European Union
Turkey
Canada
Japan
Australia
New Zealand
South Korea
Mexico
United States
Brazil
Per capita housing
investment in US$*, 2005
Economic growth from
1995 to 2005 (% per year)
Contribution to growth
(percentage points)
2.24%
4.13%
3.34%
1.20%
3.56%
3.05%
4.44%
3.62%
3.31%
2.38%
1,672.75
405.09
2,178.24
1,199.61
2,246.51
1,668.18
1,320.24
495.24
2,582.51
241.67
0.34
0.58
0.45
0.19
0.57
0.45
0.64
0.50
0.60
0.27
European Union
IrelandPortugalGreeceNorwayIcelandSpainNetherlandsAustriaGermanyGreat BritainFranceDenmarkItalyFinlandSweden
5,388.142,283.612,133.785,390.723,608.192,406.002,072.001,443.511,537.501,315.601,396.131,671.041,236.881,810.58
922.07
7.48%2.35%3.92%2.83%4.31%3.63%2.28%2.21%1.37%2.79%2.14%2.10%1.27%3.46%2.73%
1.211.130.720.720.580.530.350.300.300.300.280.280.220.160.10
1,320
495
241
Country
10
Housing mapHousing investment in selected countries
Per capital housing investment in US$*
Source: Getulio Vargas Foundation and OECD( * ) in 2005 US$, adjusted for Purchase Power Parity.
Source: Getulio Vargas Foundation and OECD( * ) in 2005 US$, adjusted for Purchasing Power Parity.
1970 1975 1980 1985 1990 1995 2000 2005
Brazil
Mexico
South Korea
1,400
1,200
1,000
800
600
400
200
European Union
Turkey
Canada
Japan
Australia
New Zealand
South Korea
Mexico
United States
Brazil
Per capita housing
investment in US$*, 2005
Economic growth from
1995 to 2005 (% per year)
Contribution to growth
(percentage points)
2.24%
4.13%
3.34%
1.20%
3.56%
3.05%
4.44%
3.62%
3.31%
2.38%
1,672.75
405.09
2,178.24
1,199.61
2,246.51
1,668.18
1,320.24
495.24
2,582.51
241.67
0.34
0.58
0.45
0.19
0.57
0.45
0.64
0.50
0.60
0.27
European Union
IrelandPortugalGreeceNorwayIcelandSpainNetherlandsAustriaGermanyGreat BritainFranceDenmarkItalyFinlandSweden
5,388.142,283.612,133.785,390.723,608.192,406.002,072.001,443.511,537.501,315.601,396.131,671.041,236.881,810.58
922.07
7.48%2.35%3.92%2.83%4.31%3.63%2.28%2.21%1.37%2.79%2.14%2.10%1.27%3.46%2.73%
1.211.130.720.720.580.530.350.300.300.300.280.280.220.160.10
1,320
495
241
Country

investors search for new markets in countries like Mexico, Brazil, China and India. When allocating their capital, investors consider economic stability, income levels, expectations for economic development, population growth tendencies, funding systems and institutional and legal environments. Brazil offers good conditions in all these aspects.
Advances of the Brazilian MarketThe Brazilian housing financing system has made improvements that contribute to solutions that have been largely accepted by market players. These improvements have caused major deregulation and strengthened the quality of securities offered to investors. Among advancements on a legal level, the following should be stressed:
Law 9.514, of November 20, 1997: with this law, the Real Estate Financing System (“SFI”) was instituted, real estate credit securitization companies were created, Real Estate Receivables Certificates (CRIs) were established and chattel mortgage of property was introduced;
Law 10.931, of August 2, 2004: introduced the concept of Detachable Property (“Patrimônio de Afetação”) for the purpose of protecting purchasers; the law also established continued payment of amortization installments where there is no disagreement in the event of legal disputes (the so-called undisputed amount).
Such changes, associated with a macroeconomic environment favorable to income growth and interest rate cuts, expanded the supply of credit and attracted foreign capital. From 2002 to 2007, the annual flow of real estate credit rose from R$ 4.8 billion to R$ 25 billion. Such prosperity attracted foreign investors who saw an excellent opportunity to enter the market in the initial public offerings (IPOs) of Brazilian construction companies and developers. In 2007, when the United States was already feeling the consequences of the subprime crisis, the Brazilian real estate sector
11
continued to receive funds from abroad, to the tune of IPOs tagged at R$ 8.3 billion.
In order to understand the reasons behind this influx of funds into Brazil, we have to take into account that the risk factors that caused the real estate crisis in developed countries do not exist in a nation where terms for extending home mortgage loans are much more restricted and where demand is high. Even when the crisis eases in the North American and European markets, Brazil can still play an important role, which makes it suitable for rapid growth.
SUSTAINABLE BRAZIL HOUSING MARKET POTENTIAL
Needs create opportunities
In drawing up the reference scenario and projecting the Brazilian real estate market, the most important step is the simultaneous analysis of the demographic factors and socio-economic dynamics that are the essential conditions for starting a family and hence satisfying housing investment needs in the years ahead. In the final analysis, this means dovetailing Brazil’s projected housing needs into the panorama drawn up for the Brazilian economy.
The housing needs of a country are dictated by three principal elements:
family dynamics: process of starting new families, which is influenced by growth in income and population;
housing deficit: housing shortfall deriving from failure to meet housing needs over the years;
depreciation: need to substitute worn housing stock.
The pace at which families are started is the principal determinant of a country’s housing needs. In preparing growth projections for the number of families, in addition to the demographic factor, we also have to consider income growth, as this is the element that directly influences the decision to start a
family, have a certain number of children and to what extent there will be a need for family cohabitation.
There is a direct relationship between the increase in the number of inhabitants and the need to build new homes. Population growth, in turn, is determined by birth and death rates and by migratory movements. Even so, there are two equally important aspects: urbanization and changes in a population’s age structure.
The general move from the countryside into cities brings about a new housing need all by itself, in addition to causing new cultural behaviors, such as the decision to have fewer children. By the same token, the aging of the population changes the pattern of housing needs. To understand this aspect, we only need to recall that, from a certain age on, youths start their own families and wish to have their own homes; that a couple in their forties usually looks for a new and generally bigger residence; and that senior citizens, on the other hand, require smaller houses.
The number of families can also be higher or lower due to economic conditions. There is a certain proportionality between the number of adults of a determined population
and the number of family start-ups, but this relationship changes when the economic situation favors the premature starting of a family and the early decision whether or not to have children. The tendencies in Chile in the 1990s, and more recently in Spain and in Ireland, illustrate such a situation. In these countries, there was a momentary reversal of the trend for a declining number of children, due to the premature starting of families.
The Demographic Scenario In the last 17 years, the Brazilian population has grown at a rate of 1.5% per year, above the world average of 1.4%, from 146.6 million inhabitants in 1990 to 189.1 million in 2007. In 1990, 74.8% of Brazilians lived in urban areas – the percentage rose to 85.1% in 2007.
In the next nine years, the combination of increasing income and decreasing fertility will contribute to an even more accentuated reduction in the growth rate of the Brazilian population. Even with the reduction of infant mortality, the constantly rising number of Brazilian women in the job market and the generalized increase in educational levels will
12

A
have negative effects on population growth, which will fall to 1.1%, a number equivalent to what is expected to be the world average. For the following 13 years, from 2017 to 2030, the historical downward trend will become even more accentuated, and the population growth rate will stay below 1%.
In developed countries, the trend towards a reduced population growth rate, associated with increased life expectancy, has been determining a major shift in the profile of the population. In Brazil, it is already possible to observe significant changes in the distribution of the age pyramid. Just a relatively short time ago, in 1990, the average age of Brazilians was 25.6 years and their average life expectancy was 66.3 years – and only 36.4% of the population was 30 years or older. In 2007, the average age rose to 29.8 years, and average life expectancy to 72.4 years – and 45.7% of the population was already 30 or older.
In 2017, the average age of Brazilians will be 32.5 years, their average life expectancy will be 74.7 years, and 51.5% of the population will be 30 or older. In Brazil in 2030, when no less than 91.1% of the population will be living in cities, the average age will be 36, and
The constantly rising number of Brazilian women in the job market and the rise in educational levels will have negative effects on population growth.
0-4
55 10
MillionsMillions
10 1515 2020
5-9
10-14
15-19
20-24
25-29
30-34
35-39
40-44
45-49
50-54
55-59
60-64
65-69
70-74
75-79
80-84
85-89
90-94
95-99
100+
20072030
Age(years)
Source: Brazilian Geographic and Statistics Institute (“IBGE”) and United Nations
Age pyramid

SUSTAINABLE BRAZIL HOUSING MARKET POTENTIAL
almost 60% of the population will be 30 or older. Thus, there will be more adults able to start families and which will require households. It should be pointed out that, in 2007, some countries in which such aging started earlier, such as Chile and South Korea, already had a higher life expectancy than Brazilians will have in 2030: 78.6 years.
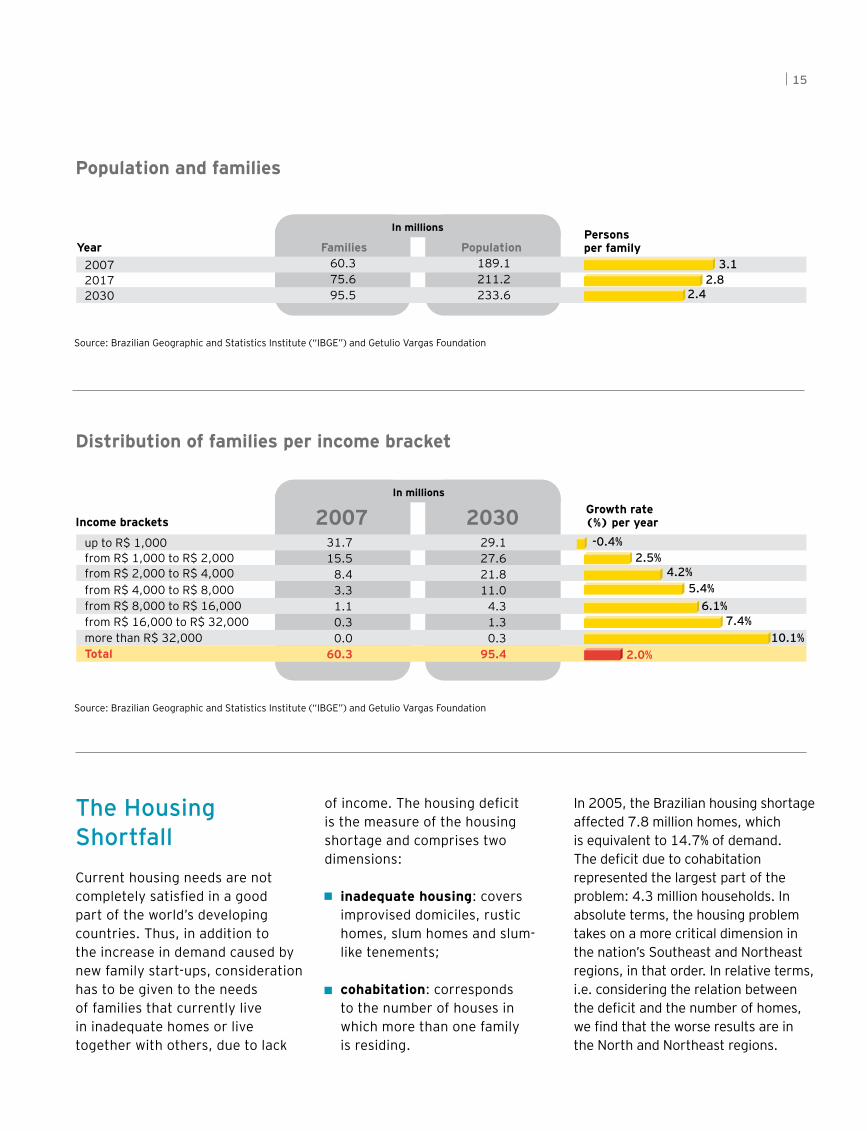
The New FamiliesBetween 2007 and 2030, the number of families in Brazil will rise from 60.3 million to 95.5 million – this growth of 58% represents more than double the pace of worldwide population increase. Falling birth rates will also have effects on the size of families, dropping from 3.1 people in 2007
to 2.4 in 2030. The distribution per income bracket shows that family growth will be more accentuated in the population strata with more purchasing power. Between 2007 and 2030, the number of families with incomes of up to R$ 1,000 will decrease, and their share of the total will change from 53% to 31%.
During the next 22 years, two different phases can be forecast. Of the 15.3 million new families that will be started in the next decade, 57% will be on the bottom of the social pyramid, with family incomes of under R$ 2,000. From 2017 on, that tendency will change, and 78% of the 19.9 million new families will have incomes of between R$ 2,000 and R$ 8,000.
Those two trends, with different dynamics, effect the way housing policies are designed and how construction companies will have to run their businesses. In the first phase, until 2017, a housing policy based on subsidies gains more relevance as a mechanism to complement the incomes of poorer families. In the second phase, in which the strata with less income diminishes, subsidies become less important. After 2017, market mechanisms and credit terms will become even more important for meeting housing needs. For companies, whether they are construction or manufacturing firms, there will be changes in their target customers and, therefore, in the product lines to be offered.
14
20
40
60
80
100
1950 60 80 9070 10 20 203000 1950 60 80 9070 10 20 203000
0.5%
1.0%
1.5%
2.0%
2.5%
3.0%
3.5%91.1%
0.7%
Urban population Demographic growth
Source: Brazilian Geographic and Statistics Institute (“IBGE”) and United Nations
(%) (% per year)
In millions
up to R$ 1,000from R$ 1,000 to R$ 2,000from R$ 2,000 to R$ 4,000
from R$ 4,000 to R$ 8,000from R$ 8,000 to R$ 16,000from R$ 16,000 to R$ 32,000more than R$ 32,000Total
Year Families60.375.695.5
200720172030
189.1211.2233.6
3.1 2.8
2.4
PopulationPersons per family
200731.715.5
8.43.31.10.30.0
60.3
29.127.621.811.0
4.31.30.3
95.4
2030 Growth rate (%) per year
-0.4%2.5%
4.2%5.4%
6.1%7.4%
10.1%
2.0%
Income brackets
In millions
In millions
up to R$ 1,000from R$ 1,000 to R$ 2,000from R$ 2,000 to R$ 4,000
from R$ 4,000 to R$ 8,000from R$ 8,000 to R$ 16,000from R$ 16,000 to R$ 32,000more than R$ 32,000Total
Year Families60.375.695.5
200720172030
189.1211.2233.6
3.1 2.8
2.4
PopulationPersons per family
200731.715.5
8.43.31.10.30.0
60.3
29.127.621.811.0
4.31.30.3
95.4
2030 Growth rate (%) per year
-0.4%2.5%
4.2%5.4%
6.1%7.4%
10.1%
2.0%
Income brackets
In millions
The Housing ShortfallCurrent housing needs are not completely satisfied in a good part of the world’s developing countries. Thus, in addition to the increase in demand caused by new family start-ups, consideration has to be given to the needs of families that currently live in inadequate homes or live together with others, due to lack
of income. The housing deficit is the measure of the housing shortage and comprises two dimensions:
inadequate housing: covers improvised domiciles, rustic homes, slum homes and slum- like tenements;
cohabitation: corresponds to the number of houses in which more than one family is residing.
In 2005, the Brazilian housing shortage affected 7.8 million homes, which is equivalent to 14.7% of demand. The deficit due to cohabitation represented the largest part of the problem: 4.3 million households. In absolute terms, the housing problem takes on a more critical dimension in the nation’s Southeast and Northeast regions, in that order. In relative terms, i.e. considering the relation between the deficit and the number of homes, we find that the worse results are in the North and Northeast regions.
Source: Brazilian Geographic and Statistics Institute (“IBGE”) and Getulio Vargas Foundation
15
Distribution of families per income bracket
Population and families
Source: Brazilian Geographic and Statistics Institute (“IBGE”) and Getulio Vargas Foundation

SUSTAINABLE BRAZIL HOUSING MARKET POTENTIAL
from R$ 2,000 to R$ 4,000
from R$ 4,000 to R$ 8,000
from R$ 8,000 to R$ 16,000
from R$ 16,000 to R$ 32,000
more than R$ 32,000
Total
CohabitationInadequate housing
9.7% 9.6%
4.8%
2.0%
0.5% 0.2% 0.2% 0.0%
6.6%5.7%
3.3%
1.8% 1.4% 1.0% 1.0%
7.5%
up to R$ 1,000
from R$ 1,000 to R$ 2,000
Southeast2,950.7
Central-West355.9
North1.071,8
South717.3
Northeast2,737.3
BRAZIL
Total: 7,833.0
Inadequate Housing
3,529.8
Cohabitation
4,303.2
14.7%
12.4%
9.2%
28.9%
8.6%
1,363.51,587.2
1,249.91,487.4
464.0 607.8
211.3
506.0
258.5
97.3
20.5%
Relative deficit
PER REGION
Source: Brazilian Geographic and Statistics Institute (“IBGE”) and Getulio Vargas Foundation
from R$ 2,000 to R$ 4,000
from R$ 4,000 to R$ 8,000
from R$ 8,000 to R$ 16,000
from R$ 16,000 to R$ 32,000
more than R$ 32,000
Total
CohabitationInadequate housing
9.7% 9.6%
4.8%
2.0%
0.5% 0.2% 0.2% 0.0%
6.6%5.7%
3.3%
1.8% 1.4% 1.0% 1.0%
7.5%
up to R$ 1,000
from R$ 1,000 to R$ 2,000
Southeast2,950.7
Central-West355.9
North1.071,8
South717.3
Northeast2,737.3
BRAZIL
Total: 7,833.0
Inadequate Housing
3,529.8
Cohabitation
4,303.2
14.7%
12.4%
9.2%
28.9%
8.6%
1,363.51,587.2
1,249.91,487.4
464.0 607.8
211.3
506.0
258.5
97.3
20.5%
Relative deficit
PER REGION
Relative deficit per income class and component in 2005
Housing deficit per region and component in 2005
Source: Brazilian Geographic and Statistics Institute (“IBGE”) and Getulio Vargas Foundation
In thousands of homes
(%) of the families
16
There is an acute housing shortage in low income family segments, which holds true both for the inadequate housing and cohabitation deficits. Around 10% of the homes of families with incomes of up to R$ 1,000 were inadequate, and the percent for cohabitation was similar. Summing up the deficits for inadequate housing and cohabitation, the total reaches almost 20% of lower-income households.
The housing shortfall is a particularly serious matter in developing countries. Some, like Chile and Mexico, have been more successful with housing deficit reduction policies. Government policy for the sector is, in this sense, a critical
factor that influences the possible scenarios for the Brazilian real estate market.
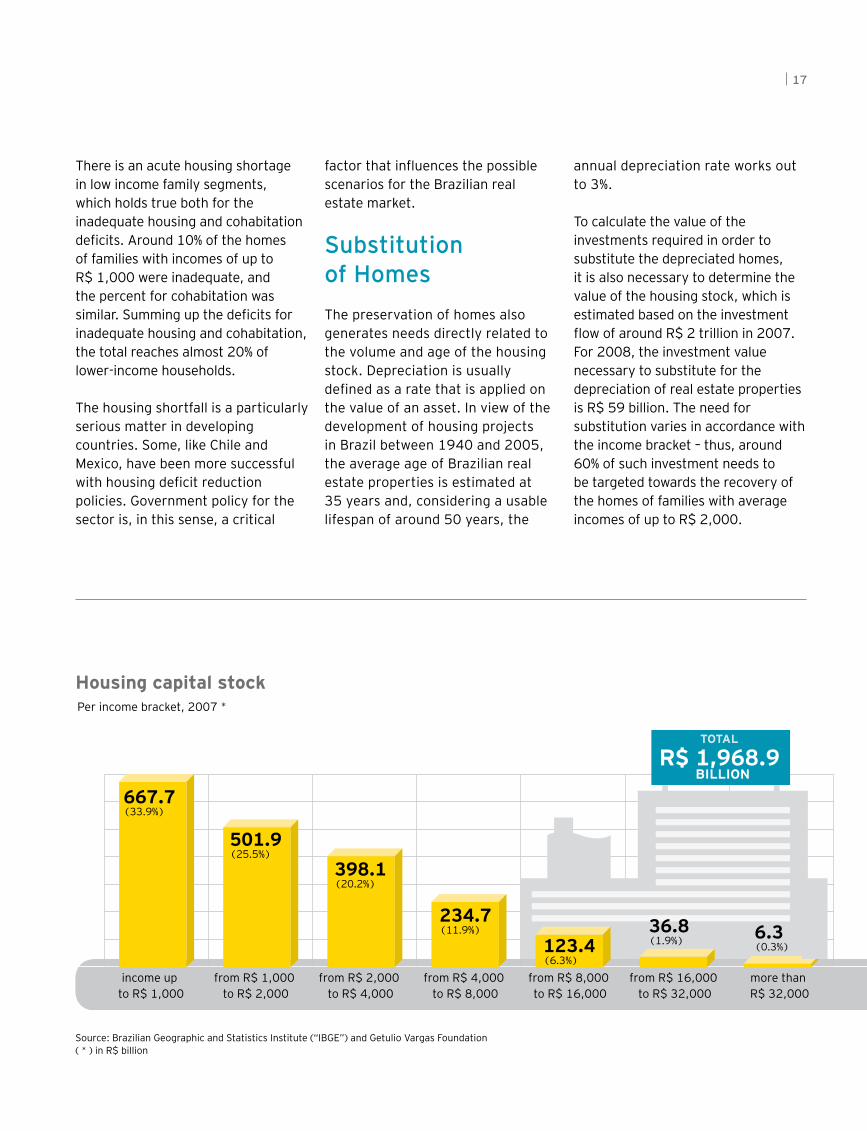
Substitution of HomesThe preservation of homes also generates needs directly related to the volume and age of the housing stock. Depreciation is usually defined as a rate that is applied on the value of an asset. In view of the development of housing projects in Brazil between 1940 and 2005, the average age of Brazilian real estate properties is estimated at 35 years and, considering a usable lifespan of around 50 years, the
annual depreciation rate works out to 3%.
To calculate the value of the investments required in order to substitute the depreciated homes, it is also necessary to determine the value of the housing stock, which is estimated based on the investment flow of around R$ 2 trillion in 2007. For 2008, the investment value necessary to substitute for the depreciation of real estate properties is R$ 59 billion. The need for substitution varies in accordance with the income bracket – thus, around 60% of such investment needs to be targeted towards the recovery of the homes of families with average incomes of up to R$ 2,000.
Source: Brazilian Geographic and Statistics Institute (“IBGE”) and Getulio Vargas Foundation( * ) in R$ billion
Housing capital stock
17
income up to R$ 1,000
from R$ 1,000 to R$ 2,000
from R$ 2,000 to R$ 4,000
from R$ 4,000 to R$ 8,000
from R$ 8,000 to R$ 16,000
from R$ 16,000 to R$ 32,000
more than R$ 32,000
667.7(33.9%)
501.9(25.5%)
398.1(20.2%)
234.7(11.9%)
123.4(6.3%)
36.8(1.9%) 6.3
(0.3%)
R$ 1,968.9 BILLION
TOTAL
Per income bracket, 2007 *
SUSTAINABLE BRAZIL HOUSING MARKET POTENTIAL
Map of the housing business
Positive ScenariosHousing need is not the same as the demand for homes. Need is possible demand, the fulfillment of which will depend on economic conditions: family incomes, funding structure and the effectiveness of housing policies. Families always find some way to scrape out a living and provide themselves with some form of shelter, but if the latter is not an adequate household, then these families will add to the numbers of the housing deficit.
By 2030, Brazil needs to find alternative solutions for the housing deficit and allow new families to be formed. Actually, it will be incumbent upon private initiative to supply a considerable part of the needs generated by new families, in such a way that housing policy is complemented by additional funds needed by the low income population.
The reference scenario forecasts average economic growth of 4%, in a context of high social mobility.
A gradual reduction of interest rates is also forecast toward the year 2030, with average home financing rates down to a level
of 7.5%. With the combination of a decline in interest rates and a gradual increase in the volume of subsidies, it is possible to see how housing investments in Brazil could reach levels well above those posted over the last 17 years.
The same scenario also presumes consolidation of secondary credit markets and more swiftness in the granting of funding.
In 22 years, Brazil will have a contingent of more than 233 million people and around 95.5 million families. Under the conditions studied, an average of 2.5 persons per home is estimated, which means about 93.1 million households – an increase of around 66% over 2007.
In that period, 37 million homes will be built in the entire country, an average of 1.6 million new residences per year.
Investment will also reduce the housing shortfall. The deficit due to inadequate housing will be completely eliminated by 2030. Cohabitation will be considerably reduced and represent 2.5% of the total amount of households, which will include many families that live together by choice. Thus, considering that the demand for
18

AIn 2030, Brazil will have a contingent of more than 230 million people and around 95 million families. The average will be 2.5 persons per home, which means 93.1 million households.
homes is gradually met and construction and renovation take place so as to steadily eliminate the housing shortfall, the reference scenario indicates that there will be an average annual increase of 1.745 million adequate homes (new and renovated households) added to the nation’s housing stock.
The annual housing investment flow will be approximately R$ 316 billion, R$ 219 billion between 2008 and 2017, and R$ 390 billion in the 2018-2030 period. Such investments will represent 7.3% of the GDP, an increase of 4.3 percentage points as compared to 2005 – putting
Brazil, in 22 years, on a level with efforts towards housing capital creation equivalent to those of Ireland and Spain at present. Thus, the per capita housing stock will reach R$ 28.2 thousand, at 2007 prices, and will be higher than the per capita GDP of R$ 26.7 thousand in 2030.
1950 1960 1970 1980 1990 2000 2010 2020 2030
25,000
20,000
15,000
10,000
5,000
Housing capital
GDP
26.739
28.230
Source: Getulio Vargas Foundation
Housing capital stock and per capita GDP in R$ in 2007

SUSTAINABLE BRAZIL HOUSING MARKET POTENTIALA
Population and HOMESThe future of housing investment in Brazil
63.1 (20.0%)From R$ 4,000 to R$ 8,000
Source: Getulio Vargas Foundation
Housing investment per year
Period
2008-2017
2018-2030
2008-2030Figures between parentheses for 2008-2030refer to the percentage of each bracket.
1.613
1.598
1.604
219.4
390.0
315.9
Housing investment(R$ billion)
Housing investment (% of GDP)
6.8%
7.6%
7.3%
New homes
(millions)
8.6 (2.7%)More than R$ 32,000
32.5 (10.3%)Income up to R$ 1,000
63.7 (20.2%)From R$ 1,000 to R$ 2,000
82.6 (26.1%)From R$ 2,000 to R$ 4,000
44.7 (14.2%)From R$ 8,000 to R$ 16,000
20.6 (6.5%)From R$ 16,000 to R$ 32,000
Housing investmentIn R$ billion, per income bracket, from 2008 to 2030
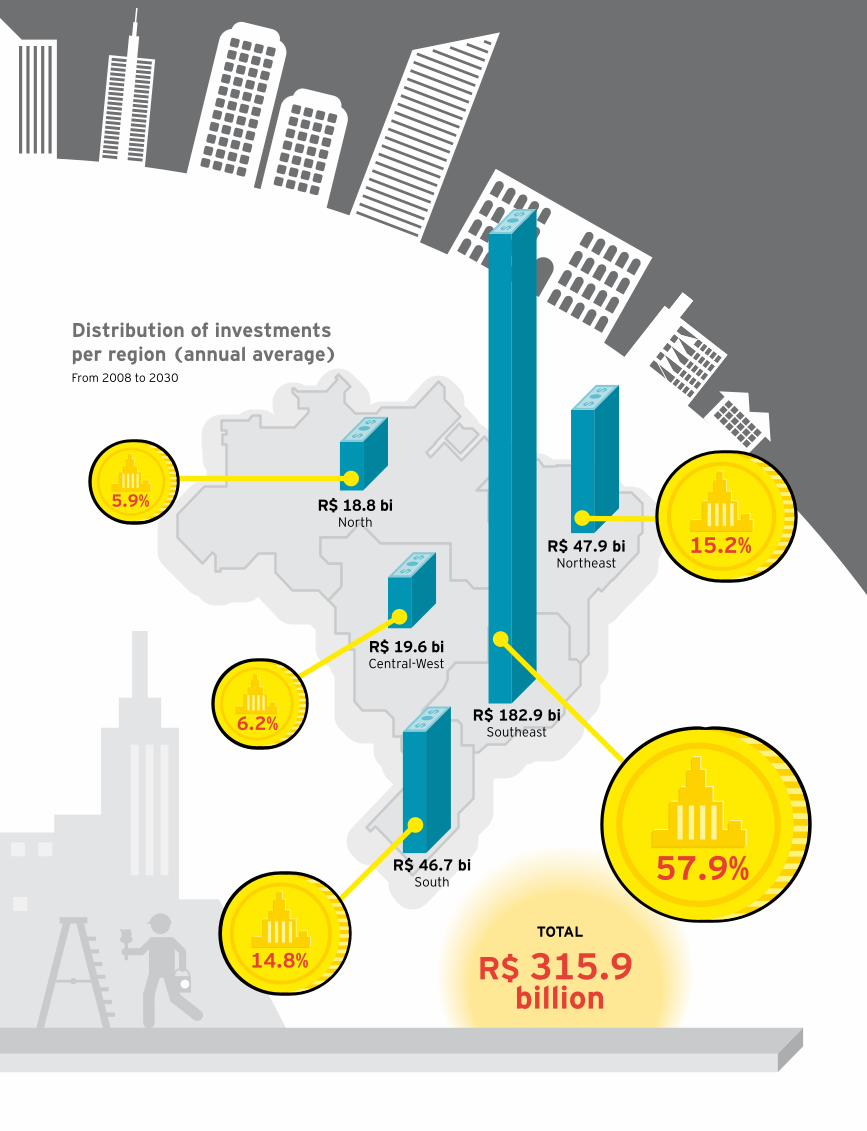
TOTAL
R$ 315.9 billion
Year
Homes (millions)
Population (millions)
2007
56.2
189.1
2017
72.4
211.2
2030
93.1
233.6
3.42.9
2.5
Persons per home
R$ 47.9 biNortheast
R$ 182.9 biSoutheast
R$ 19.6 biCentral-West
R$ 18.8 biNorth
R$ 46.7 biSouth
Distribution of investments per region (annual average)From 2008 to 2030
14.8%
6.2%
15.2%
5.9%
57.9%
Source: Getulio Vargas Foundation and OCDE
A
Population and HOMESThe future of housing investment in Brazil
63.1 (20.0%)From R$ 4,000 to R$ 8,000
Source: Getulio Vargas Foundation
Housing investment per year
Period
2008-2017
2018-2030
2008-2030Figures between parentheses for 2008-2030refer to the percentage of each bracket.
1.613
1.598
1.604
219.4
390.0
315.9
Housing investment(R$ billion)
Housing investment (% of GDP)
6.8%
7.6%
7.3%
New homes
(millions)
8.6 (2.7%)More than R$ 32,000
32.5 (10.3%)Income up to R$ 1,000
63.7 (20.2%)From R$ 1,000 to R$ 2,000
82.6 (26.1%)From R$ 2,000 to R$ 4,000
44.7 (14.2%)From R$ 8,000 to R$ 16,000
20.6 (6.5%)From R$ 16,000 to R$ 32,000
Housing investmentIn R$ billion, per income bracket, from 2008 to 2030
TOTAL
R$ 315.9 billion
Year
Homes (millions)
Population (millions)
2007
56.2
189.1
2017
72.4
211.2
2030
93.1
233.6
3.42.9
2.5
Persons per home
R$ 47.9 biNortheast
R$ 182.9 biSoutheast
R$ 19.6 biCentral-West
R$ 18.8 biNorth
R$ 46.7 biSouth
Distribution of investments per region (annual average)From 2008 to 2030
14.8%
6.2%
15.2%
5.9%
57.9%
SUSTAINABLE BRAZIL HOUSING MARKET POTENTIAL
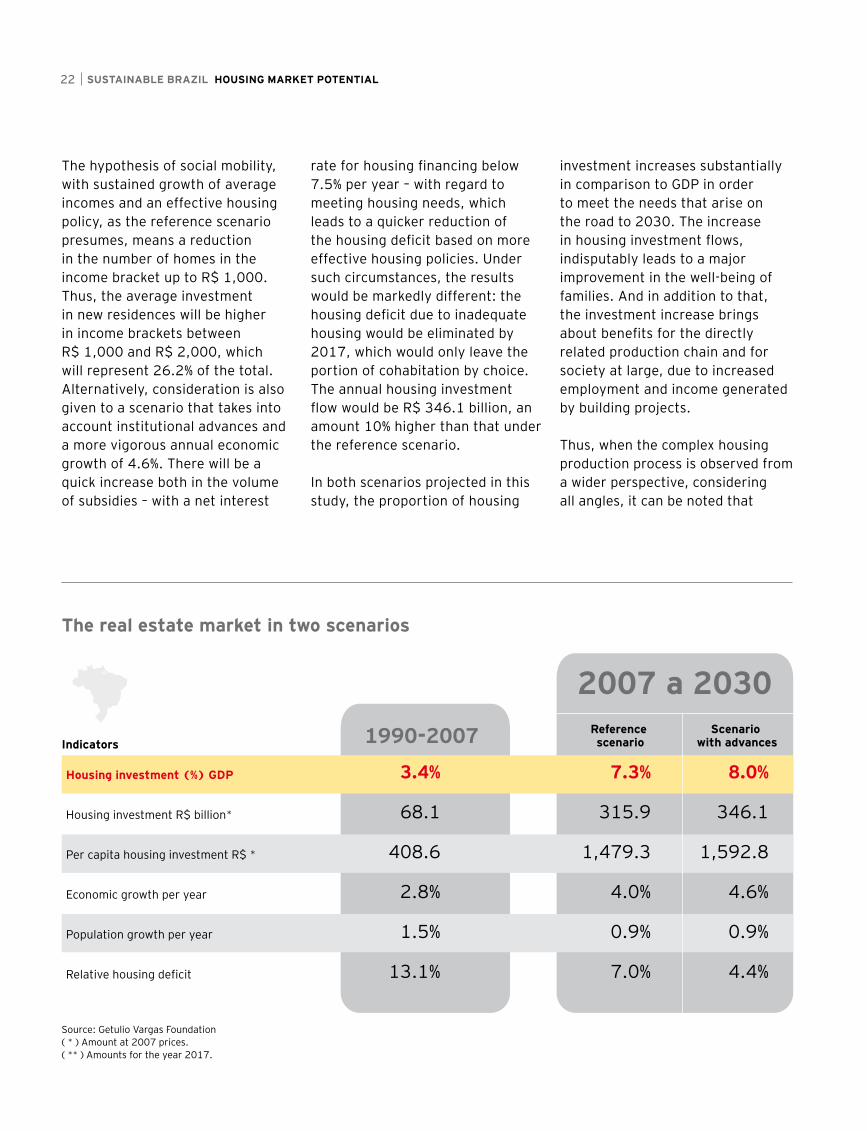
2007 a 2030 Reference scenario
Scenario with advances
3.4%
68.1
408.6
2.8%
1.5%
13.1%
7.3%
315.9
1,479.3
4.0%
0.9%
7.0%
8.0%
346.1
1,592.8
4.6%
0.9%
4.4%
Housing investment (%) GDP
Housing investment R$ billion*
Per capita housing investment R$ *
Economic growth per year
Population growth per year
Relative housing deficit
Indicators 1990-2007
22
The hypothesis of social mobility, with sustained growth of average incomes and an effective housing policy, as the reference scenario presumes, means a reduction in the number of homes in the income bracket up to R$ 1,000. Thus, the average investment in new residences will be higher in income brackets between R$ 1,000 and R$ 2,000, which will represent 26.2% of the total. Alternatively, consideration is also given to a scenario that takes into account institutional advances and a more vigorous annual economic growth of 4.6%. There will be a quick increase both in the volume of subsidies – with a net interest
rate for housing financing below 7.5% per year – with regard to meeting housing needs, which leads to a quicker reduction of the housing deficit based on more effective housing policies. Under such circumstances, the results would be markedly different: the housing deficit due to inadequate housing would be eliminated by 2017, which would only leave the portion of cohabitation by choice. The annual housing investment flow would be R$ 346.1 billion, an amount 10% higher than that under the reference scenario.
In both scenarios projected in this study, the proportion of housing
investment increases substantially in comparison to GDP in order to meet the needs that arise on the road to 2030. The increase in housing investment flows, indisputably leads to a major improvement in the well-being of families. And in addition to that, the investment increase brings about benefits for the directly related production chain and for society at large, due to increased employment and income generated by building projects.
Thus, when the complex housing production process is observed from a wider perspective, considering all angles, it can be noted that
Source: Getulio Vargas Foundation( * ) Amount at 2007 prices.( ** ) Amounts for the year 2017.
The real estate market in two scenarios
23
construction or renovation activities involve a wide range of players and sectors benefitting from such a virtuous circle.
Credit-Driven Expansion In order to acquire real estate property, a significant amount of savings is necessary, which is not always affordable for most families. Thus, whatever the scenario, the credit market is a fundamental aspect for development of the housing sector. For the sector to expand, it is indispensable that housing investments rise.
Countries with underdeveloped financial markets should not be
expected to be successful in meeting housing needs. This is the conclusion that is reached when analyzing some recent housing expansion experiences – such as those in Chile, Mexico, Spain and Ireland – in which changes in financial markets preceded credit expansion.
Brazil has already made important improvements in the sector and advances towards a more sophisticated financial market. In 2007, however, the volume of credit available was still small given the country’s housing needs: only 1% of GDP.
The growth projection for the housing market in the reference scenario forecasts a gradual reduction in interest rates and funding costs. Such improvements
will favor a major expansion of housing credit, which in 2030 will represent 4.7% of GDP, or R$ 290 billion in loans being extended that year. This means significant annual growth in this market, i.e. 11.2% per year, far outpacing overall economic growth of 4.0%.
Considering the socio-economic profile of investments, credit demand will be concentrated (approximately 46%) in brackets with average incomes between R$ 2,000 and R$ 8,000. In this sense, credit will have to undergo transformations so that it becomes a more universal instrument. Business opportunities will depend upon the capacity to differentiate products and, more importantly, by the flexibility of supply.
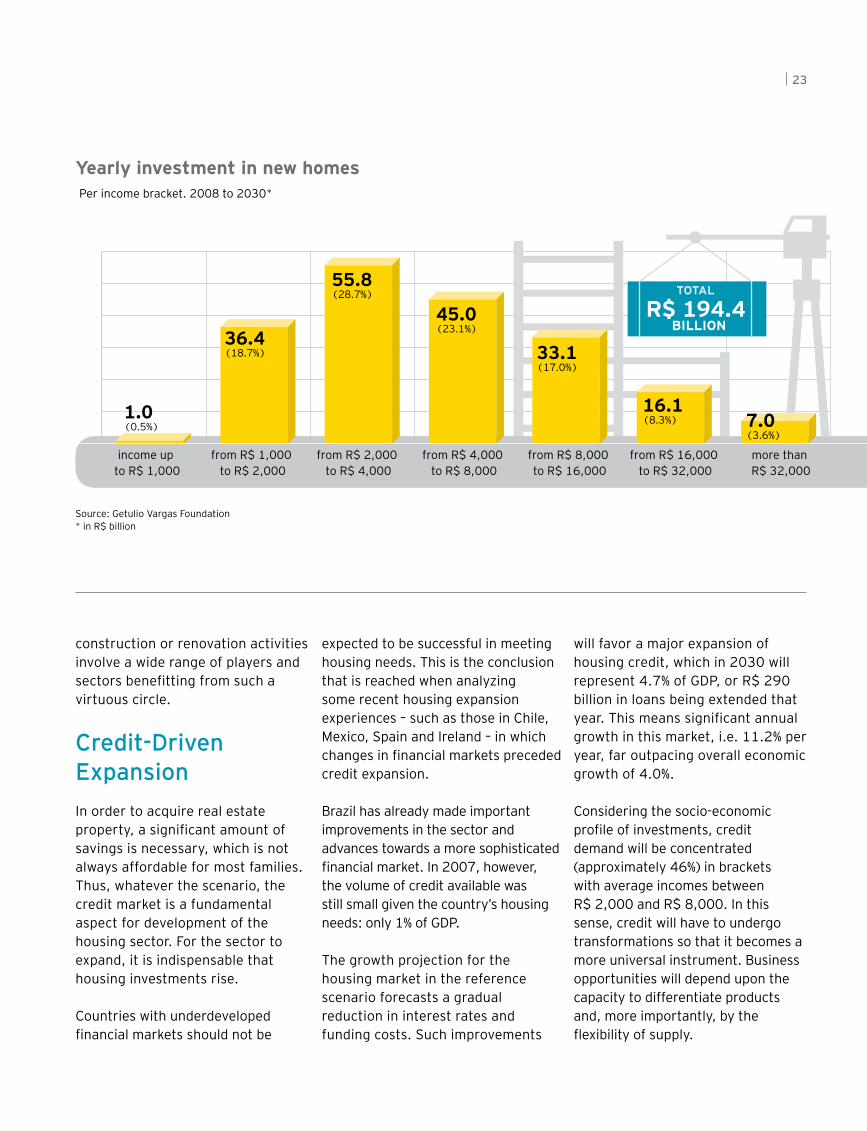
Source: Getulio Vargas Foundation* in R$ billion
Yearly investment in new homes
income up to R$ 1,000
from R$ 1,000 to R$ 2,000
from R$ 2,000 to R$ 4,000
from R$ 4,000 to R$ 8,000
from R$ 8,000 to R$ 16,000
from R$ 16,000 to R$ 32,000
more than R$ 32,000
55.8(28.7%)
45.0(23.1%)
33.1(17.0%)
16.1(8.3%) 7.0
(3.6%)
36.4(18.7%)
1.0(0.5%)
R$ 194.4 BILLION
TOTAL
Per income bracket. 2008 to 2030*

SUSTAINABLE BRAZIL HOUSING MARKET POTENTIAL24
The Construction Firms’ Market In the reference scenario, Brazilian housing stock will increase by R$ 4.6 trillion due to the construction and renovation of homes up to the year 2030. The yearly construction of 1.745 million new residences, necessary to cope with the increased number of families and to reduce the housing deficit, will bring about big business opportunities for construction companies and developers, with important effects on the development pace of these companies.
The effect on the pace and volume of business can be divided into two periods in which the socio-economic profile of family growth is different in each phase in regard to the distribution of investments between construction and renovation. From 2007 until 2017, the construction market will grow at a pace of 4.7% per year. During that period, the real estate market for low income families (up to R$ 2,000 p.a.) is the one that will grow most in absolute terms. It is a market that operates with amounts of between R$ 35,000 and R$ 70,000, at 2007 prices.
From 2017 on, the share of middle income brackets in housing investments will increase, which makes this group the main clientele by 2030. For such demand, developers and construction companies need to be prepared to offer properties between R$ 70,000 and R$ 150,000. This is clearly a new phase. The transformation will determine modifications in the
products offered, which will need to be more sophisticated, and also in the financing terms for real estate projects, since to the extent that the target market has more income available to it, the need for subsidized funds drops considerably while at the same time the demand for credits increases.
The improvement of the environment for the housing sector has led many companies to direct a substantial part of their business to serving families with medium and low incomes. The expectation of an end to the housing deficit by 2030, however, may lead to the devaluation of lower value properties. The scenario clearly shows that good opportunities for companies that work with the low income population will intensify until 2017 and will then be reduced from that time on. The changes from one period to the other will occur gradually, allowing companies to adjust their strategic planning to the new profile.
In any case, the highway leading up to 2030 in Brazil is marked by business expansion and, therefore, by turnover increase. In the reference scenario, this market will grow at an average rate of 3.9% per year, from the current R$ 99.8 billion to R$ 241.7 billion in 2030. The effect of this will be a marked expansion in employment opportunities in this field, with an expansion of 3.8% per year.
More Value Added in MaterialsBetween 2007 and 2030, the sales of construction material
industries will grow by approximately 4.8% per year under the reference scenario. Along with construction firms, manufacturers of materials will see a marked rise in sales in the period up until 2017. The growth of 5.3% will represent an additional turnover of almost R$ 95 billion, with sales of construction materials for residences jumping from R$ 69.2 billion to R$ 115.8 billion. The biggest slice of that demand increase will stem from the renovation market, accounting for R$ 55 billion.
In the following period, the sales growth rate will fall to 4.4% per year, but the additional turnover in that phase will be R$ 167.4 billion, of which R$ 65.7 billion will stem from construction activities and R$ 101.7 billion from renovation activities. This increase reflects the demand of higher purchasing power and, therefore, for products with higher added value.
In Brazil, a part of the demand for construction materials is directly supplied by the industry itself, but a more significant portion is sold by wholesale and retail companies. In particular, the wholesale network especially meets the demand of construction companies and the retail network supplies the market for maintenance projects, works performed by small entrepreneurs or through do-it-yourself construction. For the future, an increase is expected in direct sales and wholesale trade, which means that the turnover of the retail market will grow a little less than that of manufacturers, but will also be significant (tagged at 4.2% per year).
Project and editing management: Mitizy Olive Kupermann
Editorial coordination: Rejane Rodrigues (MTB 22.837)
Printing and design: Milena Tavares Teves
Infographs: Infografe
Revision: Beatriz Marchesini
Our offices
Getulio Vargas Foundation Team
Technical coordination and content development: FGV Projetos
Project director: César Cunha Campos
Supervisor: Ricardo Simonsen
Coordinator: Fernando Garcia (in charge of scenario model)
Technical staff: Edney Cielici Dias (editorial, research and editorial consulting), Ana Maria Castelo (real estate sector research), Otávio Mielnik (energy sector research), Robson Ribeiro Gonçalves (agribusiness research), Jorge de Oliveira Pires (industrial competitiveness research), Ana Lélia Magnabosco (research of indicators)
This is a publication of the Communication and Brand Management Department of Ernst & Young Terco Brazil.
São Paulo | SPCondomínio São LuizAv. Presidente Juscelino Kubitschek, 1.830 Torre I - 5º ao 10º e 13º andares, Torre II - 5º ao 7º e 10º andaresTorre III - 11º andarItaim Bibi - ZIP Code: 04543-900+55 11 2573 3000
Av. Das Nações Unidas, 12.995 13°, 14°, 15 e 16º andares Brooklin Novo - ZIP Code: 04578-000+55 11 3054 0000
Av. Maria Coelho Aguiar, 215 Bloco B - 4º Andar Jd São Luis - ZIP Code: 05804-900+55 11 2573 3000
Campinas | SPGalleria Corporate Av. Dr. Carlos Grimaldi, 1.701 - 3° andar 3A Fazenda São Quirino - ZIP Code: 13091-908+55 19 2117 6450
Rio de Janeiro | RJCentro Empresarial Botafogo Praia de Botafogo, 300 - 13º andarBotafogo - ZIP Code: 22250-040+55 21 2109 1400
Rua do Ouvidor, 88 - 6º andar Centro - ZIP Code: 20040-030+55 21 2222 3100
Praia de Botafogo, 228, Ala B - 13º andar Botafogo - ZIP Code: 22359-900+55 21 3736 9500
Belo Horizonte | MGEdifício Asamar R. Paraíba, 1.000 - 10° andarFuncionários - ZIP Code: 30130-141+55 31 3055 7750
Rua Bernardo Guimarães, 245 - 17º andar Funcionários - ZIP Code: 30140-080+55 31 3508 7200
Blumenau | SCEdifício California CenterR. Dr. Amadeu da Luz, 100 8° andar, conjunto 801 Centro ZIP Code: 89010-160+55 47 2123 7600
Brasília | DFEdifício Brasil 21 Setor Hoteleiro Sul - Quadra 06 conjunto A, bloco A - 1º andar - sala 105ZIP Code: 70316-106 +55 61 2104 0100
Goiânia | GOAv. República do Líbano, 1551 4º andar, sala 402 Setor Oeste - ZIP Code: 74125-125+55 62 3212 0210
Curitiba | PRCondomínio Centro Século XXIR. Visconde de Nacar, 1.440 - 14º andarCentro - ZIP Code: 80410-201 +55 41 3593 0700
Porto Alegre | RSCentro Empresarial Mostardeiro Av. Mostardeiro, 322 - 10º andarMoinhos de Vento - ZIP Code: 90430-000+55 51 2104 2050
Recife | PEEdifício Empresarial Center IIIR. Antônio Lumack do Monte, 128 - 14° andar Boa Viagem - ZIP Code: 51020-350+55 81 3092 8300
Salvador | BAEdifício Guimarães Trade Av. Tancredo Neves, 1.189 - 17° andar Pituba - ZIP Code: 41820-021+55 71 3496 3500
Rua da Alfazema, 761 - 2º andar Salas 201, 202 e 210 Caminho das Árvores - ZIP Code: 41820-710+55 71 2203 4350
25
Ernst & Young Terco
Assurance | Taxes | Transactions | Advisory Services | Middle Market | Government | Financial Services
About Ernst & Young
Ernst & Young is a global leader in assurance, tax, transaction and advisory services. Worldwide, our 144,000 people are united by our shared values and an unwavering commitment to quality. We make a difference by helping our people, our clients and our wider communities achieve their potential.
In Brazil, Ernst & Young Terco is the most complete company for advisory and assurance services in Brazil, boasting 3,500 professionals that support and serve over 3,400 large-, medium- and small-sized companies, 111 of which are listed on CVM (in June 2010) and are part of the special portfolio of the assurance team.
www.ey.com.br
© 2011 EYGM Limited. All Rights Reserved.
This is a publication of the Branding & Communication Department.
The full or partial reproduction of the contents of this publication is allowed provided the source is quoted.