Embed Size (px)
Citation preview
Epping Forest District
Local Plan Highway Impact Assessment
1
Technical Note 7 – Sustainable Accessibility Ranking, Mapping & Analysis
13th July 2016 – Final (Updated with additional / modified SLAA sites)
1. Introduction
A meeting was held at Epping Forest District Council (EFDC) offices on 9th December 2014 to
discuss the sustainable travel element of a transport evidence base for the District’s Local
Plan. A brief of work was subsequently drawn up to undertake the following:
• Rank the latest Strategic Land Availability Assessment (SLAA) development site locations
(as of July 2016) based on their level of sustainable accessibility
In total, 354 residential development sites were identified for inclusion in the assessment.
These sites comprised of developments in excess of 25 units. Smaller developments were
understood to be under consideration by the District Council but would not be modelled as
part of the study. Employment sites would be the subject of a separate study using a different
method of appraisal.
At a follow-up meeting held on the 17th February 2015, it was suggested that the results of
the sustainable accessibility work should then be considered alongside the earlier junction
capacity modelling (as reported in Technical Note 4 – June 2014). This would then present an
appraisal of Epping Forest District’s latest SLAA site allocation, taking into account
opportunities to reduce the impact of traffic growth via sustainable travel means.
This technical note is therefore presented in two parts. The first documents the methodology
used to rank the SLAA sites on sustainable accessibility, whilst the second reappraises the
future traffic impact on key junctions in the District with more focussed consideration of the
potential for adopting sustainable initiatives as a mitigating measure.
2. Part One: Sustainable Accessibility Ranking
This sustainability study develops on the accessibility planning work documented in Technical
Note 6 (TN6) – Dec 2014. Mapped datasets assembled for the earlier study have been utilised
again for this latest work. However, it should be pointed out that outputs contained within
TN6 have been superseded by this latest study following the significant increase in the
number of SLAA sites assessed, and an effort made to develop a more quantified
weighting/scoring system.
For ease of reference, a summary of findings is presented at the start of this section. This is
then followed by a detailed description of the methodology used in the development of the
ranking and scoring system.
EB500G
Epping Forest District
Local Plan Highway Impact Assessment
2
2.1 Summary of Findings
Complete ranked tables of 354 potential residential SLAA sites have been produced to
accompany this technical note. Site rankings have been based on the combined existing and
potential levels of sustainable accessibility at the SLAA site locations.
A summary of findings from the site ranking process is presented below.
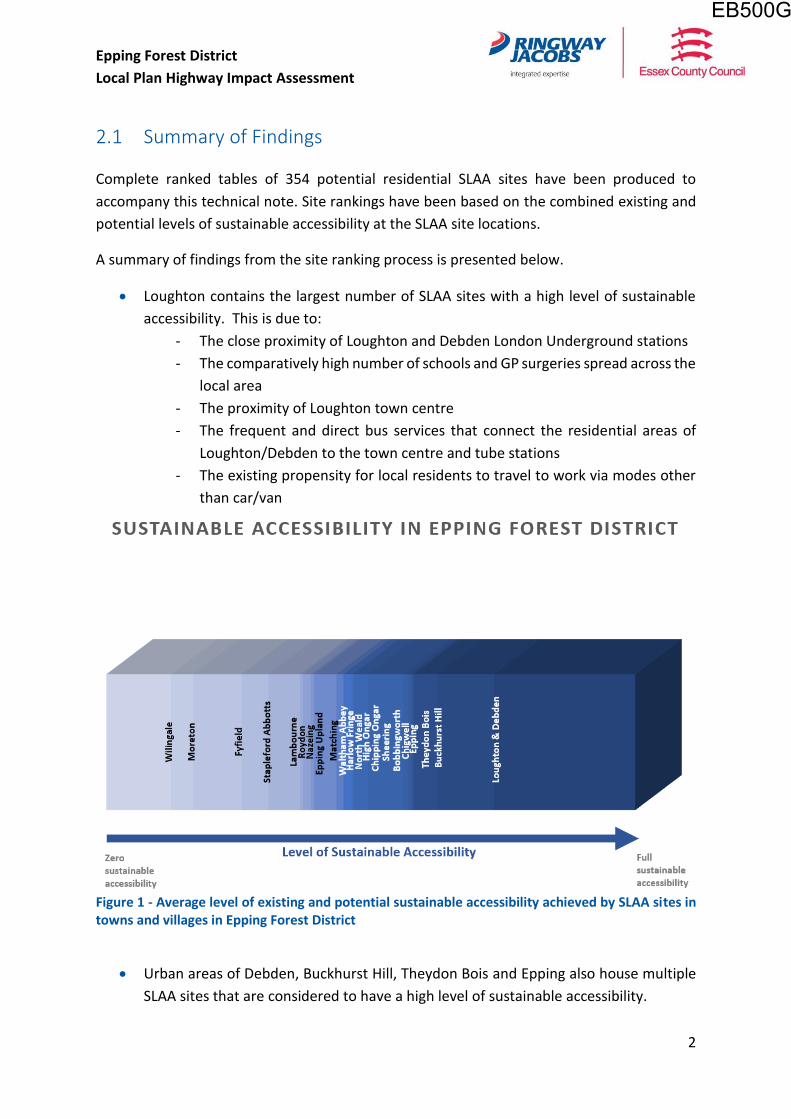
Loughton contains the largest number of SLAA sites with a high level of sustainable
accessibility. This is due to:
- The close proximity of Loughton and Debden London Underground stations
- The comparatively high number of schools and GP surgeries spread across the
local area
- The proximity of Loughton town centre
- The frequent and direct bus services that connect the residential areas of
Loughton/Debden to the town centre and tube stations
- The existing propensity for local residents to travel to work via modes other
than car/van
Figure 1 - Average level of existing and potential sustainable accessibility achieved by SLAA sites in towns and villages in Epping Forest District
Urban areas of Debden, Buckhurst Hill, Theydon Bois and Epping also house multiple
SLAA sites that are considered to have a high level of sustainable accessibility.
EB500G
Epping Forest District
Local Plan Highway Impact Assessment
3
With reference to Figure 1 above, these towns and suburbs, along with Chigwell and
Waltham Abbey both have good levels of sustainable access in place, but would likely
benefit from bus route extensions and/or improved walking and cycling links to realise
the potential for sustainable transport uptake.
SLAA sites located in towns and large villages in rural areas of Epping Forest District
might expect to have limited sustainable accessibility. These sites are likely to have
access to peak hour bus services, but may be located considerable distances from
town centres, rail/tube stations and secondary schools. Consequently, developments
on SLAA sites in these areas may still expect to generate car/van trip rates typical of a
rural location.
Of the towns and villages deemed to have a current limited level of sustainable
accessibility, Chipping Ongar and North Weald Bassett have the largest existing
populations to facilitate the provision of additional sustainable transport
infrastructure. In North Weald Bassett this could include a Park and Ride service to
Epping station, whilst improved bus services between Chipping Ongar and Brentwood
could be linked to wider Crossrail access.
SLAA sites located in small rural villages in Epping Forest District are shown in the study
to have the lowest level of sustainable accessibility. These include sites in: Willingdale,
Moreton, Fyfield and Stapleford Abbotts.
SLAA sites in these areas are likely to have low potential for encouraging uptake in
sustainable travel options given their location away from town centres, local services
and rail/tube stations. At the same time, the economic viability of providing better
sustainable travel infrastructure in these villages will be limited, given the comparative
sparseness of the rural population.
In this assessment a positive correlation was assumed between the quantum of
development at a proposed SLAA site and the potential for encouraging sustainable
travel uptake – either through improved bus services or targeted travel planning for
example. Discussions with Essex County Council’s Passenger Transport team
determined levels of development estimated in the region of 400-600 dwellings1 as
appropriate to facilitate provision of a new bus service.
All but one of five top ranked sites shown below for sustainable access potential have
large quantities of development proposed and score highly on the assumption that
better bus accessibility will be developed to accommodate potential demand. For this
1 Provision of a bus service would be dependent on site location both in regard to general services and the rest of the bus network, social mix, design of the development etc. Isolated developments in rural areas would be less likely to sustain a service than those on the edge of town. It should also be noted that a small development (20 to 30 houses) could support a change to an existing bus service (i.e. looping through the estate and re-joining the existing route) if required resources were limited to kick-starting and marketing/publicity for example.
EB500G
Epping Forest District
Local Plan Highway Impact Assessment
4
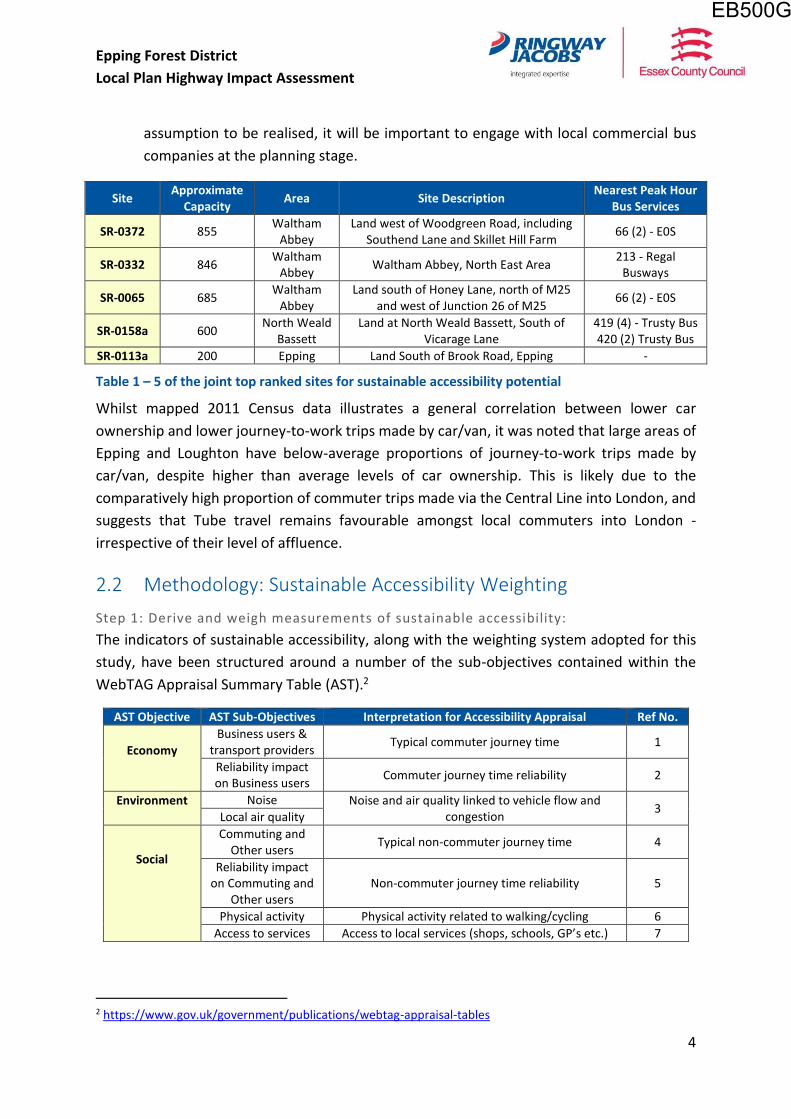
assumption to be realised, it will be important to engage with local commercial bus
companies at the planning stage.
Site Approximate
Capacity Area Site Description
Nearest Peak Hour Bus Services
SR-0372 855 Waltham
Abbey Land west of Woodgreen Road, including
Southend Lane and Skillet Hill Farm 66 (2) - E0S
SR-0332 846 Waltham
Abbey Waltham Abbey, North East Area
213 - Regal Busways
SR-0065 685 Waltham
Abbey Land south of Honey Lane, north of M25
and west of Junction 26 of M25 66 (2) - E0S
SR-0158a 600 North Weald
Bassett Land at North Weald Bassett, South of
Vicarage Lane 419 (4) - Trusty Bus 420 (2) Trusty Bus
SR-0113a 200 Epping Land South of Brook Road, Epping -
Table 1 – 5 of the joint top ranked sites for sustainable accessibility potential
Whilst mapped 2011 Census data illustrates a general correlation between lower car
ownership and lower journey-to-work trips made by car/van, it was noted that large areas of
Epping and Loughton have below-average proportions of journey-to-work trips made by
car/van, despite higher than average levels of car ownership. This is likely due to the
comparatively high proportion of commuter trips made via the Central Line into London, and
suggests that Tube travel remains favourable amongst local commuters into London -
irrespective of their level of affluence.
2.2 Methodology: Sustainable Accessibility Weighting
Step 1: Derive and weigh measurements of sustainable accessibility:
The indicators of sustainable accessibility, along with the weighting system adopted for this
study, have been structured around a number of the sub-objectives contained within the
WebTAG Appraisal Summary Table (AST).2
2 https://www.gov.uk/government/publications/webtag-appraisal-tables
AST Objective AST Sub-Objectives Interpretation for Accessibility Appraisal Ref No.
Economy
Business users & transport providers
Typical commuter journey time 1
Reliability impact on Business users
Commuter journey time reliability 2
Environment
Noise Noise and air quality linked to vehicle flow and congestion
3 Local air quality
Social
Commuting and Other users
Typical non-commuter journey time 4
Reliability impact on Commuting and
Other users Non-commuter journey time reliability 5
Physical activity Physical activity related to walking/cycling 6
Access to services Access to local services (shops, schools, GP’s etc.) 7
EB500G
Epping Forest District
Local Plan Highway Impact Assessment
5
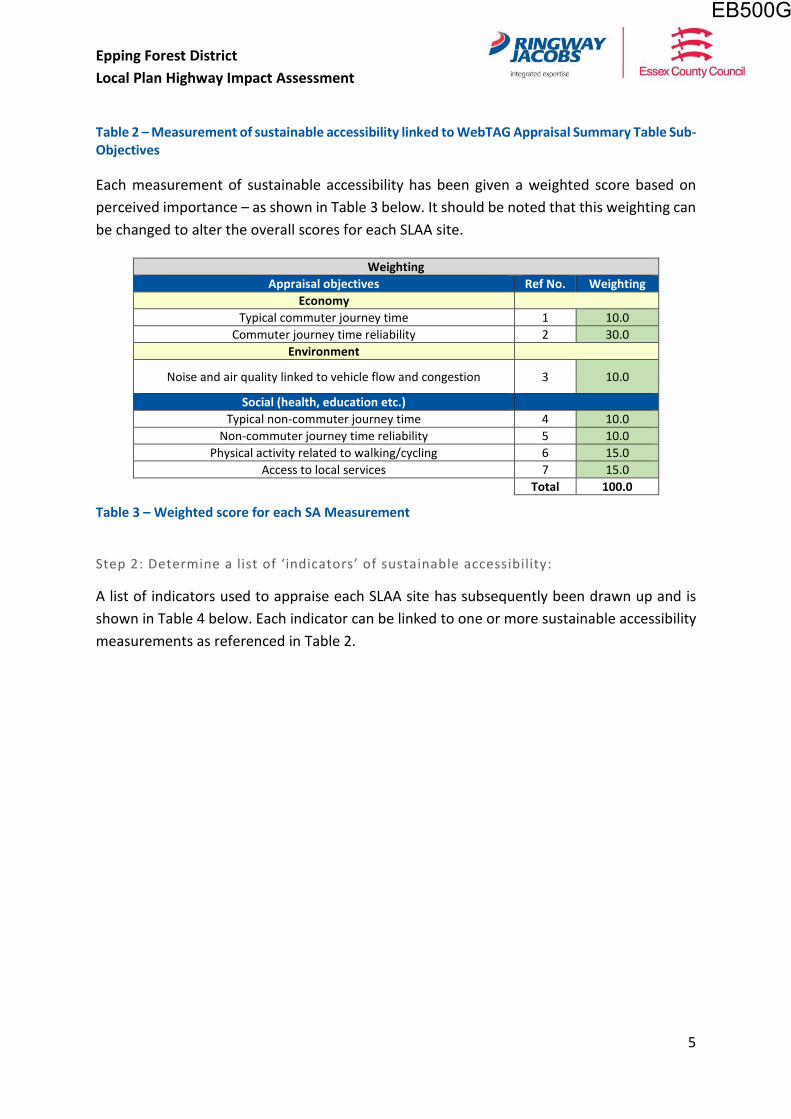
Table 2 – Measurement of sustainable accessibility linked to WebTAG Appraisal Summary Table Sub-Objectives
Each measurement of sustainable accessibility has been given a weighted score based on
perceived importance – as shown in Table 3 below. It should be noted that this weighting can
be changed to alter the overall scores for each SLAA site.
Weighting
Appraisal objectives Ref No. Weighting
Economy
Typical commuter journey time 1 10.0
Commuter journey time reliability 2 30.0
Environment
Noise and air quality linked to vehicle flow and congestion 3 10.0
Social (health, education etc.)
Typical non-commuter journey time 4 10.0
Non-commuter journey time reliability 5 10.0
Physical activity related to walking/cycling 6 15.0
Access to local services 7 15.0
Total 100.0
Table 3 – Weighted score for each SA Measurement
Step 2: Determine a list of ‘indicators’ of sustainable accessibility:
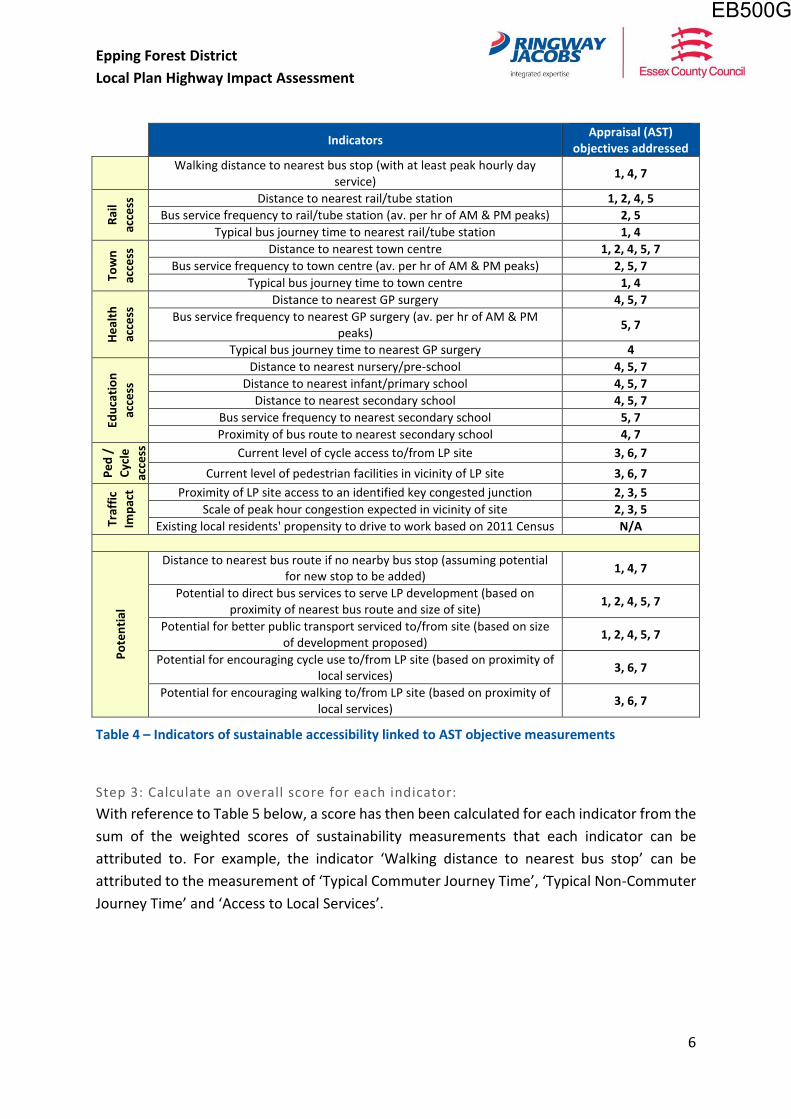
A list of indicators used to appraise each SLAA site has subsequently been drawn up and is
shown in Table 4 below. Each indicator can be linked to one or more sustainable accessibility
measurements as referenced in Table 2.
EB500G
Epping Forest District
Local Plan Highway Impact Assessment
6
Indicators Appraisal (AST)
objectives addressed
Walking distance to nearest bus stop (with at least peak hourly day
service) 1, 4, 7
Rai
l
acce
ss Distance to nearest rail/tube station 1, 2, 4, 5
Bus service frequency to rail/tube station (av. per hr of AM & PM peaks) 2, 5
Typical bus journey time to nearest rail/tube station 1, 4
Tow
n
acce
ss Distance to nearest town centre 1, 2, 4, 5, 7
Bus service frequency to town centre (av. per hr of AM & PM peaks) 2, 5, 7
Typical bus journey time to town centre 1, 4
He
alth
acce
ss Distance to nearest GP surgery 4, 5, 7
Bus service frequency to nearest GP surgery (av. per hr of AM & PM peaks)
5, 7
Typical bus journey time to nearest GP surgery 4
Edu
cati
on
acce
ss
Distance to nearest nursery/pre-school 4, 5, 7
Distance to nearest infant/primary school 4, 5, 7
Distance to nearest secondary school 4, 5, 7
Bus service frequency to nearest secondary school 5, 7
Proximity of bus route to nearest secondary school 4, 7
Pe
d /
Cyc
le
acce
ss
Current level of cycle access to/from LP site 3, 6, 7
Current level of pedestrian facilities in vicinity of LP site 3, 6, 7
Traf
fic
Imp
act Proximity of LP site access to an identified key congested junction 2, 3, 5
Scale of peak hour congestion expected in vicinity of site 2, 3, 5
Existing local residents' propensity to drive to work based on 2011 Census N/A
Po
ten
tial
Distance to nearest bus route if no nearby bus stop (assuming potential for new stop to be added)
1, 4, 7
Potential to direct bus services to serve LP development (based on proximity of nearest bus route and size of site)
1, 2, 4, 5, 7
Potential for better public transport serviced to/from site (based on size of development proposed)
1, 2, 4, 5, 7
Potential for encouraging cycle use to/from LP site (based on proximity of local services)
3, 6, 7
Potential for encouraging walking to/from LP site (based on proximity of local services)
3, 6, 7
Table 4 – Indicators of sustainable accessibility linked to AST objective measurements
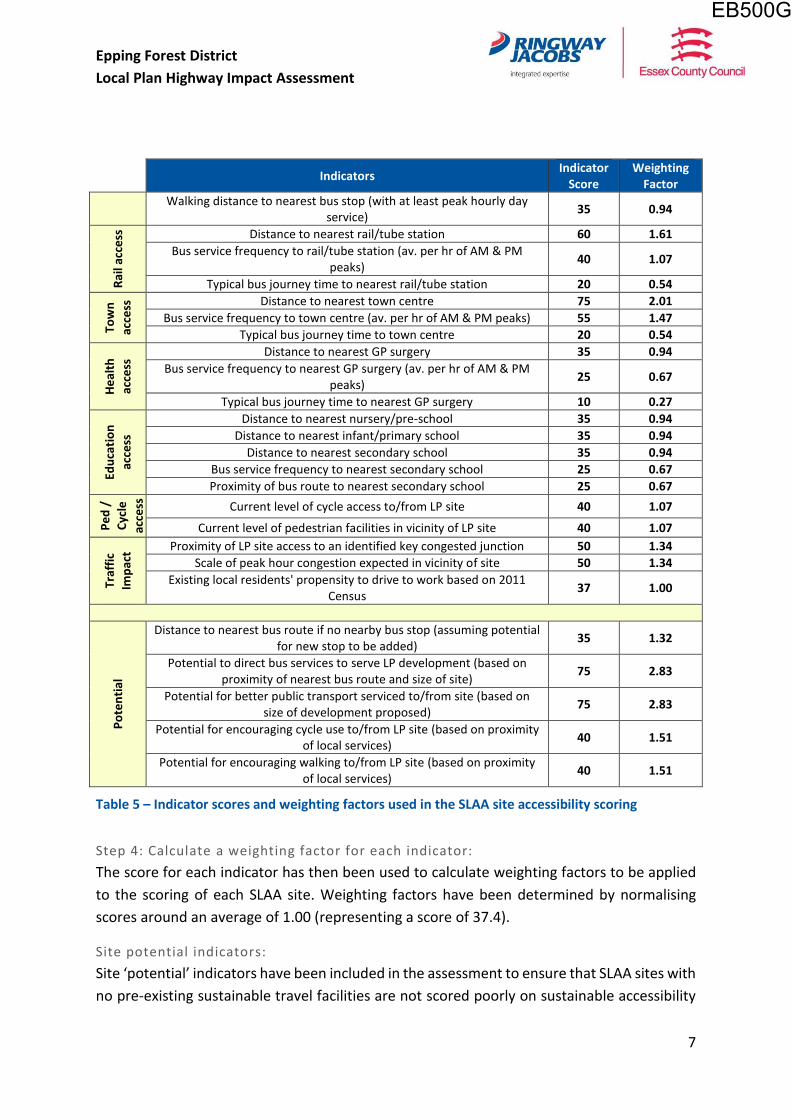
Step 3: Calculate an overall score for each indicator:
With reference to Table 5 below, a score has then been calculated for each indicator from the
sum of the weighted scores of sustainability measurements that each indicator can be
attributed to. For example, the indicator ‘Walking distance to nearest bus stop’ can be
attributed to the measurement of ‘Typical Commuter Journey Time’, ‘Typical Non-Commuter
Journey Time’ and ‘Access to Local Services’.
EB500G
Epping Forest District
Local Plan Highway Impact Assessment
7
Indicators Indicator
Score Weighting
Factor
Walking distance to nearest bus stop (with at least peak hourly day
service) 35 0.94
Rai
l acc
ess
Distance to nearest rail/tube station 60 1.61
Bus service frequency to rail/tube station (av. per hr of AM & PM peaks)
40 1.07
Typical bus journey time to nearest rail/tube station 20 0.54
Tow
n
acce
ss Distance to nearest town centre 75 2.01
Bus service frequency to town centre (av. per hr of AM & PM peaks) 55 1.47
Typical bus journey time to town centre 20 0.54
He
alth
acce
ss Distance to nearest GP surgery 35 0.94
Bus service frequency to nearest GP surgery (av. per hr of AM & PM peaks)
25 0.67
Typical bus journey time to nearest GP surgery 10 0.27
Edu
cati
on
acce
ss
Distance to nearest nursery/pre-school 35 0.94
Distance to nearest infant/primary school 35 0.94
Distance to nearest secondary school 35 0.94
Bus service frequency to nearest secondary school 25 0.67
Proximity of bus route to nearest secondary school 25 0.67
Pe
d /
Cyc
le
acce
ss
Current level of cycle access to/from LP site 40 1.07
Current level of pedestrian facilities in vicinity of LP site 40 1.07
Traf
fic
Imp
act Proximity of LP site access to an identified key congested junction 50 1.34
Scale of peak hour congestion expected in vicinity of site 50 1.34
Existing local residents' propensity to drive to work based on 2011 Census
37 1.00
Po
ten
tial
Distance to nearest bus route if no nearby bus stop (assuming potential for new stop to be added)
35 1.32
Potential to direct bus services to serve LP development (based on proximity of nearest bus route and size of site)
75 2.83
Potential for better public transport serviced to/from site (based on size of development proposed)
75 2.83
Potential for encouraging cycle use to/from LP site (based on proximity of local services)
40 1.51
Potential for encouraging walking to/from LP site (based on proximity of local services)
40 1.51
Table 5 – Indicator scores and weighting factors used in the SLAA site accessibility scoring
Step 4: Calculate a weighting factor for each indicator:
The score for each indicator has then been used to calculate weighting factors to be applied
to the scoring of each SLAA site. Weighting factors have been determined by normalising
scores around an average of 1.00 (representing a score of 37.4).
Site potential indicators:
Site ‘potential’ indicators have been included in the assessment to ensure that SLAA sites with
no pre-existing sustainable travel facilities are not scored poorly on sustainable accessibility
EB500G
Epping Forest District
Local Plan Highway Impact Assessment
8
if there is a possibility that such developments, once built, would facilitate the provision
and/or encourage the uptake of sustainable travel modes.
Weighting factors have been calculated separately for the five site ‘potential’ indicators and
the resultant values have been doubled to help provide a better balance to the scoring
system. Through iterative testing of the weighting system, a double weighting applied to
these indicators was shown to offer the best means of redressing subsequent poor scores in
the evaluation of existing sustainable accessibility.
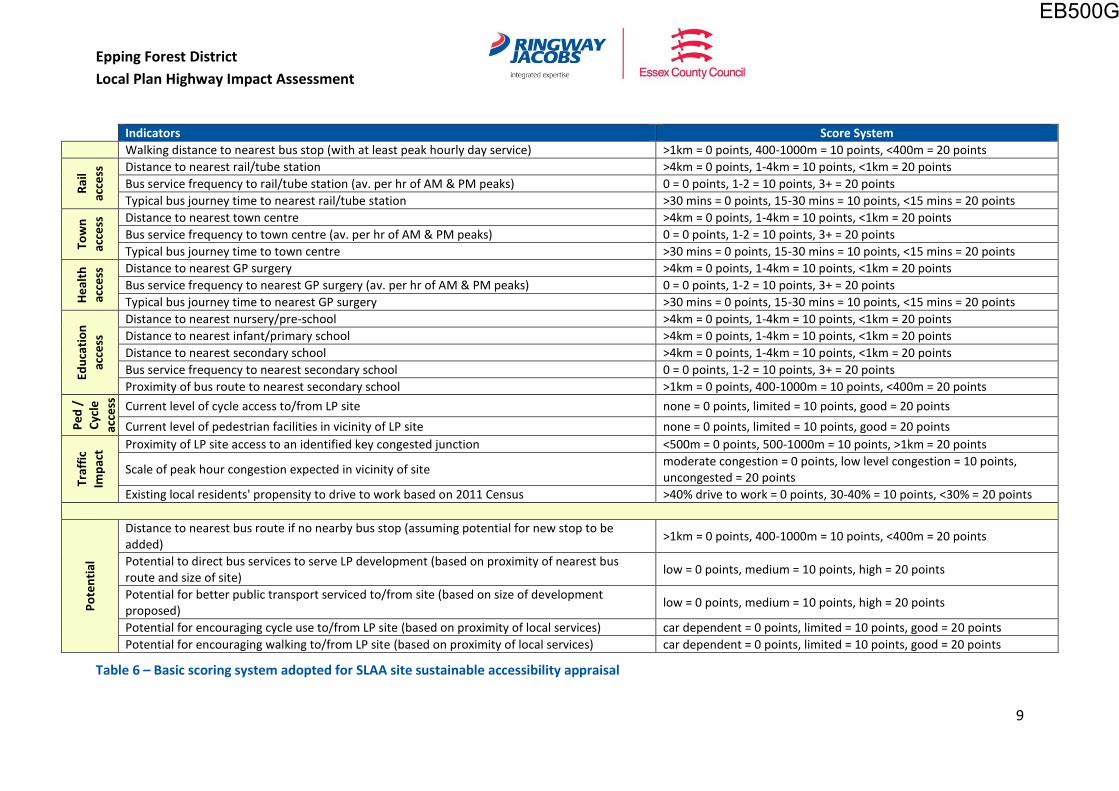
2.3 Methodology: Sustainable Accessibility Scoring
Each SLAA site has been scored under the 25 sustainable accessibility indicators listed in Table
5 above. The basic scoring system assigns 0, 10, or 20 points under each indicator based on
the criteria outlined in Table 6 below.
EB500G
Epping Forest District
Local Plan Highway Impact Assessment
9
Indicators Score System
Walking distance to nearest bus stop (with at least peak hourly day service) >1km = 0 points, 400-1000m = 10 points, <400m = 20 points
Rai
l
acce
ss Distance to nearest rail/tube station >4km = 0 points, 1-4km = 10 points, <1km = 20 points
Bus service frequency to rail/tube station (av. per hr of AM & PM peaks) 0 = 0 points, 1-2 = 10 points, 3+ = 20 points
Typical bus journey time to nearest rail/tube station >30 mins = 0 points, 15-30 mins = 10 points, <15 mins = 20 points
Tow
n
acce
ss Distance to nearest town centre >4km = 0 points, 1-4km = 10 points, <1km = 20 points
Bus service frequency to town centre (av. per hr of AM & PM peaks) 0 = 0 points, 1-2 = 10 points, 3+ = 20 points
Typical bus journey time to town centre >30 mins = 0 points, 15-30 mins = 10 points, <15 mins = 20 points
He
alth
acce
ss Distance to nearest GP surgery >4km = 0 points, 1-4km = 10 points, <1km = 20 points
Bus service frequency to nearest GP surgery (av. per hr of AM & PM peaks) 0 = 0 points, 1-2 = 10 points, 3+ = 20 points
Typical bus journey time to nearest GP surgery >30 mins = 0 points, 15-30 mins = 10 points, <15 mins = 20 points
Edu
cati
on
acce
ss
Distance to nearest nursery/pre-school >4km = 0 points, 1-4km = 10 points, <1km = 20 points
Distance to nearest infant/primary school >4km = 0 points, 1-4km = 10 points, <1km = 20 points
Distance to nearest secondary school >4km = 0 points, 1-4km = 10 points, <1km = 20 points
Bus service frequency to nearest secondary school 0 = 0 points, 1-2 = 10 points, 3+ = 20 points
Proximity of bus route to nearest secondary school >1km = 0 points, 400-1000m = 10 points, <400m = 20 points
Pe
d /
Cyc
le
acce
ss
Current level of cycle access to/from LP site none = 0 points, limited = 10 points, good = 20 points
Current level of pedestrian facilities in vicinity of LP site none = 0 points, limited = 10 points, good = 20 points
Traf
fic
Imp
act Proximity of LP site access to an identified key congested junction <500m = 0 points, 500-1000m = 10 points, >1km = 20 points
Scale of peak hour congestion expected in vicinity of site moderate congestion = 0 points, low level congestion = 10 points, uncongested = 20 points
Existing local residents' propensity to drive to work based on 2011 Census >40% drive to work = 0 points, 30-40% = 10 points, <30% = 20 points
Po
ten
tial
Distance to nearest bus route if no nearby bus stop (assuming potential for new stop to be added)
>1km = 0 points, 400-1000m = 10 points, <400m = 20 points
Potential to direct bus services to serve LP development (based on proximity of nearest bus route and size of site)
low = 0 points, medium = 10 points, high = 20 points
Potential for better public transport serviced to/from site (based on size of development proposed)
low = 0 points, medium = 10 points, high = 20 points
Potential for encouraging cycle use to/from LP site (based on proximity of local services) car dependent = 0 points, limited = 10 points, good = 20 points
Potential for encouraging walking to/from LP site (based on proximity of local services) car dependent = 0 points, limited = 10 points, good = 20 points
Table 6 – Basic scoring system adopted for SLAA site sustainable accessibility appraisal
EB500G
Epping Forest District
Local Plan Highway Impact Assessment
10
Where applicable, the scoring system has incorporated DfT guidelines3 for acceptable walking
and cycling distances as follows:
Acceptable Walking Distance - 1km (0.6 miles)
Acceptable Cycling Distance - 4km (2.4 miles)
A review of similar sustainable accessibility studies determined an acceptable bus journey
time for commuters to be typically around 30 minutes. This figure has therefore been used to
define the scoring system for bus journey time indicators.
Indicators covering the existing level of cycling and pedestrian provision are more subjective,
and have been largely scored on the location of established cycle routes and pedestrian
crossing facilities in close proximity to the SLAA sites.
Traffic impact indicators:
For the purposes of this study, the location of SLAA sites close to areas of network congestion
has been deemed a negative indicator of sustainability due to the concentration of additional
development traffic in areas that are more likely to be sensitive to noise and local air quality.
There is however, an argument to suggest that the presence of network congestion could
encourage greater use of sustainable modes of travel, and could therefore be viewed as a
positive indicator of sustainability. This is indirectly acknowledged when scoring the potential
for development sites in urban areas to encourage cycling and walking modes.
2011 Census data:
In order to better understand the propensity to drive amongst residents in Epping Forest
District, 2011 Census data was used to provide analysis of the proportion of journeys to work
made by car or van, as well as to determine the level of car ownership in the District. The
journey-to-work analysis has been used as an indicator for site appraisal – on the assumption
that, without intervention, it might be reasonable to expect future residents to adopt similar
travel patterns to those of the current local population.
Although not used in the site appraisal scoring, Census car ownership data has been included
in this study as a means of identifying areas within town centres where car ownership is
proportionally lower than in surrounding areas. It is understood that SLAA site location in
these areas could encourage lower trip rates - assuming a similar development make-up to
that existing.
3 DfT LTN 1/04 3.10.13 – acceptable walking limits
EB500G
Epping Forest District
Local Plan Highway Impact Assessment
11
A mapping analysis tool provided on the Datashine website4 has been used to illustrate the
patterns of car use and ownership in Epping Forest District. Screenshots for each town in the
District are provided in the appendices of this technical note.
Connecting the indicators:
There is an inherent difficulty in determining a combined score and then subsequently ranking
SLAA sites based on a set of 25 indicators. This is because to do so requires all indicators to
form a balanced appraisal that does not introduce bias towards one particular aspect of
sustainability, or illogically penalise a site where certain indicators are not as applicable.
To best derive a fair scoring assessment, the following assumptions have been adopted:
Existing Accessibility
1) Sites that are located within a 1km walking distance of a town centre / rail station /
GP surgery / secondary school have not be penalised for having a limited bus service,
since the maximum acceptable walking distance to a bus stop has already been set at
1km. Therefore, irrespective of the quality of bus service, sites within walking distance
have been allocated a maximum score for the associated bus service frequency
indicator.
2) Sites that are not considered to be within walking distance of the nearest bus stop,
are therefore considered inaccessible by bus. Consequently, such sites receive no
score for those indicators related to bus frequency and journey time.
This places additional emphasis on ensuring sufficient points can be ‘recovered’ for
sites with the potential for developing better public transport links, and helps to justify
the double weighting applied to such indicators.
Potential Accessibility
3) Sites that are within an acceptable walking distance (1km) of both a town centre and
rail/tube station are considered to have the demand potential to encourage walking
trips, and therefore score maximum points for this indicator. This is regardless of the
existing infrastructure in the area to accommodate pedestrians.
4) Sites that are within an acceptable cycling distance (4km) of both a town centre and
rail/tube station (but not within walking distance of both) are considered to have the
demand potential to encourage cycle use, and therefore score maximum points for
this indicator. Again, this is irrespective of the existing infrastructure in the area to
support cycling uptake.
4 http://datashine.org.uk/
EB500G
Epping Forest District
Local Plan Highway Impact Assessment
12
5) Sites located within walking distance of a town centre and rail station – where there
is an available choice of sustainable travel mode - are assumed likely to have a bias
towards walking over cycling as a preference. Subsequently, these sites score a
maximum of ‘10’ points for cycling potential.
2.4 Methodology: Data Sources
Mapped Data:
This latest study utilises existing mapped datasets compiled for the earlier accessibility
planning work documented in Technical Note 6 (TN6) - Dec 2014.
The following data was mapped to present an overview of the location of potential Local Plan
development sites in the district and their proximity to public services and the sustainable
transport network (walking, cycling, bus and rail):
SLAA July 2016 Local Plan development site areas
The bus network, bus stop locations and service frequencies (thematically mapped)
- Weekday (Wednesday): 0700-0800, 0800-0900, 1700-1800, 1800-1900
- Saturday: 1300-1400
The National Rail and London Underground network and station locations
The National Cycle Network and local cycle network (Harlow)
Location of nursery, infant/primary/secondary schools
Location of GP surgeries
SLAA 2016 Local Plan development data and location mapping layers were obtained from
ARUP in July 2016. In total, 354 residential development sites were included for assessment.
These sites comprised developments in excess of 25 residential units. Additional smaller sites
are under consideration by the District Council but are not modelled as part of this study.
As reported in TN6: June 2014 service frequency data across the district’s bus route network
was obtained from Essex County Council’s Passenger Transport team. The data is link-based
and covers two-way bus service frequencies per hour surveyed across 7 consecutive days.
The location of bus stops in Epping Forest District was determined using a 2014 National
Public Transport Access Nodes (NaPTAN) dataset obtained from the data.gov.uk website:
http://data.gov.uk/dataset/naptan
Where available, nursery/school/GP data used in the accessibility mapping was initially
extracted from an Essex Highways 2008 database built for use with previous transport studies.
EB500G
Epping Forest District
Local Plan Highway Impact Assessment
13
The data was then cross-referenced and updated where necessary using up-to-date 2014
datasets from the following sources:
Nursery schools and day care centres in Epping Forest District - Used 2014 directory
taken from the daynurseries.co.uk website: http://www.daynurseries.co.uk
Infant and Junior schools (non-private) in Epping Forest District – Existing 2008 data
updated using October 2014 information provided on the Schools Web Directory
website: http://www.schoolswebdirectory.co.uk
Secondary schools (non-private) in Epping Forest District – Existing 2008 data updated
using October 2014 information provided on the Schools Web Directory website:
http://www.schoolswebdirectory.co.uk
GP surgeries (non-private) in Epping Forest District – using August 2014 database
taken from the Health & Social Care Information Centre website:
http://systems.hscic.gov.uk/data/ods/datadownloads/index
Separate peak hour congestion plots were also referenced in order to identify the levels of
peak hour congestion present in the vicinity of the SLAA sites. These congestion plots derive
from 2014/15 TrafficMaster journey time data for a neutral month period and display the
percentage of the free-flow speed achieved on the main roads in Essex in the peak hours.
Reference Web Sites:
In addition to the mapped data, web-based information was used to assist the sustainable
accessibility scoring of each SLAA site, as follows:
Google Maps “Get Directions” – Used to determine frequency of bus services and
journey times specifically between SLAA sites and services/amenities
http://datashine.org.uk/ - Used to determine the proportion of Census 2011 journey-
to-work trips per output area made by car/van; and the level of car ownership per
2011 Census output area
EB500G
Epping Forest District
Local Plan Highway Impact Assessment
14
3. Part Two: Re-appraisal of key junctions in Epping Forest District – linked
to the consideration of sustainable mitigation measures
This section of the study re-evaluates the impact of traffic growth on key junctions in Epping
Forest District with the aim of determining the level of unmet future demand at congested
junctions. This revised approach to junction appraisal utilises the same model outputs as
those used to determine flow-capacity ratios in earlier studies. However, through
consideration of unmet demand, it has been possible to determine the extent to which
sustainable measures could help accommodate excess demand – and thus address capacity
shortfalls at junctions.
This study subsequently highlights existing and potential sustainable measures that could
accommodate demand surplus as a short/medium-term alternative to junction infrastructure
improvements. The reappraisal is qualitative in nature and is only intended to provide a broad
evaluation of the extent of sustainable measures potentially required to accommodate unmet
demand.
3.1 Summary of Findings:
Results of the capacity appraisal show that the assessed junctions in Epping Forest
District fall into four main categories:
1) Those that have no excess demand in the future year
2) Those that generate excess demand through the introduction of Local Plan
development traffic on top of background traffic
3) Those that generate excess demand through the growth in background
traffic alone
4) Those that already generate excess demand in the current day
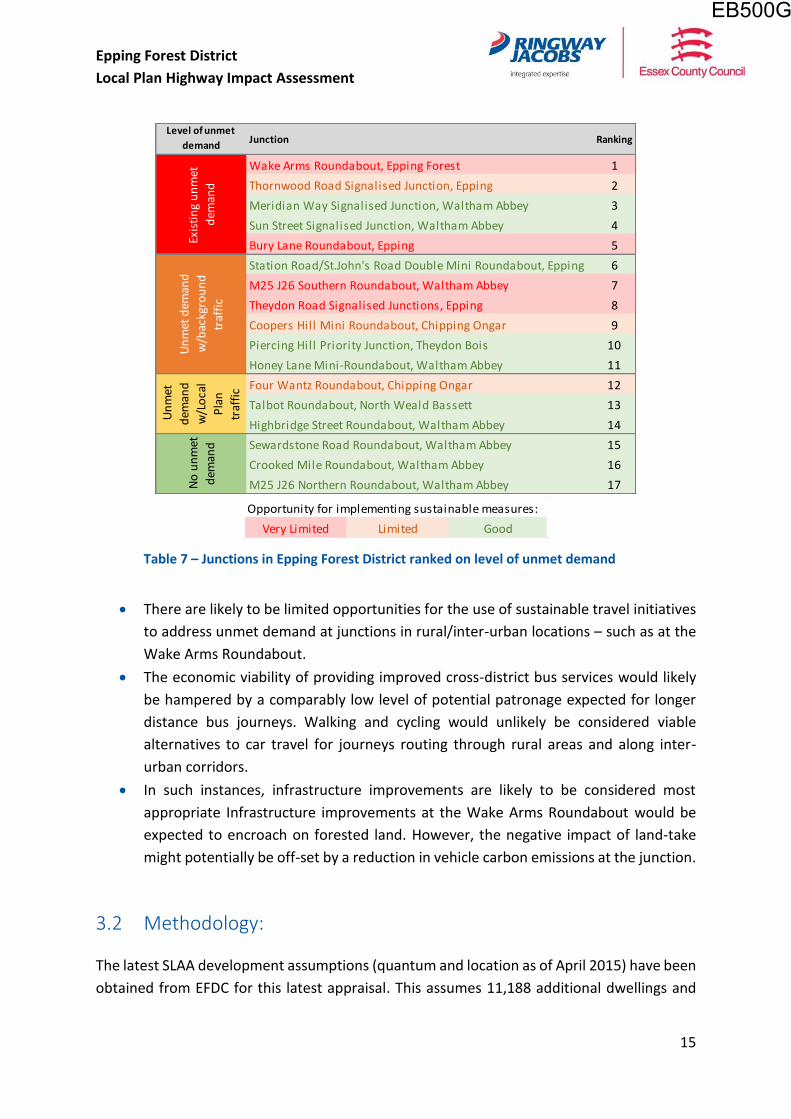
Table 7 below lists the junctions in Epping Forest District ranked by the level of unmet
demand modelled at each. At the same time, junctions are colour coded based on the
level of opportunity considered possible for implementing sustainable measures to
accommodate unmet demand.
EB500G
Epping Forest District
Local Plan Highway Impact Assessment
15
Table 7 – Junctions in Epping Forest District ranked on level of unmet demand
There are likely to be limited opportunities for the use of sustainable travel initiatives
to address unmet demand at junctions in rural/inter-urban locations – such as at the
Wake Arms Roundabout.
The economic viability of providing improved cross-district bus services would likely
be hampered by a comparably low level of potential patronage expected for longer
distance bus journeys. Walking and cycling would unlikely be considered viable
alternatives to car travel for journeys routing through rural areas and along inter-
urban corridors.
In such instances, infrastructure improvements are likely to be considered most
appropriate Infrastructure improvements at the Wake Arms Roundabout would be
expected to encroach on forested land. However, the negative impact of land-take
might potentially be off-set by a reduction in vehicle carbon emissions at the junction.
3.2 Methodology:
The latest SLAA development assumptions (quantum and location as of April 2015) have been
obtained from EFDC for this latest appraisal. This assumes 11,188 additional dwellings and
Level of unmet
demandJunction Ranking
Wake Arms Roundabout, Epping Forest 1
Thornwood Road Signalised Junction, Epping 2
Meridian Way Signalised Junction, Waltham Abbey 3
Sun Street Signalised Junction, Waltham Abbey 4
Bury Lane Roundabout, Epping 5
Station Road/St.John's Road Double Mini Roundabout, Epping 6
M25 J26 Southern Roundabout, Waltham Abbey 7
Theydon Road Signalised Junctions, Epping 8
Coopers Hill Mini Roundabout, Chipping Ongar 9
Piercing Hill Priority Junction, Theydon Bois 10
Honey Lane Mini-Roundabout, Waltham Abbey 11
Four Wantz Roundabout, Chipping Ongar 12
Talbot Roundabout, North Weald Bassett 13
Highbridge Street Roundabout, Waltham Abbey 14
Sewardstone Road Roundabout, Waltham Abbey 15
Crooked Mile Roundabout, Waltham Abbey 16
M25 J26 Northern Roundabout, Waltham Abbey 17
Exis
tin
g u
nm
et
dem
and
Un
met
dem
and
w/b
ackg
rou
nd
traf
fic
Un
met
dem
and
w/L
oca
l
Pla
n
traf
fic
No
un
met
dem
and
Opportunity for implementing sustainable measures:
Very Limited Limited Good
EB500G
Epping Forest District
Local Plan Highway Impact Assessment
16
425,800m2 of employment sites in the district up to the forecast year 20365. It is envisaged
that sensitivity testing with different housing figures will be carried out at a later stage of the
appraisal process.
A list of the April 2015 SLAA sites modelled can be found in the appendices of this technical
note.
Unmet demand has been calculated from existing junction model outputs produced for the
earlier forecast capacity modelling. 2036 forecast year assessments were not undertaken
previously on account of the significant congestion already modelled by 2026. This reappraisal
will therefore only consider the 2026 forecast year – with half the quota of development
stated.
Specific model outputs used in the calculation are as follows:
Total Demand (PCU/hr) - Capacity (PCU/hr) = Unmet Demand (PCU/hr)
Demand and capacity values have been taken from the busiest quarter hour period of both
AM and PM peak hours.
Interpretation of Results / Caveats:
It is acknowledged that the development scenario used in this assessment may change
during the ongoing development of the Local Plan. Reported outputs are
representative of this development allocation and should therefore only be
considered indicative of the scale of unmet demand that might be expected at the
various junctions under assessment with similar levels of development.
As has been the case throughout the Local Plan appraisal, the future-year junction
modelling utilises flows from a fixed demand spreadsheet model. Modelled outputs
are therefore indicative of a robust scenario where all demand flows are assigned
through the assessed junctions.
In reality however, it might be expected that drivers will avoid congestion by travelling
along different routes or travelling outside the peak hours. In effect, the unmet
demand at a junction represents the demand that cannot be accommodated during
the peak hour assessment period.
5 Numbers taken from a SLAA site list submitted by EFDC in March 2015 for testing with the Harlow VISUM model.
EB500G
Epping Forest District
Local Plan Highway Impact Assessment
17
3.3 Results
The following tables highlight the unmet demand modelled at the key assessed junctions in
Epping Forest District in 2026 with development traffic. For the purpose of analysis, unmet
demand has been disaggregated so that the quantity generated by each of the following can
be identified:
2013 base flows
Background growth to 2026
Development traffic (50% to 2026)
By disaggregating unmet demand, it is possible to determine the main contributor towards
peak hour congestion at junctions and then formulate an appropriate mitigation measure to
address growth in unmet demand.
For example, excess demand made up primarily of development traffic could be addressed
by revising housing allocation numbers, relocating sites, or focussing travel plans on new
developments; whereas excess demand made up of existing traffic flows or background
growth would need to be addressed by improving access to public transport services and/or
local infrastructure improvements.
EB500G
Epping Forest District
Local Plan Highway Impact Assessment
18
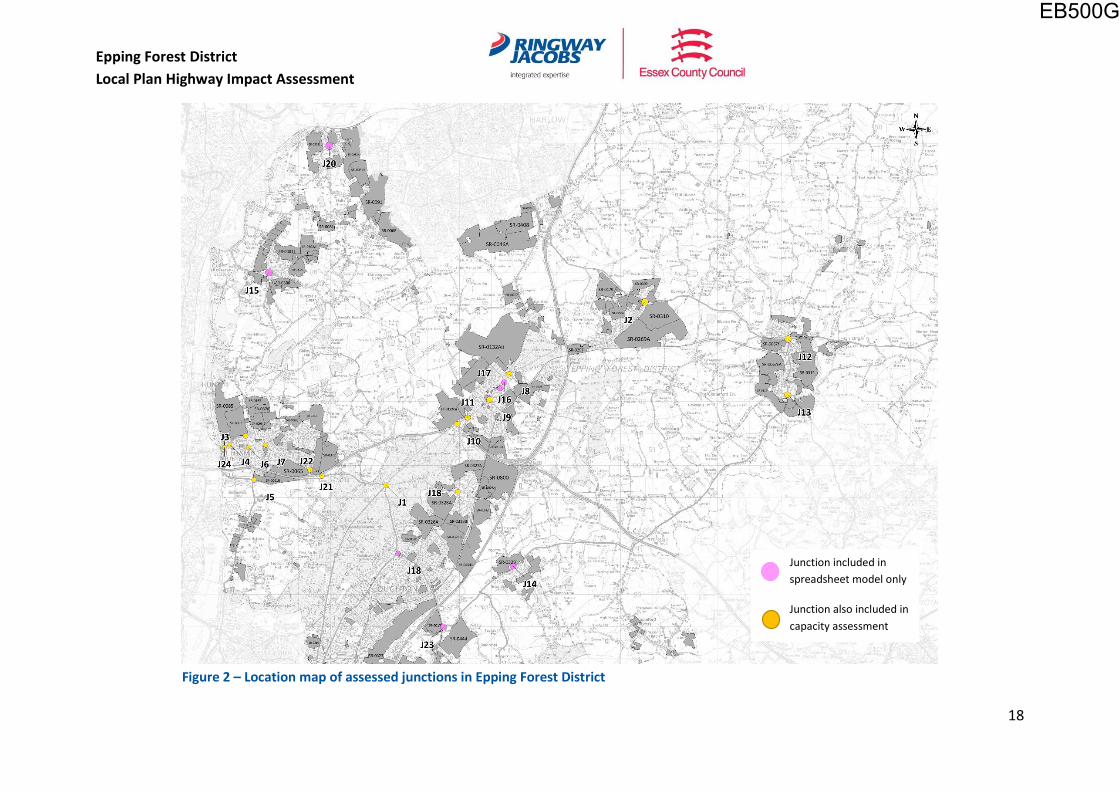
Figure 2 – Location map of assessed junctions in Epping Forest District
Junction included in
spreadsheet model only
Junction also included in
capacity assessment
EB500G
Epping Forest District
Local Plan Highway Impact Assessment
19
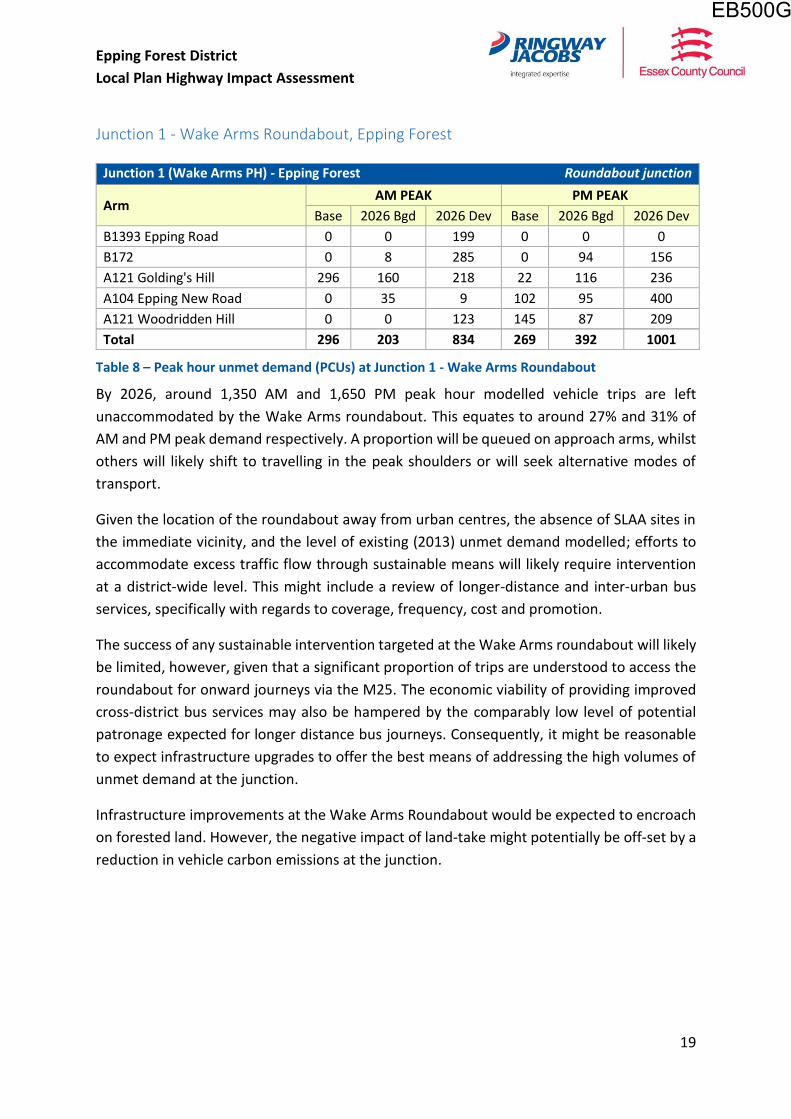
Junction 1 - Wake Arms Roundabout, Epping Forest
Junction 1 (Wake Arms PH) - Epping Forest Roundabout junction
Arm AM PEAK PM PEAK
Base 2026 Bgd 2026 Dev Base 2026 Bgd 2026 Dev
B1393 Epping Road 0 0 199 0 0 0
B172 0 8 285 0 94 156
A121 Golding's Hill 296 160 218 22 116 236
A104 Epping New Road 0 35 9 102 95 400
A121 Woodridden Hill 0 0 123 145 87 209
Total 296 203 834 269 392 1001
Table 8 – Peak hour unmet demand (PCUs) at Junction 1 - Wake Arms Roundabout
By 2026, around 1,350 AM and 1,650 PM peak hour modelled vehicle trips are left
unaccommodated by the Wake Arms roundabout. This equates to around 27% and 31% of
AM and PM peak demand respectively. A proportion will be queued on approach arms, whilst
others will likely shift to travelling in the peak shoulders or will seek alternative modes of
transport.
Given the location of the roundabout away from urban centres, the absence of SLAA sites in
the immediate vicinity, and the level of existing (2013) unmet demand modelled; efforts to
accommodate excess traffic flow through sustainable means will likely require intervention
at a district-wide level. This might include a review of longer-distance and inter-urban bus
services, specifically with regards to coverage, frequency, cost and promotion.
The success of any sustainable intervention targeted at the Wake Arms roundabout will likely
be limited, however, given that a significant proportion of trips are understood to access the
roundabout for onward journeys via the M25. The economic viability of providing improved
cross-district bus services may also be hampered by the comparably low level of potential
patronage expected for longer distance bus journeys. Consequently, it might be reasonable
to expect infrastructure upgrades to offer the best means of addressing the high volumes of
unmet demand at the junction.
Infrastructure improvements at the Wake Arms Roundabout would be expected to encroach
on forested land. However, the negative impact of land-take might potentially be off-set by a
reduction in vehicle carbon emissions at the junction.
EB500G
Epping Forest District
Local Plan Highway Impact Assessment
20
Junction 1 – Wake Arms Roundabout : Summary
Relative level of unmet demand High
Main contributor(s) to unmet demand Base, background growth & SLAA developments
Urban or Rural junction? Rural
Sustainable options to consider Improvements to and promotion of inter-urban
bus services
Opportunity for sustainable measures Very Limited
Capacity infrastructure improvements? Likely in short-term
__________________________________________________________________________________
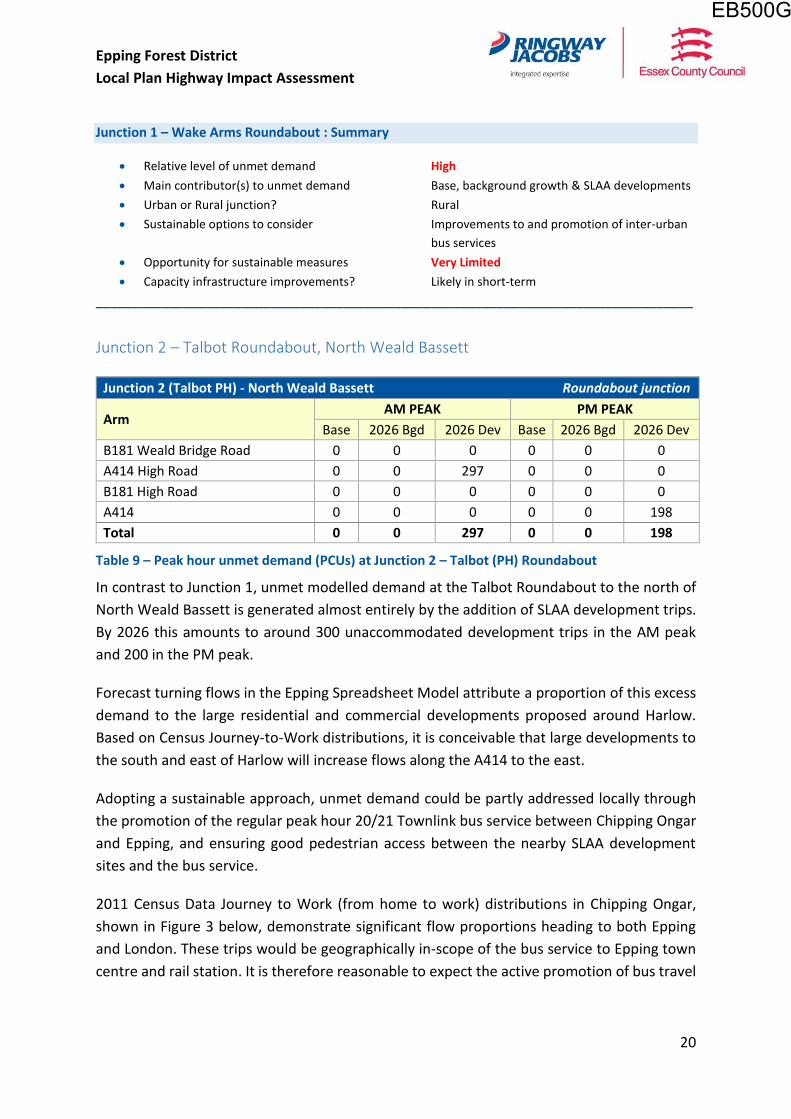
Junction 2 – Talbot Roundabout, North Weald Bassett
Junction 2 (Talbot PH) - North Weald Bassett Roundabout junction
Arm AM PEAK PM PEAK
Base 2026 Bgd 2026 Dev Base 2026 Bgd 2026 Dev
B181 Weald Bridge Road 0 0 0 0 0 0
A414 High Road 0 0 297 0 0 0
B181 High Road 0 0 0 0 0 0
A414 0 0 0 0 0 198
Total 0 0 297 0 0 198
Table 9 – Peak hour unmet demand (PCUs) at Junction 2 – Talbot (PH) Roundabout
In contrast to Junction 1, unmet modelled demand at the Talbot Roundabout to the north of
North Weald Bassett is generated almost entirely by the addition of SLAA development trips.
By 2026 this amounts to around 300 unaccommodated development trips in the AM peak
and 200 in the PM peak.
Forecast turning flows in the Epping Spreadsheet Model attribute a proportion of this excess
demand to the large residential and commercial developments proposed around Harlow.
Based on Census Journey-to-Work distributions, it is conceivable that large developments to
the south and east of Harlow will increase flows along the A414 to the east.
Adopting a sustainable approach, unmet demand could be partly addressed locally through
the promotion of the regular peak hour 20/21 Townlink bus service between Chipping Ongar
and Epping, and ensuring good pedestrian access between the nearby SLAA development
sites and the bus service.
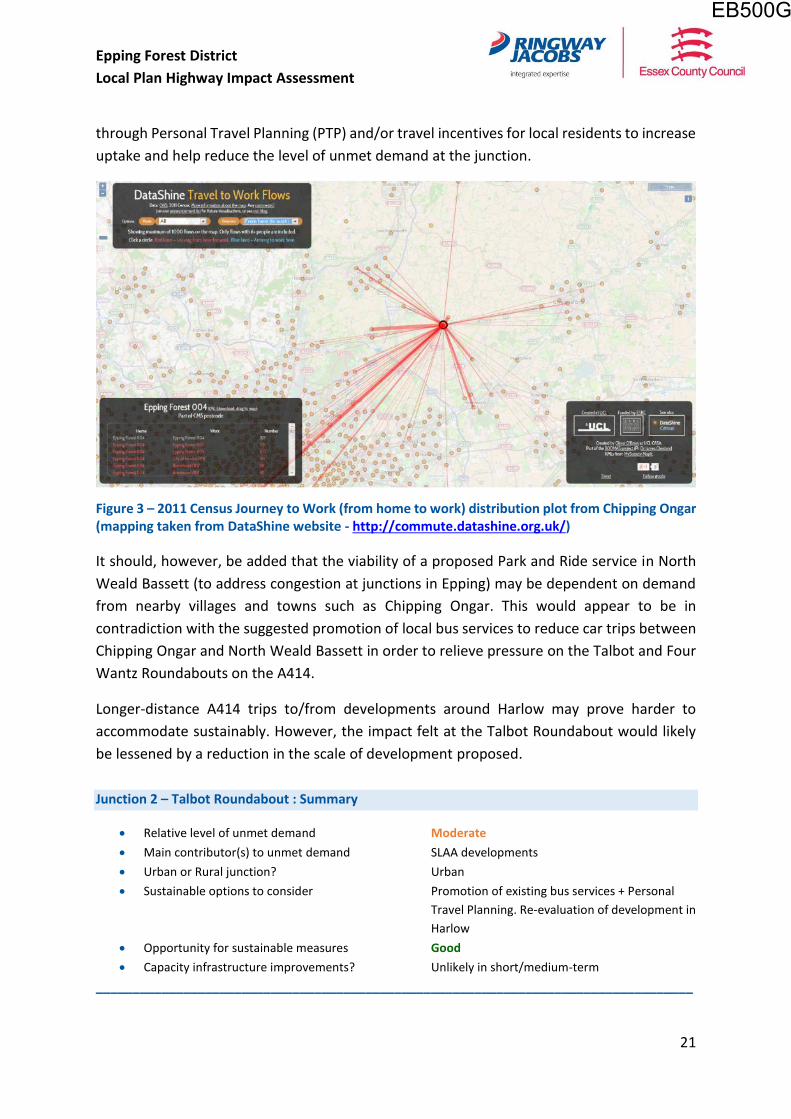
2011 Census Data Journey to Work (from home to work) distributions in Chipping Ongar,
shown in Figure 3 below, demonstrate significant flow proportions heading to both Epping
and London. These trips would be geographically in-scope of the bus service to Epping town
centre and rail station. It is therefore reasonable to expect the active promotion of bus travel
EB500G
Epping Forest District
Local Plan Highway Impact Assessment
21
through Personal Travel Planning (PTP) and/or travel incentives for local residents to increase
uptake and help reduce the level of unmet demand at the junction.
Figure 3 – 2011 Census Journey to Work (from home to work) distribution plot from Chipping Ongar (mapping taken from DataShine website - http://commute.datashine.org.uk/)
It should, however, be added that the viability of a proposed Park and Ride service in North
Weald Bassett (to address congestion at junctions in Epping) may be dependent on demand
from nearby villages and towns such as Chipping Ongar. This would appear to be in
contradiction with the suggested promotion of local bus services to reduce car trips between
Chipping Ongar and North Weald Bassett in order to relieve pressure on the Talbot and Four
Wantz Roundabouts on the A414.
Longer-distance A414 trips to/from developments around Harlow may prove harder to
accommodate sustainably. However, the impact felt at the Talbot Roundabout would likely
be lessened by a reduction in the scale of development proposed.
Junction 2 – Talbot Roundabout : Summary
Relative level of unmet demand Moderate
Main contributor(s) to unmet demand SLAA developments
Urban or Rural junction? Urban
Sustainable options to consider Promotion of existing bus services + Personal
Travel Planning. Re-evaluation of development in
Harlow
Opportunity for sustainable measures Good
Capacity infrastructure improvements? Unlikely in short/medium-term
__________________________________________________________________________________
EB500G
Epping Forest District
Local Plan Highway Impact Assessment
22
Junction 3 – Crooked Mile Roundabout, Waltham Abbey
No unmet demand is modelled at the junction in a 2026 forecast year.
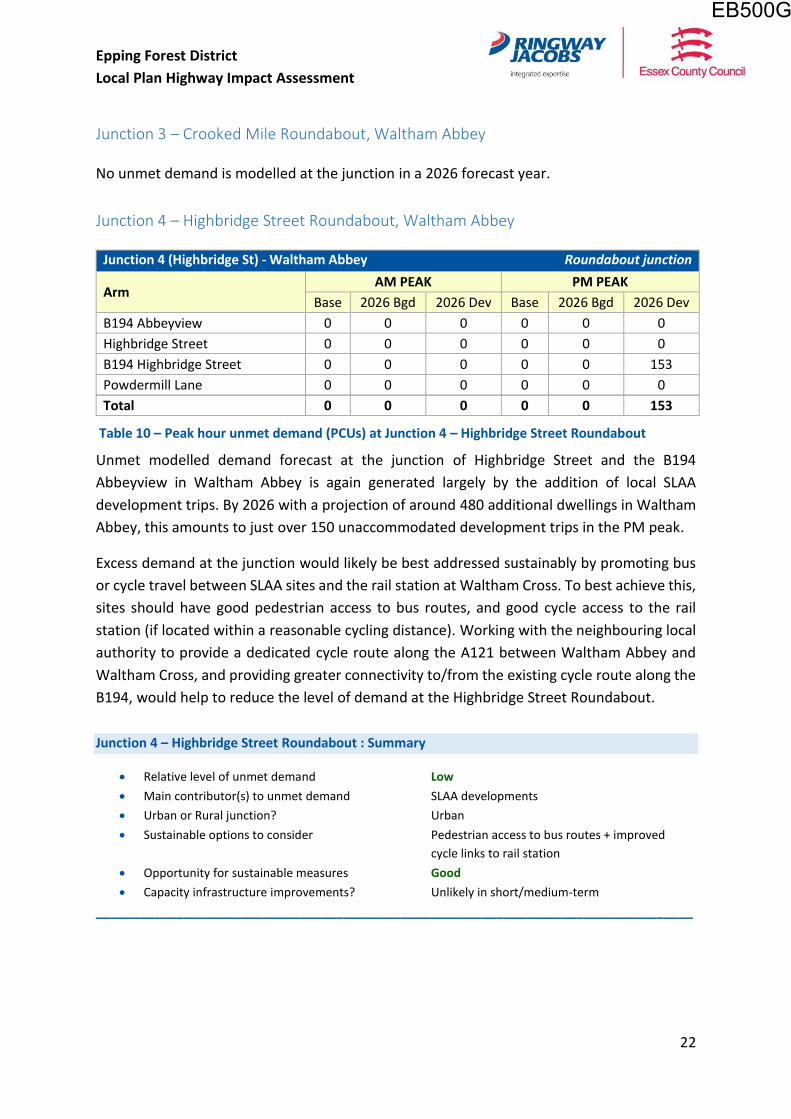
Junction 4 – Highbridge Street Roundabout, Waltham Abbey
Junction 4 (Highbridge St) - Waltham Abbey Roundabout junction
Arm AM PEAK PM PEAK
Base 2026 Bgd 2026 Dev Base 2026 Bgd 2026 Dev
B194 Abbeyview 0 0 0 0 0 0
Highbridge Street 0 0 0 0 0 0
B194 Highbridge Street 0 0 0 0 0 153
Powdermill Lane 0 0 0 0 0 0
Total 0 0 0 0 0 153
Table 10 – Peak hour unmet demand (PCUs) at Junction 4 – Highbridge Street Roundabout
Unmet modelled demand forecast at the junction of Highbridge Street and the B194
Abbeyview in Waltham Abbey is again generated largely by the addition of local SLAA
development trips. By 2026 with a projection of around 480 additional dwellings in Waltham
Abbey, this amounts to just over 150 unaccommodated development trips in the PM peak.
Excess demand at the junction would likely be best addressed sustainably by promoting bus
or cycle travel between SLAA sites and the rail station at Waltham Cross. To best achieve this,
sites should have good pedestrian access to bus routes, and good cycle access to the rail
station (if located within a reasonable cycling distance). Working with the neighbouring local
authority to provide a dedicated cycle route along the A121 between Waltham Abbey and
Waltham Cross, and providing greater connectivity to/from the existing cycle route along the
B194, would help to reduce the level of demand at the Highbridge Street Roundabout.
Junction 4 – Highbridge Street Roundabout : Summary
Relative level of unmet demand Low
Main contributor(s) to unmet demand SLAA developments
Urban or Rural junction? Urban
Sustainable options to consider Pedestrian access to bus routes + improved
cycle links to rail station
Opportunity for sustainable measures Good
Capacity infrastructure improvements? Unlikely in short/medium-term
__________________________________________________________________________________
EB500G
Epping Forest District
Local Plan Highway Impact Assessment
23
Junction 5 – Sewardstone Road Roundabout, Waltham Abbey
No unmet demand is modelled at the junction in a 2026 forecast year.
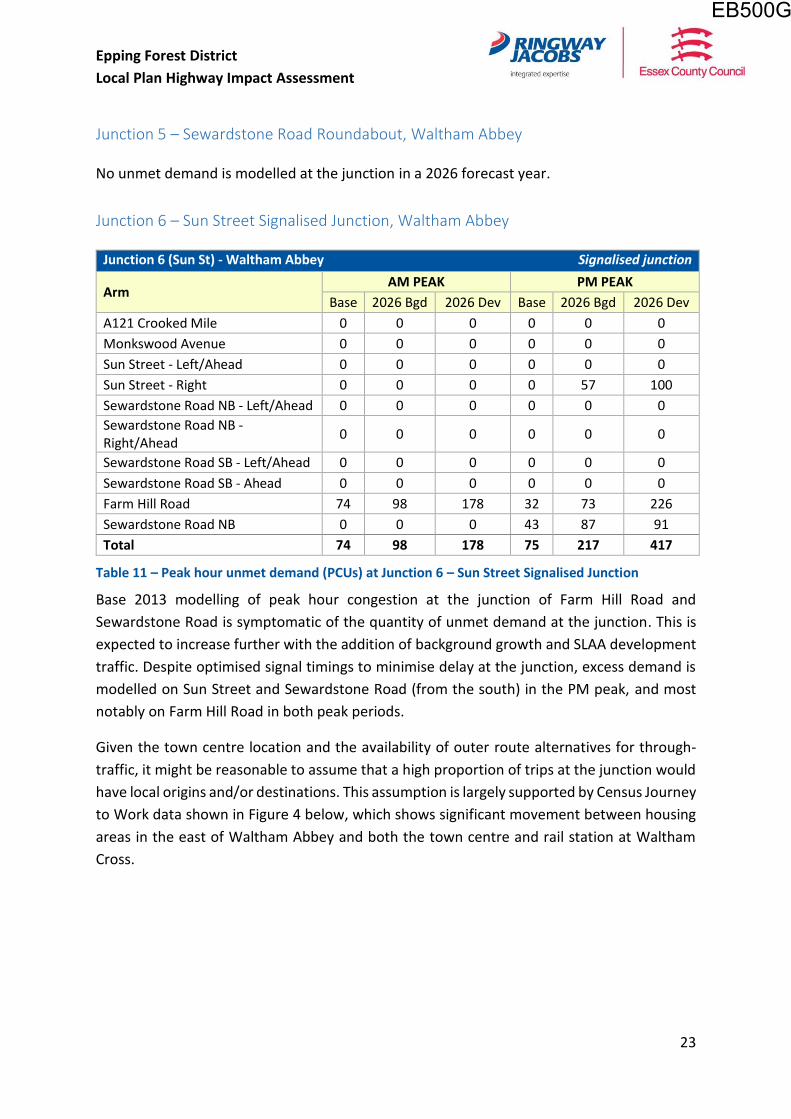
Junction 6 – Sun Street Signalised Junction, Waltham Abbey
Junction 6 (Sun St) - Waltham Abbey Signalised junction
Arm AM PEAK PM PEAK
Base 2026 Bgd 2026 Dev Base 2026 Bgd 2026 Dev
A121 Crooked Mile 0 0 0 0 0 0
Monkswood Avenue 0 0 0 0 0 0
Sun Street - Left/Ahead 0 0 0 0 0 0
Sun Street - Right 0 0 0 0 57 100
Sewardstone Road NB - Left/Ahead 0 0 0 0 0 0
Sewardstone Road NB - Right/Ahead
0 0 0 0 0 0
Sewardstone Road SB - Left/Ahead 0 0 0 0 0 0
Sewardstone Road SB - Ahead 0 0 0 0 0 0
Farm Hill Road 74 98 178 32 73 226
Sewardstone Road NB 0 0 0 43 87 91
Total 74 98 178 75 217 417
Table 11 – Peak hour unmet demand (PCUs) at Junction 6 – Sun Street Signalised Junction
Base 2013 modelling of peak hour congestion at the junction of Farm Hill Road and
Sewardstone Road is symptomatic of the quantity of unmet demand at the junction. This is
expected to increase further with the addition of background growth and SLAA development
traffic. Despite optimised signal timings to minimise delay at the junction, excess demand is
modelled on Sun Street and Sewardstone Road (from the south) in the PM peak, and most
notably on Farm Hill Road in both peak periods.
Given the town centre location and the availability of outer route alternatives for through-
traffic, it might be reasonable to assume that a high proportion of trips at the junction would
have local origins and/or destinations. This assumption is largely supported by Census Journey
to Work data shown in Figure 4 below, which shows significant movement between housing
areas in the east of Waltham Abbey and both the town centre and rail station at Waltham
Cross.
EB500G
Epping Forest District
Local Plan Highway Impact Assessment
24
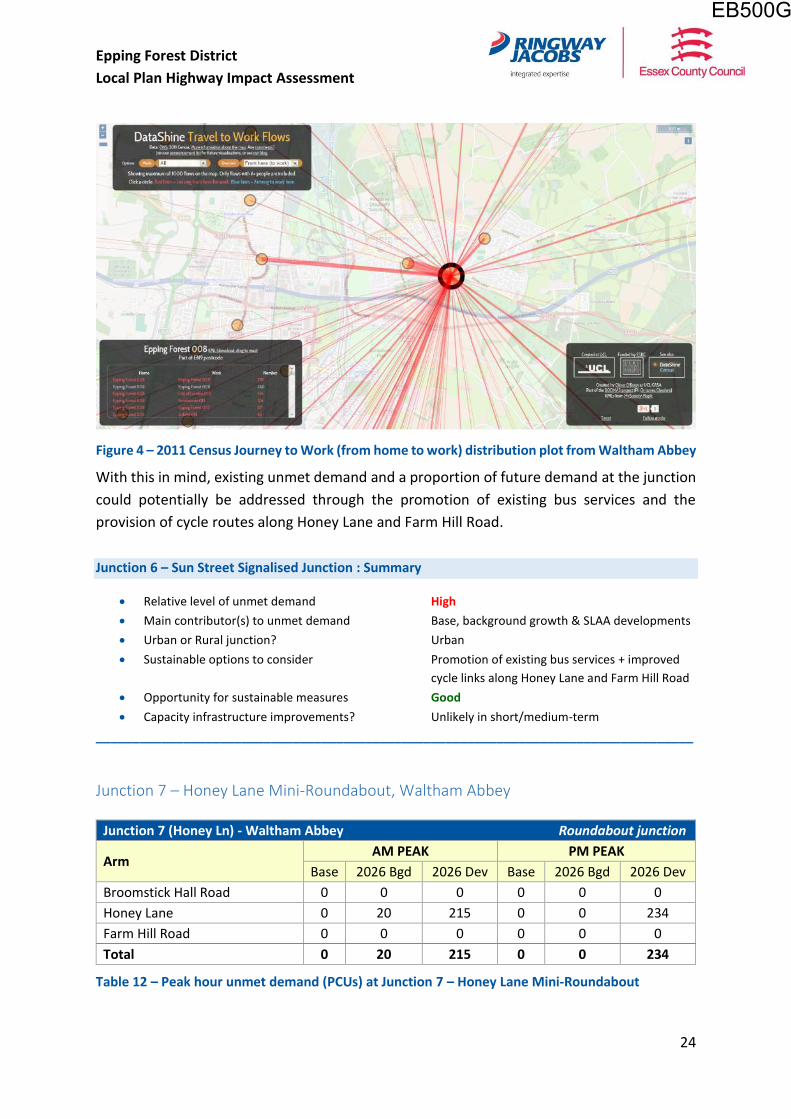
Figure 4 – 2011 Census Journey to Work (from home to work) distribution plot from Waltham Abbey
With this in mind, existing unmet demand and a proportion of future demand at the junction
could potentially be addressed through the promotion of existing bus services and the
provision of cycle routes along Honey Lane and Farm Hill Road.
Junction 6 – Sun Street Signalised Junction : Summary
Relative level of unmet demand High
Main contributor(s) to unmet demand Base, background growth & SLAA developments
Urban or Rural junction? Urban
Sustainable options to consider Promotion of existing bus services + improved
cycle links along Honey Lane and Farm Hill Road
Opportunity for sustainable measures Good
Capacity infrastructure improvements? Unlikely in short/medium-term
__________________________________________________________________________________
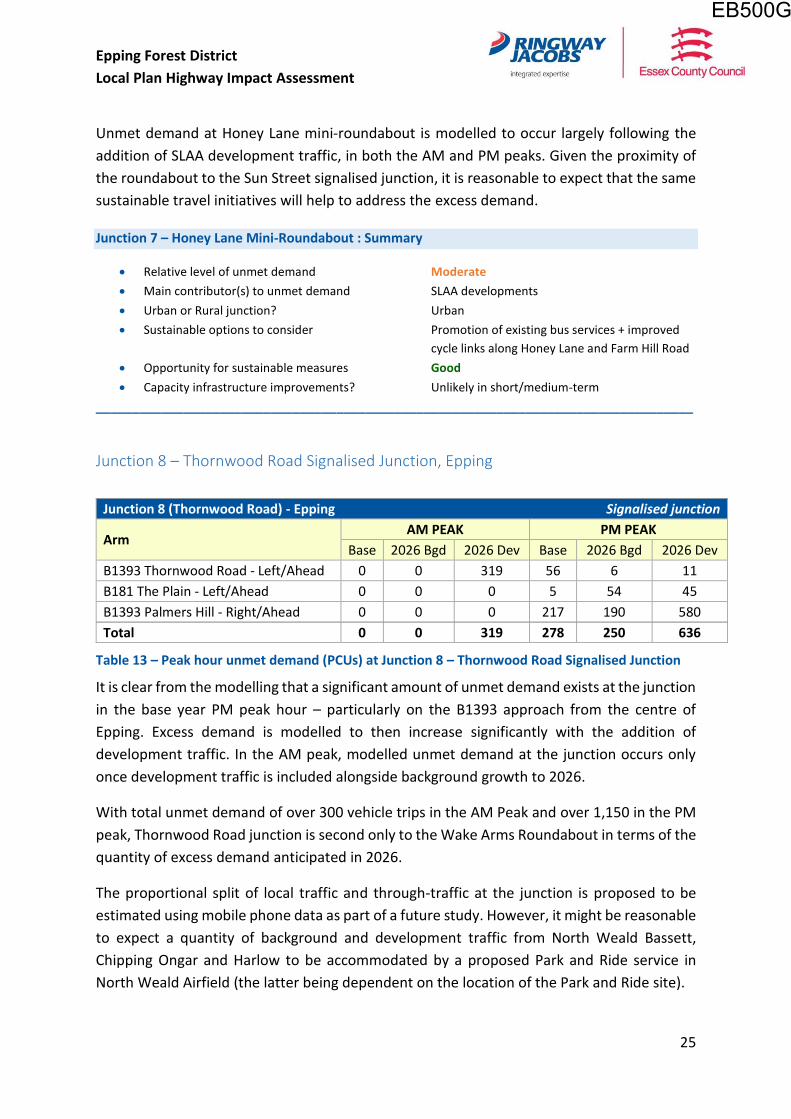
Junction 7 – Honey Lane Mini-Roundabout, Waltham Abbey
Junction 7 (Honey Ln) - Waltham Abbey Roundabout junction
Arm AM PEAK PM PEAK
Base 2026 Bgd 2026 Dev Base 2026 Bgd 2026 Dev
Broomstick Hall Road 0 0 0 0 0 0
Honey Lane 0 20 215 0 0 234
Farm Hill Road 0 0 0 0 0 0
Total 0 20 215 0 0 234
Table 12 – Peak hour unmet demand (PCUs) at Junction 7 – Honey Lane Mini-Roundabout
EB500G
Epping Forest District
Local Plan Highway Impact Assessment
25
Unmet demand at Honey Lane mini-roundabout is modelled to occur largely following the
addition of SLAA development traffic, in both the AM and PM peaks. Given the proximity of
the roundabout to the Sun Street signalised junction, it is reasonable to expect that the same
sustainable travel initiatives will help to address the excess demand.
Junction 7 – Honey Lane Mini-Roundabout : Summary
Relative level of unmet demand Moderate
Main contributor(s) to unmet demand SLAA developments
Urban or Rural junction? Urban
Sustainable options to consider Promotion of existing bus services + improved
cycle links along Honey Lane and Farm Hill Road
Opportunity for sustainable measures Good
Capacity infrastructure improvements? Unlikely in short/medium-term
__________________________________________________________________________________
Junction 8 – Thornwood Road Signalised Junction, Epping
Junction 8 (Thornwood Road) - Epping Signalised junction
Arm AM PEAK PM PEAK
Base 2026 Bgd 2026 Dev Base 2026 Bgd 2026 Dev
B1393 Thornwood Road - Left/Ahead 0 0 319 56 6 11
B181 The Plain - Left/Ahead 0 0 0 5 54 45
B1393 Palmers Hill - Right/Ahead 0 0 0 217 190 580
Total 0 0 319 278 250 636
Table 13 – Peak hour unmet demand (PCUs) at Junction 8 – Thornwood Road Signalised Junction
It is clear from the modelling that a significant amount of unmet demand exists at the junction
in the base year PM peak hour – particularly on the B1393 approach from the centre of
Epping. Excess demand is modelled to then increase significantly with the addition of
development traffic. In the AM peak, modelled unmet demand at the junction occurs only
once development traffic is included alongside background growth to 2026.
With total unmet demand of over 300 vehicle trips in the AM Peak and over 1,150 in the PM
peak, Thornwood Road junction is second only to the Wake Arms Roundabout in terms of the
quantity of excess demand anticipated in 2026.
The proportional split of local traffic and through-traffic at the junction is proposed to be
estimated using mobile phone data as part of a future study. However, it might be reasonable
to expect a quantity of background and development traffic from North Weald Bassett,
Chipping Ongar and Harlow to be accommodated by a proposed Park and Ride service in
North Weald Airfield (the latter being dependent on the location of the Park and Ride site).
EB500G
Epping Forest District
Local Plan Highway Impact Assessment
26
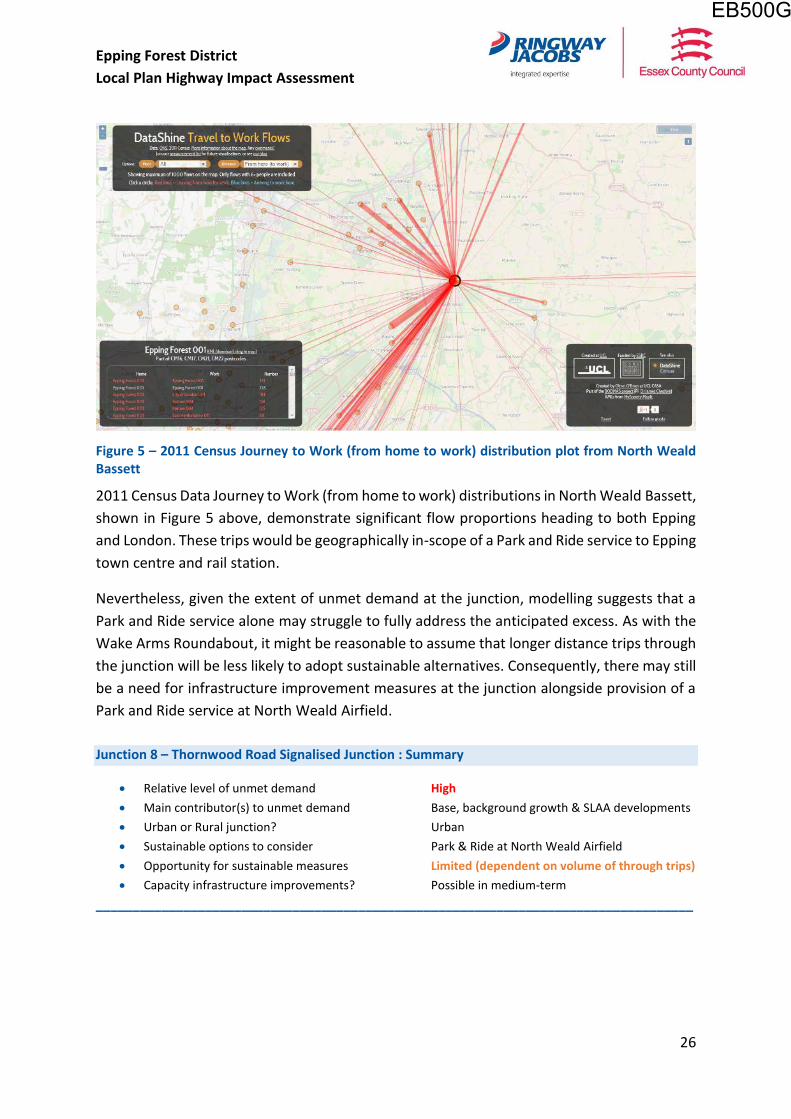
Figure 5 – 2011 Census Journey to Work (from home to work) distribution plot from North Weald Bassett
2011 Census Data Journey to Work (from home to work) distributions in North Weald Bassett,
shown in Figure 5 above, demonstrate significant flow proportions heading to both Epping
and London. These trips would be geographically in-scope of a Park and Ride service to Epping
town centre and rail station.
Nevertheless, given the extent of unmet demand at the junction, modelling suggests that a
Park and Ride service alone may struggle to fully address the anticipated excess. As with the
Wake Arms Roundabout, it might be reasonable to assume that longer distance trips through
the junction will be less likely to adopt sustainable alternatives. Consequently, there may still
be a need for infrastructure improvement measures at the junction alongside provision of a
Park and Ride service at North Weald Airfield.
Junction 8 – Thornwood Road Signalised Junction : Summary
Relative level of unmet demand High
Main contributor(s) to unmet demand Base, background growth & SLAA developments
Urban or Rural junction? Urban
Sustainable options to consider Park & Ride at North Weald Airfield
Opportunity for sustainable measures Limited (dependent on volume of through trips)
Capacity infrastructure improvements? Possible in medium-term
__________________________________________________________________________________
EB500G
Epping Forest District
Local Plan Highway Impact Assessment
27
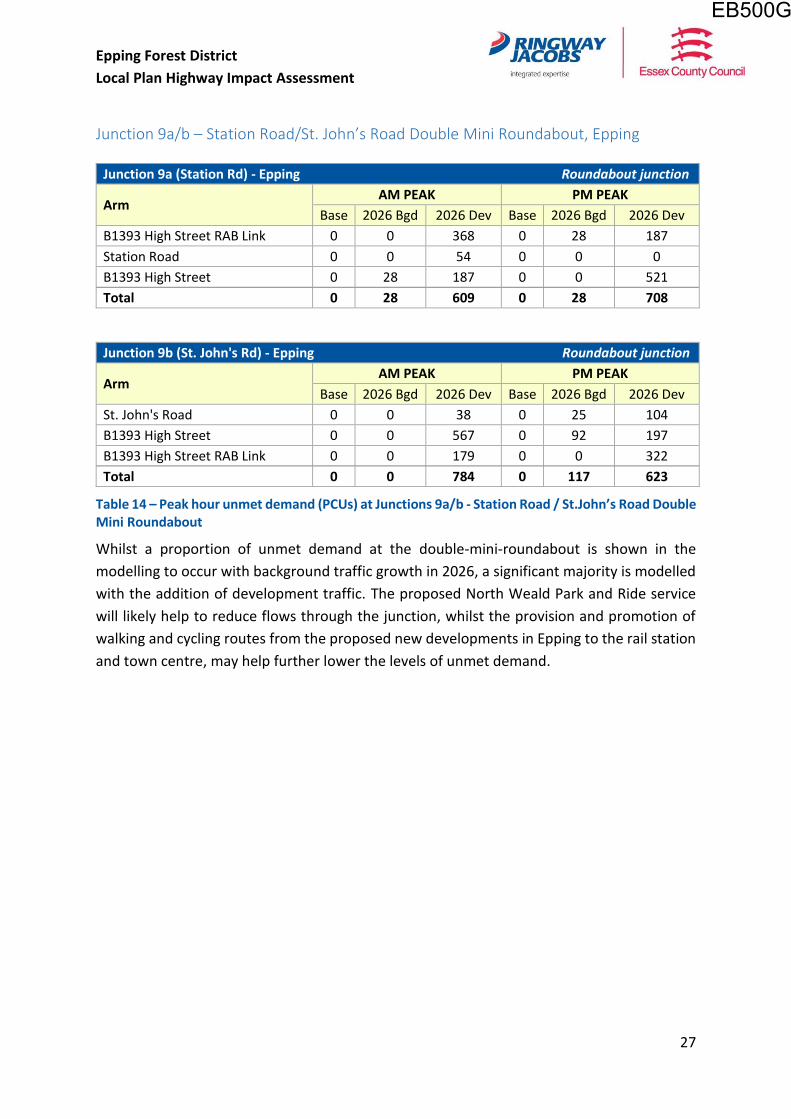
Junction 9a/b – Station Road/St. John’s Road Double Mini Roundabout, Epping
Junction 9a (Station Rd) - Epping Roundabout junction
Arm AM PEAK PM PEAK
Base 2026 Bgd 2026 Dev Base 2026 Bgd 2026 Dev
B1393 High Street RAB Link 0 0 368 0 28 187
Station Road 0 0 54 0 0 0
B1393 High Street 0 28 187 0 0 521
Total 0 28 609 0 28 708
Junction 9b (St. John's Rd) - Epping Roundabout junction
Arm AM PEAK PM PEAK
Base 2026 Bgd 2026 Dev Base 2026 Bgd 2026 Dev
St. John's Road 0 0 38 0 25 104
B1393 High Street 0 0 567 0 92 197
B1393 High Street RAB Link 0 0 179 0 0 322
Total 0 0 784 0 117 623
Table 14 – Peak hour unmet demand (PCUs) at Junctions 9a/b - Station Road / St.John’s Road Double Mini Roundabout
Whilst a proportion of unmet demand at the double-mini-roundabout is shown in the
modelling to occur with background traffic growth in 2026, a significant majority is modelled
with the addition of development traffic. The proposed North Weald Park and Ride service
will likely help to reduce flows through the junction, whilst the provision and promotion of
walking and cycling routes from the proposed new developments in Epping to the rail station
and town centre, may help further lower the levels of unmet demand.
EB500G
Epping Forest District
Local Plan Highway Impact Assessment
28
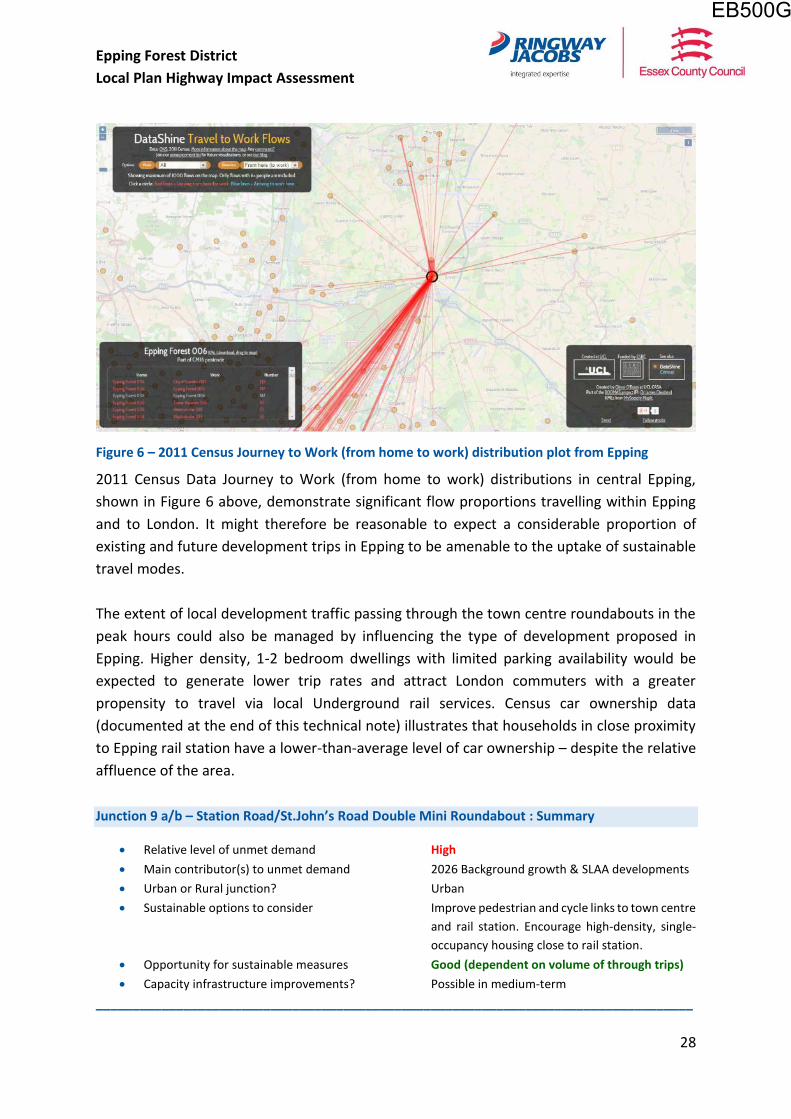
Figure 6 – 2011 Census Journey to Work (from home to work) distribution plot from Epping
2011 Census Data Journey to Work (from home to work) distributions in central Epping,
shown in Figure 6 above, demonstrate significant flow proportions travelling within Epping
and to London. It might therefore be reasonable to expect a considerable proportion of
existing and future development trips in Epping to be amenable to the uptake of sustainable
travel modes.
The extent of local development traffic passing through the town centre roundabouts in the
peak hours could also be managed by influencing the type of development proposed in
Epping. Higher density, 1-2 bedroom dwellings with limited parking availability would be
expected to generate lower trip rates and attract London commuters with a greater
propensity to travel via local Underground rail services. Census car ownership data
(documented at the end of this technical note) illustrates that households in close proximity
to Epping rail station have a lower-than-average level of car ownership – despite the relative
affluence of the area.
Junction 9 a/b – Station Road/St.John’s Road Double Mini Roundabout : Summary
Relative level of unmet demand High
Main contributor(s) to unmet demand 2026 Background growth & SLAA developments
Urban or Rural junction? Urban
Sustainable options to consider Improve pedestrian and cycle links to town centre
and rail station. Encourage high-density, single-
occupancy housing close to rail station.
Opportunity for sustainable measures Good (dependent on volume of through trips)
Capacity infrastructure improvements? Possible in medium-term
__________________________________________________________________________________
EB500G
Epping Forest District
Local Plan Highway Impact Assessment
29
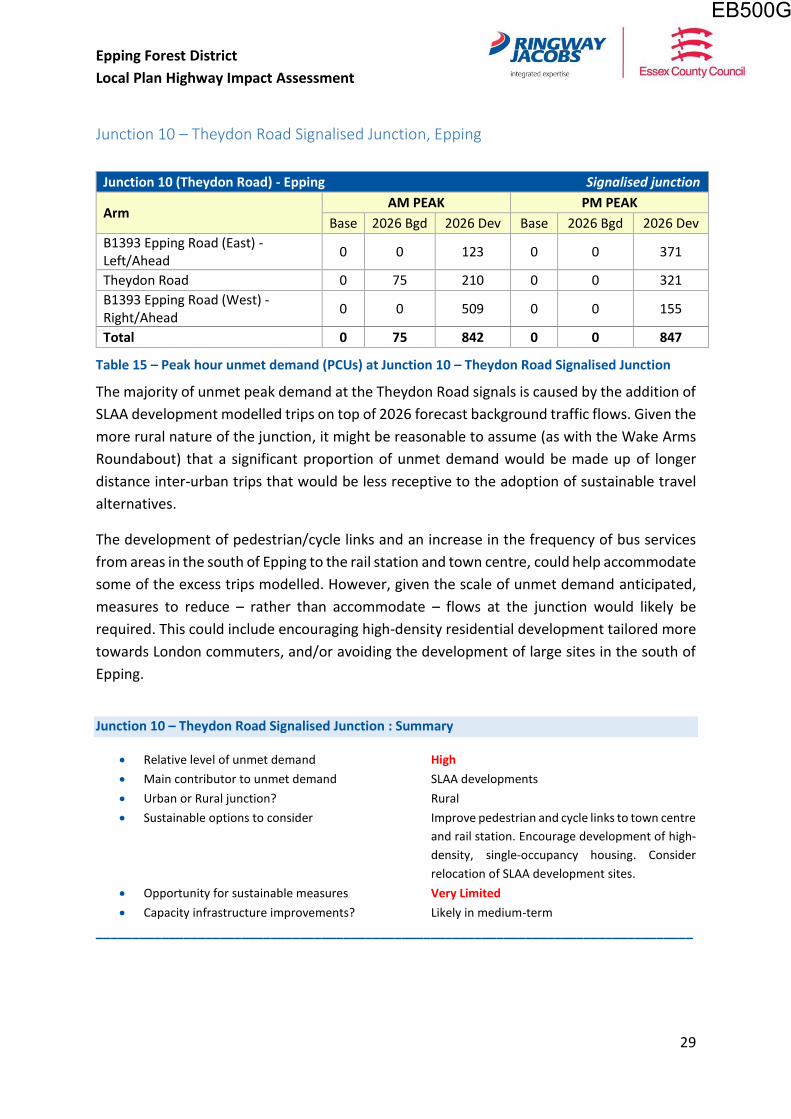
Junction 10 – Theydon Road Signalised Junction, Epping
Junction 10 (Theydon Road) - Epping Signalised junction
Arm AM PEAK PM PEAK
Base 2026 Bgd 2026 Dev Base 2026 Bgd 2026 Dev
B1393 Epping Road (East) - Left/Ahead
0 0 123 0 0 371
Theydon Road 0 75 210 0 0 321
B1393 Epping Road (West) - Right/Ahead
0 0 509 0 0 155
Total 0 75 842 0 0 847
Table 15 – Peak hour unmet demand (PCUs) at Junction 10 – Theydon Road Signalised Junction
The majority of unmet peak demand at the Theydon Road signals is caused by the addition of
SLAA development modelled trips on top of 2026 forecast background traffic flows. Given the
more rural nature of the junction, it might be reasonable to assume (as with the Wake Arms
Roundabout) that a significant proportion of unmet demand would be made up of longer
distance inter-urban trips that would be less receptive to the adoption of sustainable travel
alternatives.
The development of pedestrian/cycle links and an increase in the frequency of bus services
from areas in the south of Epping to the rail station and town centre, could help accommodate
some of the excess trips modelled. However, given the scale of unmet demand anticipated,
measures to reduce – rather than accommodate – flows at the junction would likely be
required. This could include encouraging high-density residential development tailored more
towards London commuters, and/or avoiding the development of large sites in the south of
Epping.
Junction 10 – Theydon Road Signalised Junction : Summary
Relative level of unmet demand High
Main contributor to unmet demand SLAA developments
Urban or Rural junction? Rural
Sustainable options to consider Improve pedestrian and cycle links to town centre
and rail station. Encourage development of high-
density, single-occupancy housing. Consider
relocation of SLAA development sites.
Opportunity for sustainable measures Very Limited
Capacity infrastructure improvements? Likely in medium-term
__________________________________________________________________________________
EB500G
Epping Forest District
Local Plan Highway Impact Assessment
30
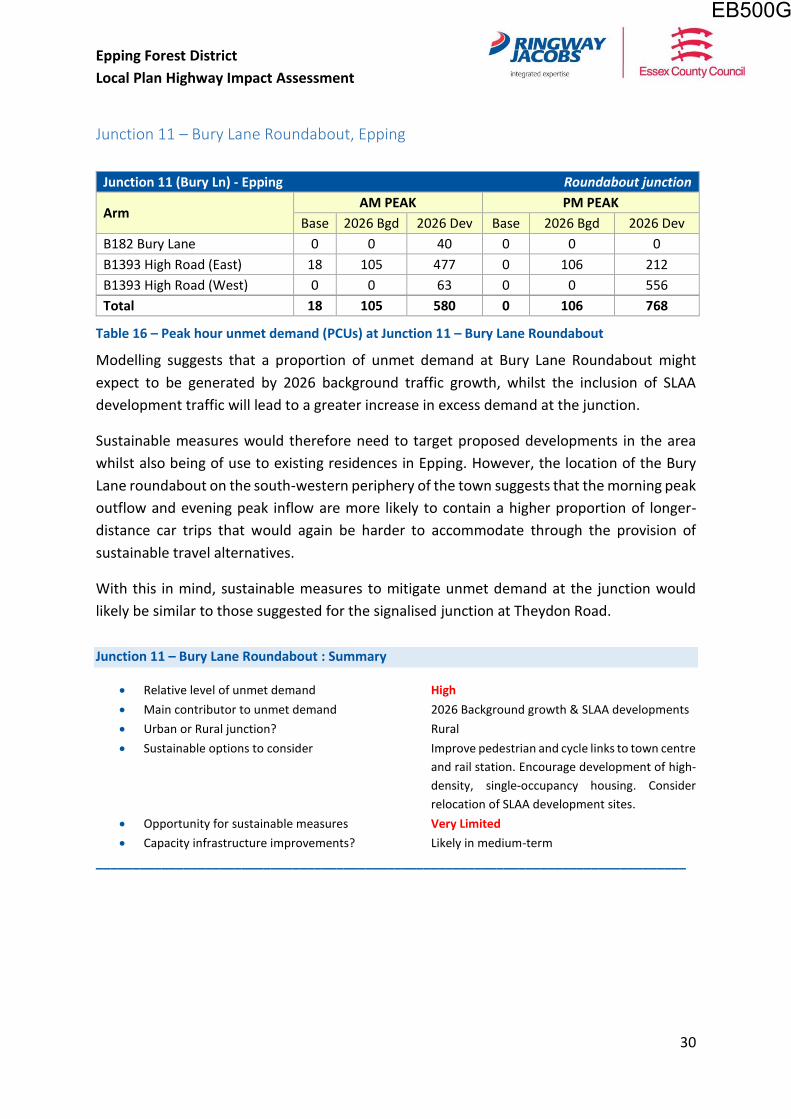
Junction 11 – Bury Lane Roundabout, Epping
Junction 11 (Bury Ln) - Epping Roundabout junction
Arm AM PEAK PM PEAK
Base 2026 Bgd 2026 Dev Base 2026 Bgd 2026 Dev
B182 Bury Lane 0 0 40 0 0 0
B1393 High Road (East) 18 105 477 0 106 212
B1393 High Road (West) 0 0 63 0 0 556
Total 18 105 580 0 106 768
Table 16 – Peak hour unmet demand (PCUs) at Junction 11 – Bury Lane Roundabout
Modelling suggests that a proportion of unmet demand at Bury Lane Roundabout might
expect to be generated by 2026 background traffic growth, whilst the inclusion of SLAA
development traffic will lead to a greater increase in excess demand at the junction.
Sustainable measures would therefore need to target proposed developments in the area
whilst also being of use to existing residences in Epping. However, the location of the Bury
Lane roundabout on the south-western periphery of the town suggests that the morning peak
outflow and evening peak inflow are more likely to contain a higher proportion of longer-
distance car trips that would again be harder to accommodate through the provision of
sustainable travel alternatives.
With this in mind, sustainable measures to mitigate unmet demand at the junction would
likely be similar to those suggested for the signalised junction at Theydon Road.
Junction 11 – Bury Lane Roundabout : Summary
Relative level of unmet demand High
Main contributor to unmet demand 2026 Background growth & SLAA developments
Urban or Rural junction? Rural
Sustainable options to consider Improve pedestrian and cycle links to town centre
and rail station. Encourage development of high-
density, single-occupancy housing. Consider
relocation of SLAA development sites.
Opportunity for sustainable measures Very Limited
Capacity infrastructure improvements? Likely in medium-term
_________________________________________________________________________________
EB500G
Epping Forest District
Local Plan Highway Impact Assessment
31
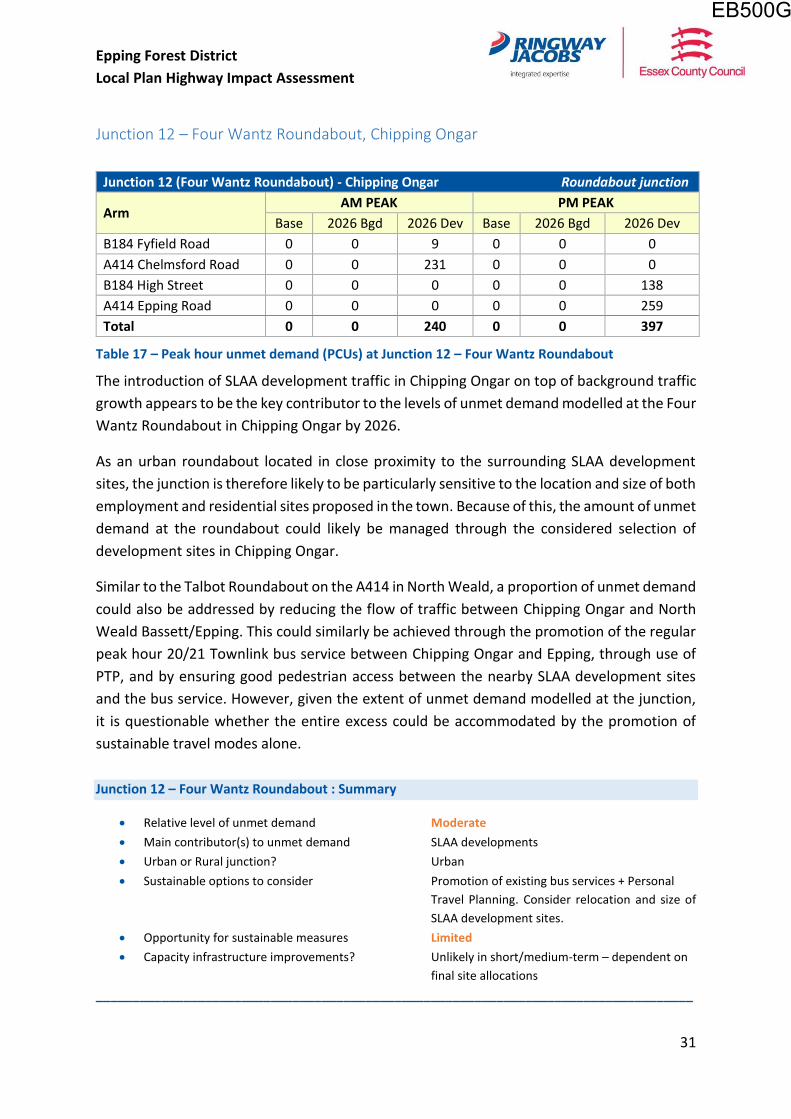
Junction 12 – Four Wantz Roundabout, Chipping Ongar
Junction 12 (Four Wantz Roundabout) - Chipping Ongar Roundabout junction
Arm AM PEAK PM PEAK
Base 2026 Bgd 2026 Dev Base 2026 Bgd 2026 Dev
B184 Fyfield Road 0 0 9 0 0 0
A414 Chelmsford Road 0 0 231 0 0 0
B184 High Street 0 0 0 0 0 138
A414 Epping Road 0 0 0 0 0 259
Total 0 0 240 0 0 397
Table 17 – Peak hour unmet demand (PCUs) at Junction 12 – Four Wantz Roundabout
The introduction of SLAA development traffic in Chipping Ongar on top of background traffic
growth appears to be the key contributor to the levels of unmet demand modelled at the Four
Wantz Roundabout in Chipping Ongar by 2026.
As an urban roundabout located in close proximity to the surrounding SLAA development
sites, the junction is therefore likely to be particularly sensitive to the location and size of both
employment and residential sites proposed in the town. Because of this, the amount of unmet
demand at the roundabout could likely be managed through the considered selection of
development sites in Chipping Ongar.
Similar to the Talbot Roundabout on the A414 in North Weald, a proportion of unmet demand
could also be addressed by reducing the flow of traffic between Chipping Ongar and North
Weald Bassett/Epping. This could similarly be achieved through the promotion of the regular
peak hour 20/21 Townlink bus service between Chipping Ongar and Epping, through use of
PTP, and by ensuring good pedestrian access between the nearby SLAA development sites
and the bus service. However, given the extent of unmet demand modelled at the junction,
it is questionable whether the entire excess could be accommodated by the promotion of
sustainable travel modes alone.
Junction 12 – Four Wantz Roundabout : Summary
Relative level of unmet demand Moderate
Main contributor(s) to unmet demand SLAA developments
Urban or Rural junction? Urban
Sustainable options to consider Promotion of existing bus services + Personal
Travel Planning. Consider relocation and size of
SLAA development sites.
Opportunity for sustainable measures Limited
Capacity infrastructure improvements? Unlikely in short/medium-term – dependent on
final site allocations
__________________________________________________________________________________
EB500G
Epping Forest District
Local Plan Highway Impact Assessment
32
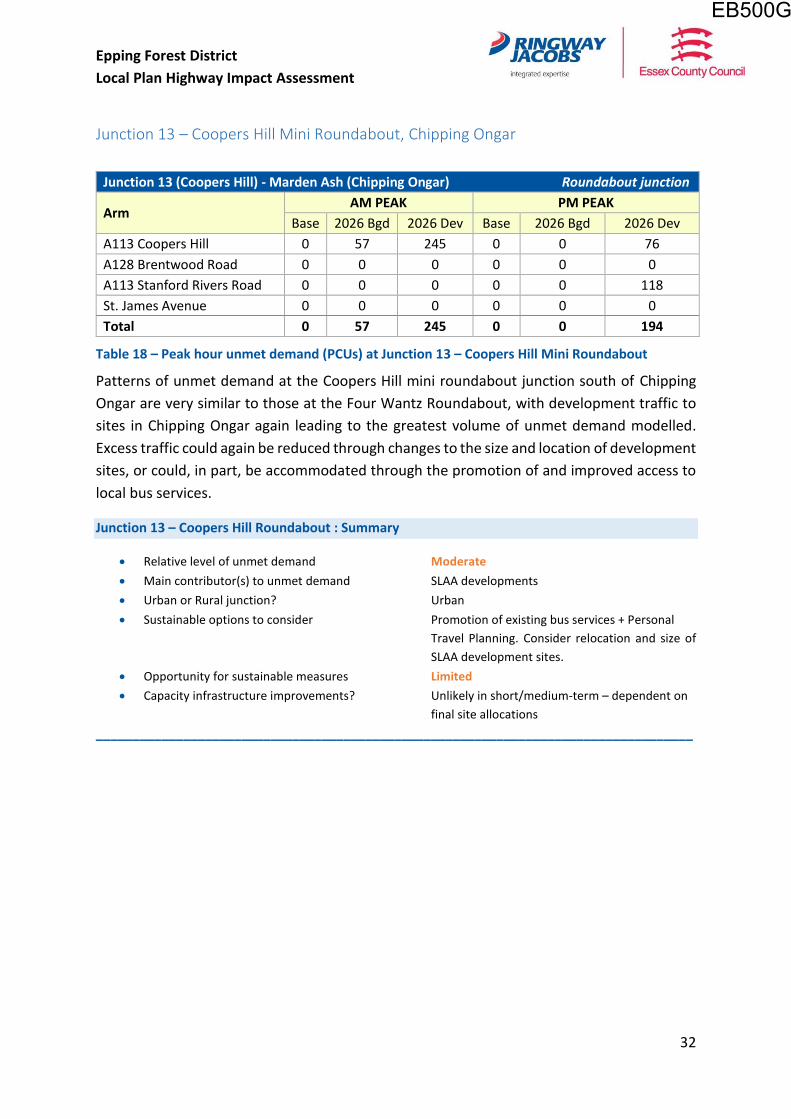
Junction 13 – Coopers Hill Mini Roundabout, Chipping Ongar
Junction 13 (Coopers Hill) - Marden Ash (Chipping Ongar) Roundabout junction
Arm AM PEAK PM PEAK
Base 2026 Bgd 2026 Dev Base 2026 Bgd 2026 Dev
A113 Coopers Hill 0 57 245 0 0 76
A128 Brentwood Road 0 0 0 0 0 0
A113 Stanford Rivers Road 0 0 0 0 0 118
St. James Avenue 0 0 0 0 0 0
Total 0 57 245 0 0 194
Table 18 – Peak hour unmet demand (PCUs) at Junction 13 – Coopers Hill Mini Roundabout
Patterns of unmet demand at the Coopers Hill mini roundabout junction south of Chipping
Ongar are very similar to those at the Four Wantz Roundabout, with development traffic to
sites in Chipping Ongar again leading to the greatest volume of unmet demand modelled.
Excess traffic could again be reduced through changes to the size and location of development
sites, or could, in part, be accommodated through the promotion of and improved access to
local bus services.
Junction 13 – Coopers Hill Roundabout : Summary
Relative level of unmet demand Moderate
Main contributor(s) to unmet demand SLAA developments
Urban or Rural junction? Urban
Sustainable options to consider Promotion of existing bus services + Personal
Travel Planning. Consider relocation and size of
SLAA development sites.
Opportunity for sustainable measures Limited
Capacity infrastructure improvements? Unlikely in short/medium-term – dependent on
final site allocations
__________________________________________________________________________________
EB500G
Epping Forest District
Local Plan Highway Impact Assessment
33
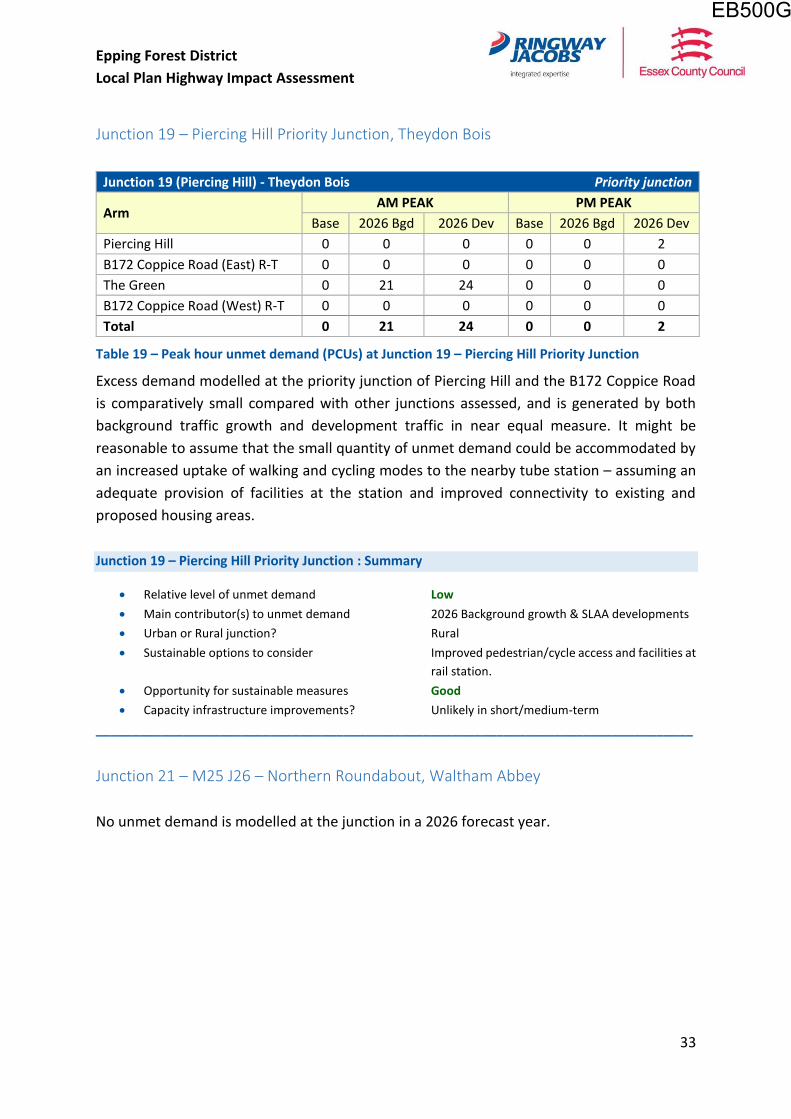
Junction 19 – Piercing Hill Priority Junction, Theydon Bois
Junction 19 (Piercing Hill) - Theydon Bois Priority junction
Arm AM PEAK PM PEAK
Base 2026 Bgd 2026 Dev Base 2026 Bgd 2026 Dev
Piercing Hill 0 0 0 0 0 2
B172 Coppice Road (East) R-T 0 0 0 0 0 0
The Green 0 21 24 0 0 0
B172 Coppice Road (West) R-T 0 0 0 0 0 0
Total 0 21 24 0 0 2
Table 19 – Peak hour unmet demand (PCUs) at Junction 19 – Piercing Hill Priority Junction
Excess demand modelled at the priority junction of Piercing Hill and the B172 Coppice Road
is comparatively small compared with other junctions assessed, and is generated by both
background traffic growth and development traffic in near equal measure. It might be
reasonable to assume that the small quantity of unmet demand could be accommodated by
an increased uptake of walking and cycling modes to the nearby tube station – assuming an
adequate provision of facilities at the station and improved connectivity to existing and
proposed housing areas.
Junction 19 – Piercing Hill Priority Junction : Summary
Relative level of unmet demand Low
Main contributor(s) to unmet demand 2026 Background growth & SLAA developments
Urban or Rural junction? Rural
Sustainable options to consider Improved pedestrian/cycle access and facilities at
rail station.
Opportunity for sustainable measures Good
Capacity infrastructure improvements? Unlikely in short/medium-term
__________________________________________________________________________________
Junction 21 – M25 J26 – Northern Roundabout, Waltham Abbey
No unmet demand is modelled at the junction in a 2026 forecast year.
EB500G
Epping Forest District
Local Plan Highway Impact Assessment
34
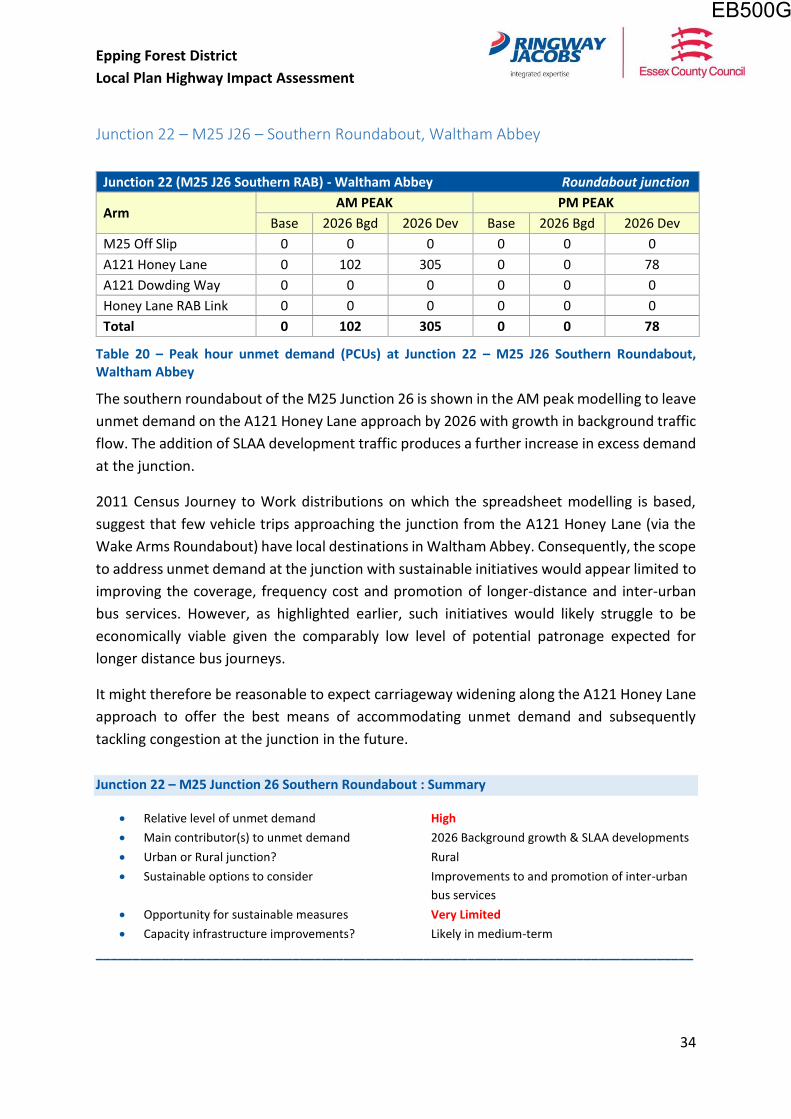
Junction 22 – M25 J26 – Southern Roundabout, Waltham Abbey
Junction 22 (M25 J26 Southern RAB) - Waltham Abbey Roundabout junction
Arm AM PEAK PM PEAK
Base 2026 Bgd 2026 Dev Base 2026 Bgd 2026 Dev
M25 Off Slip 0 0 0 0 0 0
A121 Honey Lane 0 102 305 0 0 78
A121 Dowding Way 0 0 0 0 0 0
Honey Lane RAB Link 0 0 0 0 0 0
Total 0 102 305 0 0 78
Table 20 – Peak hour unmet demand (PCUs) at Junction 22 – M25 J26 Southern Roundabout, Waltham Abbey
The southern roundabout of the M25 Junction 26 is shown in the AM peak modelling to leave
unmet demand on the A121 Honey Lane approach by 2026 with growth in background traffic
flow. The addition of SLAA development traffic produces a further increase in excess demand
at the junction.
2011 Census Journey to Work distributions on which the spreadsheet modelling is based,
suggest that few vehicle trips approaching the junction from the A121 Honey Lane (via the
Wake Arms Roundabout) have local destinations in Waltham Abbey. Consequently, the scope
to address unmet demand at the junction with sustainable initiatives would appear limited to
improving the coverage, frequency cost and promotion of longer-distance and inter-urban
bus services. However, as highlighted earlier, such initiatives would likely struggle to be
economically viable given the comparably low level of potential patronage expected for
longer distance bus journeys.
It might therefore be reasonable to expect carriageway widening along the A121 Honey Lane
approach to offer the best means of accommodating unmet demand and subsequently
tackling congestion at the junction in the future.
Junction 22 – M25 Junction 26 Southern Roundabout : Summary
Relative level of unmet demand High
Main contributor(s) to unmet demand 2026 Background growth & SLAA developments
Urban or Rural junction? Rural
Sustainable options to consider Improvements to and promotion of inter-urban
bus services
Opportunity for sustainable measures Very Limited
Capacity infrastructure improvements? Likely in medium-term
__________________________________________________________________________________
EB500G
Epping Forest District
Local Plan Highway Impact Assessment
35
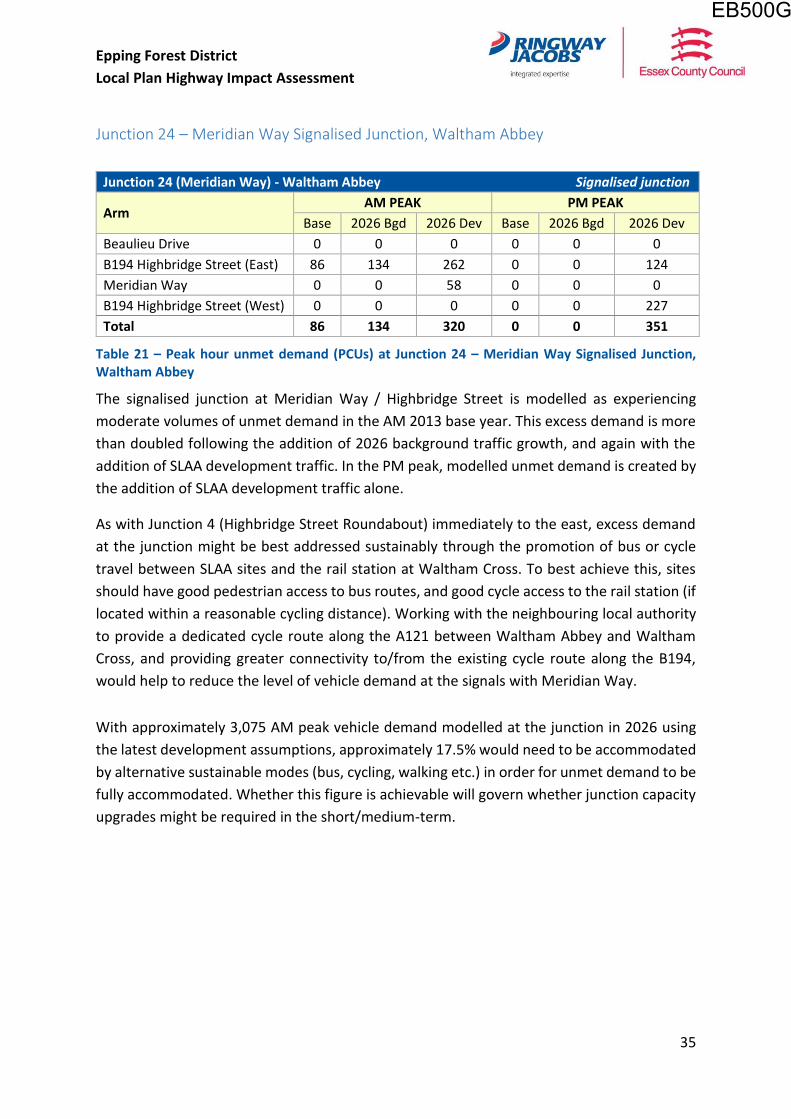
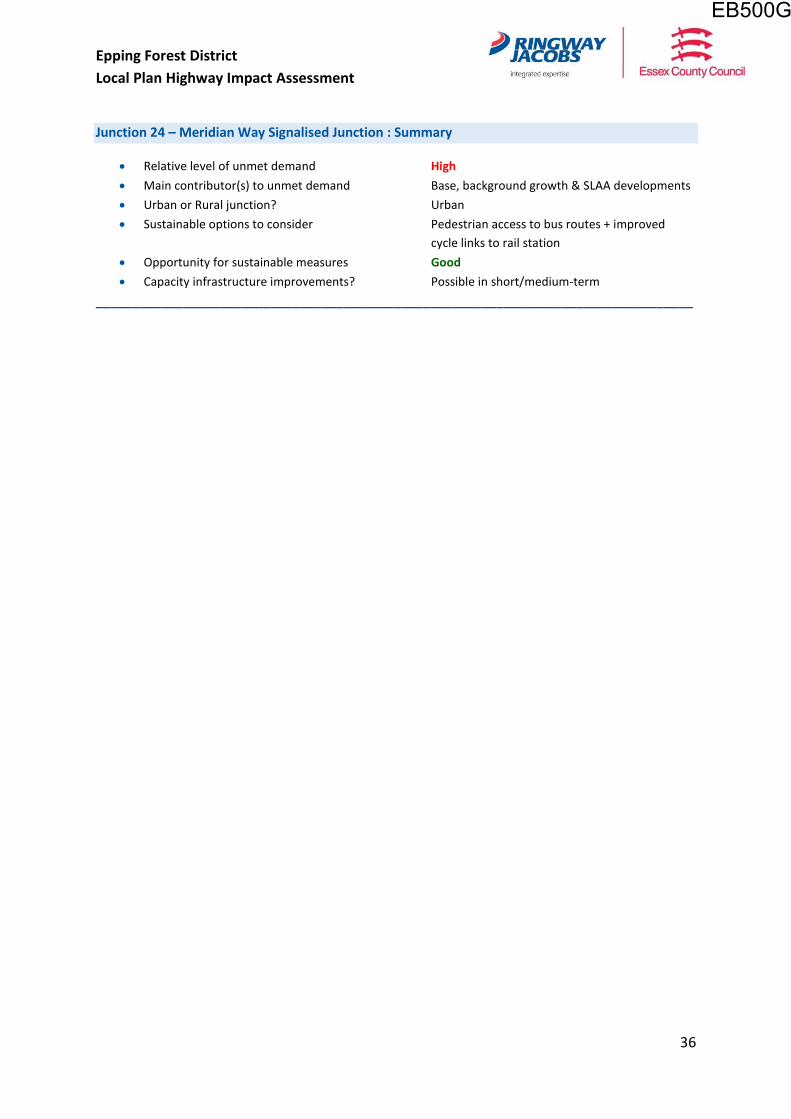
Junction 24 – Meridian Way Signalised Junction, Waltham Abbey
Junction 24 (Meridian Way) - Waltham Abbey Signalised junction
Arm AM PEAK PM PEAK
Base 2026 Bgd 2026 Dev Base 2026 Bgd 2026 Dev
Beaulieu Drive 0 0 0 0 0 0
B194 Highbridge Street (East) 86 134 262 0 0 124
Meridian Way 0 0 58 0 0 0
B194 Highbridge Street (West) 0 0 0 0 0 227
Total 86 134 320 0 0 351
Table 21 – Peak hour unmet demand (PCUs) at Junction 24 – Meridian Way Signalised Junction, Waltham Abbey
The signalised junction at Meridian Way / Highbridge Street is modelled as experiencing
moderate volumes of unmet demand in the AM 2013 base year. This excess demand is more
than doubled following the addition of 2026 background traffic growth, and again with the
addition of SLAA development traffic. In the PM peak, modelled unmet demand is created by
the addition of SLAA development traffic alone.
As with Junction 4 (Highbridge Street Roundabout) immediately to the east, excess demand
at the junction might be best addressed sustainably through the promotion of bus or cycle
travel between SLAA sites and the rail station at Waltham Cross. To best achieve this, sites
should have good pedestrian access to bus routes, and good cycle access to the rail station (if
located within a reasonable cycling distance). Working with the neighbouring local authority
to provide a dedicated cycle route along the A121 between Waltham Abbey and Waltham
Cross, and providing greater connectivity to/from the existing cycle route along the B194,
would help to reduce the level of vehicle demand at the signals with Meridian Way.
With approximately 3,075 AM peak vehicle demand modelled at the junction in 2026 using
the latest development assumptions, approximately 17.5% would need to be accommodated
by alternative sustainable modes (bus, cycling, walking etc.) in order for unmet demand to be
fully accommodated. Whether this figure is achievable will govern whether junction capacity
upgrades might be required in the short/medium-term.
EB500G
Epping Forest District
Local Plan Highway Impact Assessment
36
Junction 24 – Meridian Way Signalised Junction : Summary
Relative level of unmet demand High
Main contributor(s) to unmet demand Base, background growth & SLAA developments
Urban or Rural junction? Urban
Sustainable options to consider Pedestrian access to bus routes + improved
cycle links to rail station
Opportunity for sustainable measures Good
Capacity infrastructure improvements? Possible in short/medium-term
__________________________________________________________________________________
EB500G
Epping Forest District
Local Plan Highway Impact Assessment
37
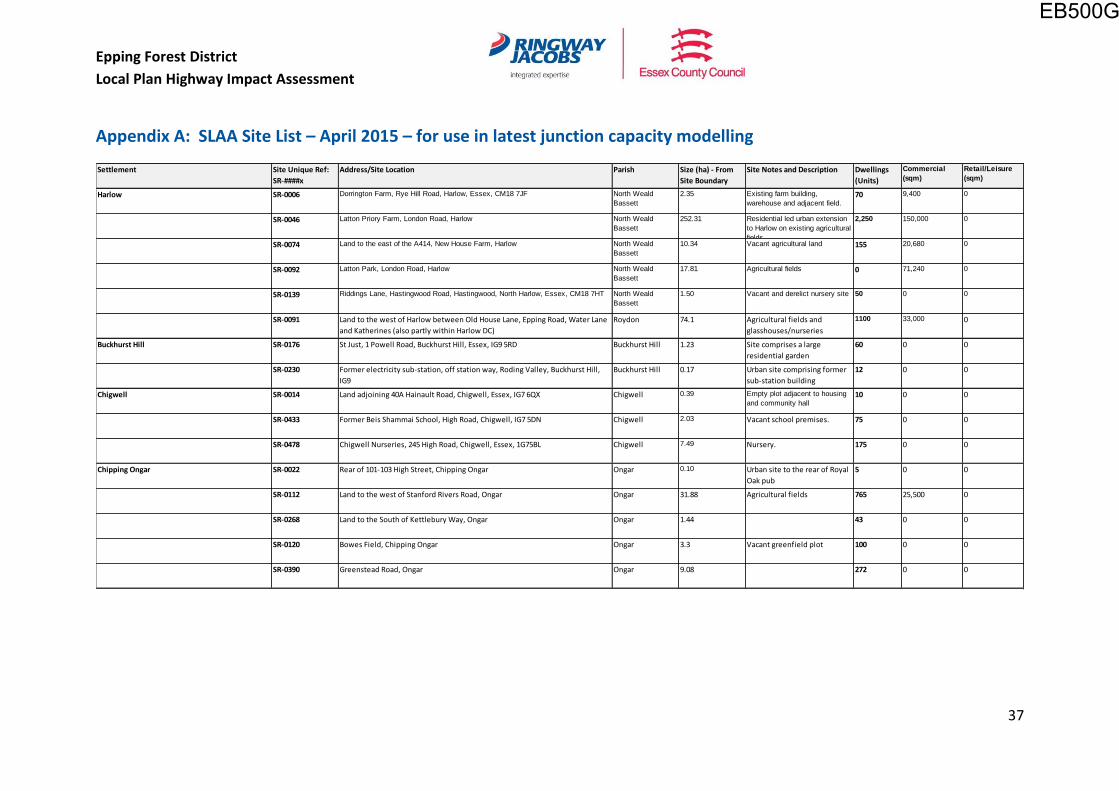
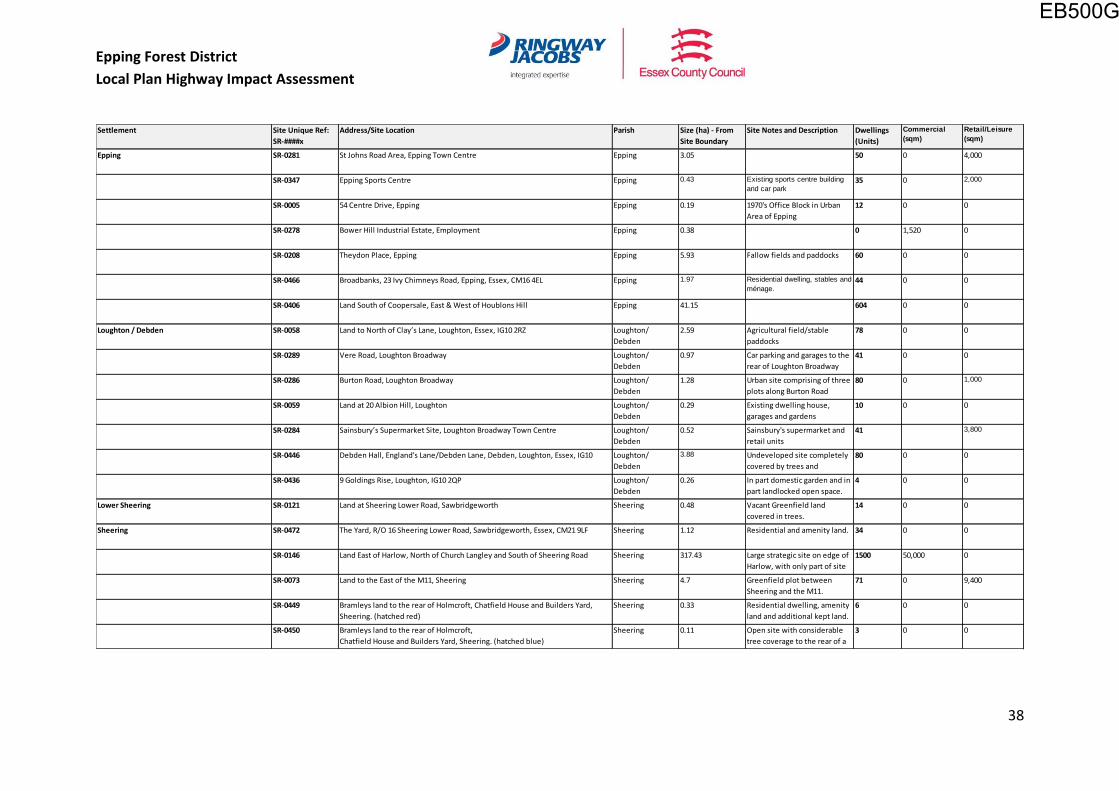
Appendix A: SLAA Site List – April 2015 – for use in latest junction capacity modelling
Settlement Site Unique Ref:
SR-####x
Address/Site Location Parish Size (ha) - From
Site Boundary
Site Notes and Description Dwellings
(Units)
Commercial
(sqm)
Retail/Leisure
(sqm)
Harlow SR-0006 Dorrington Farm, Rye Hill Road, Harlow, Essex, CM18 7JF North Weald
Bassett
2.35 Existing farm building,
warehouse and adjacent field. 70 9,400 0
SR-0046 Latton Priory Farm, London Road, Harlow North Weald
Bassett
252.31 Residential led urban extension
to Harlow on existing agricultural
fields
2,250 150,000 0
SR-0074 Land to the east of the A414, New House Farm, Harlow North Weald
Bassett
10.34 Vacant agricultural land 155 20,680 0
SR-0092 Latton Park, London Road, Harlow North Weald
Bassett
17.81 Agricultural fields 0 71,240 0
SR-0139 Riddings Lane, Hastingwood Road, Hastingwood, North Harlow, Essex, CM18 7HT North Weald
Bassett
1.50 Vacant and derelict nursery site 50 0 0
SR-0091 Land to the west of Harlow between Old House Lane, Epping Road, Water Lane
and Katherines (also partly within Harlow DC)
Roydon 74.1 Agricultural fields and
glasshouses/nurseries
1100 33,000 0
Buckhurst Hill SR-0176 St Just, 1 Powell Road, Buckhurst Hill, Essex, IG9 5RD Buckhurst Hill 1.23 Site comprises a large
residential garden
60 0 0
SR-0230 Former electricity sub-station, off station way, Roding Valley, Buckhurst Hill,
IG9
Buckhurst Hill 0.17 Urban site comprising former
sub-station building
12 0 0
Chigwell SR-0014 Land adjoining 40A Hainault Road, Chigwell, Essex, IG7 6QX Chigwell 0.39 Empty plot adjacent to housing
and community hall10 0 0
SR-0433 Former Beis Shammai School, High Road, Chigwell, IG7 5DN Chigwell 2.03 Vacant school premises. 75 0 0
SR-0478 Chigwell Nurseries, 245 High Road, Chigwell, Essex, 1G75BL Chigwell 7.49 Nursery. 175 0 0
Chipping Ongar SR-0022 Rear of 101-103 High Street, Chipping Ongar Ongar 0.10 Urban site to the rear of Royal
Oak pub
5 0 0
SR-0112 Land to the west of Stanford Rivers Road, Ongar Ongar 31.88 Agricultural fields 765 25,500 0
SR-0268 Land to the South of Kettlebury Way, Ongar Ongar 1.44 43 0 0
SR-0120 Bowes Field, Chipping Ongar Ongar 3.3 Vacant greenfield plot 100 0 0
SR-0390 Greenstead Road, Ongar Ongar 9.08 272 0 0
EB500G
Epping Forest District
Local Plan Highway Impact Assessment
38
Settlement Site Unique Ref:
SR-####x
Address/Site Location Parish Size (ha) - From
Site Boundary
Site Notes and Description Dwellings
(Units)
Commercial
(sqm)
Retail/Leisure
(sqm)
Epping SR-0281 St Johns Road Area, Epping Town Centre Epping 3.05 50 0 4,000
SR-0347 Epping Sports Centre Epping 0.43 Existing sports centre building
and car park35 0 2,000
SR-0005 54 Centre Drive, Epping Epping 0.19 1970's Office Block in Urban
Area of Epping
12 0 0
SR-0278 Bower Hill Industrial Estate, Employment Epping 0.38 0 1,520 0
SR-0208 Theydon Place, Epping Epping 5.93 Fallow fields and paddocks 60 0 0
SR-0466 Broadbanks, 23 Ivy Chimneys Road, Epping, Essex, CM16 4EL Epping 1.97 Residential dwelling, stables and
ménage. 44 0 0
SR-0406 Land South of Coopersale, East & West of Houblons Hill Epping 41.15 604 0 0
Loughton / Debden SR-0058 Land to North of Clay’s Lane, Loughton, Essex, IG10 2RZ Loughton/
Debden
2.59 Agricultural field/stable
paddocks
78 0 0
SR-0289 Vere Road, Loughton Broadway Loughton/
Debden
0.97 Car parking and garages to the
rear of Loughton Broadway
41 0 0
SR-0286 Burton Road, Loughton Broadway Loughton/
Debden
1.28 Urban site comprising of three
plots along Burton Road
identified in Loughton
80 0 1,000
SR-0059 Land at 20 Albion Hill, Loughton Loughton/
Debden
0.29 Existing dwelling house,
garages and gardens
10 0 0
SR-0284 Sainsbury’s Supermarket Site, Loughton Broadway Town Centre Loughton/
Debden
0.52 Sainsbury's supermarket and
retail units
41 3,800
SR-0446 Debden Hall, England's Lane/Debden Lane, Debden, Loughton, Essex, IG10 Loughton/
Debden
3.88 Undeveloped site completely
covered by trees and
vegetation.
80 0 0
SR-0436 9 Goldings Rise, Loughton, IG10 2QP Loughton/
Debden
0.26 In part domestic garden and in
part landlocked open space.
4 0 0
Lower Sheering SR-0121 Land at Sheering Lower Road, Sawbridgeworth Sheering 0.48 Vacant Greenfield land
covered in trees.
14 0 0
Sheering SR-0472 The Yard, R/O 16 Sheering Lower Road, Sawbridgeworth, Essex, CM21 9LF Sheering 1.12 Residential and amenity land. 34 0 0
SR-0146 Land East of Harlow, North of Church Langley and South of Sheering Road Sheering 317.43 Large strategic site on edge of
Harlow, with only part of site
within Epping Forest DC.
1500 50,000 0
SR-0073 Land to the East of the M11, Sheering Sheering 4.7 Greenfield plot between
Sheering and the M11.
71 0 9,400
SR-0449 Bramleys land to the rear of Holmcroft, Chatfield House and Builders Yard,
Sheering. (hatched red)
Sheering 0.33 Residential dwelling, amenity
land and additional kept land.
6 0 0
SR-0450 Bramleys land to the rear of Holmcroft,
Chatfield House and Builders Yard, Sheering. (hatched blue)
Sheering 0.11 Open site with considerable
tree coverage to the rear of a
hard standing area and vacant
3 0 0
EB500G
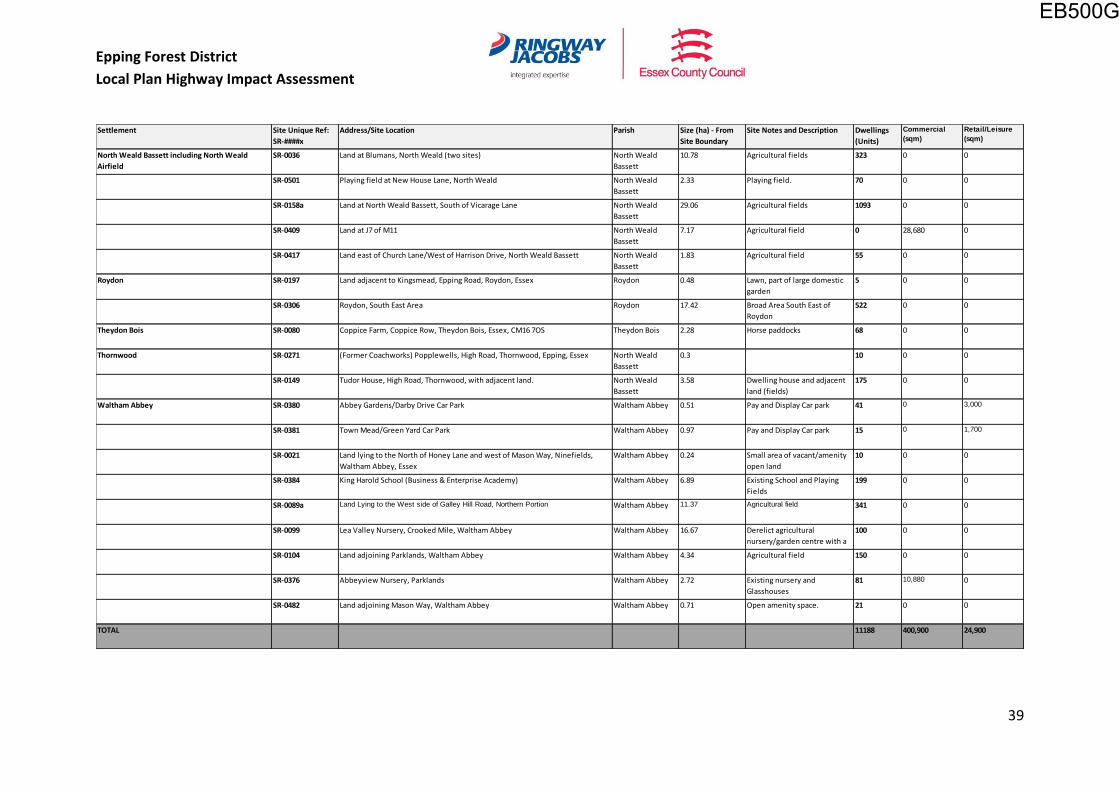
Epping Forest District
Local Plan Highway Impact Assessment
39
Settlement Site Unique Ref:
SR-####x
Address/Site Location Parish Size (ha) - From
Site Boundary
Site Notes and Description Dwellings
(Units)
Commercial
(sqm)
Retail/Leisure
(sqm)
North Weald Bassett including North Weald
Airfield
SR-0036 Land at Blumans, North Weald (two sites) North Weald
Bassett
10.78 Agricultural fields 323 0 0
SR-0501 Playing field at New House Lane, North Weald North Weald
Bassett
2.33 Playing field. 70 0 0
SR-0158a Land at North Weald Bassett, South of Vicarage Lane North Weald
Bassett
29.06 Agricultural fields 1093 0 0
SR-0409 Land at J7 of M11 North Weald
Bassett
7.17 Agricultural field 0 28,680 0
SR-0417 Land east of Church Lane/West of Harrison Drive, North Weald Bassett North Weald
Bassett
1.83 Agricultural field 55 0 0
Roydon SR-0197 Land adjacent to Kingsmead, Epping Road, Roydon, Essex Roydon 0.48 Lawn, part of large domestic
garden
5 0 0
SR-0306 Roydon, South East Area Roydon 17.42 Broad Area South East of
Roydon
522 0 0
Theydon Bois SR-0080 Coppice Farm, Coppice Row, Theydon Bois, Essex, CM16 7OS Theydon Bois 2.28 Horse paddocks 68 0 0
Thornwood SR-0271 (Former Coachworks) Popplewells, High Road, Thornwood, Epping, Essex North Weald
Bassett
0.3 10 0 0
SR-0149 Tudor House, High Road, Thornwood, with adjacent land. North Weald
Bassett
3.58 Dwelling house and adjacent
land (fields)
175 0 0
Waltham Abbey SR-0380 Abbey Gardens/Darby Drive Car Park Waltham Abbey 0.51 Pay and Display Car park 41 0 3,000
SR-0381 Town Mead/Green Yard Car Park Waltham Abbey 0.97 Pay and Display Car park 15 0 1,700
SR-0021 Land lying to the North of Honey Lane and west of Mason Way, Ninefields,
Waltham Abbey, Essex
Waltham Abbey 0.24 Small area of vacant/amenity
open land
10 0 0
SR-0384 King Harold School (Business & Enterprise Academy) Waltham Abbey 6.89 Existing School and Playing
Fields
199 0 0
SR-0089a Land Lying to the West side of Galley Hill Road, Northern Portion Waltham Abbey 11.37 Agricultural field 341 0 0
SR-0099 Lea Valley Nursery, Crooked Mile, Waltham Abbey Waltham Abbey 16.67 Derelict agricultural
nursery/garden centre with a
few small warehouses on site
100 0 0
SR-0104 Land adjoining Parklands, Waltham Abbey Waltham Abbey 4.34 Agricultural field 150 0 0
SR-0376 Abbeyview Nursery, Parklands Waltham Abbey 2.72 Existing nursery and
Glasshouses
81 10,880 0
SR-0482 Land adjoining Mason Way, Waltham Abbey Waltham Abbey 0.71 Open amenity space. 21 0 0
TOTAL 11188 400,900 24,900
EB500G
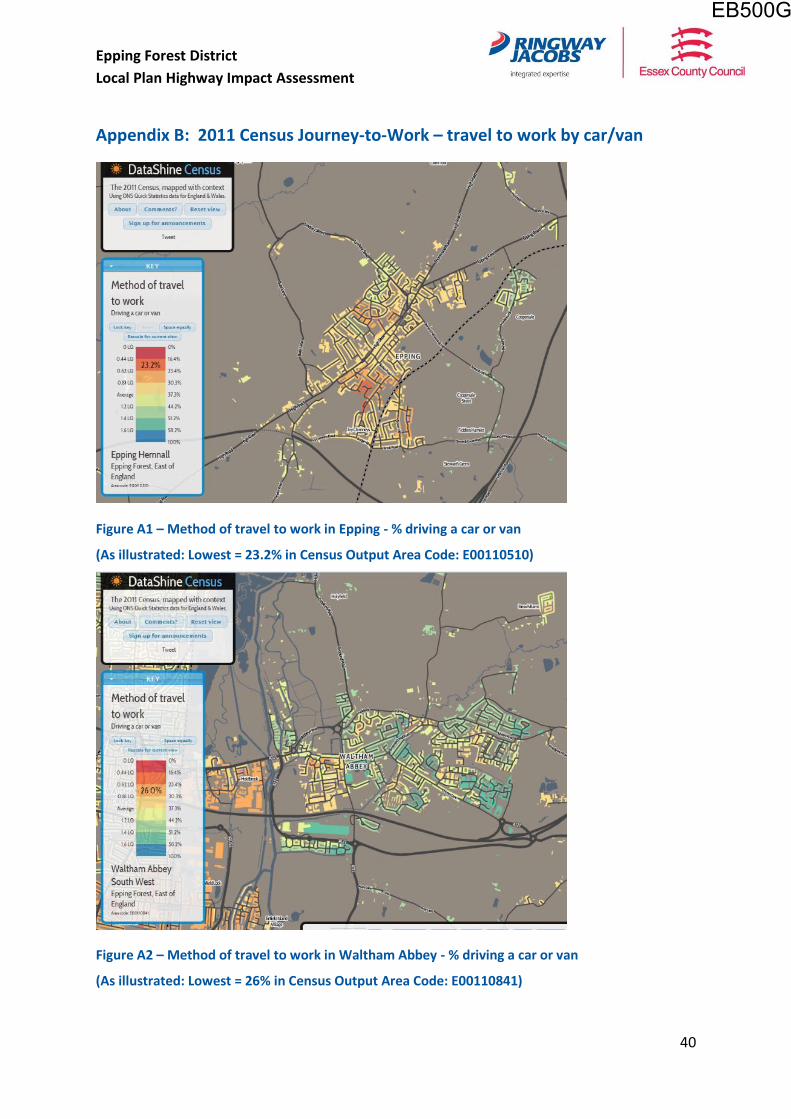
Epping Forest District
Local Plan Highway Impact Assessment
40
Appendix B: 2011 Census Journey-to-Work – travel to work by car/van
Figure A1 – Method of travel to work in Epping - % driving a car or van
(As illustrated: Lowest = 23.2% in Census Output Area Code: E00110510)
Figure A2 – Method of travel to work in Waltham Abbey - % driving a car or van
(As illustrated: Lowest = 26% in Census Output Area Code: E00110841)
EB500G
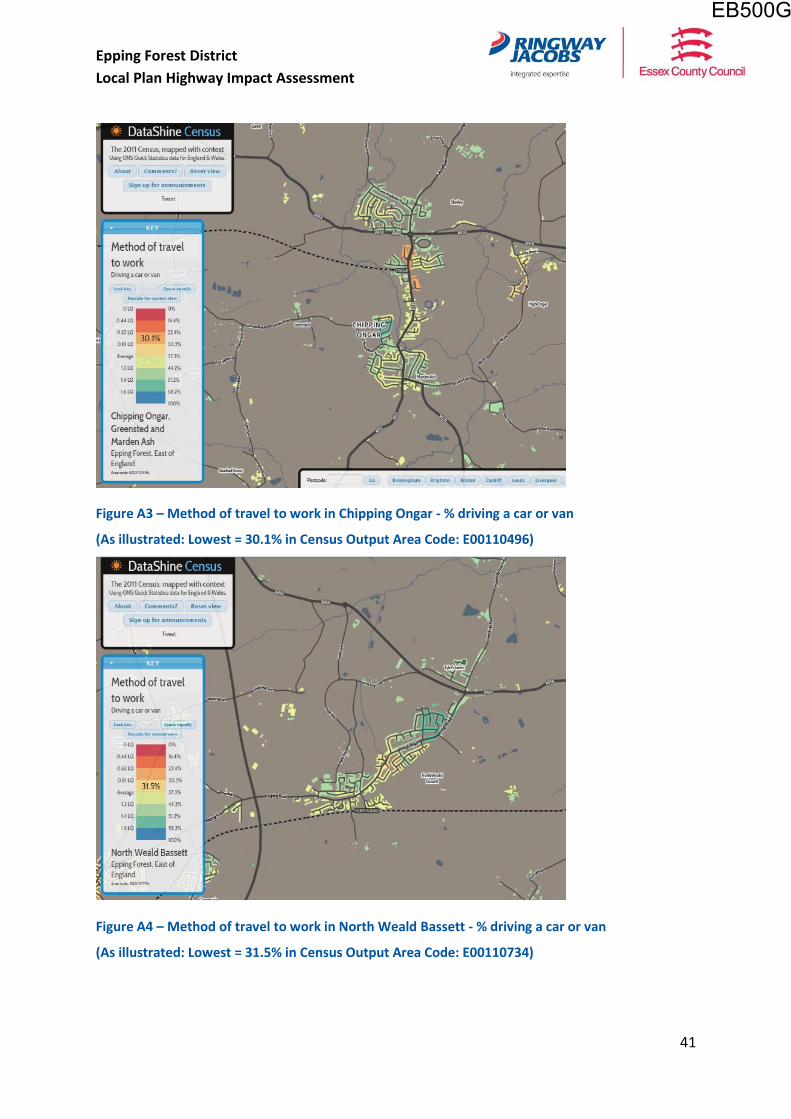
Epping Forest District
Local Plan Highway Impact Assessment
41
Figure A3 – Method of travel to work in Chipping Ongar - % driving a car or van
(As illustrated: Lowest = 30.1% in Census Output Area Code: E00110496)
Figure A4 – Method of travel to work in North Weald Bassett - % driving a car or van
(As illustrated: Lowest = 31.5% in Census Output Area Code: E00110734)
EB500G
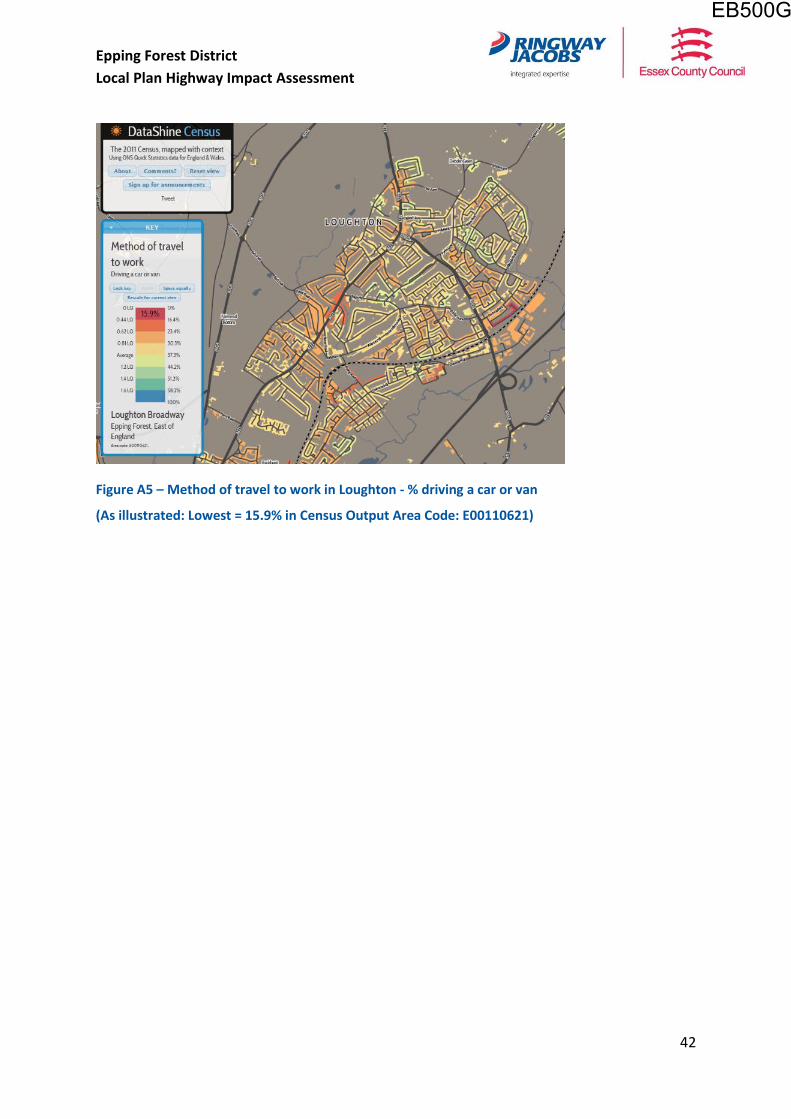
Epping Forest District
Local Plan Highway Impact Assessment
42
Figure A5 – Method of travel to work in Loughton - % driving a car or van
(As illustrated: Lowest = 15.9% in Census Output Area Code: E00110621)
EB500G
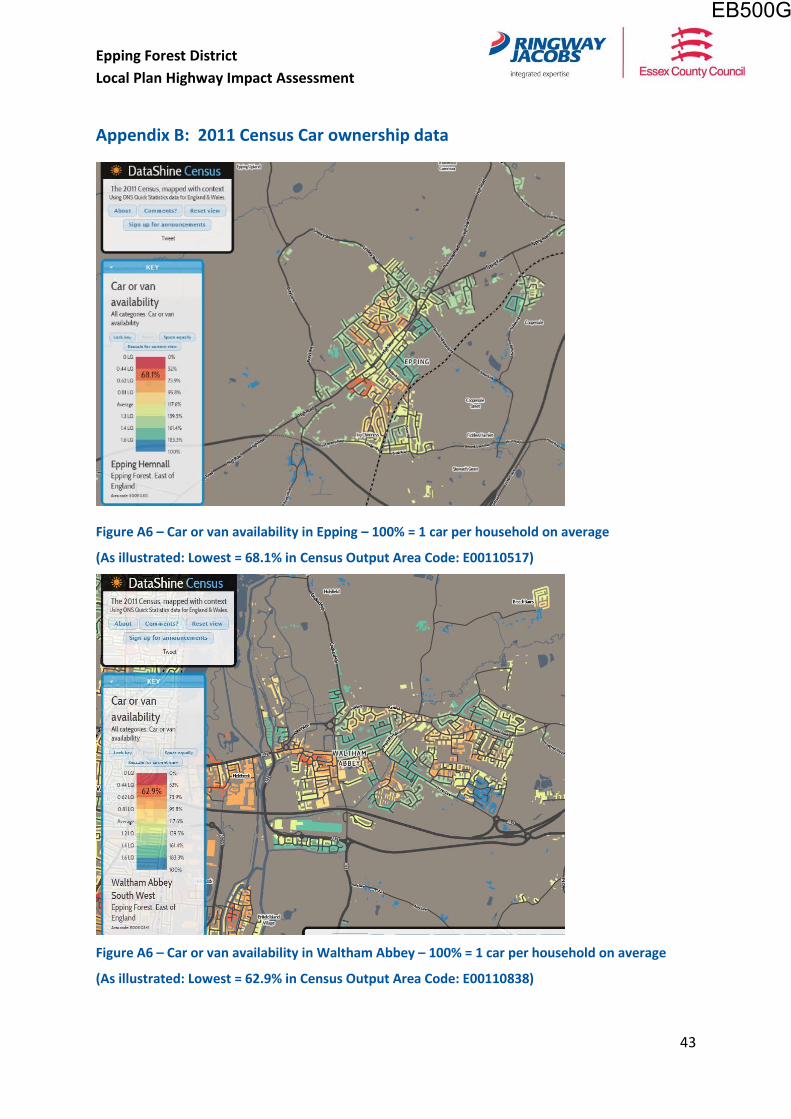
Epping Forest District
Local Plan Highway Impact Assessment
43
Appendix B: 2011 Census Car ownership data
Figure A6 – Car or van availability in Epping – 100% = 1 car per household on average
(As illustrated: Lowest = 68.1% in Census Output Area Code: E00110517)
Figure A6 – Car or van availability in Waltham Abbey – 100% = 1 car per household on average
(As illustrated: Lowest = 62.9% in Census Output Area Code: E00110838)
EB500G
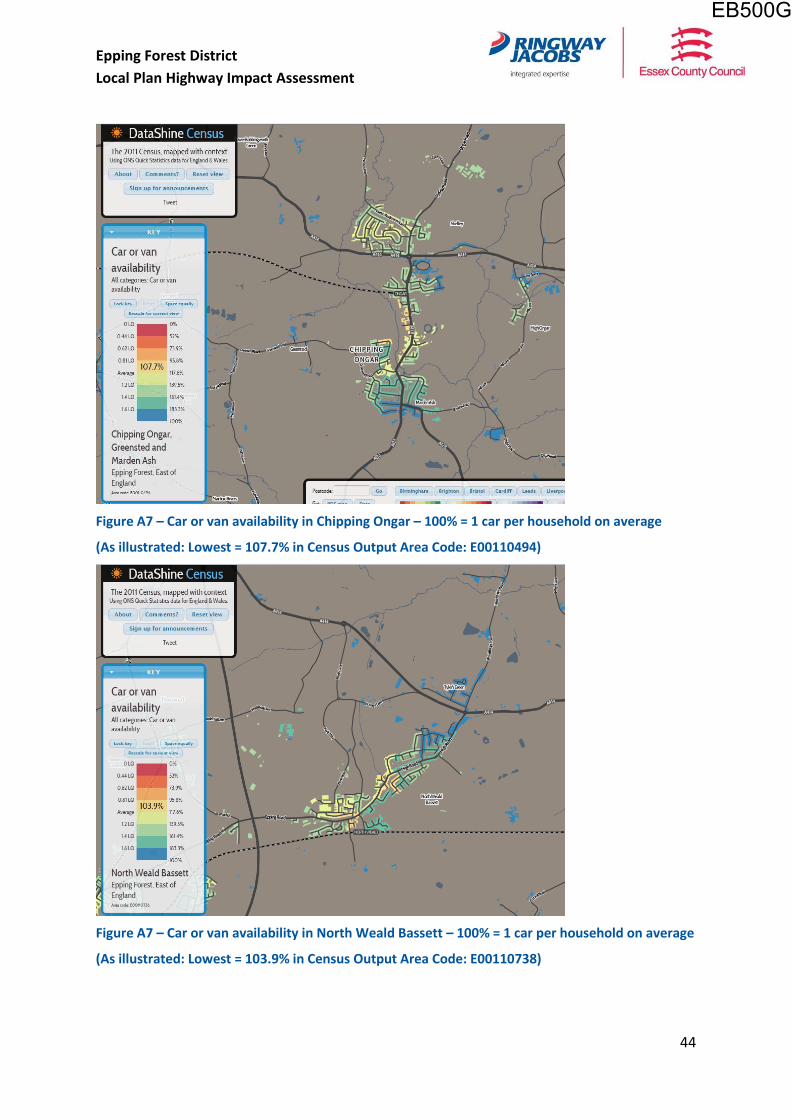
Epping Forest District
Local Plan Highway Impact Assessment
44
Figure A7 – Car or van availability in Chipping Ongar – 100% = 1 car per household on average
(As illustrated: Lowest = 107.7% in Census Output Area Code: E00110494)
Figure A7 – Car or van availability in North Weald Bassett – 100% = 1 car per household on average
(As illustrated: Lowest = 103.9% in Census Output Area Code: E00110738)
EB500G
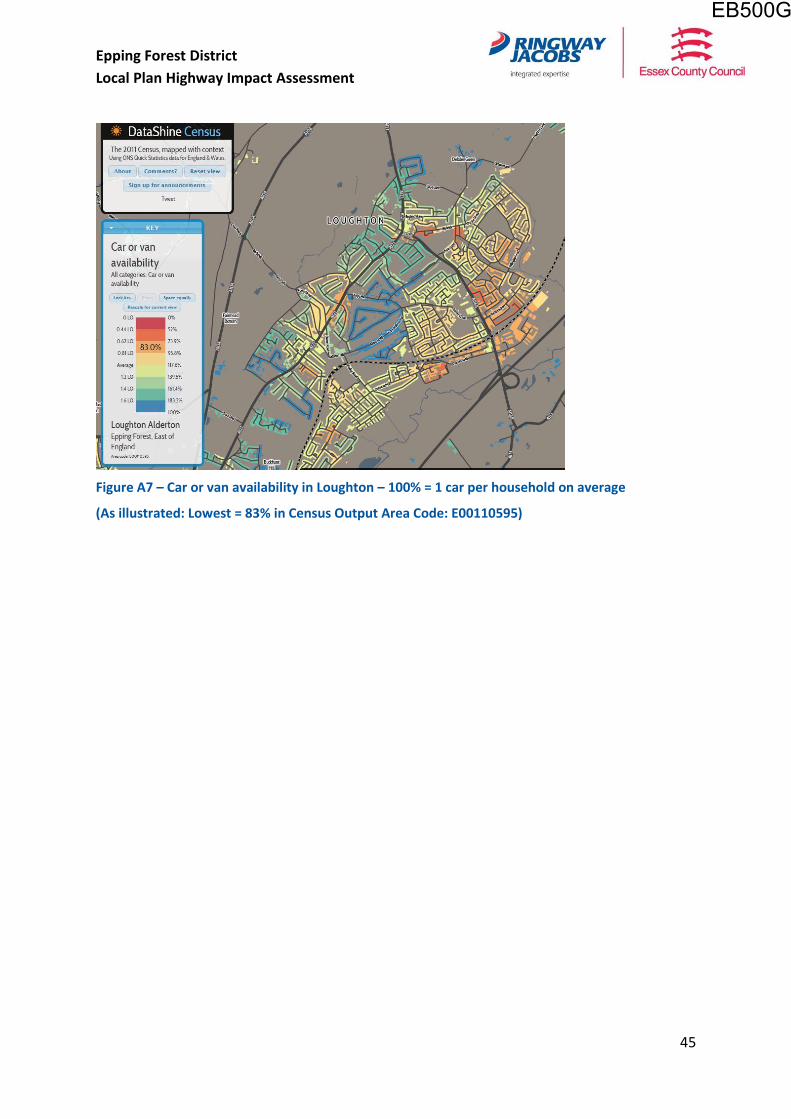
Epping Forest District
Local Plan Highway Impact Assessment
45
Figure A7 – Car or van availability in Loughton – 100% = 1 car per household on average
(As illustrated: Lowest = 83% in Census Output Area Code: E00110595)
EB500G