Embed Size (px)
Citation preview
1
Sustainable Development Goals Covered
SDG 3.9:
By 2030, substantially reduce the number of deaths and illnesses from hazardous chemicals and air,
water and soil pollution and contamination
SDG 11.6:
By 2030, reduce the adverse per capita environmental impact of cities, including by paying special
attention to air quality and municipal and other waste management
SDG 12.4:
By 2020, achieve the environmentally sound management of chemicals and all wastes throughout their
life cycle, in accordance with agreed international frameworks, and significantly reduce their release to
air, water and soil in order to minimize their adverse impacts on human health and the environment.
Countries: Kenya, Uganda, Nigeria, Tanzania
Data Types:
Time Series Data
Technologies:
Air quality Sensors monitoring Particulate Matter 2.5 and Particulate Matter 10
2
Table of Contents
About 4
Project Objective 5
Executive Summary 6
Methodology 8
Introduction 10
Air Quality Index (AQI) Basics 11
Major Air Pollutants 12
Data sources/indicators from existing citizen science sensor networks 14
Commentary on the different Air Quality Sensors on the Continent 16
Collating Air Quality Data from Existing Networks into a Private Experimental Repository withReal Time Updates 17
Comparative analysis of low-cost sensor hardware kits used by citizen science air quality datainitiatives 21
Summary Points on Side to side Analysis 33
Particulate Matter Sensor Type 35
Interactive courseware and supporting training materials 36
Risk mitigation 37
Output indicators 38
Lessons Learned 39
Advantages and Disadvantages of the Private Repository. 41
Potential of replicability and scalability. 42
Way Forward 43
Conclusions 44
Final outputs 45
Bibliography 46
About this Project 49
3
About
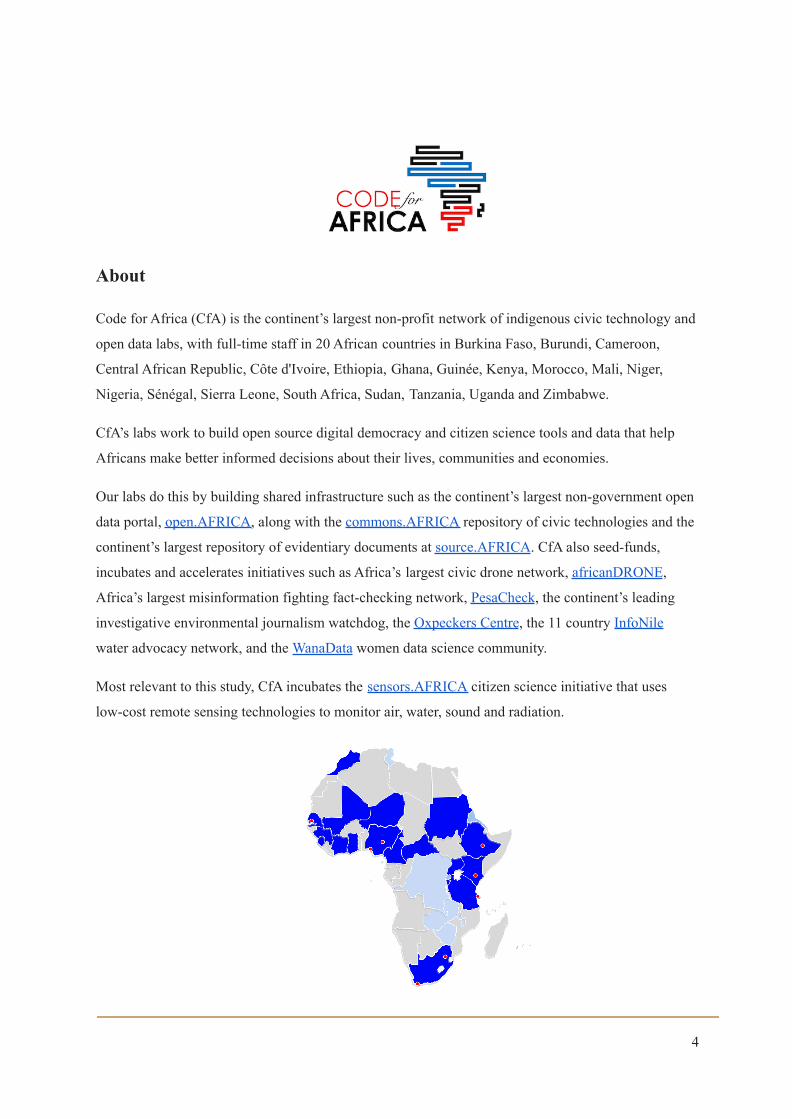
Code for Africa (CfA) is the continent’s largest non-profit network of indigenous civic technology and
open data labs, with full-time staff in 20 African countries in Burkina Faso, Burundi, Cameroon,
Central African Republic, Côte d'Ivoire, Ethiopia, Ghana, Guinée, Kenya, Morocco, Mali, Niger,
Nigeria, Sénégal, Sierra Leone, South Africa, Sudan, Tanzania, Uganda and Zimbabwe.
CfA’s labs work to build open source digital democracy and citizen science tools and data that help
Africans make better informed decisions about their lives, communities and economies.
Our labs do this by building shared infrastructure such as the continent’s largest non-government open
data portal, open.AFRICA, along with the commons.AFRICA repository of civic technologies and the
continent’s largest repository of evidentiary documents at source.AFRICA. CfA also seed-funds,
incubates and accelerates initiatives such as Africa’s largest civic drone network, africanDRONE,
Africa’s largest misinformation fighting fact-checking network, PesaCheck, the continent’s leading
investigative environmental journalism watchdog, the Oxpeckers Centre, the 11 country InfoNile
water advocacy network, and the WanaData women data science community.
Most relevant to this study, CfA incubates the sensors.AFRICA citizen science initiative that uses
low-cost remote sensing technologies to monitor air, water, sound and radiation.
4
Project Objective
Air pollution is a fast rising but often invisible public health crisis across Africa that impacts on
communities who often don’t have the infrastructure or other resources to quickly identify or combat
the problem. CfA is therefore conducting ongoing experimentation and research with low-cost
technologies that help grassroots communities and civic watchdogs track and analyze, in near
real-time, granular data on local air quality in select African countries, including Kenya, Nigeria,
South Africa and Tanzania.
CfA has for the purposes of this report worked only with existing available data, drawing on data from
citizen science initiatives it seed-funded or otherwise supported in the past, as well as from additional
independent projects at development agencies and research institutes elsewhere on the continent.
Specifically, this report seeks to provide insights on the following objectives:
1. Identifying the most useful data sources/indicators from existing citizen science sensor
networks that may offer potential complementary/comparative air quality insights in the
Africa Region to inform the Bank’s efforts to realize SDGs 3.9, 11.6, and 12.4
2. Identifying new low-cost citizen science-driven data collection and evaluation methods
focused on air quality to help share the Bank’s policy development strategies and wider efforts
to mitigate impacts of air pollution.
3. Providing comparative analysis of the current low-cost hardware solutions used by citizen
science networks to help the Bank evaluate potential synergies or alignment with efforts to
monitor air quality by government, and other partners
4. Collating the existing air quality data from citizen science networks, and structuring this into a
consolidated private repository that updates in real-time, and is accessible only by the Bank
team (adhering to any recommendations by the Bank’s Office of Information Security and
Access to Information Committee) for granular analysis and review.
5
Executive Summary
Reliable, up-to-date air quality data is scarce in Africa. There are few official air quality monitoring
services on the continent, and the existing citizen science or academic initiatives are fragmented and
often sporadically offline.
This report therefore serves as a scoping study for what is missing, as much as what exists. CfA
identified 20 substantive citizen science or academic air quality networks on the continent. It also
profiled a major United Nations Environmental Program (UNEP) initiative to aggregate both citizen
science and official air quality data, as an important additional civic resource.
Only a fraction of these sources however provide access to their data, and even fewer offer open APIs
(application program interfaces) for automated access and analysis. CfA was able to use the four
available open APIs to aggregate over 19 million data points from 1,085 sensors at 381 nodes across
the continent. The resulting data repository is over 13gig in size.
We note in our findings that it is important to note that not all sensors are online at any one time, with
many offline for months at a time. Anecdotal feedback indicates that resources are a major constraint
in maintaining sensors, and keeping them connected to communication grids.
The most common indicator measured by the sensors in this study is Particulate Matter, primarily
PM10 and PM2.5. Some sensors also measure Temperature, Relative Humidity (RH), Noise levels,
and GPS location. A small number of networks measure Ozone and PM1.0, but these are not part of
our primary focus as their coverage is not extensive. All the networks aggregated into the research
repository for this study provide both current and previous data at the respective sites. The four data
sources included in the repository are Air QO, OpenAQ (Open Data Durban), Purple Air and
sensors.AFRICA. The OpenAQ data had to be scraped, as no API was available.
As indicated in our recommendations, the number of data sources can be substantially increased with
fairly modest software engineering support to help citizen science networks develop usable APIs.
Making data more easily accessible has big impacts. Our literature review of citizen science
case-studies records how grassroots shantytown communities in Nairobi used data from low-cost air
sensors provided by sensors.AFRICA to challenge local factories before the Kenyan Environmental
Tribunal, winning official sanctions and protection. We also note how OpenAQ created courseware
and education resources to embed their sensors into shantytown schools in South Africa’s KwaZulu
Natal province, with teachers and pupils serving as custodians of the hardware and with the data used
6
by local community activists to lobby for curbs on pollution. The sensors have remained online, long
after the project’s original funding ended.
The major challenge faced by citizen science pioneers project went further ahead and did a
comparative analysis of the different existing low-cost hardware kits within these networks thus
identifying the strong points of each network which assist a lot with the data output of the repository.
An interactive courseware and training material on how to develop and use low cost sensors using
open source firmware and easily available hardware was also developed.
Some data was brought together and structured in a private repository.
7
Methodology
Our approach to aggregate data on citizen science initiatives in Africa was done using these
methodologies as indicated in the following steps, however, not all the steps were followed due to
various challenges.
Step 1: Surveying all current sources for air quality data in Africa on existing global open data portals,
on GitHub and on air monitoring websites and reviewing case-studies and methodology used on the
African Continent and elsewhere around the world.
Step 2: Deconstructing and analysing the most common low cost sensors hardware kits currently in
use by citizens science sensor initiatives in Africa, for side-by-side comparative analysis.
Step 3: Establishing streamlined team-to-team communication channels with the Bank’s urban
team/partners for immediate feedback and/or inputs.
Step 4: Developing interactive courseware with supporting training material on ways to use low-cost
hardware and open source software tools to collect and evaluate new air quality data. We will do this
by collating existing courseware for air quality data projects focused on Africa, as well as a number of
international best-practice benchmarks, finally followed by testing with citizen science networks on
the continent.
Step 5: Consolidating all the insights into a detailed report that captures findings, case studies, and
recommendations arising from this research project to inform GP SURR operational teams about
possible new low-cost data collection and evaluation methods for air quality in the African Region.
Step 6: Assist the Bank to develop policy notes that highlight key pollution challenges, and their
implications for city livability and productivity in Africa. We will do this in response to requests by the
Bank team, leveraging input from our university and citizen science networks .
8
Key Terminologies and Abbreviations
AQ - Air Quality
AQI - Air Quality Index
CH2O - Formaldehyde
CO - Carbon monoxide
CO2 - Carbon monoxide
FEM - Federal equivalent method
FRM - Federal reference method
NO2- Nitrogen Dioxide
03 - Ground level Ozone
PM - Particulate Matter
Low cost sensors - LCS
RH - Relative humidity
SO2 - Sulphur dioxide
TVOC - Total volatile organic compound
US EPA - United States Environmental Protection Agency
US EPA AQI - United States Environmental Protection Agency - Air quality index
9
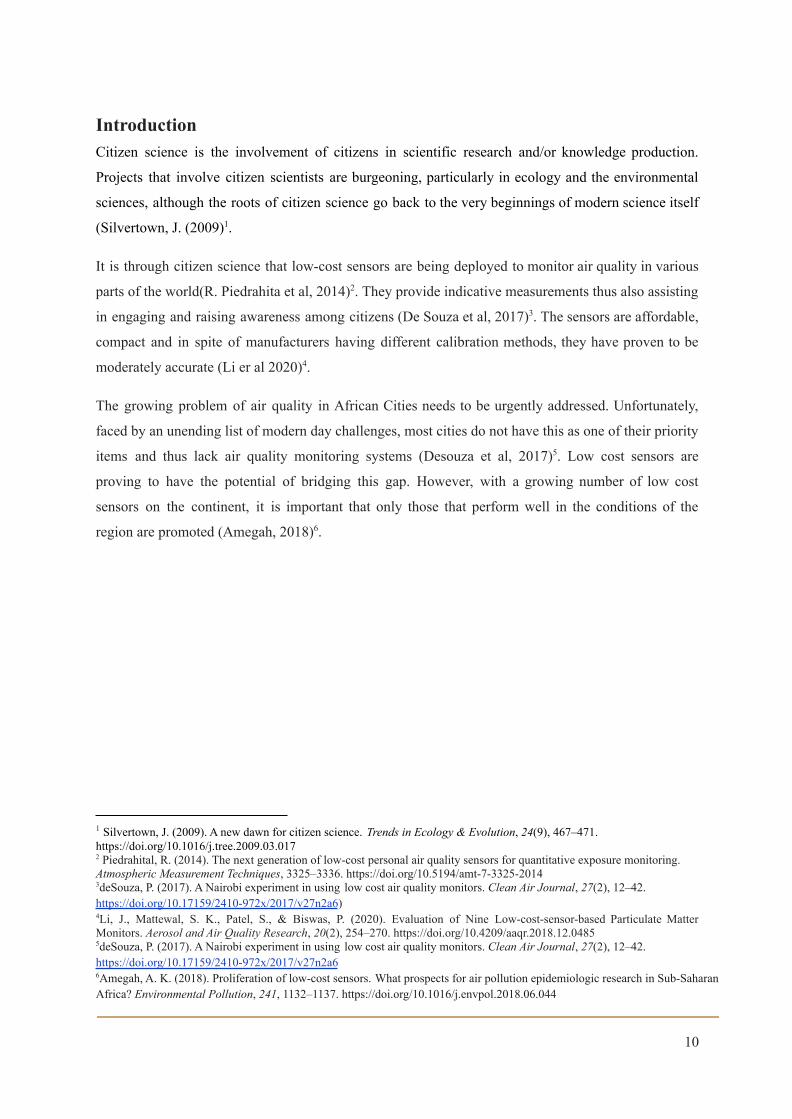
IntroductionCitizen science is the involvement of citizens in scientific research and/or knowledge production.
Projects that involve citizen scientists are burgeoning, particularly in ecology and the environmental
sciences, although the roots of citizen science go back to the very beginnings of modern science itself
(Silvertown, J. (2009)1.
It is through citizen science that low-cost sensors are being deployed to monitor air quality in various
parts of the world(R. Piedrahita et al, 2014)2. They provide indicative measurements thus also assisting
in engaging and raising awareness among citizens (De Souza et al, 2017)3. The sensors are affordable,
compact and in spite of manufacturers having different calibration methods, they have proven to be
moderately accurate (Li er al 2020)4.
The growing problem of air quality in African Cities needs to be urgently addressed. Unfortunately,
faced by an unending list of modern day challenges, most cities do not have this as one of their priority
items and thus lack air quality monitoring systems (Desouza et al, 2017)5. Low cost sensors are
proving to have the potential of bridging this gap. However, with a growing number of low cost
sensors on the continent, it is important that only those that perform well in the conditions of the
region are promoted (Amegah, 2018)6.
6Amegah, A. K. (2018). Proliferation of low-cost sensors. What prospects for air pollution epidemiologic research in Sub-SaharanAfrica? Environmental Pollution, 241, 1132–1137. https://doi.org/10.1016/j.envpol.2018.06.044
5deSouza, P. (2017). A Nairobi experiment in using low cost air quality monitors. Clean Air Journal, 27(2), 12–42.https://doi.org/10.17159/2410-972x/2017/v27n2a6
4Li, J., Mattewal, S. K., Patel, S., & Biswas, P. (2020). Evaluation of Nine Low-cost-sensor-based Particulate MatterMonitors. Aerosol and Air Quality Research, 20(2), 254–270. https://doi.org/10.4209/aaqr.2018.12.0485
3deSouza, P. (2017). A Nairobi experiment in using low cost air quality monitors. Clean Air Journal, 27(2), 12–42.https://doi.org/10.17159/2410-972x/2017/v27n2a6)
2 Piedrahital, R. (2014). The next generation of low-cost personal air quality sensors for quantitative exposure monitoring.Atmospheric Measurement Techniques, 3325–3336. https://doi.org/10.5194/amt-7-3325-2014
1 Silvertown, J. (2009). A new dawn for citizen science. Trends in Ecology & Evolution, 24(9), 467–471.https://doi.org/10.1016/j.tree.2009.03.017
10
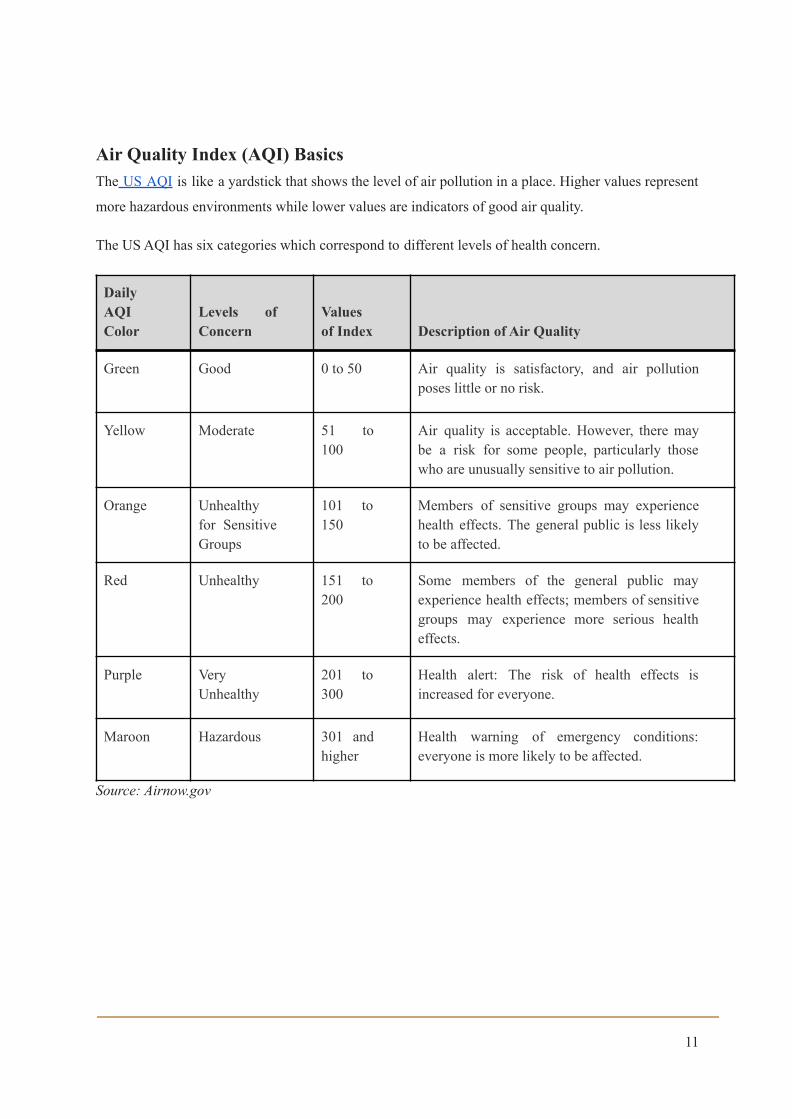
Air Quality Index (AQI) BasicsThe US AQI is like a yardstick that shows the level of air pollution in a place. Higher values represent
more hazardous environments while lower values are indicators of good air quality.
The US AQI has six categories which correspond to different levels of health concern.
DailyAQIColor
Levels ofConcern
Valuesof Index Description of Air Quality
Green Good 0 to 50 Air quality is satisfactory, and air pollutionposes little or no risk.
Yellow Moderate 51 to100
Air quality is acceptable. However, there maybe a risk for some people, particularly thosewho are unusually sensitive to air pollution.
Orange Unhealthyfor SensitiveGroups
101 to150
Members of sensitive groups may experiencehealth effects. The general public is less likelyto be affected.
Red Unhealthy 151 to200
Some members of the general public mayexperience health effects; members of sensitivegroups may experience more serious healtheffects.
Purple VeryUnhealthy
201 to300
Health alert: The risk of health effects isincreased for everyone.
Maroon Hazardous 301 andhigher
Health warning of emergency conditions:everyone is more likely to be affected.
Source: Airnow.gov
11
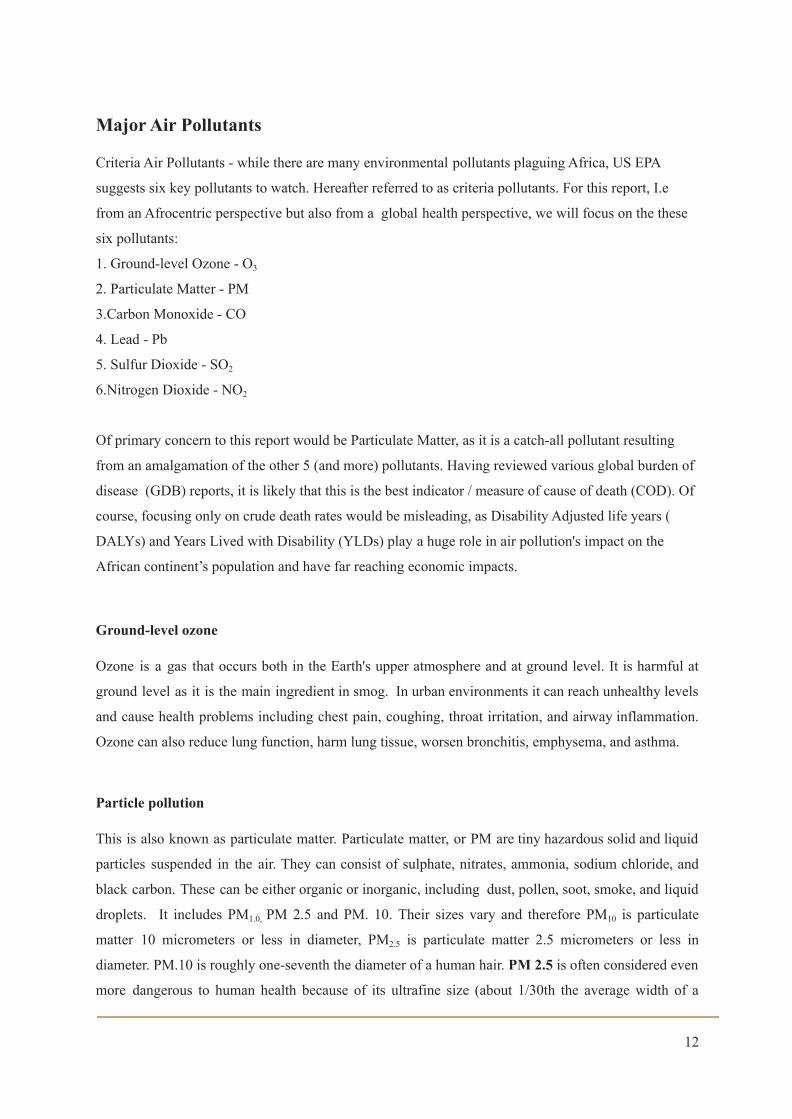
Major Air Pollutants
Criteria Air Pollutants - while there are many environmental pollutants plaguing Africa, US EPA
suggests six key pollutants to watch. Hereafter referred to as criteria pollutants. For this report, I.e
from an Afrocentric perspective but also from a global health perspective, we will focus on the these
six pollutants:
1. Ground-level Ozone - O3
2. Particulate Matter - PM
3.Carbon Monoxide - CO
4. Lead - Pb
5. Sulfur Dioxide - SO2
6.Nitrogen Dioxide - NO2
Of primary concern to this report would be Particulate Matter, as it is a catch-all pollutant resulting
from an amalgamation of the other 5 (and more) pollutants. Having reviewed various global burden of
disease (GDB) reports, it is likely that this is the best indicator / measure of cause of death (COD). Of
course, focusing only on crude death rates would be misleading, as Disability Adjusted life years (
DALYs) and Years Lived with Disability (YLDs) play a huge role in air pollution's impact on the
African continent’s population and have far reaching economic impacts.
Ground-level ozone
Ozone is a gas that occurs both in the Earth's upper atmosphere and at ground level. It is harmful at
ground level as it is the main ingredient in smog. In urban environments it can reach unhealthy levels
and cause health problems including chest pain, coughing, throat irritation, and airway inflammation.
Ozone can also reduce lung function, harm lung tissue, worsen bronchitis, emphysema, and asthma.
Particle pollution
This is also known as particulate matter. Particulate matter, or PM are tiny hazardous solid and liquid
particles suspended in the air. They can consist of sulphate, nitrates, ammonia, sodium chloride, and
black carbon. These can be either organic or inorganic, including dust, pollen, soot, smoke, and liquid
droplets. It includes PM1.0, PM 2.5 and PM. 10. Their sizes vary and therefore PM10 is particulate
matter 10 micrometers or less in diameter, PM2.5 is particulate matter 2.5 micrometers or less in
diameter. PM.10 is roughly one-seventh the diameter of a human hair. PM 2.5 is often considered even
more dangerous to human health because of its ultrafine size (about 1/30th the average width of a
12
human hair). These pollutants are produced by polluting fuels and technologies, and are known
to exceed WHO-recommended levels by a factor of 100 in poorly ventilated dwellings, along
streets polluted by vehicular emissions, within neighbourhoods close to industrial sites and
within industrial zones.
Carbon monoxide, Nitrogen dioxide, Sulphur Dioxide
Carbon monoxide (CO) is a colorless and odorless gas but very harmful when inhaled in large
amounts. Sources of CO include unvented kerosene and gas space heaters, leaking chimneys and
furnaces, and gas stoves at household level. Nitrogen Dioxide (NO2) is part of a group of gases called
nitrogen oxides (NOx). No2 is of the greatest concern within this group due to its effects on human
health. Sulphur dioxide (SO2) is part of the group of gases called Sulphur oxides SOx. The largest
source of SO2 is the burning of fossil fuels by power plants and other industrial facilities. These gasses
are common pollutants but do not form part of this study.
13
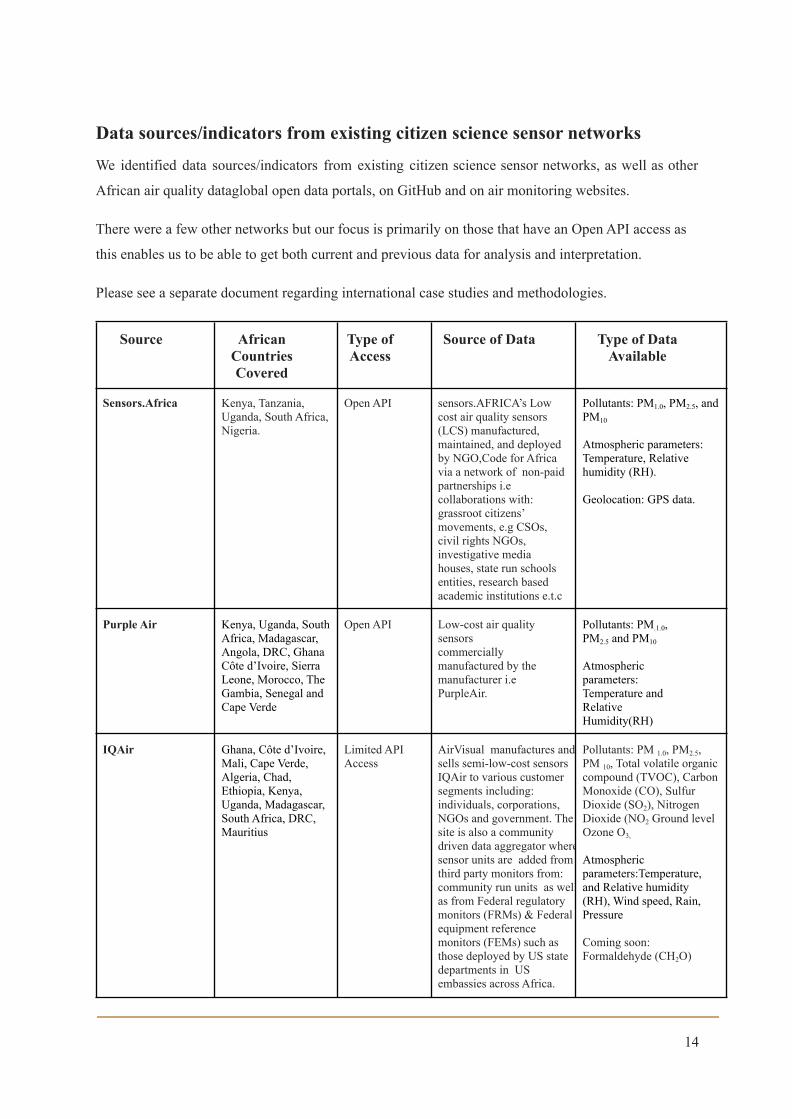
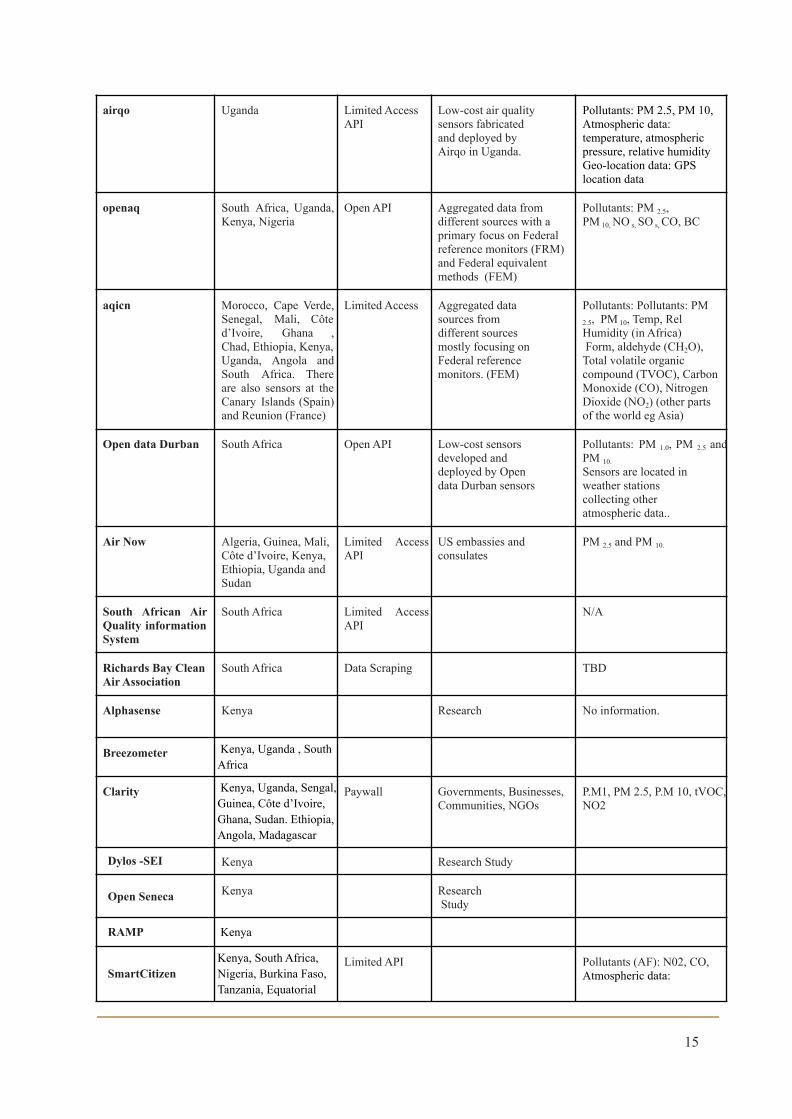
Data sources/indicators from existing citizen science sensor networks
We identified data sources/indicators from existing citizen science sensor networks, as well as other
African air quality dataglobal open data portals, on GitHub and on air monitoring websites.
There were a few other networks but our focus is primarily on those that have an Open API access as
this enables us to be able to get both current and previous data for analysis and interpretation.
Please see a separate document regarding international case studies and methodologies.
Source AfricanCountriesCovered
Type ofAccess
Source of Data Type of DataAvailable
Sensors.Africa Kenya, Tanzania,Uganda, South Africa,Nigeria.
Open API sensors.AFRICA’s Lowcost air quality sensors(LCS) manufactured,maintained, and deployedby NGO,Code for Africavia a network of non-paidpartnerships i.ecollaborations with:grassroot citizens’movements, e.g CSOs,civil rights NGOs,investigative mediahouses, state run schoolsentities, research basedacademic institutions e.t.c
Pollutants: PM1.0, PM2.5, andPM10
Atmospheric parameters:Temperature, Relativehumidity (RH).
Geolocation: GPS data.
Purple Air Kenya, Uganda, SouthAfrica, Madagascar,Angola, DRC, GhanaCôte d’Ivoire, SierraLeone, Morocco, TheGambia, Senegal andCape Verde
Open API Low-cost air qualitysensorscommerciallymanufactured by themanufacturer i.ePurpleAir.
Pollutants: PM.1.0,PM2.5 and PM10
Atmosphericparameters:Temperature andRelativeHumidity(RH)
IQAir Ghana, Côte d’Ivoire,Mali, Cape Verde,Algeria, Chad,Ethiopia, Kenya,Uganda, Madagascar,South Africa, DRC,Mauritius
Limited APIAccess
AirVisual manufactures andsells semi-low-cost sensorsIQAir to various customersegments including:individuals, corporations,NGOs and government. Thesite is also a communitydriven data aggregator wheresensor units are added fromthird party monitors from:community run units as wellas from Federal regulatorymonitors (FRMs) & Federalequipment referencemonitors (FEMs) such asthose deployed by US statedepartments in USembassies across Africa.
Pollutants: PM 1.0, PM2.5,PM 10, Total volatile organiccompound (TVOC), CarbonMonoxide (CO), SulfurDioxide (SO2), NitrogenDioxide (NO2 Ground levelOzone O3,
Atmosphericparameters:Temperature,and Relative humidity(RH), Wind speed, Rain,Pressure
Coming soon:Formaldehyde (CH2O)
14
airqo Uganda Limited AccessAPI
Low-cost air qualitysensors fabricatedand deployed byAirqo in Uganda.
Pollutants: PM 2.5, PM 10,Atmospheric data:temperature, atmosphericpressure, relative humidityGeo-location data: GPSlocation data
openaq South Africa, Uganda,Kenya, Nigeria
Open API Aggregated data fromdifferent sources with aprimary focus on Federalreference monitors (FRM)and Federal equivalentmethods (FEM)
Pollutants: PM 2.5,PM 10, NO s, SO s, CO, BC
aqicn Morocco, Cape Verde,Senegal, Mali, Côted’Ivoire, Ghana ,Chad, Ethiopia, Kenya,Uganda, Angola andSouth Africa. Thereare also sensors at theCanary Islands (Spain)and Reunion (France)
Limited Access Aggregated datasources fromdifferent sourcesmostly focusing onFederal referencemonitors. (FEM)
Pollutants: Pollutants: PM2.5, PM 10, Temp, RelHumidity (in Africa)Form, aldehyde (CH2O),Total volatile organiccompound (TVOC), CarbonMonoxide (CO), NitrogenDioxide (NO2) (other partsof the world eg Asia)
Open data Durban South Africa Open API Low-cost sensorsdeveloped anddeployed by Opendata Durban sensors
Pollutants: PM 1.0, PM 2.5 andPM 10.Sensors are located inweather stationscollecting otheratmospheric data..
Air Now Algeria, Guinea, Mali,Côte d’Ivoire, Kenya,Ethiopia, Uganda andSudan
Limited AccessAPI
US embassies andconsulates
PM 2.5 and PM 10.
South African AirQuality informationSystem
South Africa Limited AccessAPI
N/A
Richards Bay CleanAir Association
South Africa Data Scraping TBD
Alphasense Kenya Research No information.
Breezometer Kenya, Uganda , SouthAfrica
Clarity Kenya, Uganda, Sengal,Guinea, Côte d’Ivoire,Ghana, Sudan. Ethiopia,Angola, Madagascar
Paywall Governments, Businesses,Communities, NGOs
P.M1, PM 2.5, P.M 10, tVOC,NO2
Dylos -SEI Kenya Research Study
Open Seneca Kenya ResearchStudy
RAMP Kenya
SmartCitizenKenya, South Africa,Nigeria, Burkina Faso,Tanzania, Equatorial
Limited API Pollutants (AF): N02, CO,Atmospheric data:
15
Guinea, Niger, Morocco, Temperature, Relativehumidity (RH), Light, Noise.
UNEP Kenya, Uganda Limited API N/A
WeatherUnderground
Kenya, Uganda,Nigeria, South Africa,Ethiopia, Côte d’Ivoire,Sierra Leone, Ghana,Gambia, Senegal, CapeVerde, Niger, SoulBuoy (Null Island),DRC, Madagascar,Morocco
P.M. 2.5 and PM 10
Luftdaten Kenya, South Africa,Liberia
Open API Pollutants: P.M. 2.5 and PM10, Atmospheric data:Temperature, Relativehumidity
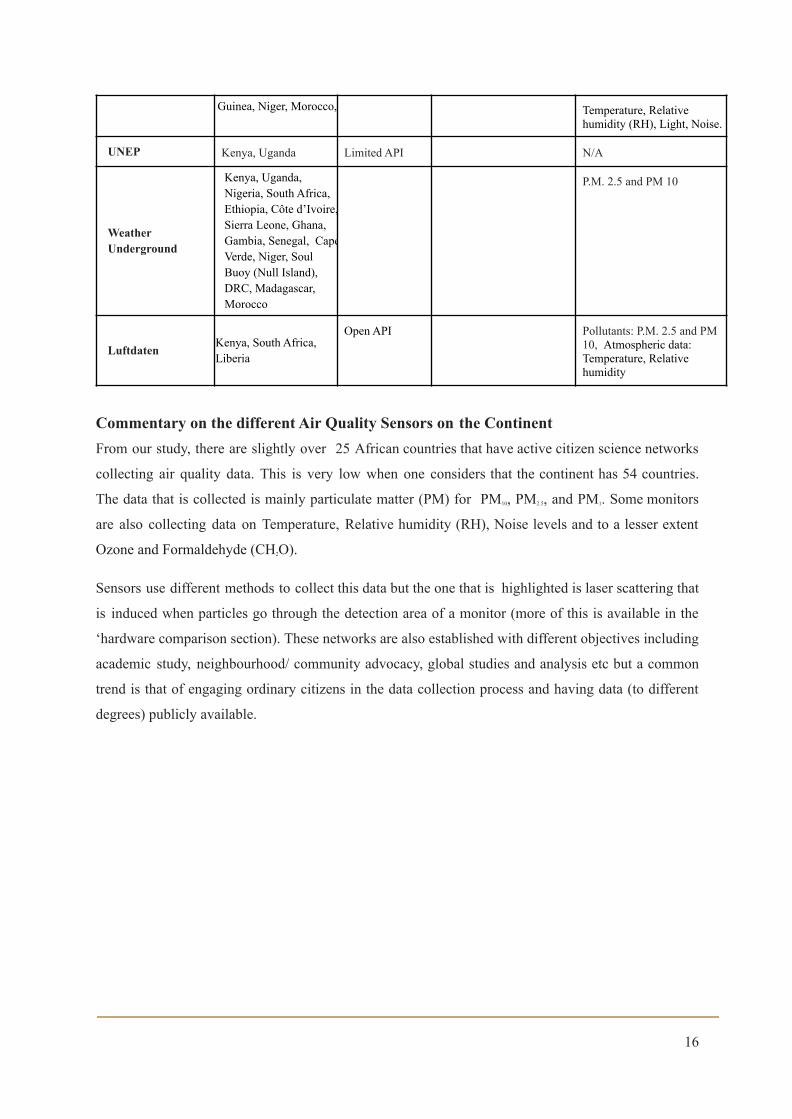
Commentary on the different Air Quality Sensors on the ContinentFrom our study, there are slightly over 25 African countries that have active citizen science networks
collecting air quality data. This is very low when one considers that the continent has 54 countries.
The data that is collected is mainly particulate matter (PM) for PM10, PM2.5, and PM1. Some monitors
are also collecting data on Temperature, Relative humidity (RH), Noise levels and to a lesser extent
Ozone and Formaldehyde (CH2O).
Sensors use different methods to collect this data but the one that is highlighted is laser scattering that
is induced when particles go through the detection area of a monitor (more of this is available in the
‘hardware comparison section). These networks are also established with different objectives including
academic study, neighbourhood/ community advocacy, global studies and analysis etc but a common
trend is that of engaging ordinary citizens in the data collection process and having data (to different
degrees) publicly available.
16
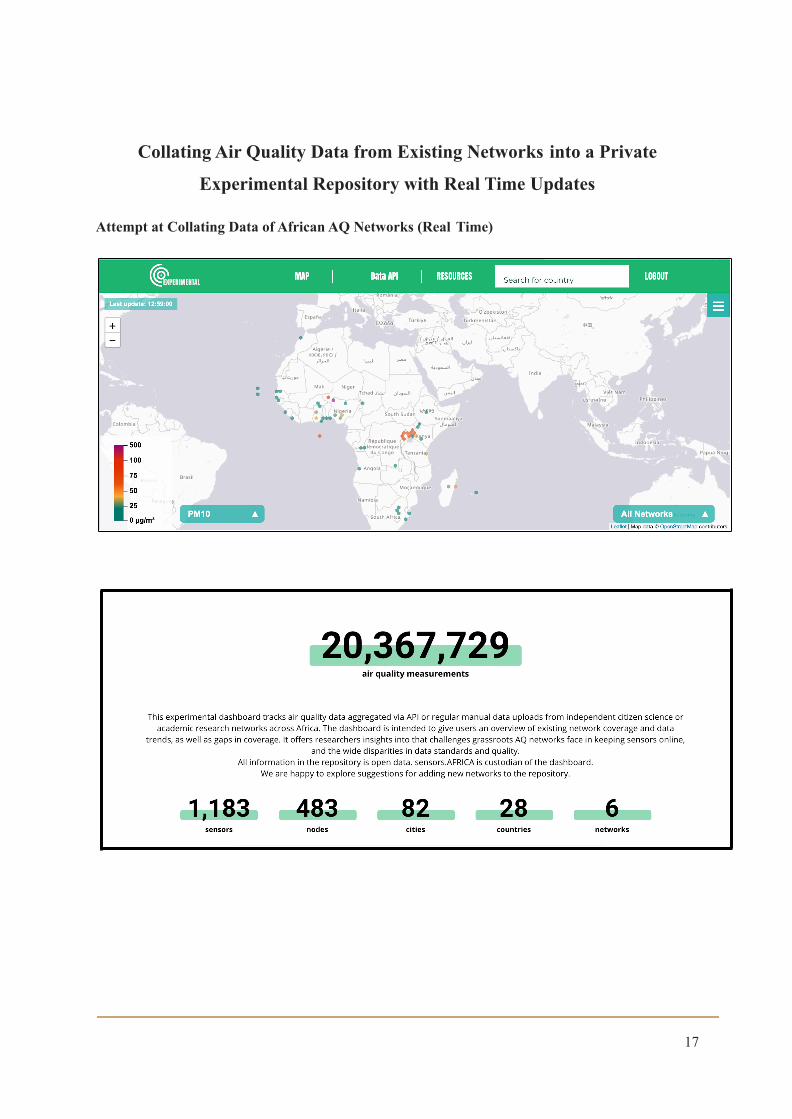
Collating Air Quality Data from Existing Networks into a Private
Experimental Repository with Real Time Updates
Attempt at Collating Data of African AQ Networks (Real Time)
17
18
https://data4sdgs.sensors.africa/dashboard
The map shows real time Air Quality Readings in twenty seven countries: Kenya, South Africa
Uganda, Chad, Nigeria, Ethiopia, Burkina Faso, Ghana, Sudan, Mali, Ivory Coast, Guinea, Algeria,
Mauritius, Cabo Verde, Liberia, Togo, Gambia, Sierra Leone, Namibia, Sénégal, Congo, Angola,
Tanzania, Madagascar, Bénin from 6 different air quality networks.
The World Bank team can view different pollution and weather characteristics including:
● PM 2.5
● PM 10
● Temperature
● Humidity
● Air Quality according to the
AQI-US Scale
Data on the map can be viewed by pollutant, country (specific to 5 countries) or by air quality
network.
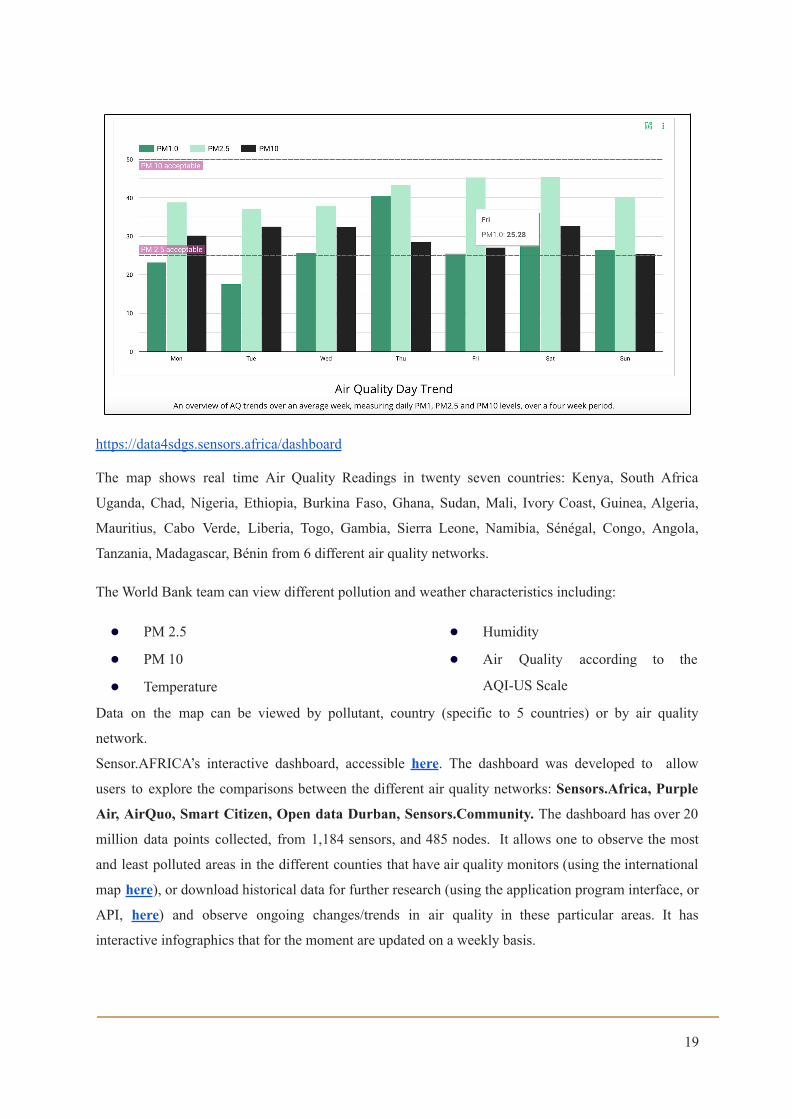
Sensor.AFRICA’s interactive dashboard, accessible here. The dashboard was developed to allow
users to explore the comparisons between the different air quality networks: Sensors.Africa, Purple
Air, AirQuo, Smart Citizen, Open data Durban, Sensors.Community. The dashboard has over 20
million data points collected, from 1,184 sensors, and 485 nodes. It allows one to observe the most
and least polluted areas in the different counties that have air quality monitors (using the international
map here), or download historical data for further research (using the application program interface, or
API, here) and observe ongoing changes/trends in air quality in these particular areas. It has
interactive infographics that for the moment are updated on a weekly basis.
19
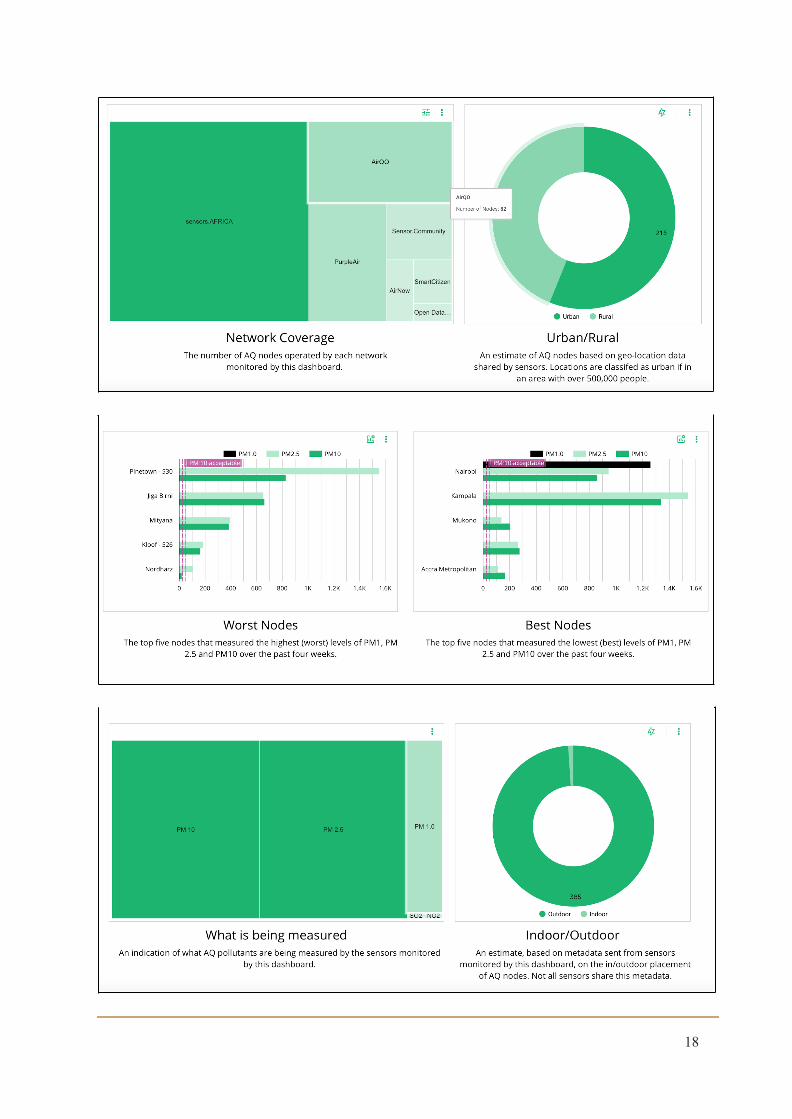
The user can utilize the visualizations on the dashboard in order to have a better understanding of the
data. Some of the information available includes:
● Country Coverage of the air quality monitors (by node/sensor coverage).
● Sensor Location: Rural vs Urban by percentage.
● Network coverage: Node/Sensor Coverage.
● Country coverage - broken down to city level and number of nodes per city/town.
● What is being measured (showing the number of nodes).
The visualizations are developed to portray quantities of variables in order for the user to have an
immediate understanding.
Commentary and Key Questions on the Experimental Repository
a. How do you do the data pull from the various repositories and what is the planned frequencyof updates? Are there duplicates? If so, how do you reconcile?
We’ve focused on a repository with documented APIs for now. We’ve created one service per
repository to pull in data to the main sensorsAFRICA repo. These services are scheduled to run from
once per day to once per hour for frequently updated repos. Repos do not provide all the necessary
information to actually say this is 100% duplicate of that and hence we use ownership to track where
data comes from and hopeful the intelligence to detect duplicates from different networks is something
that can be built into the main sensorsAFRICA repo e.g. OpenAQ doesn’t give any hardware
information about the sensor used to collect data.
b. How do you ensure that no data is lost?
We have daily automatic backup for the main sensors.AFRICA repository running. When pulling in
data, the next run of a service always checks where the previous run successfully ended. If there were
any errors, the process will be retried.
c. How are the measures from the various sensor sites comparable, or are there anytransformations that would be required for comparability?
The measures are comparable or at least we’ve focused on the measurements that are common to most
sensor networks: PM2.5 and PM10 measurements. However how this data is measured and provided
differs. For example some networks give you hardware information and sampling frequency such as
sensorsAFRICA but others such as OpenAQ averages the results and only give you the averaging
frequency per hour. Again, a bit of intelligence needs to be built into the main sensors.AFRICA repo
to handle/transform all these mismatches into something readily useful.
20
Comparative analysis of low-cost sensor hardware kits used by citizenscience air quality data initiatives
As cities grow demographically, they also face a greater risk of increased air pollution (Castel et al). It
is common in developed cities to have networks of reference monitoring stations giving real time
reports on air quality. The air quality is conducted for legislation and scientific purposes. These
monitoring stations come at a cost, and are not common to find in lower and middle income countries.
However, progress is being made in the development of low-cost technology and this is changing the
conventional approach of real-time monitoring (Mattewal, et al).
The low cost , use friendly air pollution platforms have led to a new trend worldwide where air quality
is monitored beyond the traditional monitoring stations.(castell et al). These have also enabled the
engagement of citizens in the environmental monitoring process and through this addressing data gaps
in regions that have limited monitoring (Johnson et al, 2018). Some of these, like PurpleAir PA-II-SD,
have demonstrated good linearity against reference instruments (Kelly et al, 2017). We have identified
6 such networks on the African Continent with 7 different models of AQ monitors. This report gives a
comparative analysis of the hardware that is used for these monitors.
The Sensors
Networks and their respective monitors
● Sensors Africa: SDS 011
● Purple Air: PA-II, PA-II-SD and PA-I-Indoor
● Air Qo: Air Qo Monitor
● IQ Air: Air Visual Pro
● Open Data Durban
21
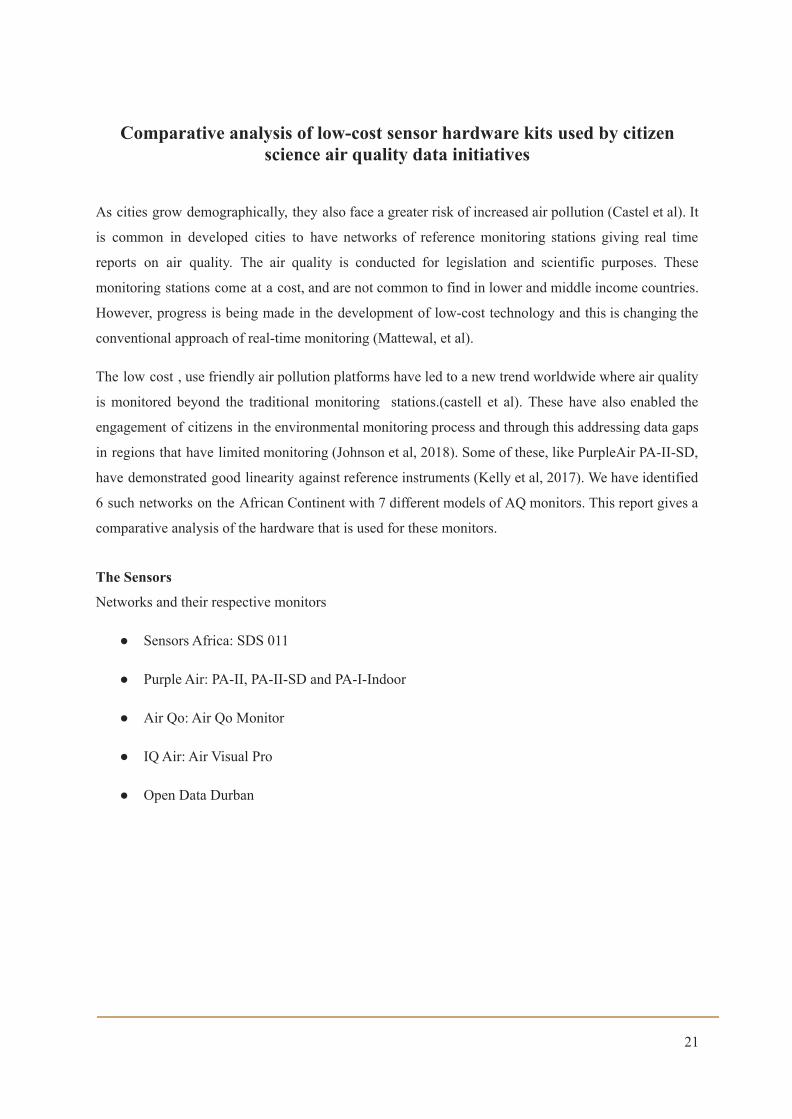
Sensors Africa: SDS 011
The sensors.africa SDS 011 monitor collects both PM 10 and PM 2.5
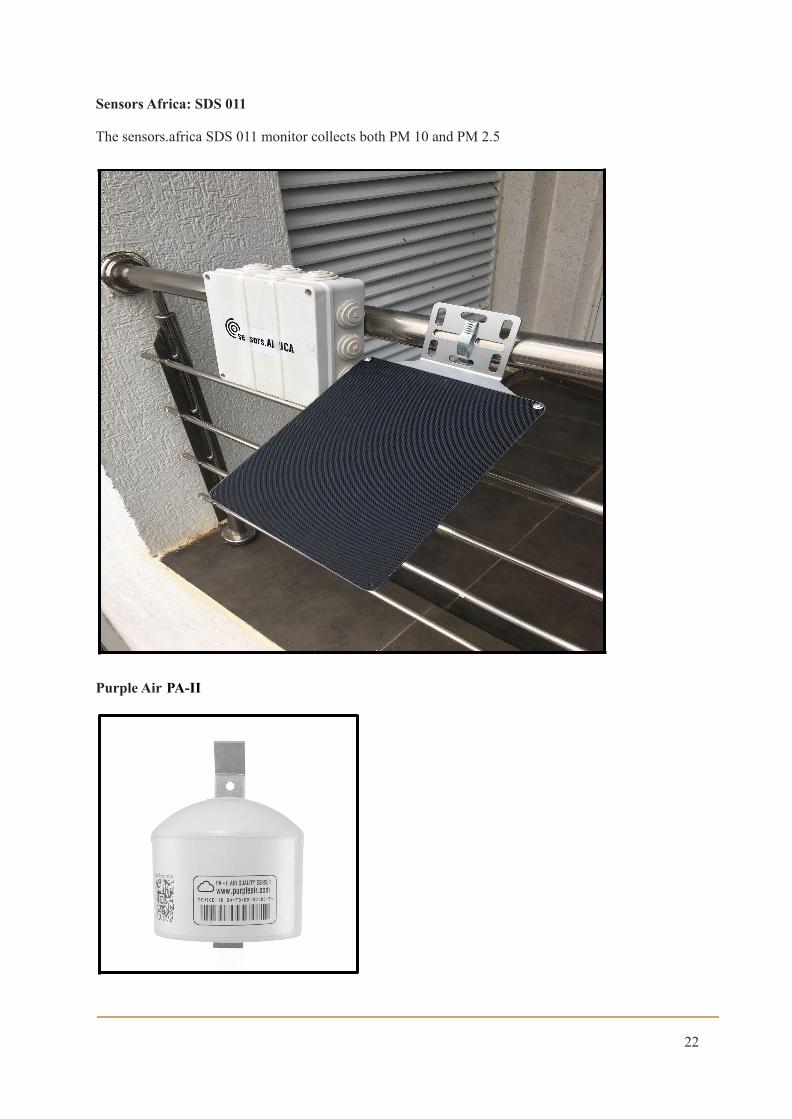
Purple Air PA-II
22
General Features:
The PA-II measures PM 2.5.It has a built in wifi which enables it to transmit data to the Purple Air
Map. It is white in colour, available for both indoor and outdoor use but has no internal storage. It
weighs 332 g and has the following dimensions: 85 mm x 85 mm x 125 mm. It comes with a Power
Supply that weighs 12.6 oz (357 g). A/C input is 100-240V AC, 50/60Hz, 1.5A and A/C output 5V
DC, 3A. The Sensor input 5V DC, 0.18A continuous, 600mA peak. Weather resistance: IP68,
Features of the wireless system:
● Wireless Networks 802.11b/g/n @ 2.4GHz, (WPA2 pre-shared key or open networks)
● Certificates: FCC/CE/ TELEC/SRRC
● Tx Power 802.11 b: +20 dBm; 802.11 g: +17 dBm; 802.11 n: +14 dBm
● Rx Sensitivity: 802.11 b: -91 dbm (11 Mbps), 802.11 g: -75 dbm (54 Mbps), 802.11 n: -72
dbm (MCS7)
● Antenna Type 2 dBi on-board PCB antenna
Characteristics of the Laser Particle Counters
● Type(2): PMS5003
● Range of measurement: 0.3, 0.5, 1.0, 2.5, 5.0, & 10 μm.
● Counting efficiency is 50% at 0.3μm & 98% at ≥0.5μm
● Effective range (PM2.5 standard)*0 to 500 μg/m³
● Maximum range (PM2.5 standard)*≥1000 μg/m³.
● Maximum consistency of error (PM2.5 standard): ±10% at 100 to 500μg/m³ & ±10μg/m³ at 0
to 100μg/m³
● Standard Volume 0.1 Litre
● Single response time is ≤1 second while Total response time is ≤10 seconds.
23
Characteristics of the Pressure, Temperature, & Humidity Sensors
● Type: BME280,
● Temperature range:-40°F to 185°F (-40°C to 85°C)
● Pressure range: 300 to 1100 hPa
● HumidityResponse time :(τ63%): 1 s
● Accuracy tolerance: ±3% RH
● Hysteresis: ≤2% RH
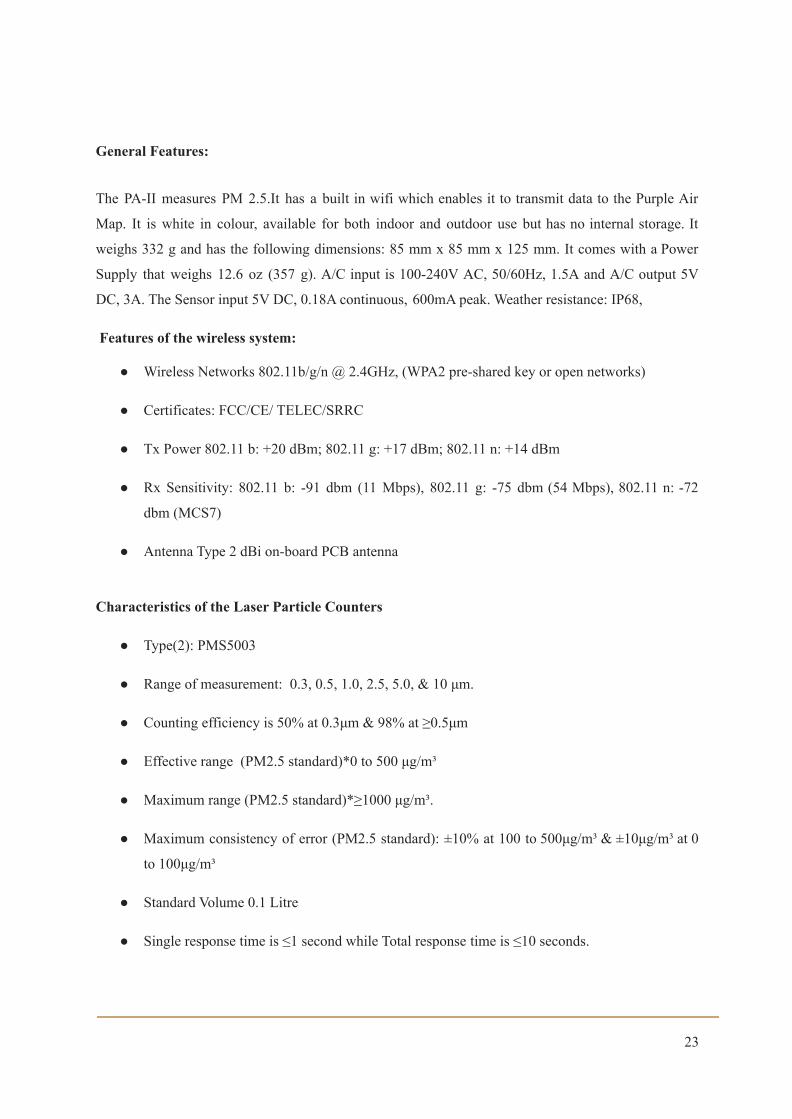
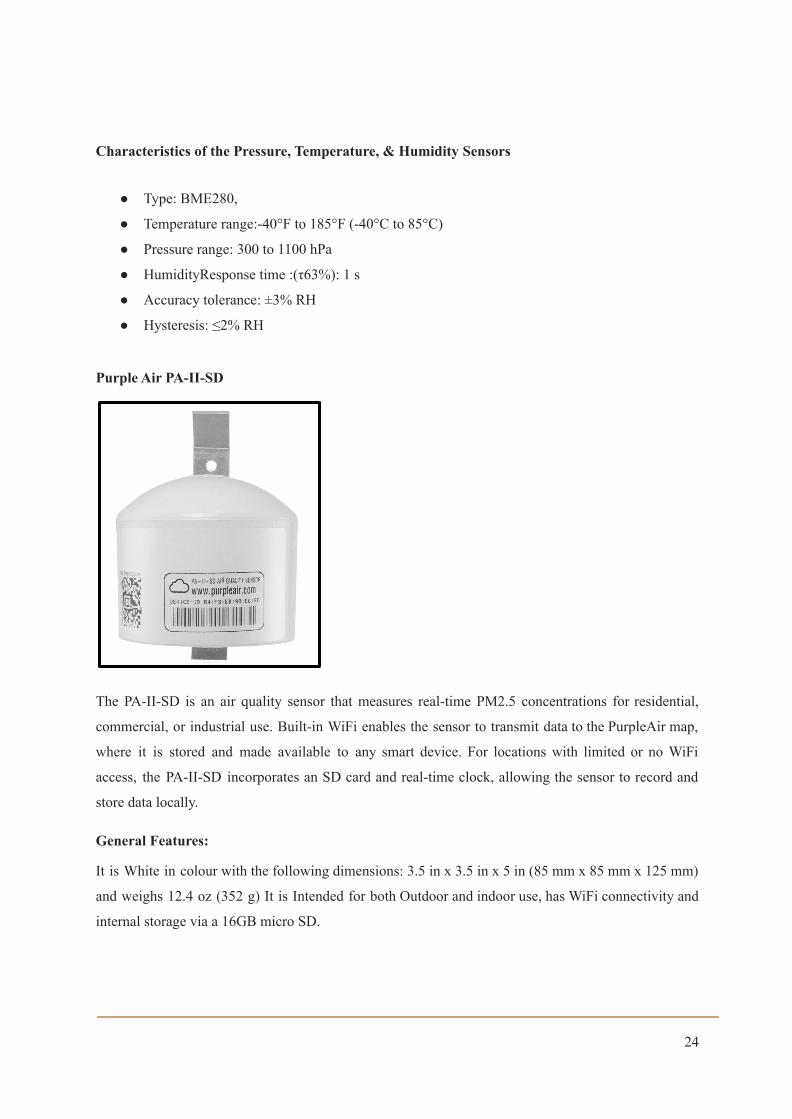
Purple Air PA-II-SD
The PA-II-SD is an air quality sensor that measures real-time PM2.5 concentrations for residential,
commercial, or industrial use. Built-in WiFi enables the sensor to transmit data to the PurpleAir map,
where it is stored and made available to any smart device. For locations with limited or no WiFi
access, the PA-II-SD incorporates an SD card and real-time clock, allowing the sensor to record and
store data locally.
General Features:
It is White in colour with the following dimensions: 3.5 in x 3.5 in x 5 in (85 mm x 85 mm x 125 mm)
and weighs 12.4 oz (352 g) It is Intended for both Outdoor and indoor use, has WiFi connectivity and
internal storage via a 16GB micro SD.
24
It comes with a white power supply that weighs 25.0 oz (709 g) and has a length of 17 ft (5 m). The
power supply has an A/C input 100-240V AC, 50/60Hz, 1.5A and an A/C output of 5V DC, 3A. The
sensor has an input 5V DC, 0.18A continuous, 600mA peak
Weather resistance: IP68
Features of the wireless system:
● Wireless Networks 8 02.11b/g/n @ 2.4GHz (WPA2 pre-shared key or open networks)
● Certificates: FCC/CE/ TELEC/SRRC
● Tx Power: 802.11 b: +20 dBm, 802.11 g: +17 dBm, 802.11 n: +14 dBm
● Rx Sensitivity: 802.11 b: -91 dbm (11 Mbps), 802.11 g: -75 dbm (54 Mbps), 802.11 n: -72
dbm (MCS7)
● Antenna Type: 2 dBi on-board PCB antenna
Characteristics of the Laser Particle Counters
● Type: (2) PMS5003
● Range of measurement: 0.3, 0.5, 1.0, 2.5, 5.0, & 10 μm
● Counting efficiency: 50% at 0.3μm & 98% at ≥0.5μm
● Effective range(PM2.5 standard)*: 0 to 500 μg/m³
● Maximum range (PM2.5 standard)*: ≥1000 μg/m³
● Maximum consistency error (PM2.5 standard): ±10% at 100 to 500μg/m³ & ±10μg/m³ at 0 to
100μg/m³
● Standard Volume 0.1 Litre
● Single response time ≤1 second
● Total response time ≤10 seconds
Characteristics of the Pressure, Temperature, & Humidity Sensors
● Type: BME280
● Temperature range: -40°F to 185°F (-40°C to 85°C)
25
● Pressure range: 300 to 1100 hPa
● Humidity Response time: (τ63%): 1 s
● Accuracy tolerance: ±3% RHHysteresis: ≤2% RH
SD Card Reader & Real-time Clock
● Real-time Clock (RTC): DS3231
● SD Card 16GB micro SD card included takes micro SD cards up to 64GB
● SD Card FormatFAT32
● SD Card Data Access: Remove micro SD card with tweezers & connect to computer to
download csv data files
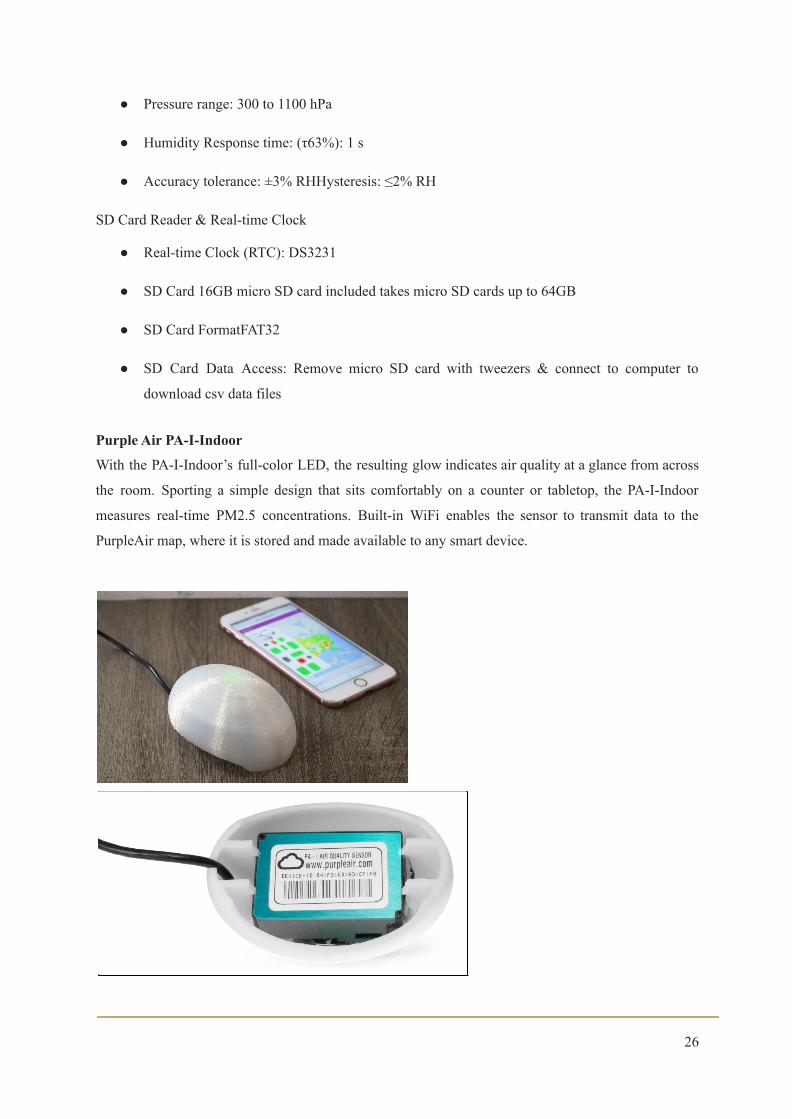
Purple Air PA-I-Indoor
With the PA-I-Indoor’s full-color LED, the resulting glow indicates air quality at a glance from across
the room. Sporting a simple design that sits comfortably on a counter or tabletop, the PA-I-Indoor
measures real-time PM2.5 concentrations. Built-in WiFi enables the sensor to transmit data to the
PurpleAir map, where it is stored and made available to any smart device.
26
General Features:
The sensor has the following dimensions: 4.25 in x 3 in x 2.25 in (108 mm x 67 mm x 57 mm) and has
a weight of 6.4 oz (181 g)
Its power supply length is 3.2 ft (1 m), it is Translucent in colour white with real-time AQI colored
LED light.
The sensor comes with a power supply that has an A/C input of 100-240V AC, 50/60Hz, 1.5A and
A/C output 5V DC, 3A.
The Sensor has an input of 5V DC, 0.18A continuous, 600mA peak
It is strictly for Indoor use only.
Features of the wireless system:
● Wireless Networks: 802.11b/g/n @ 2.4GHz (WPA2 pre-shared key or open networks)
● Certificates: FCC/CE/ TELEC/SRRC
● Tx Power: 802.11 b: +20 dBm, 802.11 g: +17 dBm, 802.11 n: +14 dBm
● Rx Sensitivity: 802.11 b: -91 dbm (11 Mbps), 802.11 g: -75 dbm (54 Mbps), 802.11 n: -72
dbm (MCS7)
● Antenna Type:2 dBi on-board PCB antenna
Characteristics of the Laser Particle Counters
● Type: (1) PMS1003
● Range of measurement: 0.3, 0.5, 1.0, 2.5, 5.0, & 10 μm
● Counting efficiency: 50% at 0.3μm & 98% at ≥0.5μm
● Effective range (PM2.5 standard)*: 0 to 500 μg/m³
● Maximum range (PM2.5 standard)*: ≥1000 μg/m³
● Maximum consistency error (PM2.5 standard): ±10% at 100 to 500μg/m³ & ±10μg/m³ at 0 to
100μg/m³
● Standard Volume: 0.1 Litre
● Single response time: ≤1 second
27
● Total response time: ≤10 seconds
Characteristics of the Pressure, Temperature, & Humidity Sensors
● Type: BME280
● Temperature range: -40°F to 185°F (-40°C to 85°C)
● Pressure range: 300 to 1100 hPa
● HumidityResponse time: (τ63%): 1 s
● Accuracy tolerance: ±3% RH
● Hysteresis: ≤2% RH
28
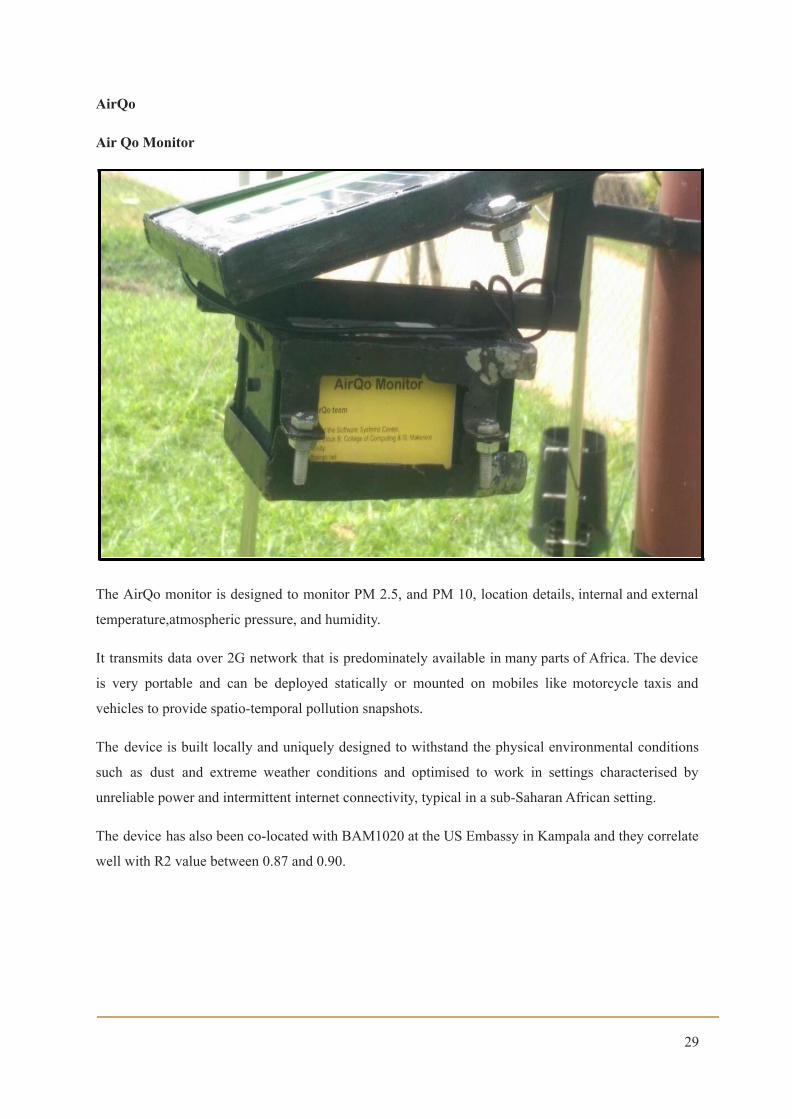
AirQo
Air Qo Monitor
The AirQo monitor is designed to monitor PM 2.5, and PM 10, location details, internal and external
temperature,atmospheric pressure, and humidity.
It transmits data over 2G network that is predominately available in many parts of Africa. The device
is very portable and can be deployed statically or mounted on mobiles like motorcycle taxis and
vehicles to provide spatio-temporal pollution snapshots.
The device is built locally and uniquely designed to withstand the physical environmental conditions
such as dust and extreme weather conditions and optimised to work in settings characterised by
unreliable power and intermittent internet connectivity, typical in a sub-Saharan African setting.
The device has also been co-located with BAM1020 at the US Embassy in Kampala and they correlate
well with R2 value between 0.87 and 0.90.
29
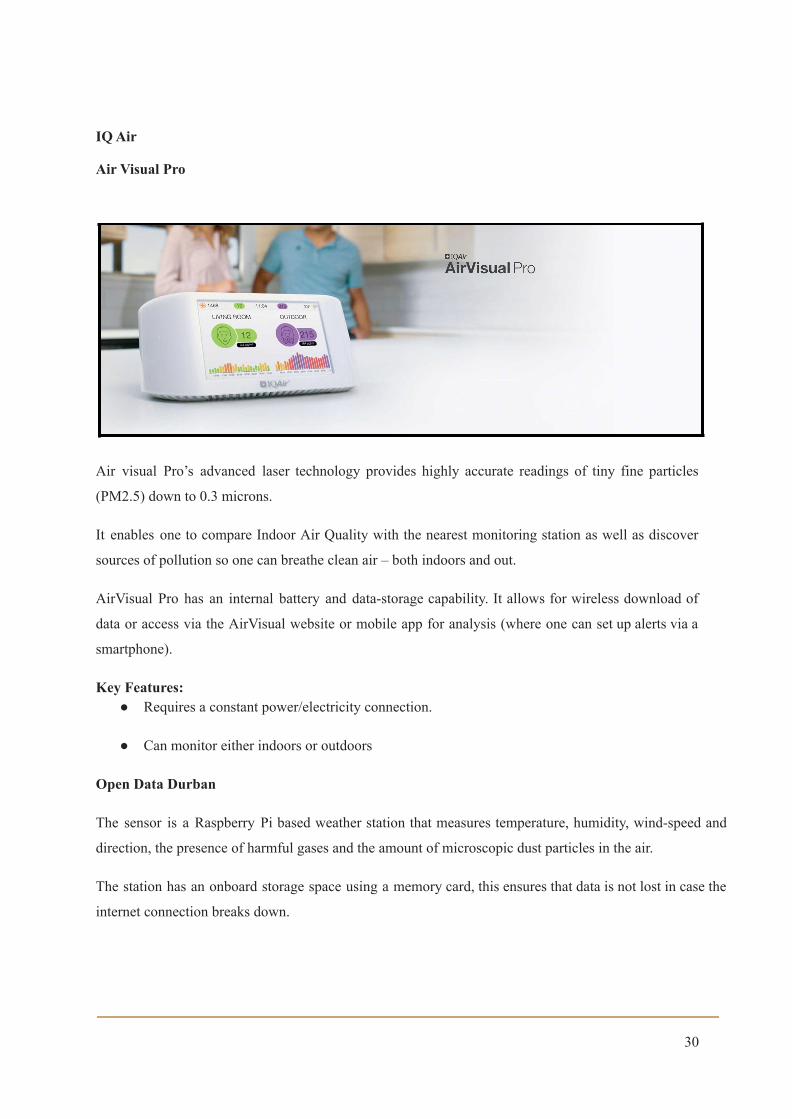
IQ Air
Air Visual Pro
Air visual Pro’s advanced laser technology provides highly accurate readings of tiny fine particles
(PM2.5) down to 0.3 microns.
It enables one to compare Indoor Air Quality with the nearest monitoring station as well as discover
sources of pollution so one can breathe clean air – both indoors and out.
AirVisual Pro has an internal battery and data-storage capability. It allows for wireless download of
data or access via the AirVisual website or mobile app for analysis (where one can set up alerts via a
smartphone).
Key Features:● Requires a constant power/electricity connection.
● Can monitor either indoors or outdoors
Open Data Durban
The sensor is a Raspberry Pi based weather station that measures temperature, humidity, wind-speed and
direction, the presence of harmful gases and the amount of microscopic dust particles in the air.
The station has an onboard storage space using a memory card, this ensures that data is not lost in case the
internet connection breaks down.
30
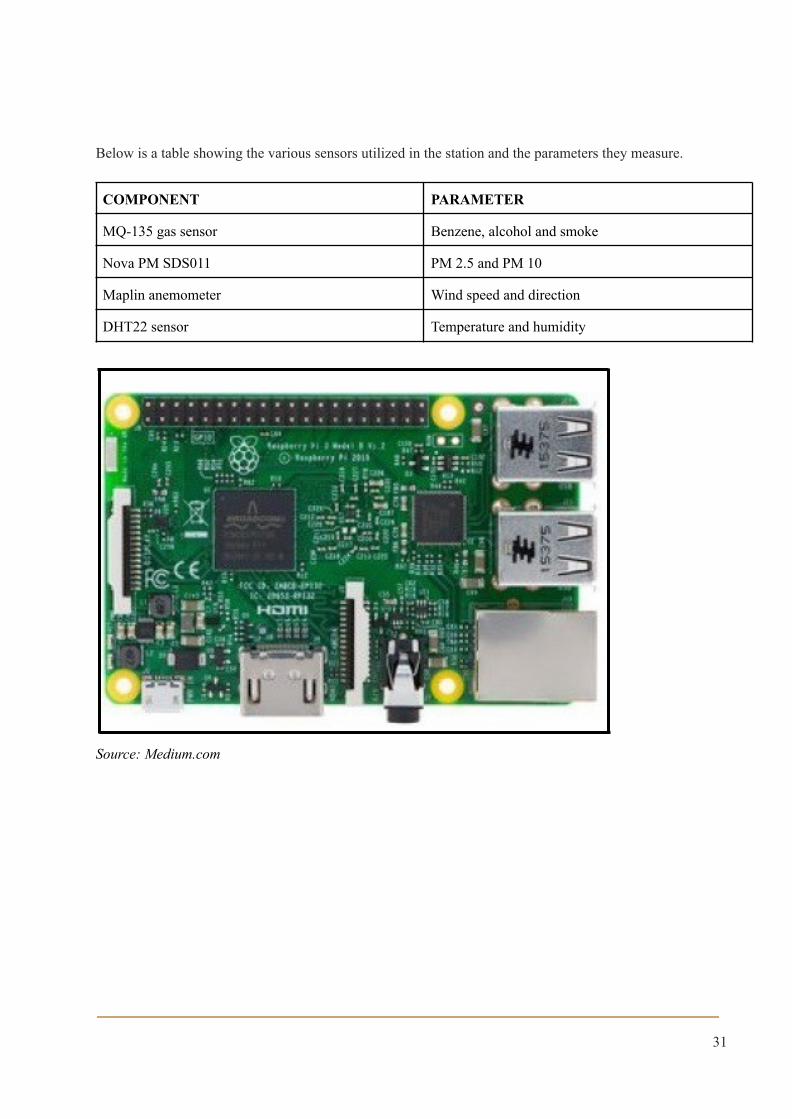
Below is a table showing the various sensors utilized in the station and the parameters they measure.
COMPONENT PARAMETER
MQ-135 gas sensor Benzene, alcohol and smoke
Nova PM SDS011 PM 2.5 and PM 10
Maplin anemometer Wind speed and direction
DHT22 sensor Temperature and humidity
Source: Medium.com
31
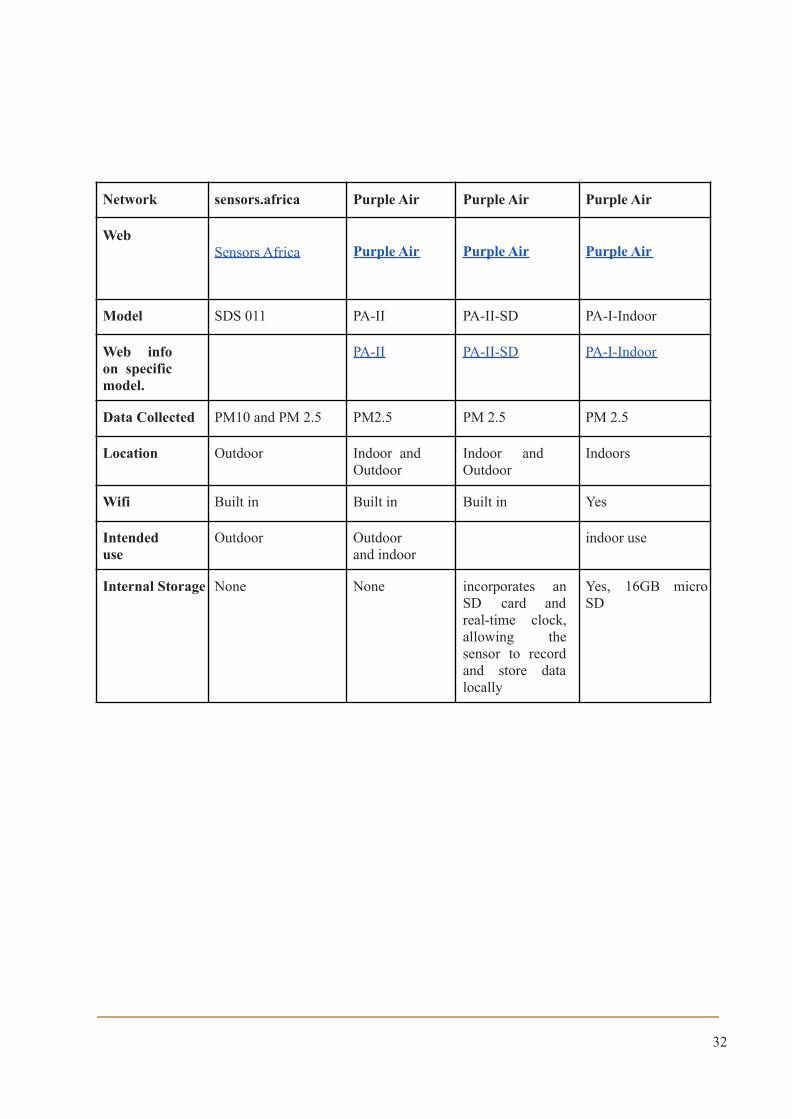
Network sensors.africa Purple Air Purple Air Purple Air
WebSensors Africa Purple Air Purple Air Purple Air
Model SDS 011 PA-II PA-II-SD PA-I-Indoor
Web infoon specificmodel.
PA-II PA-II-SD PA-I-Indoor
Data Collected PM10 and PM 2.5 PM2.5 PM 2.5 PM 2.5
Location Outdoor Indoor andOutdoor
Indoor andOutdoor
Indoors
Wifi Built in Built in Built in Yes
Intendeduse
Outdoor Outdoorand indoor
indoor use
Internal Storage None None incorporates anSD card andreal-time clock,allowing thesensor to recordand store datalocally
Yes, 16GB microSD
32
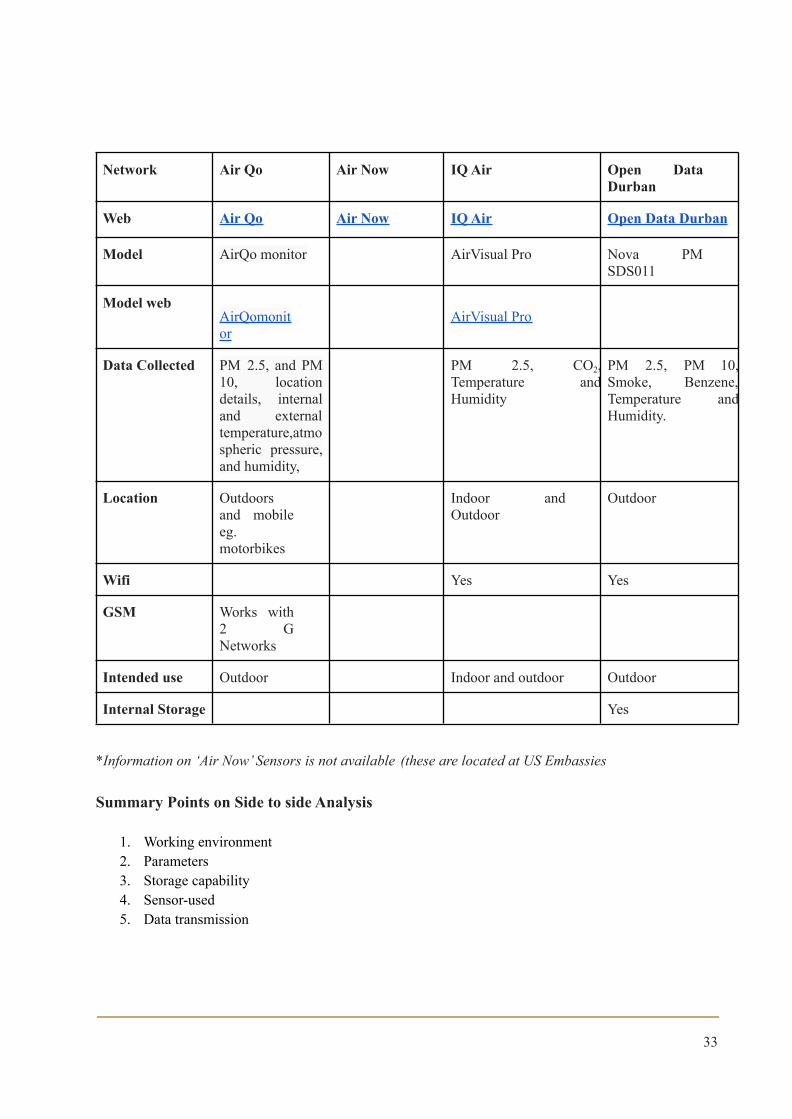
Network Air Qo Air Now IQ Air Open DataDurban
Web Air Qo Air Now IQ Air Open Data Durban
Model AirQo monitor AirVisual Pro Nova PMSDS011
Model webAirQomonitor
AirVisual Pro
Data Collected PM 2.5, and PM10, locationdetails, internaland externaltemperature,atmospheric pressure,and humidity,
PM 2.5, CO2,Temperature andHumidity
PM 2.5, PM 10,Smoke, Benzene,Temperature andHumidity.
Location Outdoorsand mobileeg.motorbikes
Indoor andOutdoor
Outdoor
Wifi Yes Yes
GSM Works with2 GNetworks
Intended use Outdoor Indoor and outdoor Outdoor
Internal Storage Yes
*Information on ‘Air Now’ Sensors is not available (these are located at US Embassies
Summary Points on Side to side Analysis
1. Working environment2. Parameters3. Storage capability4. Sensor-used5. Data transmission
33
Working Environment
Some sensor kits are capable of collecting either indoor or outdoor air quality data while others are able to
do both. The Open Data Durban, AirQo and SensorsAFRICA sensor kits are meant for outdoor air
quality data collection. The PA-I-Indoor is strictly meant for Indoor air quality measurement while the
IQAir, PA-II and the PA-II-SD can be used for both Indoor and outdoor air quality measurement.
Parameters Measures
The sensor kits measure various air quality parameters. The PA-II, PA-II-SD and PA-I-Indoor measure
PM2.5, temperature, humidity and atmospheric pressure. The sensorsAFRICA sensor kit measures
PM2.5, PM10, temperature and humidity. The AirQo is able to measure PM2.5, PM10, humidity as well
as internal and external temperature. The IQAir is capable of measuring PM2.5, CO2, temperature and
humidity. The open Data Durban sensor kit on the other hand entails an outdoor weather station and in
addition to PM2.5 and PM10 is capable of measuring smoke, benzene, alcohol levels as well as
atmospheric temperature and humidity.
Storage Capability
All the sensors are able to transmit data to a remote server while some have an additional feature of being
able to also store data locally. Through the remote server, the data is stored and can be both analysed and
visualized.
The PA-II-SD, IQAir and Open Data Durban have data storage capabilities and hence no data loss occurs
when the internet connection breaks down. On the other hand, the sensorsAFRICA sensor kit, PA-II,
PA-I-Indoor and AirQo do not have data storage capabilities and only transmit the collected data directly
to a remote server. This might lead to loss of data collected when the internet connection goes down.
Data Transmission
The sensor kits also use various methods to send data out to the various servers where they are stored. The
PA-II, PA-II-SD, PA-I-Indoor, IQAir and Open Data Durban use WiFi for data transmission. The AirQo
sensor uses GSM for data transmission while sensorsAFRICA has sensor kits that use either WiFi, GSM
or Sigfox for data transmission. WiFi networks are however prone to downtime hence the data collected
during these periods is not transmitted. GSM and Sigfox networks on the other hand are more stable
leading to reliable data transmission.
34
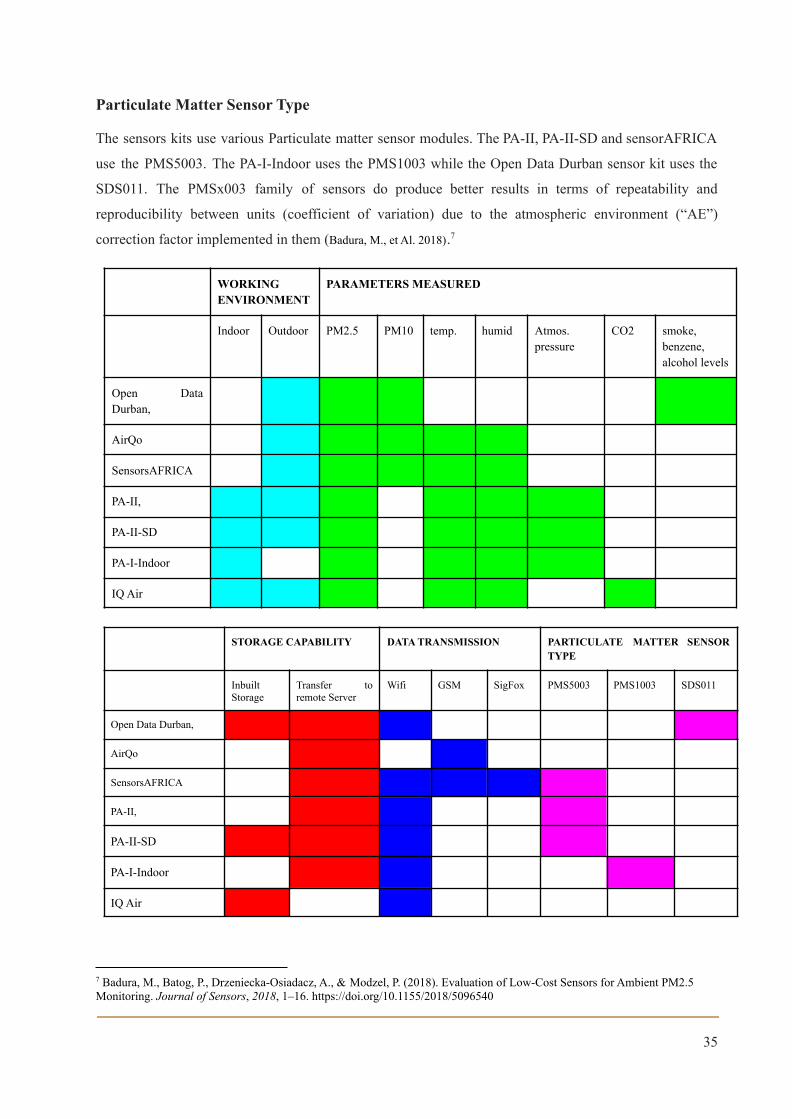
Particulate Matter Sensor Type
The sensors kits use various Particulate matter sensor modules. The PA-II, PA-II-SD and sensorAFRICA
use the PMS5003. The PA-I-Indoor uses the PMS1003 while the Open Data Durban sensor kit uses the
SDS011. The PMSx003 family of sensors do produce better results in terms of repeatability and
reproducibility between units (coefficient of variation) due to the atmospheric environment (“AE”)
correction factor implemented in them (Badura, M., et Al. 2018).7
WORKINGENVIRONMENT
PARAMETERS MEASURED
Indoor Outdoor PM2.5 PM10 temp. humid Atmos.pressure
CO2 smoke,benzene,alcohol levels
Open DataDurban,
AirQo
SensorsAFRICA
PA-II,
PA-II-SD
PA-I-Indoor
IQ Air
STORAGE CAPABILITY DATA TRANSMISSION PARTICULATE MATTER SENSORTYPE
InbuiltStorage
Transfer toremote Server
Wifi GSM SigFox PMS5003 PMS1003 SDS011
Open Data Durban,
AirQo
SensorsAFRICA
PA-II,
PA-II-SD
PA-I-Indoor
IQ Air
7 Badura, M., Batog, P., Drzeniecka-Osiadacz, A., & Modzel, P. (2018). Evaluation of Low-Cost Sensors for Ambient PM2.5Monitoring. Journal of Sensors, 2018, 1–16. https://doi.org/10.1155/2018/5096540
35
Interactive courseware and supporting training materials
The team developed interactive courseware and teaching materials on how to use low-cost hardware and
open source software tools to collect and evaluate air quality data.
These will enable the World Bank team or any other interested party to be able to put together low cost
sensors using readily available hardware, upload the necessary (open-source) firmware and access the
data collected by the monitors.
LINK TO COURSEWARE
The courseware covers the following important areas:
● Obtaining open source firmware.
The objective here is to use open source software (hereafter referred to as ‘firmware*’) to
program and assemble air quality sensors.
● Developing Low Cost Sensor Hardware
This is hardware that is relatively affordable, easily available with components that can
be easily replaced and have recognized levels of accuracy
● How to load the firmware
● Access and Analysis of the data
● Maintaining the sensor
*courseware consists of 37 explanatory slides
36
Risk mitigation
Risk mitigation is a critical part of any project and as with most projects, we did experience some risk and
had to figure out how to navigate them in order to mitigate the issues as effectively as possible.
Did you need to address any risks?
Yes, we did have to address a number of risks
If yes, what were the risks and how were they managed or Mitigated?
● We would have preferred to have access to many more networks but as some do not have open
APIs and others have a paywall, we had to do without these as our priority is to ensure access to
data that is openly available to all. There are also not very many sensors deployed in African
countries compared to other parts of the world.
● It has been difficult to get all the data from some of the open API networks. This has been due to
the magnitude of the data, which is difficult to work with, considering that we are also collecting
historical data.
● Some networks do not have historical data and therefore we are only able to get access to real
time data eg sensors.community. Others do not list their measurements, others have their data in
the form of files while some networks do not give raw values.
● We noted that in some cases, some sensors had not collected data in a long time, probably due to
maintenance challenges. This brought about a problem to the validity of the data. We have tried to
keep these particular sensors out of the dashboard. Where possible, we have also contacted the
concerned parties to have a look at the sensors.
● Towards the end of the project our main technical person had to go on medical leave. This held
us back for several weeks as we had to get new staff on the project based on their availability.
This caused a delay in the finalization of the repository.
37
Output indicators
Have there been any final results or outcomes in which data or methods have allowed data to be
produced: faster; more cheaply; at a higher resolution or granularity, or where there was no data
before? If yes, please describe.
The main product from this work is the development of a private experimental repository of air quality
data that is readily available (accessible only by the Bank team). The experimental repository was to
collate data from air quality networks around the continent and use infographics and diagrammatic
representations to be able to compare the data. The project was only able to pull data from seven
networks: Sensors.Africa, Air Qo, Purple Air, AirNow, Smart Citizen, and Open Data Durban and
Sensors.Community uploaded to the repository.
Has the project contributed to the production and/or use of data disaggregated by a) sex b)
disability c) age, d) geography (or other)? If yes, please summarize the types of disaggregated and
the context.
The project has gathered data disaggregated by geography. The project looks into air quality networks in
different African countries. The main countries of focus for this project are Kenya, Uganda, South Africa
and Nigeria. There are a number of other countries that have been included where possible. Some
countries, like Tanzania, do not have many sensors.
Data on ambient air quality from these countries being collected by different networks is available on the
experimental repository.
Has the project contributed to the use and/or production of gender statistics? If yes, please describe.
No, the project has not contributed to the use or production of gender statistics.
38
Lessons Learned
There are several lessons that this study has brought out both for Code for Africa and the relevant
programme partners. The lessons in line with some of the specific activities related to this include:
1. Work closely with GPURL and DECDG with respect to any needed interactions with selectedstakeholders to identify potential complementary air quality data in Kenya, Nigeria, South Africaand Tanzania, that may already be available and useful for this research project;
Though we managed to identify a number of air quality networks on the continent, and also addedone more country to our sources, it was clear that there isn’t a lot of air quality data available on theAfrican continent when compared to other continents. There are not many sensor networks, these areonly available in a few counties and most of the sensors are located near major urban areas.
However, we also noted that a number of networks have emerged over the last few years, which wasone of the factors that led us to include Uganda in our study, where networks like Sensors.Africa andAirQo have developed presence.
Another major concern was that some of the networks/sensors do not have up to date data.
2. Participate in knowledge exchange activities to contribute to similar engagements led by the urbanteam, for example in Uganda.
This was not done as we had challenges pulling together the data from the different networks that wewould need to use for the knowledge exchange activities.
3. Create a private repository of air quality data that is readily available (accessible only by the Bankteam) mobilized under this project for review by the World Bank’s Office of Information Security (andas relevant by the Bank’s Access to Information Committee).
We made some progress in developing the repository but were hampered by a number of challenges.
This included the fact that there are very few Open API networks on the continent which we initially
intended to use for the repository.
Where we were able to access the data, the volume of data proved to be a hindering factor as the
large volumes of data led to the system crashing thus hampering the working progress.
The importance of having an easy to understand dashboards in order to increase the awareness on the
importance of good air quality. The AQI Scale is very helpful with this as it gives a visual impression
of the existing situation.
39
Repository Ranking: Though we managed to have a graph showing trends and country ranking on
the repository, we would have prefered to show specific sensor rankings with location details so as to
be able to do some deeper analysis on causes, demographics, health data, environment and land use.
4. Develop training materials on various ways to collect and evaluate new air quality data methods.
These were developed and shared and are available for people to view.
5. At the request of the World Bank team, develop policy notes that highlight key pollution challengesand their implications for city livability and productivity
These were not requested.
6. Work in concert with GPURL and DECDG to produce a detailed and relevant report to captureinsights, findings, case studies, and recommendations arising from this research project to informGPSURR operational teams about possible new data collection and evaluation methods with respectto air quality in the Africa Region.
This report has been prepared in accordance with the guidelines provided.
Other Lessons:
Personnel Challenges: Our main technical person had to go on extended medical leave. This held us
back for several weeks as we had to get new staff on the project based on their availability. This
caused a delay in the finalization of the repository.
The increasing importance of low cost sensors in order to have readily available data Eg the scenario
in Kenya where reference data on air quality has to be purchased from the meteorological authorities.
40
Advantages and Disadvantages of the Private Repository.
Advantages:
1. Select data from some of the Air Quality Networks is available through the experimental
repository.
2. In the case where there is an area of concern concerning Air Quality it is very easy to have
sensors installed at that location.
3. With the different networks that the repository captures data from, there can be a wider spatial
spread that is covered for this data collection
4. The Dashboard shows different trends and comparisons of real time Air Quality Data.
5. Changes can be made to the dashboard depending on the requirements of the researcher.
Disadvantages:
1. Some areas are not covered e.g. parts of Nairobi and Lagos that are highly polluted do not have
monitors and this has a negative effect on possible interventions.
2. Some sensors within networks do not have up to date data due to lack of maintenance concerns,
power supply issues or other challenges.
3. A lot of the focus tends to be in urban and metropolitan areas and not rural areas, of which some
might have air quality concerns eg near mining areas.
4. The data takes a long time to obtain e.g one network can take up to 7 days or more to pull and
upload on the experimental repository.
5. In the past some professionals e.g. academics have expressed their displeasure over data from low
cost sensors versus reference data over accuracy concerns..
6. There might be some inconsistencies in data collection and calibration across the different
networks, when this happens it inevitably raises concerns over the accuracy of the data.
41
Potential of replicability and scalability.
1. With the development of the experimental repository covering these 4 countries (Kenya, Uganda,
Nigeria and South Africa) there is opportunity to add a few other countries who these networks
are already present at e.g. Ghana, Tanzania and Ethiopia.
2. As these networks increase their sensors in the respective countries, the experimental repository
can adapt to the increased number of sensors, thus giving more real time information on the status
of air quality on the continent.
3. This can be replicated in other environmental fields where necessary eg riverine water quality,
noise pollution or other areas of concern that monitoring can be done.
4. There is a need for deployment of more environmental monitoring sensors on the continent in
order to fully capture the extent and impact of air pollution and other environmental damage
within major urban centres on the continent. The urban development is on the rise as well as the
levels of pollution in urban centres.
5. Linkage between land use and monitors - eg industrial areas, residential, even within the networks
themselves is beneficial for decision makers.
42
Way Forward
In the course of this project we were able to get a great view of opportunities that can come from doing
more work in this space. We have identified and outlined these opportunities in this section as a way
forward for expanding the project. They include:
1. Where possible the data can be used for advocacy purposes in urban centres where air quality is a
major concern and issue among the population (this is particularly for publicly available data).
2. Recognizing the data gaps and absence of sufficient AQ data on the continent has proven to be an
opportunity for further development and improvement of existing AQ networks within our reach
by advocating for more low-cost sensors to be deployed on the continent. This can go a long way
in securing rights of citizens towards a better and livable environment though citizen science
driven approaches.
3. Data from the experimental repository will be used to develop policy notes that highlight key
pollution challenges and their implications for city livability and productivity in Africa.
43
Conclusions
The project aimed at conducting research on methods that can be used to mobilize, monitor and analyze
near real time data on air quality in different African countries.
Through the course of the project we were able to identify different networks collecting real time AQ
data in Africa and attempt to collate the data into a single repository. Additionally, we were able to do a
side by side comparison of the hardware that is used to collect data. Training courseware on how to use
open source software and easily available hardware was also developed.
The project faced a number of challenges which hampered us from being able to access the data from air
quality networks either due to heavy load of data or due to lack of access keys to the APIs. As a result of
this, it was also difficult to have a functional repository as intended as well as to organise knowledge
activities with networks from other countries.
In a nutshell, we can say that less than half of the countries on the African continent have active citizen
science networks collecting data. The project therefore identified the need for more investment in citizen
science projects on the continent that will enable better access to open data on Air Quality. This will
provide readily available data on the status of air quality in urban areas as well as showcase signals to
problem areas that require immediate attention in the continent. In doing so, there can be a pulling
together of such data to be used for advocacy purposes where air quality is an issue of concern.
44

Final outputs
● LINK TO COURSEWARE
● LINK TO DASHBOARD AND EXPERIMENTAL REPOSITORY
45
Bibliography
Air Now. (2020a). Home Page | AirNow.gov. AirNow. https://www.airnow.gov
Air Now. (2020b). Interactive Map of Air Quality. https://gispub.epa.gov/airnow/index.html?tab=3
Air Now. (2020c). US Embassies and Consulates | AirNow.gov.
https://www.airnow.gov/international/us-embassies-and-consulates/
AirQo Ugandan Air Quality Forecast Challenge. (2020). Zindi.
https://zindi.africa/competitions/airqo-ugandan-air-quality-forecast-challenge/data
Amegah, A. K. (2018). Proliferation of low-cost sensors. What prospects for air pollution epidemiologic
research in Sub-Saharan Africa? Environmental Pollution, 241, 1132–1137.
https://doi.org/10.1016/j.envpol.2018.06.044
Aqi Basics. (2020). Air Now. https://www.airnow.gov/aqi/aqi-basics/
AQICN. (2020, August 30). Gaia Air Quality Monitors - Product Series. The World Air Quality Project.
https://aqicn.org/gaia/
Badura, M., Batog, P., Drzeniecka-Osiadacz, A., & Modzel, P. (2018). Evaluation of Low-Cost Sensors for
Ambient PM2.5 Monitoring. Journal of Sensors, 2018, 1–16. https://doi.org/10.1155/2018/5096540
Citizen Science. (2020a). About CitizenScience.gov | CitizenScience.gov.
https://www.citizenscience.gov/about/#
Citizen Science. (2020b). Air quality around KwaZulu Natal. Citizen Science Project.
http://sensors.opendata.durban/CS/
Clarity. (2020). Clarity Movement. https://www.clarity.io/
deSouza, P. (2017). A Nairobi experiment in using low cost air quality monitors. Clean Air Journal,
27(2), 12–42. https://doi.org/10.17159/2410-972x/2017/v27n2a6
Fighting air inequality through open data and community. (2020). Open AQ.
https://openaq.org/#/?_k=mo7sis
46
Ground-level Ozone Basics. (2020, July 13). US EPA.
https://www.epa.gov/ground-level-ozone-pollution/ground-level-ozone-basics
IQ Air. (2020a). Air Pollution Data Collection Movement.
https://www.iqair.com/blog/citizen-science/air-pollution-data-collection-movement
IQ Air. (2020b). Air Quality in Africa. https://www.iqair.com/us/blog/success-stories/air-quality-in-africa
IQ Air. (2020c). Air quality in the world. AQ Air. https://www.iqair.com/us/world-air-quality
IQ Air. (2020d). AirVisual Pro. IQ Air. https://www.iqair.com/us/air-quality-monitors/airvisual-pro
Li, J., Mattewal, S. K., Patel, S., & Biswas, P. (2020). Evaluation of Nine Low-cost-sensor-based
Particulate Matter Monitors. Aerosol and Air Quality Research, 20(2), 254–270.
https://doi.org/10.4209/aaqr.2018.12.0485
Meet the man on a mission to clean up Africa’s air using AI. (2020). Google.
https://about.google/stories/clean-air-for-kampala/
Nitrogen Dioxide (NO2) Pollution. (2020, May 22). US EPA. https://www.epa.gov/no2-pollution
Open AQ. (2020, March 31). Where does data on OpenAQ come from? - OpenAQ. Medium.
https://medium.com/@openaq/where-does-openaq-data-come-from-a5cf9f3a5c85
Particulate Matter: 1. What is Particulate Matter (PM)? (2020). Green Facts.
https://www.greenfacts.org/en/particulate-matter-pm/level-2/01-presentation.htm
Particulate matter (PM10 and PM2.5). (2020). Australian Government, Department of Agriculture, Water
and the Environment. http://www.npi.gov.au/resource/particulate-matter-pm10-and-pm25
Piedrahital, R. (2014). The next generation of low-cost personal air quality sensors for quantitative
exposure monitoring. Atmospheric Measurement Techniques, 3325–3336.
https://doi.org/10.5194/amt-7-3325-2014
Purple Air. (2020, August 28). PurpleAir: Real-time Air Quality Monitoring. https://www2.purpleair.com
RBCAA - HOME. (2020). Richards Bay Clean Air Association. http://rbcaa.org.za
Sensors Africa. (2020a, August 30). About Sensors Africa. https://sensors.africa/about
Sensors Africa. (2020b, August 30). How Sensors Work. https://sensors.africa/air/how-sensors-work
47
Silvertown, J. (2009a). A new dawn for citizen science. Trends in Ecology & Evolution, 24(9), 467–471.
https://doi.org/10.1016/j.tree.2009.03.017
Sulfur Dioxide (SO2) Pollution. (2020, May 22). US EPA. https://www.epa.gov/so2-pollution
Technologies, B. (2020). Kampala Air Quality Improves By Up To 40% During The Covid-19 Lockdown |
AIRQO. AirQo. https://airqo.net/blog-post/14221308-kampala-air-quality-impro
48
About this Project
This project, Africa: Citizen science using sensor data to tackle deadly environmental dangers by
producing actionable information, submitted in response to the 2018 call for proposals by the World
Bank’s Development Economics Data Group (DECDG) and the Global Partnership for Sustainable
Development Data (GPSDD), is supported by the World Bank’s Trust Fund for Statistical Capacity
Building III (TFSCB) with financing from the United Kingdom's Foreign, Commonwealth &
Development Office, the Department of Foreign Affairs and Trade of Ireland, and the Governments
of Canada and Korea.
49