Embed Size (px)
Citation preview
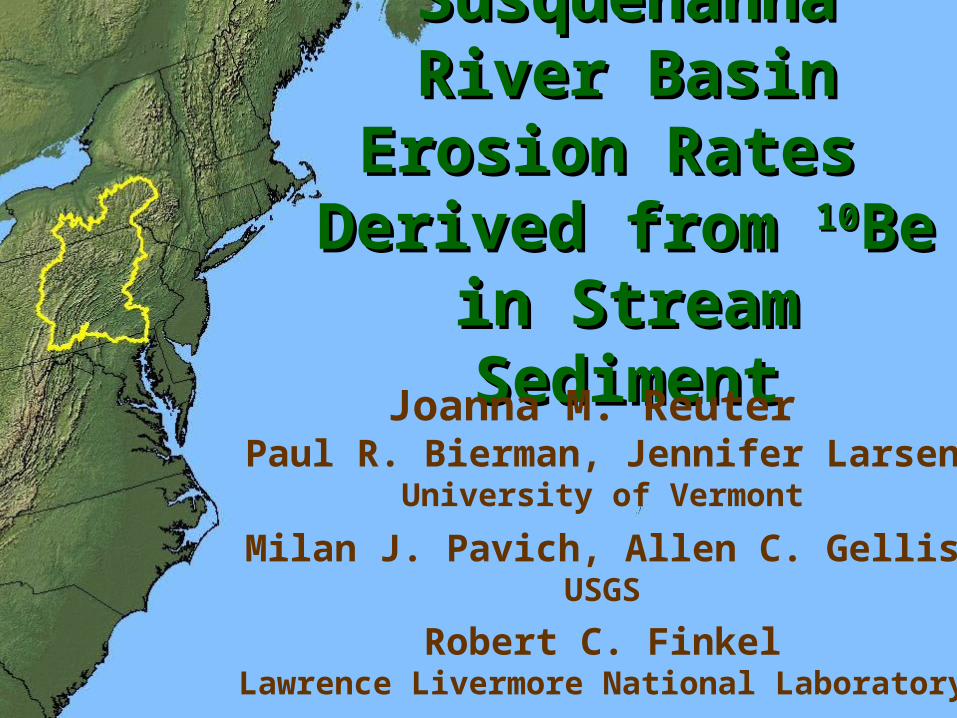
Susquehanna River Susquehanna River Basin Erosion Rates Basin Erosion Rates Derived from Derived from 1010Be in Be in
Stream SedimentStream Sediment
Joanna M. Reuter Paul R. Bierman, Jennifer Larsen
University of Vermont
Milan J. Pavich, Allen C. GellisUSGS
Robert C. FinkelLawrence Livermore National Laboratory
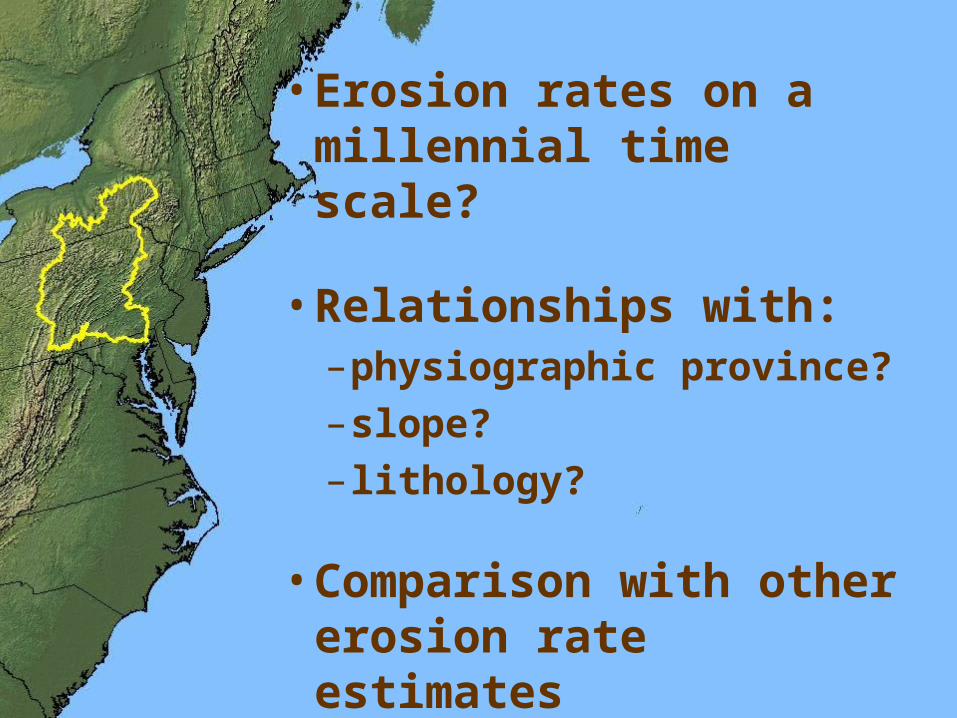
• Erosion rates on a millennial time scale?
• Relationships with:–physiographic province?–slope?– lithology?
• Comparison with other erosion rate estimates
• 1

O 10Be
Quartz
Production of 10Be from cosmic ray bombardment
of quartz
Cosmic Rays
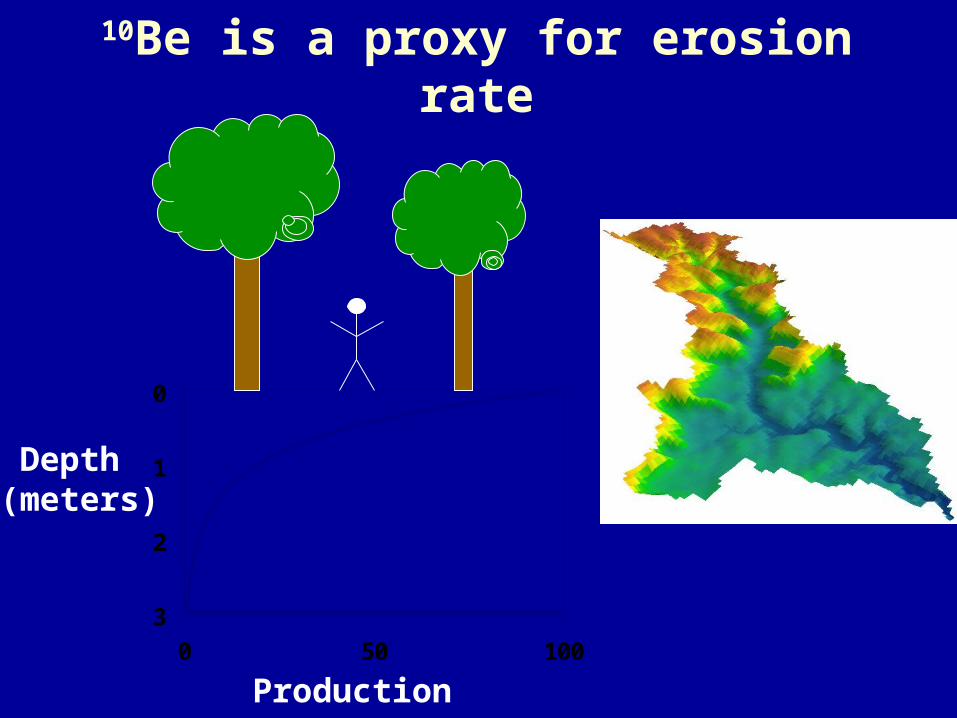
0
1
2
3
0 50 100% % %
Depth (meters)
Production Rate
10Be is a proxy for erosion rate


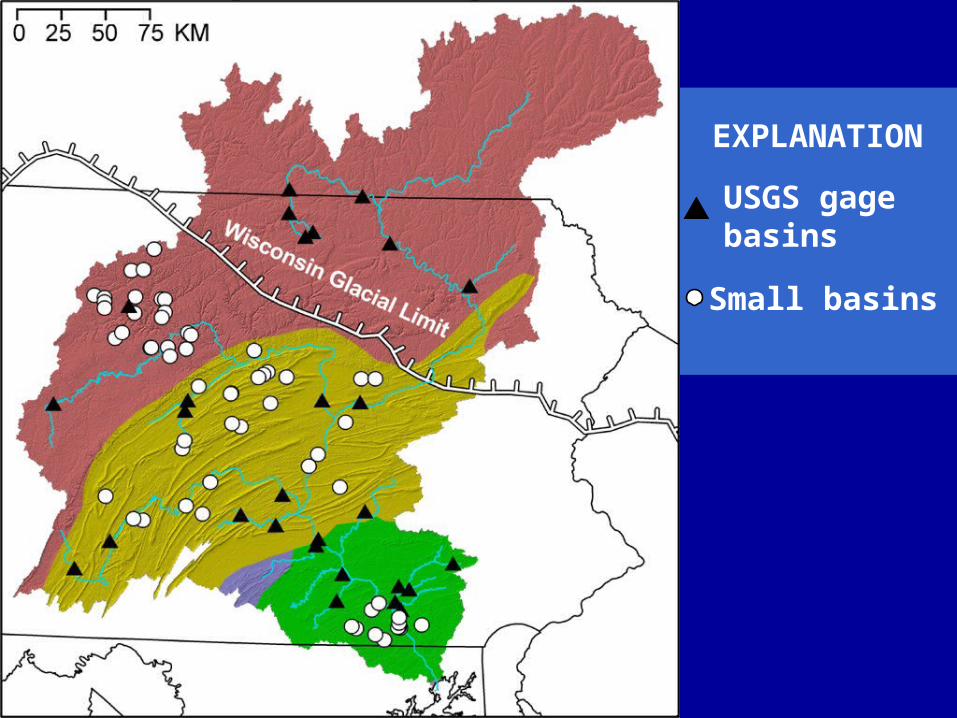
Small basins
USGS gage basins
EXPLANATION
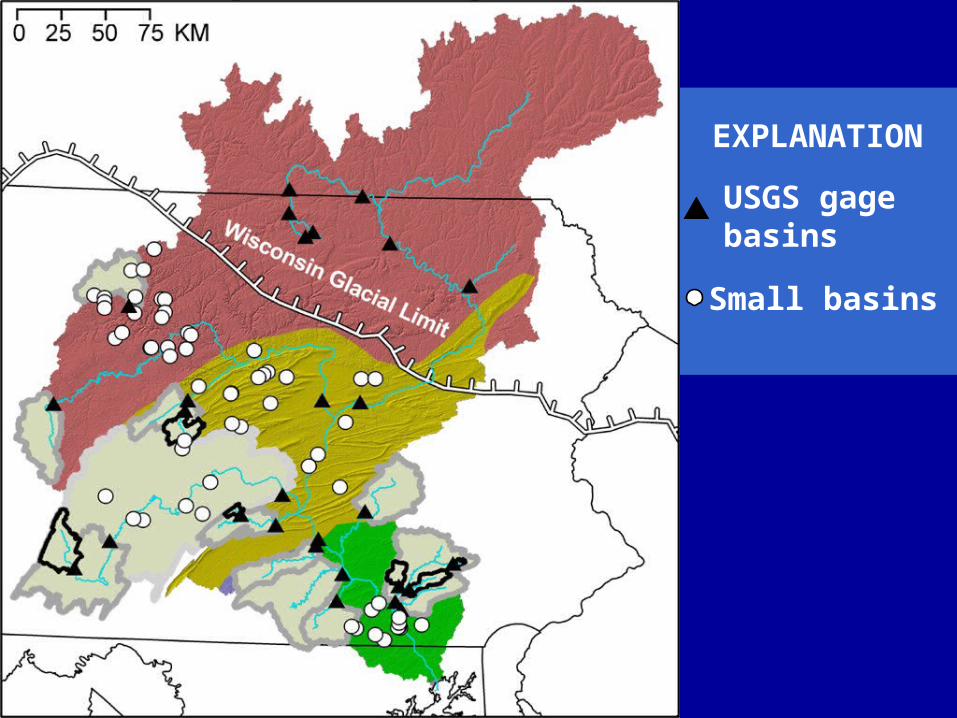
Small basins
USGS gage basins
EXPLANATION
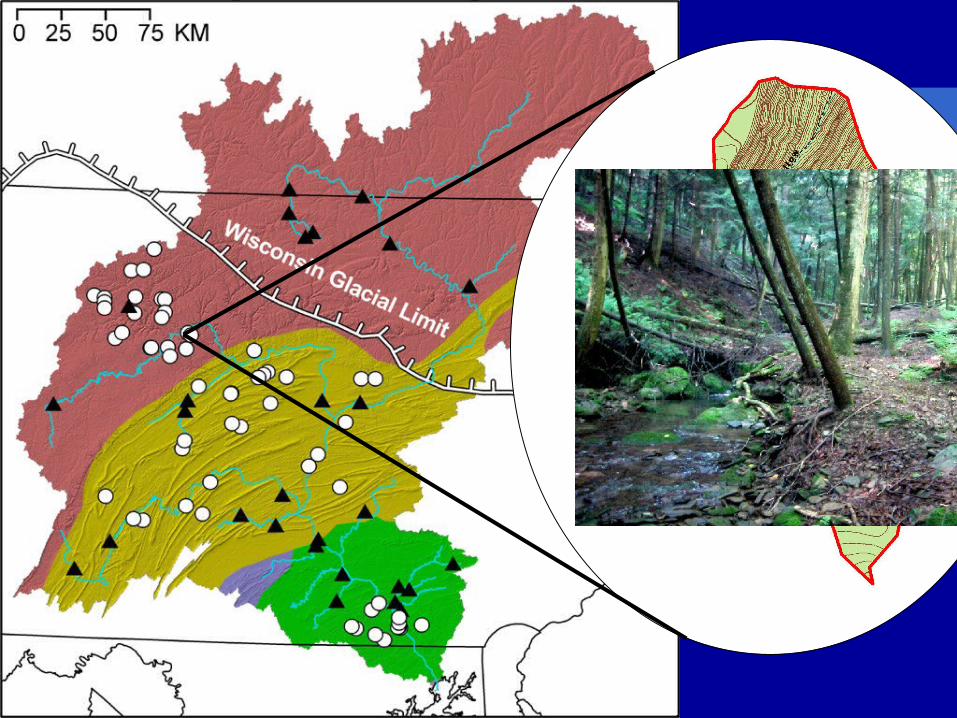
Small basins
USGS gage basins
EXPLANATION
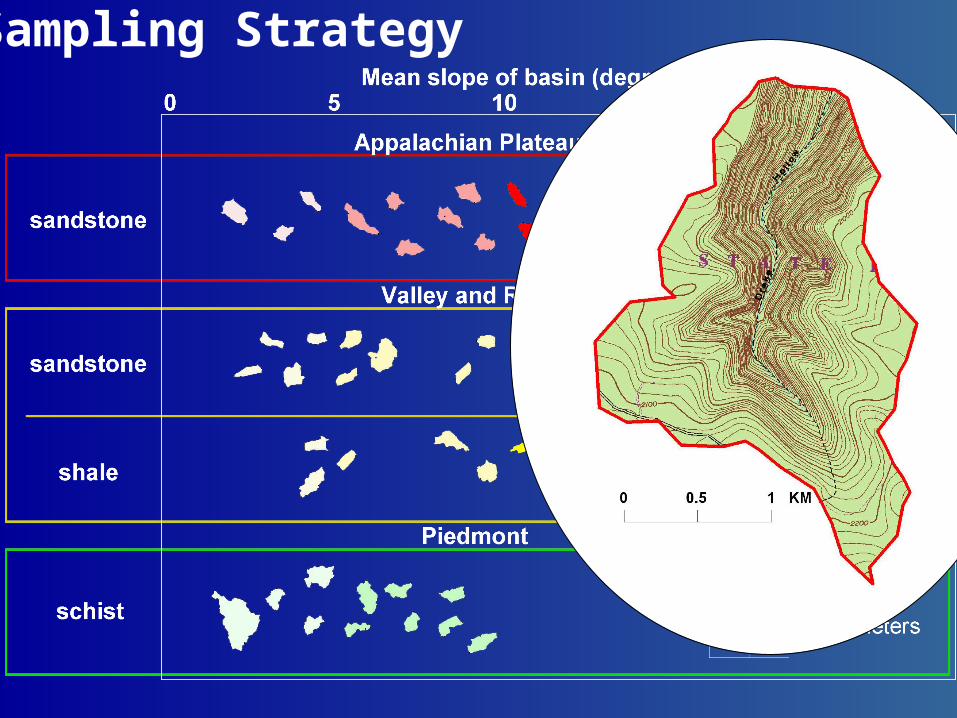
Sampling Strategy

0
10
20
30
40
50
60
AP SS USGS AP USGS AP
10Be 10Be Sediment Yield
Erosionrate
(meters/millionyears)
n = 22
n = 2
n = 1
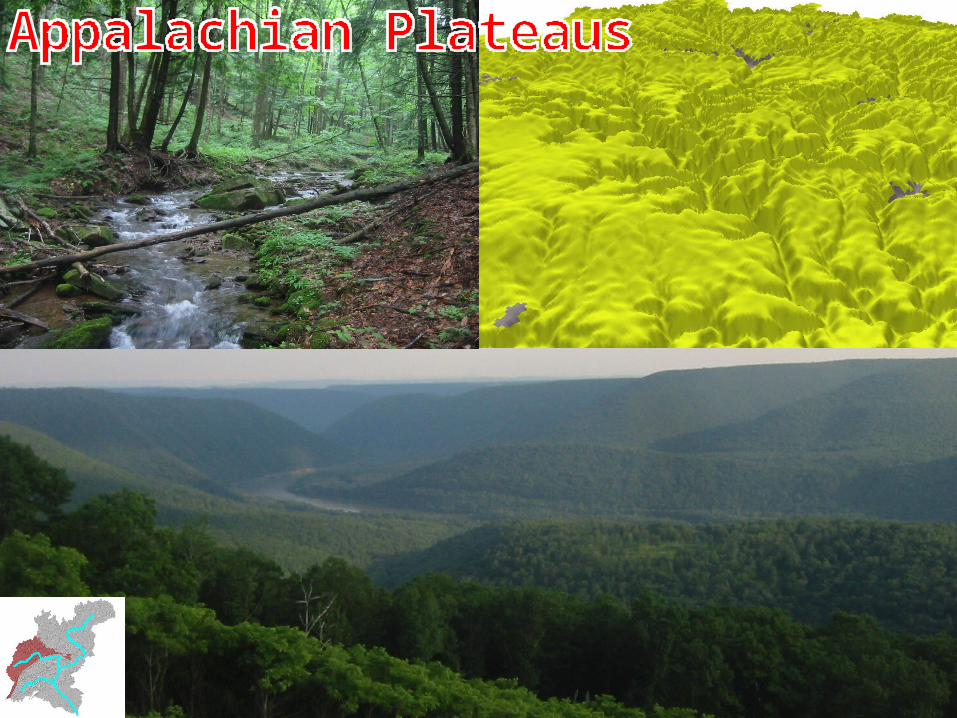
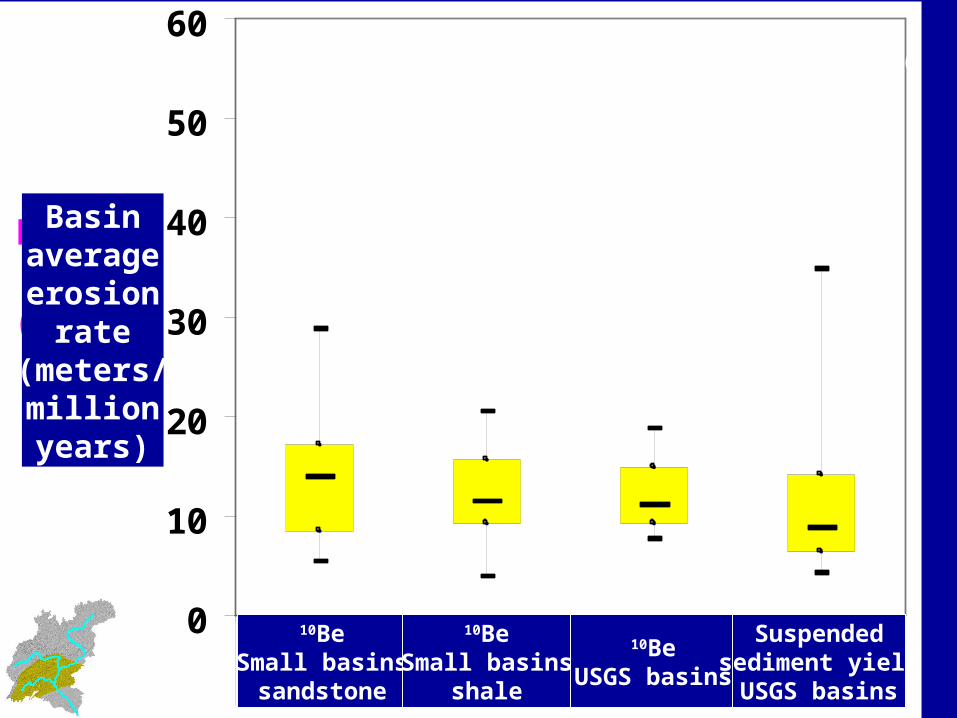
Appalachian Plateaus
10BeSmall basins
sandstone
Suspendedsediment yieldUSGS basins
10BeUSGS basins
Basinaverageerosion
rate(meters/millionyears)
0
10
20
30
40
50
60
VR SS VR SH USGS VR USGS VR
10Be 10Be 10Be Sediment Yield
Erosionrate
(meters/millionyears)
n = 17
n = 9n = 7
n = 7
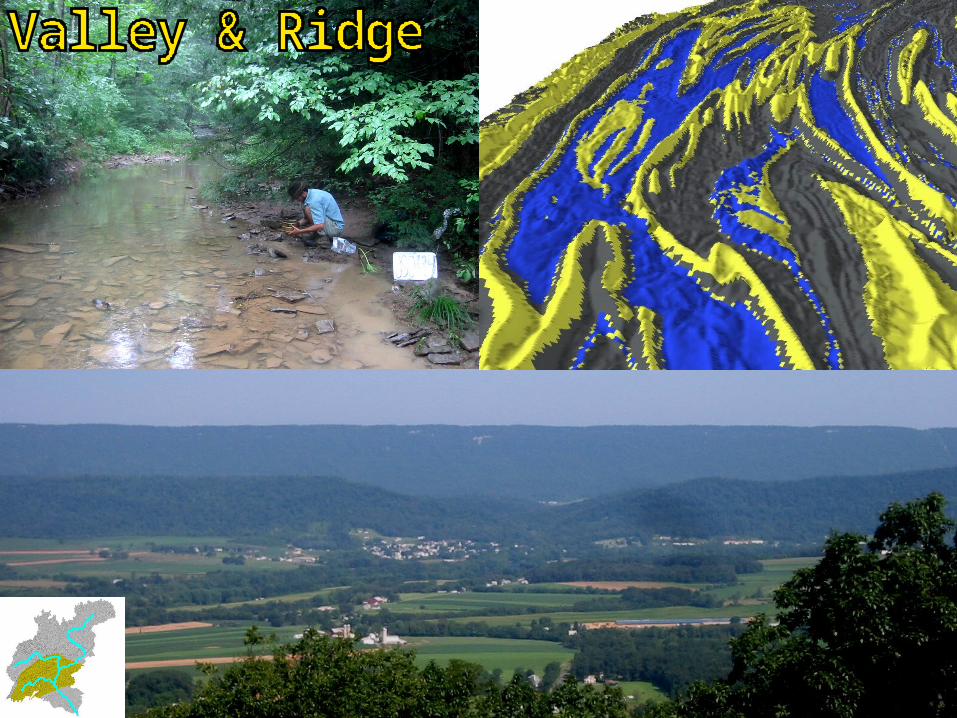
Valley & Ridge
Basinaverageerosion
rate(meters/millionyears)
10BeSmall basins
sandstone
10BeSmall basins
shale
10BeUSGS basins
Suspendedsediment yieldUSGS basins
0
10
20
30
40
50
60
PD SC USGS PD USGS PD
10Be 10Be Sediment Yield
Erosionrate
(meters/millionyears)
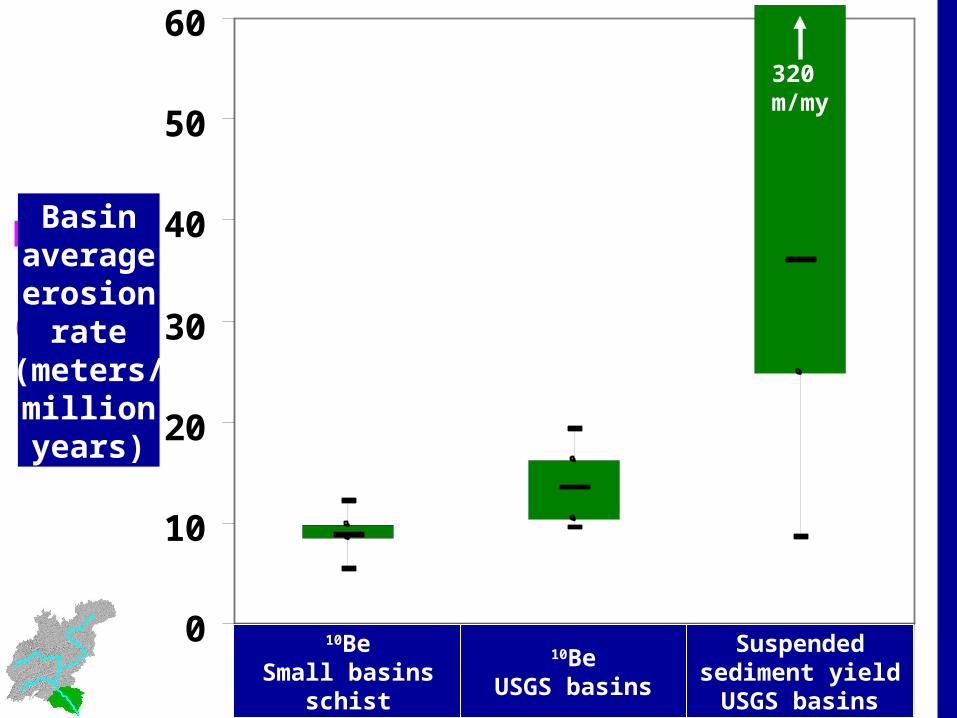
320 m/my
n = 12
n = 7
n = 6
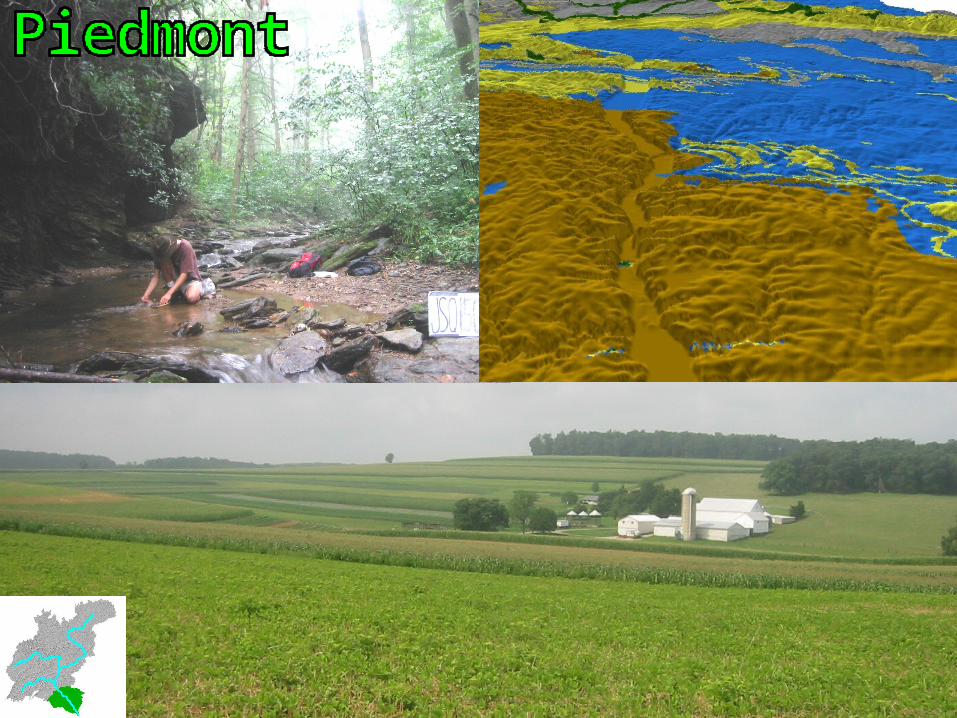
Piedmont
Basinaverageerosion
rate(meters/millionyears)
10BeSmall basins
schist
Suspendedsediment yieldUSGS basins
10BeUSGS basins
0
10
20
30
40
50
60
AP SS VR SS VR SH PD SC
10-Be EROSION 10-Be EROSION 10-Be EROSION 10-Be EROSION
Basinaverageerosion
rate(meters/millionyears)
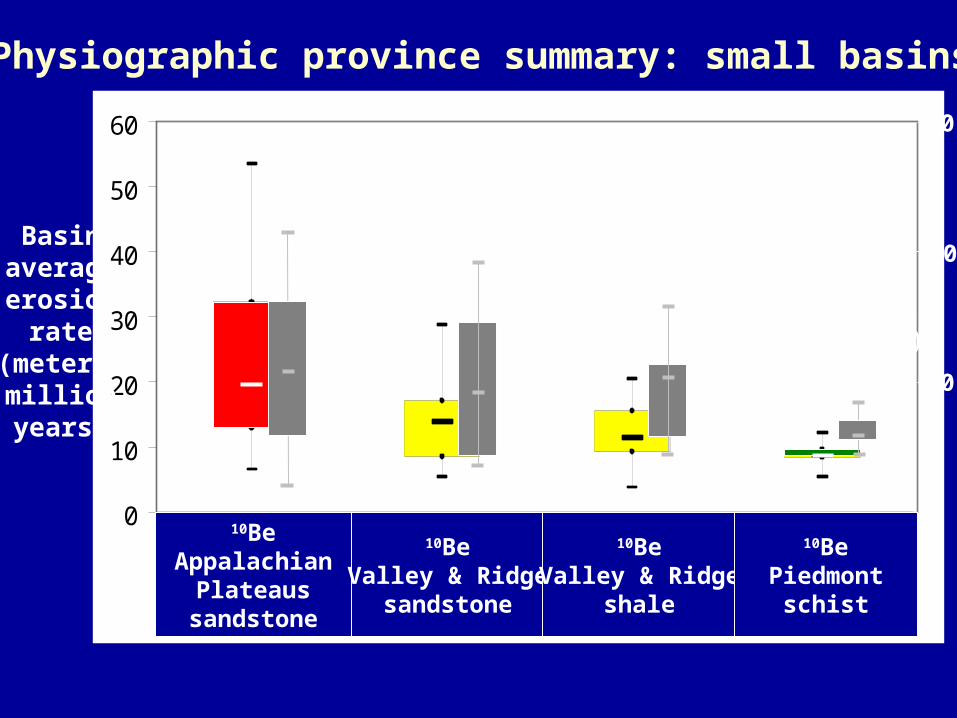
Physiographic province summary: small basins
10BeAppalachian
Plateaussandstone
10BeValley & Ridge
sandstone
10BeValley & Ridge
shale
10BePiedmont
schist
0
10
20
30
Meanslope
of basin(degrees)
0
10
20
30
40
50
60
70
0 5 10 15 20 25
Mean slope of basin (degrees)
Erosionrate
(meters/millionyears)
0
10
20
30
40
50
60
70
0 5 10 15 20 25
Mean slope of basin (degrees)
0
10
20
30
40
50
60
70
0 5 10 15 20 25
Mean slope of basin (degrees)
0
10
20
30
40
50
60
70
0 5 10 15 20 25
Mean slope of basin (degrees)
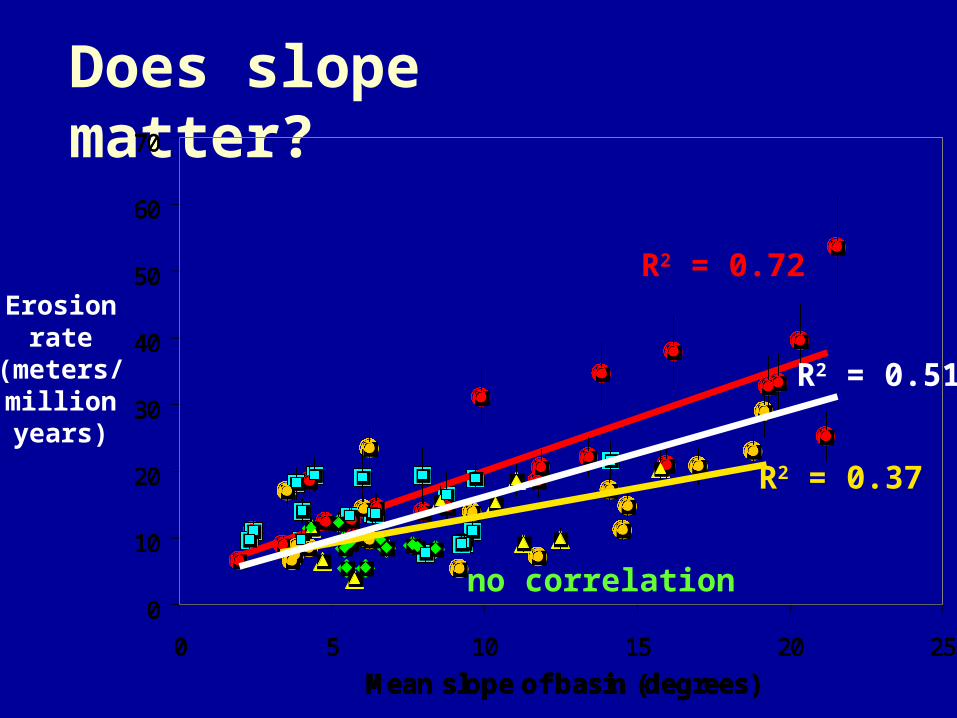
Does slope matter?
0
10
20
30
40
50
60
70
0 5 10 15 20 25
Mean slope of basin (degrees)
0
10
20
30
40
50
60
70
0 5 10 15 20 25
Mean slope of basin (degrees)
R2 = 0.72
no correlation0
10
20
30
40
50
60
70
0 5 10 15 20 25
Mean slope of basin (degrees)
R2 = 0.37
R2 = 0.51
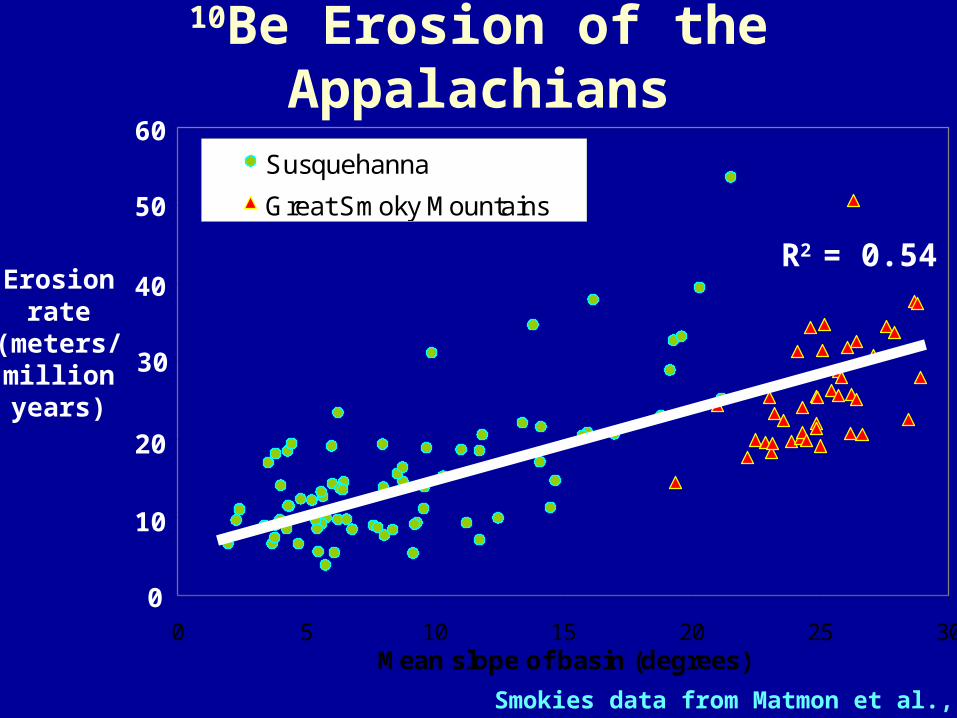
10Be Erosion of the Appalachians
0
10
20
30
40
50
60
0 5 10 15 20 25 30Mean slope of basin (degrees)
Susquehanna
Great Smoky Mountains
Erosionrate
(meters/millionyears)
R2 = 0.54
Smokies data from Matmon et al., 2003
60
50
40
30
20
10
0
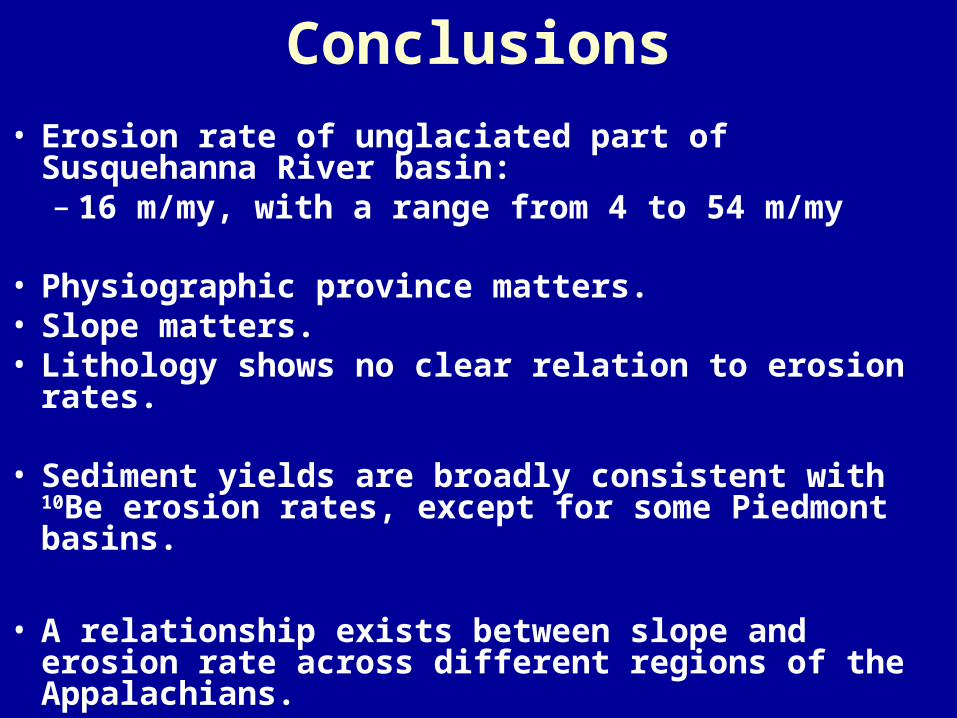
Conclusions
• Erosion rate of unglaciated part of Susquehanna River basin: – 16 m/my, with a range from 4 to 54 m/my
• Physiographic province matters.• Slope matters.• Lithology shows no clear relation to erosion rates.
• Sediment yields are broadly consistent with 10Be erosion rates, except for some Piedmont basins.
• A relationship exists between slope and erosion rate across different regions of the Appalachians.
Acknowledgments
• Funding: – USGS
– NSF
• Sample collection & processing:– Eric Butler
– Megan McGee
– Luke Reusser