Embed Size (px)
Citation preview
Astron Environmental Services 129 Royal Street East Perth WA 6004 Phone: (08) 9421 9600 Fax: (08) 9421 9699 Email: [email protected]
Report Reference: 21132-14-BISR-1Rev3_160218
Survivorship and Health of Darwinia masonii
February 2016
Prepared for Mount Gibson Mining Ltd

© Copyright 2014 Astron Environmental Services Pty Ltd. All rights reserved. This document and information contained in it has been prepared by Astron Environmental Services under the terms and conditions of its contract with its client. The report is for the clients use only and may not be used, exploited, copied, duplicated or reproduced in any form or medium whatsoever without the prior written permission of Astron Environmental Services or its client.
Survivorship and Health of Darwinia masonii
Prepared for Mount Gibson Mining Ltd
Job Number: 21132-14
Reference: 21132-14-BISR-1Rev3_160218
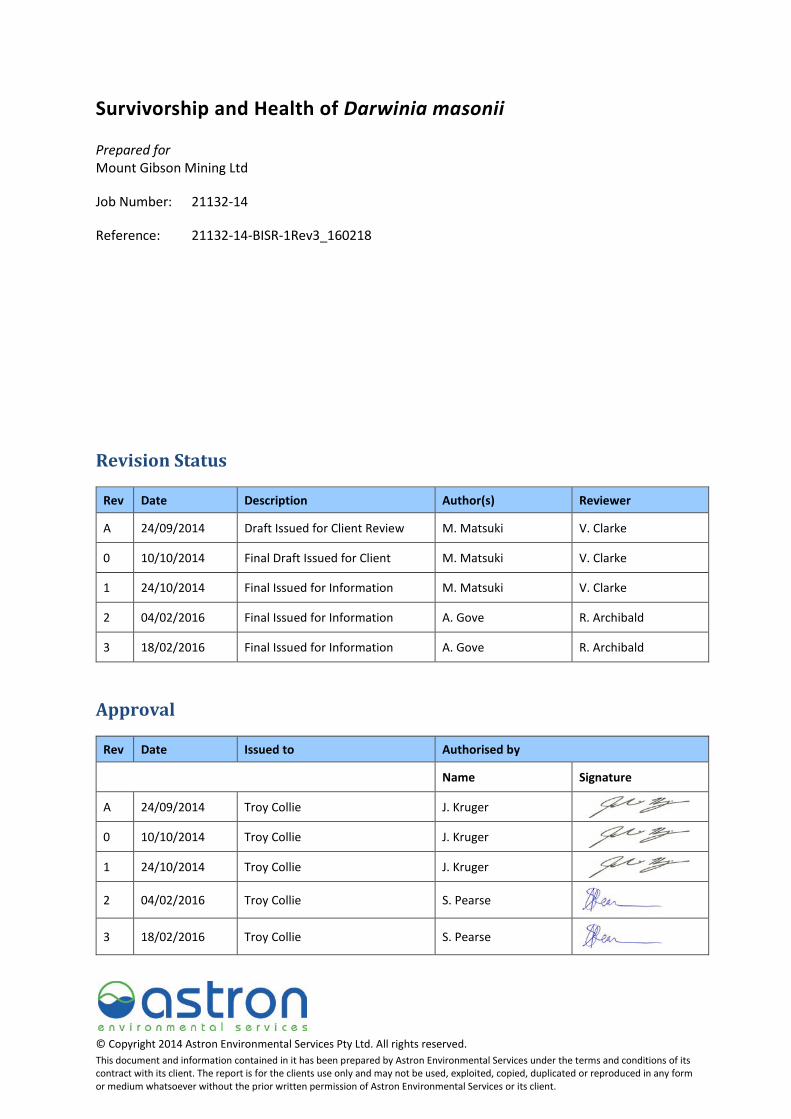
Revision Status
Rev Date Description Author(s) Reviewer
A 24/09/2014 Draft Issued for Client Review M. Matsuki V. Clarke
0 10/10/2014 Final Draft Issued for Client M. Matsuki V. Clarke
1 24/10/2014 Final Issued for Information M. Matsuki V. Clarke
2 04/02/2016 Final Issued for Information A. Gove R. Archibald
3 18/02/2016 Final Issued for Information A. Gove R. Archibald
Approval
Rev Date Issued to Authorised by
Name Signature
A 24/09/2014 Troy Collie J. Kruger
0 10/10/2014 Troy Collie J. Kruger
1 24/10/2014 Troy Collie J. Kruger
2 04/02/2016 Troy Collie S. Pearse
3 18/02/2016 Troy Collie S. Pearse
Mount Gibson Mining Ltd Survivorship and Health of Darwinia masonii, February 2016
Page | ii
Abbreviations
Abbreviation Definition
ar1 The autoregressive correlation of order 1
GEE Generalised estimating equation
GLM Generalised linear model
km Kilometre
m Metre
MGM Mount Gibson Mining Limited
MS Ministerial Statement
PERMANOVA Permutation-based multivariate analysis of variance
Mount Gibson Mining Ltd Survivorship and Health of Darwinia masonii, February 2016
Page | iii
Executive Summary
Mount Gibson Mining Limited operates the Extension Hill Hematite Project in the Mt Gibson Ranges, approximately 260 km south-east of Geraldton, Western Australia. Darwinia masonii (Myrtaceae) is a species of threatened flora with restricted distribution on ranges around Mt Gibson.
Survivorship, height and health condition of D. masonii were examined using monitoring data collected between August 2007 and November 2013. The purpose of which, was to determine whether there is significant interaction between spatial and temporal variation in three D. masonii variables in relation to mining activities.
Data from monitoring sites D1 and D2 on Extension Hill South and D9 to D12 on Mt Gibson North were selected for the analysis. Each of these six sites contained data from all monitoring field visits.
Generalised estimating equation was used to analyse data, and it was possible to incorporate the temporal correlations between field visits in the analysis. In addition, alternative analyses using generalised linear models and permutation-based multivariate analysis of variance were carried out. It was not possible to incorporate the temporal correlations between time periods in these analyses.
Interpretation of results can be summarised as follows:
• There was strong temporal variation in survivorship, health condition and height of D. masonii between August 2007 and November 2013. Reduced survivorship and poor health condition were observed in 2010 and 2013.
• There was strong variation in survivorship, health condition and height of D. masonii between monitoring sites within a range as well as between groups of monitoring sites. However, the spatial variation was not related to distance from the mine pit.
• The spatial and temporal variation in survivorship, health condition and height of D. masonii was not likely to be related to activities at the mine pit. This is because both the temporal variation and small-scale spatial variation (between monitoring sites) were observed in each of Extension Hill South (adjacent to the mine pit) and Mt Gibson North (at least 2 km from the mine pit).
• Overall, survivorship rates over the monitoring period were lowest in plants at monitoring sites in two of three zones: near the mine (0.3 to 1.0 km from mine pit) and on the southern parts of the Mt Gibson Ranges (2.5 to 4.5 km from mine pit). Plants at mid-range monitoring sites (1.0 to 2.5 km from mine pit) tended to display highest survivorship rates over the six year monitoring period.
Mount Gibson Mining Ltd Survivorship and Health of Darwinia masonii, February 2016
Page | iv
Table of Contents
1 Introduction ..................................................................................................................................... 1
1.1 Background ............................................................................................................................. 1
1.2 Scope of Works ....................................................................................................................... 1
2 Methodology ................................................................................................................................... 2
2.1 Data ......................................................................................................................................... 2
2.2 Data Management and Preliminary Examination of Data ...................................................... 4
2.2.1 Data to be used ........................................................................................................... 4
2.2.2 Design to be used ........................................................................................................ 4
2.2.3 Models to be used....................................................................................................... 5
2.3 Statistical Data Analysis .......................................................................................................... 5
2.3.1 Models that incorporate correlations between time periods .................................... 5
2.3.2 Models that do not incorporate correlations between time periods ......................... 6
3 Results ............................................................................................................................................. 7
3.1 Preliminary Data Analysis ........................................................................................................ 7
3.2 Statistical Data Analysis ........................................................................................................ 11
3.2.1 Models that incorporate correlations between time periods .................................. 11
3.2.2 Models that do not incorporate correlations between time periods ....................... 12
3.2.3 Results of the reduced model came with a warning so not used. ............................ 12
4 Discussion ...................................................................................................................................... 14
4.1 General Discussion ................................................................................................................ 14
4.2 Effects of the Environment ................................................................................................... 14
4.3 Limitations ............................................................................................................................. 15
5 Conclusions .................................................................................................................................... 16
6 References ..................................................................................................................................... 17
List of Figures
Figure 1: Location of Darwinia masonii monitoring sites. Symbols with red borders are monitoring sites used in the detailed statistical data analysis. ......................................................................... 2
Figure 2: Health condition of Darwinia masonii in different monitoring sites between August 2007 and November 2013. ...................................................................................................................... 8
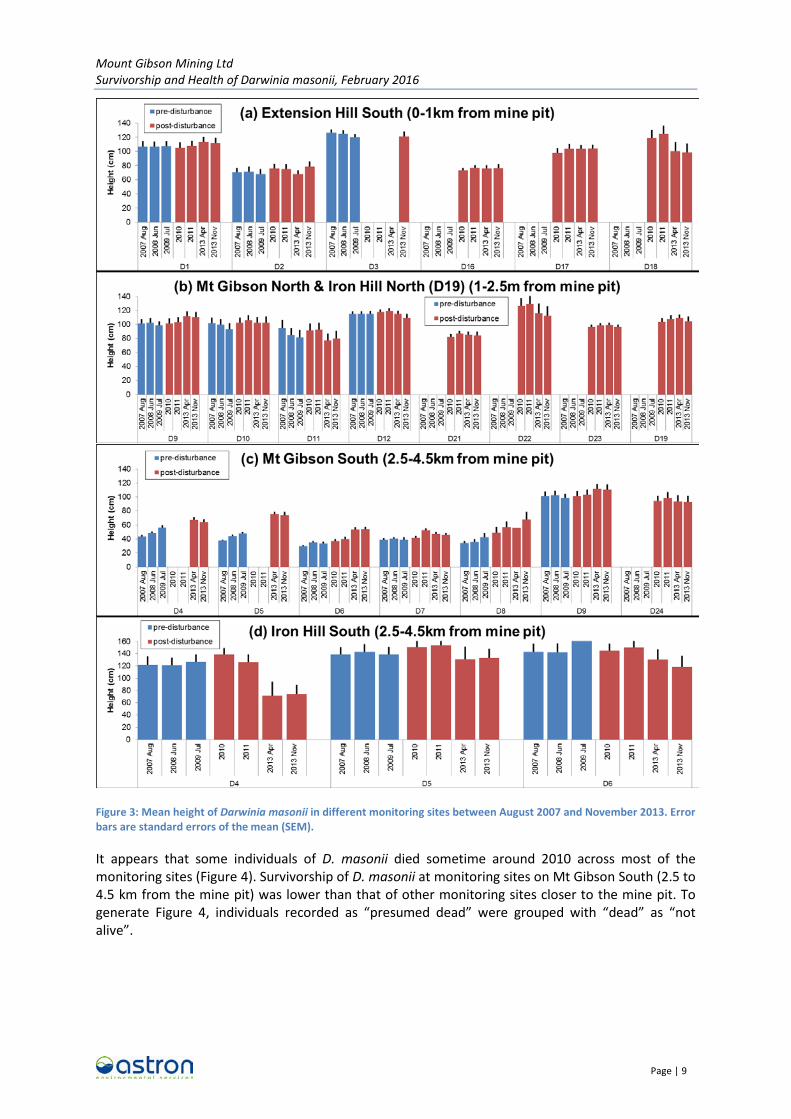
Figure 3: Mean height of Darwinia masonii in different monitoring sites between August 2007 and November 2013. Error bars are standard errors of the mean (SEM). ............................................ 9
Mount Gibson Mining Ltd Survivorship and Health of Darwinia masonii, February 2016
Page | v
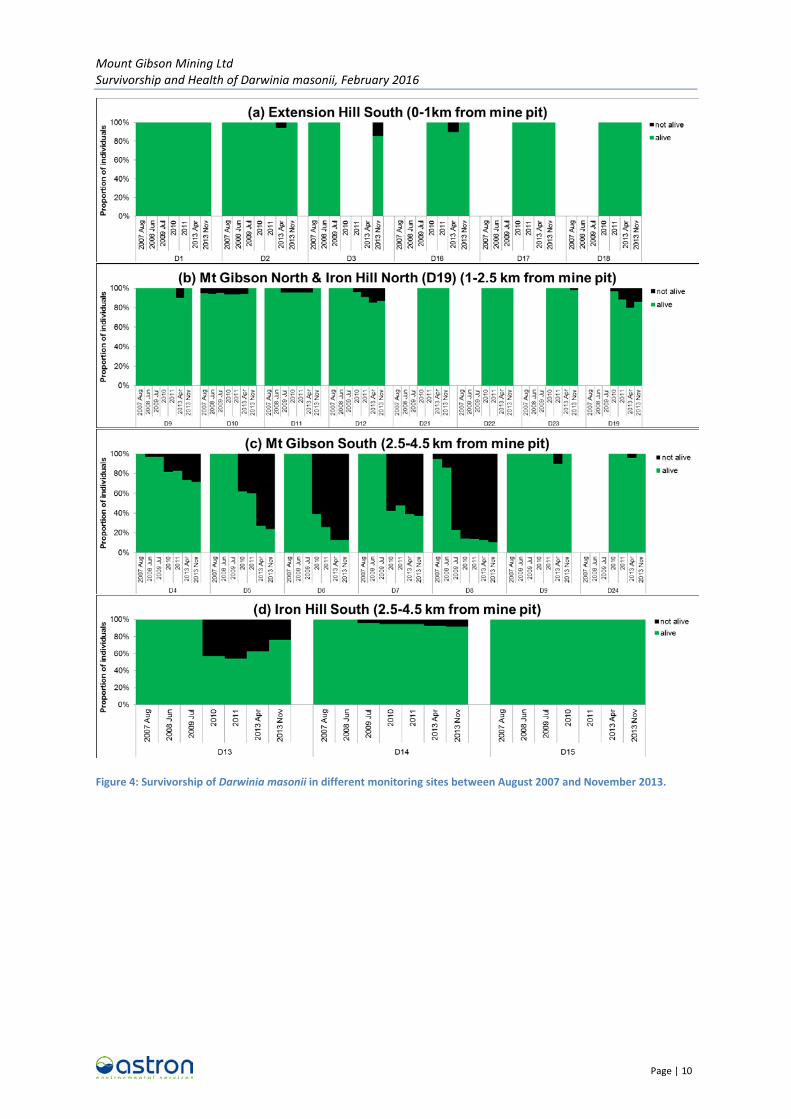
Figure 4: Survivorship of Darwinia masonii in different monitoring sites between August 2007 and November 2013. ........................................................................................................................... 10
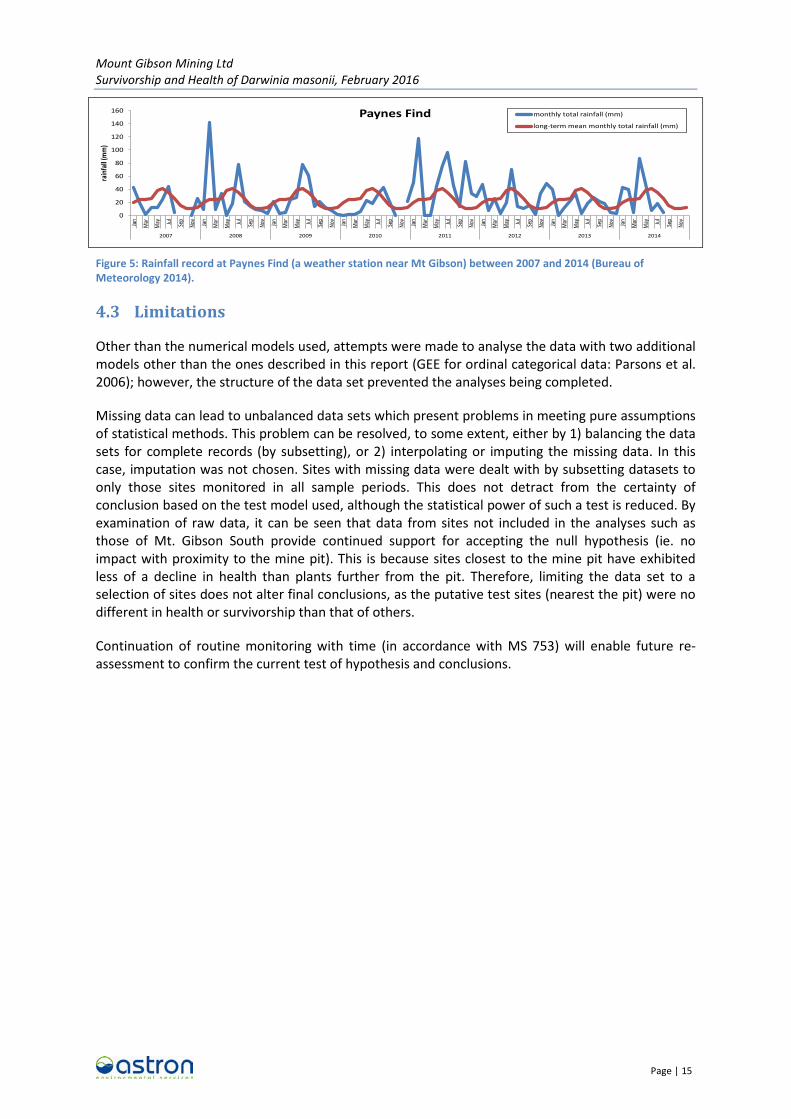
Figure 5: Rainfall record at Paynes Find (a weather station near Mt Gibson) between 2007 and 2014 (Bureau of Meteorology 2014). .................................................................................................... 15
List of Tables
Table 1: Darwinia masonii monitoring sites. .......................................................................................... 3
Table 2: Results of analyses using generalised estimating equations. P-values for the interaction are shown for the three test parameters. .......................................................................................... 11
Table 3: Summary of results of categorical data analysis. P-values are shown. ................................... 12
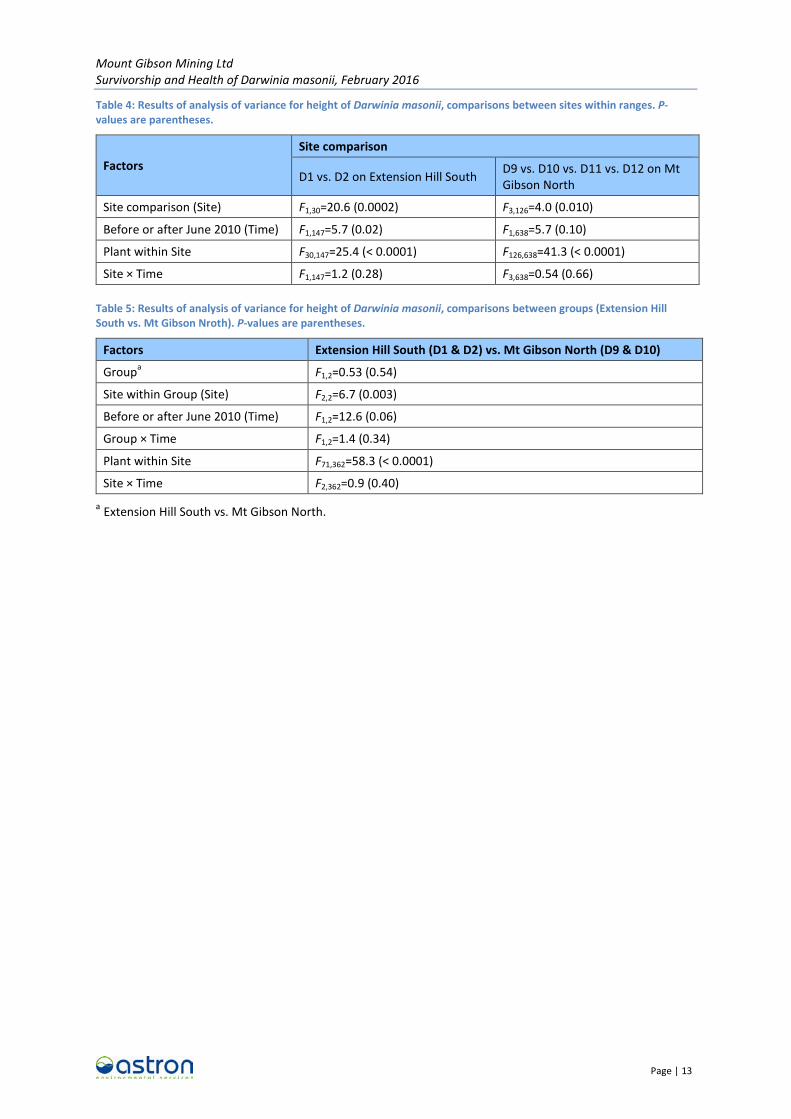
Table 4: Results of analysis of variance for height of Darwinia masonii, comparisons between sites within ranges. P-values are parentheses. ..................................................................................... 13
Table 5: Results of analysis of variance for height of Darwinia masonii, comparisons between groups (Extension Hill South vs. Mt Gibson Nroth). P-values are parentheses. ....................................... 13
List of Appendices
Appendix A: Darwinia masonii Survival and Health Analysis (Ecologia Environment 2014)
Mount Gibson Mining Ltd Survivorship and Health of Darwinia masonii, February 2016
Page | 1
1 Introduction
1.1 Background
Mount Gibson Mining Limited (MGM) operates the Extension Hill Hematite Project in the Mt Gibson Ranges, approximately 260 kilometres (km) south-east of Geraldton, Western Australia. Darwinia masonii (Myrtaceae) is a species of threatened flora with restricted distribution on ranges around Mt Gibson (Globe Environments 2014). The development of the Extension Hill Project is subject to the conditions of Ministerial Statement (MS) 753 (State of Western Australia 2007), which includes conditions related to D. masonii. On-going monitoring of the D. masonii populations is detailed in the Darwinia masonii Recovery Plan (MGM and Extension Hill Pty Ltd 2014) and the Interim Recovery Plan for Darwinia masonii (Department of Environment and Conservation 2008) both of which are required under Condition 6 of MS 753.
1.2 Scope of Works
Astron Environmental Services was engaged to examine survivorship, height and health condition of D. masonii in records collected between August 2007 and November 2013. Statistical analyses examined whether there is significant interaction between spatial variation and temporal variation in the three variables in relation to mining activities.
Mount Gibson Mining Ltd Survivorship and Health of Darwinia masonii, February 2016
Page | 2
2 Methodology
2.1 Data
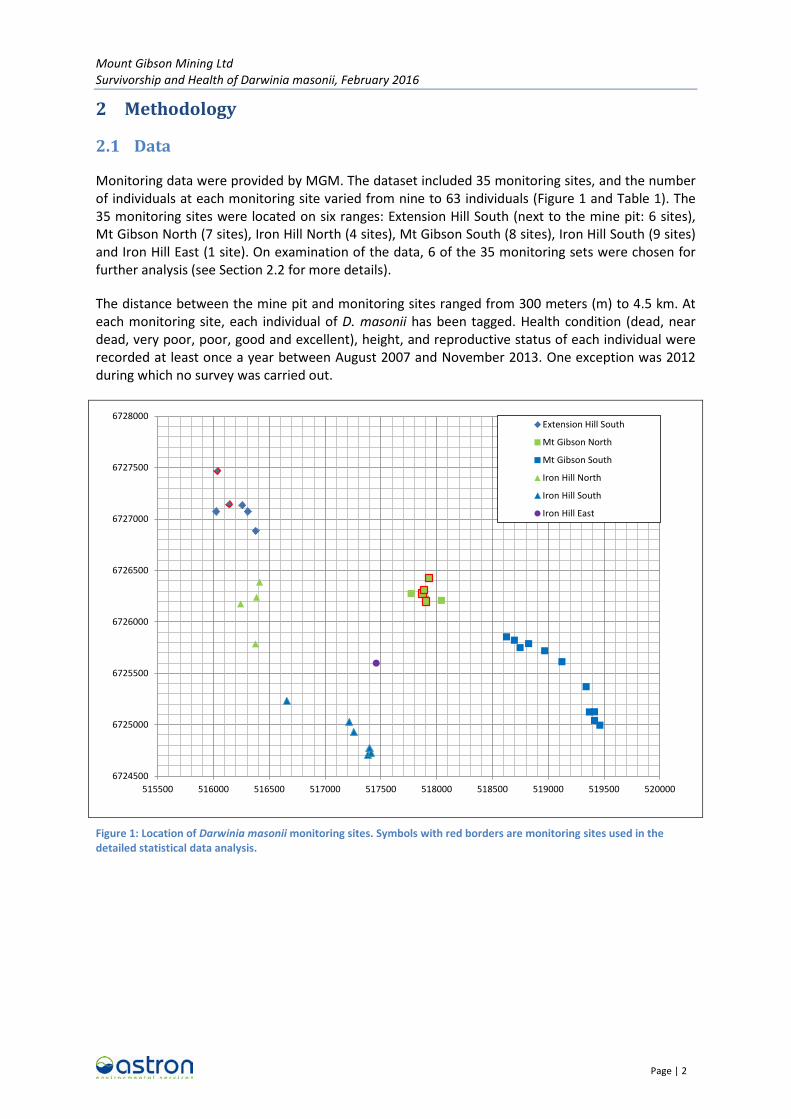
Monitoring data were provided by MGM. The dataset included 35 monitoring sites, and the number of individuals at each monitoring site varied from nine to 63 individuals (Figure 1 and Table 1). The 35 monitoring sites were located on six ranges: Extension Hill South (next to the mine pit: 6 sites), Mt Gibson North (7 sites), Iron Hill North (4 sites), Mt Gibson South (8 sites), Iron Hill South (9 sites) and Iron Hill East (1 site). On examination of the data, 6 of the 35 monitoring sets were chosen for further analysis (see Section 2.2 for more details).
The distance between the mine pit and monitoring sites ranged from 300 meters (m) to 4.5 km. At each monitoring site, each individual of D. masonii has been tagged. Health condition (dead, near dead, very poor, poor, good and excellent), height, and reproductive status of each individual were recorded at least once a year between August 2007 and November 2013. One exception was 2012 during which no survey was carried out.
Figure 1: Location of Darwinia masonii monitoring sites. Symbols with red borders are monitoring sites used in the detailed statistical data analysis.
6724500
6725000
6725500
6726000
6726500
6727000
6727500
6728000
515500 516000 516500 517000 517500 518000 518500 519000 519500 520000
Extension Hill South
Mt Gibson North
Mt Gibson South
Iron Hill North
Iron Hill South
Iron Hill East
Mount Gibson Mining Ltd Survivorship and Health of Darwinia masonii, February 2016
Page | 3
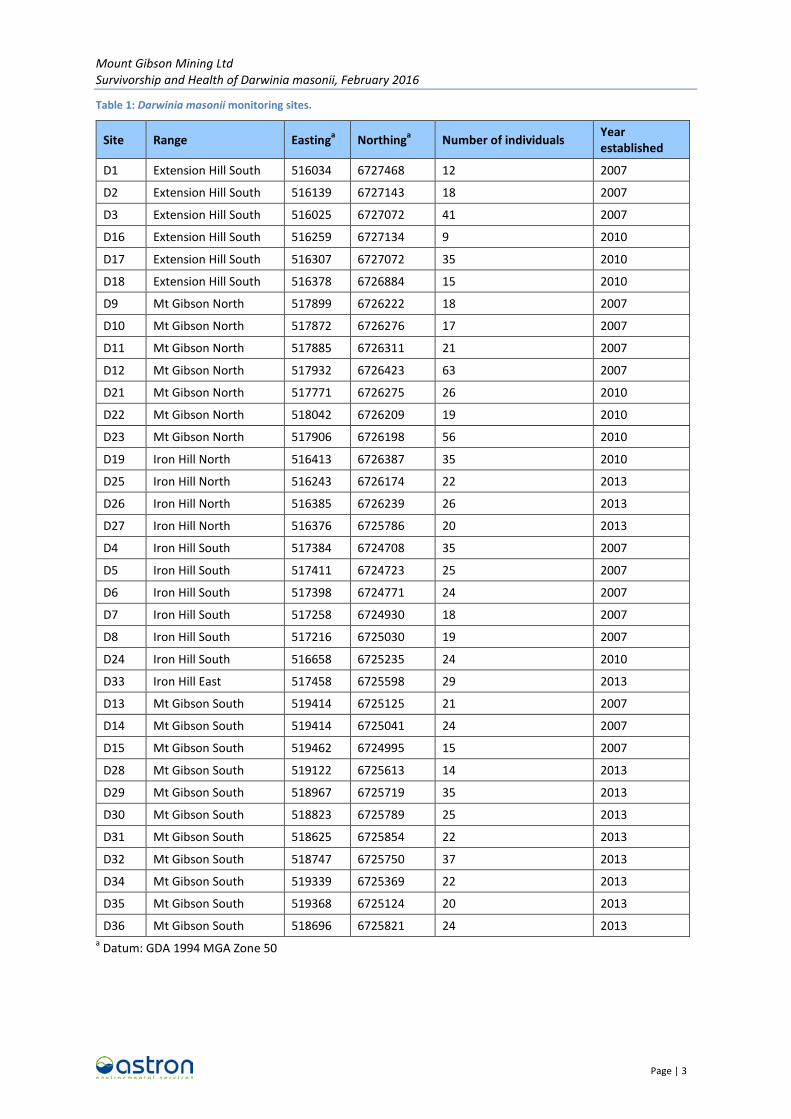
Table 1: Darwinia masonii monitoring sites.
Site Range Eastinga Northinga Number of individuals Year established
D1 Extension Hill South 516034 6727468 12 2007
D2 Extension Hill South 516139 6727143 18 2007
D3 Extension Hill South 516025 6727072 41 2007
D16 Extension Hill South 516259 6727134 9 2010
D17 Extension Hill South 516307 6727072 35 2010
D18 Extension Hill South 516378 6726884 15 2010
D9 Mt Gibson North 517899 6726222 18 2007
D10 Mt Gibson North 517872 6726276 17 2007
D11 Mt Gibson North 517885 6726311 21 2007
D12 Mt Gibson North 517932 6726423 63 2007
D21 Mt Gibson North 517771 6726275 26 2010
D22 Mt Gibson North 518042 6726209 19 2010
D23 Mt Gibson North 517906 6726198 56 2010
D19 Iron Hill North 516413 6726387 35 2010
D25 Iron Hill North 516243 6726174 22 2013
D26 Iron Hill North 516385 6726239 26 2013
D27 Iron Hill North 516376 6725786 20 2013
D4 Iron Hill South 517384 6724708 35 2007
D5 Iron Hill South 517411 6724723 25 2007
D6 Iron Hill South 517398 6724771 24 2007
D7 Iron Hill South 517258 6724930 18 2007
D8 Iron Hill South 517216 6725030 19 2007
D24 Iron Hill South 516658 6725235 24 2010
D33 Iron Hill East 517458 6725598 29 2013
D13 Mt Gibson South 519414 6725125 21 2007
D14 Mt Gibson South 519414 6725041 24 2007
D15 Mt Gibson South 519462 6724995 15 2007
D28 Mt Gibson South 519122 6725613 14 2013
D29 Mt Gibson South 518967 6725719 35 2013
D30 Mt Gibson South 518823 6725789 25 2013
D31 Mt Gibson South 518625 6725854 22 2013
D32 Mt Gibson South 518747 6725750 37 2013
D34 Mt Gibson South 519339 6725369 22 2013
D35 Mt Gibson South 519368 6725124 20 2013
D36 Mt Gibson South 518696 6725821 24 2013 a Datum: GDA 1994 MGA Zone 50
Mount Gibson Mining Ltd Survivorship and Health of Darwinia masonii, February 2016
Page | 4
2.2 Data Management and Preliminary Examination of Data
The data had been stored in an Excel worksheet, with one row for an individual. This is called the wide file format. Columns were grouped for site information, dates (one column per field visit), health condition, height, reproduction and notes. For each variable (such as health condition), data from a monitoring field visit were in a column so that changes in values of a variable for a given individual plant across monitoring field visit could be examined easily. However, extracting data from the wide file format for analyses is not necessarily easy. Thus, the data were reorganised into the long file format. In this format, each row contains values of the three variables for an individual plant measured/recorded on a particular monitoring field visit.
Data were then examined one variable at a time using graphs (Figures 2 to 4). Of the 35 monitoring sites, fifteen sites were monitored once a year from 2007 to 2011, and 2013 (shown in the figures, and considered for analysis because the data represents the longest and most consistent data set), nine sites were monitored for at least three years (also shown in the figures, but not considered for further analysis) and 11 additional sites were established in 2013 (not shown in the figures, nor considered for further analysis).
Upon preliminary examination of data, it was apparent that some tagged individuals were not located on some field visits. This meant that there were some missing observations/measurements, even in sites which were monitored each year. After preliminary examination of the data, it was decided to take the following approach for data analysis.
2.2.1 Data to be used
Data from monitoring sites D1 and D2 on Extension Hill South and D9 – D12 on Mt Gibson North were selected for use. This subset of the data was selected as each of these six sites contained data from all seven monitoring field visits, 2007 to 2013. This subset of sites represented 26% of the total number of plants monitored prior to 2013 and included the site closest to the mine pit (D1, 300 m from pit, 15 plants), a site near the mine pit (D2, 700 m from pit, 19 plants) and sites further from the mine pit (D9 - D12, approx. 2.4 km from pit, 21 to 70 plants per site)
2.2.2 Design to be used
Three site comparisons were chosen: (i) D1 vs.D2; (ii) Extension Hill South (D1 & D2) vs. Mt Gibson North (D9 – D12); and (iii) D9 vs. D10 vs. D11 vs. D12. Effects of mining activities over relatively short distances are examined in the first comparison. Effects over 1 km are examined in the second comparison. The third comparison is the control for the first comparison. If significant differences were found between D1 and D2 but not between D9 to D12, then the differences may potentially be attributed to mining activities. However, if significant differences were found between D1 and D2 as well as between D9 to D12, then the differences are not attributable to mining activities, because the test hypothesis is that individuals at sites closest to the mine would be most at-risk of impact.
There are two possible ways in which impacts of mining activities at the mine pit on D. masonii can be detected. Firstly, the negative impact can be inferred if health condition or survivorship at the monitoring site closest to the pit after 2010 is worse/lower than prior to 2010 and if there is no change in health condition or survivorship at the other monitoring site (i.e. significant site × time interaction with the pattern in data that is consistent with the description). Secondly, the negative impact can be inferred if health condition or survivorship at monitoring sites on Extension Hill South after 2010 is worse/lower than after 2010 and if there was no change in health condition or survivorship at monitoring sites on Mt Gibson North.
Mount Gibson Mining Ltd Survivorship and Health of Darwinia masonii, February 2016
Page | 5
From our experience in analysing data to detect impacts of dust on plants/vegetation, potentially damaging levels of dust are most likely to be observed at monitoring sites very close to the source of dust (M. Matsuki, Senior Scientist, Astron Environmental Services, unpublished data). Also, when factors other than dust were examined, there would be much smaller number of factors that may affect plants more than 2 km from the mine pit than immediately adjacent to the mine pit. Thus, the comparison between monitoring sites at Extension Hill South would be a stronger test than the comparison between Extension Hill South and Mt Gibson North (If D1 and D2 are located at different distances from the mine pit).
However, there is still a possibility of detecting a significant site × time interaction at Extension Hill South without any real impacts of mining activities. The between-site comparison at Mt Gibson North is called ‘contrast’. Mt Gibson North is too far from the mine pit for D. masonii to be impacted by mining activities and there is no plausible impacting mechanism that can be reasoned. Therefore, a significant site x time interaction at Mt Gibson North should not be due to mining activities. Consequently, if the significant site × time interaction is observed at Extension Hill South and at Mt Gibson North, then the significant site × time interaction at Extension Hill South in itself would be sufficiently strong evidence to indicate impacts of mining activities (and should prompt further data analysis).
2.2.3 Models to be used
Observations/measurements on D. masonii were made on tagged individuals repeatedly from August 2007 to November 2013 (a longitudinal dataset). As such, the best way to analyse the data is to use models for repeated measurements. However, as described earlier, the D. masonii data were found to include some missing observations which restricted our ability to conduct analyses of repeated-measures data.
Three solutions to address this were considered. Firstly, those individuals with missing observations be removed from the data. Secondly, that missing observations be filled in, in a procedure referred to as imputation. Thirdly, that correlation between observations is ignored, with the data analysed as if they were not longitudinal data.
After adopting the first and second solution, generalised estimating equations (GEE) (Liang and Zeger 1986, Diggle et al. 1994) were used. After adopting the third solution, generalised linear models (GLM) and permutation-based multivariate analysis of variance (PERMANOVA) (Anderson et al. 2008) were used. These models are described in detail in the next section.
2.3 Statistical Data Analysis
The main purpose of the statistical data analyses was to examine whether there are significant interactions between the site comparison and time (the number of months since August 2007). If there had been impacts of mining operations on D. masonii populations, then effect, if detectable, would be observed only at monitoring sites near the mine pit after June 2010. In contrast, there should not be any comparable changes at monitoring sites far from the mine pit. The observation of changes near the mine pit with no change away from the mine pit would result in a significant site × time interaction.
2.3.1 Models that incorporate correlations between time periods
Health condition, height and survivorship were analysed using GEE using R statistical software with geepack package. Height was analysed using GEE with normal distribution, while survivorship was analysed using GEE with binomial distribution. There was no suitable distribution for analysis of
Mount Gibson Mining Ltd Survivorship and Health of Darwinia masonii, February 2016
Page | 6
health condition using GEE. Therefore, categories of health condition were grouped into either not healthy (dead, near dead, very poor, and poor) or healthy (good and excellent) and analysed using GEE with binomial distribution. For each response variable, the site comparison (i), (ii) or (iii) was used as the categorical explanatory variable. The number of months since August 2007 was used as the continuous explanatory variable.
Two options for correlations between time periods were used. In repeated-measures analysis, the correlation is often assumed to be the autoregressive correlation of order 1 (ar1: correlated only with the previous time period), and thus, the ar1 option was used. However, correlations between time periods may not conform to ar1. Also, the ar1 option assumes that the field visits are equally spaced in time. Strictly speaking, this assumption is not met with D. masonii data. So, the option for unstructured correlations (separate correlation coefficient for each pair of time periods) was also used.
For the missing record of health condition of an individual, the mean of all health measurements for that individual was used. One exception was that when the health condition was recorded as “dead” in the previous and next field visit. In such an instance, the missing health condition was replaced with “dead”.
For the missing height measurements of an individual, the mean of all height measurements for that individual was used. Individuals that had died were excluded from the analysis. For analyses of height, individuals that had been clearly indicated as seedlings were excluded.
Height, health condition and reproduction of some individuals were missing between 2009 and 2011. If those individuals were found in 2013, then it was assumed that they had been present between 2009 and 2011. If those individuals were still missing in 2013, then they were treated as dead when they had gone missing.
2.3.2 Models that do not incorporate correlations between time periods
Health condition was analysed using adjacent-categories logit model (Agresti 1990, 2010) using R statistical software with VGAM package. This model treats health condition as the ordered categorical variable. The site comparison (i), (ii) or (iii) was used as a categorical explanatory variable. The number of months since August 2007 was also used as a categorical explanatory variable. Because the number of individuals in some health condition categories was limited, the following categories were combined: “dead” and “presumed dead”, “nearly dead” and “very poor”, and “good” and “excellent”.
Height was analysed using PERMANOVA. Euclidean distance was used to generate the distance matrix. The site comparison (i), (ii) or (iii) and before or after June 2010 were used as fixed factors. Plant ID was nested within each monitoring site. For this analysis, individuals that had been clearly indicated as seedlings were excluded. For the analysis with the site comparison (ii), only sites D9 and D10 from Mt Gibson North were included. There are some limitations of running repeated-measures analysis using PERMANOVA. The primary limitation is that it is not possible to incorporate correlation between time periods for each individual. However, in the analyses, time periods were pooled into either before or after June 2010, on the presumption that this would have reduced covariance between time periods for each plant.
Survivorship was analysed using GLM with binomial distribution (Faraway 2006) using R statistical software. The site comparison (i), (ii) or (iii) was used as the categorical explanatory variable. The number of months since August 2007 was used as the continuous explanatory variable.
Mount Gibson Mining Ltd Survivorship and Health of Darwinia masonii, February 2016
Page | 7
3 Results
3.1 Preliminary Data Analysis
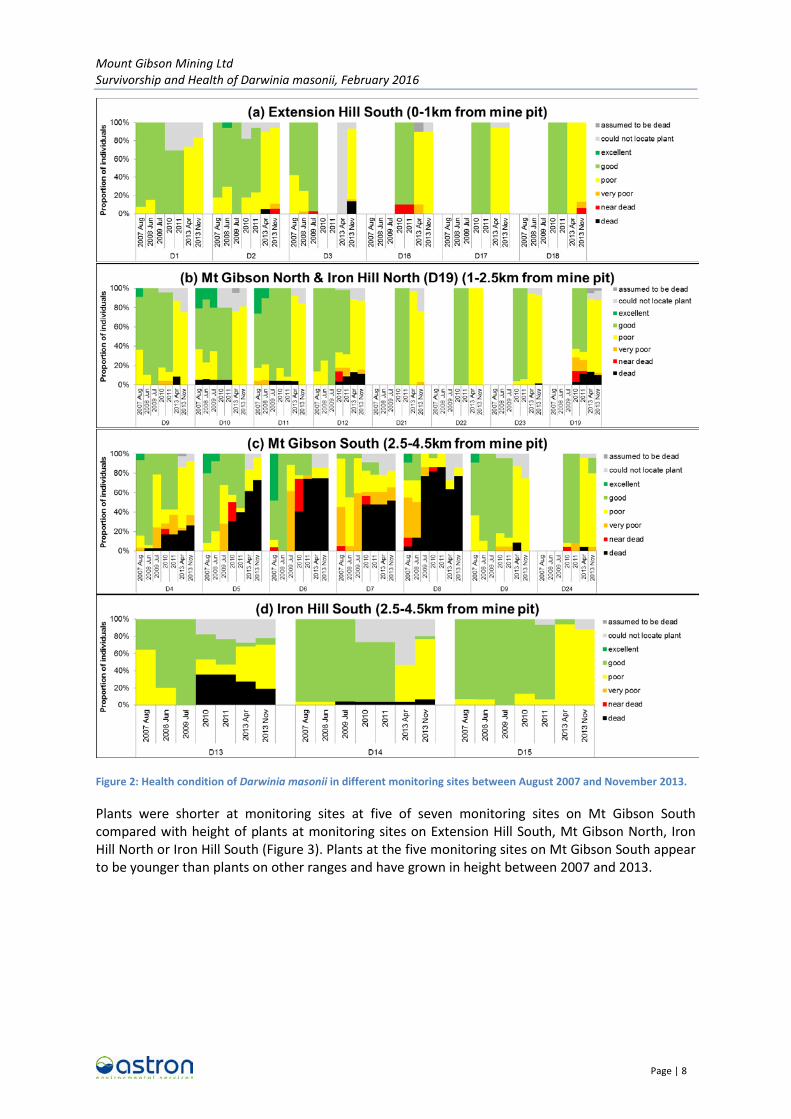
Health condition in 2013 was clearly different from earlier monitoring field visits across monitoring sites (Figure 2). It was also clear that declines in health condition of D. masonii at monitoring sites on Mt Gibson South (3 to 4 km from the mine pit) had been more severe than those closer to the mine pit at Extension Hill South, Mt Gibson North and Iron Hill North. Temporal patterns in plant health in sites closest to the mine pit (D1 and D2) are similar to those 2.4 km from the mine pit (D9 - D12). This tendency suggests common stressors or events that influence plant condition more broadly (such as rainfall quantities, extent of dry periods and temperature).
Mount Gibson Mining Ltd Survivorship and Health of Darwinia masonii, February 2016
Page | 8
Figure 2: Health condition of Darwinia masonii in different monitoring sites between August 2007 and November 2013.
Plants were shorter at monitoring sites at five of seven monitoring sites on Mt Gibson South compared with height of plants at monitoring sites on Extension Hill South, Mt Gibson North, Iron Hill North or Iron Hill South (Figure 3). Plants at the five monitoring sites on Mt Gibson South appear to be younger than plants on other ranges and have grown in height between 2007 and 2013.
Mount Gibson Mining Ltd Survivorship and Health of Darwinia masonii, February 2016
Page | 9
Figure 3: Mean height of Darwinia masonii in different monitoring sites between August 2007 and November 2013. Error bars are standard errors of the mean (SEM).
It appears that some individuals of D. masonii died sometime around 2010 across most of the monitoring sites (Figure 4). Survivorship of D. masonii at monitoring sites on Mt Gibson South (2.5 to 4.5 km from the mine pit) was lower than that of other monitoring sites closer to the mine pit. To generate Figure 4, individuals recorded as “presumed dead” were grouped with “dead” as “not alive”.
Mount Gibson Mining Ltd Survivorship and Health of Darwinia masonii, February 2016
Page | 10
Figure 4: Survivorship of Darwinia masonii in different monitoring sites between August 2007 and November 2013.
Mount Gibson Mining Ltd Survivorship and Health of Darwinia masonii, February 2016
Page | 11
3.2 Statistical Data Analysis
3.2.1 Models that incorporate correlations between time periods
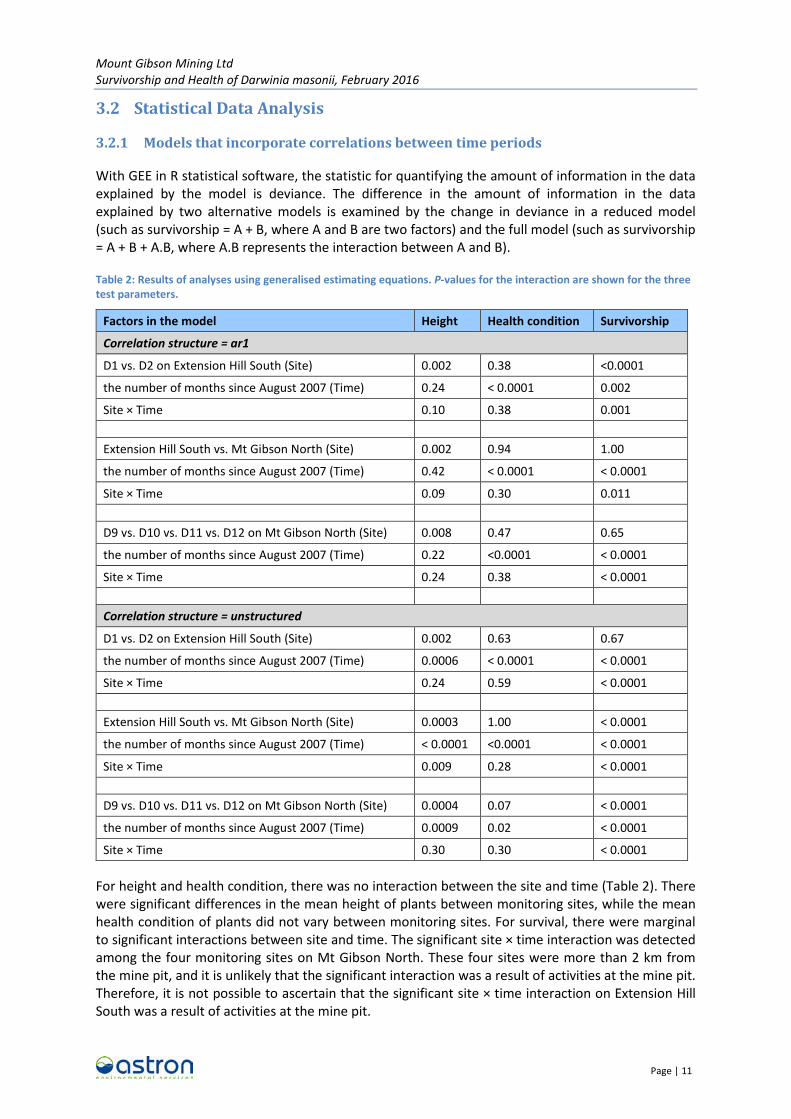
With GEE in R statistical software, the statistic for quantifying the amount of information in the data explained by the model is deviance. The difference in the amount of information in the data explained by two alternative models is examined by the change in deviance in a reduced model (such as survivorship = A + B, where A and B are two factors) and the full model (such as survivorship = A + B + A.B, where A.B represents the interaction between A and B).
Table 2: Results of analyses using generalised estimating equations. P-values for the interaction are shown for the three test parameters.
Factors in the model Height Health condition Survivorship
Correlation structure = ar1
D1 vs. D2 on Extension Hill South (Site) 0.002 0.38 <0.0001
the number of months since August 2007 (Time) 0.24 < 0.0001 0.002
Site × Time 0.10 0.38 0.001 Extension Hill South vs. Mt Gibson North (Site) 0.002 0.94 1.00
the number of months since August 2007 (Time) 0.42 < 0.0001 < 0.0001
Site × Time 0.09 0.30 0.011 D9 vs. D10 vs. D11 vs. D12 on Mt Gibson North (Site) 0.008 0.47 0.65
the number of months since August 2007 (Time) 0.22 <0.0001 < 0.0001
Site × Time 0.24 0.38 < 0.0001 Correlation structure = unstructured
D1 vs. D2 on Extension Hill South (Site) 0.002 0.63 0.67
the number of months since August 2007 (Time) 0.0006 < 0.0001 < 0.0001
Site × Time 0.24 0.59 < 0.0001 Extension Hill South vs. Mt Gibson North (Site) 0.0003 1.00 < 0.0001
the number of months since August 2007 (Time) < 0.0001 <0.0001 < 0.0001
Site × Time 0.009 0.28 < 0.0001 D9 vs. D10 vs. D11 vs. D12 on Mt Gibson North (Site) 0.0004 0.07 < 0.0001
the number of months since August 2007 (Time) 0.0009 0.02 < 0.0001
Site × Time 0.30 0.30 < 0.0001
For height and health condition, there was no interaction between the site and time (Table 2). There were significant differences in the mean height of plants between monitoring sites, while the mean health condition of plants did not vary between monitoring sites. For survival, there were marginal to significant interactions between site and time. The significant site × time interaction was detected among the four monitoring sites on Mt Gibson North. These four sites were more than 2 km from the mine pit, and it is unlikely that the significant interaction was a result of activities at the mine pit. Therefore, it is not possible to ascertain that the significant site × time interaction on Extension Hill South was a result of activities at the mine pit.
Mount Gibson Mining Ltd Survivorship and Health of Darwinia masonii, February 2016
Page | 12
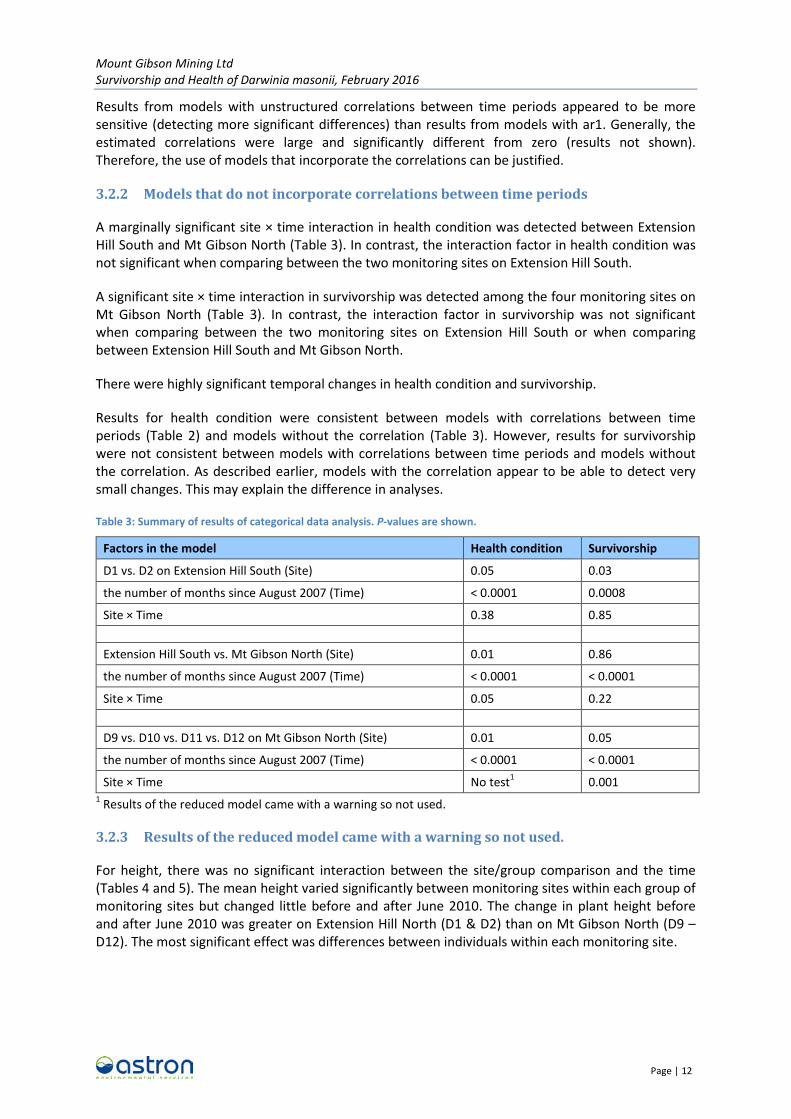
Results from models with unstructured correlations between time periods appeared to be more sensitive (detecting more significant differences) than results from models with ar1. Generally, the estimated correlations were large and significantly different from zero (results not shown). Therefore, the use of models that incorporate the correlations can be justified.
3.2.2 Models that do not incorporate correlations between time periods
A marginally significant site × time interaction in health condition was detected between Extension Hill South and Mt Gibson North (Table 3). In contrast, the interaction factor in health condition was not significant when comparing between the two monitoring sites on Extension Hill South.
A significant site × time interaction in survivorship was detected among the four monitoring sites on Mt Gibson North (Table 3). In contrast, the interaction factor in survivorship was not significant when comparing between the two monitoring sites on Extension Hill South or when comparing between Extension Hill South and Mt Gibson North.
There were highly significant temporal changes in health condition and survivorship.
Results for health condition were consistent between models with correlations between time periods (Table 2) and models without the correlation (Table 3). However, results for survivorship were not consistent between models with correlations between time periods and models without the correlation. As described earlier, models with the correlation appear to be able to detect very small changes. This may explain the difference in analyses.
Table 3: Summary of results of categorical data analysis. P-values are shown.
Factors in the model Health condition Survivorship
D1 vs. D2 on Extension Hill South (Site) 0.05 0.03
the number of months since August 2007 (Time) < 0.0001 0.0008
Site × Time 0.38 0.85 Extension Hill South vs. Mt Gibson North (Site) 0.01 0.86
the number of months since August 2007 (Time) < 0.0001 < 0.0001
Site × Time 0.05 0.22 D9 vs. D10 vs. D11 vs. D12 on Mt Gibson North (Site) 0.01 0.05
the number of months since August 2007 (Time) < 0.0001 < 0.0001
Site × Time No test1 0.001 1 Results of the reduced model came with a warning so not used.
3.2.3 Results of the reduced model came with a warning so not used.
For height, there was no significant interaction between the site/group comparison and the time (Tables 4 and 5). The mean height varied significantly between monitoring sites within each group of monitoring sites but changed little before and after June 2010. The change in plant height before and after June 2010 was greater on Extension Hill North (D1 & D2) than on Mt Gibson North (D9 – D12). The most significant effect was differences between individuals within each monitoring site.
Mount Gibson Mining Ltd Survivorship and Health of Darwinia masonii, February 2016
Page | 13
Table 4: Results of analysis of variance for height of Darwinia masonii, comparisons between sites within ranges. P-values are parentheses.
Factors Site comparison
D1 vs. D2 on Extension Hill South D9 vs. D10 vs. D11 vs. D12 on Mt Gibson North
Site comparison (Site) F1,30=20.6 (0.0002) F3,126=4.0 (0.010)
Before or after June 2010 (Time) F1,147=5.7 (0.02) F1,638=5.7 (0.10)
Plant within Site F30,147=25.4 (< 0.0001) F126,638=41.3 (< 0.0001)
Site × Time F1,147=1.2 (0.28) F3,638=0.54 (0.66)
Table 5: Results of analysis of variance for height of Darwinia masonii, comparisons between groups (Extension Hill South vs. Mt Gibson Nroth). P-values are parentheses.
Factors Extension Hill South (D1 & D2) vs. Mt Gibson North (D9 & D10)
Groupa F1,2=0.53 (0.54)
Site within Group (Site) F2,2=6.7 (0.003)
Before or after June 2010 (Time) F1,2=12.6 (0.06)
Group × Time F1,2=1.4 (0.34)
Plant within Site F71,362=58.3 (< 0.0001)
Site × Time F2,362=0.9 (0.40)
a Extension Hill South vs. Mt Gibson North.
Mount Gibson Mining Ltd Survivorship and Health of Darwinia masonii, February 2016
Page | 14
4 Discussion
4.1 General Discussion
Results of statistical analyses summarised in Tables 2 to 5 are consistent with data summarised in Figures 2 – 4. Interpretation of the results can be summarised as follows:
• There was strong temporal variation in survivorship, health condition and height of D. masonii between August 2007 and November 2013. Reduced survivorship and poor health condition were observed in 2010 and 2013.
• Some individuals of D. masonii died sometime around 2010 across most of the monitoring sites. Disturbance at the mine pit began during 2010 (Appendix A). Survivorship of D. masonii at monitoring sites on Mt Gibson South, which was more than 2 km from the mine pit, was lower than that at other monitoring sites. The age of the plant may also have accounted for natural mortality which was greatest at sites on Mt Gibson South.
• There was strong variation in survivorship, health condition and height of D. masonii between monitoring sites within a range as well as between groups of monitoring sites. However, the spatial variation was not related to distance from the mine pit.
• The spatial and temporal variation in survivorship, health condition and height of D. masonii was not likely to be related to activities at the mine pit. This is because both the temporal variation and small-scale spatial variation (between monitoring sites) were observed in each of Extension Hill South (adjacent to the mine pit) and Mt Gibson North (at least 2 km from the mine pit).
• The results of statistical analysis indicated that there was no evidence of detectable effects of dust. This was consistent with earlier preliminary health assessment (Ecologia Environment 2014) (Appendix A).
• Survivorship based on Turnbull Kaplan-Meier analysis (Appendix A) was lowest for two zones: those sites nearest the mine pit (0.3 to 1.0 km) and the sites furthest from the pit (2.5 to 4.5 km). A detailed examination of plant survival (Figure 4) indicates no relationship between distance to the mine pit and plant survival over the monitoring period.
4.2 Effects of the Environment
Statistical data analyses indicated that there were significant temporal changes in health condition and survivorship of D. masonii. The temporal changes are also clearly discernible in Figures 2 and 4. Plant mortality evidently occurred sometime between July 2009 and 2010. Also, health condition ratings worsened between 2012 and April 2013. These temporal changes were observed across most sites where records were available. Therefore, these changes were not likely to be related to distance from the mine pit or mining activity but are likely a factor or factors that affected the whole region. One possible explanation is offered by an assessment of between-year variation in rainfall at Paynes Find, a weather station near Mt Gibson Ranges (Figure 5). Rainfall was relatively low in 2010 and again in 2013. However, lower survivorship and worse health condition of D. masonii on Mt Gibson South compared with other locations requires an explanation other than temporal changes in rainfall at a regional scale. The group of plants on Mt Gibson South are comprised of shorter plants (including juveniles) so are likely to be less resilient to drought (T. Collie, MGM, pers. comm., September 2014). This may explain the difference in survivorship and health condition between Mt Gibson South and other monitoring sites.
Mount Gibson Mining Ltd Survivorship and Health of Darwinia masonii, February 2016
Page | 15
Figure 5: Rainfall record at Paynes Find (a weather station near Mt Gibson) between 2007 and 2014 (Bureau of Meteorology 2014).
4.3 Limitations
Other than the numerical models used, attempts were made to analyse the data with two additional models other than the ones described in this report (GEE for ordinal categorical data: Parsons et al. 2006); however, the structure of the data set prevented the analyses being completed.
Missing data can lead to unbalanced data sets which present problems in meeting pure assumptions of statistical methods. This problem can be resolved, to some extent, either by 1) balancing the data sets for complete records (by subsetting), or 2) interpolating or imputing the missing data. In this case, imputation was not chosen. Sites with missing data were dealt with by subsetting datasets to only those sites monitored in all sample periods. This does not detract from the certainty of conclusion based on the test model used, although the statistical power of such a test is reduced. By examination of raw data, it can be seen that data from sites not included in the analyses such as those of Mt. Gibson South provide continued support for accepting the null hypothesis (ie. no impact with proximity to the mine pit). This is because sites closest to the mine pit have exhibited less of a decline in health than plants further from the pit. Therefore, limiting the data set to a selection of sites does not alter final conclusions, as the putative test sites (nearest the pit) were no different in health or survivorship than that of others.
Continuation of routine monitoring with time (in accordance with MS 753) will enable future re-assessment to confirm the current test of hypothesis and conclusions.
0
20
40
60
80
100
120
140
160
Jan
Mar
May Ju
l
Sep
Nov
Jan
Mar
May Ju
l
Sep
Nov
Jan
Mar
May Ju
l
Sep
Nov
Jan
Mar
May Ju
l
Sep
Nov
Jan
Mar
May Ju
l
Sep
Nov
Jan
Mar
May Ju
l
Sep
Nov
Jan
Mar
May Ju
l
Sep
Nov
Jan
Mar
May Ju
l
Sep
Nov
2007 2008 2009 2010 2011 2012 2013 2014
rain
fall (
mm
)Paynes Find monthly total rainfall (mm)
long-term mean monthly total rainfall (mm)
Mount Gibson Mining Ltd Survivorship and Health of Darwinia masonii, February 2016
Page | 16
5 Conclusions
There was no evidence that health condition or survivorship of D. masonii was impacted by mining activity; as indicated by (lack of) change relative to proximity to the mine pit. To meet the assumptions of the statistical methods, a subset of sites was analysed thoroughly across the full period of monitoring; examination of the data for plants throughout the region also supports the conclusion. Based on trends alone, plants furthest from the mine pit have actually exhibited the most detectable decline in average condition through time.
Mount Gibson Mining Ltd Survivorship and Health of Darwinia masonii, February 2016
Page | 17
6 References
Agresti, A 1990, Categorical Data Analysis, Wiley and Sons, New York.
Agresti, A 2010, Analysis of Ordinal Categorical Data, 2nd Ed., Wiley and Sons, New York.
Anderson, M J, Gorley, R N and Clarke, K R 2008, PERMANOVA+ for PRIMER: Guide to Software and Statistical Methods, PRIMER-E LTD, Plymouth, UK.
Bureau of Meteorology 2014, Daily rainfall data, viewed 19 September 2014, http://www.bom.gov.au/jsp/ncc/cdio/weatherData/av?p_nccObsCode=136&p_display_type=dailyDataFile&p_startYear=2014&p_c=-10315756&p_stn_num=007139.
Department of Environment and Conservation 2008, Mason’s Darwinia (Darwinia masonii) Interim Recovery Plan 2008-2012, Interim Recovery Plan No. 282, Department of Environment and Conservation, Western Australia.
Diggle, P J, Liang, K Y, and Zeger, SL 1994, Analysis of Longitudinal Data, Oxford University Press, New York.
Ecologia Environment 2014, ‘Darwinia masonii survival and health analysis’, unpublished report prepared for Mount Gibson Mining Limited.
Faraway, J J 2006, Extending the Linear Model with R: Generalized Linear, Mixed Effects and Nonparametric Regression Models, Chapman & Hall/CRC, Boca Raton.
Globe Environments, 2014. ‘Iron Hill Deposit: Assessment of the Threatened Taxa Category for Darwinia masonii using IUCN (2012) Criteria’, report prepared for Mount Gibson Mining Limited.
Liang, K Y and Zeger, S 1986, ‘Longitudinal data analysis using generalized linear models’, Biometrika, vol. 73, pp. 13-22.
Mount Gibson Mining Limited and Extension Hill Pty Ltd 2014, Mason’s Darwinia (Darwinia masonii) Recovery Plan. Unpublished report by Mount Gibson Mining Limited and Extension Hill Pty Ltd, Western Australia.
Parsons, NR, Edmondson, RN and Gilmour, SG 2006, ‘A generalized estimating equation method for fitting autocorrelated ordinal score data with an application in horticultural research’, Applied Statistics, vol. 55, pp. 507-524.
State of Western Australia 2007, Ministerial Statement No. 753: Statement that a proposal may be implemented (pursuant to the provisions of the Environmental Protection Act 1986) Mt Gibson Iron Ore Mine & Infrastructure Project Shire of Yalgoo. Office of the Appeals Convenor, Perth, Western Australia.
Mount Gibson Mining Ltd Survivorship and Health of Darwinia masonii, February 2016
Appendix A: Darwinia masonii Survival and Health Analysis (Ecologia 2014)
Mount Gibson Mining Ltd Survivorship and Health of Darwinia masonii, February 2016
This page has been left blank intentionally.
LEVEL 10, 207 MURRAY ST PERTH WA 6000 • PH: 6180 4450 • FAX: 6180 4451 • ACN 088 821 425 • ABN 63 088 821 425 www.ecologia.com.au
MOUNT GIBSON MINING LIMITED
Darwinia masonii Survival and Health Analysis
26 June 2014
LEVEL 10, 207 MURRAY ST PERTH WA 6000 • PH: 6180 4450 • FAX: 6180 4451 • ACN 088 821 425 • ABN 63 088 821 425 www.ecologia.com.au
2
Project Background
Mount Gibson Mining Limited (MGX) operates the Extension Hill hematite project in the Mt Gibson Ranges, approximately 260 km south‐east of Geraldton, Western Australia. The development of the Extension Hill project is subject to the conditions of Ministerial Statement 753, including the implementation of the Darwinia masonii Research Plan and the Interim Recovery Plan for Darwinia masonii. Ongoing monitoring of the Darwinia masonii population is required under these plans.
Four rounds of plant monitoring have occurred since development and mining commenced in June 2010.
Darwinia masonii Data
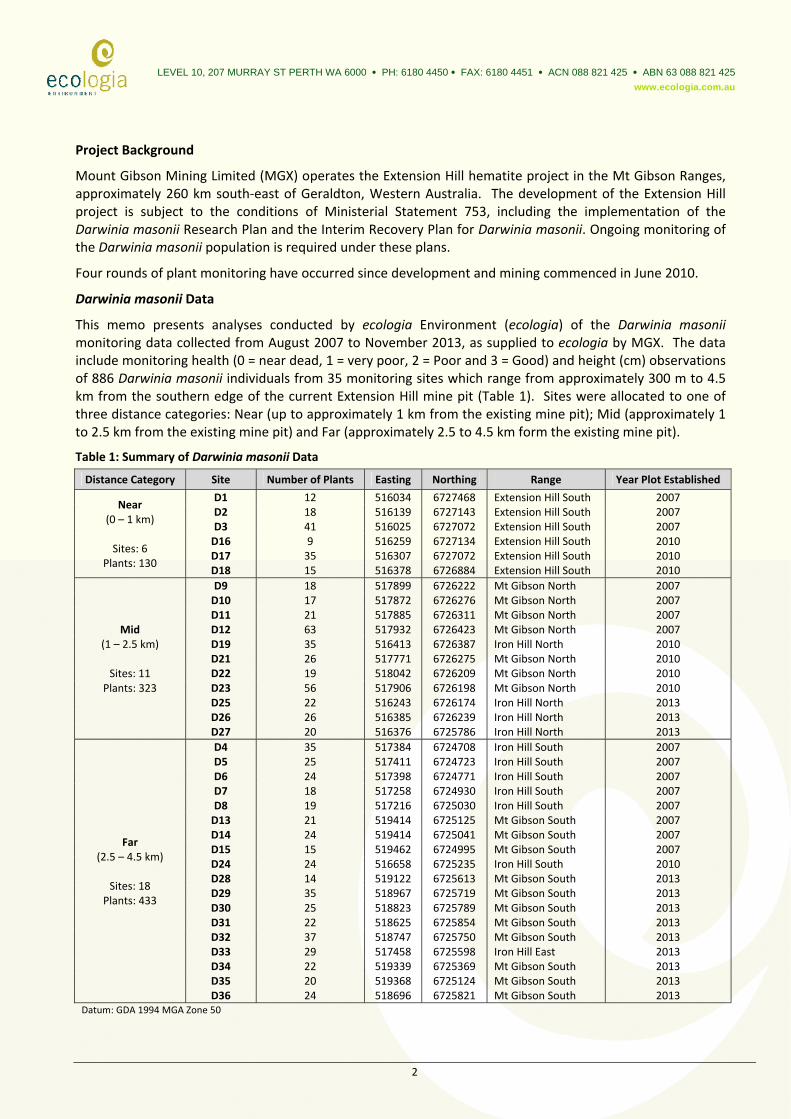
This memo presents analyses conducted by ecologia Environment (ecologia) of the Darwinia masonii monitoring data collected from August 2007 to November 2013, as supplied to ecologia by MGX. The data include monitoring health (0 = near dead, 1 = very poor, 2 = Poor and 3 = Good) and height (cm) observations of 886 Darwinia masonii individuals from 35 monitoring sites which range from approximately 300 m to 4.5 km from the southern edge of the current Extension Hill mine pit (Table 1). Sites were allocated to one of three distance categories: Near (up to approximately 1 km from the existing mine pit); Mid (approximately 1 to 2.5 km from the existing mine pit) and Far (approximately 2.5 to 4.5 km form the existing mine pit).
Table 1: Summary of Darwinia masonii Data
Distance Category Site Number of Plants Easting Northing Range Year Plot Established
Near (0 – 1 km)
Sites: 6
Plants: 130
D1 12 516034 6727468 Extension Hill South 2007 D2 18 516139 6727143 Extension Hill South 2007 D3 41 516025 6727072 Extension Hill South 2007 D16 9 516259 6727134 Extension Hill South 2010 D17 35 516307 6727072 Extension Hill South 2010 D18 15 516378 6726884 Extension Hill South 2010
Mid (1 – 2.5 km)
Sites: 11
Plants: 323
D9 18 517899 6726222 Mt Gibson North 2007 D10 17 517872 6726276 Mt Gibson North 2007 D11 21 517885 6726311 Mt Gibson North 2007 D12 63 517932 6726423 Mt Gibson North 2007 D19 35 516413 6726387 Iron Hill North 2010 D21 26 517771 6726275 Mt Gibson North 2010 D22 19 518042 6726209 Mt Gibson North 2010 D23 56 517906 6726198 Mt Gibson North 2010 D25 22 516243 6726174 Iron Hill North 2013 D26 26 516385 6726239 Iron Hill North 2013 D27 20 516376 6725786 Iron Hill North 2013
Far (2.5 – 4.5 km)
Sites: 18
Plants: 433
D4 35 517384 6724708 Iron Hill South 2007 D5 25 517411 6724723 Iron Hill South 2007 D6 24 517398 6724771 Iron Hill South 2007 D7 18 517258 6724930 Iron Hill South 2007 D8 19 517216 6725030 Iron Hill South 2007 D13 21 519414 6725125 Mt Gibson South 2007 D14 24 519414 6725041 Mt Gibson South 2007 D15 15 519462 6724995 Mt Gibson South 2007 D24 24 516658 6725235 Iron Hill South 2010 D28 14 519122 6725613 Mt Gibson South 2013 D29 35 518967 6725719 Mt Gibson South 2013 D30 25 518823 6725789 Mt Gibson South 2013 D31 22 518625 6725854 Mt Gibson South 2013 D32 37 518747 6725750 Mt Gibson South 2013 D33 29 517458 6725598 Iron Hill East 2013 D34 22 519339 6725369 Mt Gibson South 2013 D35 20 519368 6725124 Mt Gibson South 2013 D36 24 518696 6725821 Mt Gibson South 2013
Datum: GDA 1994 MGA Zone 50
LEVEL 10, 207 MURRAY ST PERTH WA 6000 • PH: 6180 4450 • FAX: 6180 4451 • ACN 088 821 425 • ABN 63 088 821 425 www.ecologia.com.au
3
Not all Darwinia masonii plants have been monitored from the beginning of the monitoring program. Of the 130 plants monitored at Near sites, 65 have been monitored since 2007, 59 since 2010 and an additional 6 plants (including 2 seedlings) were introduced into the monitoring program in 2013. Of the 323 plants monitored at the Mid sites, 103 have been monitored since 2007, 116 since 2010 and a further 31 (including 6 seedlings) introduced in 2013. Of the 433 plants at Far sites, 162 have been monitored since 2007, 23 since 2010 and an additional 248 plants (including 40 seedlings) introduced to the monitoring program in 2013.
The putative hypothesis being tested is that the health and survival of Darwinia masonii is related to distance from mine; that plants in close proximity to the mine (Near sites) are expected to have poorer health and survival than those from those sites further away (Mid and Far sites). For statistical purposes, the null hypothesis was tested; that there is no difference in plant health scores or survival with distance from mine category.
Darwinia masonii Survival Analysis
Survival analysis is concerned with the time to occurrence of a particular event (usually death). Survival analyses are often complicated by censored observations (where the event of interest was not observed, either because the individual was lost from the study, or the study ended before the event occurred).
The survival analysis compares the survivorship probability among the three distance categories for the duration of the monitoring program. The survival analysis incorporates right‐censored data (for plants still alive at the November 2013 monitoring event) and interval‐censored data (because date of death is not known exactly, only lower (left) and upper (right) possible survivorship duration) using Turnbull’s Kaplan‐Meier Estimation, with Systat12 statistical package. Given that the age of plants is not known at the commencement of the monitoring program, all plants are assumed to have begun life at the commencement of monitoring.
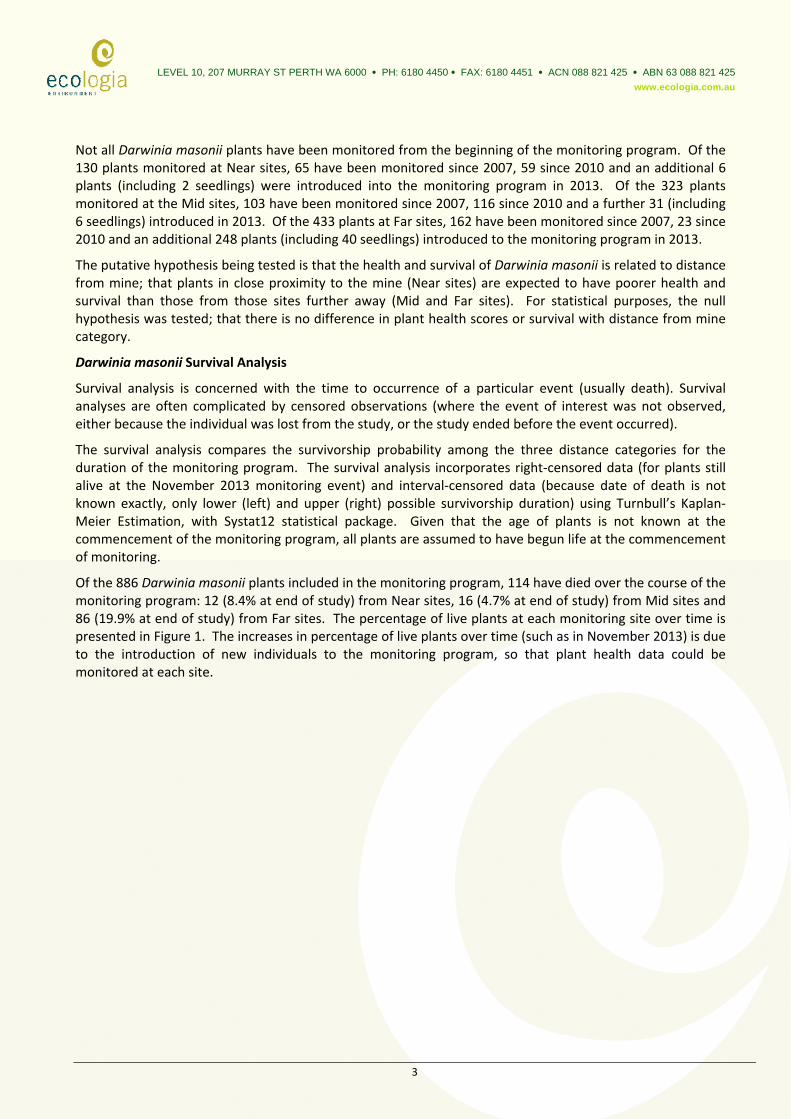
Of the 886 Darwinia masonii plants included in the monitoring program, 114 have died over the course of the monitoring program: 12 (8.4% at end of study) from Near sites, 16 (4.7% at end of study) from Mid sites and 86 (19.9% at end of study) from Far sites. The percentage of live plants at each monitoring site over time is presented in Figure 1. The increases in percentage of live plants over time (such as in November 2013) is due to the introduction of new individuals to the monitoring program, so that plant health data could be monitored at each site.
LEVEL 10, 207 MURRAY ST PERTH WA 6000 • PH: 6180 4450 • FAX: 6180 4451 • ACN 088 821 425 • ABN 63 088 821 425 www.ecologia.com.au
4
Figure 1: Darwinia masonii live plants (%) over time for Near (red), Mid (blue) and Far (green) sites (dots) and mean for distance category (lines). The sites closest to the pit (D1, D2 & D3) are highlighted yellow.
The Turnbull Kaplan‐Meier probability of survival for Darwinia masonii plants for the duration of the monitoring program (up to 2320 days) is 0.24 plants at Near sites, 0.45 for plants at Mid sites and 0.22 for plants at Far sites.
Darwinia masonii Health Analysis
The plant health analysis compares the health scores of individuals amongst the three distance form mine pit categories. Changes in plant health scores during the Darwinia masonii monitoring program are presented in Figure 2.
Ground Disturbance June 2010
LEVEL 10, 207 MURRAY ST PERTH WA 6000 • PH: 6180 4450 • FAX: 6180 4451 • ACN 088 821 425 • ABN 63 088 821 425 www.ecologia.com.au
5
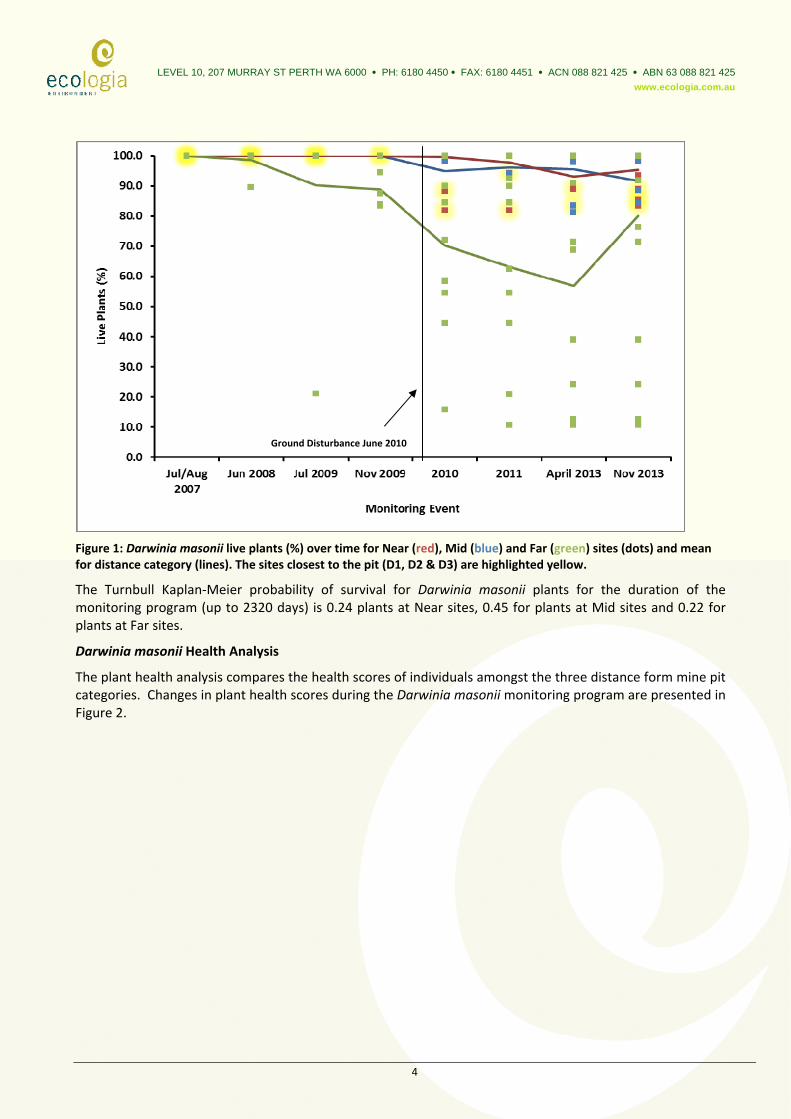
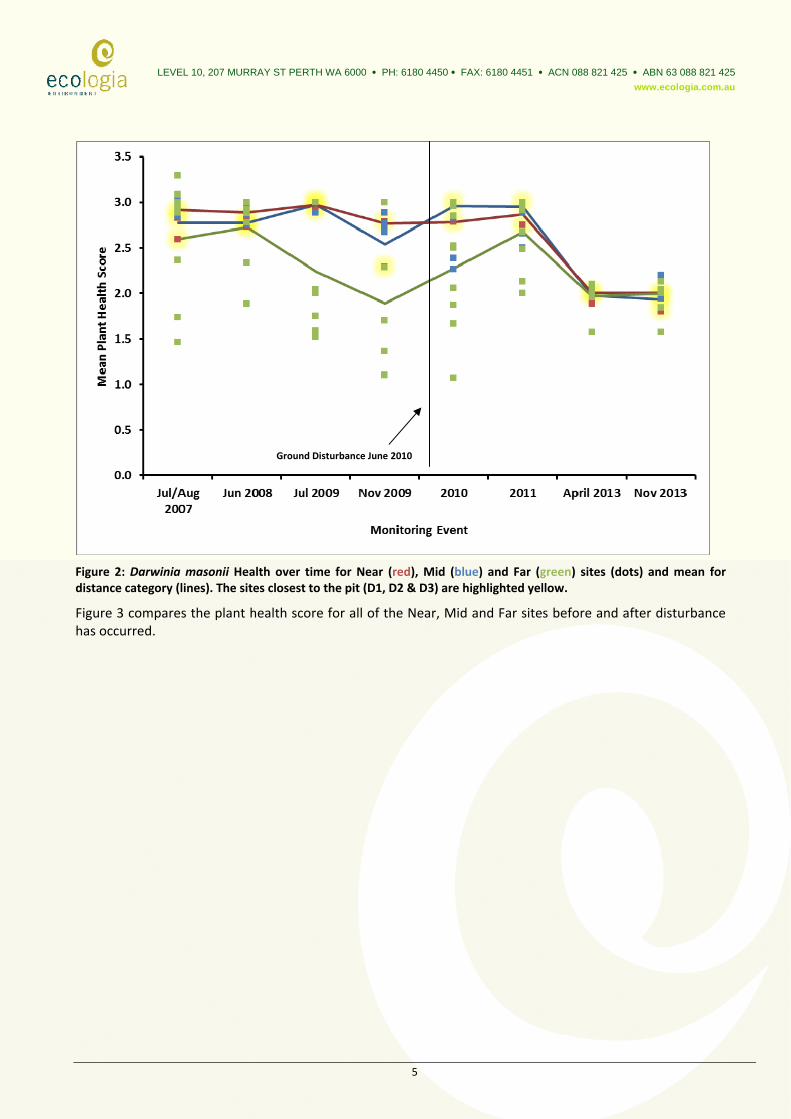
Figure 2: Darwinia masonii Health over time for Near (red), Mid (blue) and Far (green) sites (dots) and mean for distance category (lines). The sites closest to the pit (D1, D2 & D3) are highlighted yellow.
Figure 3 compares the plant health score for all of the Near, Mid and Far sites before and after disturbance has occurred.
Ground Disturbance June 2010
LEVEL 10, 207 MURRAY ST PERTH WA 6000 • PH: 6180 4450 • FAX: 6180 4451 • ACN 088 821 425 • ABN 63 088 821 425 www.ecologia.com.au
6
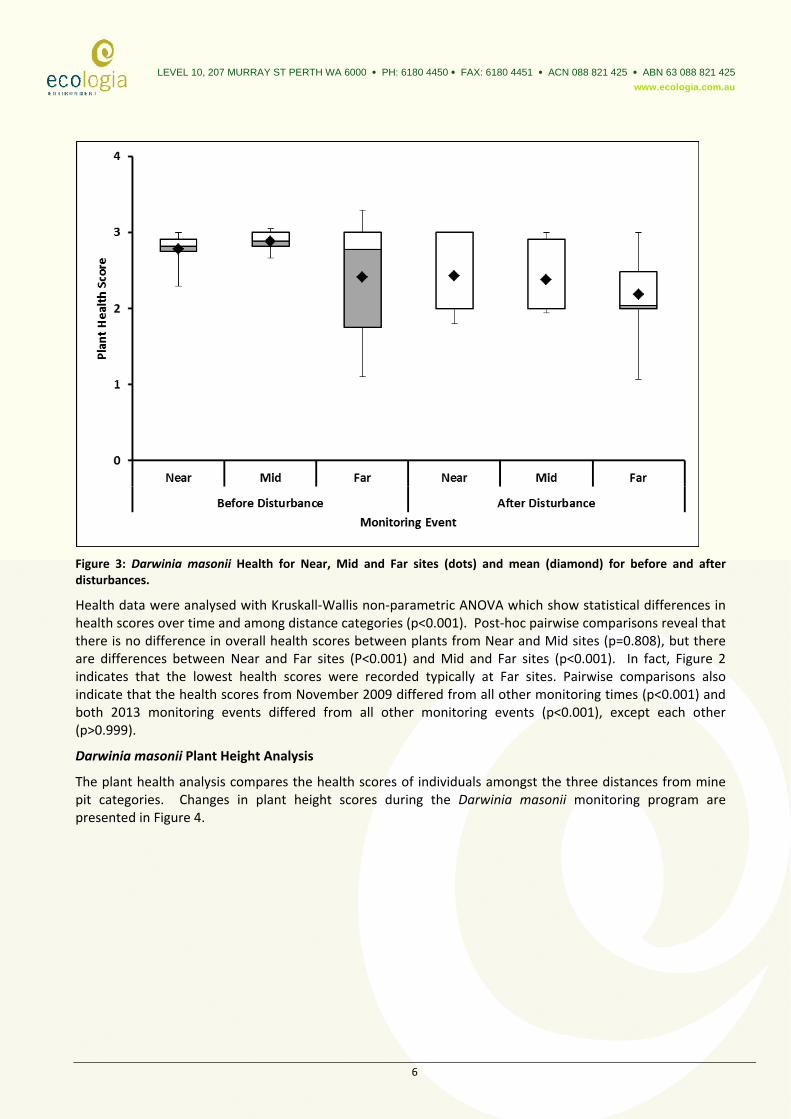
Figure 3: Darwinia masonii Health for Near, Mid and Far sites (dots) and mean (diamond) for before and after disturbances.
Health data were analysed with Kruskall‐Wallis non‐parametric ANOVA which show statistical differences in health scores over time and among distance categories (p<0.001). Post‐hoc pairwise comparisons reveal that there is no difference in overall health scores between plants from Near and Mid sites (p=0.808), but there are differences between Near and Far sites (P<0.001) and Mid and Far sites (p<0.001). In fact, Figure 2 indicates that the lowest health scores were recorded typically at Far sites. Pairwise comparisons also indicate that the health scores from November 2009 differed from all other monitoring times (p<0.001) and both 2013 monitoring events differed from all other monitoring events (p<0.001), except each other (p>0.999).
Darwinia masonii Plant Height Analysis
The plant health analysis compares the health scores of individuals amongst the three distances from mine pit categories. Changes in plant height scores during the Darwinia masonii monitoring program are presented in Figure 4.
LEVEL 10, 207 MURRAY ST PERTH WA 6000 • PH: 6180 4450 • FAX: 6180 4451 • ACN 088 821 425 • ABN 63 088 821 425 www.ecologia.com.au
7
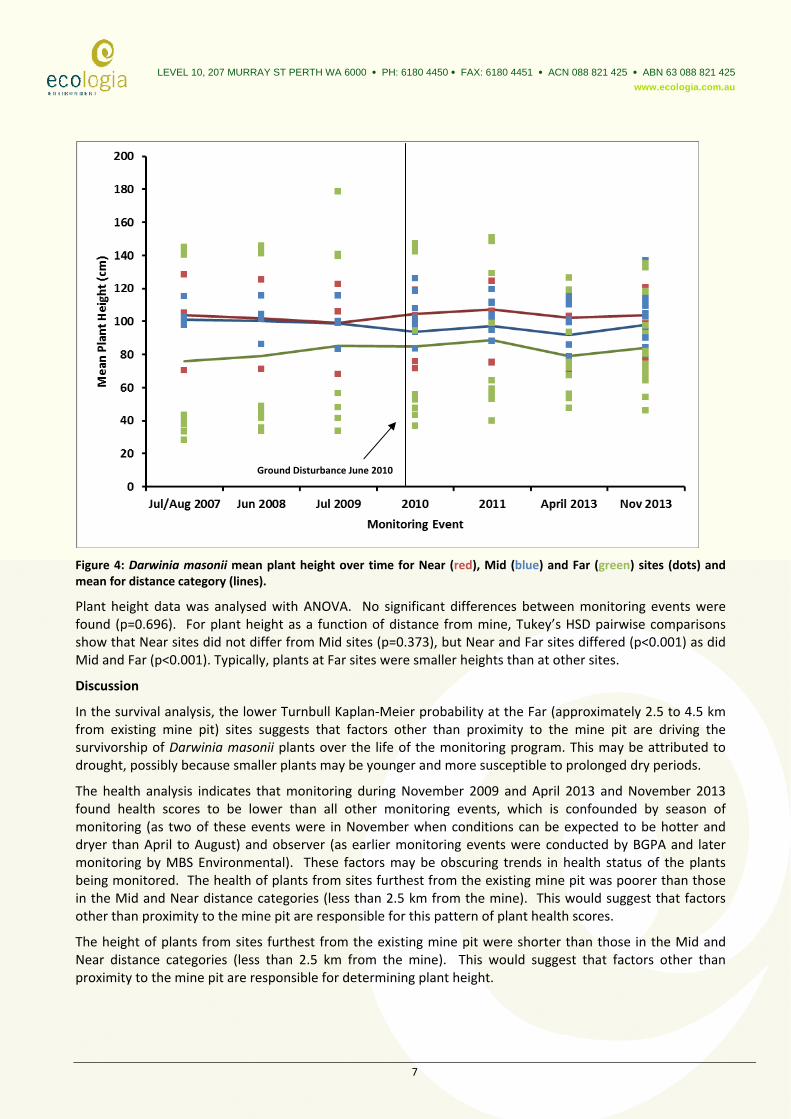
Figure 4: Darwinia masonii mean plant height over time for Near (red), Mid (blue) and Far (green) sites (dots) and mean for distance category (lines).
Plant height data was analysed with ANOVA. No significant differences between monitoring events were found (p=0.696). For plant height as a function of distance from mine, Tukey’s HSD pairwise comparisons show that Near sites did not differ from Mid sites (p=0.373), but Near and Far sites differed (p<0.001) as did Mid and Far (p<0.001). Typically, plants at Far sites were smaller heights than at other sites.
Discussion
In the survival analysis, the lower Turnbull Kaplan‐Meier probability at the Far (approximately 2.5 to 4.5 km from existing mine pit) sites suggests that factors other than proximity to the mine pit are driving the survivorship of Darwinia masonii plants over the life of the monitoring program. This may be attributed to drought, possibly because smaller plants may be younger and more susceptible to prolonged dry periods.
The health analysis indicates that monitoring during November 2009 and April 2013 and November 2013 found health scores to be lower than all other monitoring events, which is confounded by season of monitoring (as two of these events were in November when conditions can be expected to be hotter and dryer than April to August) and observer (as earlier monitoring events were conducted by BGPA and later monitoring by MBS Environmental). These factors may be obscuring trends in health status of the plants being monitored. The health of plants from sites furthest from the existing mine pit was poorer than those in the Mid and Near distance categories (less than 2.5 km from the mine). This would suggest that factors other than proximity to the mine pit are responsible for this pattern of plant health scores.
The height of plants from sites furthest from the existing mine pit were shorter than those in the Mid and Near distance categories (less than 2.5 km from the mine). This would suggest that factors other than proximity to the mine pit are responsible for determining plant height.
Ground Disturbance June 2010
LEVEL 10, 207 MURRAY ST PERTH WA 6000 • PH: 6180 4450 • FAX: 6180 4451 • ACN 088 821 425 • ABN 63 088 821 425 www.ecologia.com.au
8
Conclusions
Overall, the patterns and statistical analysis of Darwinia masonii survivorship, plant health and height as measured in the ongoing monitoring program do not show that proximity to the existing mine pit has had a detectable statistically significant effect on the Darwinia masonii population over the timescale of the monitoring program. The putative hypothesis that plants closer to the mine are in poorer health and have reduced survivorship is not supported by the data collected to date, and the distance from mine categories used in these analyses.
Darwina masonii individuals furthest from the mine appear to be in poorer health, less likely to survive and are shorter than those closer to the mine, although this difference could not be attributed to any identified factors in this analysis. Additional data on fire history, plant age, rainfall, slope, position and substrate may provide insight into the differences identified through these analyses.
Annual monitoring of individual plant health is due to continue over the life of the mine in accordance with Ministerial Statement 753.