Embed Size (px)
Citation preview
Survey Techniques
M. Shahjahan Mondal, ProfessorM. Shahjahan Mondal, Professor
Prepared forWFM 6209: Interdisciplinary Field
Research Methodology in Water Management

Questionnaire Survey
• Aim: To introduce the basic concepts of questionnaire survey for collection
of field data
ILOs: Upon attending this session, the students will be ableILOs: Upon attending this session, the students will be ableto
Design a questionnaire given a set of research questions Administer the questionnaire among the chosen sample elements

Questionnaire
• In field research, the researcher collects information byobserving the social phenomena directly and as completely aspossible.
• But in case where the population is too large to observedirectly, the survey research is probably the best option forcollecting primary data.collecting primary data.
• It is one of the most powerful and frequently used methods insocial sciences
• A set of questions are used• The method is suitable for obtaining information for explaining social
phenomena and exploratory research• A method is different from a tool. While a method refers to the way or
mode of gathering data, a tool is an instrument used for the method. Forexample, a schedule is used for interviewing.

Questionnaire may contain a mixture of questions or statements (some items better served if statements, and some if questions)

Questionnaire Survey Types of questionnaires Types of questions Construction of questionnaire Administration of questionnaire Administration of questionnaire

Structured questionnaire
• Identical questions for everyone in terms of wording, and sequence• Validity of results
Unstructured questionnaireUnstructured questionnaire
• Not the same set of questions (wording and sequence) for everybody• Heterogeneous respondents • Education, vocabularies, level of comprehension

Closed-ended and Open-ended questions Little room for respondents tovolunteer additional information
Answers are exhaustive and mutually exclusive
Respondents have freedom to provide their answers
What do you think of the performance of the water users' association?
Advantages??Advantages??Disadvantages??
If nature, range, and diversity of responses are known – closed ended; otherwise open-ended MAY BE appropriate.
Factual, opinion, motivation and knowledge questions

Construction of questionnaire"No survey can be better than its questionnaire"Step-1: decide variables directly related to the hypothesis (or research questions) (plus other variables, e.g. background variables)
Step-2: frame questions to obtain information on variablesvariables
Cover letter (in case of self-administered questionnaire)
Introductory statements (in case of interview)
Confidentiality of the responses
Instructions on how to fill in

Characteristics of a good questionnaire
• Accurate communication
• Accurate response
• Attractive form and style
• Direct, simple and unambiguous questions• Direct, simple and unambiguous questions
• The questions should not be so intimate
• The questions must be directly related to the specialized problem being explored
• The responses should be such as are classifiable and amenable to statistical treatment
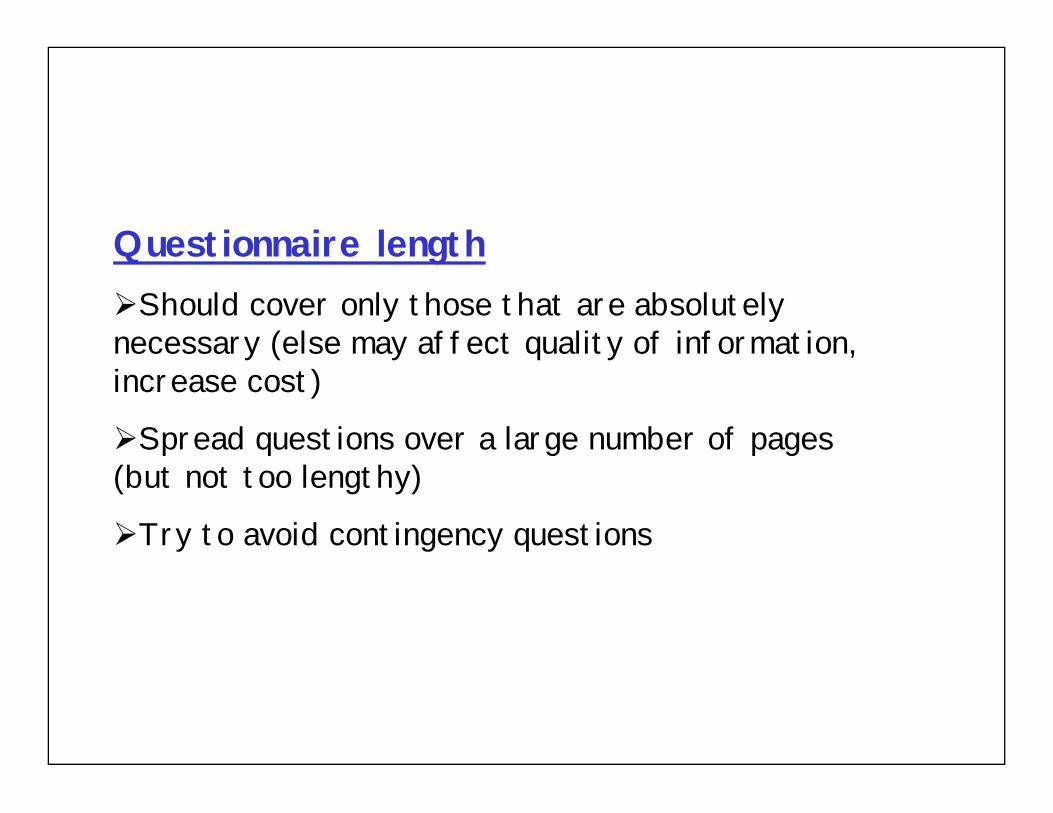
Questionnaire lengthShould cover only those that are absolutely necessary (else may affect quality of information, increase cost)
Spread questions over a large number of pages (but not too lengthy)
Try to avoid contingency questions

Question content As practicable (understandable) as possible
Make respondents feel that questions are relevant to themrelevant to them
Avoid questions involving an event that occurred long, long ago. (Global warming)

Question Wording As simple language as possible (may be ‘technical’ in nature for certain professional groups)
Make questions as specific as possibleHow much money did you spend for irrigation in the last three months?last three months?
How much money do you generally spend for irrigation?
Make questions unambiguous (specify frame of reference)
What irrigation method do you use?What irrigation method do you use?LLP STW DSSTW DTW
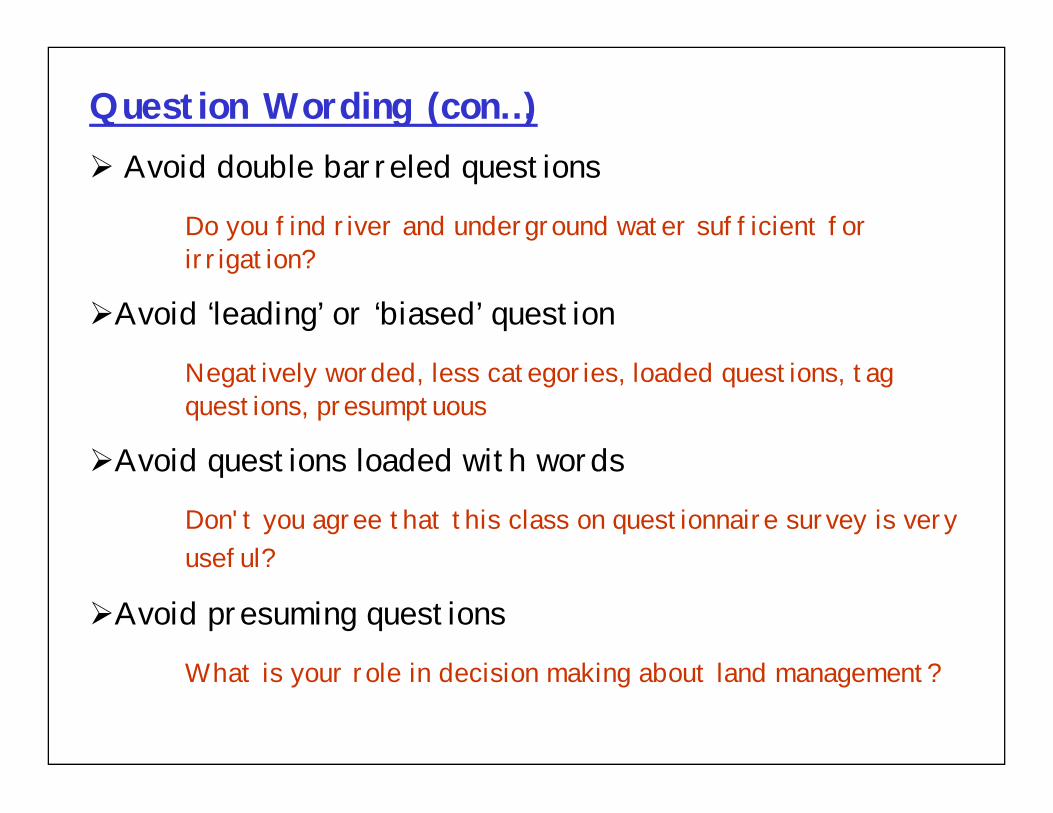
Question Wording (con…) Avoid double barreled questions
Do you find river and underground water sufficient for irrigation?
Avoid ‘leading’ or ‘biased’ question
Negatively worded, less categories, loaded questions, tag questions, presumptuousquestions, presumptuous
Avoid questions loaded with words
Don't you agree that this class on questionnaire survey is very useful?
Avoid presuming questions
What is your role in decision making about land management?

Question Wording (con…) Avoid vague words
Do you use bottled water regularly or occasionally?
kind of, fairly, generally, often, many, much the same, on the whole, etc. are vague words.
Vagueness occurs with 'why' questions
Be careful about asking private and embarrassing Be careful about asking private and embarrassing questions
How much fertilizer did you use for cultivation of rice in the last season?What varieties of rice did you cultivate in the last season? What crops are sensitive to climate change?

Question ordering Easy to answer, interesting questions in the beginning; sensitive, ego-threatening, and dull questions at the end
Make the respondents feel that the whole process is a meaningful exercise
General questions about the subject matter, then narrowing down to specific issues; each successive question is related to the previous question but in a more specific way.

• Questions should be– Short
– Clear– Clear
– Easy to understand
– Answerable without difficulties

Pretesting Questions are meaningful and responsive
Ambiguous and irrelevant questions are identified
Questionnaire format is suitable
Respondents had understood the contexts
Respondents' eagerness to participate in the survey Respondents' eagerness to participate in the survey
Interview time and attention of respondents (30 min)Pre-tested with 25 local people in 5 administrative units Sometimes, a part of the survey (e.g. pilot survey)

Administration of Questionnaire- Self-administration
- mailed, emailed or delivered in person-Interview
-Telephone- Face-to-face
- Questionnaire and interview schedule- Who asks and fills in- Who asks and fills in

Interviewing
• Start with standard initial greetings and explain the purpose of survey
• Next ask warm-up and general questions• Next ask warm-up and general questions

Data Analysis
• Aim: To explain the different techniques used for data analyses so that the
participants can use the knowledge in analyzing their research data
• ILOs: Upon attending this session, the participants will beable toable to Select and carry out appropriate analyses for a given set of data

Data Analysis
• Scale of measurement• Frequency distribution, cumulative frequency distribution, proportion,
percentage• Central tendency
– Mean– Median– Median
• Dispersion– Std deviation– CV
• Joint frequency table• Correlation & Regression• ANOVA• Logistic regression• Multivariate analysis

Scale of measurement
• Nominal
• Ordinal
• Interval
Scale Analysis
Nominal Correlation
Ordinal Correlation
Interval Regression• Interval
• Ratio
A higher order variable can always be used as a lower order variable. Information is lost.
Interval Regression
Nominal dichotomous Y
Logistic regression
Nominal XInterval Y
ANOVA

Age Groups Frequency Cumulative Frequency
0-4 5 55-9 8 13
10-14 7 2015-19 5 2520-24 10 3520-24 10 3525-29 15 5030-34 10 6035-39 10 7040-44 15 8545-49 10 9550+ 5 100Total 100

Place of Residence Total
Urban Rural
Distribution of 1000 residents byreligiosity & place of residence
Religiosity
High150
(25%)250
(63%)400
Low450
(75%)150
(37%)600
Total600
(100%)400
(100%)1000

Place of Residence Total
Urban Rural
Distribution of 1000 residents byreligiosity & place of residence
Religiosity
High150
(240)250
(160)400
Low450
(360)150
(240)600
Total 600 400 1000

Social Status Total
Urban Suburban Rural
Distribution of 1000 residents byreligiosity & social status
Urban Suburban Rural
Religiosity
High 150 100 50 300
Medium 50 200 50 300
Low 50 50 300 400
Total 250 350 400 1000

Average daily weight gain (kg/day)Land 1 Land 2 Land 3 Land 4 Land 5
0.412 1.059 1.147 0.735 0.618
0.471 0.941 1.000 0.529 0
1.088 0.382 1.000 0.265 0.8241.088 0.382 1.000 0.265 0.824
0.559 0.941 0.676 0.118 0.471
0.676 0.676 0.882 0.676 0.647
0.618 0.471 0.647 0.618 0.735
1.000 0.382 1.059 0.206 0.618
0.689 0.693 0.916 0.450 0.559

• We would like to know whether the differences in the means are caused by real treatment effects or whether they are a result of natural variability.
.853 4 .213 3.319Between Groups
Sum of
Squares df Mean Square F
• Compare this F with F α (m, n)
• m is numerator & n is denominator d.o.f.; α is CI
• In this case, m=4; n=30
• Table; F 0.95 (4, 30)=2.69; Reject H0
.853 4 .213 3.319
1.928 30 .064
2.781 34
Between Groups
Within Groups
Total

WTP to restoration of wetland with distance
Statistics Region 1 Region 2 Region 3
Mean 14.9 8.5 11.8
Std Dev 17.3 5.2 8.2
Source of variation
SS df MS F
Between groups
1174 2 587 2.4
Within groups
48652 201 242
Total 49826 203

Multiple regression
Variable Standardized coefficient
Significance
Income from winter rice
0.490 0.001
Non-crop income 0.317 0.016Non-crop income 0.317 0.016
Homestead income
0.261 0.050
Debt of household -0.105 0.358
Household size -0.218 0.075

Example
• Total economic value of wetland
• WTP – yes or no? How much?
• Determinants of WTP – Logistic regression• Determinants of WTP – Logistic regression
• Sex, use status, education and distance are the determinants
• The beauty of the survey method lies in the types of analysis that can be carried out with its data!!!
• People's confidence!!!

Example: WTP
Independent variable
Coeff Std errWald
StatisticOdds ratio
Sex 2.02 0.54 13.8 ** 7.5
Education 0.58 0.21 7.3 ** 1.8Education 0.58 0.21 7.3 ** 1.8
Distance -0.91 0.29 9.5 ** 0.4
User 1.35 0.42 10.2 ** 3.8
Tables and graphs convey summary results quickly!!!

AssignmentQuestionnaire Survey
Encroachment on the Buriganga RiverEncroachment on the Floodplain near DhakaPollution of the BurigangaSanitation in a slum areaSanitation in a slum areaDrinking water in slum/old city/densely populated areaStorm water flooding


![[XLS]shed.portal.gov.bdshed.portal.gov.bd/sites/default/files/files/shed.portal... · Web view14/26, SHAHJAHAN ROAD, TOWN HALL 01712942223 RAYGANJ 01558039908 01758009977 01714444772](https://img.pdfslide.us/doc/110x75/5ae709337f8b9a9e5d8e8a02/xlsshed-view1426-shahjahan-road-town-hall-01712942223-rayganj-01558039908.jpg)