Embed Size (px)
Citation preview
Survey Response Rates in FamilyBusiness Research
DAVID I. PIELSTICKER1 and MARTIN R.W. HIEBL
1,2
1Chair of Management Accounting and Control, University of Siegen, Germany2Institute of Management Control and Consulting, Johannes Kepler University Linz, Austria
Although family business survey research is growing in volume and publication in highly regarded managementjournals, we do not yet have evidence on the usual response rates in this research and on the factors that impact theseresponse rates. This paper addresses these voids and finds that the average response rates of family business surveystudies published in seven prominent outlets amount to 21%. We also find that the response rates have declinedsignificantly over time and that the size of the survey population and the establishment of contacts with surveyaddressees before sending out questionnaires are significantly associated with response rates. Such precontactsand reminders seem less fruitful for family respondents than for non-family respondents.
Keywords: family business; family firm; survey; response rate
Introduction
Various reviews show that surveys are the most frequentlyapplied data-gathering method in empirical familybusiness studies (e.g., Bird et al., 2002; Benavides-Velasco et al., 2013; Evert et al., 2016). At the same time,surveys addressing family firms may feature somespecific challenges. For instance,Wilson et al. (2014) notethat family members are typically reluctant to givedetailed information about their firms. In addition, familybusiness surveys are often intended for family members,such as owner-managers, as they are usually expected tobe most knowledgeable about both business and familydynamics (Wilson et al., 2014). However, from priorresearch, we know that surveying top executives such asowner-managers usually leads to lower response ratescompared to surveying actors situated at lower levels ofcorporate hierarchies (e.g., Cycyota and Harrison, 2006;Anseel et al., 2010; Hiebl and Richter, 2018). As aconsequence of these specifics of family business surveys,Stamm and Lubinski (2011) assert that response rates areusually low in family business survey research. Lowresponse rates can make it more difficult for a paper tobe published in highly regarded business andmanagementjournals because they may indicate threats to the validity
and reliability of the findings extracted from the surveys.For instance, low response rates may indicate a coveragebias that occurs when important segments of the surveypopulation are not adequately represented in the analyzedsample (Speklé and Widener, 2018). Another problem isnon-response bias, which may be linked to low responserates when there are significant differences between thefew members of the survey population who haveanswered the questionnaire and the more numerousmembers of the population who have not (Baruch andHoltom, 2008). These potential problems can help explainwhy response rates are an important criterion forevaluating the rigor of survey studies for many journaleditors (Carley-Baxter et al., 2009). In addition to thesegeneral problems associated with low response rates,highly regarded business and management journals maybe accustomed to much higher response rates in studiesthat do not focus on family firms. That is, survey studiespublished in highly ranked management journals typicallyfeature response rates between 40% and 60% (Baruch,1999; Baruch and Holtom, 2008; Anseel et al., 2010;Mellahi and Harris, 2016). To the best of our knowledge,there is currently no data about such average responserates for family business survey studies.
In addition, the factors that impact the response rates infamily business survey research are not known, but maybe different for surveys of family firms. As indicatedabove, such family business surveys are often targetedtowards owner-managers. These owner-managers or
Correspondence: Martin R.W. Hiebl, Chair of Management Accountingand Control, University of Siegen, Germany. E-mail [email protected]
DOI: 10.1111/emre.12375
© 2019 The AuthorsEuropean Management Review published by John Wiley & Sons Ltd on behalf of European Academy of Management(EURAM)This is an open access article under the terms of the Creative Commons Attribution-NonCommercial-NoDerivs License,which permits use and distribution in anymedium, provided the originalwork is properly cited, the use is non-commercialand no modifications or adaptations are made.
European Management Review, Vol. 17, – , (2020)327 346
family managers have been found to show idiosyncrasiesin their behavior compared to non-owner managers (e.g.,Armstrong and Hird, 2009; Woods and Joyce, 2016).For instance, Armstrong and Hird (2009) find that ownermanagers differ in their cognitive style from other people.Many response-rate-enhancing techniques, such asreminders or incentives, address phenomena of socialpsychology or social exchange (e.g., Roth and BeVier,1998; Fan and Yan, 2010). That is, such techniquesusually attempt to make use of frequently found cognitivetraits of individuals to increase response rates. Given thatowner-managers and family managers have been foundto show different cognitive styles, we could theorize thattypical response-rate-enhancing techniques may alsowork out differently in family business survey research,which further requires knowledge about how suchtechniques fare in family business survey research.
This paper aims to address these voids. Morespecifically, based on a review of survey studies publishedin journals often featuring family business studies, we aimto (1) identify the average response rates and response ratetrends over time in family business survey research and(2) identify the factors that are associated with highresponse rates.
Our analysis of 126 family business survey studiescontributes to the literature on response rates inmanagement research (e.g., Baruch, 1999; Baruch andHoltom, 2008; Anseel et al., 2010; Mellahi and Harris,2016) in several ways.We add to this literature an analysisof response rate levels and factors associated withresponse rates for the specific and highly economicallyrelevant case of family firms. Our findings show that theaverage response rate in family business research is lowerthan the figures reported for response rates in generalmanagement research. Our study also adds factors thatare significantly associated with response rates in familybusiness research. Among these, our findings reveal afactor that has so far not been considered in prior meta-analytic studies on response rates: whether therespondents belong to the controlling family or not. Thisfamily status of respondents also shows significantinteractions with the response-enhancing techniques ofreminders and incentives. Both types of response-enhancing techniques are associated with higher responserates in studies that did not address only members ofcontrolling families. Thus, our results imply that the effectof reminders and precontacts on response rates seems tobe contingent on the type of survey addressee. That is,our study complements prior meta-analytic work onresponse rates in management research (e.g., Baruch,1999; Baruch and Holtom, 2008; Anseel et al., 2010;Mellahi and Harris, 2016) by adding that respondentswho belong to the firm’s controlling family seem to be aspecifically challenging and idiosyncratic population inregard to reaching high response rates. Consequently,
editors and reviewers from general-management journalsmay need to adapt their expectations on response rateswhen evaluating surveys on family firms – especiallythose targeting family respondents. In turn, familybusiness scholars may benefit from considering ourfindings when designing their next survey studies.Therefore, in general, we hope that these results can givefamily business scholars and reviewers examining familybusiness surveys some guidance in terms of what responserates to typically expect from family business surveystudies. In addition, the factors correlated with highresponse rates may support family business researchersin achieving higher response rates when conducting theirsubsequent survey studies.
The remainder of this paper is structured as follows. Inthe next section, we review the existing literature onresponse rates, extract factors known to influenceresponse rates and develop hypotheses on theirapplication in family business research. Afterwards, wedetail the methods applied to address our above researchobjectives. Afterwards, we present descriptive data onthe response rates in family business survey research overtime and a regression analysis on the factors associatedwith such response rates. In the final section, we discussour results and present implications for future surveyresearch on family firms.
Literature review and hypotheses
Response rates are seen as an important quality criterionof survey studies because higher response rates canstrengthen the confidence in the representativeness andvalidity of data produced by survey studies (Mellahi andHarris, 2016). Conversely, low response rates can causesmaller data samples, decrease statistical power, limit theapplicability of sophisticated statistical procedures(Rogelberg and Stanton, 2007) and raise doubts aboutthe validity of the sample (The American Associationfor Public Opinion Research, 2016). That is, low responserates may represent or at least signal potential biases insurvey research, such as non-response bias (Rogelbergand Luong, 1998).
These reasons may explain why there is continuedinterest in response rates and the factors affecting them.As part of this line of research, prior meta-analyticalstudies have identified various factors that may influenceresponse rates in survey research (e.g., Roth and BeVier,1998; Baruch, 1999; Edwards et al., 2002; Cycyota andHarrison, 2006; Baruch and Holtom, 2008; Anseel et al.,2010; Chidlow et al., 2015; Mellahi and Harris, 2016;Hiebl and Richter, 2018). Guidance on achieving highresponse rates is also offered in several books (e.g.,Dillman et al., 2014) and in publications by professionalassociations (e.g., The American Association for PublicOpinion Research, 2016). All this work has, however,
D.I. Pielsticker and M.R.W. Hiebl
© 2019 The AuthorsEuropean Management Review published by John Wiley & Sons Ltd on behalf of European Academy of Management
(EURAM)
328
not considered the above-noted potential specifics inregard to surveying family firms. Not least, this non-consideration of response rates in family business surveysmay be problematic because family firms represent themajority of firms worldwide (IFERA, 2003), and thus,family firms are likely to be addressed in many surveystargeting profit-oriented organizations. We argue that acloser examination of factors driving response rates infamily business research may therefore be of interest tomany survey researchers who – at least in part – addressfamily firms in their survey studies.
While no studies on response rates in family businesssurvey research have been published to date, there aresome studies on response rates in small firms (Dennis,2003; Newby et al., 2003; Bartholomew and Smith,2006). These studies deliver many interesting insights,some of which are referenced later in this paper. Theydid, however, only draw on insights from isolated surveyprojects. Thus, unlike our meta-analytic study, they werenot based on a large number of prior studies. Furthermore,such studies did not focus specifically on family firms buton small firms. Because small firms show severaldifferences from family firms, the findings of these studiescannot be attributed to family firms (e.g., Carland et al.,1984), which further warrants our present study.
In the pursuit of our above research objectives, we drawon prior methodological work (e.g., Dillman et al., 2014;The American Association for Public Opinion Research,2016) and meta-analytical studies on response rates. Suchresearch has identified various factors that may influenceresponse rates (e.g., Heberlein and Baumgartner, 1978;Fox et al., 1988; Roth and BeVier, 1998; Baruch, 1999;Cook et al., 2000; Edwards et al., 2002; Frohlich, 2002;Cycyota and Harrison, 2006; Baruch and Holtom, 2008;Shih and Fan, 2008; Anseel et al., 2010; Dillman et al.,2014;Chidlow et al., 2015; Mellahi and Harris, 2016;Hiebl and Richter, 2018; ). From this literature, weextracted ten factors that were most commonly analyzedand that were partly found to affect the response rates inthese studies. At the same time, these ten factors have been
shown to be accessible to meta-analytic studies such asours (e.g., Baruch, 1999; Baruch and Holtom, 2008;Chidlow et al., 2015; Mellahi and Harris, 2016). That is,we have focused on factors that can usually be extractedfrom published papers without further details. Whiledetails such as the length of questionnaires could havean effect on response rates (e.g., Yammarino et al.,1991; Edwards et al., 2002; Deutskens et al., 2004), suchdetails are usually not disclosed in published managementresearch studies. In addition, recent evidence shows thatauthors of published surveys are often unable or unwillingto disclose such information, especially in the case ofsurvey studies that have been published decades ago(Hiebl and Richter, 2018), which are also included inour study. Consequently, in this study, we draw primarilyon data available from published family business surveystudies.
Several of the ten factors potentially affecting responserates represent response-enhancing techniques suggestedin the much referenced ‘tailored design method” byDillman et al. (2014), such as establishing contact withsurvey addressees before sending out questionnaires,sending out reminders and offering incentives to surveyrespondents. Below, we develop hypotheses on how thesefactors can be expected to affect response rates in familybusiness survey research. In addition to these ten morewidely applicable factors, we added two factors that areparticularly important in family business survey research(i.e., factors 2.5 and 2.6 in Table 1). We then clusteredthese 12 factors into three groups: (1) survey processcharacteristics; (2) survey population characteristics; and(3) bibliographic characteristics. See Table 1 for anoverview of these factors.
Survey process characteristics
As indicated above, methodological work on responserates such as the book by Dillman et al. (2014) suggeststhat contacting survey respondents before actuallysending out questionnaires can create a buy-in of the
Table 1 Factors potentially affecting the response rate in family business survey research
Groups of factors Factors potentially influencingthe response rate
Hypothesized direct effect on responserates in family business survey research
1. Survey processcharacteristics
1.1 Precontact1.2 Electronic survey techniques1.3 Reminder1.4 Incentives
+–+
None2. Survey populationcharacteristics
2.1 Surveys in North America2.2 Higher hierarchical level2.3 Survey population size2.4 Random sampling2.5 Family respondents2.6 Firm size
None––+–+
3. Bibliographic characteristics 3.1 Published in ETP or JBV3.2 Publication year
+–
Response Rates in Family Business Research
© 2019 The AuthorsEuropean Management Review published by John Wiley & Sons Ltd on behalf of European Academy of Management(EURAM)
329
survey respondents in the relevance and necessity of thesurvey and thus increase response rates. In line with thisnotion, several studies have found that such precontacts(e.g., by phone, mail or email) are associated with higherresponse rates (e.g., Fox et al., 1988; Roth and BeVier,1998; Edwards et al., 2002; Chidlow et al., 2015 ). Aswe see no conceptual reasons why precontacts in familybusiness survey research should generally not work infavor of response rates, we posit the following:
Hypothesis 1 (H1). Precontacts have a positive effecton response rates in family business survey research.
There is evidence that in recent years, research surveysin the social sciences have increasingly drawn onelectronic techniques such as e-mail-based or browser-based surveys (Buchanan and Hvizdak, 2009; Hiebl andRichter, 2018). Such electronic survey techniques entailadvantages such as being more cost efficient – forinstance, due to avoiding postal charges (Keusch, 2015;Shannon and Bradshaw, 2002). At the same time,electronic survey techniques also feature some specificchallenges, such as technical issues in disseminating,opening and responding to questionnaires (Toepoelet al., 2009; Anseel et al., 2010; Foster Thompson andSurface, 2016). Potentially, due to such challenges, somemeta-analytic studies find that surveys using electronictechniques feature lower response rates (e.g., Manfredaet al., 2008; Shih and Fan, 2008). While more recentstudies indicate that response behavior between electronicand non-electronic surveys no longer differs significantly(e.g., Saunders, 2012; Newberry and Israel, 2017), weexpect that in our sample of family business surveyresearch over the past few decades, electronic surveytechniques have had a detrimental effect on response ratesin family business research:
Hypothesis 2 (H2). Electronic survey techniques havea negative effect on response rates in family businesssurvey research.
The methods literature suggests that reminders are avery efficient technique for increasing response rates(e.g., Dillman et al., 2014). Some meta-analytic studies(e.g., Fox et al., 1988; Roth and BeVier, 1998; Edwardset al., 2002; Shih and Fan, 2008) confirm this assumption,while others find that studies with high response rates didnot rely on reminders (e.g., Baruch and Holtom, 2008;Mellahi and Harris, 2016). Because reminders cannotdecrease but can only increase response rates, we alsoexpect that studies having used reminders will featurehigher response rates. Thus,
Hypothesis 3 (H3). Reminders have a positive effecton response rates in family business survey research.
Similar to reminders, the usage of monetary and non-monetary incentives is a technique that is oftenrecommended to enhance response rates (e.g., Dillmanet al., 2014). Monetary incentives include cash paymentsto respondents, while non-monetary incentives includedonations to charities or lotteries (Edwards et al., 2002).Some prior meta-analytic studies show positiveassociations between incentives and response rates (e.g.,Heberlein and Baumgartner, 1978; Edwards et al.,2002). Others find no or even negative associations (e.g.,Cook et al., 2000; Shih and Fan, 2008; Chidlow et al.,2015; Mellahi and Harris, 2016). The positive effect ofincentives can be explained by increasing the surveyaddressees’ willingness to participate in the surveys dueto the promised incentives (Dillman et al., 2014), whilethe negative effects of incentives on response rates maybe due to the notion that incentives could underminesurvey addressees’ intrinsic or social motivations toparticipate in the survey and thus lead to non-response(Sauermann and Roach, 2013). This ambiguity warrantsan analysis of the effect of incentives in the specific fieldof family business research, but given the largely mixedeffects of incentives, we expect that the positive andnegative effects will level each other out. Thus,
Hypothesis 4 (H4). Incentives have no effect onresponse rates in family business survey research.
Survey population characteristics
Prior meta-analytic evidence on the response rates inhighly ranked management (Baruch, 1999; Mellahi andHarris, 2016) and accounting (Hiebl and Richter, 2018)journals suggests that the response rates differ by theregion where the surveys were conducted. However, theevidence is inconclusive. For instance, while Baruch(1999) finds that surveys conducted in North Americafeature higher response rates, Hiebl and Richter (2018)find the opposite. Given this mixed evidence, wehypothesize that response rates in North American familybusiness research studies do not differ significantly fromthose achieved in other regions:
Hypothesis 5 (H5). Response rates achieved in familybusiness research surveys conducted in NorthAmerica do not significantly differ from response ratesreached in other regions.
Survey data collected from executives are an importantsource of evidence for management-related researchfields, but they come with specific challenges. Forinstance, executives are often especially time starved andare therefore more selective in responding to surveys thanemployees at lower hierarchical levels (Cycyota and
D.I. Pielsticker and M.R.W. Hiebl
© 2019 The AuthorsEuropean Management Review published by John Wiley & Sons Ltd on behalf of European Academy of Management
(EURAM)
330
Harrison, 2002, 2006). In line with this notion, prior meta-analytic evidence shows that surveys relying onrespondents from the top of organizational hierarchiesachieve, on average, lower response rates (e.g., Baruch,1999; Anseel et al., 2010). In turn, we can expect higherresponse rates from studies focused on respondents fromlower hierarchical levels. Thus,
Hypothesis 6 (H6). Family business research surveysaddressing respondents situated at higher hierarchicallevels reach lower response rates than surveystargeting respondents situated at lower hierarchicallevels.
Not only the position of survey addressees but also theiroverall number, that is, the survey population size, mayinfluence response rates. Larger survey population sizesmay be associated with fewer resources available forgathering responses from individual members of thesurvey population. This aspect may be associated withfewer activities performed to attract the individual surveyaddressees, resulting in lower response rates. In line withthis argument, in their study on response rates inaccounting survey research, Hiebl and Richter (2018)found a negative association between the surveypopulation size and response rates, which is why we alsoinclude this factor in our analyses:
Hypothesis 7 (H7). Larger survey population sizeshave a negative effect on response rates in familybusiness survey research.
The survey population that is addressed in anyparticular survey can be constructed by differentsampling approaches. For instance, we can distinguishsurveys where the addressees are selected randomlyfrom a certain population (i.e., random sampling)from surveys where the addressees are not selectedrandomly (i.e., non-probability sampling; Landers andBehrend, 2015). Response rates are regularlyconsidered to be more important to studies relying onrandom sampling because statistical generalization isoften the aim of such studies (Speklé and Widener,2018). High response rates are regularly interpreted asbetter enabling such generalization from survey studiesthan lower response rates (van der Stede et al., 2005).In turn, response rates are often considered lessimportant in studies testing theoretical propositions butnot aiming at results that necessarily enablegeneralizations to the underlying population of interest(Speklé and Widener, 2018). For this reason, we expectthat in family business research, scholars place higheremphasis on and invest more resources in achievinghigher response rates when following a randomsampling approach:
Hypothesis 8 (H8). Random sampling has a positiveeffect on response rates in family business surveyresearch.
Surveys in family business research are often directedto family firms’ top managers (Wilson et al., 2014). Infamily business research, it has been found that theinclusion of non-family actors in the management teamoften leads to family firm behaviors that differ frombehaviors in family firms purely equipped with topmanagement team members that belong to the controllingfamily (Klein and Bell, 2007; Hiebl and Li, 2018; Taboret al., 2018). Based on these general observations, weexpect that the family or non-family status of respondentswill also have an effect on response rates in familybusiness survey studies. In particular, we expect lowerresponse rates for surveys including family respondentsbecause family members are portrayed as often being verysecretive in regard to disclosing data about their firms(Stamm and Lubinski, 2011;Wilson et al., 2014), whereasnon-family respondents may be more accustomed todisclosing information about their employer firms basedon earlier career experience in non-family firms and arenot as committed to family-related goals, such assecretiveness (cf. Tabor et al., 2018). Consequently, weposit the following:
Hypothesis 9a (H9a). Response rates are lower forfamily business research surveys including familyrespondents than for surveys addressing only non-family respondents.
In addition to this direct impact of family respondentson response rates, we also expect that the status as afamily or non-family respondent interacts with the foursurvey process characteristics investigated in this study:precontacts, electronic survey techniques, incentivesand reminders. Drawing on Anseel et al.’s (2010)finding that the effectiveness of response-enhancingtechniques is dependent on the type of respondent, weexpect that family respondents may react differently toresponse-enhancing techniques than non-familyrespondents. That is, given the alleged secretiveness offamily members in family firms (Stamm and Lubinski,2011; Wilson et al., 2014), we expect that theabovementioned survey process characteristics are lesseffective for family respondents than for non-familyrespondents. Thus,
Hypothesis 9b (H9b). Response-enhancing techniquessuch as precontacts, electronic survey techniques,incentives and reminders are less effective in reachinghigh response rates for family business researchsurveys addressing family respondents than for surveysaddressing only non-family respondents.
Response Rates in Family Business Research
© 2019 The AuthorsEuropean Management Review published by John Wiley & Sons Ltd on behalf of European Academy of Management(EURAM)
331
Many aspects of family firms vary with firm size. Thereis evidence that larger family firms tend to resemble non-family firms in applying techniques that are consideredpart of ‘professional management’; thus, larger familyfirms may be considered to have lost some familybusiness-specific characteristics. For instance, similar tonon-family firms, larger family firms make greater useof formal employee training programs (Kotey and Folker,2007) and formal performance measurement techniques(Speckbacher and Wentges, 2012) and employ morenon-family managers (Hiebl and Li, 2018; Tabor et al.,2018). Consequently, we could expect that with growingfirm size, family firms may lose some of theirsecretiveness in regard to responding to surveys (Stammand Lubinski, 2011; Wilson et al., 2014). In line with thisnotion, there is some evidence in small business researchthat the response rates are positively associated with thesize of the surveyed firms (Kleinknecht, 1989). That is,there is evidence that managers and owners of smallerfirms are particularly reluctant to participate in surveystudies (Dennis, 2003; Bartholomew and Smith, 2006).We thus hypothesize the following:
Hypothesis 10 (H10). Surveying larger firms has apositive effect on response rates in family businesssurvey research.
Bibliographic characteristics
We now turn to two bibliographic characteristics thatcannot necessarily be interpreted as antecedents ofresponse rates but as factors associated with responserates. For this reason, we include them in our analyses,but we need to keep in mind that unlike the other factors,the two bibliographic factors are not fully in the hands offamily business researchers when designing or conductingtheir survey studies.
The first of these two bibliographic characteristicsrelates to the publication outlet of the survey studies. Notethat this factor, in particular, cannot be considered anantecedent of response rates because the submission of asurvey study to a publication outlet usually occurs afterthe survey has been conducted and, thus, after theresponse rate has been determined. Nevertheless, tocontrol for potential differences in response ratesdepending on the outlet where family business surveystudies are published, we include this factor in ouranalysis. Two out of the seven journals on which we relyin this paper – Entrepreneurship Theory and Practice(ETP) and the Journal of Business Venturing (JBV) –are consistently considered to be among the very topjournals in entrepreneurship (e.g., Pearce, 2012) andfamily business research (Chrisman et al., 2008). Forinstance, different from the other journals analyzed in
our study, ETP and JBV are included in the FinancialTimes Top 50 Journals list, and they carry a grade 4ranking in the latest edition of the Academic JournalGuide published by the Chartered Association of BusinessSchools in 2018. ETP and JBV receive a high number ofsubmissions and feature a review process that results incomparatively low acceptance rates (Pearce, 2012). Therigorous review process of ETP and JBV may also bereflected in the response rates of the survey studiespublished in these two journals. That is, given that highresponse rates can be considered a quality criterion ofsurvey studies (e.g., Cook et al., 2000; Manfreda et al.,2008), ETP and JBV may select only survey studies ofthe highest quality for publication and thus expect to seehigher response rates than the other journals covered inour study. Thus,
Hypothesis 11 (H11). Family business survey studiespublished in ETP and JBV show higher response ratesthan studies published in other journals.
Several authors have lamented that in more recentyears, surveys in business-related research fields havesuffered from lower response rates (e.g., Baruch, 1999;van der Stede et al., 2005; Cycyota and Harrison, 2006;Chidlow et al., 2015). The main reason for thisphenomenon could be ‘oversurveying;; that is, executivesand other survey addressees receive increasingly moresurvey invitations and, consequently, have become moreselective in responding to such invitations (Rogelbergand Stanton, 2007). This phenomenon could especiallyapply to family business research because the researchactivity around family firms has increased greatly overthe last few decades (Bird et al., 2002; Sharma et al.,2017). It can be expected that family firms have alsobecome increasingly oversurveyed and that the responserates in family business survey studies may have also thusdeclined. We posit the following:
Hypothesis 12a (H12a). Response rates in familybusiness survey research have declined over time.
We expect, however, that most family business surveyresearchers are well aware of the fact that in recent years,high response rates are more difficult to achieve and that itis now the norm to receive lower response rates than thosea few decades ago. Not least, this expectation is rooted inthe fact that meta-analytic studies on response rates insurvey-based management research have indicated adownturn in response rates 20 years ago (e.g., Baruch,1999). Consequently, we expect that family businesssurvey researchers are trying to counter decliningresponse rates with measures that allow them to achievemeaningful sample sizes despite lower response rates.Such meaningful sample sizes are necessary because
D.I. Pielsticker and M.R.W. Hiebl
© 2019 The AuthorsEuropean Management Review published by John Wiley & Sons Ltd on behalf of European Academy of Management
(EURAM)
332
many statistical procedures require a minimum samplesize (Speklé and Widener, 2018). In addition, recentfamily business studies have increasingly drawn uponsophisticated statistical methods, which often come withthe need for larger sample sizes (Wilson et al., 2014). Apremier measure to increase sample sizes when facinglower response rates is addressing more people – that is,increasing the survey population size (cf. Hiebl andRichter, 2018). For instance, if a survey researcher wantsto have a sample size of 200, he could achieve this witha survey population size of 500 and a response rate of40%. If such a high response rate is not realistic and theresearcher rather expects to achieve a 20% response rate,all else being equal, the researcher would need to doublethe survey population size to 1,000. Given this interactioneffect of survey population sizes and response rates onsample sizes, we expect that in more recent years, familybusiness survey researchers have addressed larger surveypopulations to achieve meaningful sample sizes despitedecreasing response rates. Thus,
Hypothesis 12b (H12b). In more recent years, familybusiness survey studies have drawn on larger surveypopulation sizes to achieve high response rates. Thatis, there will be an interaction effect between surveypopulation size and the year of publication inexplaining response rates in family business surveyresearch.
Methods
Sampling and data collection
To examine the response rates in family business surveyresearch, we draw on survey studies published in ETP,JBV, European Management Review (EMR), FamilyBusiness Review (FBR), the Journal of Family BusinessManagement (JFBM), the Journal of Family BusinessStrategy (JFBS) and the Journal of Small BusinessManagement (JSBM). Four of these journals – ETP,FBR, JBV and JSBM – have long been considered coreoutlets for family business research and have also beendrawn upon in review papers adopting samplingapproaches similar to ours (e.g., Bird et al., 2002; Steigeret al., 2015). In addition, we have also included theyounger journals JFBM and JFBS because they focusexclusively on family business research, have alreadygained decent scholarly recognition and frequentlypublish survey research (Astrachan and Pieper, 2013;Wilson et al., 2014). In addition to these journals with atraditional focus on family firms, we have also includedthe publication outlet for this study in our search—theEMR.
We have analyzed all research articles published inthese seven journals between 1988 and 2017 for potentialinclusion in our study. We have chosen 1988 as the firstyear for our time frame because this year marks theintroduction of FBR and can thus be viewed as animportant year for the establishment of the distinct fieldof family business research (cf. Bird et al., 2002). Wesearched for all research studies that were based on acombination of questionnaires and quantitative analysesand that were concerned with family firms. For articlespublished in FBR, JFBM and JFBS, we assumed that allwere focused on family firms because these journalsexclusively publish family business research. For EMR,ETP, JBV and JSBM, we included only articles thatshowed clear links to family business research. That is,such articles had to declare a focus on family businessesin their titles, abstracts and/or author-provided keywordsand had to include family firms in their empirical analyses.The identification of such studies was somewhat impededby the non-existence of a universally accepted definitionof family businesses in the literature (Chua et al., 1999;Steiger et al., 2015). However, most of the availablefamily business definitions agree that family businessesare characterized by a high degree of family involvement(Chua et al., 1999; Sharma, 2004). Consequently, and inline with some other recent family business studies (e.g.,Landry et al., 2013; Hiebl and Li, 2018), we used thisoverall criterion to identify family business studies in thefour journals not exclusively devoted to family firms.We also needed a common understanding of what definessurvey studies. From the meta-analytic studies onresponse rates that disclose their underlying definition ofsurvey studies, we distilled two factors that characterizea survey study: (1) the study is based on a questionnaire(Baruch, 1999; Baruch and Holtom, 2008); and (2) thedata gathered through the questionnaire are analyzed in aquantitative fashion (Hiebl and Richter, 2018). We usedthese two criteria for the identification of survey studiesin the seven journals mentioned above. Following theseinclusion criteria, we identified 232 articles for furtherexamination.
In line with other meta-analytical studies on responserates (e.g., van der Stede et al., 2005; Baruch andHoltom, 2008; Hiebl and Richter, 2018), we excludeda series of articles (in total, 106) from further analyses.Table 2 provides an overview of these exclusions andour reasoning as to why these exclusions werenecessary. After these exclusions, our final sampleconsisted of 126 articles (see the Appendix for a list).The distribution of these 126 articles across journals isas follows: FBR 71, JFBM 5, JFBS 20, ETP 9, JBV5 and JSBM 16. In EMR, we could not detect a familybusiness survey study. Table 3 presents an overview ofthe temporal distribution of the articles included in oursample.
Response Rates in Family Business Research
© 2019 The AuthorsEuropean Management Review published by John Wiley & Sons Ltd on behalf of European Academy of Management(EURAM)
333
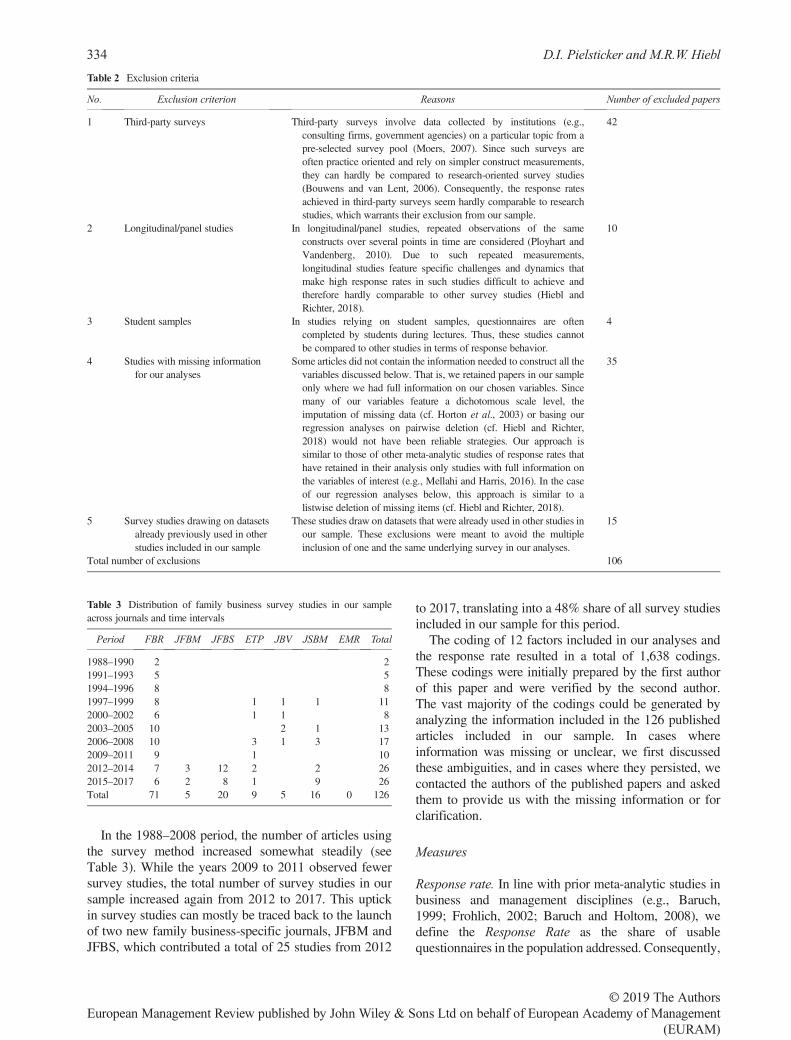
In the 1988–2008 period, the number of articles usingthe survey method increased somewhat steadily (seeTable 3). While the years 2009 to 2011 observed fewersurvey studies, the total number of survey studies in oursample increased again from 2012 to 2017. This uptickin survey studies can mostly be traced back to the launchof two new family business-specific journals, JFBM andJFBS, which contributed a total of 25 studies from 2012
to 2017, translating into a 48% share of all survey studiesincluded in our sample for this period.
The coding of 12 factors included in our analyses andthe response rate resulted in a total of 1,638 codings.These codings were initially prepared by the first authorof this paper and were verified by the second author.The vast majority of the codings could be generated byanalyzing the information included in the 126 publishedarticles included in our sample. In cases whereinformation was missing or unclear, we first discussedthese ambiguities, and in cases where they persisted, wecontacted the authors of the published papers and askedthem to provide us with the missing information or forclarification.
Measures
Response rate. In line with prior meta-analytic studies inbusiness and management disciplines (e.g., Baruch,1999; Frohlich, 2002; Baruch and Holtom, 2008), wedefine the Response Rate as the share of usablequestionnaires in the population addressed. Consequently,
Table 2 Exclusion criteria
No. Exclusion criterion Reasons Number of excluded papers
1 Third-party surveys Third-party surveys involve data collected by institutions (e.g.,consulting firms, government agencies) on a particular topic from apre-selected survey pool (Moers, 2007). Since such surveys areoften practice oriented and rely on simpler construct measurements,they can hardly be compared to research-oriented survey studies(Bouwens and van Lent, 2006). Consequently, the response ratesachieved in third-party surveys seem hardly comparable to researchstudies, which warrants their exclusion from our sample.
42
2 Longitudinal/panel studies In longitudinal/panel studies, repeated observations of the sameconstructs over several points in time are considered (Ployhart andVandenberg, 2010). Due to such repeated measurements,longitudinal studies feature specific challenges and dynamics thatmake high response rates in such studies difficult to achieve andtherefore hardly comparable to other survey studies (Hiebl andRichter, 2018).
10
3 Student samples In studies relying on student samples, questionnaires are oftencompleted by students during lectures. Thus, these studies cannotbe compared to other studies in terms of response behavior.
4
4 Studies with missing informationfor our analyses
Some articles did not contain the information needed to construct all thevariables discussed below. That is, we retained papers in our sampleonly where we had full information on our chosen variables. Sincemany of our variables feature a dichotomous scale level, theimputation of missing data (cf. Horton et al., 2003) or basing ourregression analyses on pairwise deletion (cf. Hiebl and Richter,2018) would not have been reliable strategies. Our approach issimilar to those of other meta-analytic studies of response rates thathave retained in their analysis only studies with full information onthe variables of interest (e.g., Mellahi and Harris, 2016). In the caseof our regression analyses below, this approach is similar to alistwise deletion of missing items (cf. Hiebl and Richter, 2018).
35
5 Survey studies drawing on datasetsalready previously used in otherstudies included in our sample
These studies draw on datasets that were already used in other studies inour sample. These exclusions were meant to avoid the multipleinclusion of one and the same underlying survey in our analyses.
15
Total number of exclusions 106
Table 3 Distribution of family business survey studies in our sampleacross journals and time intervals
Period FBR JFBM JFBS ETP JBV JSBM EMR Total
1988–1990 2 21991–1993 5 51994–1996 8 81997–1999 8 1 1 1 112000–2002 6 1 1 82003–2005 10 2 1 132006–2008 10 3 1 3 172009–2011 9 1 102012–2014 7 3 12 2 2 262015–2017 6 2 8 1 9 26Total 71 5 20 9 5 16 0 126
D.I. Pielsticker and M.R.W. Hiebl
© 2019 The AuthorsEuropean Management Review published by John Wiley & Sons Ltd on behalf of European Academy of Management
(EURAM)
334
the Response Rate features a metric scale. In cases wherethe analyzed articles did not disclose the Response Rate orcalculated it differently, we (re-)calculated the ResponseRate, as defined above. In cases where we did not havesufficient information to calculate the Response Rate atall (even after contacting the survey authors), therespective study was excluded from our sample, asexplained in Table 2.
Precontact. This variable indicates whether the surveyauthors had already been in contact (e.g., by phone, mailor email) with the survey population before the actualquestionnaires were sent out. Our Precontact variable isdichotomously scaled. It assumes the value of 1 (yes) ifany form of precontact was made, and 0 otherwise.
Electronic survey techniques. This variable measureswhether the underlying survey involved electronic surveytechniques, that is, whether the survey questionnaire couldbe answered via email and/or web sites. Our variableElectronic Survey Techniques has a dichotomous scalelevel. The variable assumes a value of 1 (yes) if the surveyauthors have used only electronic survey techniques and 0(no) if the survey authors exclusively used non-electronictechniques or if they have used both electronic surveytechniques and non-electronic survey techniques. Weacknowledge that we could have differentiated betweenthree categories for this variable: (1) only electronicsurvey techniques; (2) both electronic and non-electronicsurvey techniques; and (3) only non-electronic surveytechniques. We also attempted this more fine-grainedcoding, but our significant results presented belowremained the same. However, we aimed to save spaceand to avoid decreasing the statistical power of ourregression analysis due to the larger number ofindependent variables at a given sample size of surveystudies included in our analysis (cf. Cohen, 1988; Khamisand Kepler, 2010). Such a larger number of independentvariables and thus issues with statistical power wouldhave resulted from a more fine-grained measurement ofvariables such as Electronic Survey Techniques. Thus,for this variable and others (see below), we report a lessfine-grained measurement here.
Reminder. To test the effect of reminders for familybusiness survey research, we include the dichotomousvariable Reminder. This variable indicates whether theauthors sent at least one reminder message (regardless ofwhether by mail, email, phone or other media) after thefirst wave of questionnaires had been sent. The variabletakes the value of 1 (yes) if the authors have used areminder and takes the value of 0 (no) if no reminderwas sent.
Incentives. We include the dichotomous variableIncentives in our analyses. This variable takes the valueof 1 (yes) if any kind of incentive (i.e., monetary, non-monetary or mixed) was offered to survey addresseesand otherwise 0 (no).
Surveys in North America.We coded a study as 1 (yes) ifthe surveys were conducted exclusively in North Americaand as 0 (no) if the respective surveys included data fromoutside of North America. Similar to Electronic SurveyTechniques, at least three categories for this variable couldbe determined (i.e., (1) surveys in North America, (2)surveys including data from North America and otherregions, and (3) surveys outside of North America). Wehave tested this more fine-grained measurement; however,it does not lead to different results. Consequently, weretain this less detailed measurement where (2) and (3)are both coded as 0.
Higher hierarchical level. If the respondents cameexclusively from higher hierarchical levels, such as topmanagement, then we coded the dichotomous variableHigher Hierarchical Level as 1 (yes). If the respondentscame from mixed or middle/lower management levels,then we coded this variable as 0 (no). Similar to ElectronicSurvey Techniques and Surveys in North America, wecould have developed at least three categories for thisvariable. Because the significant results remainunchanged in the case of a more fine-grainedcategorization of hierarchical levels, we retain this simplermeasurement.
Survey population size. The survey population features ametrical scale level and represents the total number ofaddressed members of the survey population.
Random sampling. In line with prior meta-analytic studies(e.g., Derfuss, 2016), we coded all studies clearly statingthat they relied on random sampling techniques with avalue of 1 (yes) for this variable and otherwise 0 (no).
Family respondents. Our variable Family Respondentsfeatures a dichotomous scale level and is a specificcharacteristic in survey research on family firms. Wecoded this variable as 1 (yes) if the survey included onlyfamily respondents. If the surveys relied only on non-family respondents such as non-family managers or bothfamily respondents and non-family respondents, we codedthis variable as 0 (no). Again, we could have created atleast three categories for this variable. For FamilyRespondents, we also tested a more fine-grainedmeasurement, but it did not materially alter our results.Consequently, we also retained the simpler dichotomousmeasurement for this variable.
Response Rates in Family Business Research
© 2019 The AuthorsEuropean Management Review published by John Wiley & Sons Ltd on behalf of European Academy of Management(EURAM)
335
Firm size. As is typical in family business research (e.g.,De Massis et al., 2018; Ge et al., 2019), we draw on thenumber of employees to measure Firm Size. In line withprior meta-analytic studies (e.g., Rauch and Hatak, 2016;Brinckmann et al., 2019), we draw on the threshold of500 employees to define small firms. That is, our variableFirm Size takes the value of 1 (yes) if all firms included ina survey had a maximum of 500 employees. The variableassumes the value 0 (no) if the firms included in the surveyhad more than 500 employees or if the survey relied on amixed sample that included both small and large firms.For our Firm Size variable, we could also have created atleast three categories. We tested a more fine-grainedmeasurement of Firm Size, which did not change oursignificant results. Consequently, we also retained thesimpler dichotomous measurement for this variable. Wealso tested whether operationalizing firm size with amaximum of 250 employees would change our significantresults. This was not the case, and in the belowmeasurement of Firm Size, we draw on the 500-employeethreshold to distinguish small firms from large firms.1
Published in ETP or JBV. We constructed a dichotomousvariable that is coded as 1 (yes) for all papers published inETP and JBV. This variable is coded as 0 (no) for surveystudies published in EMR, FBR, JSBM, JFBM, andJFBS.
Publication year. This variable is metrically scaled andindicates the year in which the respective article waspublished in print. We acknowledge that there are timelags between the actual survey and the publication of thesurvey results. However, the actual years when therespective surveys were conducted are not disclosed inthe vast majority of analyzed papers. Consequently,similar to other meta-analytic studies on response rates(e.g., Baruch, 1999; Chidlow et al., 2015; Shih and Fan,2008), we draw on the variable Publication Year as aproxy for the time effects in response rate developments.
Results
Descriptive results and correlations
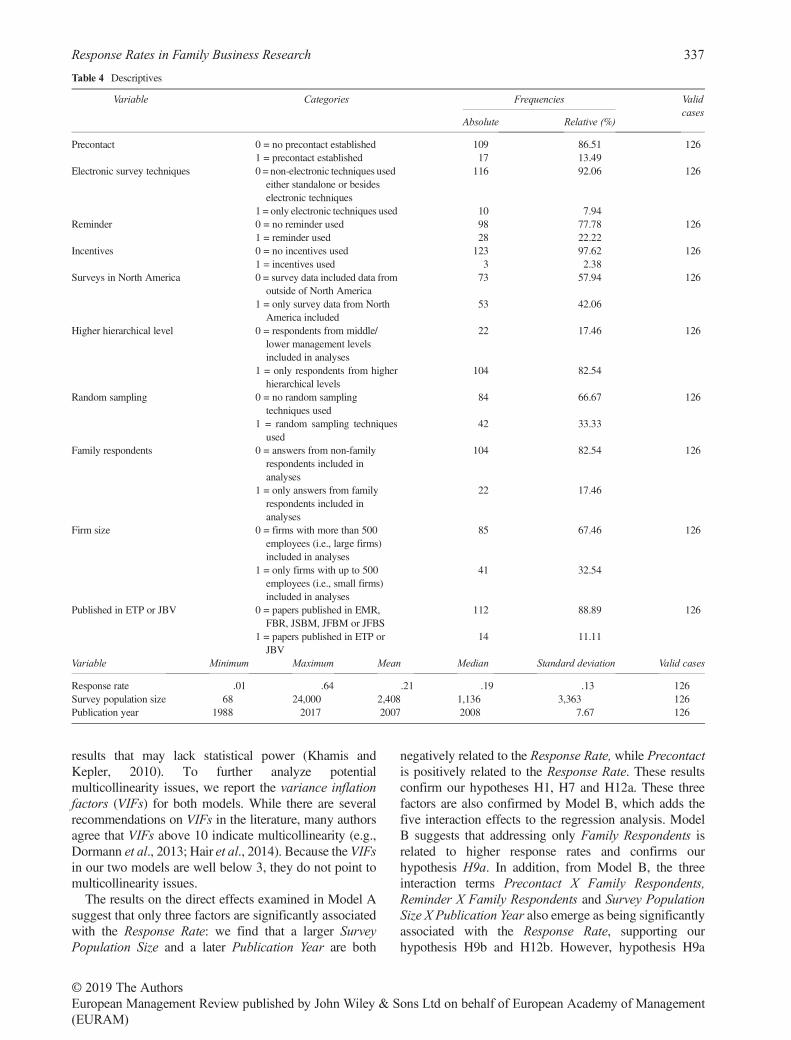
Table 4 reports descriptive results of our variables, andTable 5 reports the correlations and associations betweenthe endogenous variable (response rate) and all 12exogenous variables. Due to different scale levels of ourvariables, different measures of associations between
variables were used (see the notes in Table 5). Somevariables feature significant associations with each other.However, none of these associations lies within the criticalrange of 0.6–0.8, which could point to multicollinearityissues (Tabachnick and Fidell, 2007; Dormann et al.,2013). Thus, from the correlation matrix, we have noindications of multicollinearity issues in our data.
Table 6 shows that the overall average response rate inthe analyzed survey studies is approximately 21%, theoverall average number of usable responses is 322, andthe overall average survey population size is 2,408. Thedescriptive data in Table 6 hint that the response rates infamily business survey research have declined over time:while the highest average response rates can be observedin earlier time intervals, such as 1988–1993 and 2000–2002, the lowest average response rates can be found inmore recent time intervals, such as 2009–2011 and2015–2017. Table 6 also indicates that family businesssurvey researchers have addressed ever-growing surveypopulations, potentially as a response to the difficultiesin reaching high response rates: while in the earlier yearscovered in our analyses, the average survey populationsize remained well below 1,000, in the new millennium,this number averaged almost consistently above 2,000.In turn, while the number of usable responses increasedin the earlier years in our analyses, it remained broadlyconstant from 2006 on and hovered at approximately300. That is, our data suggest that the average surveystudy in family business research published in 2006 orlater relies on approximately 300 observations.
Table 7 illustrates a split of our sample into the worldregions where the surveys were conducted. It shows thatonly a small number (12) of studies included in our samplewere conducted outside of North America and Europe.The descriptives also suggest that, on average, theresponse rates are higher in North America than inEurope.
Multiple regression analyses
Table 8 reports two multiple regression models. Model Aincludes all direct effects of the above variables on theresponse rate. Model B adds the four interaction effectsbetween the survey process characteristics and our FamilyRespondents variable as well as the interaction effectbetween the Survey Population Size and Year ofPublication. The F statistics indicate that both modelsare significant at p < 0.01 and both models show noindications of missing statistical power or overfitting:following Khamis and Kepler (2010), our sample size of126 allows for a maximum of 21 independent variablesto deliver reliable results. Model A includes 12independent variables, while Model B includes 17independent variables. Both models are thus well belowthis threshold and do not show indications of unreliable
1The threshold of 500 employees for demarcating small from large enterprises istypical for North America, but less so for other regions of the world (Ang andCardozo, 1993) such as Europe, where the threshold set by the EuropeanCommission (2003) for delineating large firms from small and medium-sizedfirms is 250 employees. Since most of the seven journals we searched for familybusiness survey studies are US-based, we opted for the threshold of 500employees.
D.I. Pielsticker and M.R.W. Hiebl
© 2019 The AuthorsEuropean Management Review published by John Wiley & Sons Ltd on behalf of European Academy of Management
(EURAM)
336
results that may lack statistical power (Khamis andKepler, 2010). To further analyze potentialmulticollinearity issues, we report the variance inflationfactors (VIFs) for both models. While there are severalrecommendations on VIFs in the literature, many authorsagree that VIFs above 10 indicate multicollinearity (e.g.,Dormann et al., 2013; Hair et al., 2014). Because the VIFsin our two models are well below 3, they do not point tomulticollinearity issues.
The results on the direct effects examined in Model Asuggest that only three factors are significantly associatedwith the Response Rate: we find that a larger SurveyPopulation Size and a later Publication Year are both
negatively related to the Response Rate, while Precontactis positively related to the Response Rate. These resultsconfirm our hypotheses H1, H7 and H12a. These threefactors are also confirmed by Model B, which adds thefive interaction effects to the regression analysis. ModelB suggests that addressing only Family Respondents isrelated to higher response rates and confirms ourhypothesis H9a. In addition, from Model B, the threeinteraction terms Precontact X Family Respondents,Reminder X Family Respondents and Survey PopulationSize X Publication Year also emerge as being significantlyassociated with the Response Rate, supporting ourhypothesis H9b and H12b. However, hypothesis H9a
Table 4 Descriptives
Variable Categories Frequencies Validcases
Absolute Relative (%)
Precontact 0 = no precontact established 109 86.51 1261 = precontact established 17 13.49
Electronic survey techniques 0 = non-electronic techniques usedeither standalone or besideselectronic techniques
116 92.06 126
1 = only electronic techniques used 10 7.94Reminder 0 = no reminder used 98 77.78 126
1 = reminder used 28 22.22Incentives 0 = no incentives used 123 97.62 126
1 = incentives used 3 2.38Surveys in North America 0 = survey data included data from
outside of North America73 57.94 126
1 = only survey data from NorthAmerica included
53 42.06
Higher hierarchical level 0 = respondents from middle/lower management levelsincluded in analyses
22 17.46 126
1 = only respondents from higherhierarchical levels
104 82.54
Random sampling 0 = no random samplingtechniques used
84 66.67 126
1 = random sampling techniquesused
42 33.33
Family respondents 0 = answers from non-familyrespondents included inanalyses
104 82.54 126
1 = only answers from familyrespondents included inanalyses
22 17.46
Firm size 0 = firms with more than 500employees (i.e., large firms)included in analyses
85 67.46 126
1 = only firms with up to 500employees (i.e., small firms)included in analyses
41 32.54
Published in ETP or JBV 0 = papers published in EMR,FBR, JSBM, JFBM or JFBS
112 88.89 126
1 = papers published in ETP orJBV
14 11.11
Variable Minimum Maximum Mean Median Standard deviation Valid cases
Response rate .01 .64 .21 .19 .13 126Survey population size 68 24,000 2,408 1,136 3,363 126Publication year 1988 2017 2007 2008 7.67 126
Response Rates in Family Business Research
© 2019 The AuthorsEuropean Management Review published by John Wiley & Sons Ltd on behalf of European Academy of Management(EURAM)
337
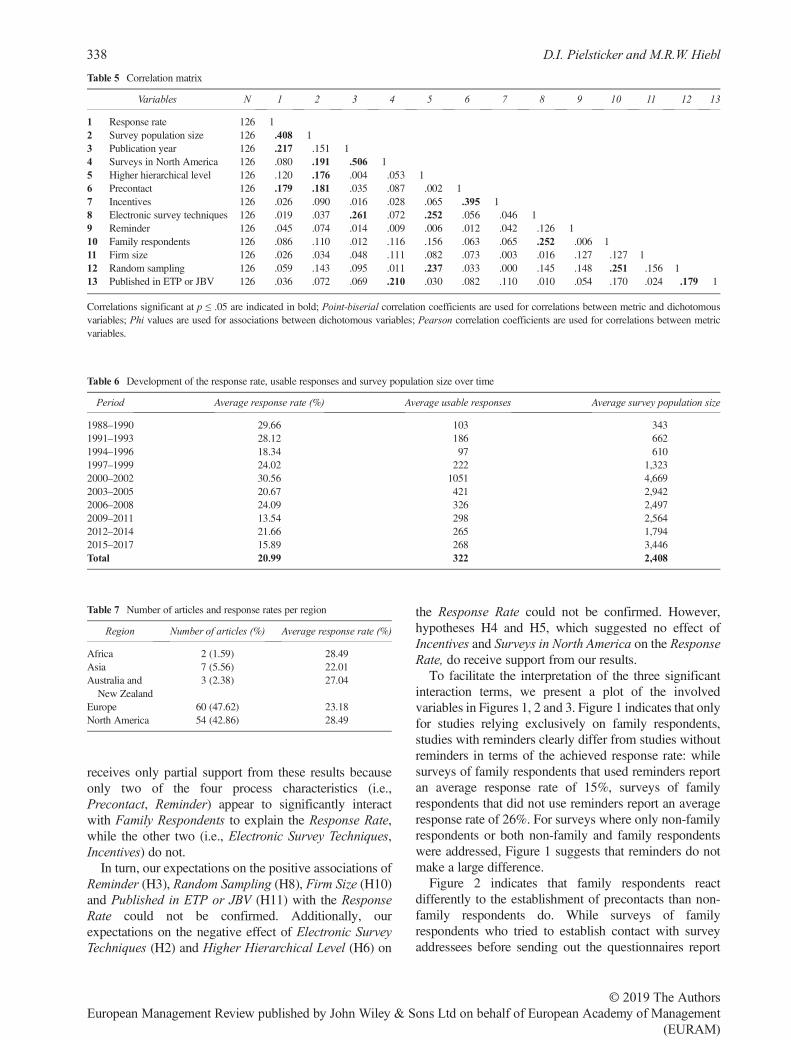
receives only partial support from these results becauseonly two of the four process characteristics (i.e.,Precontact, Reminder) appear to significantly interactwith Family Respondents to explain the Response Rate,while the other two (i.e., Electronic Survey Techniques,Incentives) do not.
In turn, our expectations on the positive associations ofReminder (H3), Random Sampling (H8), Firm Size (H10)and Published in ETP or JBV (H11) with the ResponseRate could not be confirmed. Additionally, ourexpectations on the negative effect of Electronic SurveyTechniques (H2) and Higher Hierarchical Level (H6) on
the Response Rate could not be confirmed. However,hypotheses H4 and H5, which suggested no effect ofIncentives and Surveys in North America on the ResponseRate, do receive support from our results.
To facilitate the interpretation of the three significantinteraction terms, we present a plot of the involvedvariables in Figures 1, 2 and 3. Figure 1 indicates that onlyfor studies relying exclusively on family respondents,studies with reminders clearly differ from studies withoutreminders in terms of the achieved response rate: whilesurveys of family respondents that used reminders reportan average response rate of 15%, surveys of familyrespondents that did not use reminders report an averageresponse rate of 26%. For surveys where only non-familyrespondents or both non-family and family respondentswere addressed, Figure 1 suggests that reminders do notmake a large difference.
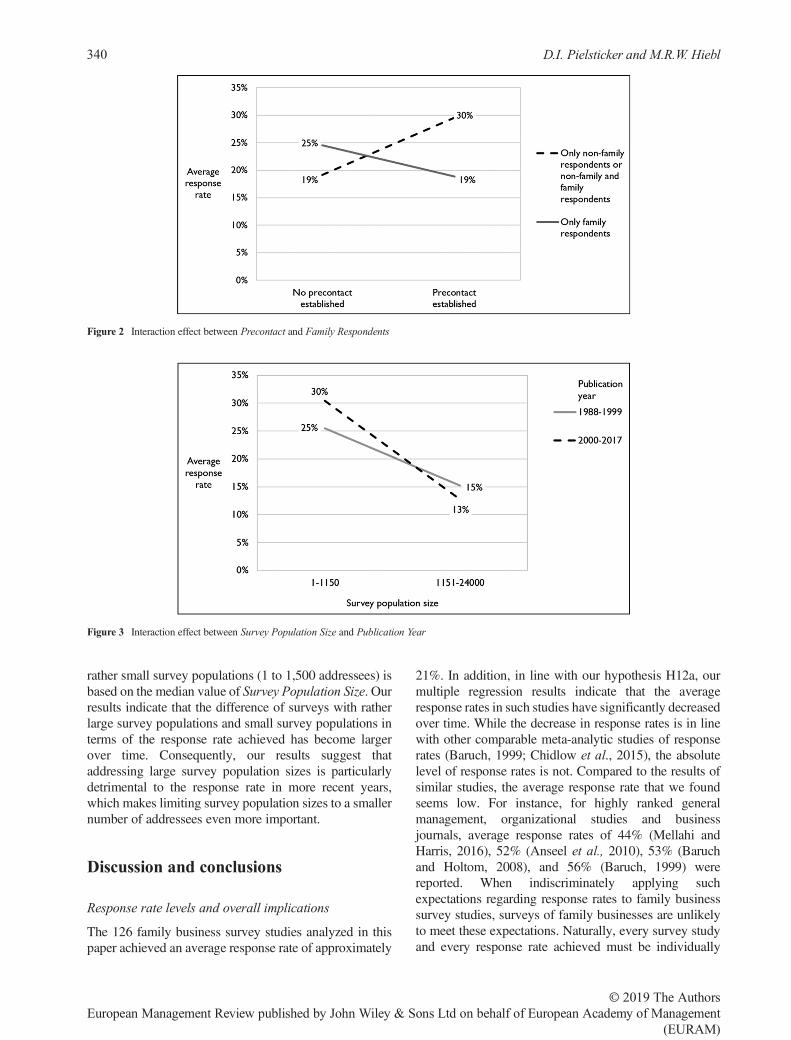
Figure 2 indicates that family respondents reactdifferently to the establishment of precontacts than non-family respondents do. While surveys of familyrespondents who tried to establish contact with surveyaddressees before sending out the questionnaires report
Table 6 Development of the response rate, usable responses and survey population size over time
Period Average response rate (%) Average usable responses Average survey population size
1988–1990 29.66 103 3431991–1993 28.12 186 6621994–1996 18.34 97 6101997–1999 24.02 222 1,3232000–2002 30.56 1051 4,6692003–2005 20.67 421 2,9422006–2008 24.09 326 2,4972009–2011 13.54 298 2,5642012–2014 21.66 265 1,7942015–2017 15.89 268 3,446Total 20.99 322 2,408
Table 7 Number of articles and response rates per region
Region Number of articles (%) Average response rate (%)
Africa 2 (1.59) 28.49Asia 7 (5.56) 22.01Australia andNew Zealand
3 (2.38) 27.04
Europe 60 (47.62) 23.18North America 54 (42.86) 28.49
Table 5 Correlation matrix
Variables N 1 2 3 4 5 6 7 8 9 10 11 12 13
1 Response rate 126 12 Survey population size 126 �.408 13 Publication year 126 �.217 .151 14 Surveys in North America 126 .080 �.191 �.506 15 Higher hierarchical level 126 �.120 .176 �.004 .053 16 Precontact 126 .179 �.181 .035 .087 �.002 17 Incentives 126 .026 �.090 .016 �.028 �.065 .395 18 Electronic survey techniques 126 .019 �.037 .261 �.072 �.252 .056 �.046 19 Reminder 126 �.045 .074 �.014 .009 �.006 .012 .042 .126 110 Family respondents 126 .086 �.110 �.012 .116 .156 .063 .065 .252 .006 111 Firm size 126 .026 �.034 .048 �.111 �.082 .073 .003 �.016 �.127 .127 112 Random sampling 126 �.059 .143 �.095 .011 .237 �.033 .000 �.145 .148 .251 .156 113 Published in ETP or JBV 126 .036 .072 �.069 .210 .030 .082 .110 �.010 .054 .170 .024 .179 1
Correlations significant at p ≤ .05 are indicated in bold; Point-biserial correlation coefficients are used for correlations between metric and dichotomousvariables; Phi values are used for associations between dichotomous variables; Pearson correlation coefficients are used for correlations between metricvariables.
D.I. Pielsticker and M.R.W. Hiebl
© 2019 The AuthorsEuropean Management Review published by John Wiley & Sons Ltd on behalf of European Academy of Management
(EURAM)
338
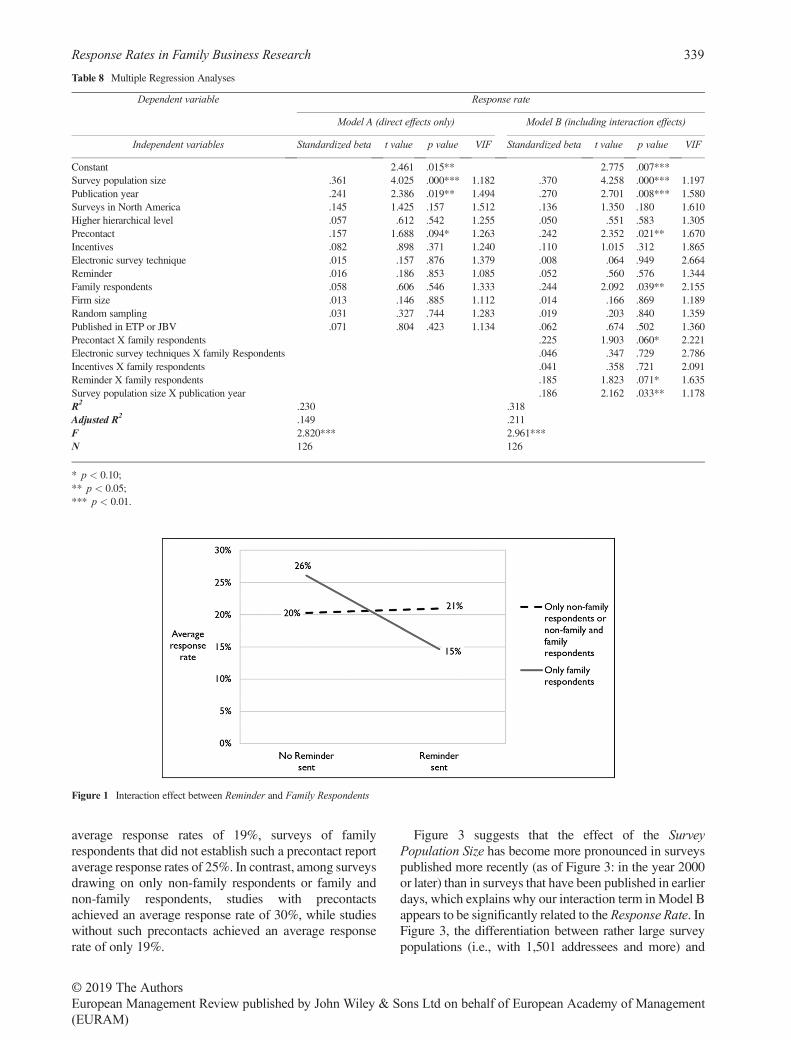
average response rates of 19%, surveys of familyrespondents that did not establish such a precontact reportaverage response rates of 25%. In contrast, among surveysdrawing on only non-family respondents or family andnon-family respondents, studies with precontactsachieved an average response rate of 30%, while studieswithout such precontacts achieved an average responserate of only 19%.
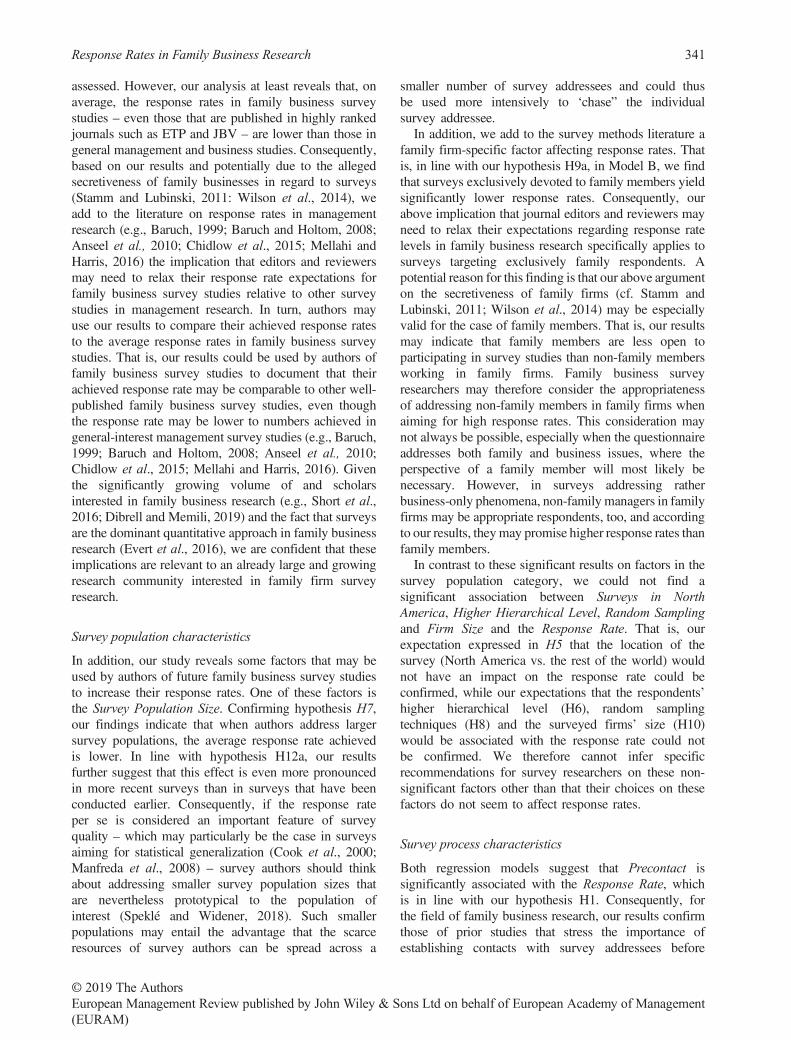
Figure 3 suggests that the effect of the SurveyPopulation Size has become more pronounced in surveyspublished more recently (as of Figure 3: in the year 2000or later) than in surveys that have been published in earlierdays, which explains why our interaction term inModel Bappears to be significantly related to the Response Rate. InFigure 3, the differentiation between rather large surveypopulations (i.e., with 1,501 addressees and more) and
Table 8 Multiple Regression Analyses
Dependent variable Response rate
Model A (direct effects only) Model B (including interaction effects)
Independent variables Standardized beta t value p value VIF Standardized beta t value p value VIF
Constant 2.461 .015** 2.775 .007***Survey population size �.361 �4.025 .000*** 1.182 �.370 �4.258 .000*** 1.197Publication year �.241 �2.386 .019** 1.494 �.270 �2.701 .008*** 1.580Surveys in North America �.145 �1.425 .157 1.512 �.136 �1.350 .180 1.610Higher hierarchical level �.057 �.612 .542 1.255 �.050 �.551 .583 1.305Precontact .157 1.688 .094* 1.263 .242 2.352 .021** 1.670Incentives �.082 �.898 .371 1.240 �.110 �1.015 .312 1.865Electronic survey technique .015 .157 .876 1.379 �.008 �.064 .949 2.664Reminder �.016 �.186 .853 1.085 .052 .560 .576 1.344Family respondents .058 .606 .546 1.333 .244 2.092 .039** 2.155Firm size �.013 �.146 .885 1.112 �.014 �.166 .869 1.189Random sampling �.031 �.327 .744 1.283 �.019 �.203 .840 1.359Published in ETP or JBV .071 .804 .423 1.134 .062 .674 .502 1.360Precontact X family respondents �.225 �1.903 .060* 2.221Electronic survey techniques X family Respondents �.046 �.347 .729 2.786Incentives X family respondents .041 .358 .721 2.091Reminder X family respondents �.185 �1.823 .071* 1.635Survey population size X publication year �.186 �2.162 .033** 1.178R2 .230 .318Adjusted R2 .149 .211F 2.820*** 2.961***N 126 126
* p < 0.10;** p < 0.05;*** p < 0.01.
Figure 1 Interaction effect between Reminder and Family Respondents
Response Rates in Family Business Research
© 2019 The AuthorsEuropean Management Review published by John Wiley & Sons Ltd on behalf of European Academy of Management(EURAM)
339
rather small survey populations (1 to 1,500 addressees) isbased on the median value of Survey Population Size. Ourresults indicate that the difference of surveys with ratherlarge survey populations and small survey populations interms of the response rate achieved has become largerover time. Consequently, our results suggest thataddressing large survey population sizes is particularlydetrimental to the response rate in more recent years,which makes limiting survey population sizes to a smallernumber of addressees even more important.
Discussion and conclusions
Response rate levels and overall implications
The 126 family business survey studies analyzed in thispaper achieved an average response rate of approximately
21%. In addition, in line with our hypothesis H12a, ourmultiple regression results indicate that the averageresponse rates in such studies have significantly decreasedover time. While the decrease in response rates is in linewith other comparable meta-analytic studies of responserates (Baruch, 1999; Chidlow et al., 2015), the absolutelevel of response rates is not. Compared to the results ofsimilar studies, the average response rate that we foundseems low. For instance, for highly ranked generalmanagement, organizational studies and businessjournals, average response rates of 44% (Mellahi andHarris, 2016), 52% (Anseel et al., 2010), 53% (Baruchand Holtom, 2008), and 56% (Baruch, 1999) werereported. When indiscriminately applying suchexpectations regarding response rates to family businesssurvey studies, surveys of family businesses are unlikelyto meet these expectations. Naturally, every survey studyand every response rate achieved must be individually
Figure 2 Interaction effect between Precontact and Family Respondents
Figure 3 Interaction effect between Survey Population Size and Publication Year
D.I. Pielsticker and M.R.W. Hiebl
© 2019 The AuthorsEuropean Management Review published by John Wiley & Sons Ltd on behalf of European Academy of Management
(EURAM)
340
assessed. However, our analysis at least reveals that, onaverage, the response rates in family business surveystudies – even those that are published in highly rankedjournals such as ETP and JBV – are lower than those ingeneral management and business studies. Consequently,based on our results and potentially due to the allegedsecretiveness of family businesses in regard to surveys(Stamm and Lubinski, 2011: Wilson et al., 2014), weadd to the literature on response rates in managementresearch (e.g., Baruch, 1999; Baruch and Holtom, 2008;Anseel et al., 2010; Chidlow et al., 2015; Mellahi andHarris, 2016) the implication that editors and reviewersmay need to relax their response rate expectations forfamily business survey studies relative to other surveystudies in management research. In turn, authors mayuse our results to compare their achieved response ratesto the average response rates in family business surveystudies. That is, our results could be used by authors offamily business survey studies to document that theirachieved response rate may be comparable to other well-published family business survey studies, even thoughthe response rate may be lower to numbers achieved ingeneral-interest management survey studies (e.g., Baruch,1999; Baruch and Holtom, 2008; Anseel et al., 2010;Chidlow et al., 2015; Mellahi and Harris, 2016). Giventhe significantly growing volume of and scholarsinterested in family business research (e.g., Short et al.,2016; Dibrell and Memili, 2019) and the fact that surveysare the dominant quantitative approach in family businessresearch (Evert et al., 2016), we are confident that theseimplications are relevant to an already large and growingresearch community interested in family firm surveyresearch.
Survey population characteristics
In addition, our study reveals some factors that may beused by authors of future family business survey studiesto increase their response rates. One of these factors isthe Survey Population Size. Confirming hypothesis H7,our findings indicate that when authors address largersurvey populations, the average response rate achievedis lower. In line with hypothesis H12a, our resultsfurther suggest that this effect is even more pronouncedin more recent surveys than in surveys that have beenconducted earlier. Consequently, if the response rateper se is considered an important feature of surveyquality – which may particularly be the case in surveysaiming for statistical generalization (Cook et al., 2000;Manfreda et al., 2008) – survey authors should thinkabout addressing smaller survey population sizes thatare nevertheless prototypical to the population ofinterest (Speklé and Widener, 2018). Such smallerpopulations may entail the advantage that the scarceresources of survey authors can be spread across a
smaller number of survey addressees and could thusbe used more intensively to ‘chase” the individualsurvey addressee.
In addition, we add to the survey methods literature afamily firm-specific factor affecting response rates. Thatis, in line with our hypothesis H9a, in Model B, we findthat surveys exclusively devoted to family members yieldsignificantly lower response rates. Consequently, ourabove implication that journal editors and reviewers mayneed to relax their expectations regarding response ratelevels in family business research specifically applies tosurveys targeting exclusively family respondents. Apotential reason for this finding is that our above argumenton the secretiveness of family firms (cf. Stamm andLubinski, 2011; Wilson et al., 2014) may be especiallyvalid for the case of family members. That is, our resultsmay indicate that family members are less open toparticipating in survey studies than non-family membersworking in family firms. Family business surveyresearchers may therefore consider the appropriatenessof addressing non-family members in family firms whenaiming for high response rates. This consideration maynot always be possible, especially when the questionnaireaddresses both family and business issues, where theperspective of a family member will most likely benecessary. However, in surveys addressing ratherbusiness-only phenomena, non-family managers in familyfirms may be appropriate respondents, too, and accordingto our results, theymay promise higher response rates thanfamily members.
In contrast to these significant results on factors in thesurvey population category, we could not find asignificant association between Surveys in NorthAmerica, Higher Hierarchical Level, Random Samplingand Firm Size and the Response Rate. That is, ourexpectation expressed in H5 that the location of thesurvey (North America vs. the rest of the world) wouldnot have an impact on the response rate could beconfirmed, while our expectations that the respondents’higher hierarchical level (H6), random samplingtechniques (H8) and the surveyed firms’ size (H10)would be associated with the response rate could notbe confirmed. We therefore cannot infer specificrecommendations for survey researchers on these non-significant factors other than that their choices on thesefactors do not seem to affect response rates.
Survey process characteristics
Both regression models suggest that Precontact issignificantly associated with the Response Rate, whichis in line with our hypothesis H1. Consequently, forthe field of family business research, our results confirmthose of prior studies that stress the importance ofestablishing contacts with survey addressees before
Response Rates in Family Business Research
© 2019 The AuthorsEuropean Management Review published by John Wiley & Sons Ltd on behalf of European Academy of Management(EURAM)
341
actually sending out questionnaires (e.g., Roth andBeVier, 1998; Edwards et al., 2002; Chidlow et al.,2015). When aiming to achieve higher response rates,family business survey researchers may therefore bewell advised to make the additional effort of contactingthe members of the survey population before sendingout their questionnaires.
However, this strategy does not seem to work for alltypes of respondents. Our analysis of interaction effectsreveals that this approach seems less fruitful for familyrespondents (see Figure 2). The interaction effectportrayed in Figure 2 even indicates that precontacts withfamily respondents may be detrimental to the responserate, which is line with our hypothesis H9b. A potentialexplanation for this finding may be that familyrespondents could be put off by multiple attempts toestablish contact. Thus, they could react more negativelyto the receipt of questionnaires after the attempt toestablish precontact. In contrast, our results indicate thatprecontacts are more successful with non-familyrespondents, which is in line with prior findings onprecontacts as a response rate-enhancing technique (seeabove). It thus appears that the positive picture ofprecontacts drawn in the existing literature on surveyresponse rates does not fully apply to family businessresearch. Family business researchers may thus considertrying to establish precontacts only with non-familyrespondents, not with family respondents, in their futuresurvey studies.
We also found a significant interaction effect betweenReminder and Family Respondents, again supportinghypothesis H9b. On the one hand, this result suggests thatfor non-family respondents, reminders do not make asignificant difference for the response rate, which is in linewith other meta-analytic studies of response rates inmanagement (Cycyota and Harrison, 2006) andaccounting studies (Hiebl and Richter, 2018). On the otherhand, our findings arrive at the result that studies of familyrespondents who drew upon reminders report significantlylower response rates than studies that did not usereminders. While somewhat counter-intuitive, similarresults have been found in prior meta-analytic studies inmanagement research that also report a negativecorrelation between the use of reminders and responserates (Baruch and Holtom, 2008; Chidlow et al., 2015;Mellahi and Harris, 2016). Despite these findings, it seemshardly plausible that response rates suffer as a result ofsending out reminders. It is more likely that studies thathave not achieved a satisfactory response rate after thefirst wave of survey invitations later draw on remindersto grow an initially low response rate (cf. Baruch andHoltom, 2008; Chidlow et al., 2015). Consequently, wedo not interpret this finding as suggesting that remindersare not a valuable method to increase the response ratesin family business survey research. Nevertheless, our
findings may indicate that some surveys of familyrespondents were not well designed in the first place andthus needed to send out reminders afterwards. Thisinterpretation would point to a need to design and pretestsurvey studies of family respondents more diligentlybefore sending them out.
In addition to these significant results, some non-significant results seem interesting. Among these findings,our results suggest that in family business research,electronic survey studies do not feature lower responserates than more traditional mail surveys, in contrast toour hypothesis H2. This result is in contrast to othermeta-analytic studies reporting that electronic surveysfeature lower response rates (e.g., Manfreda et al., 2008;Shih and Fan, 2008). Instead, our data suggest that infamily business research, electronic survey methods arenot necessarily detrimental to response rates, which is inline with recent evidence suggesting that electronic andnon-electronic surveys currently achieve comparableresponse rates (Saunders, 2012; Newberry and Israel,2017). In addition to the data-gathering method, the usageof incentives is a frequently discussed and recommendedapproach to increase response rates (e.g., Dillman et al.,2014; Singer and Ye, 2013). However, the choice andeffect of incentives are much debated. Certain types ofincentives, such as offering the survey results torespondents, were not found to increase response rates(Keusch, 2015). The fact that such offerings of surveyresults are often used as incentives in business-relatedstudies (Hiebl and Richter, 2018) may explain why, inour study, we did not find a significant relationshipbetween incentives and response rates. In contrast, in theirstudy on response rates in small firms, Newby et al.(2003) found a response-enhancing effect of monetaryincentives, which may also be more promising for familybusiness surveys.
Limitations
Naturally, our results are subject to some limitations. First,we considered only one design feature of survey studies –the response rate. Fellow researchers must keep in mindthat not only the response rate but also many more aspectsneed to be considered when designing and conductingsurvey studies. For instance, the measurement ofconstructs, adequate sample sizes, the representativenessof a sample to the underlying population, issues withomitted variables, and common-method and nonresponsebiases warrant their attention, too (cf. Dillman et al., 2014;Evert et al., 2016; Speklé and Widener, 2018).
Second, our results stem from only survey studiespublished in seven predefined journals. While thisapproach is not uncommon in reviews of the familybusiness literature, it cannot be ruled out that the inclusionof survey studies published in other journals would have
D.I. Pielsticker and M.R.W. Hiebl
© 2019 The AuthorsEuropean Management Review published by John Wiley & Sons Ltd on behalf of European Academy of Management
(EURAM)
342
led to somewhat different results. Third, our analyses arebased on a relatively small sample of 126 survey studies.Well-published other meta-analytic studies on responserates rely on similar sample sizes (e.g., Yammarinoet al., 1991; Baruch, 1999; Hiebl and Richter, 2018), butwe cannot rule out the possibility that a larger sample sizewould have yielded other results.
Fourth, the set of potential factors impacting responserates is restricted to the factors that are usually reportedin the methods sections of published survey studies.While this approach is common in well-publishedmeta-analytic studies of response rates similar to ours(Cycyota and Harrison, 2006; Baruch and Holtom,2008; Chidlow et al., 2015; Mellahi and Harris, 2016),there may be factors that impact response rates but thathave not been featured in our analyses. Factors such asthe length of questionnaires (Deutskens et al., 2004;Yammarino et al., 1991), institutional sponsorship(Edwards et al., 2002) or social ties between researchersand survey addressees (Bartholomew and Smith, 2006)may affect response rates but can be assessed only ifthe authors of surveys are open to sharing suchinformation with meta-analytic researchers like us. Thereis recent evidence that this willingness is not overlystrong (Hiebl and Richter, 2018), which is why we haverefrained from this possibility. However, for morecomprehensive analyses of the drivers affecting responserates across a large number of studies, we call for moretransparent reporting on the survey methods used. Thatis, we believe that it should at least become standard thatthe survey instrument (i.e., the questionnaire) and theinvitation letter for participants are made available alongwith the published article. Such additional informationwould not need to take up potentially scarce printedjournal space but could be published as onlineappendices, as already practiced in some survey studiespublished in leading business-related journals (e.g.,Windolph and Moeller, 2012: Speckbacher andWentges, 2012).
Despite these limitations, we believe that our results arevaluable to other family business survey researchers for atleast two reasons: (1) they are the first to offer abenchmark of response rates in family business surveyresearch; and (2) they identify some factors that areassociated with higher response rates. We therefore hopethat our results provide some useful insights for familybusiness survey researchers when designing their nextsurvey studies.
Acknowledgments
The authors are grateful to Bill Lee (editor) and twoanonymous reviewers for most helpful comments on priorversions of this article.
Declaration of Conflicting Interests
The authors declare no potential conflicts of interest withrespect to the research, authorship, and/or publication ofthis article.
ReferencesAng, S. and R. N. Cardozo, 1993, “The entrepreneurial grid.
Small firms, new firms & public policy”. Journal ofEnterprising Culture, 1: 233–254.
Anseel, F., F. Lievens, E. Schollaert and B. Choragwicka, 2010,“Response rates in organizational science, 1995–2008. A meta-analytic review and guidelines for survey researchers”. Journalof Business and Psychology, 25: 335–349.
Armstrong, S. J. and A. Hird, 2009, “Cognitive styleand entrepreneurial drive of new and mature businessowner-managers”. Journal of Business and Psychology, 24:419–430.
Astrachan, J. H. and T. M. Pieper, 2013, “Editors’ note”.Journal of Family Business Strategy, 4: 229–231.
Bartholomew, S. and A. D. Smith, 2006, “Improving surveyresponse rates from chief executive officers in small firms.The importance of social networks”. Entrepreneurship Theoryand Practice, 30: 83–96.
Baruch, Y., 1999, “Response rate in academic studies – acomparative analysis”. Human Relations, 52: 421–438.
Baruch, Y. and B. C. Holtom, 2008, “Survey response rate levelsand trends in organizational research”. Human Relations, 61:1139–1160.
Benavides-Velasco, C. A., C. Quintana-García and V. F.Guzmán-Parra, 2013, “Trends in family business research”.Small Business Economics, 40: 41–57.
Bird, B., H. Welsch, J. H. Astrachan and D. Pistrui, 2002,“Family business research. The evolution of an academicfield”. Family Business Review, 15: 337–350.
Bouwens, J. and L. van Lent, 2006, “Performance measureproperties and the effect of incentive contracts”. Journal ofManagement Accounting Research, 18: 55–75.
Brinckmann, J., N. Dew, S. Read, K. Mayer-Haug and D.Grichnik, 2019, “Of those who plan: A meta-analysis of therelationship between human capital and business planning”.Long Range Planning, 52: 173–188.
Buchanan, E. A. and E. E. Hvizdak, 2009, “Online survey tools:Ethical and methodological concerns of human research ethicscommittees”. Journal of Empirical Research on HumanResearch Ethics, 4: 37–48.
Carland, J. W., F. Hoy, W. R. Boulton and J. A. C. Carland,1984, “Differentiating entrepreneurs from small businessowners: A conceptualization”. Academy of ManagementReview, 9: 354–359.
Carley-Baxter, L. R., C. A. Hill, D. J. Roe, S. E. Twiddy, R. K.Baxter and J. Ruppenkamp, 2009, “Does response ratematter? Journal editors use of survey quality measures inmanuscript publication decisions”. Survey Practice, 2: 1–7.
Chidlow, A., P. N. Ghauri, S. Yeniyurt and S. T. Cavusgil,2015, “Establishing rigor in mail-survey procedures ininternational business research”. Journal of World Business,50: 26–35.
Response Rates in Family Business Research
© 2019 The AuthorsEuropean Management Review published by John Wiley & Sons Ltd on behalf of European Academy of Management(EURAM)
343
Chrisman, J. J., J. H. Chua, F. W. Kellermanns, C. F.Matherne III and B. J. Debicki, 2008, “Managementjournals as venues for publication of family businessresearch”. Entrepreneurship Theory and Practice, 32: 927–934.
Chua, J. H., J. J. Chrisman and P. Sharma, 1999, “Defining thefamily business by behavior”. Entrepreneurship: Theory andPractice, 23: 19–40.
Cohen, J., 1988. Statistical power analysis for the behavioralsciences, 2nd ed. Hillsdale, N.J: L. Erlbaum Associates.
Cook, C., F. Heath and R. L. Thompson, 2000, “A meta-analysis of response rates in web- or internet-based surveys”.Educational and Psychological Measurement, 60: 821–836.
Cycyota, C. S. and D. A. Harrison, 2002, “Enhancing surveyresponse rates at the executive level. Are employee- orconsumer-level techniques effective?” Journal ofManagement, 28: 151–176.
Cycyota, C. S. and D. A. Harrison, 2006, “What (not) to expectwhen surveying executives”. Organizational ResearchMethods, 9: 133–160.
DeMassis, A., J. Kotlar, P. Mazzola, T. Minola and S. Sciascia,2018, “Conflicting selves. Family owners’ multiple goals andself-control agency problems in private firms”.Entrepreneurship Theory and Practice, 42: 362–389.
Dennis, W. J., 2003, “Raising response rates in mail surveys ofsmall business owners. Results of an experiment”. Journal ofSmall Business Management, 41: 278–295.
Derfuss, K., 2016, “Reconsidering the participative budgeting–performance relation: A meta-analysis regarding the impact oflevel of analysis, sample selection, measurement, and industryinfluences”. The British Accounting Review, 48: 17–37.
Deutskens, E., K. de Ruyter, M. Wetzels and P. Oosterveld,2004, “Response rate and response quality of internet-basedsurveys. An experimental study”.Marketing Letters, 15: 21–36.
Dibrell, C. and E.Memili, 2019. “A brief history and a look to thefuture of family business heterogeneity: An introduction”. In E.Memili and C. Dibrell (eds.), The Palgrave handbook ofheterogeneity among family firms. Cham: SpringerInternational Publishing, pp. 1–15.
Dillman, D. A., J. D. Smyth and L.M.Christian, 2014. Internet,phone, mail, and mixed-mode surveys. The tailored designmethod, 4th ed. Hoboken: Wiley.
Dormann, C. F., J. Elith, S. Bacher, C. Buchmann, G. Carl, G.Carré, J. R. G. Marquéz, B. Gruber, B. Lafourcade, P. J.Leitão, T. Münkemüller, C. McClean, P. E. Osborne, B.Reineking, B. Schröder, A. K. Skidmore, D. Zurell and S.Lautenbach, 2013, “Collinearity. A review of methods todeal with it and a simulation study evaluating theirperformance”. Ecography, 36: 27–46.
Edwards, P., I. Roberts, M. Clarke, C. DiGuiseppi, S. Pratap,R. Wentz and I. Kwan, 2002, “Increasing response rates topostal questionnaires. Systematic review”. British MedicalJournal, 324: 1183.
European Commission, 2003, May 20, 2003, “Commissionrecommendation of 6 may 2003 concerning the definition ofmicro, small and medium-sized enterprises”. Official Journalof the European Union, 46: 36–41.
Evert, R. E., J. A. Martin, M. S. McLeod and G. T. Payne,2016, “Empirics in family business research. Progress,challenges, and the path ahead”. Family Business Review, 29:17–43.
Fan,W. andZ. Yan, 2010, “Factors affecting response rates of theweb survey. A systematic review”. Computers in HumanBehavior, 26: 132–139.
Foster Thompson, L. and E. A. Surface, 2016, “Employeesurveys administered online”. Organizational ResearchMethods, 10: 241–261.
Fox, R. J.,M. R. Crask and J. Kim, 1988, “Mail survey responserate. A meta-analysis of selected techniques for inducingresponse”. Public Opinion Quarterly, 52: 467–491.
Frohlich, M. T., 2002, “Techniques for improving response ratesin OM survey research”. Journal of Operations Management,20: 53–62.
Ge, J., M. Carney and F. Kellermanns, 2019, “Who fillsinstitutional voids? Entrepreneurs’ utilization of political andfamily ties in emerging markets”. Entrepreneurship Theoryand Practice, 43: 1124–1147. https://doi.org/10.1177/1042258718773175
Hair, J. F., W. C. Black, B. J. Babin and R. E. Anderson, 2014.Multivariate data analysis. Pearson new international edition,7th ed. Upper Saddle River, NJ: Prentice Hall.
Heberlein, T. A. and R. Baumgartner, 1978, “Factors affectingresponse rates to mailed questionnaires. A quantitativeanalysis of the published literature”. American SociologicalReview, 43: 447-462.
Hiebl, M. R. and Z. Li, 2018, “Non-family managers in familyfirms: Review, integrative framework and future researchagenda”. Review of Managerial Science, forthcoming. https://doi.org/10.1007/s11846-018-0308-x.
Hiebl, M. R. W. and J. F. Richter, 2018, “Response rates inmanagement accounting survey research”. Journal ofManagement Accounting Research, 30: 59–79.
Horton, N. J., S. R. Lipsitz and M. Parzen, 2003, “A potentialfor bias when rounding in multiple imputation”. The AmericanStatistician, 57: 229–232.
IFERA, 2003, “Family businesses dominate. Families are the keyplayers around the world, but prefer the backstage positions”.Family Business Review, 16: 235–239.
Keusch, F., 2015, “Why do people participate in web surveys?Applying survey participation theory to internet survey datacollection”. Management Review Quarterly, 65: 183–216.
Khamis, H. J. and M. Kepler, 2010, “Sample size in multipleregression: 20+ 5k”. Journal of Applied Statistical Science,17: 505–517.
Klein, S. B. and F.-A. Bell, 2007, “Non-family executives infamily businesses. A literature review”. Electronic Journal ofFamily Business Studies, 1: 19–37.
Kleinknecht, A., 1989, “Firm size and innovation”. SmallBusiness Economics, 1: 215–222.
Kotey, B. and C. Folker, 2007, “Employee training in SMEs.Effect of size and firm type-family and nonfamily”. Journal ofSmall Business Management, 45: 214–238.
Landers, R. N. and T. S. Behrend, 2015, “An inconvenient truth.Arbitrary distinctions between organizational, mechanical Turk,and other convenience samples”. Industrial and OrganizationalPsychology, 8: 142–164.
Landry, S., A. Fortin and A. Callimaci, 2013, “Family firms andthe lease decision”. Journal of Family Business Strategy, 4:176–187.
Manfreda, K. L., J. Berzelak, V. Vehovar, M. Bosnjak and I.Haas, 2008, “Web surveys versus other survey modes. A
D.I. Pielsticker and M.R.W. Hiebl
© 2019 The AuthorsEuropean Management Review published by John Wiley & Sons Ltd on behalf of European Academy of Management
(EURAM)
344
meta-analysis comparing response rates”. International Journalof Market Research, 50: 79–104.
Mellahi, K. and L. C. Harris, 2016, “Response rates in businessand management research. An overview of current practice andsuggestions for future direction”. British Journal ofManagement, 27: 426–437.
Moers, F., 2007. “Doing archival research in managementaccounting”. In C. S. Chapm, A. G. Hopwood and M. D.Shields (eds.), Handbook of management accounting researchVol. 2. Oxford: Elsevier, pp. 399–413.
Newberry, M. G. and G. D. Israel, 2017, “Comparing twoweb/mail mixed-mode contact protocols to a unimode mailsurvey”. Field Methods, 29: 281–298.
Newby, R., J. Watson and D. Woodliff, 2003, “SME surveymethodology. Response rates, data quality, and costeffectiveness”. Entrepreneurship Theory and Practice, 28:163–172.
Pearce, J. A. II, 2012, “Revising manuscripts for premierentrepreneurship journals”. Entrepreneurship Theory andPractice, 36: 193–203.
Ployhart, R. E. and R. J. Vandenberg, 2010, “Longitudinalresearch. The theory, design, and analysis of change”. Journalof Management, 36: 94–120.
Rauch, A. and I. Hatak, 2016, “A meta-analysis of differentHR-enhancing practices and performance of small andmedium sized firms”. Journal of Business Venturing, 31:485–504.
Rogelberg, S. G. and A. Luong, 1998, “Nonresponse to mailedsurveys: A review and guide”. Current Directions inPsychological Science, 7: 60–65.
Rogelberg, S. G. and J. M. Stanton, 2007, “Understanding anddealing with organizational survey nonresponse”.Organizational Research Methods, 10: 195–209.
Roth, P. L. and C. A. BeVier, 1998, “Response rates in HRM/OBsurvey research. Norms and correlates, 1990-1994”. Journal ofManagement, 24: 97–117.
Sauermann, H. and M. Roach, 2013, “Increasing web surveyresponse rates in innovation research. An experimental studyof static and dynamic contact design features”. ResearchPolicy, 42: 273–286.
Saunders, M. N. K., 2012, “Web versus mail. The influence ofsurvey distribution mode on Employees’ response”. FieldMethods, 24: 56–73.
Shannon, D. M. and C. C. Bradshaw, 2002, “A comparison ofresponse rate, response time, and costs of mail and electronicsurveys”. The Journal of Experimental Education, 70:179–192.
Sharma, P., 2004, “An overview of the field of family businessstudies: Current status and directions for the future”. FamilyBusiness Review, 17: 1–36.
Sharma, P., D. Shepherd and D. R. Bagby, 2017,“Preconceptions, lessons learned, and other changes. ThreeEditors’ journeys”. Family Business Review, 30: 314–319.
Shih, T.-H. and X. Fan, 2008, “Comparing response rates fromweb and mail surveys. A meta-analysis”. Field Methods, 20:249–271.
Short, J. C., P. Sharma, G. T. Lumpkin and A. W. Pearson,2016, “Oh, the places We’ll go! Reviewing past, present, andfuture possibilities in family business research”. FamilyBusiness Review, 29: 11–16.
Singer, E. and C. Ye, 2013, “The use and effects of incentives insurveys”. The Annals of the American Academy of Political andSocial Science, 645: 112–141.
Speckbacher, G. and P. Wentges, 2012, “The impact of familycontrol on the use of performance measures in strategic targetsetting and incentive compensation. A research note”.Management Accounting Research, 23: 34–46.
Speklé, R. F. and S. K. Widener, 2018, “Challenging issues insurvey research. Discussion and suggestions”. Journal ofManagement Accounting Research, 30: 3–21.
Stamm, I. and C. Lubinski, 2011, “Crossroads of familybusiness research and firm demography. A critical assessmentof family business survival rates”. Journal of Family BusinessStrategy, 2: 117–127.
Steiger, T., C. Duller and M. R. W. Hiebl, 2015, “No consensusin sight: An analysis of ten years of family business definitionsin empirical research studies”. Journal of Enterprising Culture,23: 25–62.
Tabachnick, B. G. and L. S. Fidell, 2007. Using multivariatestatistics, 5th ed. Boston, MA: Pearson International.
Tabor, W., J. J. Chrisman, K. Madison and J. M. Vardaman,2018, “Nonfamily members in family firms. A review andfuture research agenda”. Family Business Review, 31: 54–79.
The American Association for Public Opinion Research, 2016,“Standard Definitions: Final Dispositions of Case Codes andOutcome Rates for Surveys.” 9th edition. AAPOR.
Toepoel, V., M. Das and A. van Soest, 2009, “Design of webQuestionnaires. The effects of the number of items perscreen”. Field Methods, 21: 200–213.
van der Stede, W. A., S. M. Young and C. X. Chen, 2005,“Assessing the quality of evidence in empirical managementaccounting research. The case of survey studies”. Accounting,Organizations and Society, 30: 655–684.
Wilson, S. R., J. G. Whitmoyer, T. M. Pieper, J. H. Astrachan,J. F. Hair andM. Sarstedt, 2014, “Method trends and methodneeds. Examining methods needed for accelerating the field”.Journal of Family Business Strategy, 5: 4–14.
Windolph, M. and K. Moeller, 2012, “Open-book accounting.Reason for failure of inter-firm cooperation?” ManagementAccounting Research, 23: 47–60.
Woods, A. and P. Joyce, 2016, “Owner-managers and thepractice of strategic management”. International SmallBusiness Journal, 21: 181–195.
Yammarino, F. J., S. J. Skinner and T. L. Childers, 1991,“Understanding mail survey response behavior. A meta-analysis”. Public Opinion Quarterly, 55: 613–639.
Response Rates in Family Business Research
© 2019 The AuthorsEuropean Management Review published by John Wiley & Sons Ltd on behalf of European Academy of Management(EURAM)
345
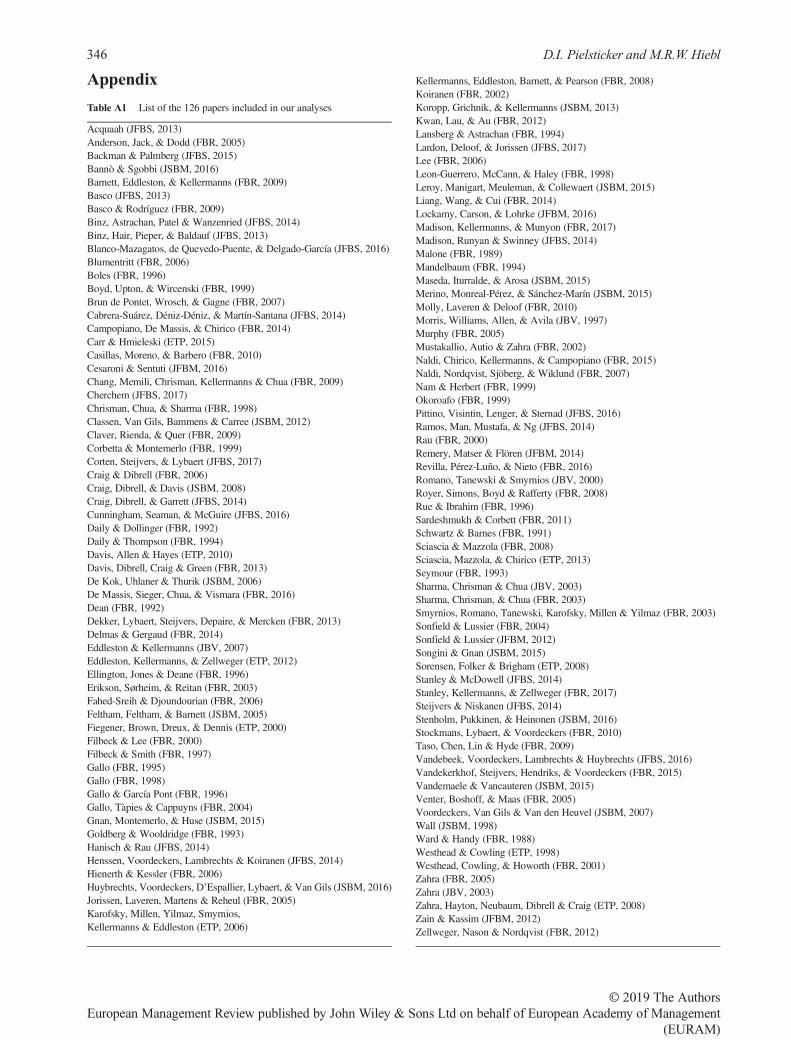
Appendix
Table A1 List of the 126 papers included in our analyses
Acquaah (JFBS, 2013)Anderson, Jack, & Dodd (FBR, 2005)Backman & Palmberg (JFBS, 2015)Bannò & Sgobbi (JSBM, 2016)Barnett, Eddleston, & Kellermanns (FBR, 2009)Basco (JFBS, 2013)Basco & Rodríguez (FBR, 2009)Binz, Astrachan, Patel & Wanzenried (JFBS, 2014)Binz, Hair, Pieper, & Baldauf (JFBS, 2013)Blanco-Mazagatos, de Quevedo-Puente, & Delgado-García (JFBS, 2016)Blumentritt (FBR, 2006)Boles (FBR, 1996)Boyd, Upton, & Wircenski (FBR, 1999)Brun de Pontet, Wrosch, & Gagne (FBR, 2007)Cabrera-Suárez, Déniz-Déniz, & Martín-Santana (JFBS, 2014)Campopiano, De Massis, & Chirico (FBR, 2014)Carr & Hmieleski (ETP, 2015)Casillas, Moreno, & Barbero (FBR, 2010)Cesaroni & Sentuti (JFBM, 2016)Chang, Memili, Chrisman, Kellermanns & Chua (FBR, 2009)Cherchem (JFBS, 2017)Chrisman, Chua, & Sharma (FBR, 1998)Classen, Van Gils, Bammens & Carree (JSBM, 2012)Claver, Rienda, & Quer (FBR, 2009)Corbetta & Montemerlo (FBR, 1999)Corten, Steijvers, & Lybaert (JFBS, 2017)Craig & Dibrell (FBR, 2006)Craig, Dibrell, & Davis (JSBM, 2008)Craig, Dibrell, & Garrett (JFBS, 2014)Cunningham, Seaman, & McGuire (JFBS, 2016)Daily & Dollinger (FBR, 1992)Daily & Thompson (FBR, 1994)Davis, Allen & Hayes (ETP, 2010)Davis, Dibrell, Craig & Green (FBR, 2013)De Kok, Uhlaner & Thurik (JSBM, 2006)De Massis, Sieger, Chua, & Vismara (FBR, 2016)Dean (FBR, 1992)Dekker, Lybaert, Steijvers, Depaire, & Mercken (FBR, 2013)Delmas & Gergaud (FBR, 2014)Eddleston & Kellermanns (JBV, 2007)Eddleston, Kellermanns, & Zellweger (ETP, 2012)Ellington, Jones & Deane (FBR, 1996)Erikson, Sørheim, & Reitan (FBR, 2003)Fahed-Sreih & Djoundourian (FBR, 2006)Feltham, Feltham, & Barnett (JSBM, 2005)Fiegener, Brown, Dreux, & Dennis (ETP, 2000)Filbeck & Lee (FBR, 2000)Filbeck & Smith (FBR, 1997)Gallo (FBR, 1995)Gallo (FBR, 1998)Gallo & García Pont (FBR, 1996)Gallo, Tàpies & Cappuyns (FBR, 2004)Gnan, Montemerlo, & Huse (JSBM, 2015)Goldberg & Wooldridge (FBR, 1993)Hanisch & Rau (JFBS, 2014)Henssen, Voordeckers, Lambrechts & Koiranen (JFBS, 2014)Hienerth & Kessler (FBR, 2006)Huybrechts, Voordeckers, D’Espallier, Lybaert, & Van Gils (JSBM, 2016)Jorissen, Laveren, Martens & Reheul (FBR, 2005)Karofsky, Millen, Yilmaz, Smyrnios,Kellermanns & Eddleston (ETP, 2006)
Kellermanns, Eddleston, Barnett, & Pearson (FBR, 2008)Koiranen (FBR, 2002)Koropp, Grichnik, & Kellermanns (JSBM, 2013)Kwan, Lau, & Au (FBR, 2012)Lansberg & Astrachan (FBR, 1994)Lardon, Deloof, & Jorissen (JFBS, 2017)Lee (FBR, 2006)Leon-Guerrero, McCann, & Haley (FBR, 1998)Leroy, Manigart, Meuleman, & Collewaert (JSBM, 2015)Liang, Wang, & Cui (FBR, 2014)Lockamy, Carson, & Lohrke (JFBM, 2016)Madison, Kellermanns, & Munyon (FBR, 2017)Madison, Runyan & Swinney (JFBS, 2014)Malone (FBR, 1989)Mandelbaum (FBR, 1994)Maseda, Iturralde, & Arosa (JSBM, 2015)Merino, Monreal-Pérez, & Sánchez-Marín (JSBM, 2015)Molly, Laveren & Deloof (FBR, 2010)Morris, Williams, Allen, & Avila (JBV, 1997)Murphy (FBR, 2005)Mustakallio, Autio & Zahra (FBR, 2002)Naldi, Chirico, Kellermanns, & Campopiano (FBR, 2015)Naldi, Nordqvist, Sjöberg, & Wiklund (FBR, 2007)Nam & Herbert (FBR, 1999)Okoroafo (FBR, 1999)Pittino, Visintin, Lenger, & Sternad (JFBS, 2016)Ramos, Man, Mustafa, & Ng (JFBS, 2014)Rau (FBR, 2000)Remery, Matser & Flören (JFBM, 2014)Revilla, Pérez-Luño, & Nieto (FBR, 2016)Romano, Tanewski & Smyrnios (JBV, 2000)Royer, Simons, Boyd & Rafferty (FBR, 2008)Rue & Ibrahim (FBR, 1996)Sardeshmukh & Corbett (FBR, 2011)Schwartz & Barnes (FBR, 1991)Sciascia & Mazzola (FBR, 2008)Sciascia, Mazzola, & Chirico (ETP, 2013)Seymour (FBR, 1993)Sharma, Chrisman & Chua (JBV, 2003)Sharma, Chrisman, & Chua (FBR, 2003)Smyrnios, Romano, Tanewski, Karofsky, Millen & Yilmaz (FBR, 2003)Sonfield & Lussier (FBR, 2004)Sonfield & Lussier (JFBM, 2012)Songini & Gnan (JSBM, 2015)Sorensen, Folker & Brigham (ETP, 2008)Stanley & McDowell (JFBS, 2014)Stanley, Kellermanns, & Zellweger (FBR, 2017)Steijvers & Niskanen (JFBS, 2014)Stenholm, Pukkinen, & Heinonen (JSBM, 2016)Stockmans, Lybaert, & Voordeckers (FBR, 2010)Taso, Chen, Lin & Hyde (FBR, 2009)Vandebeek, Voordeckers, Lambrechts & Huybrechts (JFBS, 2016)Vandekerkhof, Steijvers, Hendriks, & Voordeckers (FBR, 2015)Vandemaele & Vancauteren (JSBM, 2015)Venter, Boshoff, & Maas (FBR, 2005)Voordeckers, Van Gils & Van den Heuvel (JSBM, 2007)Wall (JSBM, 1998)Ward & Handy (FBR, 1988)Westhead & Cowling (ETP, 1998)Westhead, Cowling, & Howorth (FBR, 2001)Zahra (FBR, 2005)Zahra (JBV, 2003)Zahra, Hayton, Neubaum, Dibrell & Craig (ETP, 2008)Zain & Kassim (JFBM, 2012)Zellweger, Nason & Nordqvist (FBR, 2012)
D.I. Pielsticker and M.R.W. Hiebl
© 2019 The AuthorsEuropean Management Review published by John Wiley & Sons Ltd on behalf of European Academy of Management
(EURAM)
346