Embed Size (px)
Citation preview
European Commission, Directorate General XIII, Information Society: Telecommunications, Markets, Technologies – Innovation and Exploitation of Research
CAPE Project
(TR 4101/ IN 4101)
SURVEY ON TELEMATICS APPLICATIONS
IN CENTRAL EUROPEAN COUNTRIES
DELIVERABLE D 2.4 PART 1: TRANSPORT
Authors:
Siegfried Rupprecht & Ludger Rogge Kemperbachstraße 55
D - 51069 Köln Germany
Tel. +49.221.689.72.54 Fax +49.221.689.72.55
Email [email protected]
February 1999
R U P P R E C H T C O N S U L T — FORSCHUNG & BERATUNG GMBH —
CAPE PROJECT – TRANSPORT TELEMATICS SURVEY (CEEC)
T A B L E O F C O N T E N T S
EXECUTIVE SUMMARY............................................................................................................. 6
1 INTRODUCTION ............................................................................................................... 10
1.1 CONTEXT OF THE REPORT .......................................................................................................... 10
1.2 METHODOLOGICAL BACKGROUND OF THE SURVEY ........................................................ 11
1.3 SURVEY RESPONSE ......................................................................................................................... 11
2 FACTUAL INFORMATION ON THE TRANSPORT SYSTEM ...................................... 12
2.1 MODAL SPLIT .................................................................................................................................... 12
2.2 CAR-OWNERSHIP ............................................................................................................................. 13
2.3 PUBLIC TRANSPORT PASSENGERS ............................................................................................ 14
2.4 AIR QUALITY LEVELS .................................................................................................................... 14
2.5 PUBLIC TRANSPORT AUTHORITES ........................................................................................... 15
2.6 SUMMARY .......................................................................................................................................... 16
3 KEY TRANSPORT PROBLEMS AND POLICY AREAS .................................................. 16
3.1 KEY TRANSPORT PROBLEMS ...................................................................................................... 17
3.2 SUMMARY .......................................................................................................................................... 20
4 POLICY AREAS .................................................................................................................... 21
4.1 SUMMARY .......................................................................................................................................... 23
5 IMPACT AND RELEVANCE OF TECHNOLOGY .......................................................... 24
5.1 IMPACTS OF TELEMATICS TECHNOLOGIES ON TRANSPORT ......................................... 24
5.2 PERSONAL LEVEL OF EXPERTISE ............................................................................................. 25
5.3 SUMMARY .......................................................................................................................................... 26
6 EXPECTED BENEFITS AND OBSTACLES OF USING INFORMATION AND COMMUNICATION TECHNOLOGIES .................................................................................. 27
6.1 BENEFITS ............................................................................................................................................ 27
6.2 OBSTACLES ....................................................................................................................................... 27
6.3 SUMMARY .......................................................................................................................................... 28
7 INTERNAL USE OF TELEMATICS SYSTEMS ............................................................... 28
7.1 DATA AVAILABILITY...................................................................................................................... 28
7.2 TECHNOLOGIES FOR MANAGING TRAFFIC ........................................................................... 30
7.3 INHOUSE TELEMATICS SUPPORT FOR TRANSPORT MANAGEMENT TASKS .............. 32
7.4 BASIC TECHNOLOGIES .................................................................................................................. 34
7.5 SUMMARY .......................................................................................................................................... 36
8 DELIVERY OF PUBLIC SERVICES/ AND EXTERNAL COMMUNICATION ........... 37
8.1 INFORMATION SERVICES ............................................................................................................. 37
8.2 TECHNICAL PLATFORMS ............................................................................................................. 39
8.3 SUMMARY .......................................................................................................................................... 40
9 FINANCING OF TRANSPORT TECHNOLOGIES AND SERVICES ........................... 40
10 EUROPEAN INTEGRATION ............................................................................................ 41
CAPE PROJECT – TRANSPORT TELEMATICS SURVEY (CEEC)
3
11 FUTURE INTERESTS ........................................................................................................ 42
11.1 TELEMATICS APPLICATIONS ...................................................................................................... 42
11.2 TECHNOLOGIES ............................................................................................................................... 44
11.3 INFRASTRUCTURE RELATED ISSUES ....................................................................................... 45
11.4 POLICY RELATED ISSUES ............................................................................................................. 45
11.5 FORMATS FOR MEETINGS ............................................................................................................ 45
11.6 SUMMARY .......................................................................................................................................... 46
ANNEX I: PROCEDURES FOR THE QUESTIONNAIRE SURVEY .................................... 47
DATABASE CREATION ............................................................................................................................ 47
SELECTION PROCESS .............................................................................................................................. 47
MAILING AND DATA ENTRY ................................................................................................................. 48
ANNEX II: SURVEY RESPONSE AND REPRESENTATIVENESS ...................................... 49
SUMMARY ................................................................................................................................................... 53
ANNEX III: QUESTIONNAIRE ON TRANSPORT TELEMATICS IN CEEC .................... 54

CAPE PROJECT – TRANSPORT TELEMATICS SURVEY (CEEC)
4
T A B L E O F F I G U R E S
Figure 1: Modal split 1997 (by authority size) 13
Figure 2: Average number of cars per 1000 inhabitants (by region) 13
Figure 3: Decrease of public transport passengers between 1995 and 1997 (by authority size) 14
Figure 4: Percentage of authorities having critical air quality levels in the last 12 months (by authority size and region) 15
Figure 5: Institutional functioning of Public transport (by order of EU accession) 16
Figure 6: Most pressing transport problems (by order of EU-accession) 17
Figure 7: Problems which can be solved in the next 2-3 years (by region) 18
Figure 8: Problems which will take many years to be solved (by region) 19
Figure 9: Future priorities in transport policies (by -region) 20
Figure 10: Existence of a comprehensive transport plan (by authority size and region) 21
Figure 11: Transport policies in operation (by order of accession and authority size) 22
Figure 12: Personal judgement of the efficiency of transport policies (by region) 23
Figure 13: Expected significant impacts of telematics use in transport policies (by region) 25
Figure 14: Personal level of expertise in transport telematics application (by authority size and region) 26
Figure 15: Transport related data sufficiently available (by authority size and region) 29
Figure 16: Future priorities in acquisition of transport related data (authority size and region) 30
Figure 17: Technologies for managing traffic partly available (by authority size and region) 31
Figure 18: Future priorities for using technologies for traffic management (by authority size and region) 32
Figure 19: In-house telematics applications partly used or on a trial basis (by authority size and CEEC-region) 33
Figure 20: Future priorities for in-house telematics applications (by CEEC-region and city size) 34
Figure 21: Basic technologies (by city size and region) 35
Figure 22: Future priorities in basic technology implementation 36
Figure 23: Status of information service provision (by authority size and region) 38
Figure 24: Future priorities of information service provision (by authority size and region) 39
Figure 25: Technical platforms for information service delivery 40
Figure 26: Financing of transport technologies and services (by order of EU-accession) 41
Figure 27: Expected consequences of EU-accession 42
Figure 28: Future interests in telematics applications 43
Figure 29: Future interests in telematics applications (by authority size) 44
Figure 30: Future interests in technology applications (by authority size) 44
Figure 31: Future interests in infrastructure related issues (by authority size) 45
Figure 32: Expected formats for meetings 46
Figure 33: Sample size and response rate 49
Figure 34: Survey sample (by country) 50

CAPE PROJECT – TRANSPORT TELEMATICS SURVEY (CEEC)
5
Figure 35: Authority size in sample (by-region) 50
Figure 36: Representativeness of the survey sample 51
Figure 37: Institutional function of the authorities responding (by authority size) 52
Figure 38: Responsibility of persons having responded (by region) 53
CAPE PROJECT – TRANSPORT TELEMATICS SURVEY (CEEC)
6
EXECUTIVE SUMMARY
Context of the report
CAPE (Co-ordinated Action for Pan-European Transport and Environment Telematics Implementation Support) is a European Union (EU) funded project that aims to encourage the greater use of telematics technologies in Western, Central and Eastern Europe.
One key objective of CAPE is to survey the needs and priorities among CEE and EU local and regional authorities for transport and environment telematics solutions.
Within Work Package 2 of the CAPE project a qualitative examination of the organisational, technical and legal frameworks for transport and environment telematics among local authorities and related policies and priorities has been realised for each of the EU accession countries (Country Reports).
Additionally three quantitative (questionnaire) surveys of the status and priorities for telematics solutions in CEE and the EU were realised:
Survey on Transport Telematics Applications in CEEC
Survey on Environment Telematics Applications in CEEC
Survey on Environment Telematics Applications in EU
This report comprises the results of the survey analysis on Transport Telematics in Central and Eastern Europe. The survey on Transport Telematics Applications in CEEC gives for the first time a comprehensive overview of the use and priorities of Transport Telematics Applications in transport authorities in 10 Central and East European Countries. The results are based on a questionnaire which was sent in 10 languages to 851 local and regional authorities in Central and East European Countries. The mailing was based on a genuinely researched and representative database of decision-makers.
Survey response
229 authorities (27%) responded to this questionnaire. The survey can be considered as reasonably representative in terms of different authority size segments. The Baltic States are over-represented, while South-East Europe is under-represented due to unexpectedly high/low response rates. However results are presented separately by geographical regions and by different authority size segments, whenever significant differences became apparent between subsets of the sample. Thereby imbalances in geographic representativeness are adjusted.
Factual information on the transport system
The transport situation in CEE authorities is characterised by:
Compared to many EU authorities, high levels of public transport use, which are dropping quickly.
High increase of car ownership.
More than 20% of the large authorities had air quality incidents in 1997, although air quality standards are below EU-levels.
In over half of the authorities, public transport is operated by private companies (although these are for the most part public sector controlled).
CAPE PROJECT – TRANSPORT TELEMATICS SURVEY (CEEC)
7
Key transport problems
The most important transport problems in CEEC authorities at long term are those related to transport infrastructure (especially the condition of roads and public transport vehicles as well as associated funding difficulties). 61% of the authorities pointed out that the low condition and maintenance of roads is an important problem, that needs many years to be solved. Other important long-term problems are “lack of parking spaces” and “low quality of rolling stock and infrastructure”. At short term, the “lack of traffic information for divers and travellers” and “low efficiency of traffic management” are the most acute transport problems. To improve road conditions and generally the quality of infrastructure and to increase parking capacity in inner city areas are the by far highest priorities in future transport policies. Problems like traffic congestion and pollution, which are predominant in EU authorities, are still perceived to play a minor role.
Policy areas
At the same time there is a lack of transport planning indicated by the fact that only 26% of the CEEC authorities have comprehensive transport plans. However it can be expected, that this situation will change, particularly in large authorities. Many CEEC authorities see already the need for elaborating a comprehensive transport and land use plan (44%), and developing new strategies for traffic management (37%). In addition, decision makers express that considerable progress has been made through new (sectoral) policies, but many are concerned about the time required and the difficulty to address the real driving forces.
Impact and relevance of technology
The problem solving capacity of telematics solutions in transport is considered to be lower in the local and regional authorities of CEE as compared to the EU. However, CEEC authorities believe that telematics systems might be useful to solve especially important short-term transport problems. The most significant impact of telematics tools is seen in improving the access to mobility information and services, which was indicated by 36% of the authorities. Additionally, CEEC decision-makers believe, that telematics can help improving the quality of public transport services, the efficiency of freight delivery and traffic safety, as well as several other problems. Significant impacts of telematics are generally expected by around 20-25% of the authorities. The order of relevance in the CEEC is similar to statements in the EU.
The somewhat more critical attitude towards the potentials of telematics systems in the CEEC, is partly due to the generally low level of expertise in applying telematics. Only 35% of the decision-makers stated that they have at least a good understanding of some key areas. Authorities are lacking training and education facilities for their administrative staff. Other obstacles for a better telematics uptake in the transport field apart from insufficient public funds are lacking data or information for new services and problems of institutional and inter-departmental co-operation.
The main benefits of using telematics are expected to be a generally higher quality of transport services, greater cost-efficiency, and improved planning and decision-making. Although CEEC decision makers are less clear about benefits and obstacles overall trends are similar to the EU.
Internal use of telematics systems
The current level of internal use of telematics systems is for many authorities poor. Basic pre-conditions for a telematics uptake within the next years are still missing. Especially in small authorities as well as in authorities in South-East Europe and the Baltic States, the framework conditions for a better use of telematics systems are in most urgent need of improvement.
The availability of transport related data is often insufficient. Data availability is best for the “current position of buses/trams in the network” and “free parking places”, for which half of the authorities mentioned that data is sufficiently available. Most data is available in large authorities. These in particular
CAPE PROJECT – TRANSPORT TELEMATICS SURVEY (CEEC)
8
are planning to improve on their information background of current transport situations.
The use of telematics for managing traffic is not very widespread. Above average are large authorities. Among the technologies which are at least partly used, centralised traffic signal control (23%), flexible signal plans, public transport priority and traffic sensors (each 20%) are the most widely employed technologies.
Other technologies such as VMS and automatic scheduling of trams are used by only 11% or less. Most CEEC authorities have plans to apply telematics for traffic management in the future. The major priorities are related to road traffic, i.e. in the areas of: “central traffic signal control”, “flexible signal plans” and “automatic co-ordination of urban and regional traffic”.
In-house telematics systems to support the tasks of transport planning and management are not widely spread.
Telematics applications for “road maintenance or construction planning”1 are used by 40% of the authorities and for transport demand planning by 36%. Other tasks like “signal plans definition/operations” and “road side equipment/ surveillance” are supported by telematics systems in only one fourth of the authorities. Approximately 60% of the authorities have the intention to increase the use of telematics for a better road maintenance and construction planning and for improving transport demand planning. The interest for telematics applications generally is higher in medium-sized and large authorities, except for “road maintenance and construction planning”.
Basic technologies, such as Internet, e-mail and mobile telephony (GSM) are used by one third of the authorities. Although considerably lower than in the EU, this indicates a very high level of new basic tools by CEEC authorities, even if deployment levels within administrations are still low. Other more sophisticated technical systems, like smart cards, Geographic Information Systems (GIS) or satellite based positioning are used by not more than 5% of all CEEC authorities. GIS, Internet/e-mail and smart cards are seen by more than half of the authorities as basic technologies which have priority for further use.
Delivery of public services/ and external communication
Although few dedicated transport information “services” may exist in the CEEC, many decision –makers claim to deliver information on a range of issues (around 60% for most items), most notably on current road works and other incidents. For the future, priorities are again on real-time road user information (parking spaces and traffic conditions).
The most important technical platforms, which are used by authorities to deliver these information services are radio and television as well as telephone and fax. VMS based information dissemination is extremely low (9%). Internet services are more common than VMS. In order to achieve a greater use of transport related information services, the technical preconditions for CEEC authorities (especially for smaller ones) need to be improved.
Future interests
The survey identifies future interests of transport authorities, with regard to the conferences and workshops, to be prepared by the CAPE project. CEEC authorities have stated high interest for a broad variety of areas. Highest: interest is identified for “traffic calming (speed control)”, “parking management”, “real-time public transport information” and “public transport vehicle scheduling and control”. Medium-sized and large authorities generally are more interested in learning about telematics applications. In addition to that, CEEC authorities are particularly interested in using telematics for road maintenance and construction planning.
1 Although the relevance of this particular statement appears to be clearly influenced by a very wide understanding of “information and communication technologies”.

CAPE PROJECT – TRANSPORT TELEMATICS SURVEY (CEEC)
9
Specific interests in technologies is highest for “real-time data acquisition”, VMS, Geographic Information Systems (GIS) and data exchange. The demand of learning more about these technologies is above average in large authorities.
The relevance of dissemination formats planned by CAPE (especially good practice guidelines, targeted training sessions) has been confirmed by high ratings from the target group.

CAPE PROJECT – TRANSPORT TELEMATICS SURVEY (CEEC)
10
1 INTRODUCTION
1.1 CONTEXT OF THE REPORT
While considerable knowledge is available for transport telematics-related issues in the EU, for the area of environment telematics the empirical basis is unsatisfactory. For Central and Eastern European Countries (CEEC) no information on the current status and framework of telematics implementation is available so far.
CAPE (Co-ordinated Action for Pan –European Transport and Environment Telematics Implementation Support) is a European Union (EU) funded project that aims to encourage the greater use of telematics technologies in Western, Central and Eastern Europe. The project intends to generate a number of products that will serve both local governments across Europe, and help the European Commission increase the implementation of IT (information technology) solutions at the municipal and district level.
CAPE’s goals are twofold:
First, the project aims to benefit local authorities in Central and Eastern Europe (CEE) and the EU by raising their awareness to telematics applications and facilitating their implementation at the local level.
In CEE, those public authorities who have an immediate need for applying efficient and low-cost telematics systems in the areas of transport and environment are being targeted, while in the EU, those who are for a large part not yet fully aware of the potentials of advanced environmental telematics for improving environmental management in their jurisdiction, will aim to be reached by CAPE.
Project results will be disseminated through:
completion of a best practice inventory in environment and transport telematics
conferences serving as dissemination events, and
workshops that serve as an opportunity to exchange information and experiences and build networks between the EU and CEE.
an Internet webpage which serves as part of the related dissemination activities (www/rec.org/REC/Programs/Telematics/CAPE/CAPE.html)
Secondly, CAPE will survey the needs and priorities among CEE and EU local and regional authorities for transport and environment telematics solutions and through this, encourage future involvement in the European Union’s 5th Research and Technological Development (RTD) Framework Programme (FP).
Within Work Package 2 “Analysis of Status and Framework of Telematics Implementation” of the CAPE project three quantitative (questionnaire) surveys of the status and priorities for telematics solutions in CEE and the EU were realised:
Survey on Transport Telematics Applications in CEEC
Survey on Environment Telematics Applications in CEEC
Survey on Environment Telematics Applications in EU
Complementing these surveys, a qualitative examination of the organisational, technical and legal frameworks for transport and environment telematics among local authorities and related policies and priorities has been conducted for each of the EU accession countries (Country Reports).
CAPE PROJECT – TRANSPORT TELEMATICS SURVEY (CEEC)
11
This report is one element of Work Package 2 and comprises the results of the survey analysis on Transport Telematics in Central and Eastern Europe. The survey on transport telematics is based on a questionnaire, which has been sent to local and regional authorities in ten different countries in CEEC.
1.2 METHODOLOGICAL BACKGROUND OF THE SURVEY
For the mailing of the questionnaire on Transport Telematics in CEEC, the following data sources were used:
Data researched systematically by consortium partners (Regional Environmental Centre, REC (Hungary), Prague Project Institute, PPI (Czech Republic) and Gestionnaires Sans Frontières, GSF (Romania).
Complementary data extracted from the European Local Government Organisation (ELGO) data base.
In order to ensure the representativeness of the survey, approximate target numbers for each country were determined by the relative share of population for each country in relation to overall CEEC population.
The questionnaires were sent out to 851 CEE authorities in September/October 1998. Translations of the questionnaire was prepared for 10 languages.
An ACCESS-data entry mask was supplied by Rupprecht Consult. Data entry was done by GSF and PPI and finished in November 1998.
(for further information on procedures for the questionnaire survey see: Annex I )
1.3 SURVEY RESPONSE
27% (229) of the authorities having received the questionnaire responded to the questionnaire. The response to the CAPE transport survey is considered as representative in terms of authority size overall. In geographical terms authorities from Central Europe are well represented (with the exception of Hungary). However, the representation of authorities from the Baltic states and from South-East Europe is not well balanced, due to above average response rates in Estonia, Latvia and Lithuania and a low response rate in Bulgaria. The survey sample is acceptable with regard to the constitutional role of the authorities. The majority of the responses came from independent authorities which are not part of a larger authority. Respondents are mainly managers or experts from public administration. Only a few questionnaires were answered by members of staff and elected representatives
(for further information on the survey response and representativeness see: Annex II)
CAPE PROJECT – TRANSPORT TELEMATICS SURVEY (CEEC)
12
2 FACTUAL INFORMATION ON THE TRANSPORT SYSTEM
The first part of the questionnaire was designed to provide some information on the status of the transport systems as well as on the level of transport policy action in the CEEC authorities. Before the authorities should state their most important problems related to transport and assess their current status of transport policy action, they were asked to give some factual information on key indicators on the transport system. These refer to:
modal split
number of private cars per thousand inhabitants
number of public transport passengers
critical air quality levels
operation of public transport authority in institutional terms
By means of these indicators, it was intended to not only compare the relative state of the transport systems in different CEEC authorities, but also to see how far an explicit transport policy has been drawn up and implemented.
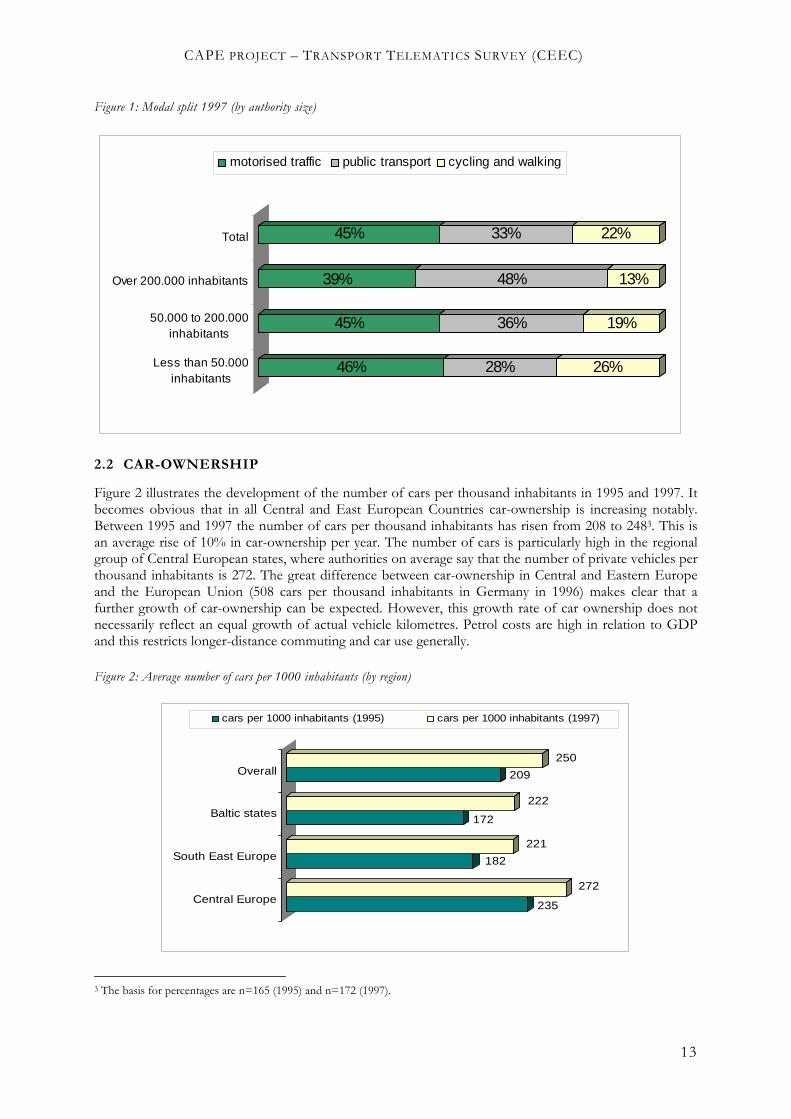
2.1 MODAL SPLIT
The analysis of the modal split of the CEEC authorities in the years 1995 and 1997 clearly shows, that motorised private traffic in all CEEC authorities has increased considerably. In 1997 on average 45% of all daily journeys were made by private motorised vehicles while two years before the modal split of motorised private traffic was only 39%2. Accordingly, the average proportion of daily journeys by public transport has fallen in these two years from 38% to 33%. In contrast, the modal split in most EU authorities remained more constant in recent years: the amount of car traffic in Western European authorities marginally increased or stayed at the same level.
As can be seen in figure 1, modal-split between public transport and motorised private traffic is highly dependent on city size. This is an obvious finding which is mainly due to urban density and land use patterns and which can be observed equally in EU authorities.
Comparing the modal-split of all transport modes (in 1997) it turns out that in authorities below 50.000 inhabitants, the proportion of motorised private traffic is highest (46%) and that of public transport lowest (28%). For large authorities over 200.000 inhabitants the opposite is the case which means that the modal-split for public transport is far above (48%) and for motorised private traffic far below the overall average (39%).
2 Data from 121 up to 137 respondents was available for this question. 101 respondents provided figures to all questions on modal split.
CAPE PROJECT – TRANSPORT TELEMATICS SURVEY (CEEC)
13
Figure 1: Modal split 1997 (by authority size)
46% 28% 26%
45% 36% 19%
39% 48% 13%
45% 33% 22%
Less than 50.000inhabitants
50.000 to 200.000inhabitants
Over 200.000 inhabitants
Total
motorised traffic public transport cycling and walking
2.2 CAR-OWNERSHIP
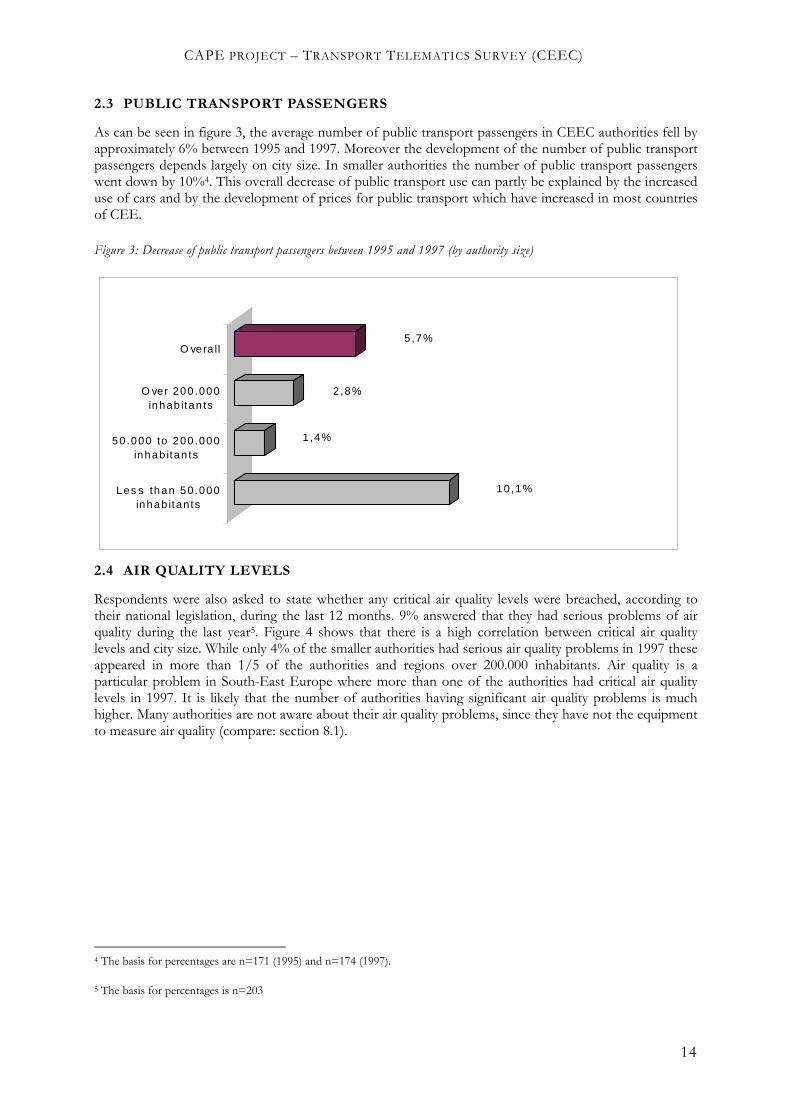
Figure 2 illustrates the development of the number of cars per thousand inhabitants in 1995 and 1997. It becomes obvious that in all Central and East European Countries car-ownership is increasing notably. Between 1995 and 1997 the number of cars per thousand inhabitants has risen from 208 to 2483. This is an average rise of 10% in car-ownership per year. The number of cars is particularly high in the regional group of Central European states, where authorities on average say that the number of private vehicles per thousand inhabitants is 272. The great difference between car-ownership in Central and Eastern Europe and the European Union (508 cars per thousand inhabitants in Germany in 1996) makes clear that a further growth of car-ownership can be expected. However, this growth rate of car ownership does not necessarily reflect an equal growth of actual vehicle kilometres. Petrol costs are high in relation to GDP and this restricts longer-distance commuting and car use generally.
Figure 2: Average number of cars per 1000 inhabitants (by region)
235
272
182
221
172
222
209
250
Central Europe
South East Europe
Baltic states
Overall
cars per 1000 inhabitants (1995) cars per 1000 inhabitants (1997)
3 The basis for percentages are n=165 (1995) and n=172 (1997).
CAPE PROJECT – TRANSPORT TELEMATICS SURVEY (CEEC)
14
2.3 PUBLIC TRANSPORT PASSENGERS
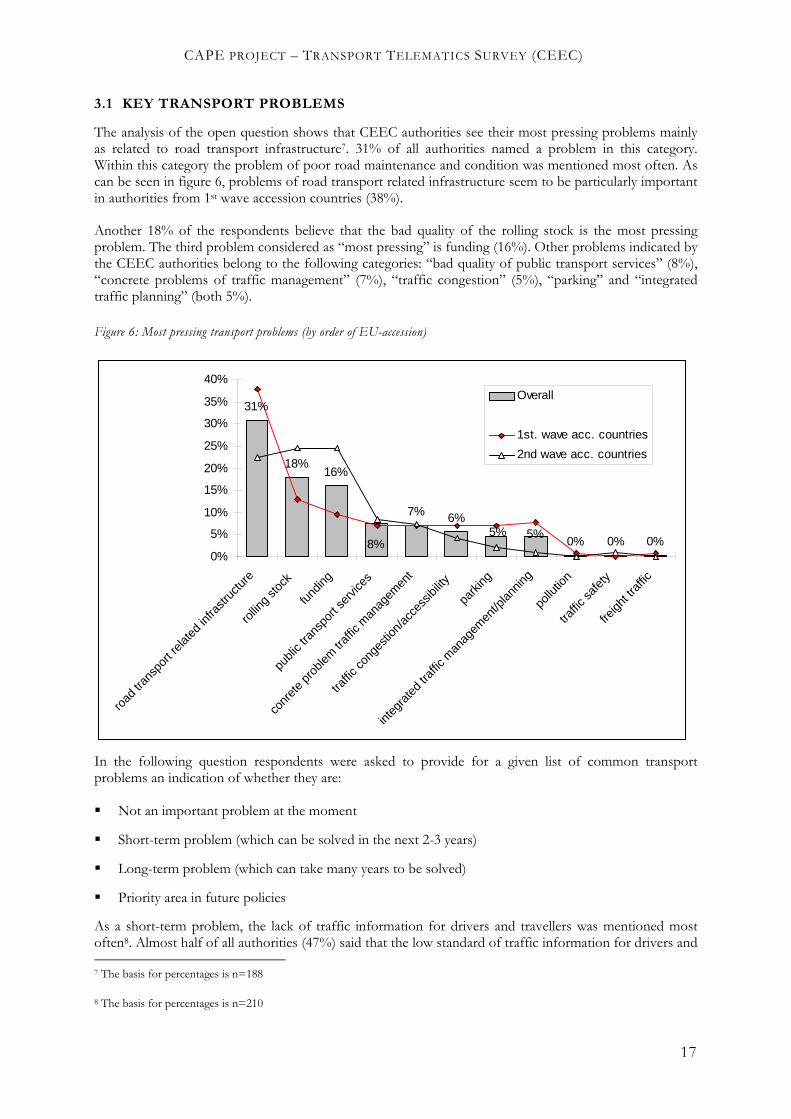
As can be seen in figure 3, the average number of public transport passengers in CEEC authorities fell by approximately 6% between 1995 and 1997. Moreover the development of the number of public transport passengers depends largely on city size. In smaller authorities the number of public transport passengers went down by 10%4. This overall decrease of public transport use can partly be explained by the increased use of cars and by the development of prices for public transport which have increased in most countries of CEE.
Figure 3: Decrease of public transport passengers between 1995 and 1997 (by authority size)
10 ,1%
1,4%
2,8%
5,7%
Les s than 50 .000inhab itan ts
50 .000 to 200 .000inhab itan ts
O ver 200 .000inhab itan ts
O vera ll
2.4 AIR QUALITY LEVELS
Respondents were also asked to state whether any critical air quality levels were breached, according to their national legislation, during the last 12 months. 9% answered that they had serious problems of air quality during the last year5. Figure 4 shows that there is a high correlation between critical air quality levels and city size. While only 4% of the smaller authorities had serious air quality problems in 1997 these appeared in more than 1/5 of the authorities and regions over 200.000 inhabitants. Air quality is a particular problem in South-East Europe where more than one of the authorities had critical air quality levels in 1997. It is likely that the number of authorities having significant air quality problems is much higher. Many authorities are not aware about their air quality problems, since they have not the equipment to measure air quality (compare: section 8.1).
4 The basis for percentages are n=171 (1995) and n=174 (1997).
5 The basis for percentages is n=203

CAPE PROJECT – TRANSPORT TELEMATICS SURVEY (CEEC)
15
Figure 4: Percentage of authorities having critical air quality levels in the last 12 months (by authority size and region)
4%
14%
21%
8%
4%
27%
9%
Les s than 50.000 inhabitants
50.000 to 200.000 inhabitants
O ver 200.000 inhabitants
Central E urope
B alt ic s tates
S outh E as t E urope
O verall
2.5 PUBLIC TRANSPORT AUTHORITES
The last indicator provides some information about how public transport authorities are functioning in institutional terms. In more than 3 out of 5 authorities public transport is fully state or publicly owned and in 39% of all cases respondents answered that public transport is legally operating as a commercial company6. Still more than one third of all respondents claimed that public transport is competing with other (private/public) transport providers.
Comparing 1st and 2nd wave accession countries, it becomes clear that privatisation of public transport in 1st wave accession countries is already much more advanced. In more than half of the authorities from 1st wave accession countries public transport is legally operating as a private company, whereas in only 22% of authorities from 2nd wave accession countries public transport has been fully privatised.
6 The basis for percentages is n=209

CAPE PROJECT – TRANSPORT TELEMATICS SURVEY (CEEC)
16
Figure 5: Institutional functioning of Public transport (by order of EU accession)
31%
34%
32%
52%
24%
39%
55%
75%
64%
0% 20% 40% 60% 80%
1st. wave acc.countries
2nd wave acc.countries
Overallpublic transport: fully state/publicly owned
Legally operating as acommercial company
Competing with other(private) public transportproviders
2.6 SUMMARY
In summary the transport system in CEE countries can be described as follows:
Levels of public transport use are in many authorities still higher than in the EU, but are dropping quickly (6% loss of passengers between 1995 and 1997)
Car ownership has increased by 20% between 1995 and 1997
Although air quality standards are below EU-levels, more than 20% of the large authorities had air quality incidents in 1997.
Local transport reform is more advanced in 1st wave accession countries, where in over half of the cases public transport is operated by private companies (although these are for the most part public sector controlled).
3 KEY TRANSPORT PROBLEMS AND POLICY AREAS
The questions in this section of the questionnaire were related to the authorities’ assessment of the most important transport problems and transport policies in operation. At first respondents were asked in an open question to describe from their personal viewpoint the three most pressing problems of their authority. In addition to providing responses of a very high validity, respondents were also required, in the form of “multiple response”, to give the authorities’ perspective on the most important problems in the short-term and long-term, but also their priorities in future policies. This information was also requested to judge whether decision makers believe modern information and communication technologies to contribute to solving their most pressing transport problems.
CAPE PROJECT – TRANSPORT TELEMATICS SURVEY (CEEC)
17
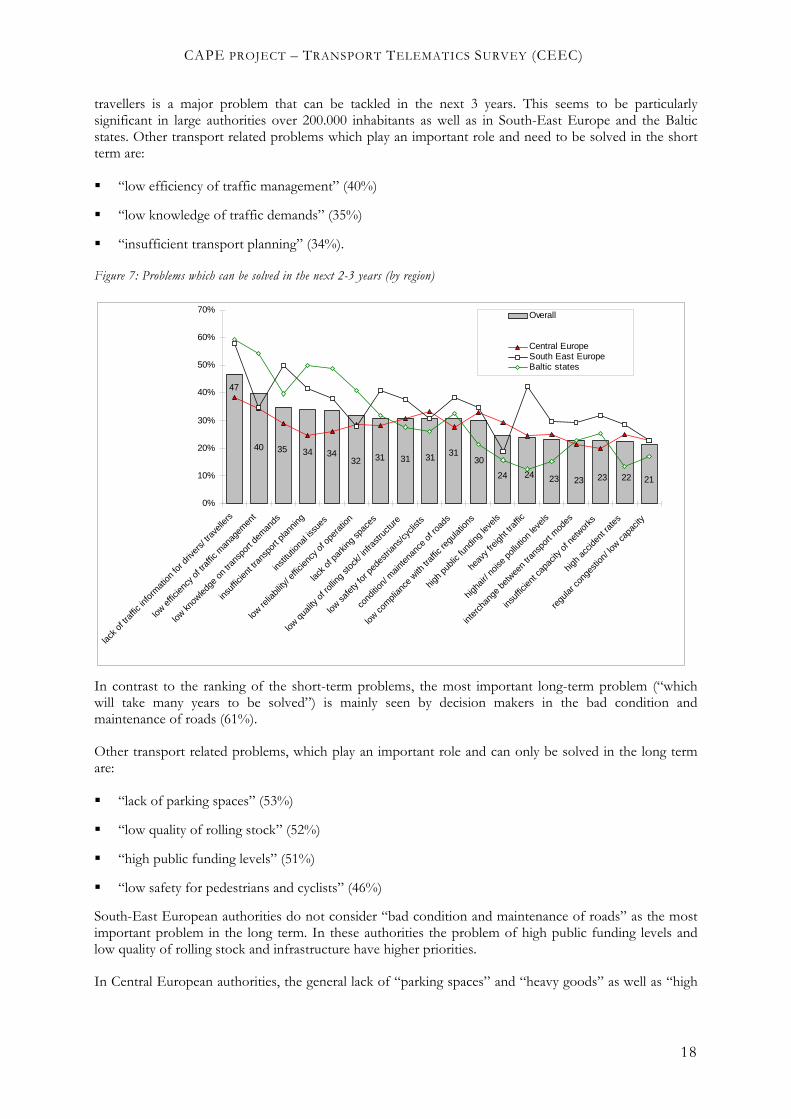
3.1 KEY TRANSPORT PROBLEMS
The analysis of the open question shows that CEEC authorities see their most pressing problems mainly as related to road transport infrastructure7. 31% of all authorities named a problem in this category. Within this category the problem of poor road maintenance and condition was mentioned most often. As can be seen in figure 6, problems of road transport related infrastructure seem to be particularly important in authorities from 1st wave accession countries (38%).
Another 18% of the respondents believe that the bad quality of the rolling stock is the most pressing problem. The third problem considered as “most pressing” is funding (16%). Other problems indicated by the CEEC authorities belong to the following categories: “bad quality of public transport services” (8%), “concrete problems of traffic management” (7%), “traffic congestion” (5%), “parking” and “integrated traffic planning” (both 5%).
Figure 6: Most pressing transport problems (by order of EU-accession)
31%
18%16%
7% 6%
0% 0% 0%5%5%
8%0%
5%
10%
15%
20%
25%
30%
35%
40%
road
tran
spor
t rela
ted
infra
struc
ture
rollin
g sto
ck
fund
ing
publi
c tra
nspo
rt se
rvice
s
conr
ete
prob
lem tr
affic
man
agem
ent
traffic
cong
estio
n/ac
cess
ibility
park
ing
integ
rate
d tra
ffic m
anag
emen
t/plan
ning
pollu
tion
traffic
safe
ty
freigh
t tra
ffic
Overall
1st. wave acc. countries
2nd wave acc. countries
In the following question respondents were asked to provide for a given list of common transport problems an indication of whether they are:
Not an important problem at the moment
Short-term problem (which can be solved in the next 2-3 years)
Long-term problem (which can take many years to be solved)
Priority area in future policies
As a short-term problem, the lack of traffic information for drivers and travellers was mentioned most often8. Almost half of all authorities (47%) said that the low standard of traffic information for drivers and 7 The basis for percentages is n=188
8 The basis for percentages is n=210
CAPE PROJECT – TRANSPORT TELEMATICS SURVEY (CEEC)
18
travellers is a major problem that can be tackled in the next 3 years. This seems to be particularly significant in large authorities over 200.000 inhabitants as well as in South-East Europe and the Baltic states. Other transport related problems which play an important role and need to be solved in the short term are:
“low efficiency of traffic management” (40%)
“low knowledge of traffic demands” (35%)
“insufficient transport planning” (34%).
Figure 7: Problems which can be solved in the next 2-3 years (by region)
2122232323
47
40 35 34 3432 31 31 31 31
30
24 24
0%
10%
20%
30%
40%
50%
60%
70%
lack o
f tra
ffic in
form
ation
for d
river
s/ tra
velle
rs
low e
fficien
cy o
f tra
ffic m
anag
emen
t
low kn
owled
ge o
n tra
nspo
rt de
man
ds
insuf
ficien
t tra
nspo
rt pla
nning
institu
tiona
l issu
es
low re
liabil
ity/ e
fficien
cy o
f ope
ratio
n
lack o
f par
king
spac
es
low q
uality
of r
olling
stoc
k/ inf
rastr
uctu
re
low sa
fety
for p
edes
trian
s/cyc
lists
cond
ition/
main
tena
nce
of ro
ads
low co
mpli
ance
with
traf
fic re
gulat
ions
high
publi
c fun
ding
levels
heav
y fre
ight t
raffic
higha
ir/ n
oise
pollu
tion
levels
inter
chan
ge b
etwee
n tra
nspo
rt m
odes
insuf
ficien
t cap
acity
of n
etwor
ks
high
accid
ent r
ates
regu
lar co
nges
tion/
low ca
pacit
y
Overall
Central EuropeSouth East EuropeBaltic states
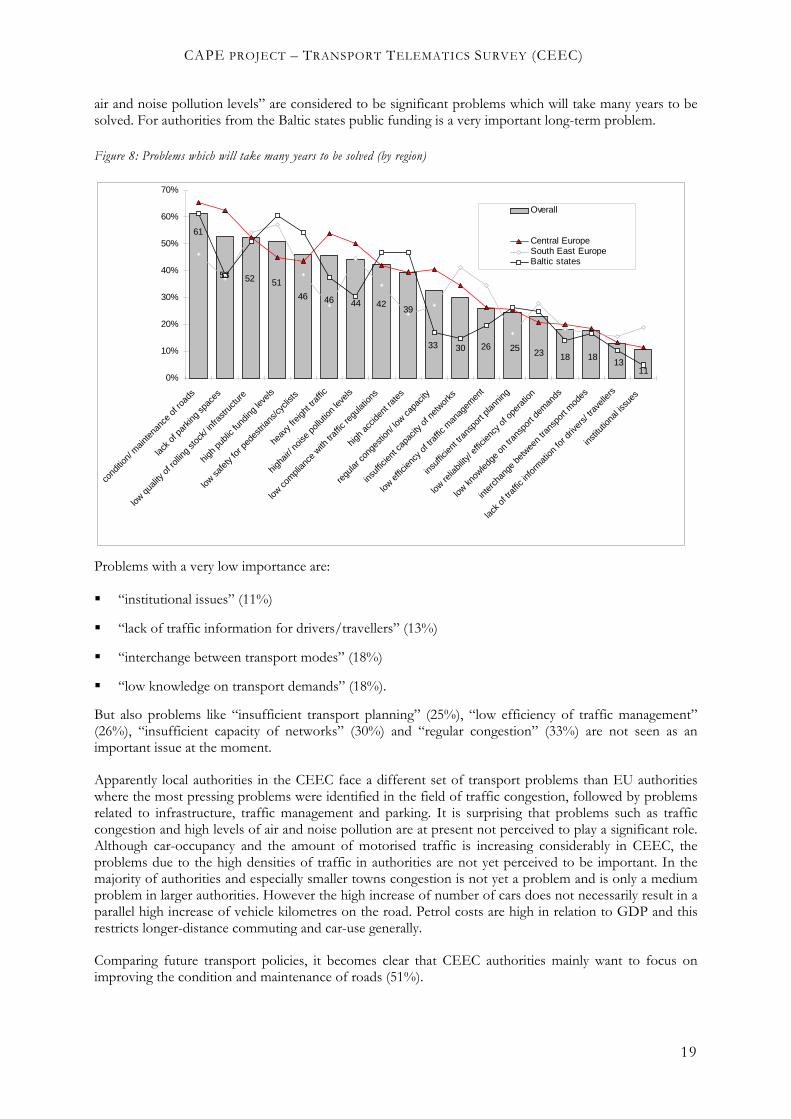
In contrast to the ranking of the short-term problems, the most important long-term problem (“which will take many years to be solved”) is mainly seen by decision makers in the bad condition and maintenance of roads (61%).
Other transport related problems, which play an important role and can only be solved in the long term are:
“lack of parking spaces” (53%)
“low quality of rolling stock” (52%)
“high public funding levels” (51%)
“low safety for pedestrians and cyclists” (46%)
South-East European authorities do not consider “bad condition and maintenance of roads” as the most important problem in the long term. In these authorities the problem of high public funding levels and low quality of rolling stock and infrastructure have higher priorities.
In Central European authorities, the general lack of “parking spaces” and “heavy goods” as well as “high
CAPE PROJECT – TRANSPORT TELEMATICS SURVEY (CEEC)
19
air and noise pollution levels” are considered to be significant problems which will take many years to be solved. For authorities from the Baltic states public funding is a very important long-term problem.
Figure 8: Problems which will take many years to be solved (by region)
25263033
3942444646
515253
61
23 18 1813
110%
10%
20%
30%
40%
50%
60%
70%
cond
ition/
main
tena
nce
of ro
ads
lack o
f par
king
spac
es
low q
uality
of r
olling
stoc
k/ inf
rastr
uctu
re
high
publi
c fun
ding
levels
low sa
fety
for p
edes
trian
s/cyc
lists
heav
y fre
ight t
raffic
higha
ir/ n
oise
pollu
tion
levels
low co
mpli
ance
with
traf
fic re
gulat
ions
high
accid
ent r
ates
regu
lar co
nges
tion/
low ca
pacit
y
insuf
ficien
t cap
acity
of n
etwor
ks
low e
fficien
cy o
f tra
ffic m
anag
emen
t
insuf
ficien
t tra
nspo
rt pla
nning
low re
liabil
ity/ e
fficien
cy o
f ope
ratio
n
low kn
owled
ge o
n tra
nspo
rt de
man
ds
inter
chan
ge b
etwee
n tra
nspo
rt m
odes
lack o
f tra
ffic in
form
ation
for d
river
s/ tra
velle
rs
institu
tiona
l issu
es
Overall
Central EuropeSouth East EuropeBaltic states
Problems with a very low importance are:
“institutional issues” (11%)
“lack of traffic information for drivers/travellers” (13%)
“interchange between transport modes” (18%)
“low knowledge on transport demands” (18%).
But also problems like “insufficient transport planning” (25%), “low efficiency of traffic management” (26%), “insufficient capacity of networks” (30%) and “regular congestion” (33%) are not seen as an important issue at the moment.
Apparently local authorities in the CEEC face a different set of transport problems than EU authorities where the most pressing problems were identified in the field of traffic congestion, followed by problems related to infrastructure, traffic management and parking. It is surprising that problems such as traffic congestion and high levels of air and noise pollution are at present not perceived to play a significant role. Although car-occupancy and the amount of motorised traffic is increasing considerably in CEEC, the problems due to the high densities of traffic in authorities are not yet perceived to be important. In the majority of authorities and especially smaller towns congestion is not yet a problem and is only a medium problem in larger authorities. However the high increase of number of cars does not necessarily result in a parallel high increase of vehicle kilometres on the road. Petrol costs are high in relation to GDP and this restricts longer-distance commuting and car-use generally.
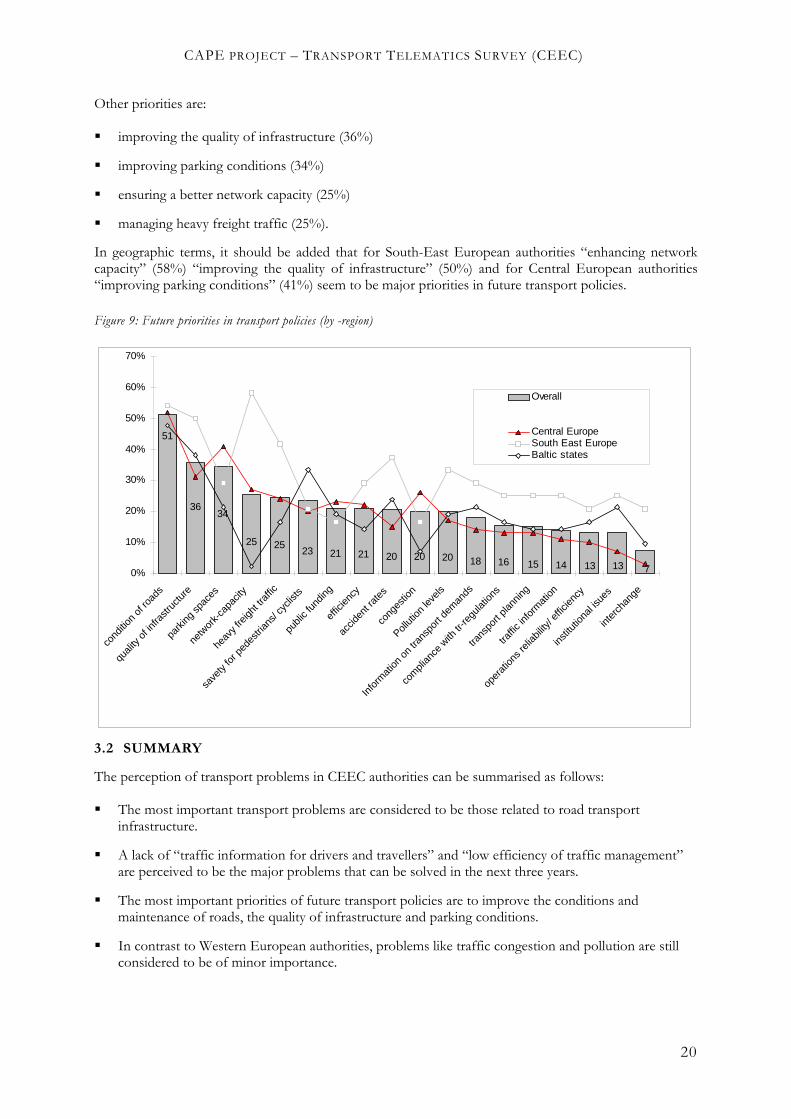
Comparing future transport policies, it becomes clear that CEEC authorities mainly want to focus on improving the condition and maintenance of roads (51%).
CAPE PROJECT – TRANSPORT TELEMATICS SURVEY (CEEC)
20
Other priorities are:
improving the quality of infrastructure (36%)
improving parking conditions (34%)
ensuring a better network capacity (25%)
managing heavy freight traffic (25%).
In geographic terms, it should be added that for South-East European authorities “enhancing network capacity” (58%) “improving the quality of infrastructure” (50%) and for Central European authorities “improving parking conditions” (41%) seem to be major priorities in future transport policies.
Figure 9: Future priorities in transport policies (by -region)
713131415
51
3634
25 2523 21 21 20 20 20 18 16
0%
10%
20%
30%
40%
50%
60%
70%
cond
ition
of ro
ads
quali
ty of
infra
struc
ture
park
ing sp
aces
netw
ork-
capa
city
heav
y fre
ight t
raffic
save
ty fo
r ped
estri
ans/
cycli
sts
publi
c fun
ding
effic
iency
accid
ent r
ates
cong
estio
n
Pollut
ion le
vels
Info
rmat
ion o
n tra
nspo
rt de
man
ds
com
plian
ce w
ith tr
-regu
lation
s
trans
port
plann
ing
traffic
info
rmat
ion
oper
ation
s reli
abilit
y/ ef
ficien
cy
institu
tiona
l isue
s
inter
chan
ge
Overall
Central EuropeSouth East EuropeBaltic states
3.2 SUMMARY
The perception of transport problems in CEEC authorities can be summarised as follows:
The most important transport problems are considered to be those related to road transport infrastructure.
A lack of “traffic information for drivers and travellers” and “low efficiency of traffic management” are perceived to be the major problems that can be solved in the next three years.
The most important priorities of future transport policies are to improve the conditions and maintenance of roads, the quality of infrastructure and parking conditions.
In contrast to Western European authorities, problems like traffic congestion and pollution are still considered to be of minor importance.
CAPE PROJECT – TRANSPORT TELEMATICS SURVEY (CEEC)
21
4 POLICY AREAS
After examining the perception of transport problems, it is of particular interest to analyse how CEEC authorities are trying to respond to these challenges. For this reason the level of transport policy action was analysed.
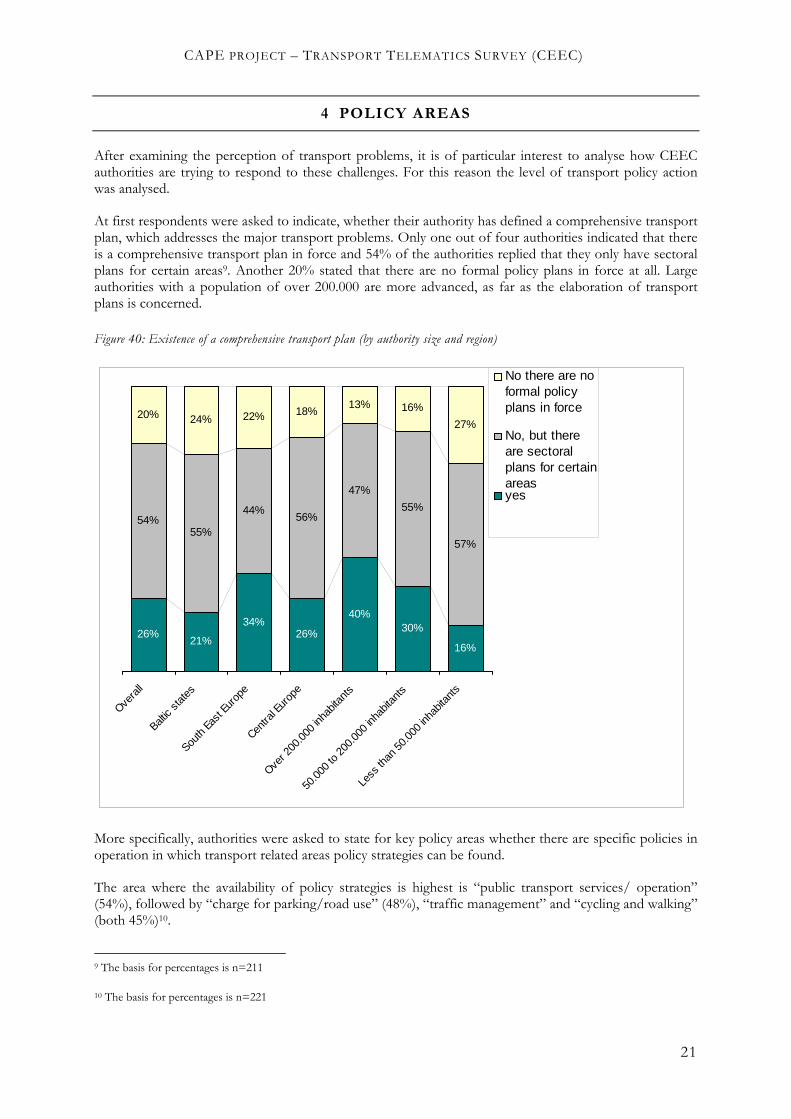
At first respondents were asked to indicate, whether their authority has defined a comprehensive transport plan, which addresses the major transport problems. Only one out of four authorities indicated that there is a comprehensive transport plan in force and 54% of the authorities replied that they only have sectoral plans for certain areas9. Another 20% stated that there are no formal policy plans in force at all. Large authorities with a population of over 200.000 are more advanced, as far as the elaboration of transport plans is concerned.
Figure 40: Existence of a comprehensive transport plan (by authority size and region)
16%
30%40%
26%34%
21%
57%
55%56%
44%
55%54%
27%
16%13%18%22%24%20%
26%
47%
Less
than
50.
000
inhab
itant
s
50.0
00 to
200
.000
inha
bitan
ts
Over 2
00.0
00 in
habit
ants
Centra
l Eur
ope
South
Eas
t Eur
ope
Baltic
stat
es
Overa
ll
No there are noformal policyplans in force
No, but thereare sectoralplans for certainareasyes
More specifically, authorities were asked to state for key policy areas whether there are specific policies in operation in which transport related areas policy strategies can be found.
The area where the availability of policy strategies is highest is “public transport services/ operation” (54%), followed by “charge for parking/road use” (48%), “traffic management” and “cycling and walking” (both 45%)10.
9 The basis for percentages is n=211
10 The basis for percentages is n=221
CAPE PROJECT – TRANSPORT TELEMATICS SURVEY (CEEC)
22
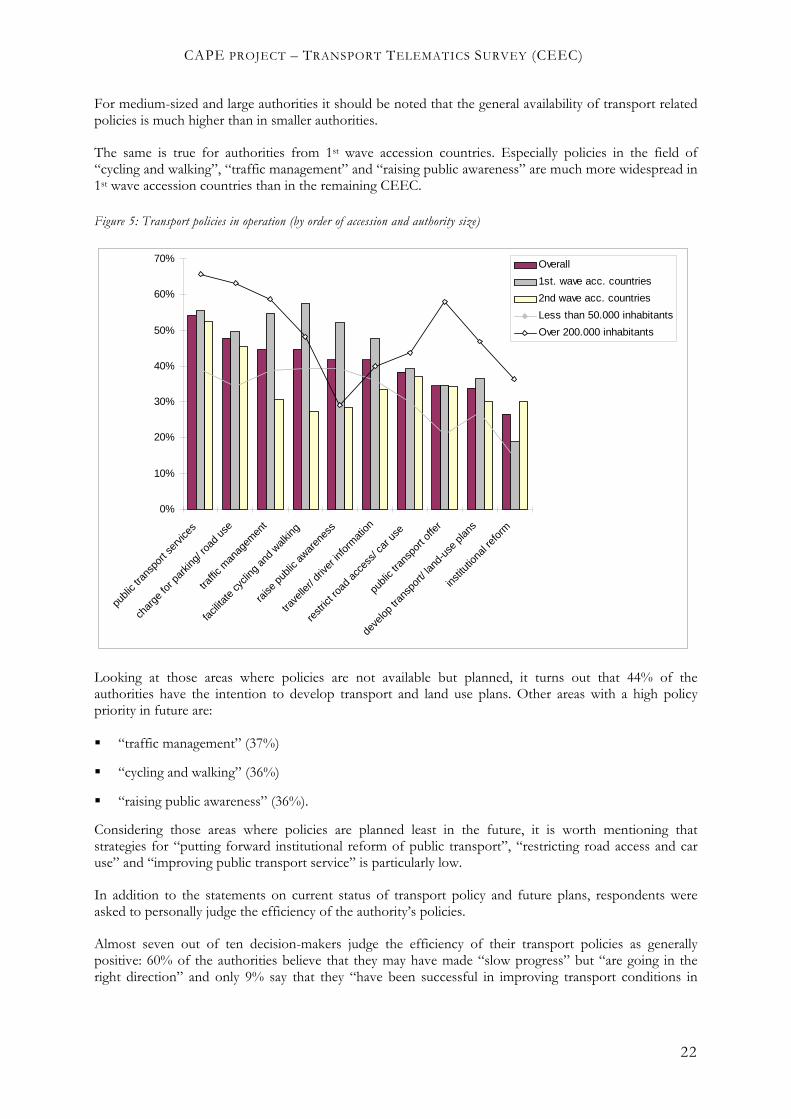
For medium-sized and large authorities it should be noted that the general availability of transport related policies is much higher than in smaller authorities.
The same is true for authorities from 1st wave accession countries. Especially policies in the field of “cycling and walking”, “traffic management” and “raising public awareness” are much more widespread in 1st wave accession countries than in the remaining CEEC.
Figure 5: Transport policies in operation (by order of accession and authority size)
0%
10%
20%
30%
40%
50%
60%
70%
publi
c tra
nspo
rt se
rvice
s
char
ge fo
r par
king/
road
use
traffic
man
agem
ent
facil
itate
cycli
ng a
nd w
alking
raise
pub
lic a
waren
ess
trave
ller/
drive
r inf
orm
ation
restr
ict ro
ad a
cces
s/ ca
r use
publi
c tra
nspo
rt of
fer
deve
lop tr
ansp
ort/
land-
use
plans
institu
tiona
l ref
orm
Overall
1st. wave acc. countries
2nd wave acc. countries
Less than 50.000 inhabitants
Over 200.000 inhabitants
Looking at those areas where policies are not available but planned, it turns out that 44% of the authorities have the intention to develop transport and land use plans. Other areas with a high policy priority in future are:
“traffic management” (37%)
“cycling and walking” (36%)
“raising public awareness” (36%).
Considering those areas where policies are planned least in the future, it is worth mentioning that strategies for “putting forward institutional reform of public transport”, “restricting road access and car use” and “improving public transport service” is particularly low.
In addition to the statements on current status of transport policy and future plans, respondents were asked to personally judge the efficiency of the authority’s policies.
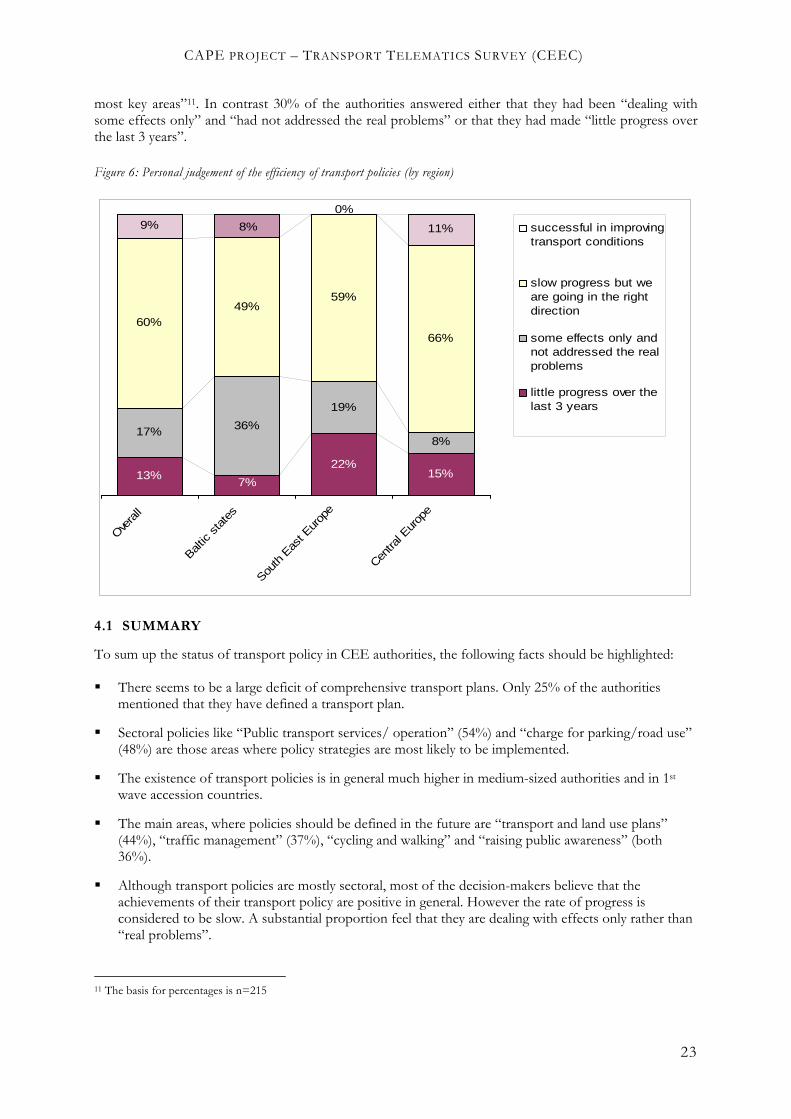
Almost seven out of ten decision-makers judge the efficiency of their transport policies as generally positive: 60% of the authorities believe that they may have made “slow progress” but “are going in the right direction” and only 9% say that they “have been successful in improving transport conditions in
CAPE PROJECT – TRANSPORT TELEMATICS SURVEY (CEEC)
23
most key areas”11. In contrast 30% of the authorities answered either that they had been “dealing with some effects only” and “had not addressed the real problems” or that they had made “little progress over the last 3 years”.
Figure 6: Personal judgement of the efficiency of transport policies (by region)
15%22%
7%13%
8%
19%
36%17%
66%
59%49%
60%
11%
0%9% 8%
Centra
l Eur
ope
South
Eas
t Eur
ope
Baltic
state
s
Ove
rall
successful in improvingtransport conditions
slow progress but weare going in the rightdirection
some effects only andnot addressed the realproblems
little progress over thelast 3 years
4.1 SUMMARY
To sum up the status of transport policy in CEE authorities, the following facts should be highlighted:
There seems to be a large deficit of comprehensive transport plans. Only 25% of the authorities mentioned that they have defined a transport plan.
Sectoral policies like “Public transport services/ operation” (54%) and “charge for parking/road use” (48%) are those areas where policy strategies are most likely to be implemented.
The existence of transport policies is in general much higher in medium-sized authorities and in 1st wave accession countries.
The main areas, where policies should be defined in the future are “transport and land use plans” (44%), “traffic management” (37%), “cycling and walking” and “raising public awareness” (both 36%).
Although transport policies are mostly sectoral, most of the decision-makers believe that the achievements of their transport policy are positive in general. However the rate of progress is considered to be slow. A substantial proportion feel that they are dealing with effects only rather than “real problems”.
11 The basis for percentages is n=215
CAPE PROJECT – TRANSPORT TELEMATICS SURVEY (CEEC)
24
5 IMPACT AND RELEVANCE OF TECHNOLOGY
The key area of interest in the survey was to analyse possible impacts of information and communication technologies on transport. Respondents were asked to rate the short term impact (2-3 years) of modern technologies on different areas of transport policy as low, moderate or high. By means of this question it should be identified, where CEEC authorities see the most important impacts of new technologies in the field of transport and how these technologies can contribute to solving their most pressing transport problems.
5.1 IMPACTS OF TELEMATICS TECHNOLOGIES ON TRANSPORT
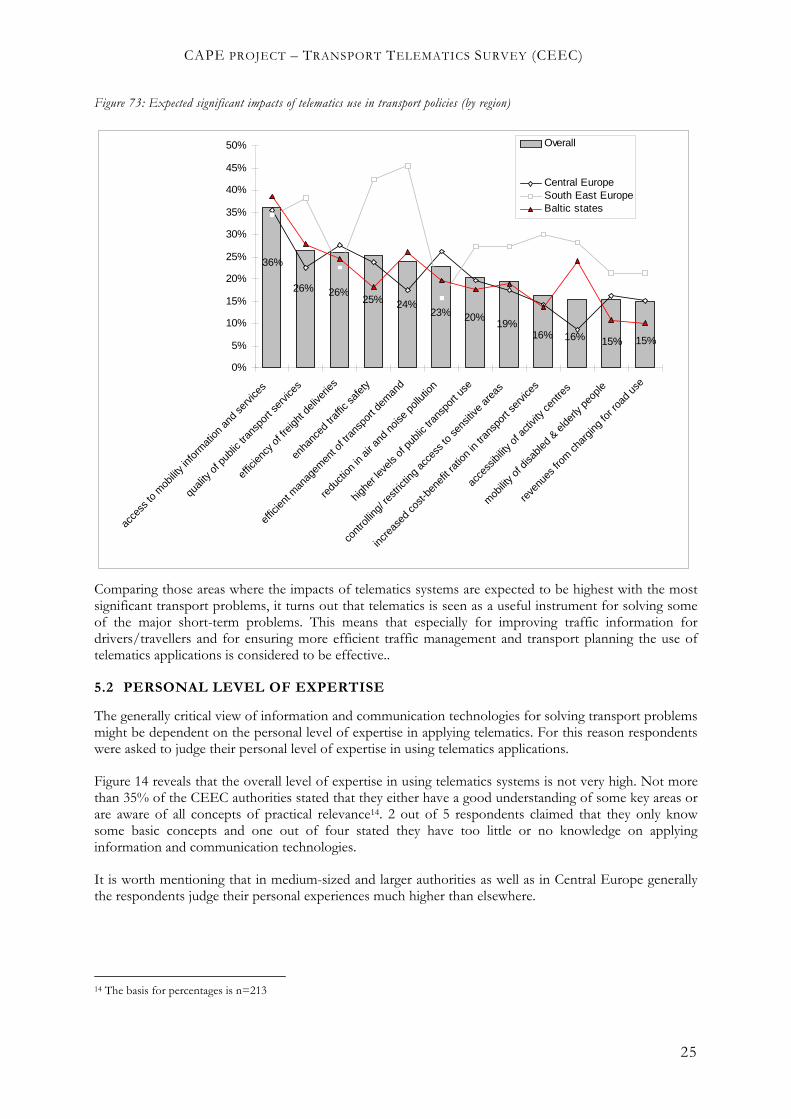
According to figure 13, it is apparent that amongst CEEC authorities the general appreciation of information and communication technologies as a useful tool to solve transport-related problems is not very high. The EDC survey 1998 has shown that the effects of telematics on transport are more appreciated in EU authorities12. The ranking of impacts, however, are fairly similar in CEEC and EU authorities.
Like in EU authorities “access to mobility information and services” and “quality of public transport services” are the areas, where the CEEC authorities believe the impact of information and communication technologies to be highest13. However only 36% of the authorities (in EU 56%) expect that the use of telematics systems will bring about some improvements for the quality of mobility information and services.
In about one quarter of the CEEC authorities, respondents anticipate that new technologies will be particularly useful for improving the:
“quality of transport services”
“efficiency of freight deliveries”
“traffic safety”
“transport demand management”.
In South East Europe the potentials of telematics are generally more appreciated than in the remaining CEEC-regions.
12 In the EDC 1998 survey it was found out, that EU authorities see the key impacts of telematics in next 2-3 years in: “access to mobility information and services” (56%), “quality of public transport services” (44%), “reliability of public transport services” (35%), “efficient use of transport infrastructure” (30%).
13 The basis for percentages is n=218
CAPE PROJECT – TRANSPORT TELEMATICS SURVEY (CEEC)
25
Figure 73: Expected significant impacts of telematics use in transport policies (by region)
15%15%16%16%19%
20%23%24%25%
26%26%
36%
0%
5%
10%
15%
20%
25%
30%
35%
40%
45%
50%
acce
ss to
mob
ility i
nfor
mat
ion a
nd se
rvice
s
quali
ty of
pub
lic tr
ansp
ort s
ervic
es
effic
iency
of f
reigh
t deli
verie
s
enha
nced
traf
fic sa
fety
effic
ient m
anag
emen
t of t
rans
port
dem
and
redu
ction
in a
ir an
d no
ise p
ollut
ion
highe
r lev
els o
f pub
lic tr
ansp
ort u
se
cont
rollin
g/ re
strict
ing a
cces
s to
sens
itive
area
s
incre
ased
cost-
bene
fit ra
tion
in tra
nspo
rt se
rvice
s
acce
ssibi
lity o
f acti
vity c
entre
s
mob
ility o
f disa
bled
& elde
rly p
eople
reve
nues
from
char
ging
for r
oad
use
Overall
Central EuropeSouth East EuropeBaltic states
Comparing those areas where the impacts of telematics systems are expected to be highest with the most significant transport problems, it turns out that telematics is seen as a useful instrument for solving some of the major short-term problems. This means that especially for improving traffic information for drivers/travellers and for ensuring more efficient traffic management and transport planning the use of telematics applications is considered to be effective..
5.2 PERSONAL LEVEL OF EXPERTISE
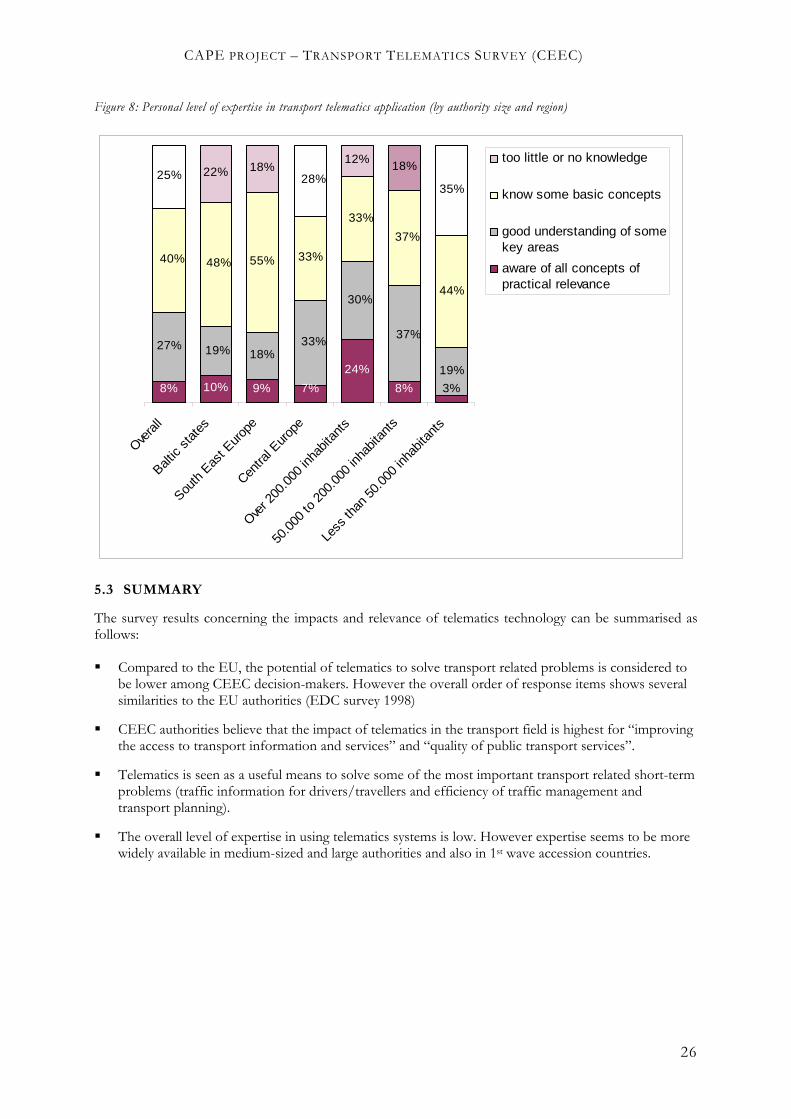
The generally critical view of information and communication technologies for solving transport problems might be dependent on the personal level of expertise in applying telematics. For this reason respondents were asked to judge their personal level of expertise in using telematics applications.
Figure 14 reveals that the overall level of expertise in using telematics systems is not very high. Not more than 35% of the CEEC authorities stated that they either have a good understanding of some key areas or are aware of all concepts of practical relevance14. 2 out of 5 respondents claimed that they only know some basic concepts and one out of four stated they have too little or no knowledge on applying information and communication technologies.
It is worth mentioning that in medium-sized and larger authorities as well as in Central Europe generally the respondents judge their personal experiences much higher than elsewhere.
14 The basis for percentages is n=213
CAPE PROJECT – TRANSPORT TELEMATICS SURVEY (CEEC)
26
Figure 8: Personal level of expertise in transport telematics application (by authority size and region)
8%
24%
7%9%10%8%
19%18%
27%
44%
33%55%
35%
18%12%
18%22%25%
3%
33%19%
37%
30%
40% 48%
33%
37%
28%
Less
than
50.
000
inhab
itant
s
50.0
00 to
200
.000
inha
bitan
ts
Over 2
00.0
00 in
habit
ants
Centra
l Eur
ope
South
Eas
t Eur
ope
Baltic
stat
es
Overa
ll
too little or no knowledge
know some basic concepts
good understanding of somekey areas
aware of all concepts ofpractical relevance
5.3 SUMMARY
The survey results concerning the impacts and relevance of telematics technology can be summarised as follows:
Compared to the EU, the potential of telematics to solve transport related problems is considered to be lower among CEEC decision-makers. However the overall order of response items shows several similarities to the EU authorities (EDC survey 1998)
CEEC authorities believe that the impact of telematics in the transport field is highest for “improving the access to transport information and services” and “quality of public transport services”.
Telematics is seen as a useful means to solve some of the most important transport related short-term problems (traffic information for drivers/travellers and efficiency of traffic management and transport planning).
The overall level of expertise in using telematics systems is low. However expertise seems to be more widely available in medium-sized and large authorities and also in 1st wave accession countries.
CAPE PROJECT – TRANSPORT TELEMATICS SURVEY (CEEC)
27
6 EXPECTED BENEFITS AND OBSTACLES OF USING INFORMATION AND COMMUNICATION TECHNOLOGIES
In this part of the questionnaire respondents were asked to rank general benefits and obstacles of using telematics technologies from a given list. For a final ranking of the benefits and obstacles, the statistical mean over each variable (benefit/obstacle) was calculated. This allows an overview of the major difficulties in implementing telematics.
6.1 BENEFITS
The main benefits of using information and communication technologies in the transport area are seen in15:
“generally higher quality of transport services” (2,4)
“greater cost efficiency” (2,4)
“improved planning and decision making” (2,6)
“improved internal communication/work flow” (3,2)
“higher rate of enforcement of regulations” (3,4)
Of secondary importance are:
“Improved internal communication/ work flow” (3,2)
“Higher rate of enforcement regulations” (3,4)
“Better access for citizens to transport related information” (3,5)
It is surprising that “better access for citizens to transport related information” is only seen as a benefit of secondary importance, since this item was identified as the area with the highest impact of telematics.
Least important benefits are:
“Better technical integration between systems” (3,7)
“Improved outside image of authority” (3,8)
In general regarding the benefits of telematics use no very clear trend emerges in CEEC. From this survey it was therefore not possible to clearly identify the major expected benefits from using telematics systems.
6.2 OBSTACLES
The wider application of transport telematics in Central and East European faces a number of obstacles. For enhancing the use of information and communication technologies in CEEC local and regional authorities, it was essential to find out what the most important obstacles for the implementation of these technologies are16.
The two paramount obstacles for a better use of information and communication technologies are:
15 The basis for percentages is n=206
16 The basis for percentages is n=206
CAPE PROJECT – TRANSPORT TELEMATICS SURVEY (CEEC)
28
“lack of public funds” (1,4)
“lack of data and the difficulties in supplying up-to-date and relevant information” (2,8)
These two obstacles are also the most important ones in EU authorities. Authorities in CEEC and in the EU believe that the missing financial support is the most important obstacle for a better telematics use and the lack of data and relevant information is another important reason, why telematics systems are not more often used.
The following obstacles obviously play a more secondary role:
“Problems of institutional/ interdepartmental co-operation” (3,2)
“Technical problems for operators” (3,2)
“Lack of political support” (3,4)
“Lack of awareness of services on the part of citizens” (3,6)
“Complexity of new services for users” (3,7)
It is important to note that lack of political support is not seen as a major obstacle. It seems that decision-makers generally do not have a sceptical attitude towards the use of modern technologies, but compared to the political support for transport infrastructure projects, the wider employment of modern technologies is often seen as a secondary issue.
6.3 SUMMARY
The major benefits and obstacles to telematics uptake are:
The highest benefit of using telematics is seen in a generally “higher quality of transport services” and “greater cost-efficiency”.
However regarding the benefits of telematics use no very clear trend emerges in CEEC.
“Insufficient public funds” and “lack of data and relevant information” are the most important obstacles that have to be overcome before a better telematics uptake may be achieved.
These two obstacles are also the key obstacles amongst EU authorities.
7 INTERNAL USE OF TELEMATICS SYSTEMS
One key objective of this questionnaire was to outline the internal use and future priorities of telematics systems in CEEC authorities. CEEC authorities were asked first to give some details on the availability of transport related data and technologies for managing traffic and to describe the current internal use of telematics applications. The approach for this section was to establish the availability of basic information tools and technologies for future application of telematics systems. This information will serve also as a basis for developing targeted strategies to enhance the dissemination of transport telematics good practices to the CAPE project’s target groups.
7.1 DATA AVAILABILITY
The pre-condition for any new telematics systems and services is availability of key data on current transport and environmental conditions. Four items were selected for indication of availability by respondents (sufficiently available, partly available, not available, future priority).

CAPE PROJECT – TRANSPORT TELEMATICS SURVEY (CEEC)
29
The availability of data is best in the areas of establishing the current position of buses/trams in the network and availability of parking places, for which half of the authorities (58% of the authorities from the Baltic states) mentioned that data is sufficiently available17. Only one third of the authorities stated that their data availability on transport demands and on congestion levels is sufficient. This is an important information for evaluating the pre-conditions for telematics use in the field of traffic management. Data availability for roadside air pollution from traffic is very low. Only 15% of the authorities stated that data in this field is sufficiently available.
Large authorities generally seem to be better equipped with transport related data than other authorities.
Figure 95: Transport related data sufficiently available (by authority size and region)
15%
27%
34%49%
50%
0%
10%
20%
30%
40%
50%
60%
70%
posit
ion o
f bus
es/ t
ram
s in
the
netw
ork
avail
abilit
y of p
arkin
g pla
ces
data
on
trans
port
dem
ands
cong
estio
n lev
els o
n ro
ads
road
side
air p
ollut
ion fr
om tr
affic
OverallLess than 50.000 inhabitantsOver 200.000 inhabitantsCentral EuropeSouth East EuropeBaltic states
The highest demand for future provision of transport related data is seen in the area of parking places (50%) followed by “roadside air pollution from traffic” (41%) and “congestion levels on roads” (39%). Again it turns out that parking will play an important issue in urban transport policies. The fact that better data on roadside air pollution from traffic and on congestion levels is highly demanded, clearly shows that the negative impacts of car use are increasingly discussed.
Larger authorities generally have a higher demand in improving their transport-related data availability than other authorities.
17 The basis for percentages is n=200

CAPE PROJECT – TRANSPORT TELEMATICS SURVEY (CEEC)
30
Figure 106: Future priorities in acquisition of transport related data (authority size and region)
50%
41%39%
36%
26%0%
10%
20%
30%
40%
50%
60%
70%
avail
ab. o
f par
king
place
s
road
side
air p
ollut
ion
cong
estio
n lev
els o
n ro
ads
trans
port
mod
el an
d de
man
d
posit
ion o
f bus
es/tr
ams i
n ne
twor
k
Overall Les s than 50.000 inhabitants Over 200.000 inhabitants Central E urope S outh E as t E urope B alt ic s tates
7.2 TECHNOLOGIES FOR MANAGING TRAFFIC
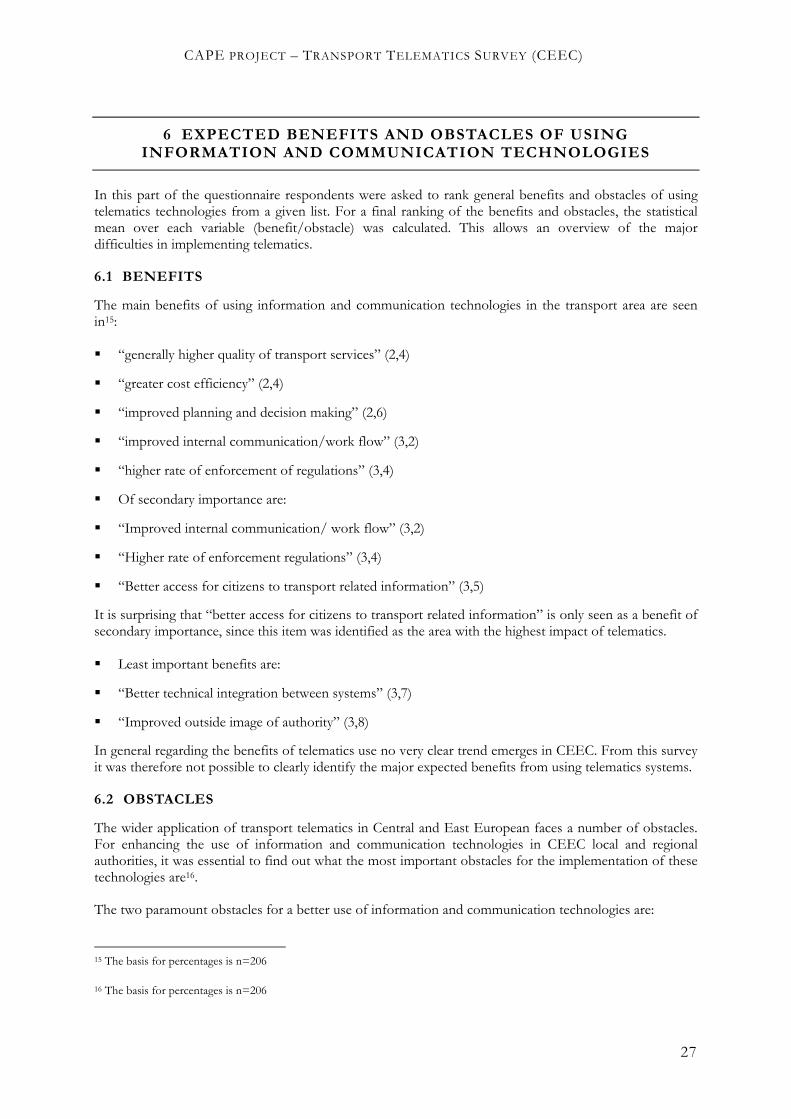
The next section examined whether transport authorities are equipped with key technology for managing traffic.
Overall the level of deployment is extremely low. Only about one out of five authorities (figure 17) have at least partly available18:
“centralised traffic signal control” (23%)
“flexible signal plans” (20%)
“public transport priority” (20%)
“traffic sensors” (20%)
Other technologies such as electronic signboards (VMS) and automatic scheduling of trams are used by only 11% or less.
Authorities with over 200.000 inhabitants are much better equipped than small authorities with less than 50.000 inhabitants.
18 The basis for percentages is n=173
CAPE PROJECT – TRANSPORT TELEMATICS SURVEY (CEEC)
31
Figure 117: Technologies for managing traffic partly available (by authority size and region)
7%
23%
20% 20% 20% 18%
11%
0%
5%
10%
15%
20%
25%
30%
35%
40%
45%
cent
ralis
ed tr
affic
sign
al co
ntro
l
flexib
le sig
nal p
lans
publi
c tra
nspo
rt pr
iority
traffic
sens
ors
coor
dinat
ion o
f urb
an &
regio
nal tr
affic
electr
onic
signb
oard
s (VM
S)
sche
dulin
g of
tram
s
Overall
Less than 50.000 inhabitants
Over 200.000 inhabitants
Central Europe
South East Europe
Baltic states
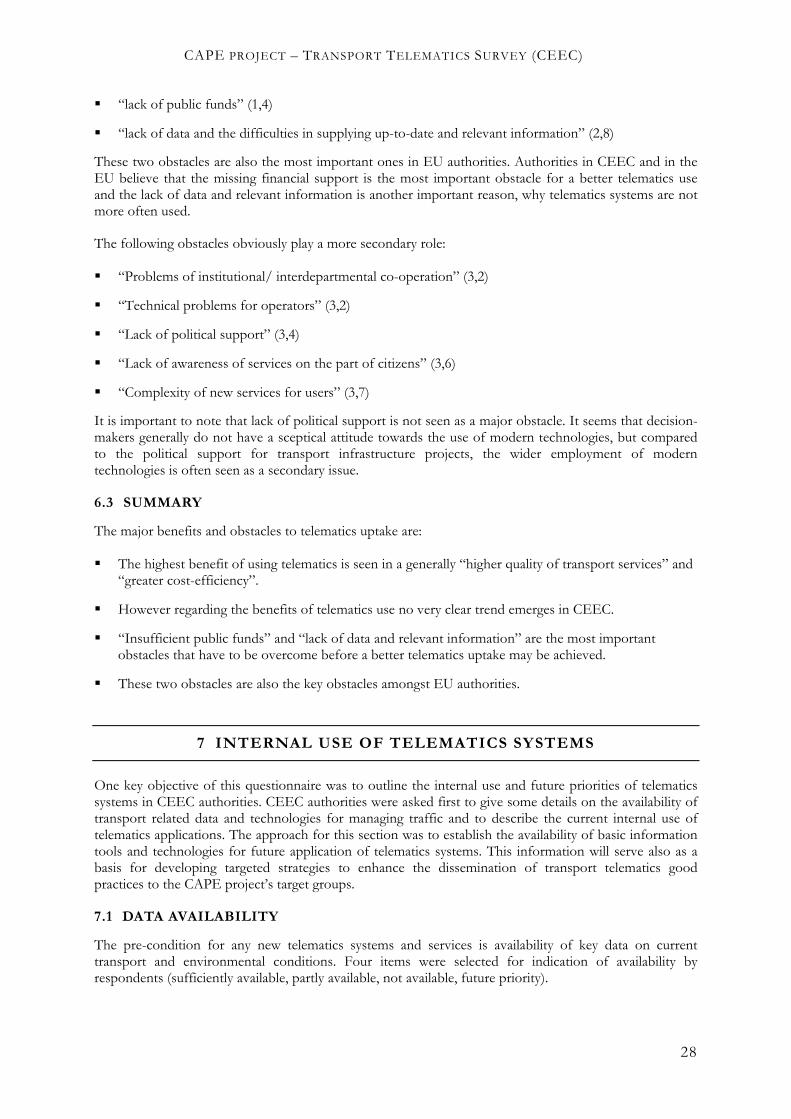
A look at the priorities for future technology use in traffic management (figure 18) makes clear that the highest demand is seen for “central traffic signal control”, “flexible signal plans” and “automatic co-ordination of urban and regional traffic”.
Smaller authorities are apparently trying to catch up with the recent technological innovations in the field of “flexible signal plans”, “traffic co-ordination” and “traffic sensors”, whereas bigger authorities are trying to improve on “public transport priorities”, “electronic signboards” and “automatic scheduling of trams”. South East European authorities seem to be especially interested in applying technology for “public transport priority”, while Central European authorities favour “flexible signal plan” applications and “centralised traffic signal control”.
CAPE PROJECT – TRANSPORT TELEMATICS SURVEY (CEEC)
32
Figure 128: Future priorities for using technologies for traffic management (by authority size and region)
36%38%
42%45%47%
48%
13%0%
10%
20%
30%
40%
50%
60%
70%
cent
r. Tra
ffic si
gnal
cont
rol
flexib
le sig
nal p
lans
traffic
coor
dinat
ion
traffic
sens
ors
publi
c tra
nspo
rt pr
iority
electr
onic
signb
orad
s
sche
dulin
g of
tram
s
OverallLess than 50.000 inhabitantsOver 200.000 inhabitantsCentral EuropeSouth East EuropeBaltic states
7.3 INHOUSE TELEMATICS SUPPORT FOR TRANSPORT MANAGEMENT TASKS
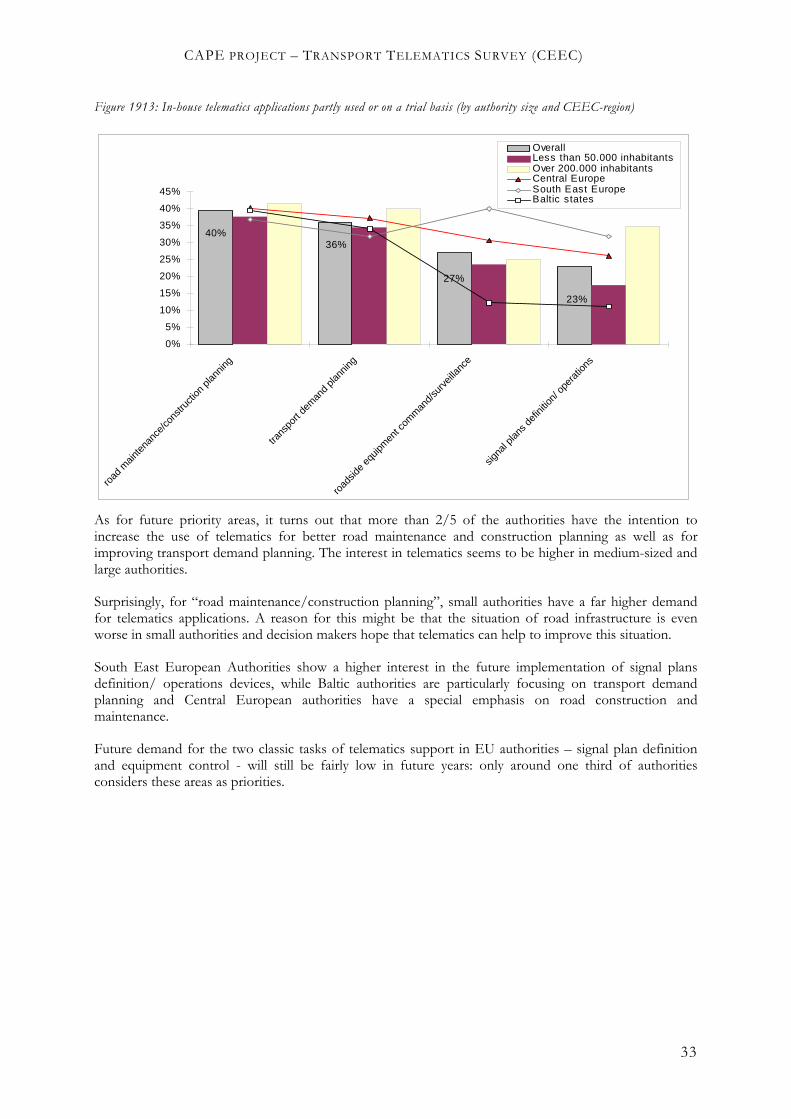
Figure 19 gives an overview of some major tasks of a transport department that are supported at least partly or on a trial basis by information and communication technologies.
Again it can be seen that information and communication technologies are not extensively used in CEEC authorities. It is remarkable that telematics systems are mostly used for road maintenance or construction planning (40%)19. Undoubtedly the use of telematics in this area is considered to be essential by CEEC authorities. The bad condition and maintenance of roads was identified to be the most important problem and authorities hope that telematics applications can contribute to solving this problem20.
Transport demand management is supported partly by telematics in 36% of all authorities.
Other applications such as signal plans definition/operations and roadside equipment command/ surveillance are supported by telematics systems in only one quarter of all cases. Authorities with over 200.000 inhabitants apply transport telematics somewhat more frequently than smaller authorities (especially signal plans definition/ operation).
South East European Authorities and also Central European Authorities are better equipped with technologies such as roadside equipment command/ surveillance and signal plans definition/ operations.
19 The basis for percentages is n=178
20 However the nature of “telematics support” in this area is not entirely clear. Presumably a very wide definition of information and communication technologies was assumed by respondents. The real use of telematics tools is probably much lower.
CAPE PROJECT – TRANSPORT TELEMATICS SURVEY (CEEC)
33
Figure 1913: In-house telematics applications partly used or on a trial basis (by authority size and CEEC-region)
40%36%
27%
23%
0%
5%
10%
15%
20%
25%
30%
35%
40%
45%
road
main
tena
nce/
cons
tructi
on p
lannin
g
trans
port
dem
and
plann
ing
road
side
equip
men
t com
man
d/su
rveil
lance
signa
l plan
s def
initio
n/ o
pera
tions
OverallLess than 50.000 inhabitantsOver 200.000 inhabitantsCentral EuropeSouth East EuropeBaltic states
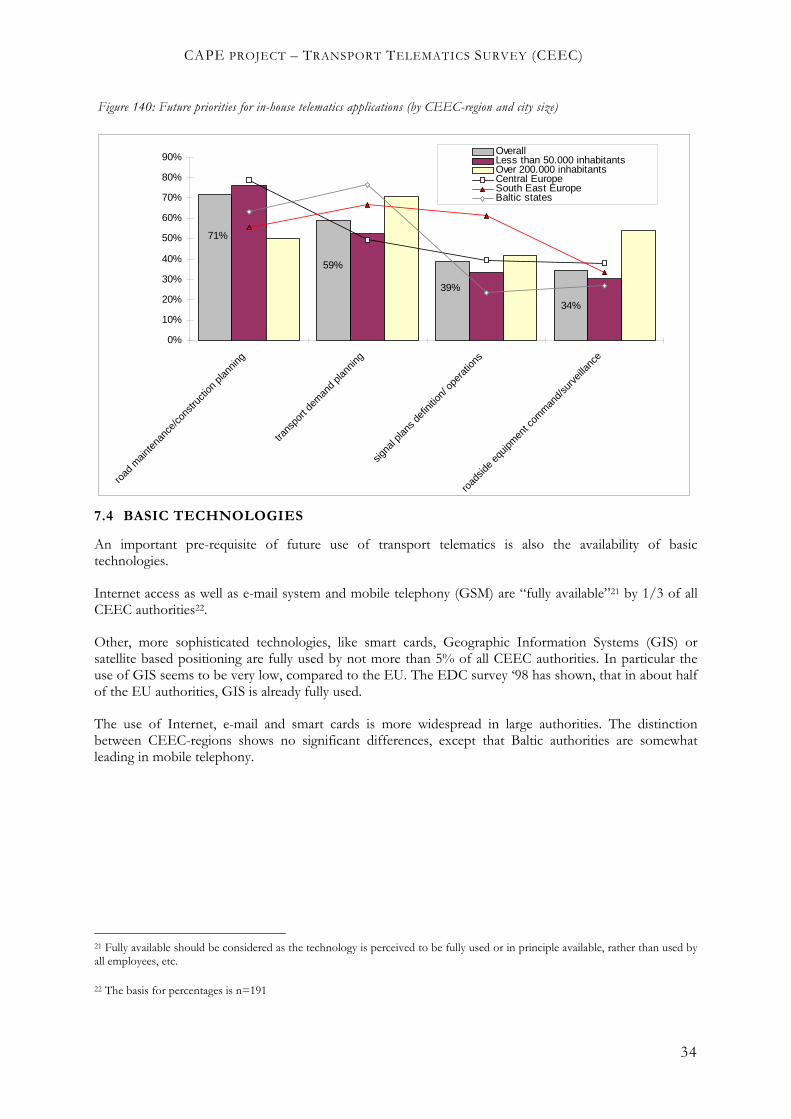
As for future priority areas, it turns out that more than 2/5 of the authorities have the intention to increase the use of telematics for better road maintenance and construction planning as well as for improving transport demand planning. The interest in telematics seems to be higher in medium-sized and large authorities.
Surprisingly, for “road maintenance/construction planning”, small authorities have a far higher demand for telematics applications. A reason for this might be that the situation of road infrastructure is even worse in small authorities and decision makers hope that telematics can help to improve this situation.
South East European Authorities show a higher interest in the future implementation of signal plans definition/ operations devices, while Baltic authorities are particularly focusing on transport demand planning and Central European authorities have a special emphasis on road construction and maintenance.
Future demand for the two classic tasks of telematics support in EU authorities – signal plan definition and equipment control - will still be fairly low in future years: only around one third of authorities considers these areas as priorities.
CAPE PROJECT – TRANSPORT TELEMATICS SURVEY (CEEC)
34
Figure 140: Future priorities for in-house telematics applications (by CEEC-region and city size)
34%
39%
59%
71%
0%
10%
20%
30%
40%
50%
60%
70%
80%
90%
road
main
tena
nce/
cons
tructi
on p
lannin
g
trans
port
dem
and
plann
ing
signa
l plan
s def
initio
n/ o
pera
tions
road
side
equip
men
t com
man
d/su
rveil
lance
OverallLess than 50.000 inhabitantsOver 200.000 inhabitantsCentral EuropeSouth East EuropeBaltic states
7.4 BASIC TECHNOLOGIES
An important pre-requisite of future use of transport telematics is also the availability of basic technologies.
Internet access as well as e-mail system and mobile telephony (GSM) are “fully available”21 by 1/3 of all CEEC authorities22.
Other, more sophisticated technologies, like smart cards, Geographic Information Systems (GIS) or satellite based positioning are fully used by not more than 5% of all CEEC authorities. In particular the use of GIS seems to be very low, compared to the EU. The EDC survey ‘98 has shown, that in about half of the EU authorities, GIS is already fully used.
The use of Internet, e-mail and smart cards is more widespread in large authorities. The distinction between CEEC-regions shows no significant differences, except that Baltic authorities are somewhat leading in mobile telephony.
21 Fully available should be considered as the technology is perceived to be fully used or in principle available, rather than used by all employees, etc.
22 The basis for percentages is n=191

CAPE PROJECT – TRANSPORT TELEMATICS SURVEY (CEEC)
35
Figure 15: Basic technologies (by city size and region)
34% 34%
33%
5% 5% 2%
0%
5%
10%
15%
20%
25%
30%
35%
40%
45%
Inte
rnet
acc
ess
mob
ile te
lepho
ny
electr
onic
syste
m
smar
t car
ds
Geogr
aphic
Info
rmat
ion S
yste
ms
sate
litte-
base
d po
sition
ing (G
PS)
OverallLess than 50.000 inhabitantsOver 200.000 inhabitantsCentral EuropeSouth East EuropeBaltic states
A subdivision according to EU-accession order shows that first and second wave accession countries are much better equipped with Internet, mobile telephony and electronic mail systems.
Future priorities for basic technology use is high for all areas. Geographic Information Systems are seen by more than half of the responding authorities as a technical system which should be further developed. GIS are followed by Internet, e-mail and smart cards. Only GPS and GSM are of lower interest (26%/29%).
South East European authorities have most interest in improving their technological equipment with Internet access, e-mail system, smart cards and mobile telephony, while Baltic authorities put an emphasis on GIS and Central European authorities focus on GPS. Authorities with over 200.000 inhabitants have a special interest in implementing smart card systems and GPS.

CAPE PROJECT – TRANSPORT TELEMATICS SURVEY (CEEC)
36
Figure 16: Future priorities in basic technology implementation
26%29%43%45%50%
51%
0%
10%
20%
30%
40%
50%
60%
70%
80%
Geogr
aphic
Info
rmat
ion S
yste
ms
Inte
rnet
acc
ess
electr
onic
syste
m
smar
t car
ds
mob
ile te
lepho
ny
sate
litte-
base
d po
sition
ing
OverallLess than 50.000 inhabitantsOver 200.000 inhabitantsCentral EuropeSouth East EuropeBaltic states
7.5 SUMMARY
To sum up the survey results relating the internal use of telematics systems in Central and East European authorities, it can be said that:
Transport data
The availability of transport related data is low and needs to be improved considerably if telematics systems and services are to be implemented in the future.
The best data availability can be noted in large authorities and in the Baltic states.
In particular large authorities intend to improve the availability of transport-related data.
Traffic management
The use of technologies for managing traffic is very low. Only in medium-sized and large authorities and in Central European states levels are somewhat higher. Overall, “traffic sensors” (25%), “flexible signal plans” and “centralised traffic signal control” (both 16%) are the most frequently used technologies.
Technologies such as ensuring public transport priority, scheduling of trams and especially (automatic) co-ordination of urban and regional and electronic signboards (VMS) are only used to a very small extent.
The demand for future technology use is high for all areas. Between half and one third of authorities state to have priority interests. Only “scheduling of trams” is of minor interest (13%).
Especially in small authorities as well as in most authorities in South-East Europe and the Baltic States, the conditions for a more intensive use of telematics for managing traffic are severely limited by a lack of basic telematics tools and technologies.
In-house telematics systems

CAPE PROJECT – TRANSPORT TELEMATICS SURVEY (CEEC)
37
The level of telematics support for key tasks of transport departments is extremely low for areas such as “demand planning”(36%), roadside equipment command/surveillance” (27%) or “signal plans definition/operations” (23%).
Future interest refer mainly to road maintenance/construction planning (71%) and transport demand planning (59%), but less to explicit technical traffic management (e.g. signal plan definition or equipment control).
Basic technologies
Around one third of authorities has access to basic generic technologies, such as Internet, e-mail and GSM
More advanced technologies as smart cards, GIS and GPS are only marginally used (5% or less)
Future priorities are high for all enquired technologies, except for GSM and GPS (below 30%)
8 DELIVERY OF PUBLIC SERVICES/ AND EXTERNAL COMMUNICATION
In this section details of transport related public information and services are provided. In addition respondents were asked to state the technical platforms through which these information and services are delivered. These questions will help to establish the current technical framework of telematics supported information policy.
Apparently respondents adopted an extremely wide definition of “service”. When interpreting results in this section it can be assumed that for indicated services, information is in principle available, but may not be disseminated on a regular basis for the entire geographic area.
8.1 INFORMATION SERVICES
Irrespective of its indicative nature it seems that the standard of information provision is highest for “current road works and other incidents” and “advance notice on public transport disruptions” with two third of respondents claiming that they are providing these “services”23. But also other information services, like “real-time information on traffic conditions” (58%), “fixed schedules on buses/trams/metro” (58%) or “weather information/forecasts” (57%) are in principle available by the majority of authorities from Central and Eastern Europe. Information on parking space is only available in about one quarter of the authorities.
In general it can be observed that the level of information services is particularly high in authorities from 1st wave accession countries as well as in large authorities with over 200.000 inhabitants.
23 The basis for percentages are all responses (i.e. n=229). Nil response was considered as “service not available”.
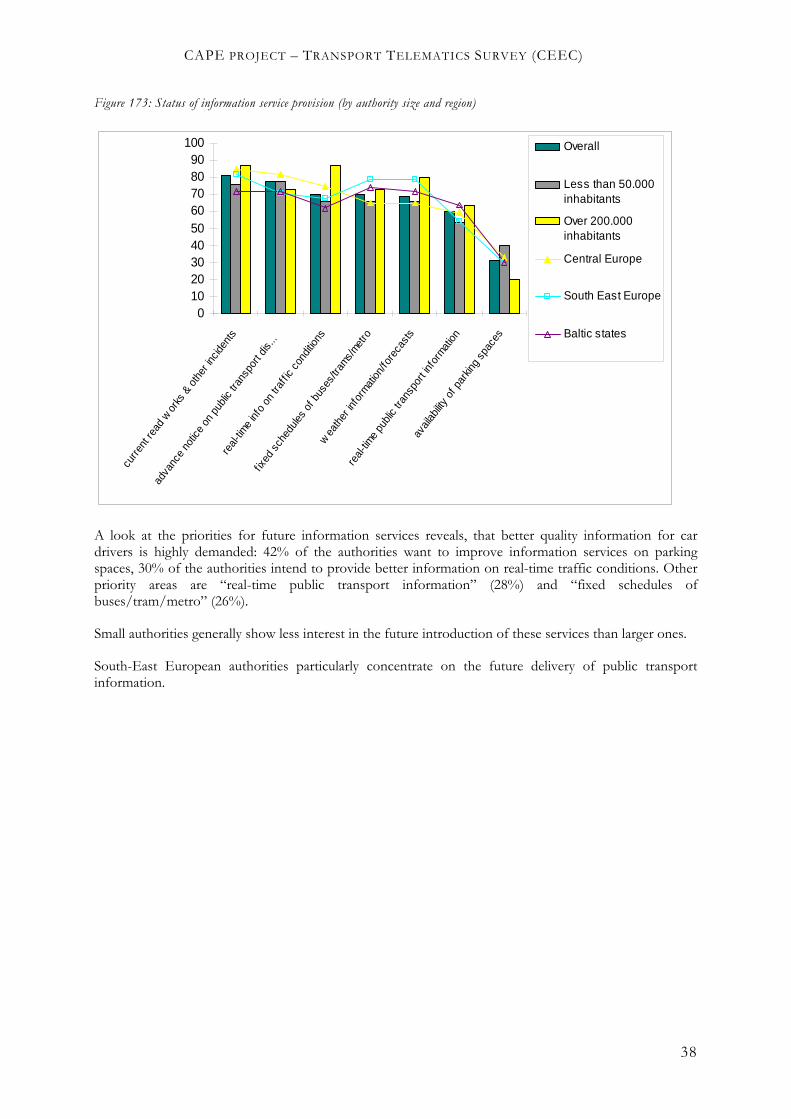
CAPE PROJECT – TRANSPORT TELEMATICS SURVEY (CEEC)
38
Figure 173: Status of information service provision (by authority size and region)
0102030405060708090
100
curre
nt re
ad w
orks
& o
ther
incid
ents
adva
nce
notic
e on
pub
lic tr
ansp
ort d
is...
real-
time
info
on tr
aff ic
con
dition
s
f ixed
sch
edule
s of
bus
es/tr
ams/
metro
wea
ther
info
rmat
ion/fo
reca
sts
real-
time
publi
c tra
nspo
rt inf
ormat
ion
avail
abilit
y of
par
king
spac
es
Overall
Less than 50.000inhabitants
Over 200.000inhabitants
Central Europe
South East Europe
Baltic states
A look at the priorities for future information services reveals, that better quality information for car drivers is highly demanded: 42% of the authorities want to improve information services on parking spaces, 30% of the authorities intend to provide better information on real-time traffic conditions. Other priority areas are “real-time public transport information” (28%) and “fixed schedules of buses/tram/metro” (26%).
Small authorities generally show less interest in the future introduction of these services than larger ones.
South-East European authorities particularly concentrate on the future delivery of public transport information.
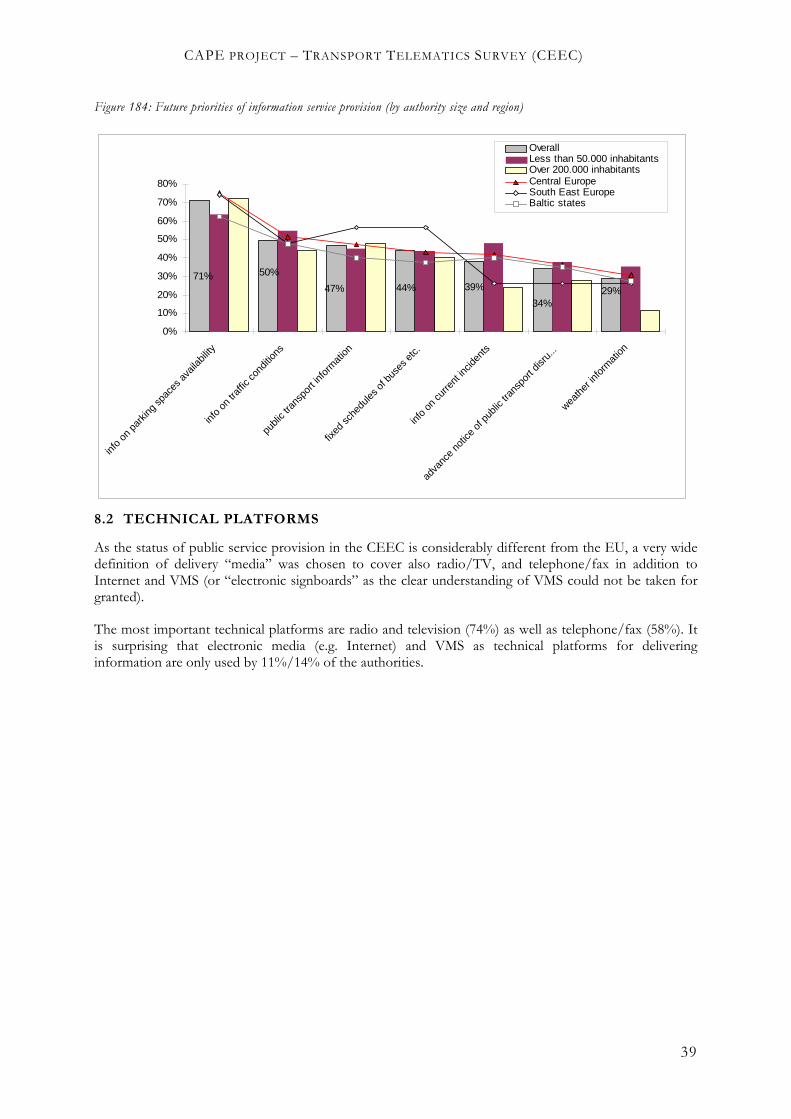
CAPE PROJECT – TRANSPORT TELEMATICS SURVEY (CEEC)
39
Figure 184: Future priorities of information service provision (by authority size and region)
29%
71% 50%
47% 44% 39%
34%
0%
10%
20%
30%
40%
50%
60%
70%
80%
info
on p
arkin
g sp
aces
ava
ilabil
ity
info
on tr
affic
cond
itions
publi
c tra
nspo
rt inf
orm
ation
fixed
sche
dules
of b
uses
etc.
info
on cu
rrent
incid
ents
adva
nce
notic
e of
pub
lic tr
ansp
ort d
isru.
..
weath
er in
form
ation
OverallLess than 50.000 inhabitantsOver 200.000 inhabitantsCentral EuropeSouth East EuropeBaltic states
8.2 TECHNICAL PLATFORMS
As the status of public service provision in the CEEC is considerably different from the EU, a very wide definition of delivery “media” was chosen to cover also radio/TV, and telephone/fax in addition to Internet and VMS (or “electronic signboards” as the clear understanding of VMS could not be taken for granted).
The most important technical platforms are radio and television (74%) as well as telephone/fax (58%). It is surprising that electronic media (e.g. Internet) and VMS as technical platforms for delivering information are only used by 11%/14% of the authorities.

CAPE PROJECT – TRANSPORT TELEMATICS SURVEY (CEEC)
40
Figure 195: Technical platforms for information service delivery24
info
on in
ciden
ts
wea
ther
info
rmat
ion
adva
nce
notic
e of
pub
lic tr
ansp
ort d
isr
info
on tr
affic
con
dition
s
fixed
sch
edule
s of
bus
es/tr
ams/
metro
publi
c tra
nspo
rt inf
o
info
on p
arkin
g sp
aces
ava
ilab.
electronic signboards (9%)
internet (12%)
phone/fax (58%)
radio/TV (74%)
55%52% 50%
44%
22%
21%
10%
27%
13%
33%27%
41%
34%
18%
5%4%
3% 3% 5%4%
1%
3%3% 4%
3% 4%3%
2%
0%
10%
20%
30%
40%
50%
60%
8.3 SUMMARY
For the delivery of information and services, it is worth noting that:
The substantial degree of information availability is high, but it is likely that the level of “real” information service is much lower.
The provision of information services seems to be better in large authorities.
Information on parking spaces and on real-time traffic conditions are those areas in which authorities want to improve information services with highest priority.
Electronic media such as Internet and VMS are used by only a small part of the authorities for information delivery. As a result, the technical preconditions for a greater application of telematics for the delivery of information and services to the public are limited at present for CEEC authorities, especially for small ones.
9 FINANCING OF TRANSPORT TECHNOLOGIES AND SERVICES
With respect to funding, which was identified to be by far the most important obstacle of a wider application of transport telematics, it is of particular interest to get an overview of what CEEC authorities are planning to spend on transport-related information and communication technology infrastructure.
24 The overall percentage for the use of different media platforms exceeds the percentages for the media in combination with the single services, since multiple responses were allowed in this question.
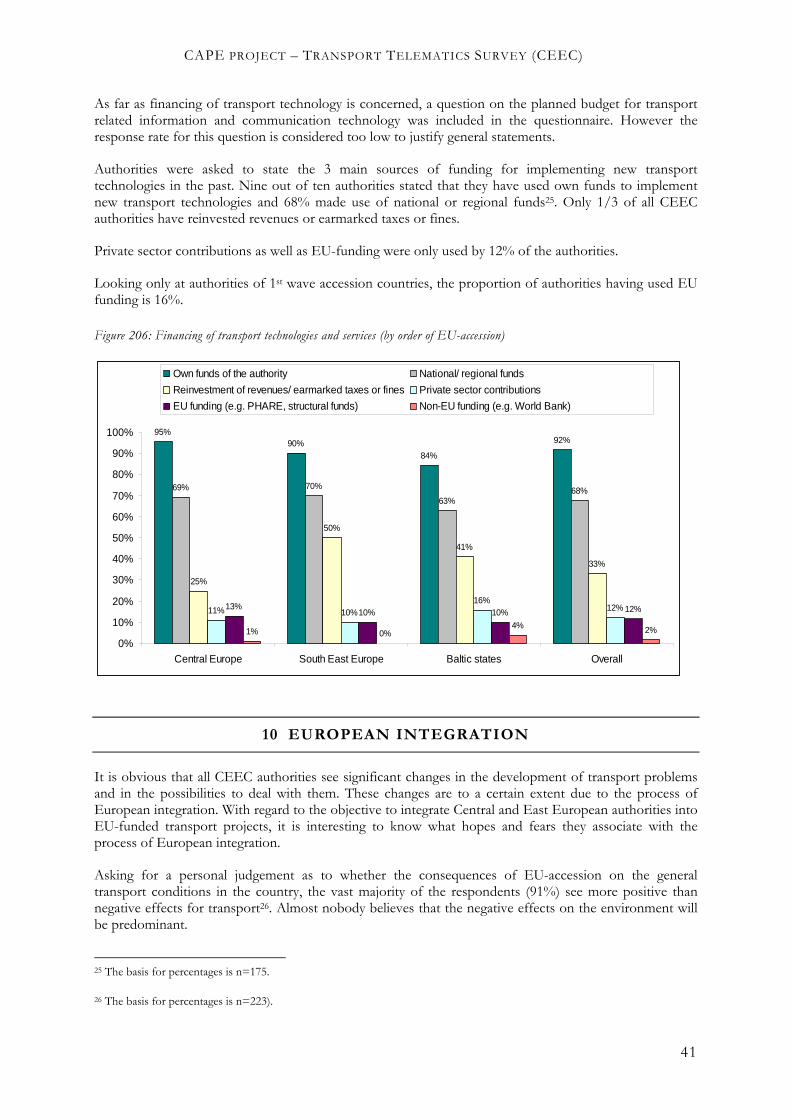
CAPE PROJECT – TRANSPORT TELEMATICS SURVEY (CEEC)
41
As far as financing of transport technology is concerned, a question on the planned budget for transport related information and communication technology was included in the questionnaire. However the response rate for this question is considered too low to justify general statements.
Authorities were asked to state the 3 main sources of funding for implementing new transport technologies in the past. Nine out of ten authorities stated that they have used own funds to implement new transport technologies and 68% made use of national or regional funds25. Only 1/3 of all CEEC authorities have reinvested revenues or earmarked taxes or fines.
Private sector contributions as well as EU-funding were only used by 12% of the authorities.
Looking only at authorities of 1st wave accession countries, the proportion of authorities having used EU funding is 16%.
Figure 206: Financing of transport technologies and services (by order of EU-accession)
95%90%
84%
92%
69% 70%
63%68%
25%
50%
41%
33%
11% 10%16%
12%13%10% 10% 12%
1% 0%4% 2%
0%
10%
20%
30%
40%
50%
60%
70%
80%
90%
100%
Central Europe South East Europe Baltic states Overall
Own funds of the authority National/ regional funds
Reinvestment of revenues/ earmarked taxes or fines Private sector contributions
EU funding (e.g. PHARE, structural funds) Non-EU funding (e.g. World Bank)
10 EUROPEAN INTEGRATION
It is obvious that all CEEC authorities see significant changes in the development of transport problems and in the possibilities to deal with them. These changes are to a certain extent due to the process of European integration. With regard to the objective to integrate Central and East European authorities into EU-funded transport projects, it is interesting to know what hopes and fears they associate with the process of European integration.
Asking for a personal judgement as to whether the consequences of EU-accession on the general transport conditions in the country, the vast majority of the respondents (91%) see more positive than negative effects for transport26. Almost nobody believes that the negative effects on the environment will be predominant.
25 The basis for percentages is n=175.
26 The basis for percentages is n=223).
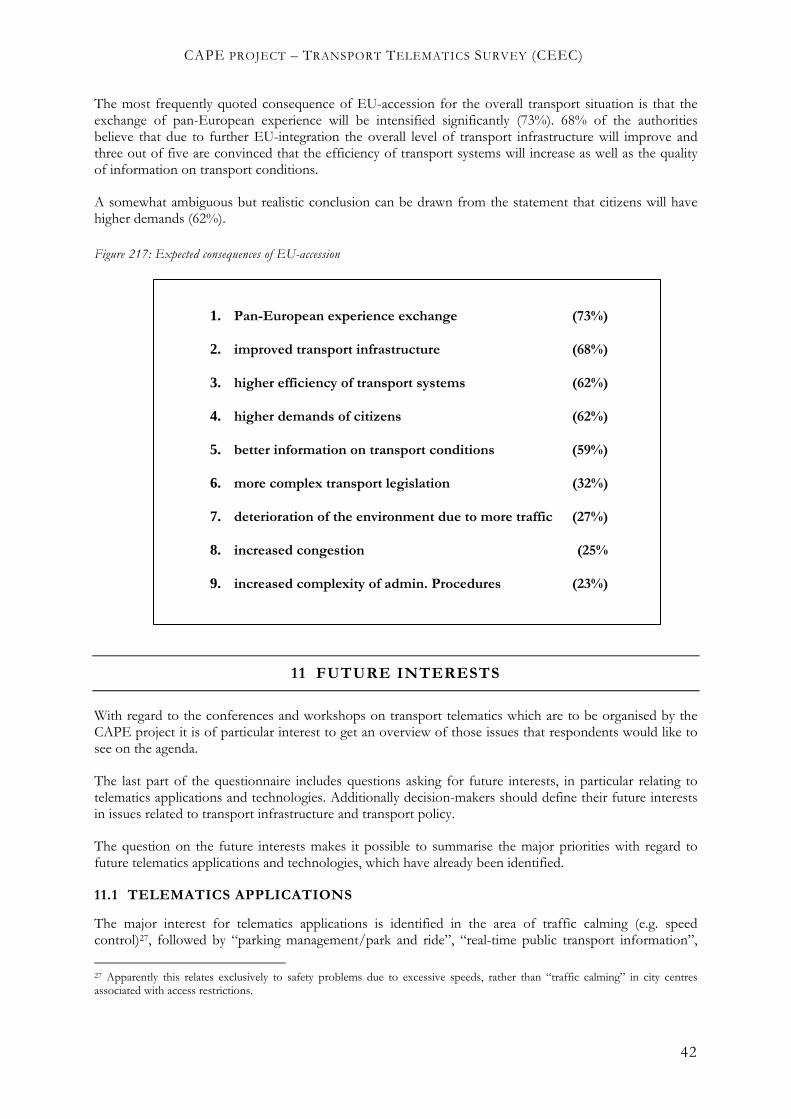
CAPE PROJECT – TRANSPORT TELEMATICS SURVEY (CEEC)
42
The most frequently quoted consequence of EU-accession for the overall transport situation is that the exchange of pan-European experience will be intensified significantly (73%). 68% of the authorities believe that due to further EU-integration the overall level of transport infrastructure will improve and three out of five are convinced that the efficiency of transport systems will increase as well as the quality of information on transport conditions.
A somewhat ambiguous but realistic conclusion can be drawn from the statement that citizens will have higher demands (62%).
Figure 217: Expected consequences of EU-accession
11 FUTURE INTERESTS
With regard to the conferences and workshops on transport telematics which are to be organised by the CAPE project it is of particular interest to get an overview of those issues that respondents would like to see on the agenda.
The last part of the questionnaire includes questions asking for future interests, in particular relating to telematics applications and technologies. Additionally decision-makers should define their future interests in issues related to transport infrastructure and transport policy.
The question on the future interests makes it possible to summarise the major priorities with regard to future telematics applications and technologies, which have already been identified.
11.1 TELEMATICS APPLICATIONS
The major interest for telematics applications is identified in the area of traffic calming (e.g. speed control)27, followed by “parking management/park and ride”, “real-time public transport information”,
27 Apparently this relates exclusively to safety problems due to excessive speeds, rather than “traffic calming” in city centres associated with access restrictions.
1. Pan-European experience exchange (73%)
2. improved transport infrastructure (68%)
3. higher efficiency of transport systems (62%)
4. higher demands of citizens (62%)
5. better information on transport conditions (59%)
6. more complex transport legislation (32%)
7. deterioration of the environment due to more traffic (27%)
8. increased congestion (25%
9. increased complexity of admin. Procedures (23%)
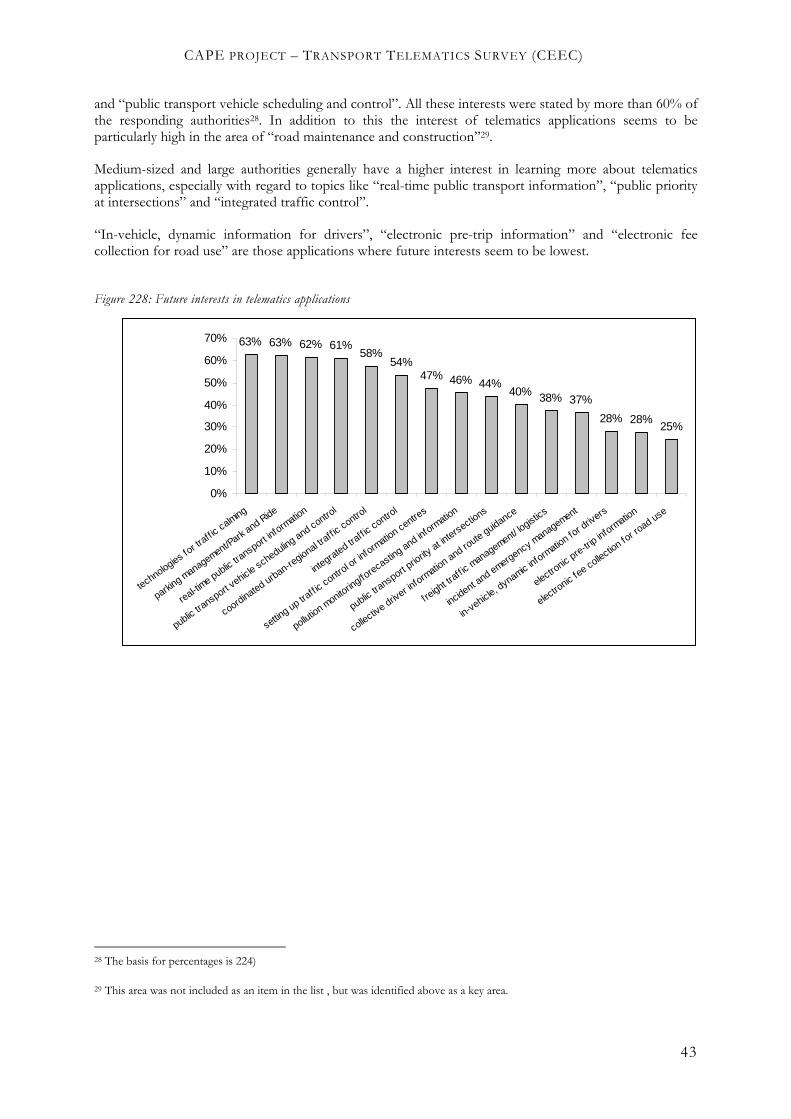
CAPE PROJECT – TRANSPORT TELEMATICS SURVEY (CEEC)
43
and “public transport vehicle scheduling and control”. All these interests were stated by more than 60% of the responding authorities28. In addition to this the interest of telematics applications seems to be particularly high in the area of “road maintenance and construction”29.
Medium-sized and large authorities generally have a higher interest in learning more about telematics applications, especially with regard to topics like “real-time public transport information”, “public priority at intersections” and “integrated traffic control”.
“In-vehicle, dynamic information for drivers”, “electronic pre-trip information” and “electronic fee collection for road use” are those applications where future interests seem to be lowest.
Figure 228: Future interests in telematics applications
63% 63% 62% 61%58%
54%47% 46% 44%
40% 38% 37%
28% 28%25%
0%
10%
20%
30%
40%
50%
60%
70%
technologies for tr
aff ic calming
parking m
anagement/Park
and Ride
real-time public tra
nsport inform
ation
public transport v
ehicle scheduling and control
coordinated urban-regional tr
aff ic contro
l
integrated traff ic
control
setting up tra
ff ic contro
l or in
formatio
n centres
pollution m
onitorin
g/forecastin
g and inform
ation
public transport p
riority
at intersectio
ns
collective driv
er inform
ation and ro
ute guidance
freight tr
aff ic m
anagement/ logistic
s
incident and emergency m
anagement
in-vehicle, dynamic in
formatio
n for d
rivers
electronic pre-tr
ip inform
ation
electronic fe
e collection fo
r road use
28 The basis for percentages is 224)
29 This area was not included as an item in the list , but was identified above as a key area.
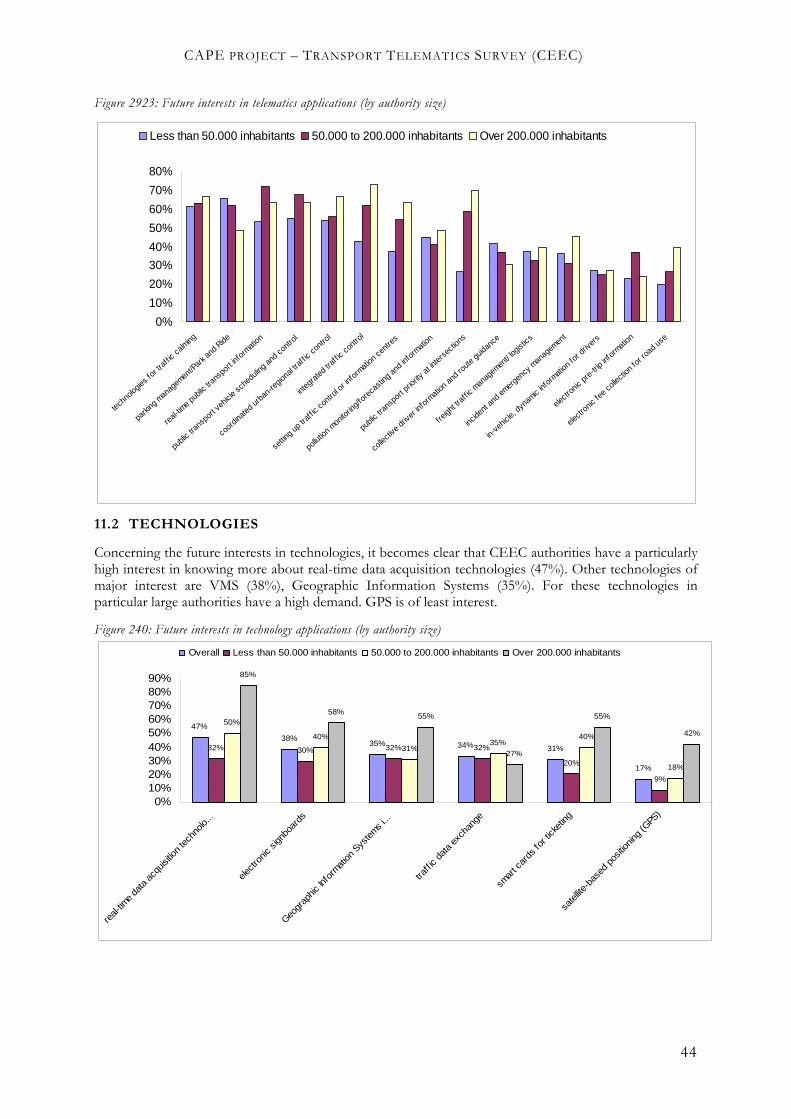
CAPE PROJECT – TRANSPORT TELEMATICS SURVEY (CEEC)
44
Figure 2923: Future interests in telematics applications (by authority size)
0%
10%
20%
30%
40%
50%
60%
70%
80%
techn
ologie
s for
traf
f ic ca
lming
parki
ng m
anag
emen
t/Par
k and
Ride
real-
time p
ublic
tran
spor
t info
rmati
on
publi
c tra
nspo
rt ve
hicle
sche
dulin
g and
contr
ol
coor
dinate
d urb
an-re
giona
l traf
f ic co
ntrol
integ
rated
traf
f ic co
ntrol
settin
g up t
raff i
c con
trol o
r info
rmati
on ce
ntres
pollu
tion m
onito
ring/f
orec
astin
g and
info
rmati
on
publi
c tra
nspo
rt pr
iority
at in
terse
ction
s
colle
ctive
drive
r info
rmati
on an
d rou
te gu
idanc
e
freigh
t traf
f ic m
anag
emen
t/ log
istics
incide
nt an
d emer
genc
y man
agem
ent
in-ve
hicle,
dyna
mic inf
ormati
on fo
r driv
ers
electr
onic
pre-
trip in
form
ation
electr
onic
fee c
ollec
tion f
or ro
ad us
e
Less than 50.000 inhabitants 50.000 to 200.000 inhabitants Over 200.000 inhabitants
11.2 TECHNOLOGIES
Concerning the future interests in technologies, it becomes clear that CEEC authorities have a particularly high interest in knowing more about real-time data acquisition technologies (47%). Other technologies of major interest are VMS (38%), Geographic Information Systems (35%). For these technologies in particular large authorities have a high demand. GPS is of least interest.
Figure 240: Future interests in technology applications (by authority size)
47%
38%35% 34% 31%
17%
32% 30% 32% 32%
20%
9%
50%
40%
31%35%
40%
18%
85%
58% 55%
27%
55%
42%
0%10%20%30%40%50%60%70%80%90%
real-
time da
ta a
cquis
ition te
chno
lo...
electro
nic s
ignbo
ards
Geogr
aphic
Info
rmat
ion S
ystems
i...
traffi
c da
ta exc
hang
e
smar
t car
ds fo
r tick
eting
satellit
e-ba
sed
posit
ioning
(GPS
)
Overall Less than 50.000 inhabitants 50.000 to 200.000 inhabitants Over 200.000 inhabitants
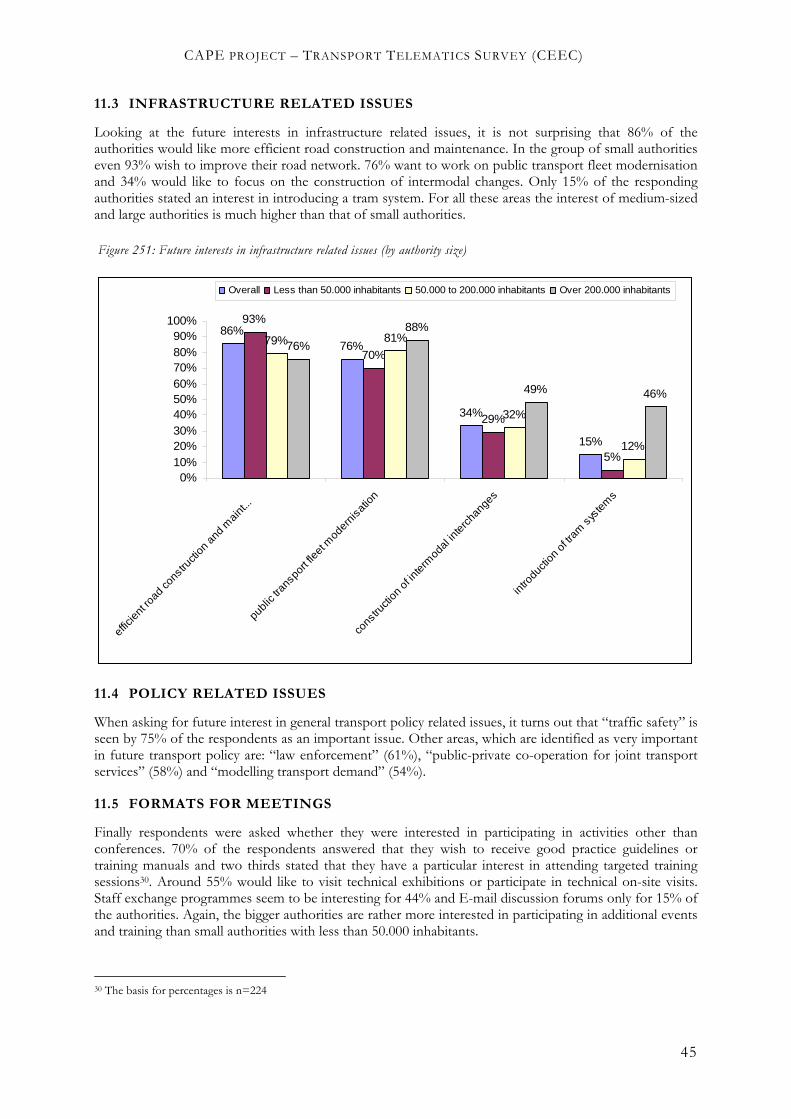
CAPE PROJECT – TRANSPORT TELEMATICS SURVEY (CEEC)
45
11.3 INFRASTRUCTURE RELATED ISSUES
Looking at the future interests in infrastructure related issues, it is not surprising that 86% of the authorities would like more efficient road construction and maintenance. In the group of small authorities even 93% wish to improve their road network. 76% want to work on public transport fleet modernisation and 34% would like to focus on the construction of intermodal changes. Only 15% of the responding authorities stated an interest in introducing a tram system. For all these areas the interest of medium-sized and large authorities is much higher than that of small authorities.
Figure 251: Future interests in infrastructure related issues (by authority size)
86%76%
34%
15%
93%
70%
29%
5%
79% 81%
32%
12%
76%
88%
49% 46%
0%10%20%30%40%50%60%70%80%90%
100%
effic
ient
road
cons
tructi
on a
nd m
aint
...
publ
ic tra
nspo
rt fle
et m
oder
nisa
tion
cons
tructi
on o
f inte
rmod
al in
terc
hang
es
intro
ducti
on o
f tram
sys
tem
s
Overall Less than 50.000 inhabitants 50.000 to 200.000 inhabitants Over 200.000 inhabitants
11.4 POLICY RELATED ISSUES
When asking for future interest in general transport policy related issues, it turns out that “traffic safety” is seen by 75% of the respondents as an important issue. Other areas, which are identified as very important in future transport policy are: “law enforcement” (61%), “public-private co-operation for joint transport services” (58%) and “modelling transport demand” (54%).
11.5 FORMATS FOR MEETINGS
Finally respondents were asked whether they were interested in participating in activities other than conferences. 70% of the respondents answered that they wish to receive good practice guidelines or training manuals and two thirds stated that they have a particular interest in attending targeted training sessions30. Around 55% would like to visit technical exhibitions or participate in technical on-site visits. Staff exchange programmes seem to be interesting for 44% and E-mail discussion forums only for 15% of the authorities. Again, the bigger authorities are rather more interested in participating in additional events and training than small authorities with less than 50.000 inhabitants.
30 The basis for percentages is n=224

CAPE PROJECT – TRANSPORT TELEMATICS SURVEY (CEEC)
46
Figure 262: Expected formats for meetings
70%67%
57% 55%
44%
15%0%
10%
20%
30%
40%
50%
60%
70%
80%
90%
good
pra
ctice
guid
eline
s/ tra
ining
man
uals
Targe
ted
traini
g se
ssion
s
Techn
ical e
xhibi
tions
Techn
ical o
n sit
e vis
its
Staff
exch
ange
pro
gram
mes
disc
ussio
n fo
rum
Overall
Less than 50.000 inhabitants50.000 to 200.000 inhabitantsOver 200.000 inhabitants
11.6 SUMMARY
To sum up, the future interests for conferences and workshops can be seen in the following areas:
Interest to learn about using new telematics applications are extremely high. One half of respondents or more was interested in almost any supported item.
The most interesting areas related to telematics applications seem to be “road maintenance/ construction planning”, “traffic calming” (e.g. speed control) and “real-time public transport information”, closely followed by a wide range of other areas.
Interests to learn more about new technologies are equally high, especially for real-time data acquisition technologies.
The demand for telematics technologies is particularly high in medium-sized and large authorities as well as in South-East Europe.
In terms of infrastructure related issues the vast majority of CEE authorities are interested in more efficient road construction and maintenance.
Policy interests are highest in traffic safety, law enforcement and public-private co-operation for joint transport services are considered as important issues of future transport policy.
The relevance of formats chosen by the CAPE project (especially good practice guides and targeted training) are confirmed by respondents primary interests.

CAPE PROJECT – TRANSPORT TELEMATICS SURVEY (CEEC)
ANNEX I: PROCEDURES FOR THE QUESTIONNAIRE SURVEY
DATABASE CREATION
For the mailing database, the following data was available:
Data researched systematically by consortium partners (Regional Environmental Centre, REC (Hungary), Prague Project Institute, PPI (Czech Republic) and Gestionnaires Sans Frontières, GSF (Romania). The consortium partners from CEEC have systematically researched local and regional authority contacts on the basis of their own established communication links. This approach was considered preferable because especially in the CEEC personal contacts are key to producing comparatively high return rates and for CEEC public authorities data sources are not of a comparable quality and reliability. Therefore REC, GSF and PPI have selected authorities in the CEEC through their regional offices. In many cases researched contact persons were telephoned to verify contact details.
Data extracted from the European Local Government Organisation (ELGO) data base. In order to complement the systematically researched data sources with randomly selected data from missing or underrepresented countries and sectors, POLIS has acquired ELGO data from Newmedia Publishing for the exclusive use in the CAPE survey.
The ELGO database is the only available systematic source of local and regional government information in Europe. ELGO includes full contact information and population figures from all layers of local and regional government in all European countries. For the CEE Transport survey, POLIS has acquired the following data:
Chief Executive Officers in authorities between 20,000 and less than 100,000 inhabitants for all CEEC countries.
Responsible officers in transport departments of authorities above 100,000 population for all EU and CEEC countries.
SELECTION PROCESS
For the setting up of the mailing data base the following criteria were defined:
All systematically researched data had preference over any data from ELGO as it was considered to be of higher quality and reliability.
As far as possible the contact data research was based on direct contacts with local authorities. National contact points were used to confirm names and contact details of representatives.
Target numbers for local authorities in all target countries were established in order to ensure representativeness.
The mailing focussed on larger and medium sized authorities, since small authorities were considered less likely to have sufficient power for implementing telematics systems or had a low degree of independence to pursue any own policies
The mailing data base should be representative for all layers of local and regional level in order to allow general conclusions and the internal distribution between large and small authorities in each country should be considered.
To meet the requirement of representativeness, approximate target numbers for each country were determined by the relative share of population for each country in relation to overall CEEC/ EU population.
For the selection of the mailing data base for the CEEC transport survey two approaches were chosen:
Project partner representatives selected roughly the targeted amount on the basis of their own specific local knowledge of typical authorities. Target numbers could be reasonably well met. The result is although not strictly a random sample, nonetheless considered as fair and representative selection of authorities in each country.

CAPE PROJECT – TRANSPORT TELEMATICS SURVEY (CEEC)
48
Data from the ELGO database was added. A random sample was drawn for CEEC transport contacts where only an insufficient number of contacts could be made available. The resulting ELGO mailing database contained a randomly selected “stratified sample” of local and regional authorities. It can be considered as representative of all levels of local government institutions in all CEEC member states.
MAILING AND DATA ENTRY
RC provided an English version of the questionnaire and consortium members provided national language versions on that basis. For the CEEC it was considered as essential that all 10 languages should be covered.31. All translations were prepared/ proof read by native speakers. Partners were advised to pay special attention to producing identical layouts of questionnaires.
The burden of mailing was split within the consortium. The questionnaires were accompanied by a cover letter introducing the CAPE project and the benefits of participating in the survey. Questionnaires were sent out in September/October 1998.
An ACCESS-data entry mask was supplied by RC. Data entry was done by GSF and PPU and finished in November 98.
31 According to personal contacts of REC local offices only 1 in 5 persons said they would be able to answer an English questionnaire.

CAPE PROJECT – TRANSPORT TELEMATICS SURVEY (CEEC)
49
ANNEX II: SURVEY RESPONSE AND REPRESENTATIVENESS
851 questionnaires in all were sent out by the different CAPE partners for the CAPE survey on transport telematics in CEEC authorities. 229 questionnaires or 27% of the questionnaires were returned. This return rate is considerably higher than the optimistic target of 20%. The table below clearly shows that the response rates vary considerably from one country to another. In particular the Baltic states were very active in responding to the questionnaires. In these countries far more than 50% of all questionnaires, in Estonia even more than 65%, were returned. The return rates in Bulgaria and Hungary however are far below the target rate of 20%. The relatively low response rates in these countries are partly due to specific local difficulties outside the control of the project 32.
The geographical dispersion of the responding authorities is as follows: the majority of the responses (58%) come from Central Europe (Poland, Czech Republic, Slovak Republic Hungary) and another 15% of the responses were sent back by authorities from South-East Europe (Bulgaria, Romania, Slovenia). 27% of all questionnaires were returned by authorities from Baltic authorities.
Figure 273: Sample size and response rate
Country Questionnaires sent Questionnaires received Return rate
Bulgaria 38 2 5,3% Czech Rep. 78 20 25,6%
Estonia 21 14 66,7%
Hungary 39 6 15,4%
Latvia 55 32 58,2%
Lithuania 26 15 57,7%
Poland 400 83 20,8%
Romania 108 28 25,9%
Slovak Rep. 68 25 36,8%
Slovenia 18 4 22,2%
Total 851 229 26,9%
32 Bulgaria and Hungary: The low response rate noted in these countries had two main causes: the lack of habit to participate in similar surveys and the high priority given to other events at that time (e.g. local elections)
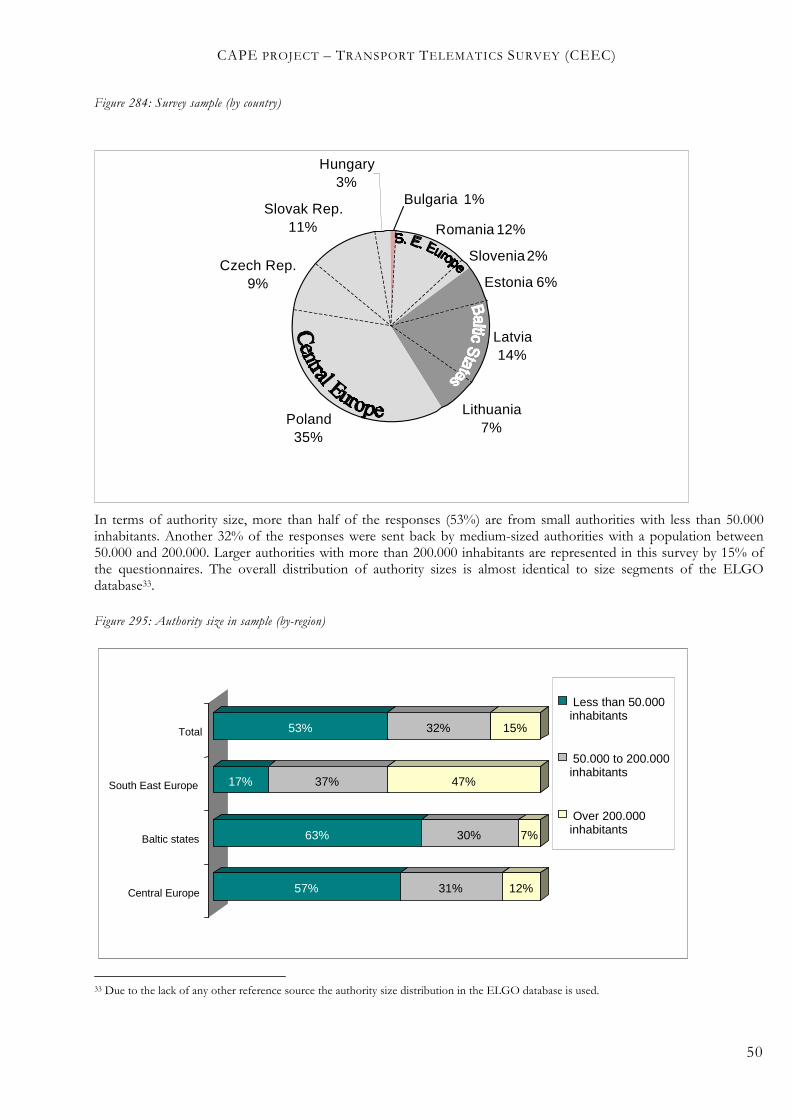
CAPE PROJECT – TRANSPORT TELEMATICS SURVEY (CEEC)
50
Figure 284: Survey sample (by country)
Bulgaria 1%
Romania 12%
Slovenia2%
Estonia 6%
Latvia14%
Lithuania7%
Poland35%
Czech Rep.9%
Slovak Rep.11%
Hungary3%
In terms of authority size, more than half of the responses (53%) are from small authorities with less than 50.000 inhabitants. Another 32% of the responses were sent back by medium-sized authorities with a population between 50.000 and 200.000. Larger authorities with more than 200.000 inhabitants are represented in this survey by 15% of the questionnaires. The overall distribution of authority sizes is almost identical to size segments of the ELGO database33.
Figure 295: Authority size in sample (by-region)
57% 31% 12%
63% 30% 7%
17% 37% 47%
53% 32% 15%
Central Europe
Baltic states
South East Europe
Total
Less than 50.000inhabitants
50.000 to 200.000inhabitants
Over 200.000inhabitants
33 Due to the lack of any other reference source the authority size distribution in the ELGO database is used.
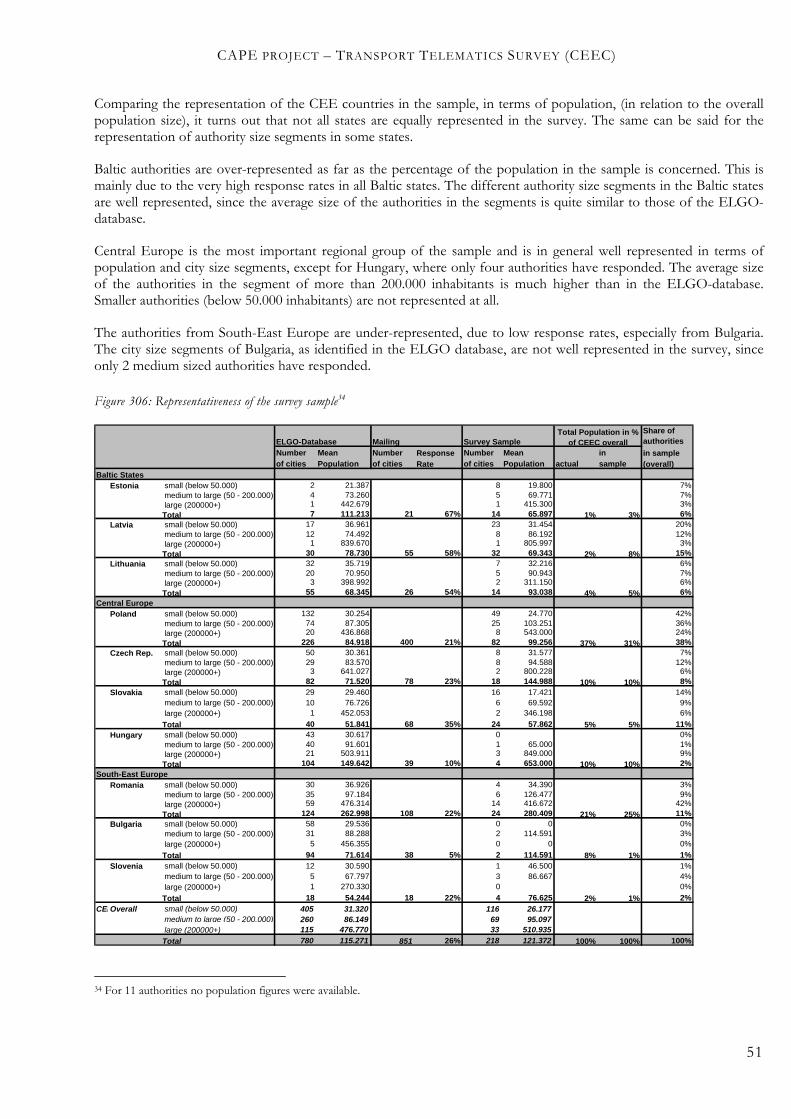
CAPE PROJECT – TRANSPORT TELEMATICS SURVEY (CEEC)
51
Comparing the representation of the CEE countries in the sample, in terms of population, (in relation to the overall population size), it turns out that not all states are equally represented in the survey. The same can be said for the representation of authority size segments in some states.
Baltic authorities are over-represented as far as the percentage of the population in the sample is concerned. This is mainly due to the very high response rates in all Baltic states. The different authority size segments in the Baltic states are well represented, since the average size of the authorities in the segments is quite similar to those of the ELGO-database.
Central Europe is the most important regional group of the sample and is in general well represented in terms of population and city size segments, except for Hungary, where only four authorities have responded. The average size of the authorities in the segment of more than 200.000 inhabitants is much higher than in the ELGO-database. Smaller authorities (below 50.000 inhabitants) are not represented at all.
The authorities from South-East Europe are under-represented, due to low response rates, especially from Bulgaria. The city size segments of Bulgaria, as identified in the ELGO database, are not well represented in the survey, since only 2 medium sized authorities have responded.
Figure 306: Representativeness of the survey sample34
ELGO-Database Mailing Survey Sample
Share of authorities
Number Mean Number Response Number Mean in in sampleof cities Population of cities Rate of cities Population actual sample (overall)
Baltic StatesEstonia small (below 50.000) 2 21.387 8 19.800 7%
medium to large (50 - 200.000) 4 73.260 5 69.771 7% large (200000+) 1 442.679 1 415.300 3%Total 7 111.213 21 67% 14 65.897 1% 3% 6%
Latvia small (below 50.000) 17 36.961 23 31.454 20% medium to large (50 - 200.000) 12 74.492 8 86.192 12% large (200000+) 1 839.670 1 805.997 3%
Total 30 78.730 55 58% 32 69.343 2% 8% 15%Lithuania small (below 50.000) 32 35.719 7 32.216 6%
medium to large (50 - 200.000) 20 70.950 5 90.943 7% large (200000+) 3 398.992 2 311.150 6%
Total 55 68.345 26 54% 14 93.038 4% 5% 6%Central Europe
Poland small (below 50.000) 132 30.254 49 24.770 42% medium to large (50 - 200.000) 74 87.305 25 103.251 36% large (200000+) 20 436.868 8 543.000 24%Total 226 84.918 400 21% 82 99.256 37% 31% 38%
Czech Rep. small (below 50.000) 50 30.361 8 31.577 7% medium to large (50 - 200.000) 29 83.570 8 94.588 12% large (200000+) 3 641.027 2 800.228 6%
Total 82 71.520 78 23% 18 144.988 10% 10% 8%
Slovakia small (below 50.000) 29 29.460 16 17.421 14% medium to large (50 - 200.000) 10 76.726 6 69.592 9% large (200000+) 1 452.053 2 346.198 6%
Total 40 51.841 68 35% 24 57.862 5% 5% 11%Hungary small (below 50.000) 43 30.617 0 0%
medium to large (50 - 200.000) 40 91.601 1 65.000 1% large (200000+) 21 503.911 3 849.000 9%Total 104 149.642 39 10% 4 653.000 10% 10% 2%
South-East EuropeRomania small (below 50.000) 30 36.926 4 34.390 3%
medium to large (50 - 200.000) 35 97.184 6 126.477 9% large (200000+) 59 476.314 14 416.672 42%
Total 124 262.998 108 22% 24 280.409 21% 25% 11%Bulgaria small (below 50.000) 58 29.536 0 0 0%
medium to large (50 - 200.000) 31 88.288 2 114.591 3% large (200000+) 5 456.355 0 0 0%
Total 94 71.614 38 5% 2 114.591 8% 1% 1%
Slovenia small (below 50.000) 12 30.590 1 46.500 1% medium to large (50 - 200.000) 5 67.797 3 86.667 4% large (200000+) 1 270.330 0 0%
Total 18 54.244 18 22% 4 76.625 2% 1% 2%
CEEOverall small (below 50.000) 405 31.320 116 26.177 medium to large (50 - 200.000) 260 86.149 69 95.097 large (200000+) 115 476.770 33 510.935
Total 780 115.271 851 26% 218 121.372 100% 100% 100%
Total Population in % of CEEC overall
34 For 11 authorities no population figures were available.
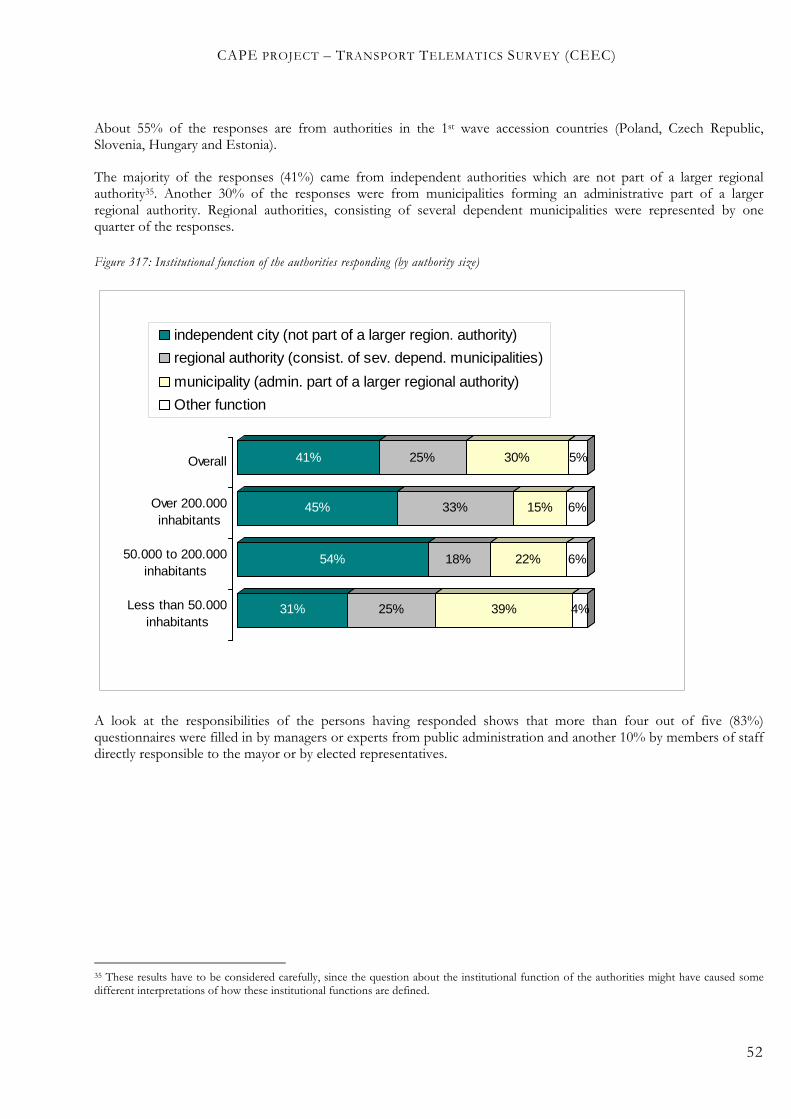
CAPE PROJECT – TRANSPORT TELEMATICS SURVEY (CEEC)
52
About 55% of the responses are from authorities in the 1st wave accession countries (Poland, Czech Republic, Slovenia, Hungary and Estonia).
The majority of the responses (41%) came from independent authorities which are not part of a larger regional authority35. Another 30% of the responses were from municipalities forming an administrative part of a larger regional authority. Regional authorities, consisting of several dependent municipalities were represented by one quarter of the responses.
Figure 317: Institutional function of the authorities responding (by authority size)
31% 25% 39% 4%
54% 18% 22% 6%
45% 33% 15% 6%
41% 25% 30% 5%
Less than 50.000inhabitants
50.000 to 200.000inhabitants
Over 200.000inhabitants
Overall
independent city (not part of a larger region. authority)
regional authority (consist. of sev. depend. municipalities)
municipality (admin. part of a larger regional authority)
Other function
A look at the responsibilities of the persons having responded shows that more than four out of five (83%) questionnaires were filled in by managers or experts from public administration and another 10% by members of staff directly responsible to the mayor or by elected representatives.
35 These results have to be considered carefully, since the question about the institutional function of the authorities might have caused some different interpretations of how these institutional functions are defined.
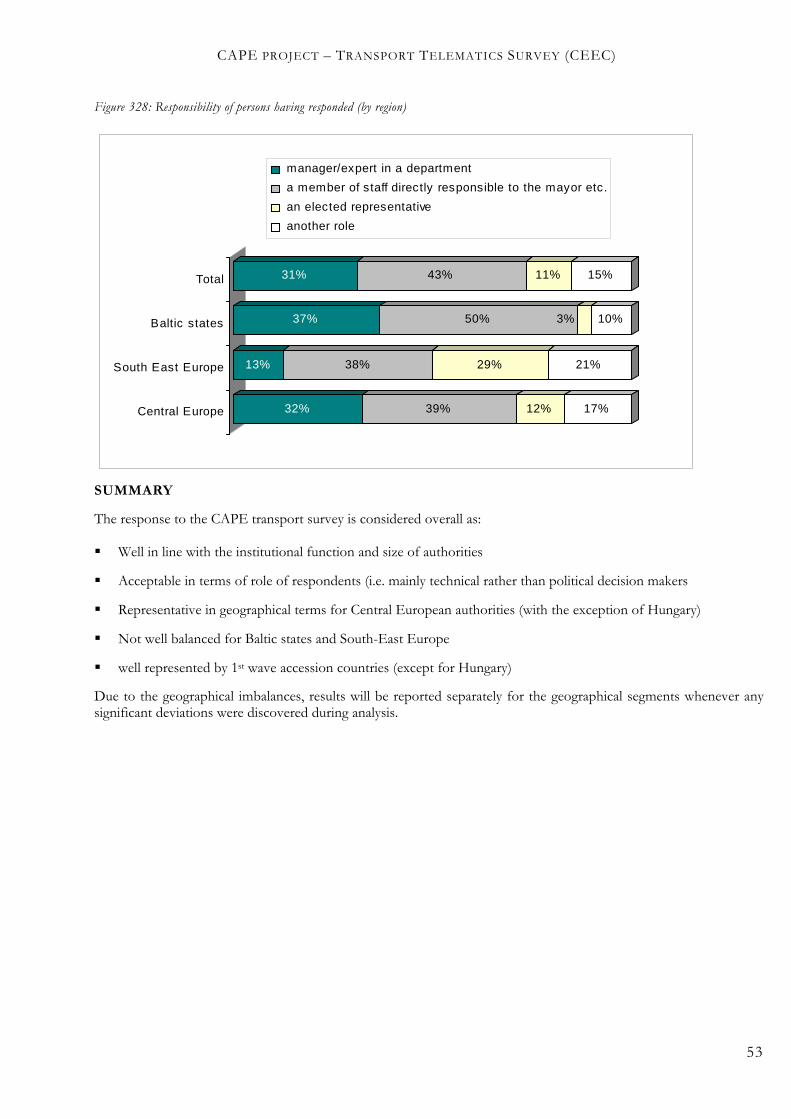
CAPE PROJECT – TRANSPORT TELEMATICS SURVEY (CEEC)
53
Figure 328: Responsibility of persons having responded (by region)
32% 39% 12% 17%
13% 38% 29% 21%
37% 50% 3% 10%
31% 43% 11% 15%
Central Europe
South East Europe
Baltic states
Total
manager/expert in a department
a member of staff directly responsible to the mayor etc.
an elected representative
another role
SUMMARY
The response to the CAPE transport survey is considered overall as:
Well in line with the institutional function and size of authorities
Acceptable in terms of role of respondents (i.e. mainly technical rather than political decision makers
Representative in geographical terms for Central European authorities (with the exception of Hungary)
Not well balanced for Baltic states and South-East Europe
well represented by 1st wave accession countries (except for Hungary)
Due to the geographical imbalances, results will be reported separately for the geographical segments whenever any significant deviations were discovered during analysis.

CAPE PROJECT – TRANSPORT TELEMATICS SURVEY (CEEC)
54
ANNEX III: QUESTIONNAIRE ON TRANSPORT TELEMATICS IN CEEC
SURVEY ON TRANSPORT MANAGEMENT IN CENTRAL EUROPEAN CITIES AND REGIONS:
1000 decision makers state their priorities!
Please take a few minutes to complete this questionnaire which will help us to understand your authority better, the range of transport problems you currently face, and your use of information and communication technology.
Please respond by__________and return the completed questionnaire to the following address:
or fax to:
Background information on your area and organisation.
1. Please give the following basic information for your city (or region)!
Name of authority:36 ............................................................................................................... Country: ..........................................
Institutional function of your organisation? Tick the most appropriate box, please!
an independent city (not subject to a larger regional authority) a regional authority (containing several dependent municipalities) a municipality (administratively subject to a larger regional authority)
Other function ................................................................................................................................. ( Please specify).
Population of city (or region) 37: ................................................................................................................. ( Please specify).
2. Please provide some information on your organisation! Estimate the following figures, please:
Number of employees (white collar only) ................................................... ( Please specify).
What is your organisation’s total projected expenditure this year? ca. ................................................. currency: ...................
3. What is your role or primary responsibility in your organisation? Tick only the most appropriate box, please!
I am a manager or expert in the department which is responsible for ... Transportation Planning Economic development/ urban regeneration Traffic control International affairs Technical services/ information technology Building/ Architecture/ Town Planning
Other department .................................................................................... ( Please specify).
I am a member of staff directly responsible to the mayor, chief executive etc. I am an elected representative (e.g. mayor, councillor, chief executive) I have another role ....................................................................................................................... ( Please specify).
Factual information on the transport system.
4. What was the relative proportion of the different transport modes (in %) of all journeys (modal split) in 1997 – and what was the situation in the year 1995 in your city (or region)? ( Estimate figures, please!)
1995 1997
.................... .................. % motorised (private) traffic
.................... .................. % public transport (all types)
.................... .................. % cycling and walking
5. What was the number of private cars per thousand inhabitants in 1997 – and what was it in 1995 in your city (or region)? ( Estimate figures, please!)
1995: .......................................................................... cars per 1000 inhabitants
1997: .......................................................................... cars per 1000 inhabitants
36 If you prefer you can answer anonymously.
37 Please note: Urban authorities please answer for your own authority´s urban geographic area. Regional authorities please answer for your authority´s entire area of responsibility.
CAPE PROJECT – TRANSPORT TELEMATICS SURVEY (CEEC)
55
6. What was the number of public transport passengers in 1997 – and what was it in 1995 in your city (or region)? ( Estimate figures, please!)
1995: .......................................................................... passengers
1997: .......................................................................... passengers
7. How many people were killed in road traffic accidents in 1997 in your city (or region)? ( Estimate figures, please!)
.......................................................................... fatalities
8. Were there any critical air quality levels breached during the last 12 months (i.e. the responsible authority was legally obliged to inform the public)? Tick one box, please!
No Yes, on .................................................... days. ( Estimate a figure, please!)
9. How is your public transport authority operating in institutional terms? Tick all applicable boxes, please!
Fully state/ publicly owned. Legally operating as a commercial company. Competing with other (private) public transport providers.
Key transport problems and policies.
10. What do you feel are currently the three largest problems related to transport in your own city or region (in order of priority)? Please give a few keywords!
Our most pressing problem is: ...............................................................................................................................................
Our 2nd most pressing problem is: ........................................................................................................................................
Our 3rd most pressing problem is: .........................................................................................................................................
11.This is a list of some common transport problems. How is your authority dealing with these? Tick all applicable boxes for each area, please!
This is not an important problem
for us at the moment.
This is an important problem, which ... This will be a priority area
in future policies. ... we can solve in the
next 3 years. ... will take many
years to be solved. public transport : insufficient capacity of networks ------------------ ------------------ ---------------------- ------- ---- -----
low quality of rolling stock/ infrastructure --------- ------------------ ---------------------- ------- ---- ----- low reliability/ efficiency of operation ------------- ------------------ ---------------------- ------- ---- ----- high public funding levels ---------------------------- ------------------ ---------------------- ------- ---- ----- institutional issues ------------------------------------- ------------------ ---------------------- ------- ---- -----
private road traffic: condition/ maintenance of roads ------------------ ------------------ ---------------------- ------- ---- ----- lack of parking spaces---------------------------------- ------------------ ---------------------- ------- ---- ----- low efficiency of traffic management -------------- ------------------ ---------------------- ------- ---- ----- regular congestion/ low capacity ------------------- ------------------ ---------------------- ------- ---- -----
interchange between transport modes --------------------- ------------------ ---------------------- ------- ---- ----- lack of traffic information for drivers/ travellers ---------- ------------------ ---------------------- ------- ---- ----- low compliance with traffic regulations --------------------- ------------------ ---------------------- ------- ---- ----- high accident rates ----------------------------------------------- ------------------ ---------------------- ------- ---- ----- low safety for pedestrians/ cyclists -------------------------- ------------------ ---------------------- ------- ---- ----- heavy freight traffic --------------------------------------------- ------------------ ---------------------- ------- ---- ----- high air/ noise pollution levels -------------------------------- ------------------ ---------------------- ------- ---- ----- insufficient transport planning ------------------------------- ------------------ ---------------------- ------- ---- ----- low knowledge on transport demands --------------------- ------------------ ---------------------- ------- ---- -----
other ( ) ---------------------------------------------------------- ------------------ ---------------------- ------- ---- -----
other ( ) ---------------------------------------------------------- ------------------ ---------------------- ------- ---- -----
CAPE PROJECT – TRANSPORT TELEMATICS SURVEY (CEEC)
56
12. Is there a comprehensive transport plan in force which addresses the major transport problems of your city (or region)? Tick one box only, please!
Yes No, but there are sectoral plans for certain areas (e.g. road building) No, there are no formal policy plans in force.
13. Are there policies in operation in the following areas in your city/ region to..? Tick one box for each area, please!
YesNo,
but plannedNo
(not planned) enlarge the public transport offer ------------------------ ------------------ ---------------------- ------- improve public transport services/operation ----------- ------------------ ---------------------- ------- put forward institutional reform of public transport --- ------------------ ---------------------- ------- increase traveller/driver information --------------------- ------------------ ---------------------- ------- improve traffic management -------------------------------- ------------------ ---------------------- ------- charge for parking/ road use ------------------------------- ------------------ ---------------------- ------- restrict road access/ car use -------------------------------- ------------------ ---------------------- ------- develop transport/ land-use plans ----------------------- ------------------ ---------------------- ------- facilitate cycling and walking ------------------------------- ------------------ ---------------------- ------- raise public awareness (for env. friendly transport) --- ------------------ ---------------------- -------
14. How would you personally judge the efficiency of your authority's transport policies? Tick one box, please!
We have made little progress over the last 3 years. We have been dealing with some effects only and have not addressed the real problems. We have made slow progress but we are going in the right direction. We have been successful in improving transport conditions in most key areas.
Impact and relevance of technology
15. What do you personally believe the impact of information and communication technologies might be in the next 2 - 3 years? Tick one box for each area, please! The impact will be ... ... in these areas ...
low (i.e. no or very little
actual change)
moderate (i.e. some benefits
are expected)
significant (i.e. major improvements
will be achieved) enhanced traffic safety ---------------------------------------------------- ------------------------------- ------------------------------- ---------------- efficient management of transport demand ------------------------- --------------------------- ------------------------------- ---------------- accessibility of activity centres ---------------------------------------- --------------------------- --------------------------- -------------- mobility of disabled & elderly people -------------------------------- --------------------------- --------------------------- -------------- reduction in air and noise pollution ----------------------------------- --------------------------- --------------------------- -------------- efficiency of freight deliveries ------------------------------------------ --------------------------- --------------------------- -------------- access to mobility information and services ----------------------- --------------------------- --------------------------- -------------- increased cost-benefit ratio in transport services ----------------- --------------------------- --------------------------- -------------- quality of public transport services --------------------------------- --------------------------- --------------------------- -------------- higher levels of public transport use -------------------------------- --------------------------- --------------------------- -------------- controlling/ restricting access to sensitive areas --------------- --------------------------- --------------------------- -------------- revenues from charging for road use -------------------------------- --------------------------- --------------------------- --------------
16. How would you rate your personal level of expertise in applying information and communication technologies?
Tick one box only, please!
I am aware of all concepts of practical relevance. I have a good understanding of some key areas. I know some basic concepts. I have too little or no knowledge of information and communication technology.
CAPE PROJECT – TRANSPORT TELEMATICS SURVEY (CEEC)
57
Internal use of telematics systems.
17. Which data for your city (or region) is your authority or your public transport operator collecting? Tick one box per area and tick whether this is a priority in the future, please!
Data sufficiently
available data
incomplete
data not
available
This will be a priority area
in future policies. roadside air pollution from traffic ----------------------------------- ----------------------- -------------------- -------- ------ ------ congestion levels on roads ------------------------------------------ ----------------------- -------------------- -------- ------ ------ availability of parking places ---------------------------------------- ----------------------- -------------------- -------- ------ ------ current position of buses/ trams in the network --------------- ----------------------- -------------------- -------- ------ ------ recent transport model/ data on transport demands ---------- ----------------------- -------------------- -------- ------ ------
other data ()__________________________ ----- ----------------------- -------------------- -------- ------ ------
18. What technologies do you have available for managing traffic? Tick one box per area and tick whether this is a priority in the future, please!
Technology sufficiently availability
technology support
incomplete
technology not
available
This will be a priority area
in future policies. traffic sensors at intersections (e.g. loops) -------------------- -------------------------- -------------------- -------- ------ ------ centralised traffic signal control --------------------------------- -------------------------- -------------------- -------- ------ ------ flexible signal plans based on traffic situation ---------------- -------------------------- -------------------- -------- ------ ------ public transport priority at intersections ---------------------- -------------------------- -------------------- -------- ------ ------ automatic scheduling of trams ----------------------------------- -------------------------- -------------------- -------- ------ ------ electronic signboards for collective traffic information (Variable Message Signs - VMS) ---------------------------------- -------------------------- -------------------- -------- ------ ------ (automatic) coordination of urban & regional traffic -------- -------------------------- -------------------- -------- ------ ------
other ()_____________________________ ---- -------------------------- -------------------- -------- ------ ------
19. In your authority, are information and communication technologies used for the following applications?
Tick one box per area and tick whether this is a priority in the future, please!
Fully technology supported
partly supported/ on a trial basis only
not
available
This will be a priority area
in future policies. signal plans definition/ operations ------------------------------- -------------------------- -------------------- -------- ------ ------ roadside equipment command/ surveillance --------------- -------------------------- -------------------- -------- ------ ------ transport demand planning -------------------------------------- -------------------------- -------------------- -------- ------ ------ road maintenance/ construction planning ------------------ -------------------------- -------------------- -------- ------ ------
other ()_____________________________ ---- -------------------------- -------------------- -------- ------ ------
20. Which other technical systems are available to the transport department of your authority? Tick one box per area and tick whether this is a priority in the future, please!
Fully
available partly available
on a trial basis only
not
available
This will be a priority area
in future policies. electronic mail system ---------------------------------------------- -------------------------- -------------------- -------- ------ ------ Internet access ------------------------------------------------------- -------------------------- -------------------- -------- ------ ------ satellite-based positioning (GPS) ------------------------------ ----------------------- ------------------ ------- ----- ----- “smart cards” (electronic cards, e.g. for ticketing) ----------- -------------------------- -------------------- -------- ------ ------ mobile telephony (GSM) ------------------------------------------- -------------------------- -------------------- -------- ------ ------ Geographic Information Systems (GIS) ---------------------- -------------------------- -------------------- -------- ------ ------

CAPE PROJECT – TRANSPORT TELEMATICS SURVEY (CEEC)
58
Delivery of transport services to travellers.
21. What information and services does your authority provide to the public? And which technical platform are you using to deliver them? Tick all relevant boxes for each item, please!
Our citizens can get the following information or services:
via radio/ TV
by
telephone/fax
via electronic signboards
(VMS)...)
via other electronic media (e.g. Internet,
...)
This will be a priority area in future policies
real-time information on traffic conditions ----------------------- ------------- -------------- ------------------ ----- ----- ----- availability of parking spaces ----------------------------------------- ------------- -------------- ------------------ ----- ----- ----- current road works & other incidents ----------------------------- ------------- -------------- ------------------ ----- ----- ----- weather information/ forecasts -------------------------------------- ------------- -------------- ------------------ ----- ----- ----- fixed schedules of buses/ trams/ metro --------------------------- ------------- -------------- ------------------ ----- ----- ----- real-time public transport information ---------------------------- ------------- -------------- ------------------ ----- ----- ----- advance notice of public transport disruptions ----------------- ------------- -------------- ------------------ ----- ----- -----
other () ______________________________________ --- ------------- -------------- ------------------ ----- ----- -----
other () ______________________________________ --- ------------- -------------- ------------------ ----- ----- -----
Expected benefits and obstacles of using modern technologies.
22. What are the 5 major benefits that you expect from using information and communication technologies in the transport area? Please rank the 5 crucial issues in the order of importance (1 = highest ... 5 = lowest)!
Rank .......... greater cost efficiency .......... improved planning/ decision making .......... generally higher quality of transport services .......... higher rate of enforcement of regulations .......... better access for citizens to transport-related information .......... improved outside image of authority .......... better technical integration between systems .......... improved internal communication / work flow .......... others ................................................................................................................................. ( Please specify).
23. What are the 5 major obstacles that you face in using information and communication technologies in the transport area? Please rank the 5 crucial issues in the order of importance (1 = highest ... 5 = lowest)!
Rank .......... insufficient public funds .......... problems of institutional/ interdepartmental cooperation .......... lack of data/ difficulty in supplying up-to-date and relevant information .......... lack of awareness of services on the part of citizens .......... technical problems for operators .......... complexity of new services for users .......... lack of political support .......... others ................................................................................................................................. ( Please specify).
Financing of transport technology and services.
24. How much is your organisation planning to spend this year on transport-related information and communication technology infrastructure (excluding internal costs and training)? Please give an approximate figure! .............................................................................. currency: ........................
25. Which are the 3 main sources of funding your authority has mainly used in implementing new transport technologies in the past? Tick the 3 most relevant boxes, please!
National/ regional funds Non-EU funding (e.g. World Bank) Own funds of the authority Reinvestment of revenues/ earmarked taxes or fines EU funding (e.g. PHARE, structural funds) Private sector contributions
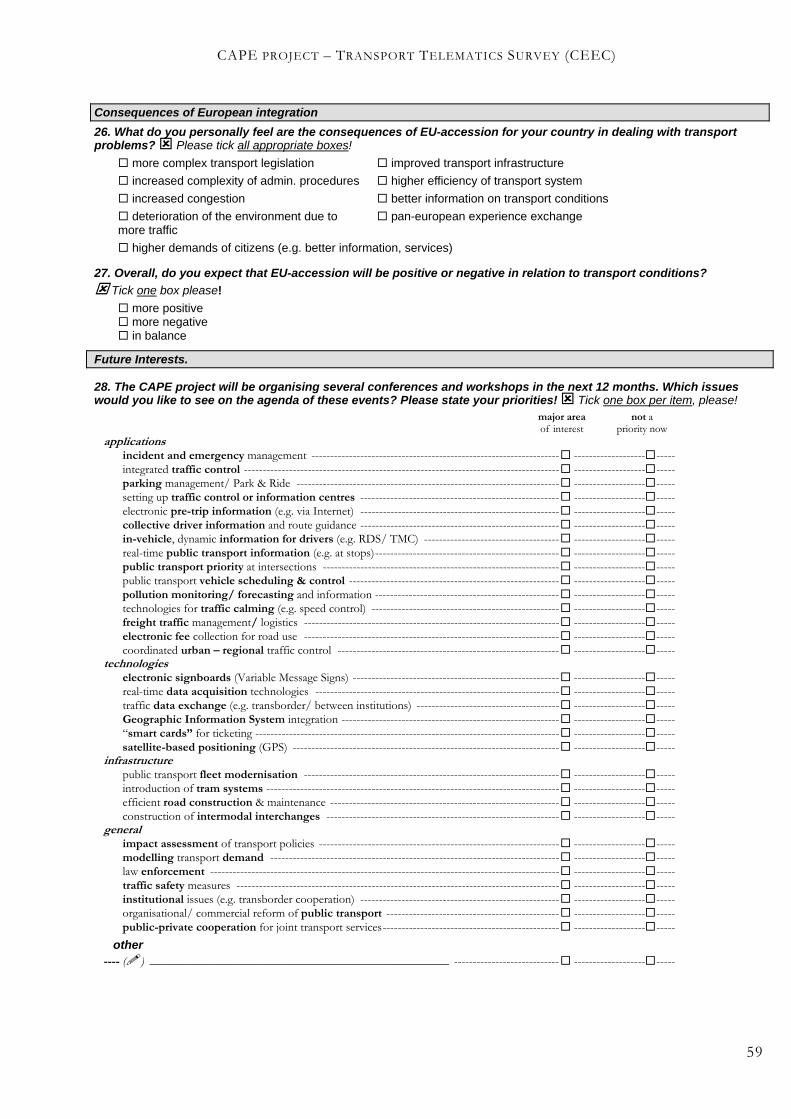
CAPE PROJECT – TRANSPORT TELEMATICS SURVEY (CEEC)
59
Consequences of European integration
26. What do you personally feel are the consequences of EU-accession for your country in dealing with transport problems? Please tick all appropriate boxes!
more complex transport legislation improved transport infrastructure
increased complexity of admin. procedures higher efficiency of transport system
increased congestion better information on transport conditions
deterioration of the environment due to pan-european experience exchange more traffic
higher demands of citizens (e.g. better information, services)
27. Overall, do you expect that EU-accession will be positive or negative in relation to transport conditions?
Tick one box please!
more positive more negative in balance
Future Interests.
28. The CAPE project will be organising several conferences and workshops in the next 12 months. Which issues would you like to see on the agenda of these events? Please state your priorities! Tick one box per item, please!
major area of interest
not a priority now
applications incident and emergency management ------------------------------------------------------------------ ------------------- ----- integrated traffic control ------------------------------------------------------------------------------------ ------------------- ----- parking management/ Park & Ride ---------------------------------------------------------------------- ------------------- ----- setting up traffic control or information centres ----------------------------------------------------- ------------------- ----- electronic pre-trip information (e.g. via Internet) ----------------------------------------------------- ------------------- ----- collective driver information and route guidance ----------------------------------------------------- ------------------- ----- in-vehicle, dynamic information for drivers (e.g. RDS/ TMC) ------------------------------------ ------------------- ----- real-time public transport information (e.g. at stops) ------------------------------------------------- ------------------- ----- public transport priority at intersections --------------------------------------------------------------- ------------------- ----- public transport vehicle scheduling & control -------------------------------------------------------- ------------------- ----- pollution monitoring/ forecasting and information ------------------------------------------------- ------------------- ----- technologies for traffic calming (e.g. speed control) -------------------------------------------------- ------------------- ----- freight traffic management/ logistics -------------------------------------------------------------------- ------------------- ----- electronic fee collection for road use -------------------------------------------------------------------- ------------------- ----- coordinated urban – regional traffic control ----------------------------------------------------------- ------------------- -----
technologies electronic signboards (Variable Message Signs) ------------------------------------------------------- ------------------- ----- real-time data acquisition technologies ----------------------------------------------------------------- ------------------- -----
traffic data exchange (e.g. transborder/ between institutions) -------------------------------------- ------------------- ----- Geographic Information System integration ---------------------------------------------------------- ------------------- ----- “smart cards” for ticketing --------------------------------------------------------------------------------- ------------------- ----- satellite-based positioning (GPS) ----------------------------------------------------------------------- ------------------- ----- infrastructure public transport fleet modernisation -------------------------------------------------------------------- ------------------- ----- introduction of tram systems ------------------------------------------------------------------------------ ------------------- ----- efficient road construction & maintenance ------------------------------------------------------------- ------------------- ----- construction of intermodal interchanges -------------------------------------------------------------- ------------------- ----- general impact assessment of transport policies ---------------------------------------------------------------- ------------------- ----- modelling transport demand ----------------------------------------------------------------------------- ------------------- ----- law enforcement --------------------------------------------------------------------------------------------- ------------------- ----- traffic safety measures -------------------------------------------------------------------------------------- ------------------- ----- institutional issues (e.g. transborder cooperation) ----------------------------------------------------- ------------------- ----- organisational/ commercial reform of public transport ---------------------------------------------- ------------------- ----- public-private cooperation for joint transport services ----------------------------------------------- ------------------- -----
other ---- () __________________________________________________ ---------------------------- ------------------- -----

CAPE PROJECT – TRANSPORT TELEMATICS SURVEY (CEEC)
60
29. In addition to attending conferences would you be interested in participating in any of the following activities? Please tick all appropriate boxes!
Targeted training sessions. Technical exhibitions. Staff exchange programmes. Technical on site visits. Receiving good practice guidelines/ training manuals. E-mail discussion forum.
Thank you very much for participating in this survey!
30. Would you like to receive any of the following? Please tick all appropriate boxes! the final report of this survey further information on the CAPE project
invitations to future events as ... speaker/ exhibitor participant
If yes, please give the contact details of the person to receive it: Name: ...................................................................................................................................................................
Organisation: ...................................................................................................................................................................
Postal address: ...................................................................................................................................................................
...................................................................................................................................................................
Email: ...................................................................................................................................................................
31. Would you suggest other persons to receive invitations for participation in future events? Please provide their contact details below!
Do you have any additional comments? Please, write them below (if necessary, add a new page)!