Embed Size (px)
Citation preview
TÜV Automotive is accredited under DAR-registration number KBA • P 00001-95 to the accreditation body of the Kraftfahrt-Bundesamt, Federal Republic of Germany.
FINAL REPORT
SSUURRVVEEYY OONNMMOOTTOORR VVEEHHIICCLLEE TTYYRREESS
&& RREELLAATTEEDD AASSPPEECCTTSS((EENNTTRR//0022//004455))
prepared by:
commissioned by:
The European CommissionEnterprise Directorate General
Unit ENTR/F/5
______________________________________________________________ SURVEY ON MOTOR VEHICLE TYRES AND RELATED ASPECTS – 2003 -
Page 2
Final Report
“Motor Vehicle Tyres And Related Aspects”
Commissioned by:
The European Commission
Enterprise Directorate General
Prepared by:
TÜV Automotive GmbH
Authors:
Dipl.-Ing. (FH) Walter Reithmaier Dipl.-Ing. (FH) Thomas Salzinger
PRELIMINARY REMARK: The investigations within the scope of this survey and the composition of the present report were carried out in all conscience and to the best of our knowledge.
As can be seen in the list of references, some sources refer to pages on the Internet. As this medium is subject to fast changes, some references may no longer be found at the addresses given in the list. The list of references represents the state at delivery of the first draft version of this report.
______________________________________________________________ SURVEY ON MOTOR VEHICLE TYRES AND RELATED ASPECTS – 2003 -
Page 3
CONTENTS: A: GENERAL PART
0 GLOSSARY OF ABBREVIATIONS................................................................................ 9
1 INTRODUCTION................................................................................................... 11
1.1 BACKGROUND AND PURPOSE............................................................................. 11
1.2 APPROACH ...................................................................................................... 11
B: TOPICAL PART
2 ANALYSIS OF TYRE-RELATED ACCIDENT RESEARCH DATA AND CONTRIBUTION
OF TYRES TO HIGHER TRAFFIC SAFETY ...................................................................... 13
2.1 ANALYSIS OF DATA FROM ACCIDENT RESEARCH RELATED TO TYRES ............................... 13
2.1.1 TASK DESCRIPTION ........................................................................................ 13
2.1.2 APPROACH ................................................................................................... 13
2.1.3 PROBLEMS INVOLVED WITH DATA COLLECTION, AVAILABILITY AND QUALITY ............... 15
2.1.4 THE ROLE OF TECHNICAL DEFECTS IN ROAD ACCIDENTS .......................................... 17
2.1.5 DETAILS OF TECHNICAL DEFECTS IN ROAD ACCIDENTS ............................................ 19
2.1.6 RESULTS CONCERNING FAILURES IN TYRE CHECKS WITHOUT PRIOR ACCIDENT .............. 24
2.1.7 CONCLUSIONS AND SUMMARY ........................................................................... 26
2.2 CONTRIBUTION OF THE TYRES TO TRAFFIC AND DRIVING SAFETY FROM A
TECHNICAL PERSPECTIVE (PASSENGER CARS)........................................................... 28
2.2.1 STRUCTURAL DAMAGE..................................................................................... 28
2.2.1.1 RELATED TO APPLICATION AND OPERATION ........................................................ 28
2.2.1.1.1 UNDER-INFLATION/OVERLOADING......................................................... 28 2.2.1.1.2 TYRE AGE/AGING BEHAVIOUR .............................................................. 29 2.2.1.1.3 INCORRECT LOAD/SPEED INDICES ......................................................... 29 2.2.1.1.4 EXTERNAL IMPACTS ........................................................................... 30
2.2.1.2 RELATED TO RETREADING .............................................................................. 30
2.2.1.3 RELATED TO CONCEPT/DESIGN ........................................................................ 30
2.2.2 ROAD PERFORMANCE OF THE TYRE..................................................................... 33
______________________________________________________________ SURVEY ON MOTOR VEHICLE TYRES AND RELATED ASPECTS – 2003 -
Page 4
2.2.2.1 INFLATION PRESSURE .................................................................................... 34
2.2.2.1.1 CORRECT INFLATION PRESSURE............................................................ 34 2.2.2.1.2 OVER-INFLATION .............................................................................. 35 2.2.2.1.3 UNDERINFLATION ............................................................................. 35
2.2.2.2 RELATED TO CONCEPT/DESIGN ........................................................................ 37
2.2.2.2.1 DECELERATION PROPERTIES ................................................................ 38 2.2.2.2.2 AQUAPLANING PERFORMANCE .............................................................. 40 2.2.2.2.3 CORNERING STABILITY ....................................................................... 41 2.2.2.2.4 GENERAL VEHICLE HANDLING/DRIVING SAFTEY......................................... 41
2.2.3 CONCLUSION ................................................................................................ 44
2.2.4 CONTRIBUTION OF THE TYRES TO TRAFFIC AND DRIVING SAFETY FROM A TECHNICAL
PERSPECTIVE (MOTORCYCLES) .......................................................................... 46
2.2.4.1 HANDLING AND MANOEUVRABILITY................................................................... 46
2.2.4.2 DRIVING STABILITY ...................................................................................... 47
2.2.4.2.1 WOBBLE (SHIMMY) ........................................................................... 47 2.2.4.2.2 KICKBACK ....................................................................................... 48 2.2.4.2.3 WEAVE........................................................................................... 48
2.2.4.3 BRAKING/ACCELERATING ............................................................................... 49
2.2.4.4 SUMMARY AND CONCLUSION ........................................................................... 49
2.3 SUMMARY OF WORKSHOP MEETINGS...................................................................... 51
2.3.1 MEETINGS WITH REPRESENTATIVES OF TYRE MANUFACTURERS (ETRTO).................... 51
2.3.1.1 MEETINGS WITH REPRESENTATIVES OF PASSENGER CAR MANUFACTURERS
(ACEA/VDA) ............................................................................................. 53
2.3.1.2 MEETINGS WITH REPRESENTATIVES OF MOTORCYCLE MANUFACTURERS AND MOTOR
CYCLE TYRE MANUFACTURERS.......................................................................... 54
3 RESEARCH OF THE CURRENT AND FUTURE STATE OF TECHNOLOGICAL
DEVELOPMENTS WITH RESPECT TO TYRES AND RELATED COMPONENTS AND
SYSTEMS ........................................................................................................... 56
3.1 TYRES............................................................................................................ 56
3.1.1 TYRES AND COMBINED SYSTEMS WITH RUN-FLAT TECHNOLOGY ................................. 56
3.1.1.1 TYRES WITH RUN-FLAT-PROPERTIES ................................................................. 57
______________________________________________________________ SURVEY ON MOTOR VEHICLE TYRES AND RELATED ASPECTS – 2003 -
Page 5
3.1.1.2 ADD-ON SYSTEMS WITH RUN-FLAT PROPERTIES................................................... 58
3.1.1.3 TYRE/WHEEL SYSTEMS WITH RUN-FLAT-PROPERTIES ............................................ 60
3.1.1.3.1 SPECIAL DESIGNATIONS (PAX) ............................................................ 61
3.1.1.4 SUMMARY AND DISCUSSION OF RUN-FLAT-TECHNOLOGY ........................................ 61
3.1.2 PRESSURE WARNING AND MONITORING SYSTEMS................................................... 63
3.1.2.1 PASSIVE/INDIRECT SYSTEMS........................................................................... 64
3.1.2.2 ACTIVE/DIRECT SYSTEMS............................................................................... 65
3.1.2.3 SUMMARY AND DISCUSSION OF PRESSURE WARNING AND MONITORING SYSTEMS ......... 68
3.1.3 PUNCTURE REPAIR SETS .................................................................................. 69
3.1.3.1 INSTANT TYRE SEALANTS ............................................................................... 69
3.1.3.2 PREVENTIVE PUNCTURE SEALANT LIQUIDS .......................................................... 70
3.1.4 TYRE SENSORSING ......................................................................................... 71
3.1.4.1 SIDE-WALL-TORSION SENSOR (SWT)............................................................... 71
3.1.4.2 SURFACE-ACOUSTIC WAVE SENSOR (SAW) ........................................................ 72
3.1.4.3 TYRE IDENTIFICATION CHIPS .......................................................................... 73
3.1.4.4 SUMMARY AND DISCUSSION OF TYRE SENSORING................................................. 75
3.2 RELATED SYSTEMS AND COMPONENTS.................................................................... 76
3.2.1 ELECTRONIC SYSTEMS FOR IMPROVED VEHICLE CONTROL ........................................ 76
3.2.1.1 ANTI-LOCK BRAKE SYSTEM (ABS) .................................................................... 76
3.2.1.2 BRAKE ASSISTANT SYSTEMS............................................................................ 76
3.2.1.3 ELECTRONIC TRACTION CONTROL (ETC) ........................................................... 77
3.2.1.4 CORNERING BRAKE CONTROL .......................................................................... 77
3.2.1.5 ELECTRONIC STABILITY PROGRAM (ESP) ........................................................... 77
3.2.2 BRAKING SYSTEMS ......................................................................................... 78
3.2.2.1 BRAKE-BY-WIRE (ELECTRO-HYDRAULIC AND -MECHANIC BRAKE SYSTEMS).................. 78
3.2.2.2 NEW MATERIALS .......................................................................................... 80
3.2.3 STEERING SYSTEMS........................................................................................ 81
3.2.3.1 ADAPTIVE POWER STEERING ........................................................................... 81
3.2.3.2 ACTIVE STEERING ........................................................................................ 81
______________________________________________________________ SURVEY ON MOTOR VEHICLE TYRES AND RELATED ASPECTS – 2003 -
Page 6
3.2.3.3 STEER-BY-WIRE........................................................................................... 82
3.2.4 CHASSIS AND SUSPENSION ............................................................................... 83
3.3 SUMMARY TABLE .............................................................................................. 84
3.4 SPECIAL CONSIDERATIONS OF THE STATE OF THE ART AND TECHNOLOGICAL
DEVELOPMENTS IN THE MOTORCYCLE FIELD............................................................. 87
3.4.1 TYRES......................................................................................................... 87
3.4.1.1 RUN-FLAT TECHNOLGY .................................................................................. 87
3.4.1.2 PRESSURE WARNING AND MONITORING SYSTEMS ................................................. 88
3.4.1.3 TYRE SENSORING, TYRE IDENTIFICATION CHIPS .................................................. 88
3.4.2 RELATED SYSTEMS ......................................................................................... 88
3.4.2.1 VEHICLE CONTROL SYSTEMS ........................................................................... 88
3.4.2.2 BRAKING SYSTEMS........................................................................................ 89
3.4.2.2.1 COMBINED BRAKING SYSTEM (CBS), INTEGRAL BRAKE............................... 89 3.4.2.2.2 BRAKE BOOSTER............................................................................... 89 3.4.2.2.3 BRAKE-BY-WIRE SYSTEMS................................................................... 89
3.4.2.3 ALTERNATIVE SUSPENSIONS/WHEEL CONTROL..................................................... 89
4 ASSESSMENT OF THE ADEQUACY OF LAWS AND REGULATIONS APPLICABLE TO
TYRES AND FITTING OF TYRES ................................................................................ 91
4.1 CURRENT STATE OF LEGAL REQUIREMENTS FOR TYRES ............................................... 91
4.1.1 ADEQUACY OF CURRENT LEGISLATION AND RECOMMENDATIONS FOR
CHANGES/AMENDMENTS .................................................................................. 91
4.1.1.1 SNOW-TYRE USE AND PERTINENT REQUIREMENTS ............................................... 92
4.1.1.2 TYRE DIMENSION TOLERANCES ........................................................................ 92
4.1.1.3 QUALITY DIFFERENCES .................................................................................. 94
4.1.1.4 INCLUSION OF RUN-FLAT TECHNOLOGY IN DIRECTIVES AND STANDARDS .................... 97
4.1.1.5 TYRE AGE / AGING ....................................................................................... 98
4.1.1.6 TYRE MARKING AND CONSUMER INFORMATION .................................................... 99
4.1.1.7 ENVIRONMENTAL ASPECTS.............................................................................. 99
4.1.1.8 TYRE INFLATION PRESSURE ............................................................................ 101
______________________________________________________________ SURVEY ON MOTOR VEHICLE TYRES AND RELATED ASPECTS – 2003 -
Page 7
4.1.1.9 CLARIFICATION OF PRODUCT LIABILITY ............................................................. 102
4.1.1.10 VEHICLE-TYRE INTERACTION ....................................................................... 103
4.1.1.11 STANDARDIZATION AND DESCRIPTION OF TYRE ELECTRONICS ............................. 103
4.1.1.12 NEW VEHICLE SYSTEMS.............................................................................. 103
4.1.1.13 CAMBER LIMITING .................................................................................... 104
4.1.1.14 REGIONAL-MARKET-SPECIFIC VEHICLES/TYRES................................................. 105
4.2 RECOMMENDATIONS FOR CHANGES TO LEGISLATION (FOUR-WHEEL VEHICLES) ................ 105
4.2.1 GENERAL RECOMMENDATIONS FOR THE USE OF TYRES ............................................ 105
4.2.1.1 USE OF SNOW TYRES (M+S) .......................................................................... 105
4.2.2 AMENDMENTS TO COUNCIL DIRECTIVE 89/549/EEC (TREAD DEPTH OF TYRES) ........... 106
4.2.3 FORMULATION OF A NEW DIRECTIVE CONCERNING TYRE AGE .................................... 107
4.2.4 AMENDMENTS TO COUNCIL DIRECTIVE 70/156/EEC ............................................. 107
4.2.5 AMENDMENTS TO COUNCIL DIRECTIVE 92/23/EEC ............................................... 109
4.3 RECOMMENDATIONS FOR CHANGES TO LEGISLATION (MOTORCYCLES) ........................... 130
4.3.1 CHANGES TO DIRECTIVE 2002/24/EC ................................................................ 130
4.3.2 CHANGES TO DIRECTIVE 97/24/EC.................................................................... 131
5 COST-BENEFIT-ANALYSIS AND CONSIDERATIONS CONCERNING INSIGHTS
GAINED AND RESULTING NECESSITIES....................................................................... 132
5.1 INTRODUCTION................................................................................................ 132
5.2 INCREASED MINUMUM TREAD DEPTH ..................................................................... 134
5.2.1 SAFETY BENEFITS .......................................................................................... 135
5.2.2 COSTS ........................................................................................................ 140
5.2.3 POTENTIAL COST-BENEFIT RATIO AND COST-BENEFIT DIFFERENCE ............................. 142
5.2.4 DISCUSSION AND FURTHER ANALYSIS ................................................................. 142
5.2.5 CONCLUSION ................................................................................................ 142
5.3 NEW TECHNICAL SOLUTIONS FOR TYRE-RELATED ACCIDENTS....................................... 143
5.3.1 SAFETY BENEFITS .......................................................................................... 143
5.3.2 COSTS ........................................................................................................ 146
______________________________________________________________ SURVEY ON MOTOR VEHICLE TYRES AND RELATED ASPECTS – 2003 -
Page 8
5.3.3 POTENTIAL COST-BENEFIT RATIO AND COST-BENEFIT DIFFERENCE ............................. 148
5.3.4 DISCUSSION AND FURTHER ANALYSIS ................................................................. 148
5.3.5 CONCLUSIONS............................................................................................... 149
5.4 FURTHER DISCUSSION AND NOTES ........................................................................ 150
5.4.1 INSTANT PUNCTURE SEALANTS .......................................................................... 150
5.4.2 TYRE IDENTIFICATION CHIPS/”INTELLIGENT TYRE” ................................................ 150
5.4.3 QUALITY DIFFERENCES/COMMITMENT TO TYRE MAKES ............................................ 150
5.4.4 INTENSIFICATION OF TYRE INSPECTIONS ............................................................. 152
5.4.5 IMPROVED CONSUMER INFORMATION AND TYRE LABELLING ...................................... 153
5.5 ENVIRONMENTAL EFFECTS .................................................................................. 154
6 CONCLUDING REMARKS......................................................................................... 156
C: ANNEX
7 LIST OF REFERENCES............................................................................................ 157
8 RESULTS AND EVALUATIONS................................................................................... 161
8.1 EXAMINATIONS OF PROPERTIES OF MARKET AVAILABLE PASSENGER CAR TYRES ................ 161
8.2 RESULTS OF WET GRIP RESEARCH ......................................................................... 165
8.3 EVALUATION OF CAR MAGAZINE TESTS (WET BRAKING PERFORMANCE)........................... 166
8.4 COMPARISON BETWEEN TYRES FROM ORIGINAL EQUIPMENT AND THE
AFTERMARKET (ANONYMISED SHORT VERSION OF TEST REPORT) .................................. 167
9 TREND-EXTRAPOLATION FUNCTIONS FOR CBA............................................................ 171
______________________________________________________________ SURVEY ON MOTOR VEHICLE TYRES AND RELATED ASPECTS – 2003 -
Page 9
A. GENERAL PART 0 GLOSSARY OF ABBREVIATIONS
AIR Arbeitsgemeinschaft industrieller Runderneuerer Consortium of industrial retreaders
ABS Anti-lock Braking System
ACEA Association des Constructeurs Européens d' Automobiles European Automobile Manufacturers Association
ADAC Allgemeiner Deutscher Automobil Club German Automobile Drivers Association
AM Aftermarket
BASt Bundesanstalt für Straßenwesen German Federal Highway Research Institute
BRV Bundesverband Reifenhandel und Vulkaniseurhandwerk German Association of the Tyre and Vulcanizing Trade
CBA Cost-Benefit-Analysis
DEKRA Deutscher Kraftfahrzeug-Überwachungsverein e.V. Technical Inspection Association (Germany)
DOT Department of Transport (USA)
DVR Deutscher Verkehrssicherheitsrat e.V.: German Traffic Safety Council
ESP Electronic Stability Program
ETRTO European Tyre and Rim Technical Organisation
FMVSS Federal Motor Vehicle Safety Standards (USA)
GDV Gesamtverband der Deutschen Versicherungswirtschaft German Insurance Association
GTÜ Gesellschaft für Technische Überwachung mbH Association for Technical Surveillance
ITARDA Institute for Traffic Accident Research and Data Analysis (Japan)
IVM Industrieverband Motorrad Motorcycle Industry Association
LI Load Index (of a tyre)
______________________________________________________________ SURVEY ON MOTOR VEHICLE TYRES AND RELATED ASPECTS – 2003 -
Page 10
MHH Medizinische Hochschule Hannover Medical University of Hannover, Germany
NHTSA National Highway Traffic Safety Administration (USA)
RMA Retread Manufacturers Association
OE Original Equipment
OEM Original Equipment Manufacturer
ÖAMTC Österreichischer Automobil-, Motorrad- und Touring Club Austrian Automobile and Motorcycle Drivers Association
SUV Sport Utility Vehicle High-performance four-wheel drive car with an appearance similar to an
off-road vehicle
TPMS Tyre pressure monitoring system
UTQGS Uniform Tire Quality Grading System Tyre information system designed to help buyers make relative comparisons among tyres with respect to tread wear, traction and temperature resistance
VDA Verband der Automobilindustrie German Association of the Automotive Industry
______________________________________________________________ SURVEY ON MOTOR VEHICLE TYRES AND RELATED ASPECTS – 2003 -
Page 11
1 INTRODUCTION 1.1 BACKGROUND AND PURPOSE
The rapid development in the field of automotive technology over the past decades imposes great demands on legislators to adequately address this technological progress. Ideally, legislation should be easy to enforce, ensuring the highest possible levels of safety for road users. At the same time, it should not restrict, but rather promote, technological progress.
In the field of chassis technology, as well, focussing on tyres, related systems and components in particular, considerable achievements have been made, aimed at increasing traffic safety and enhancing reliable functional performance. By commissioning this study on tyres and related aspects, legislators have set the target of addressing the role of the tyre for traffic safety as well as current and anticipated technological developments in order to bring this in line with current legislation and to examine its adequacy, including economic, social and environmental issues. 1.2 APPROACH
To achieve this objective in a pinpoint manner, the survey has been subdivided into five main items, addressed in self-contained sub-projects, the contents of which are partly based on each other.
An in-depth analysis of existing accident research data with regard to distinctive tyre-related characteristics provided the starting point for the authors to establish a sound basis from which to proceed. At the same time, the authors investigated the link between tyres and driving safety from a technical point of view.
Another cornerstone of the survey is technological background research performed in the field of tyres, related systems and components, the current state of the art as well as future developments anticipated within the next five to ten years.
Based on the results of the statistical and technical analyses made, including the current state of technology and development, adequacy of current legislation has been reviewed. This starts with a review of applicable regulations and directives and culminates in a proposal of reasonable and necessary changes and amendments to the current statutory framework.
The survey concludes with an examination of the effects of currently existing technical facts and the consequences of changes in terms of social, economic and environmental aspects, to the extent that such an examination has been feasible.
______________________________________________________________ SURVEY ON MOTOR VEHICLE TYRES AND RELATED ASPECTS – 2003 -
Page 12
In order to cover all pertinent issues, facts and problems from the broadest possible perspective, the authors invited those parties most likely to be affected by the outcome of this survey to contribute their views and concerns. In addition to the expertise gained by TÜV Automotive in many years of testing tyres, wheels, brakes and components (for homologation purposes, as a development service provider for industry customers and with in-house and public research projects) as well as by TÜV Automotive’s participation in UN-ECE working groups, representatives of pressure groups representing motor vehicle (passenger cars and motorcycles) and tyre manufacturers were given the opportunity to take part in workshops held under the direction of TÜV Automotive. A summary of the contents, the inputs given and the outcome of these workshops is provided in the relevant chapters of this report.
______________________________________________________________ SURVEY ON MOTOR VEHICLE TYRES AND RELATED ASPECTS – 2003 -
Page 13
B. TOPICAL PART 2 ANALYSIS OF TYRE-RELATED ACCIDENT RESEARCH DATA AND
CONTRIBUTION OF TYRES TO HIGHER TRAFFIC SAFETY In order to establish a sound basis for assessing the role of the tyre in terms of traffic and driving safety, analyses of existing and accessible traffic accident research data as well as evaluations and interpretations of technical facts and issues were made. This allowed conclusions to be drawn regarding both the number of traffic accidents and casualties doubtlessly related to tyres and the general influence and possibly positive contribution to traffic safety made by tyres and their performance.
It must be stated at this point that both considerations are necessarily theoretical to a certain extent, as a large number of unrecorded cases must be assumed in the statistical analysis. By the same token, the technical analysis can provide merely a rough assessment of the effective consequences for traffic safety, even if all vehicles were equipped with ideally operated and performing tyres.
2.1 ANALYSIS OF DATA FROM ACCIDENT RESEARCH RELATED TO TYRES
2.1.1 TASK DESCRIPTION
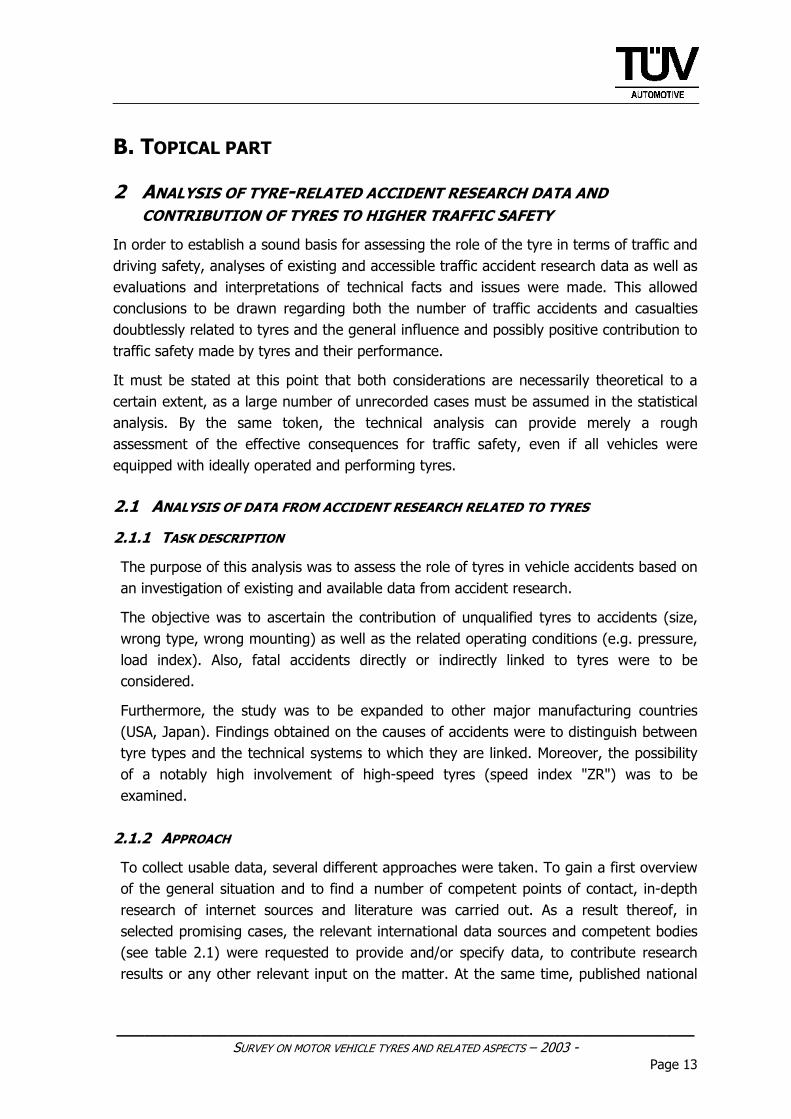
The purpose of this analysis was to assess the role of tyres in vehicle accidents based on an investigation of existing and available data from accident research.
The objective was to ascertain the contribution of unqualified tyres to accidents (size, wrong type, wrong mounting) as well as the related operating conditions (e.g. pressure, load index). Also, fatal accidents directly or indirectly linked to tyres were to be considered.
Furthermore, the study was to be expanded to other major manufacturing countries (USA, Japan). Findings obtained on the causes of accidents were to distinguish between tyre types and the technical systems to which they are linked. Moreover, the possibility of a notably high involvement of high-speed tyres (speed index "ZR") was to be examined.
2.1.2 APPROACH
To collect usable data, several different approaches were taken. To gain a first overview of the general situation and to find a number of competent points of contact, in-depth research of internet sources and literature was carried out. As a result thereof, in selected promising cases, the relevant international data sources and competent bodies (see table 2.1) were requested to provide and/or specify data, to contribute research results or any other relevant input on the matter. At the same time, published national
______________________________________________________________ SURVEY ON MOTOR VEHICLE TYRES AND RELATED ASPECTS – 2003 -
Page 14
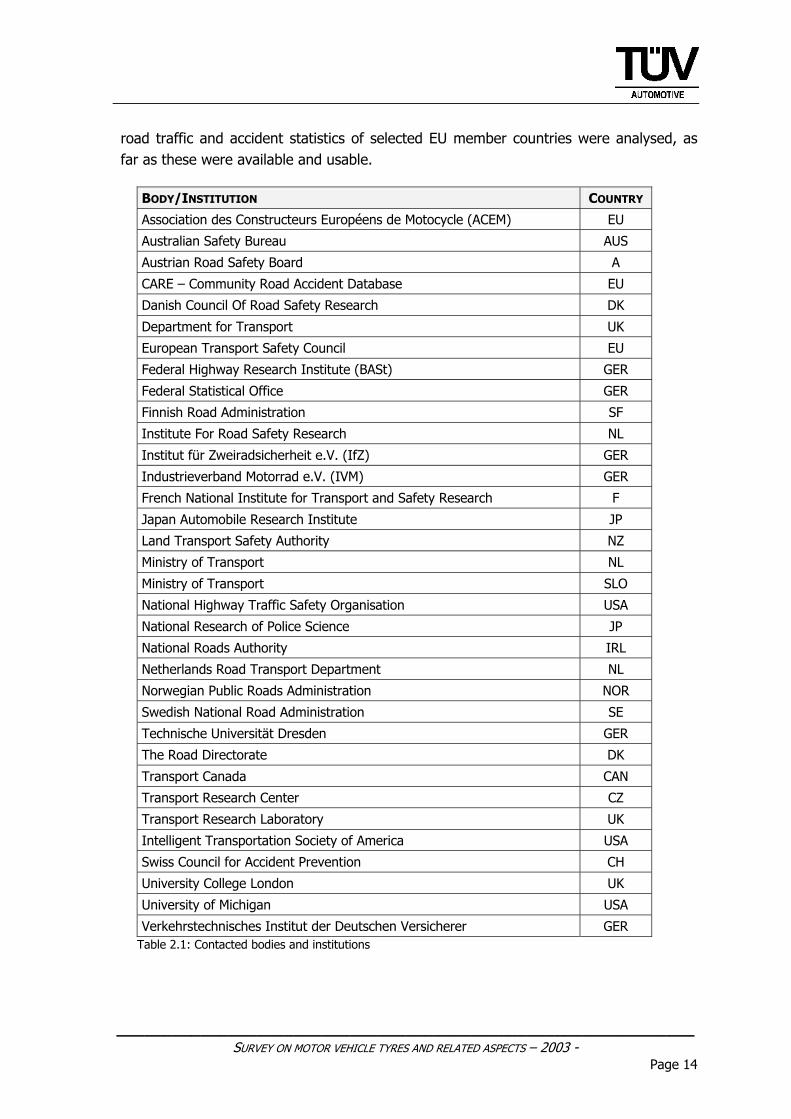
road traffic and accident statistics of selected EU member countries were analysed, as far as these were available and usable.
BODY/INSTITUTION COUNTRY
Association des Constructeurs Européens de Motocycle (ACEM) EU
Australian Safety Bureau AUS
Austrian Road Safety Board A
CARE – Community Road Accident Database EU
Danish Council Of Road Safety Research DK
Department for Transport UK
European Transport Safety Council EU
Federal Highway Research Institute (BASt) GER
Federal Statistical Office GER
Finnish Road Administration SF
Institute For Road Safety Research NL
Institut für Zweiradsicherheit e.V. (IfZ) GER
Industrieverband Motorrad e.V. (IVM) GER
French National Institute for Transport and Safety Research F
Japan Automobile Research Institute JP
Land Transport Safety Authority NZ
Ministry of Transport NL
Ministry of Transport SLO
National Highway Traffic Safety Organisation USA
National Research of Police Science JP
National Roads Authority IRL
Netherlands Road Transport Department NL
Norwegian Public Roads Administration NOR
Swedish National Road Administration SE
Technische Universität Dresden GER
The Road Directorate DK
Transport Canada CAN
Transport Research Center CZ
Transport Research Laboratory UK
Intelligent Transportation Society of America USA
Swiss Council for Accident Prevention CH
University College London UK
University of Michigan USA
Verkehrstechnisches Institut der Deutschen Versicherer GER Table 2.1: Contacted bodies and institutions
______________________________________________________________ SURVEY ON MOTOR VEHICLE TYRES AND RELATED ASPECTS – 2003 -
Page 15
In addition, tyre and motor vehicle manufacturers were asked for possible contributions from their own accident research departments within the scope of the workshops held, and participants’ suggestions for contacting further, so far unconsidered, promising institutions were adopted.
After completion of the data collection process, the data was examined and filtered with respect to subject-relevant and - most importantly - truly significant data. The results, presented in chapter 2.1.4 and subsequent chapters, reflect the summary and essential conclusions to be drawn from the data accessible.
2.1.3 PROBLEMS INVOLVED WITH DATA COLLECTION, AVAILABILITY AND QUALITY
The quality of data provided by the afore-mentioned institutions (as far as there was a response at all) and to be found in available data sources was, in most cases, neither comprehensive nor specific enough to contribute to fundamentally new insights.
In fact, practically all European countries have national statistics and road research offices, track traffic and transport characteristics and, in particular, road accidents. Even with respect to distinguishing between individual causes of accidents, this differentiation is relatively good and sophisticated in some countries. Unfortunately (at least with regard to the purpose of this survey) the relevant factors are usually identified by parameters which do not allow any determination of the influence of technical failures, and in particular of the tyres, on overall accident statistics. The differentiations made by statistical offices and research bodies are mainly focused on other, apparently – from a superficial perspective - more important factors, such as the age of drivers, road category, traffic situation, seasonal and regional differences. Concerning assumptions of causes, the human factor, such as distraction and inattentiveness, drunk driving, failure to obey traffic signs, speeding or insufficient safety distance, to name just a few, was deemed the predominant factor- by far – in all of the countries surveyed. Technical failures were either listed as one common factor, without any further differentiation, or sometimes not even listed separately at all, but mentioned among “other causes”. The experience gained during the data collection process showed that only some countries, and surprisingly so, predominantly those to which above-average road safety can be attributed, appeared to provide slightly more detailed statistics.
The most likely reason for the general lack of “depth” may be that accident reports, which provide the basis for such statistics, only capture those facts which can be obtained quickly, easily and with absolute certainty, while the detection of technical failures, unless obvious, is a difficult and sophisticated task. In particular if tyre failures are involved, only trained accident experts are able to ascertain details about the actual causes of the accident by performing an accurate reconstruction of the event. As such examinations are presumably performed in merely a small number of all accidents recorded, conclusions from such official statistics should only be drawn with great

______________________________________________________________ SURVEY ON MOTOR VEHICLE TYRES AND RELATED ASPECTS – 2003 -
Page 16
caution. Even if the records should reflect information of a damaged tyre on a vehicle involved, it is by no means certain that this particular tyre was the (single) cause of the accident, or if, instead, it may have merely been damaged as a result of the accident or other contributing factors (e.g. running over an obstacle). Yet, such an accident is likely to appear in the official statistics as a tyre-related accident. On the other hand, in accidents, in which the tyre was not obviously affected (as it showed no damage and tread wear was within the legal limits), the tyre may have been ignored, despite the possibility of having been at least co-responsible due to a performance deficit under the respective road conditions (e.g. summer tyre used in winter driving conditions). Also, vehicles breaking down due to tyre failure are often involved in collisions, yet not considered in official statistics. The same applies to accidents caused by debris of destroyed tyres.
Unlike official statistics, a few semi-public and private organisations are maintaining databases with relatively specific data on accidents and their causes. Although tyre-specific data in terms of make, dimension, load and speed indices are partly recorded here, and might possibly be related to the cause of an accident, there are several problems involved with using these more detailed statistics. One of them is that, in some cases, access to such statistics seems to be restricted to a select circle, namely parties making financial contributions to the respective organisation, e.g. the automotive industry, which has a major interest in such detailed accident research, particularly with regard to product liability. Secondly, for databases that would have been accessible in principle a fee was charged, and the costs for adequate search efforts would have by far exceeded the financial budget of this project, without prior assurance that the outcome of the research would have resulted in any deeper insights. Additionally, these databases frequently consider merely those accidents occurring within a small region, and the results would therefore not have been representative for the purposes of this survey.
Based on this knowledge, only data was utilized for the following statistical evaluations, which - from the authors’ point of view - allowed at least indicative conclusions to be drawn.
______________________________________________________________ SURVEY ON MOTOR VEHICLE TYRES AND RELATED ASPECTS – 2003 -
Page 17
2.1.4 THE ROLE OF TECHNICAL DEFECTS IN ROAD ACCIDENTS
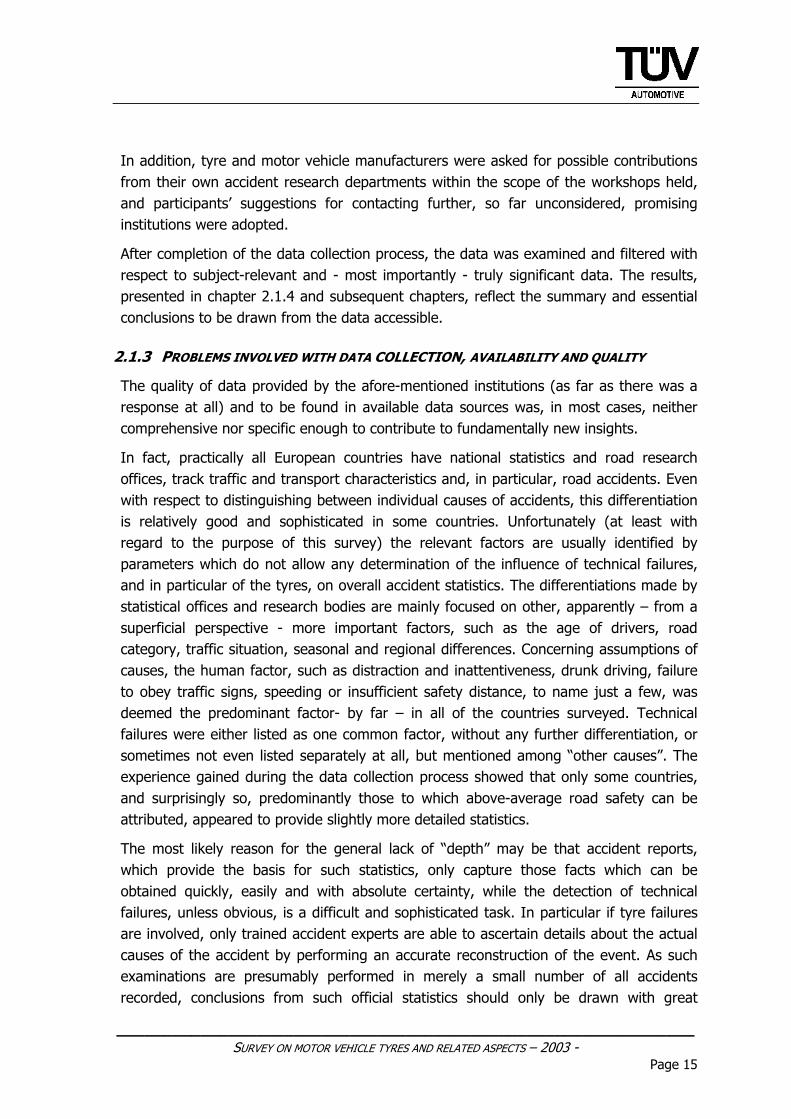
An initial evaluation deals with the chronological development of the ratio of tyre defects to technical defects in motor vehicle accidents (passenger cars, motorcycles, trucks, buses).
As Table 2.2 shows, the tyre is the assembly group most frequently mentioned in motor vehicle accidents due to technical failures resulting in personal injury or fatalities within the past 10 years in Germany. The share of tyre failures has a mean value of 44.9% and a spread of 2.5%, considering reported accidents resulting in personal injury or death. Analogous to the total number of accidents involving reported technical failures and resulting in personal injury or death, the total incidence of tyre defects has been decreasing at nearly regular levels.
Technically defective assembly group
Total Lights Tyres Brakes Steering Towing Unit Others
Ratio: Tyre defect/accident
leading to injury or death total
Year Counts Counts Counts Counts Counts Counts Counts %
1993 4,390 378 2,032 750 221 87 922 46.3
1994 4,334 411 1,925 762 208 88 940 44.4
1995 3,878 359 1,740 682 202 74 821 44.9
1996 3,521 367 1,543 591 187 76 757 43.8
1997 3,513 364 1,578 562 163 79 767 44.9
1998 3,327 363 1,486 491 120 61 806 44.7
1999 3,367 358 1,542 503 149 64 751 45.8
2000 3,288 331 1,477 519 124 83 754 44.9
2001 3,059 316 1,351 428 136 52 776 44.2
2002 3,017 278 1,374 412 115 57 781 45.5
Table 2.2: Technical defects by assembly groups in Germany from 1993 to 2002 [1]
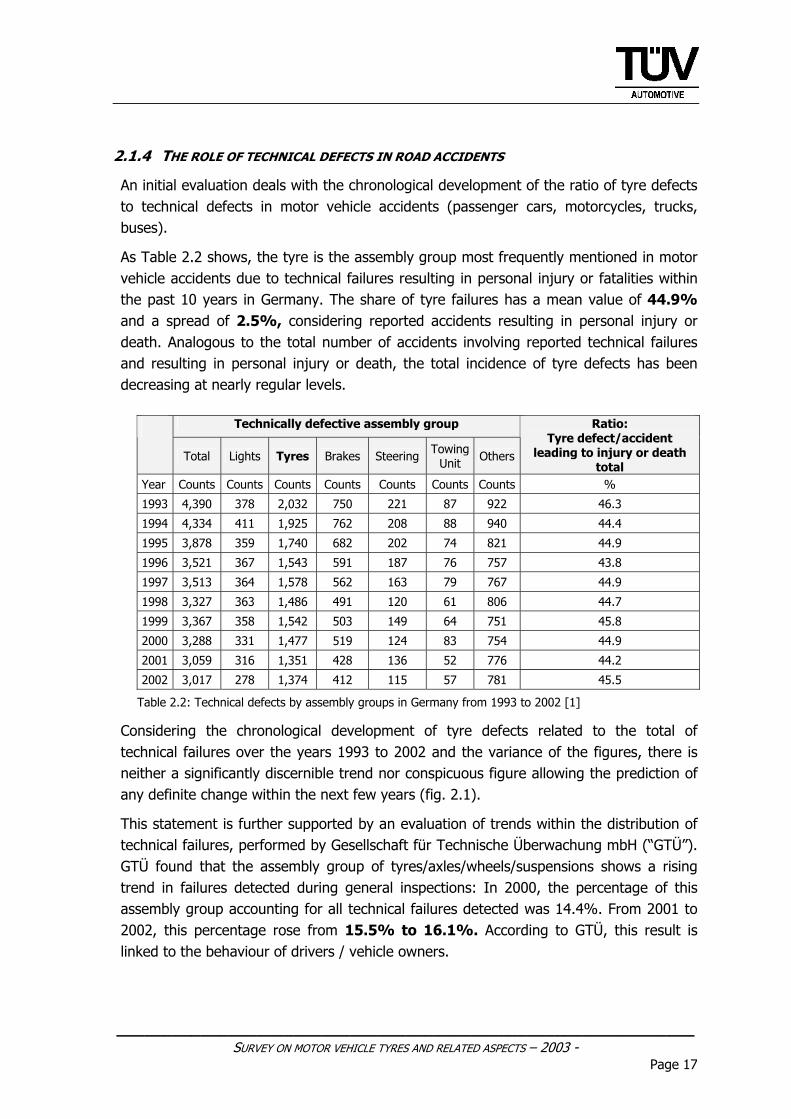
Considering the chronological development of tyre defects related to the total of technical failures over the years 1993 to 2002 and the variance of the figures, there is neither a significantly discernible trend nor conspicuous figure allowing the prediction of any definite change within the next few years (fig. 2.1).
This statement is further supported by an evaluation of trends within the distribution of technical failures, performed by Gesellschaft für Technische Überwachung mbH (“GTÜ”). GTÜ found that the assembly group of tyres/axles/wheels/suspensions shows a rising trend in failures detected during general inspections: In 2000, the percentage of this assembly group accounting for all technical failures detected was 14.4%. From 2001 to 2002, this percentage rose from 15.5% to 16.1%. According to GTÜ, this result is linked to the behaviour of drivers / vehicle owners.
______________________________________________________________ SURVEY ON MOTOR VEHICLE TYRES AND RELATED ASPECTS – 2003 -
Page 18
Year20
03
2002
2001
2000
1999
1998
1997
1996
1995
1994
1993
1992
[Cou
nts/
100]
or [
%] 50
45
40
35
30
25
20
Technical Failure
Total Counts / 100
Technical FailureRatioTire/Total in %
Fig. 2.1: Chronological development of tyre defects related to total technical failures in Germany
The total percentage of tyre-related accidents in all reported motor vehicle accidents with personal injury in Germany has remained nearly constant at 0.4%.
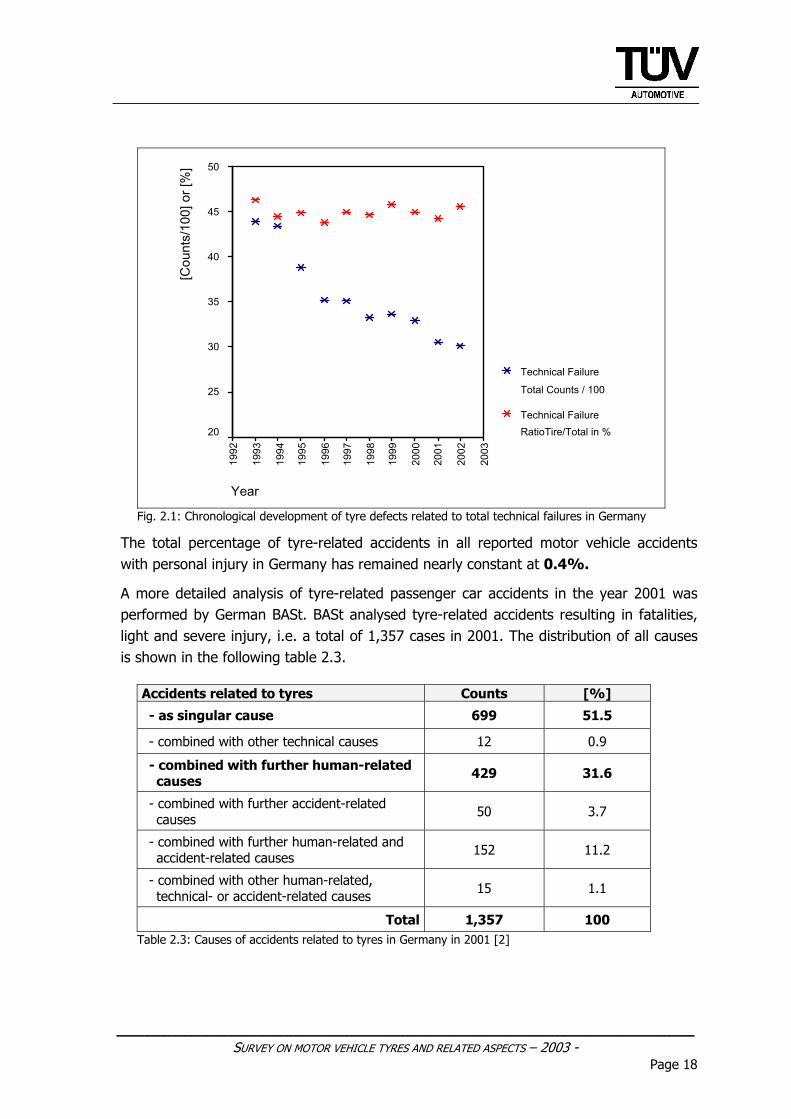
A more detailed analysis of tyre-related passenger car accidents in the year 2001 was performed by German BASt. BASt analysed tyre-related accidents resulting in fatalities, light and severe injury, i.e. a total of 1,357 cases in 2001. The distribution of all causes is shown in the following table 2.3.
Accidents related to tyres Counts [%]
- as singular cause 699 51.5
- combined with other technical causes 12 0.9
- combined with further human-related causes 429 31.6
- combined with further accident-related causes 50 3.7
- combined with further human-related and accident-related causes 152 11.2
- combined with other human-related, technical- or accident-related causes 15 1.1
Total 1,357 100 Table 2.3: Causes of accidents related to tyres in Germany in 2001 [2]
______________________________________________________________ SURVEY ON MOTOR VEHICLE TYRES AND RELATED ASPECTS – 2003 -
Page 19
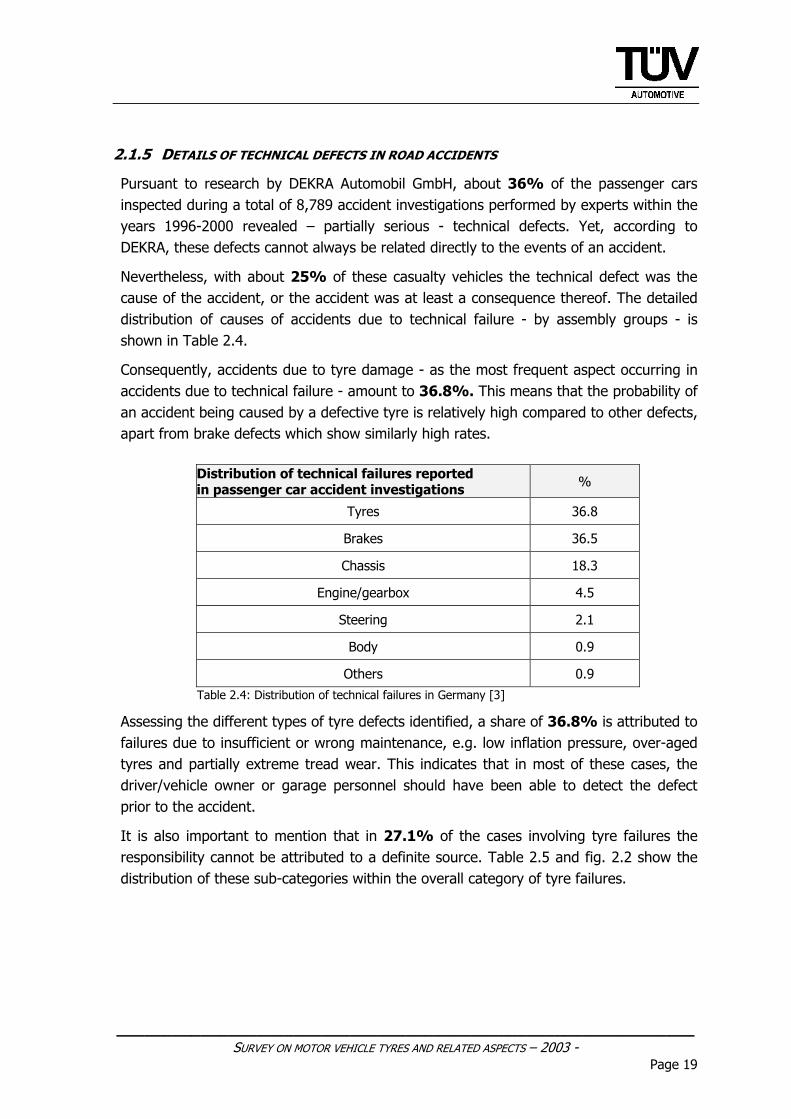
2.1.5 DETAILS OF TECHNICAL DEFECTS IN ROAD ACCIDENTS
Pursuant to research by DEKRA Automobil GmbH, about 36% of the passenger cars inspected during a total of 8,789 accident investigations performed by experts within the years 1996-2000 revealed – partially serious - technical defects. Yet, according to DEKRA, these defects cannot always be related directly to the events of an accident.
Nevertheless, with about 25% of these casualty vehicles the technical defect was the cause of the accident, or the accident was at least a consequence thereof. The detailed distribution of causes of accidents due to technical failure - by assembly groups - is shown in Table 2.4.
Consequently, accidents due to tyre damage - as the most frequent aspect occurring in accidents due to technical failure - amount to 36.8%. This means that the probability of an accident being caused by a defective tyre is relatively high compared to other defects, apart from brake defects which show similarly high rates.
Distribution of technical failures reported in passenger car accident investigations %
Tyres 36.8
Brakes 36.5
Chassis 18.3
Engine/gearbox 4.5
Steering 2.1
Body 0.9
Others 0.9 Table 2.4: Distribution of technical failures in Germany [3]
Assessing the different types of tyre defects identified, a share of 36.8% is attributed to failures due to insufficient or wrong maintenance, e.g. low inflation pressure, over-aged tyres and partially extreme tread wear. This indicates that in most of these cases, the driver/vehicle owner or garage personnel should have been able to detect the defect prior to the accident.
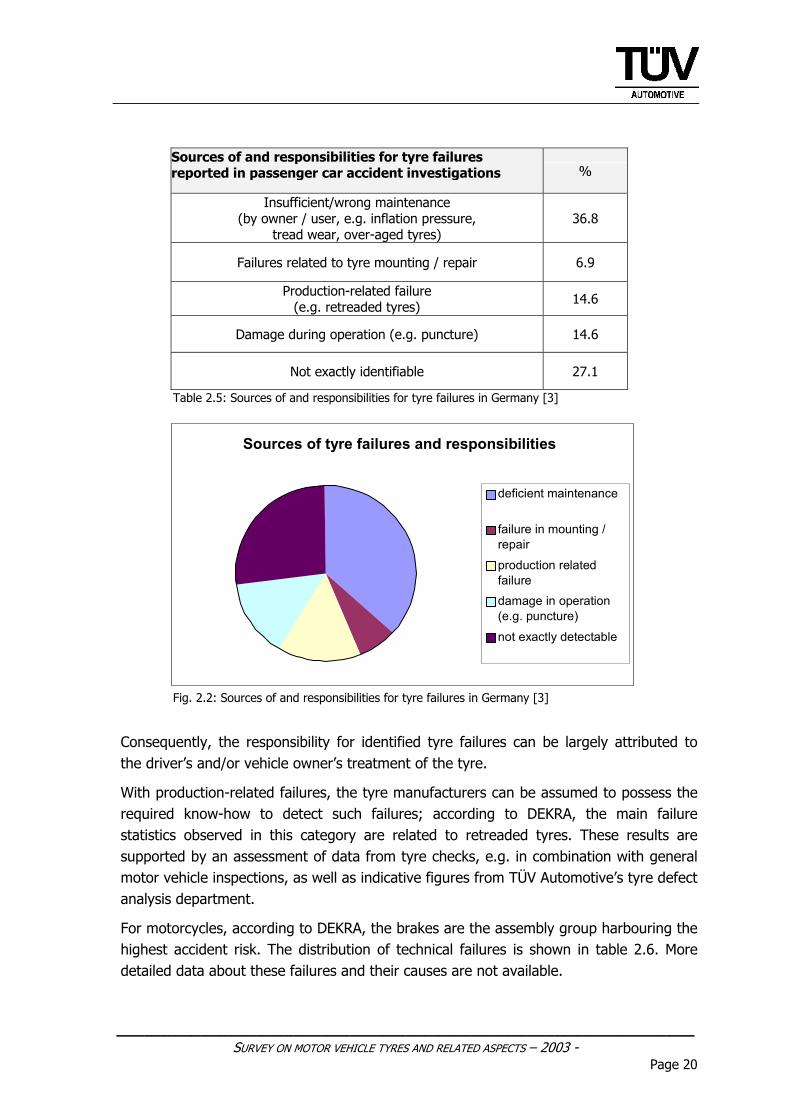
It is also important to mention that in 27.1% of the cases involving tyre failures the responsibility cannot be attributed to a definite source. Table 2.5 and fig. 2.2 show the distribution of these sub-categories within the overall category of tyre failures.
______________________________________________________________ SURVEY ON MOTOR VEHICLE TYRES AND RELATED ASPECTS – 2003 -
Page 20
Sources of and responsibilities for tyre failures reported in passenger car accident investigations %
Insufficient/wrong maintenance (by owner / user, e.g. inflation pressure,
tread wear, over-aged tyres) 36.8
Failures related to tyre mounting / repair 6.9
Production-related failure (e.g. retreaded tyres) 14.6
Damage during operation (e.g. puncture) 14.6
Not exactly identifiable 27.1
Table 2.5: Sources of and responsibilities for tyre failures in Germany [3]
Sources of tyre failures and responsibilities
deficient maintenance
failure in mounting / repair
production related failuredamage in operation (e.g. puncture) not exactly detectable
Fig. 2.2: Sources of and responsibilities for tyre failures in Germany [3]
Consequently, the responsibility for identified tyre failures can be largely attributed to the driver’s and/or vehicle owner’s treatment of the tyre.
With production-related failures, the tyre manufacturers can be assumed to possess the required know-how to detect such failures; according to DEKRA, the main failure statistics observed in this category are related to retreaded tyres. These results are supported by an assessment of data from tyre checks, e.g. in combination with general motor vehicle inspections, as well as indicative figures from TÜV Automotive’s tyre defect analysis department.
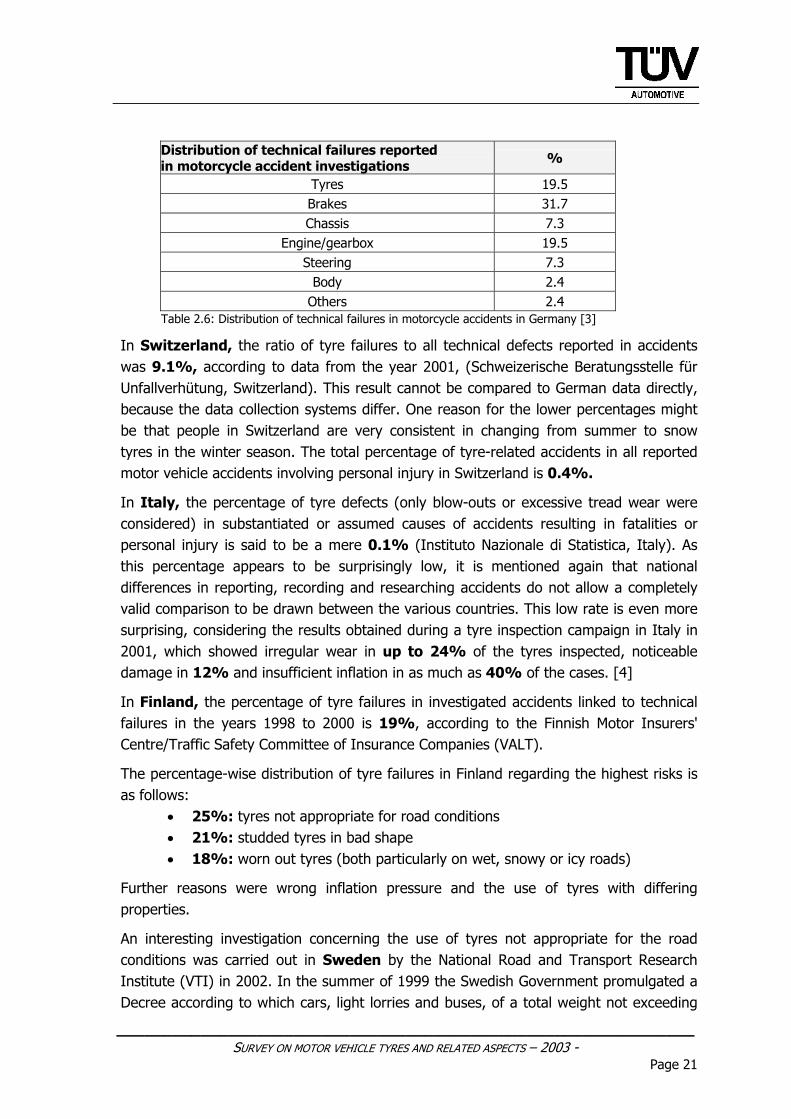
For motorcycles, according to DEKRA, the brakes are the assembly group harbouring the highest accident risk. The distribution of technical failures is shown in table 2.6. More detailed data about these failures and their causes are not available.
______________________________________________________________ SURVEY ON MOTOR VEHICLE TYRES AND RELATED ASPECTS – 2003 -
Page 21
Distribution of technical failures reported in motorcycle accident investigations %
Tyres 19.5 Brakes 31.7 Chassis 7.3
Engine/gearbox 19.5 Steering 7.3
Body 2.4 Others 2.4
Table 2.6: Distribution of technical failures in motorcycle accidents in Germany [3]
In Switzerland, the ratio of tyre failures to all technical defects reported in accidents was 9.1%, according to data from the year 2001, (Schweizerische Beratungsstelle für Unfallverhütung, Switzerland). This result cannot be compared to German data directly, because the data collection systems differ. One reason for the lower percentages might be that people in Switzerland are very consistent in changing from summer to snow tyres in the winter season. The total percentage of tyre-related accidents in all reported motor vehicle accidents involving personal injury in Switzerland is 0.4%.
In Italy, the percentage of tyre defects (only blow-outs or excessive tread wear were considered) in substantiated or assumed causes of accidents resulting in fatalities or personal injury is said to be a mere 0.1% (Instituto Nazionale di Statistica, Italy). As this percentage appears to be surprisingly low, it is mentioned again that national differences in reporting, recording and researching accidents do not allow a completely valid comparison to be drawn between the various countries. This low rate is even more surprising, considering the results obtained during a tyre inspection campaign in Italy in 2001, which showed irregular wear in up to 24% of the tyres inspected, noticeable damage in 12% and insufficient inflation in as much as 40% of the cases. [4]
In Finland, the percentage of tyre failures in investigated accidents linked to technical failures in the years 1998 to 2000 is 19%, according to the Finnish Motor Insurers' Centre/Traffic Safety Committee of Insurance Companies (VALT).
The percentage-wise distribution of tyre failures in Finland regarding the highest risks is as follows:
• 25%: tyres not appropriate for road conditions • 21%: studded tyres in bad shape • 18%: worn out tyres (both particularly on wet, snowy or icy roads)
Further reasons were wrong inflation pressure and the use of tyres with differing properties.
An interesting investigation concerning the use of tyres not appropriate for the road conditions was carried out in Sweden by the National Road and Transport Research Institute (VTI) in 2002. In the summer of 1999 the Swedish Government promulgated a Decree according to which cars, light lorries and buses, of a total weight not exceeding
______________________________________________________________ SURVEY ON MOTOR VEHICLE TYRES AND RELATED ASPECTS – 2003 -
Page 22
3.5 tonnes, shall during the period 1 December to 31 March, when travelling on a road, be fitted with snow tyres or similar equipment when winter road conditions prevail. The law came into force on 1 December 1999. This Decree was followed by an order which requires a least tread depth of 3 mm under winter road conditions during the period 1 December to 31 March, as against the previous requirement of 1.6 mm throughout the year. The study of accidents shows a steep reduction in personal injury accidents with fatalities and severe injuries between the winters before (97/98 and 98/99) and the winters after (99/00 and 00/01) when winter road conditions prevail. An estimate of the effect on these police-reported accidents shows that they had decreased by 11 or 14% depending on whether it is assumed that snow tyres also have a significance on the accident effect on roads free from snow and ice. When all road conditions are considered, these injury accidents decrease by 8% over the period 1 December to 31 March.[39]
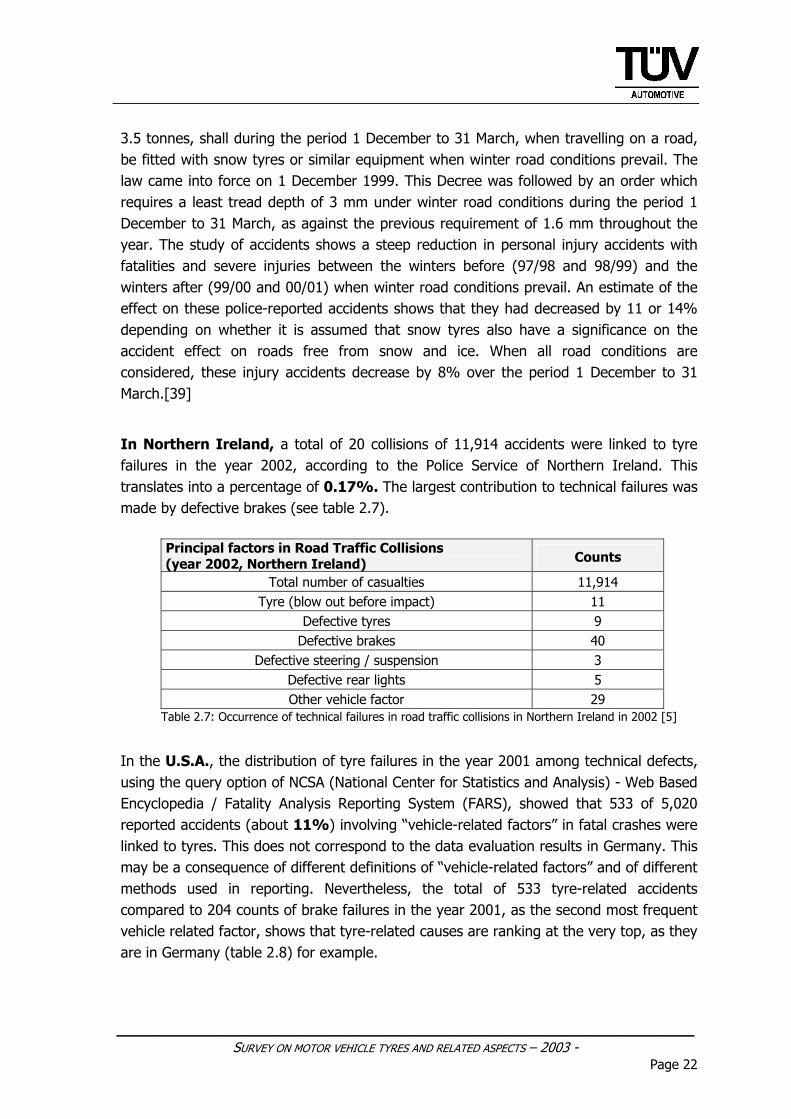
In Northern Ireland, a total of 20 collisions of 11,914 accidents were linked to tyre failures in the year 2002, according to the Police Service of Northern Ireland. This translates into a percentage of 0.17%. The largest contribution to technical failures was made by defective brakes (see table 2.7).
Principal factors in Road Traffic Collisions (year 2002, Northern Ireland) Counts
Total number of casualties 11,914 Tyre (blow out before impact) 11
Defective tyres 9 Defective brakes 40
Defective steering / suspension 3 Defective rear lights 5 Other vehicle factor 29
Table 2.7: Occurrence of technical failures in road traffic collisions in Northern Ireland in 2002 [5]
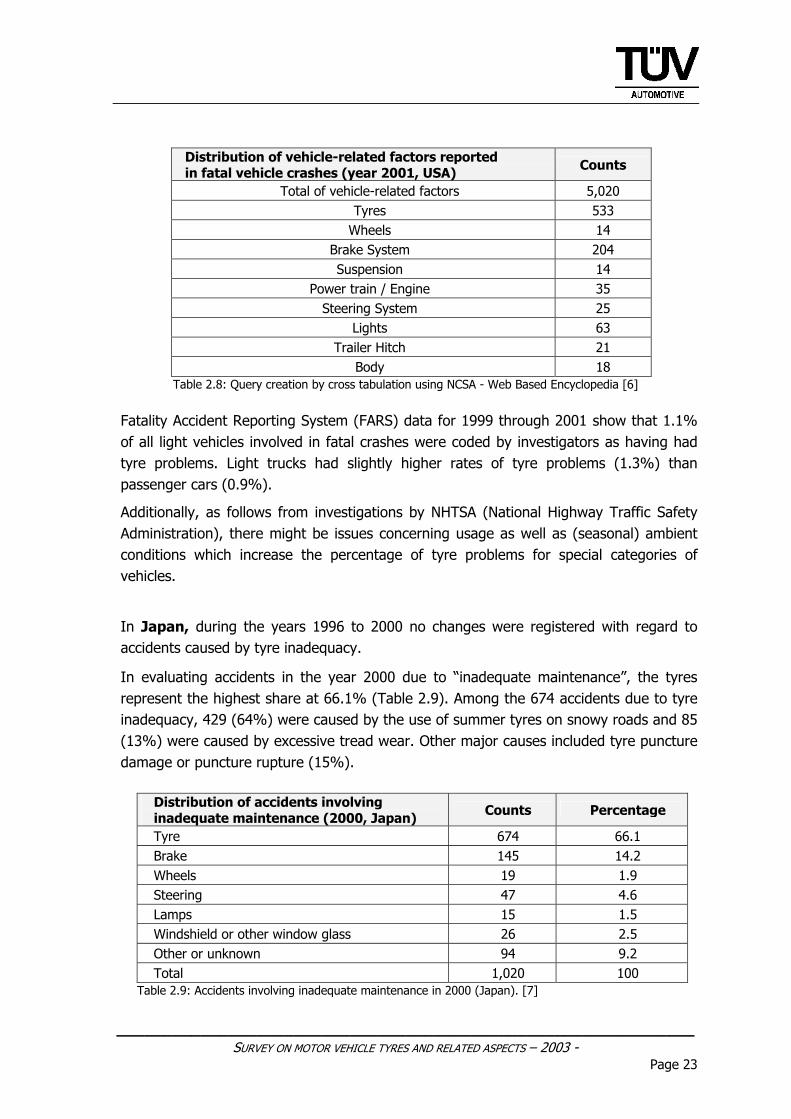
In the U.S.A., the distribution of tyre failures in the year 2001 among technical defects, using the query option of NCSA (National Center for Statistics and Analysis) - Web Based Encyclopedia / Fatality Analysis Reporting System (FARS), showed that 533 of 5,020 reported accidents (about 11%) involving “vehicle-related factors” in fatal crashes were linked to tyres. This does not correspond to the data evaluation results in Germany. This may be a consequence of different definitions of “vehicle-related factors” and of different methods used in reporting. Nevertheless, the total of 533 tyre-related accidents compared to 204 counts of brake failures in the year 2001, as the second most frequent vehicle related factor, shows that tyre-related causes are ranking at the very top, as they are in Germany (table 2.8) for example.
______________________________________________________________ SURVEY ON MOTOR VEHICLE TYRES AND RELATED ASPECTS – 2003 -
Page 23
Distribution of vehicle-related factors reported in fatal vehicle crashes (year 2001, USA) Counts
Total of vehicle-related factors 5,020 Tyres 533
Wheels 14 Brake System 204 Suspension 14
Power train / Engine 35 Steering System 25
Lights 63 Trailer Hitch 21
Body 18 Table 2.8: Query creation by cross tabulation using NCSA - Web Based Encyclopedia [6]
Fatality Accident Reporting System (FARS) data for 1999 through 2001 show that 1.1% of all light vehicles involved in fatal crashes were coded by investigators as having had tyre problems. Light trucks had slightly higher rates of tyre problems (1.3%) than passenger cars (0.9%).
Additionally, as follows from investigations by NHTSA (National Highway Traffic Safety Administration), there might be issues concerning usage as well as (seasonal) ambient conditions which increase the percentage of tyre problems for special categories of vehicles.
In Japan, during the years 1996 to 2000 no changes were registered with regard to accidents caused by tyre inadequacy.
In evaluating accidents in the year 2000 due to “inadequate maintenance”, the tyres represent the highest share at 66.1% (Table 2.9). Among the 674 accidents due to tyre inadequacy, 429 (64%) were caused by the use of summer tyres on snowy roads and 85 (13%) were caused by excessive tread wear. Other major causes included tyre puncture damage or puncture rupture (15%).
Distribution of accidents involving inadequate maintenance (2000, Japan) Counts Percentage
Tyre 674 66.1 Brake 145 14.2 Wheels 19 1.9 Steering 47 4.6 Lamps 15 1.5 Windshield or other window glass 26 2.5 Other or unknown 94 9.2 Total 1,020 100
Table 2.9: Accidents involving inadequate maintenance in 2000 (Japan). [7]
______________________________________________________________ SURVEY ON MOTOR VEHICLE TYRES AND RELATED ASPECTS – 2003 -
Page 24
The total percentage of tyre-related accidents in all reported motor vehicle accidents with personal injury in Japan is 0.25%, according to 2001 statistics by ITARDA.
2.1.6 RESULTS CONCERNING FAILURES IN TYRE CHECKS WITHOUT PRIOR ACCIDENT
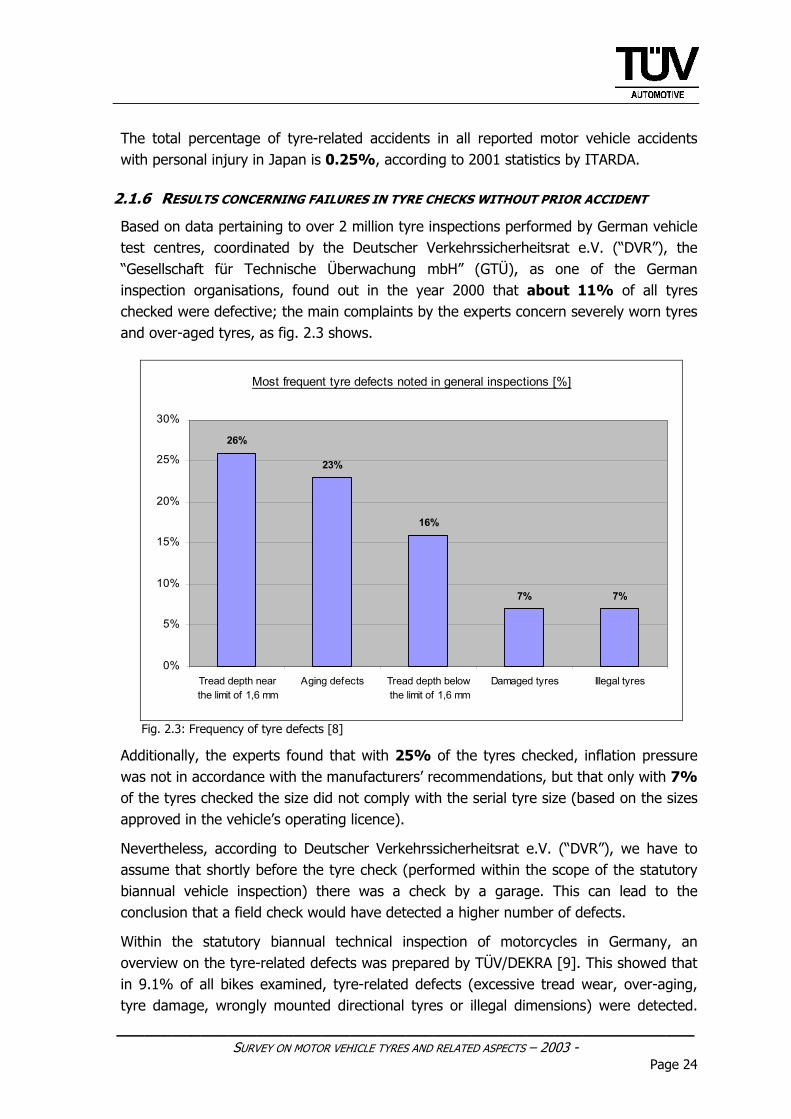
Based on data pertaining to over 2 million tyre inspections performed by German vehicle test centres, coordinated by the Deutscher Verkehrssicherheitsrat e.V. (“DVR”), the “Gesellschaft für Technische Überwachung mbH” (GTÜ), as one of the German inspection organisations, found out in the year 2000 that about 11% of all tyres checked were defective; the main complaints by the experts concern severely worn tyres and over-aged tyres, as fig. 2.3 shows.
Most frequent tyre defects noted in general inspections [%]
26%
23%
16%
7% 7%
0%
5%
10%
15%
20%
25%
30%
Tread depth nearthe limit of 1,6 mm
Aging defects Tread depth belowthe limit of 1,6 mm
Damaged tyres Illegal tyres
Fig. 2.3: Frequency of tyre defects [8]
Additionally, the experts found that with 25% of the tyres checked, inflation pressure was not in accordance with the manufacturers’ recommendations, but that only with 7% of the tyres checked the size did not comply with the serial tyre size (based on the sizes approved in the vehicle’s operating licence).
Nevertheless, according to Deutscher Verkehrssicherheitsrat e.V. (“DVR”), we have to assume that shortly before the tyre check (performed within the scope of the statutory biannual vehicle inspection) there was a check by a garage. This can lead to the conclusion that a field check would have detected a higher number of defects.
Within the statutory biannual technical inspection of motorcycles in Germany, an overview on the tyre-related defects was prepared by TÜV/DEKRA [9]. This showed that in 9.1% of all bikes examined, tyre-related defects (excessive tread wear, over-aging, tyre damage, wrongly mounted directional tyres or illegal dimensions) were detected.
______________________________________________________________ SURVEY ON MOTOR VEHICLE TYRES AND RELATED ASPECTS – 2003 -
Page 25
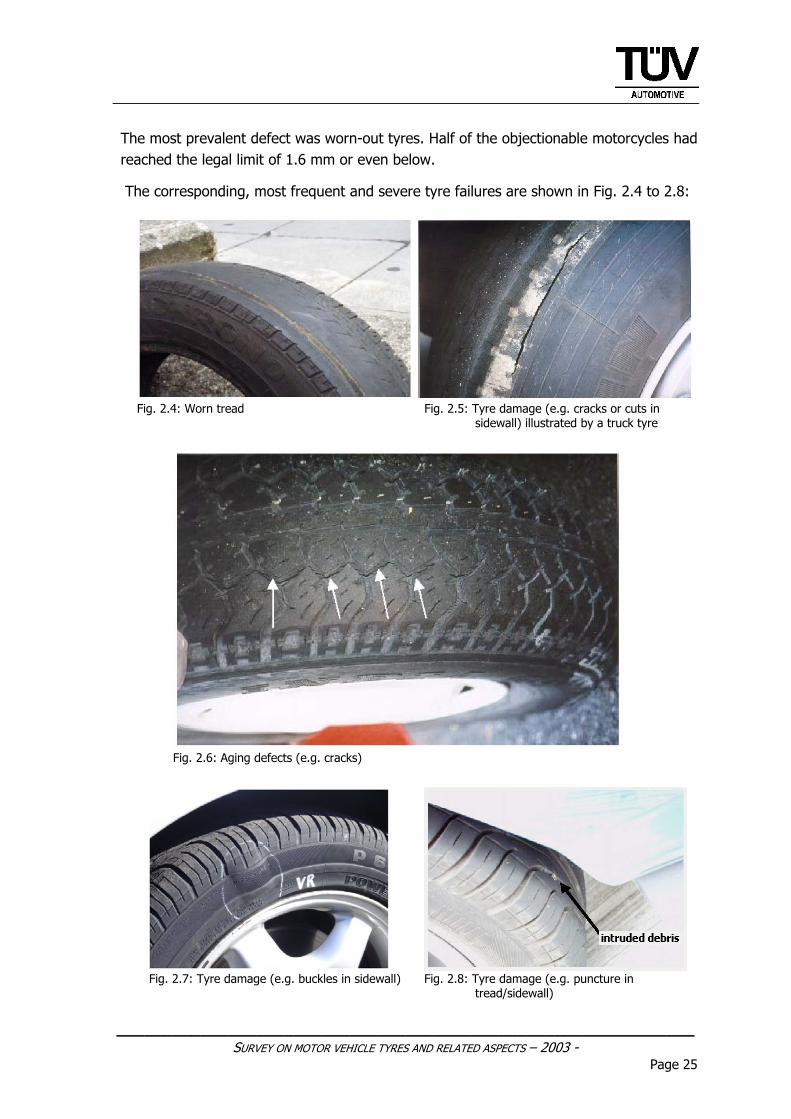
The most prevalent defect was worn-out tyres. Half of the objectionable motorcycles had reached the legal limit of 1.6 mm or even below.
The corresponding, most frequent and severe tyre failures are shown in Fig. 2.4 to 2.8:
Fig. 2.4: Worn tread Fig. 2.5: Tyre damage (e.g. cracks or cuts in sidewall) illustrated by a truck tyre
Fig. 2.6: Aging defects (e.g. cracks)
Fig. 2.7: Tyre damage (e.g. buckles in sidewall) Fig. 2.8: Tyre damage (e.g. puncture in tread/sidewall)
______________________________________________________________ SURVEY ON MOTOR VEHICLE TYRES AND RELATED ASPECTS – 2003 -
Page 26
2.1.7 CONCLUSIONS AND SUMMARY
In accidents involving technical failures tyres have the largest or at least the second-largest share in nearly all considered areas in Europe, Japan and the USA. The main responsibility for tyre failures detectable from the statistics has to be attributed to the drivers/vehicle owners, resulting predominantly from failure to perform proper maintenance, i.e. operation in under-inflated mode, excessive tread wear and use of over-aged tyres. Among all data available, there were no details or noticeable statistics found about a correlation between road accidents and technical failures for motorcycles nor any special involvement of ZR-tyres.
There is an even higher ratio of accidents involving technical failures due to tyres when adding accidents caused by a combination of human or accident-related factors and tyres. to the evaluation. Beyond this, the existence of production-related failures is at least partly detectable in the statistics and therefore has to be considered to a certain extent with a view towards possible accident prevention.
With the knowledge and experience gained in the project so far, it is highly recommended to establish a standard European-wide accident data collection system with a special focus on technical failures in order to enable the detection of distinctive technical factors related to road accidents in future. Ideally, the slightest suspicion of a technical defect being involved in an accident should cause an expert to be called to the scene immediately to perform an in-depth accident investigation. The resulting data should be collected for each country by a single, nation-wide, independent institution, linked to a European superordinate body. This body would then merge these results into comprehensive statistics, allowing for regional considerations, but assuring an overview of the situation across Europe. The more specific vehicle data, including tyres, involved are recorded, the easier it would be to take appropriate action in case of any disproportionate incidence of particular technical factors. For the benefit of legislators, the automotive industry and consumers, free and unrestricted access to such a database would have to be guaranteed. A feasibility study regarding the establishment of such an EU-wide database focused on causes of accidents related to technical defects, to be integrated, ideally, into the already existing CARE-project (Community Road Accident Database) should be a first step to be taken into this direction.
The subject of tyre-related factors in traffic accidents was also briefly discussed within the workshops held with representatives of the motor vehicle industry and tyre manufacturers. Both parties were able to forecast the outcome of our traffic accident data analysis very precisely, obviously knowing from their own research and experience that publicly accessible, significant tyre-related accident data is only scarcely available and, in most cases, neither extensive nor specific enough to contribute to fundamentally new insights. Understandably, the industry itself, both vehicle and tyre manufacturers, is very sensitive about publishing results and statistics of their own accident research or complaint departments.
______________________________________________________________ SURVEY ON MOTOR VEHICLE TYRES AND RELATED ASPECTS – 2003 -
Page 27
In summary, it must be admitted that it appears to be practically impossible to obtain independent and publicly available data that is specific and detailed enough to contribute to new insights. The danger arising from operation in under-inflated mode, mostly caused by failure to perform proper maintenance, as well as from worn and over-aged tyres, was already known before and is plausible, considering common technical sense. The difficulties of getting more specific data are further confirmed by statements and the feedback from various other parties engaged in intensive research of traffic accidents, be it the tyre and vehicle industry themselves or independent institutions, such as DEKRA or GDV (German Insurance Association). Although - for example - the results of their investigations are able to show that fitting all motorcycles with ABS in Germany would save the lives of 70 riders per year, the mere tyre issue is treated with a certain amount of neglect, which is unfortunately reflected by the lack of specific data regarding tyre- related accidents. Admittedly, revealing the influence of the respective tyre parameters is an extremely difficult and intricate task. This is mostly due to the complexity of traffic accidents, in which tyres and related components or systems are often given merely secondary consideration (unless a failure or defect such as a burst or worn-out tyre is obvious). For this reason, most accident reports lack the required details completely. Even if reports contain information on the tyres used as well as their condition, it is extremely difficult to determine the actual influence of the tyre (were tyres properly mounted, did they comply with permissible dimensions, load and speed index or tread depth, or not). In any such case, several effects are brought to bear, and to the largest extent, human failure has to be considered as a cause.
______________________________________________________________ SURVEY ON MOTOR VEHICLE TYRES AND RELATED ASPECTS – 2003 -
Page 28
2.2 CONTRIBUTION OF THE TYRES TO TRAFFIC AND DRIVING SAFETY FROM A
TECHNICAL PERSPECTIVE (PASSENGER CARS)
In order to give an idea of the extent to which the tyres are of essential importance for traffic and driving safety, the following chapter provides an overview of technical safety factors, highlighting the effects and some of the specific hazards involved. In addition, this chapter deals with the performance factors related to tyres, an influencing parameter not considered at all in official statistics. 2.2.1 STRUCTURAL DAMAGE
The effect which can well be deemed the most prevalent cause of an accident (besides excessive tread wear), of those which can be determined beyond a doubt, is the structural damage of a tyre, normally resulting in the driver’s loss of control over the vehicle. To the extent that they lend themselves to differentiation in the statistical data, some of the particular factors have already been outlined in the previous chapter. Now, however, they are presented from a technical perspective and, where applicable, with regard to the various existing, or most probable, technical causes. In addition to the statistical figures on accidents caused by structurally damaged tyres, a number of unknown cases of road users indirectly affected by such incidents can be assumed to exist.
In 1999, ADAC (Allgemeiner Deutscher Automobil Club) assisted 3.44 million broken-down vehicles on German roads, 7% of which (240,800 vehicles) had a tyre or wheel defect (not necessarily being involved in an accident, though). However, when considering the general hazard for traffic safety and the severe consequences which emanate from people having to leave their car in case of a breakdown (for themselves as well as for other road users, particularly on highly frequented roads or motorways), it is likely that a reduction of tyre failures would significantly affect overall accident statistics.[10]
2.2.1.1 RELATED TO APPLICATION AND OPERATION
The following chapters on structural damage related to application deal first and foremost with those factors which emerge from the customer’s actions, i.e. how the consumer uses or abuses the tyre.
2.2.1.1.1 UNDER-INFLATION/OVERLOADING
In any case, deliberate or negligent abuse and failure to perform proper maintenance by the driver has to be regarded as a major reason for structural damage. This can either be by overloading the vehicle beyond the recommended and permissible limits (which is, in fact, not really an issue linked to the tyre) or, truly disastrous if occurring simultaneously, under-inflation of the tyre. Both cause
______________________________________________________________ SURVEY ON MOTOR VEHICLE TYRES AND RELATED ASPECTS – 2003 -
Page 29
the tyre to overheat, followed by tread separation or burst and ultimately resulting in the driver losing control of the vehicle.
To give some exemplary figures, the influence of under-inflation on the tyre’s strength and durability, and resulting liability to sudden burst, can be described as follows [11]:
• 0.2 bar under-inflation causes a durability reduction of 10% • 0.4 bar under-inflation causes a durability reduction of 25% • 0.6 bar under-inflation causes a durability reduction of 45%
The examples above refer to continuous operation in under-inflated mode. It is important to note in this context that any operation (including over a relatively short period or distance) in under-inflated mode decreases the tyre’s overall durability, even if the tyre is refilled again and constantly operated with the correct inflation thereafter.
2.2.1.1.2 TYRE AGE/AGING BEHAVIOUR
Another important aspect to be considered is the age of the tyre and the loss of its strength and durability. In this context, not only the mere age of a tyre expressed in years should be considered, as the overall stress to which the tyre has been subjected during its life is another critical factor. This subject will be covered in more detail later in this report, i.e. in the chapter on concept-related causes. In this case, the key aspect is the consumer’s negligence, i.e. failure to replace the tyres when they have exceeded a certain age or, as a minimum, once aging defects (cracks, hardening) have become obvious.
2.2.1.1.3 INCORRECT LOAD/SPEED INDICES
Illegal use of the wrong tyres with insufficient load or speed indices has to be considered in this context, too. This, however, is a relatively minor factor, as such circumstances are easily detected during regular vehicle inspections or roadside police checks, and tyre shops normally ensure that the tyre on a vehicle complies with legal specifications. Problems may arise, though, from the (for the consumer) slightly obscure practice of load capacity restrictions for tyres with a V speed rating or higher. Only experts know that these tyres may not be operated with the loads corresponding to the printed load index (LI). Depending on the maximum vehicle speed, restrictions down to 85% of the LI-related load have to be considered for these tyres. As this is not obvious from the specifications printed on the tyre, this lack of information available to the consumer gives rise to criticism.
______________________________________________________________ SURVEY ON MOTOR VEHICLE TYRES AND RELATED ASPECTS – 2003 -
Page 30
2.2.1.1.4 EXTERNAL IMPACTS
Other factors contributing to structural tyre damage are external impacts by road hazards, such as debris, potholes, nails etc. Unlike a sudden burst, such damage leads to a slow loss of tyre inflation pressure. Assuming that regular checks of inflation pressure have been performed (by the driver or electronically), such defects can be regarded as less hazardous, as the driver will have a certain period of advance warning. Of course, if the loss of pressure goes unnoticed, once certain limits are under-cut, this, too, will inevitably result in a blow-out sooner or later. In this context it is also important to mention the unpredictable long-term damage suffered by a tyre during operation in under-inflated state, if such tyre is supposed to be repaired again.
2.2.1.2 RELATED TO RETREADING
In its Tire-/Wheel-Test-Center, TÜV Automotive operates a department for analysis of tyre failures, where an experienced expert deals with customer and manufacturer claims. 148 damaged passenger car tyres have been examined here within the past ten years. Following the damage caused by external impacts or intrusion (approx. 50% altogether) as the main cause of tyre damage, at 10%, improperly retreaded tyres present a disproportionately high share of all tyres examined (compared to their roughly 5% market share with passenger car tyres in Germany). Although the work done by TÜV experts must be considered as non-representative due to the relatively small number of samples tested, these results may still be considered as a valuable indicator warranting further research, also with regard to comparing data from chapter 2.1.5.
In any case, consumers should be advised to resort to products from manufacturers affiliated with generally acknowledged industry associations (e.g. AIR, RMA and others), as these have to ensure certain quality standards of production and carcass checks for their products, unlike the manufacturers of no-name, low-budget products.
2.2.1.3 RELATED TO CONCEPT/DESIGN
Past incidents in the U.S. as well as TÜV Automotive’s in-house investigations have shown that although both, the vehicle and the tyre, meet all applicable legal requirements, an unfavourable combination (in the worst case coinciding with the vehicle being operated at or beyond the limits) may lead to a disproportionately high risk of causing structural damage to a tyre. In this context, there must be a special focus on the influence of the aging behaviour of a tyre - in terms of the collective stress to which the tyre is subjected during its lifetime, as previously mentioned. This collective stress is influenced by various parameters. One of them, of course, is the “consumer factor”, i.e. style of driving and proper inflation pressure. Also, the tyre
______________________________________________________________ SURVEY ON MOTOR VEHICLE TYRES AND RELATED ASPECTS – 2003 -
Page 31
factor must be considered in this context, i.e. all engineering- and production-related parameters (design, materials, skills etc.). Further influence is exerted by environmental factors, such as climatic conditions, UV radiation, ozone, as well as road factors (surface conditions and temperatures). Last but not least vehicle-related factors have substantial influence, concerning parameters of chassis geometry (camber, toe), drive concept, heat flow, wheel loads, speed and wheel slip.
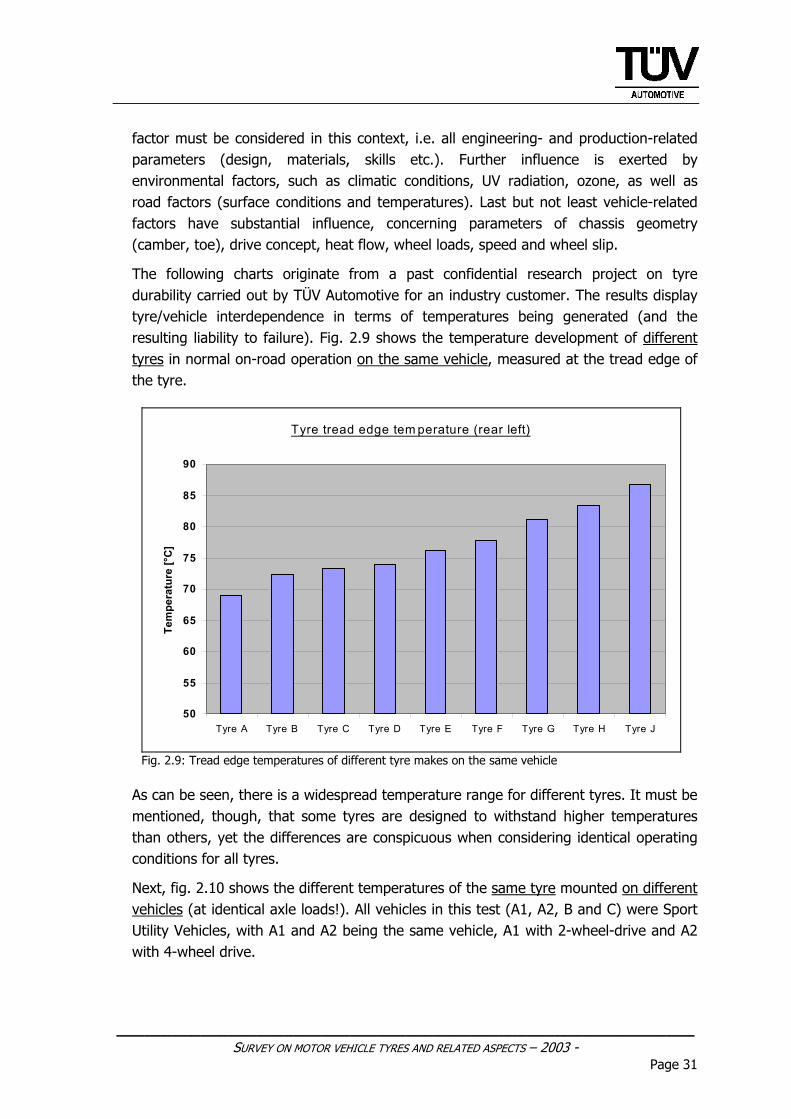
The following charts originate from a past confidential research project on tyre durability carried out by TÜV Automotive for an industry customer. The results display tyre/vehicle interdependence in terms of temperatures being generated (and the resulting liability to failure). Fig. 2.9 shows the temperature development of different tyres in normal on-road operation on the same vehicle, measured at the tread edge of the tyre.
Tyre tread edge tem perature (rear left)
50
55
60
65
70
75
80
85
90
Tyre A Tyre B Tyre C Tyre D Tyre E Tyre F Tyre G Tyre H Tyre J
Tem
pera
ture
[°C
]
Fig. 2.9: Tread edge temperatures of different tyre makes on the same vehicle
As can be seen, there is a widespread temperature range for different tyres. It must be mentioned, though, that some tyres are designed to withstand higher temperatures than others, yet the differences are conspicuous when considering identical operating conditions for all tyres.
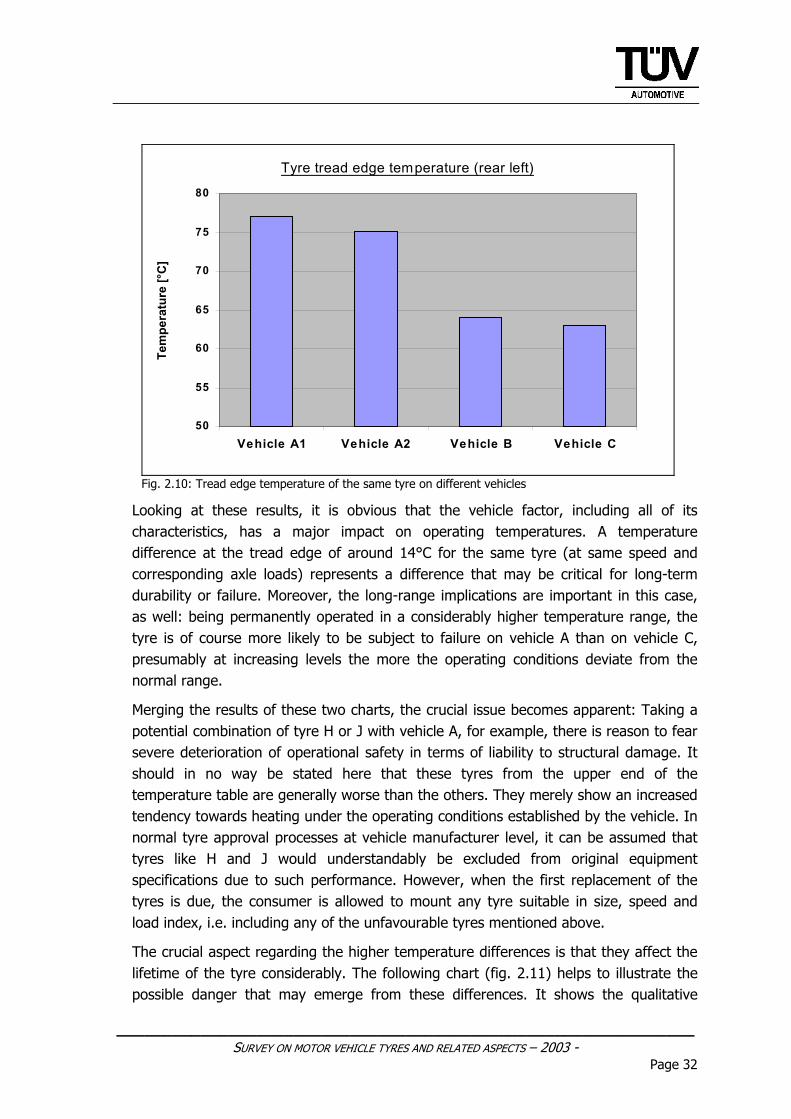
Next, fig. 2.10 shows the different temperatures of the same tyre mounted on different vehicles (at identical axle loads!). All vehicles in this test (A1, A2, B and C) were Sport Utility Vehicles, with A1 and A2 being the same vehicle, A1 with 2-wheel-drive and A2 with 4-wheel drive.
______________________________________________________________ SURVEY ON MOTOR VEHICLE TYRES AND RELATED ASPECTS – 2003 -
Page 32
Tyre tread edge temperature (rear left)
50
55
60
65
70
75
80
Vehicle A1 Vehicle A2 Vehicle B Vehicle C
Tem
pera
ture
[°C
]
Fig. 2.10: Tread edge temperature of the same tyre on different vehicles
Looking at these results, it is obvious that the vehicle factor, including all of its characteristics, has a major impact on operating temperatures. A temperature difference at the tread edge of around 14°C for the same tyre (at same speed and corresponding axle loads) represents a difference that may be critical for long-term durability or failure. Moreover, the long-range implications are important in this case, as well: being permanently operated in a considerably higher temperature range, the tyre is of course more likely to be subject to failure on vehicle A than on vehicle C, presumably at increasing levels the more the operating conditions deviate from the normal range.
Merging the results of these two charts, the crucial issue becomes apparent: Taking a potential combination of tyre H or J with vehicle A, for example, there is reason to fear severe deterioration of operational safety in terms of liability to structural damage. It should in no way be stated here that these tyres from the upper end of the temperature table are generally worse than the others. They merely show an increased tendency towards heating under the operating conditions established by the vehicle. In normal tyre approval processes at vehicle manufacturer level, it can be assumed that tyres like H and J would understandably be excluded from original equipment specifications due to such performance. However, when the first replacement of the tyres is due, the consumer is allowed to mount any tyre suitable in size, speed and load index, i.e. including any of the unfavourable tyres mentioned above.
The crucial aspect regarding the higher temperature differences is that they affect the lifetime of the tyre considerably. The following chart (fig. 2.11) helps to illustrate the possible danger that may emerge from these differences. It shows the qualitative
______________________________________________________________ SURVEY ON MOTOR VEHICLE TYRES AND RELATED ASPECTS – 2003 -
Page 33
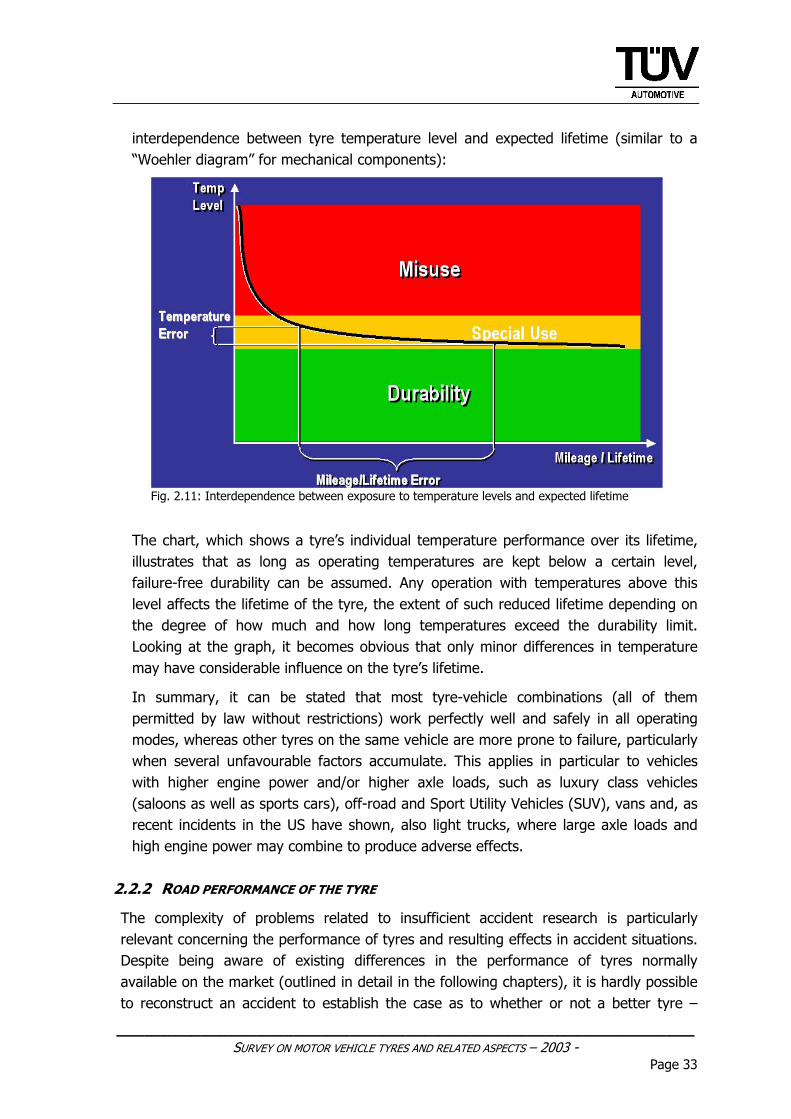
interdependence between tyre temperature level and expected lifetime (similar to a “Woehler diagram” for mechanical components):
Fig. 2.11: Interdependence between exposure to temperature levels and expected lifetime
The chart, which shows a tyre’s individual temperature performance over its lifetime, illustrates that as long as operating temperatures are kept below a certain level, failure-free durability can be assumed. Any operation with temperatures above this level affects the lifetime of the tyre, the extent of such reduced lifetime depending on the degree of how much and how long temperatures exceed the durability limit. Looking at the graph, it becomes obvious that only minor differences in temperature may have considerable influence on the tyre’s lifetime.
In summary, it can be stated that most tyre-vehicle combinations (all of them permitted by law without restrictions) work perfectly well and safely in all operating modes, whereas other tyres on the same vehicle are more prone to failure, particularly when several unfavourable factors accumulate. This applies in particular to vehicles with higher engine power and/or higher axle loads, such as luxury class vehicles (saloons as well as sports cars), off-road and Sport Utility Vehicles (SUV), vans and, as recent incidents in the US have shown, also light trucks, where large axle loads and high engine power may combine to produce adverse effects.
2.2.2 ROAD PERFORMANCE OF THE TYRE
The complexity of problems related to insufficient accident research is particularly relevant concerning the performance of tyres and resulting effects in accident situations. Despite being aware of existing differences in the performance of tyres normally available on the market (outlined in detail in the following chapters), it is hardly possible to reconstruct an accident to establish the case as to whether or not a better tyre –
______________________________________________________________ SURVEY ON MOTOR VEHICLE TYRES AND RELATED ASPECTS – 2003 -
Page 34
assuming that there was one available in the particular situation – would have helped to prevent the accident under the given circumstances or would have at least reduced its severity and consequences. Such analyses, focussing on the particular local accident situation, are unusual and involve an extensive effort, even exceeding the scope of regular recognised accident experts, not to mention police officers normally covering the accident.
From the technical point of view, it can be assumed with maximum probability that there is a non-negligible number of unknown cases of tyre-related accidents related to inadequate tyre performance. Yet, the extent of how much inappropriate road performance of a tyre contributes to the nature and events of an accident can only be estimated. In this context, when speaking about the performance of a tyre, the central focus must be on properties like road holding ability, directional control, deceleration ability (particularly on wet surfaces) and aquaplaning behaviour and its overall influence on vehicle handling. Official statistics are unable to shed light on this influence, as they merely allow obviously defective tyres to be considered. Analogous to the vulnerability of a tyre to structural damage, the tyre’s road performance, as well, can be influenced by various factors.
2.2.2.1 INFLATION PRESSURE
Similar to the causes of structural damage, the performance characteristics of a tyre are substantially influenced by inflation pressure. When speaking of over- or under-inflation in the following chapters, this refers to substantial deviations from the recommended values. To influence the fine-tuning of a vehicle’s driveability (e.g. comfort or stability), vehicle manufacturers deliberately use deviations of approx. ± 0.1 bar.
The principal effects of inflation pressure (graphically displayed in fig 2.12 to 2.14) can be summarized as follows:
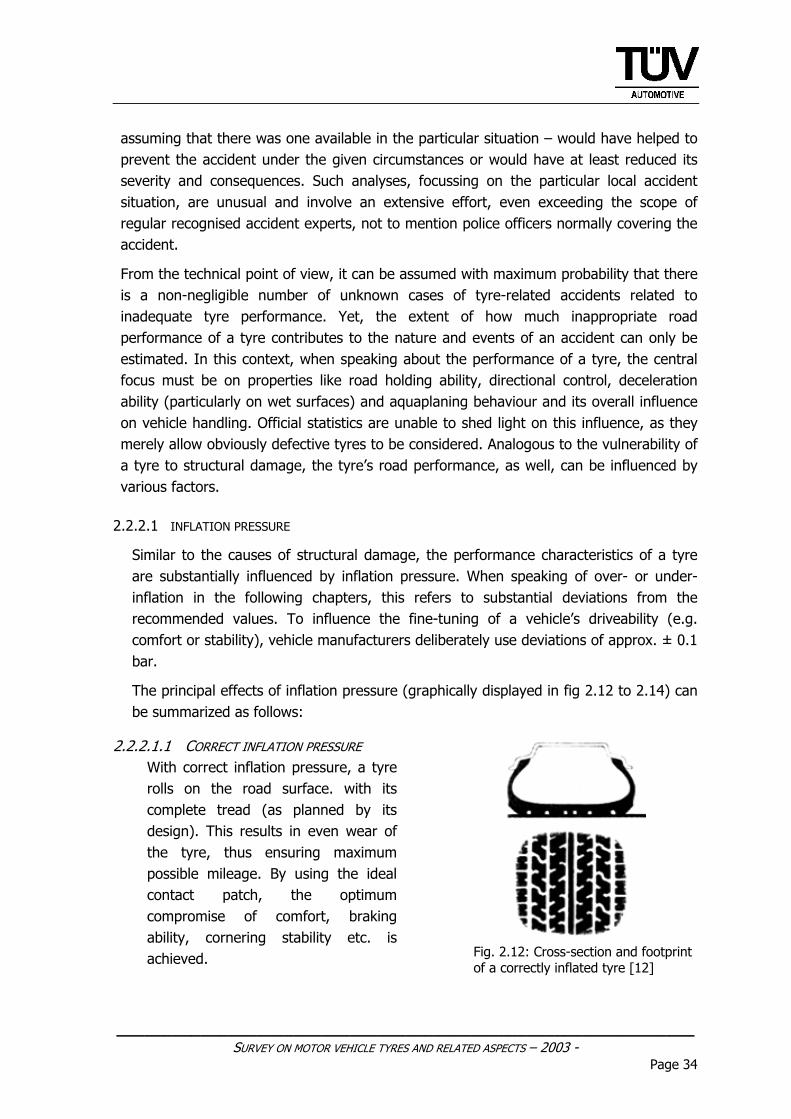
2.2.2.1.1 CORRECT INFLATION PRESSURE With correct inflation pressure, a tyre rolls on the road surface. with its complete tread (as planned by its design). This results in even wear of the tyre, thus ensuring maximum possible mileage. By using the ideal contact patch, the optimum compromise of comfort, braking ability, cornering stability etc. is achieved.
Fig. 2.12: Cross-section and footprint of a correctly inflated tyre [12]
______________________________________________________________ SURVEY ON MOTOR VEHICLE TYRES AND RELATED ASPECTS -2003-
Page 35
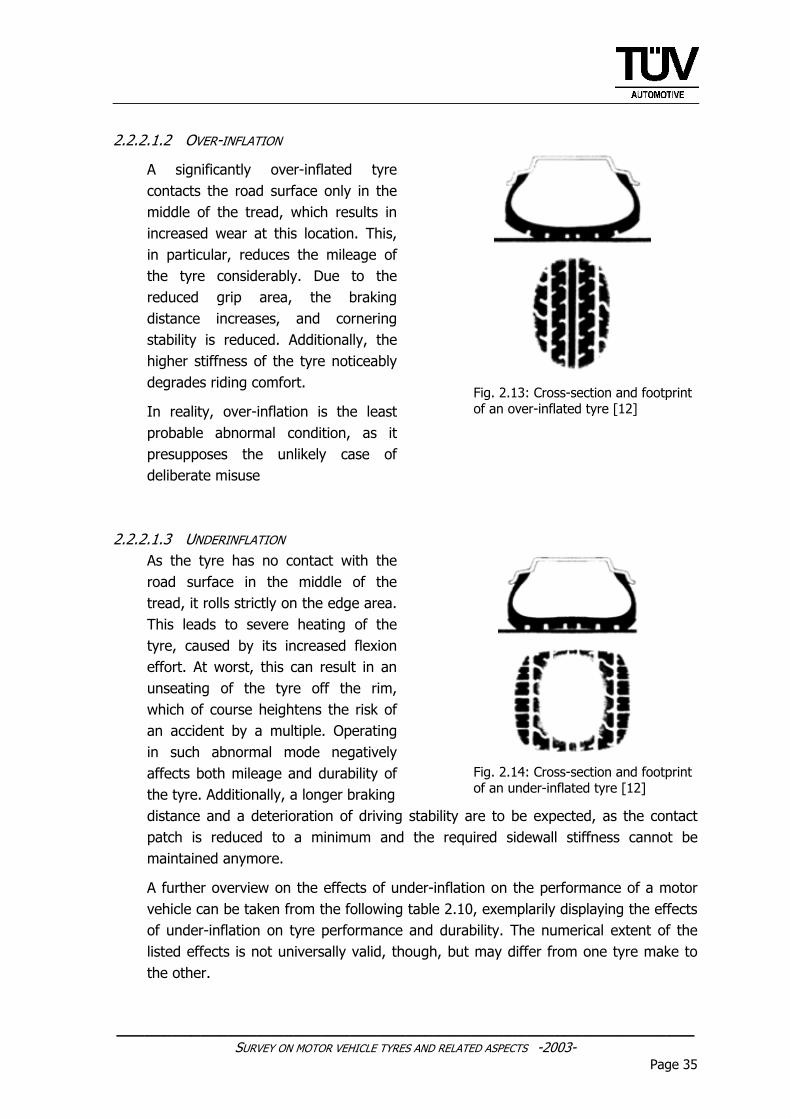
2.2.2.1.2 OVER-INFLATION
A significantly over-inflated tyre contacts the road surface only in the middle of the tread, which results in increased wear at this location. This, in particular, reduces the mileage of the tyre considerably. Due to the reduced grip area, the braking distance increases, and cornering stability is reduced. Additionally, the higher stiffness of the tyre noticeably degrades riding comfort.
In reality, over-inflation is the least probable abnormal condition, as it presupposes the unlikely case of deliberate misuse
Fig. 2.13: Cross-section and footprint of an over-inflated tyre [12]
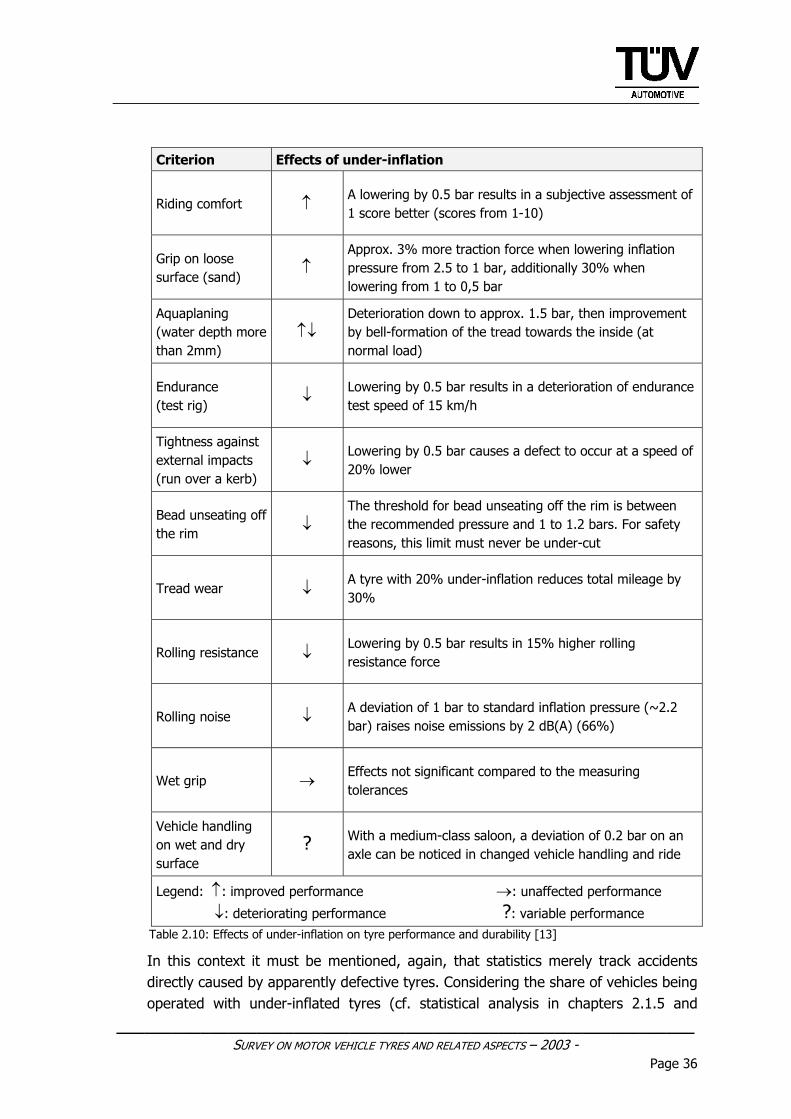
2.2.2.1.3 UNDERINFLATION As the tyre has no contact with the road surface in the middle of the tread, it rolls strictly on the edge area. This leads to severe heating of the tyre, caused by its increased flexion effort. At worst, this can result in an unseating of the tyre off the rim, which of course heightens the risk of an accident by a multiple. Operating in such abnormal mode negatively affects both mileage and durability of the tyre. Additionally, a longer braking
Fig. 2.14: Cross-section and footprint of an under-inflated tyre [12]
distance and a deterioration of driving stability are to be expected, as the contact patch is reduced to a minimum and the required sidewall stiffness cannot be maintained anymore.
A further overview on the effects of under-inflation on the performance of a motor vehicle can be taken from the following table 2.10, exemplarily displaying the effects of under-inflation on tyre performance and durability. The numerical extent of the listed effects is not universally valid, though, but may differ from one tyre make to the other.
______________________________________________________________ SURVEY ON MOTOR VEHICLE TYRES AND RELATED ASPECTS – 2003 -
Page 36
Criterion Effects of under-inflation
Riding comfort ↑ A lowering by 0.5 bar results in a subjective assessment of 1 score better (scores from 1-10)
Grip on loose surface (sand)
↑ Approx. 3% more traction force when lowering inflation pressure from 2.5 to 1 bar, additionally 30% when lowering from 1 to 0,5 bar
Aquaplaning (water depth more than 2mm)
↑↓ Deterioration down to approx. 1.5 bar, then improvement by bell-formation of the tread towards the inside (at normal load)
Endurance (test rig)
↓ Lowering by 0.5 bar results in a deterioration of endurance test speed of 15 km/h
Tightness against external impacts (run over a kerb)
↓ Lowering by 0.5 bar causes a defect to occur at a speed of 20% lower
Bead unseating off the rim
↓ The threshold for bead unseating off the rim is between the recommended pressure and 1 to 1.2 bars. For safety reasons, this limit must never be under-cut
Tread wear ↓ A tyre with 20% under-inflation reduces total mileage by 30%
Rolling resistance ↓ Lowering by 0.5 bar results in 15% higher rolling resistance force
Rolling noise ↓ A deviation of 1 bar to standard inflation pressure (~2.2 bar) raises noise emissions by 2 dB(A) (66%)
Wet grip → Effects not significant compared to the measuring tolerances
Vehicle handling on wet and dry surface
? With a medium-class saloon, a deviation of 0.2 bar on an axle can be noticed in changed vehicle handling and ride
Legend: ↑: improved performance →: unaffected performance
↓: deteriorating performance ?: variable performance Table 2.10: Effects of under-inflation on tyre performance and durability [13]
In this context it must be mentioned, again, that statistics merely track accidents directly caused by apparently defective tyres. Considering the share of vehicles being operated with under-inflated tyres (cf. statistical analysis in chapters 2.1.5 and
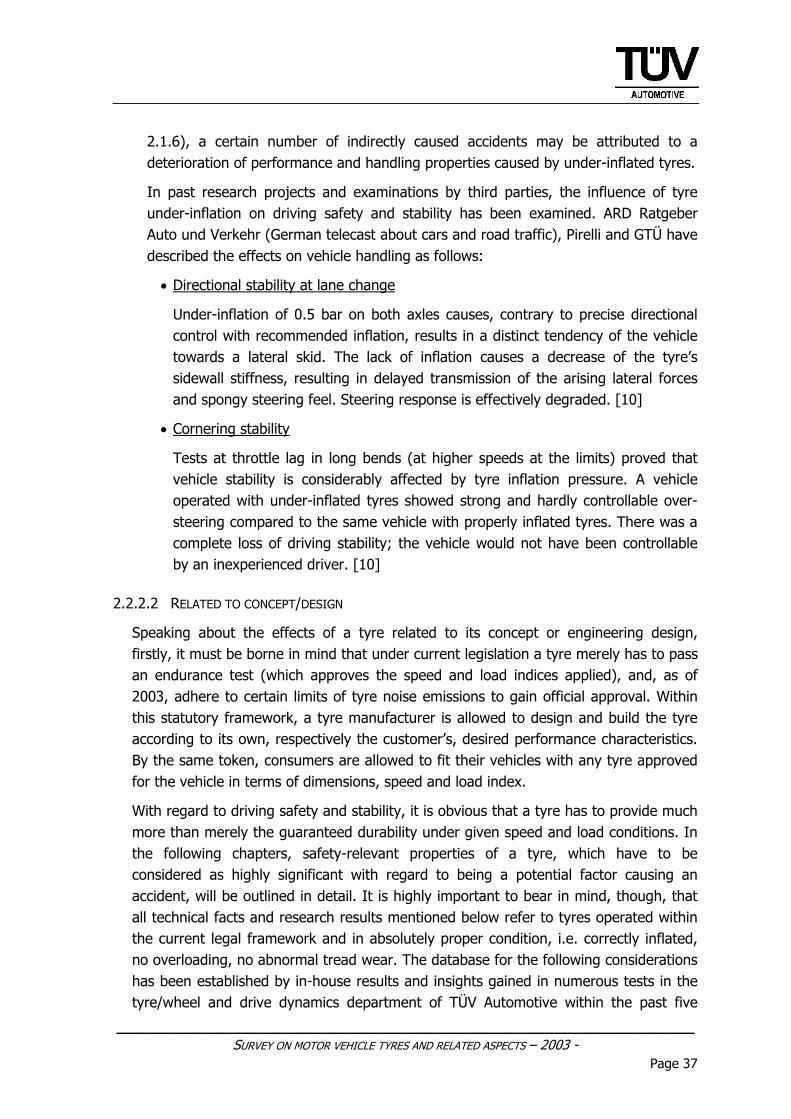
______________________________________________________________ SURVEY ON MOTOR VEHICLE TYRES AND RELATED ASPECTS – 2003 -
Page 37
2.1.6), a certain number of indirectly caused accidents may be attributed to a deterioration of performance and handling properties caused by under-inflated tyres.
In past research projects and examinations by third parties, the influence of tyre under-inflation on driving safety and stability has been examined. ARD Ratgeber Auto und Verkehr (German telecast about cars and road traffic), Pirelli and GTÜ have described the effects on vehicle handling as follows:
• Directional stability at lane change
Under-inflation of 0.5 bar on both axles causes, contrary to precise directional control with recommended inflation, results in a distinct tendency of the vehicle towards a lateral skid. The lack of inflation causes a decrease of the tyre’s sidewall stiffness, resulting in delayed transmission of the arising lateral forces and spongy steering feel. Steering response is effectively degraded. [10]
• Cornering stability
Tests at throttle lag in long bends (at higher speeds at the limits) proved that vehicle stability is considerably affected by tyre inflation pressure. A vehicle operated with under-inflated tyres showed strong and hardly controllable over-steering compared to the same vehicle with properly inflated tyres. There was a complete loss of driving stability; the vehicle would not have been controllable by an inexperienced driver. [10]
2.2.2.2 RELATED TO CONCEPT/DESIGN
Speaking about the effects of a tyre related to its concept or engineering design, firstly, it must be borne in mind that under current legislation a tyre merely has to pass an endurance test (which approves the speed and load indices applied), and, as of 2003, adhere to certain limits of tyre noise emissions to gain official approval. Within this statutory framework, a tyre manufacturer is allowed to design and build the tyre according to its own, respectively the customer’s, desired performance characteristics. By the same token, consumers are allowed to fit their vehicles with any tyre approved for the vehicle in terms of dimensions, speed and load index.
With regard to driving safety and stability, it is obvious that a tyre has to provide much more than merely the guaranteed durability under given speed and load conditions. In the following chapters, safety-relevant properties of a tyre, which have to be considered as highly significant with regard to being a potential factor causing an accident, will be outlined in detail. It is highly important to bear in mind, though, that all technical facts and research results mentioned below refer to tyres operated within the current legal framework and in absolutely proper condition, i.e. correctly inflated, no overloading, no abnormal tread wear. The database for the following considerations has been established by in-house results and insights gained in numerous tests in the tyre/wheel and drive dynamics department of TÜV Automotive within the past five
______________________________________________________________ SURVEY ON MOTOR VEHICLE TYRES AND RELATED ASPECTS – 2003 -
Page 38
years. Part of those tests were commissioned by the public sector and have been published (references to the relevant publications are found in the annex of this report), while others may only be quoted anonymously with respect to customers and our obligations under pertinent confidentiality agreements.
2.2.2.2.1 DECELERATION PROPERTIES
It is a proven fact that the risk of an accident is higher on roads with low surface friction values, which occur predominantly on wet roads. Admittedly, the probability of encountering wet road surfaces largely depends on regional and seasonal climatic conditions in the different countries of the European Community. The importance of wet performance can and must therefore be seen from different perspectives, considering the fact, though, that cars may well be travelling through different climatic regions, as well as encountering unexpected or unusual precipitation in normally dry periods or arid regions.
In several larger projects since 1999, TÜV Automotive has tested the wet braking capability of a total of more than 100 passenger car tyres on the market. For these tests, different commonly used tyre dimensions were used, both as winter and summer tyres. Besides the use of common sizes and test vehicles, the focus was placed on a highly balanced composition of the tyre population, in order to cover the widest possible range from excellent to barely sufficient performance. Consequently, the tests included the tyres of well-established top-class tyre manufacturers from Europe, USA and Japan as well as low-priced tyres from less known manufacturers (e.g. from Czech Republic, Indonesia,…), all of them approved for the European market without any restrictions.
In this context, we would like to state that the fact that all tyres have to comply with the legal regulations of the EU merely ensures that a minimum standard is being observed. Incontestably existing differences in production standards, quality assurance, performance, brand awareness and sales price therefore allow a certain classification of tyres and their manufacturers by terms such as “well-established” or “less-known”, for example. However, we have in no way intended to designate e.g. re-treaded or low-priced tyres as being basically of lower performance, nor could this be substantiated.
In summary, the results of these tests were both surprising and alarming. In the following, the central points of this research project are presented; a table listing the tyres involved and the results of the individual tests are included in the annex to this report (chapters 8.1 and 8.2).
Within many of the tyre groupings tested (a grouping in terms of this project is made up by commercially available tyres of the same dimension and range of use), the spread of average deceleration between the best and the worst tyre was at more
______________________________________________________________ SURVEY ON MOTOR VEHICLE TYRES AND RELATED ASPECTS – 2003 -
Page 39
than 20%, rising all the way to a nearly 30% difference within single tyre groupings. Assuming, for example, an average deceleration of the best tyre by 7 m/s² on a wet surface, the actual consequences become apparent when applied to real-world road conditions. A difference of 25%, for example, as experienced within these tests, when suddenly braking down from 130 km/h on a wet road surface, would increase the braking distance to standstill by 23 metres. A vehicle with poorly performing tyres was still travelling at 48 km/h, while the same vehicle equipped with the best tyres of the test had already stopped. The effect of such inadequate braking performance, for instance when running up the end of an unexpected traffic jam on the motorway, is easy to imagine. However, in accident reports or statistics across the board, such accidents are normally attributed to excessive speed or insufficient safety distance (which must, in fact, be deemed one of the causes, as the vehicle’s speed or safety distance was certainly inappropriate with respect to the particular tyre used). It must be clearly stated at this point that there is no possibility to fully identify these performance deficits as the causes of such accidents. Nevertheless, considering the potentially positive contribution to traffic safety, the currently existing spread of safety properties among tyres should certainly be reduced.
The existence of such a divergence among safety performance characteristics, and in particular wet braking performance, is further supported by an unpublished internal investigation by TÜV Automotive, based on tyre performance tests conducted by automotive magazines. This analysis considered more than 30 performance tests dating from 1997 to present, involving over 300 regular summer and winter tyres on the market. Although such tests normally include only top and medium class products, there were differences of more than 20% noted (see summary chart in annex 8.3).
It is interesting in this context to compare such deviations with the limit values for approval tests of non-OE replacement brake pads (set forth in ECE Regulation No. 90). In this case, a maximum difference of ± 15% in the mean fully developed deceleration is allowed, compared to the OE pad. This makes the importance of tyres as an essentially safety-relevant component appear to be underestimated, considering the fact that there have been no limits established so far.
Another reason for these strongly differing deceleration capabilities of a vehicle with different tyres might be found in the interaction between the tyre and the vehicle’s ABS system. It is important to know that any tyre has more or less differing µ-slip characteristics, caused by its specific tread compounds, carcass stiffness and tread design. The response behaviour of an ABS brake, i.e. the permitted limits of slip that are allowed before brake pressure is released or applied again, varies from car to car. For improved deceleration ability, ABS can be harmonised with tyre characteristics (respectively the µ-slip-characteristic), which holds considerable potential of reducing stopping distance in case this interaction is optimally
______________________________________________________________ SURVEY ON MOTOR VEHICLE TYRES AND RELATED ASPECTS – 2003 -
Page 40
harmonised. On the other hand, an unnecessary loss of safety performance might be caused by using tyres with characteristics strongly differing from the pre-assumed conditions. Analogous circumstances apply to the functionality of electronic traction control and stability programs.
In summary, the existence of widespread performance variations among the different tyre makes regarding safety-relevant properties such as deceleration capability cannot be denied. Of course, individual tyre characteristics are to be maintained, allowing tyre manufacturers to distinguish themselves from their competitors and to place a stronger focus on certain features than on others. Additionally, the customer, too, must be given the opportunity to select a tyre according to his/her individual preferences and driving habits. This, in fact, is the reason why the majority of tyres is deliberately designed to offer certain properties, be it riding comfort, low tyre noise or rolling resistance, high mileage, sporty driving characteristics or excellent wet or snow performance. The afore-mentioned test project, which, in addition to investigating wet performance included rolling resistance, pass-by noise (acc. Amendment 2001/43/EC to Council Directive 92/23/EEC) and tyre weight, proved that it is relatively difficult for a tyre manufacturer to deliver top performance in all relevant criteria, as it is often necessary to compromise one characteristic in order to improve another. The majority of the tyres tested displayed below-average performance in one aspect, while performing above average in another. In fact, the admittedly highly difficult balancing act of delivering top performance in all criteria at a reasonable price is only managed by very few manufacturers, and only with a few, selected tyres.
Of course, it must be mentioned in this context, as well, that the quality and texture of a road surface has considerable influence on the road performance of a tyre and, along with it, on the driveability of a vehicle. Depending on the surface friction values, at wet braking, differences in the absolute deceleration values of up to 40% for the same tyre, tested on different proving grounds on an artificially rained asphalt track, were noted.
2.2.2.2.2 AQUAPLANING PERFORMANCE
The same, previously mentioned research project also tested aquaplaning performance in longitudinal direction (results see annex 8.1). In this case, the difference between the various tyre makes was not as significant as in wet braking performance, however, floating speeds varied by up to 15% between the best and the worst tyre of the same size and range of use, and by more than 20% when comparing only tyres of the same dimension (summer and winter tyres). Moreover, only new tyres with full tread depth were tested in the project, so there is still reason to fear that the differences may become more noticeable with increasing tyre wear. In any event, it is obvious that there is room for improvement in this area as
______________________________________________________________ SURVEY ON MOTOR VEHICLE TYRES AND RELATED ASPECTS – 2003 -
Page 41
well. However, it must be added that in conditions of heavy rainfalls which lead to aquaplaning, a reasonable driver would normally reduce his/her speed anyway to a level where the differences are no longer as critical.
2.2.2.2.3 CORNERING STABILITY
In 2000, TÜV Automotive carried out a large cross-check for an industry customer (therefore requiring further particulars of the testing as well as detailed results to be kept confidential), focussed on braking stability in corners and throttle lag reactions at higher speeds above 100 km/h. A large number of sporty passenger cars from different categories were tested in this project. Starting from a speed of 100 km/h, then accelerating in steps of 10 km/h up to 180 km/h, vehicle stability was tested in different corner radii (up to 600 m). More or less by coincidence, while trying out different tyre makes on certain vehicles, test engineers noted complete differences in the performance of a few of the vehicles, depending on which tyre was mounted. Although all of the tyres used were known as top products and are generally available on the market, a deviation from the tyre specification recommended by the vehicle manufacturer caused a considerable change in driveability in certain cases. While the same vehicle showed perfectly balanced and easily controllable driveability with one particular tyre specification, a momentous change of the emerging sideslip angles was noticed with a different tyre, leading to a significant change of the self-steering characteristics and, in some cases, even to hardly controllable under- or over-steering of the vehicle. This abnormal behaviour was even noted with combinations of speed and radii likely to occur in real-world situations, e.g. at motorway junctions or in tight motorway turns. Admittedly, the tests were performed at the limits, which the average motorist does not normally encounter in everyday driving. Yet, such conditions can certainly arise in emergency situations, often preceding an accident, when being forced to brake at a higher speed while cornering. A tyre optimally harmonised with chassis design (and vice versa) can provide a critical safety margin, compared to a different top-class product which simply does not match the specific requirements optimally, for whatever reason. Comparing these circumstances to the previously described influence of under-inflation (cf. chapter 2.2.2.1) on driving stability, the effect resulting from the spread of tyre properties must by all means be taken into consideration.
2.2.2.2.4 GENERAL VEHICLE HANDLING/DRIVING SAFTEY
The same tendency described above was also noted in numerous benchmarking tests for tyre and vehicle manufacturers performed by TÜV Automotive in recent years. Summarizing the findings obtained in these past projects, it can be stated that the performance of a vehicle is affected to a large extent by the tyre with which it is fitted. Irrespective of such factors as appropriate, safe chassis design or fitting the vehicle with electronic stability and control systems, like ABS, traction control or ESP,
______________________________________________________________ SURVEY ON MOTOR VEHICLE TYRES AND RELATED ASPECTS – 2003 -
Page 42
for which the vehicle manufacturer is solely responsible and which, naturally, are the basic factors influencing the car’s overall handling characteristics, such as response, tracking ability, self-steering tendencies at throttle lag, directional control and vehicle balance, are mainly influenced by the choice of tyre. Generally, all the parameters influenced by the tyre are within clearly obvious tolerances and acceptable from a safety point of view. However, once in a while, in a few but nevertheless recurring cases, not only involving high-powered sports cars, but ordinary compact class cars and medium class family saloons, there was evidence of a tyre, perfectly legal to be fitted in terms of dimensions, load and speed indices, causing a change from well balanced, slightly under-steering and easily controllable driveability to unpredictable and comparably risky performance with erratic self-steering tendencies, which even the average driver would notice in everyday driving situations. Yet, the same tyre may be the optimum choice for a different car of the same class, but having a different drive concept (front/rear wheel drive), different axle load distribution, different engine torque or, above all, different suspension characteristics (in terms of chassis geometry and the kinematic and elasto-kinematic framework), to name only some of the potentially influencing factors. All of these effects are not only noticeable when driving at the limits, but in some cases are already evident at lower speeds, on dry as well as on wet roads (though particularly apparent on wet roads).
With respect to the previous discussions on the necessity of clearly specifying tyre makes, some interesting facts came up during a customer’s project recently carried out by TÜV Automotive. As the particulars of the project are subject to confidentiality, the results must be presented without reference to specific manufacturers or makes.
In this particular project, a comparison of tyres from original equipment (OE) with normal aftermarket (AM) tyres was made. The testing criteria included high-speed durability, rolling resistance, braking on dry and wet surfaces, lateral and longitudinal aquaplaning as well as a subjective handling assessment on dry and wet surfaces. Two different vehicles (medium-class saloons), one with front- and one with rear-wheel drive, were used for the test. The tyre population tested comprised two manufacturer-approved OE specifications for each vehicle and five tyre makes from the aftermarket. The results of this test are summarized below. A short version of this test and a summary chart with the relative performances are provided in the annex to this report (chapter 8.4).
Anonymous excerpt from comparison test report between OE- and AM-tyres:
“ […] Summary: Comparing the results of the objective measurements and the handling assessments, only minor correlations were noted with regard to overall performance. Although, of course, there were noticeable, yet tolerable, differences in the range of measurable criteria, practically no safety-critical concerns with any
______________________________________________________________ SURVEY ON MOTOR VEHICLE TYRES AND RELATED ASPECTS – 2003 -
Page 43
of the tyres of the population were detected. Nevertheless, distinct deviations appeared when focusing on the actual driving performance assessed in the handling tests. Apparently, it was possible to determine the actual potential of active driving safety only during the handling test approaching or exceeding the limits of driving dynamics (and thus the relevant range in emergency situations).
The results of the test can be seen as an indicator that fitting a vehicle with tyres approved/recommended by the car manufacturer holds advantages with regard to stability and controllability in emergency situations at the physical limits, without having to accept any significant disadvantages in the objectively measurable criteria.
The properties of the aftermarket tyres tested showed a very large spread of handling capabilities, from excellent to partly insufficient performance. In any event, the very good performance of some tyres proves that it is possible to fit a vehicle with non-OE tyres without compromising driving safety. In the test discussed, the very good road performance of one aftermarket tyre was degraded by, to some extent, considerable losses (without any causal connection) in rolling resistance and high-speed durability, compared to the OE tyres for the same vehicle. […]”
Due to the relatively small number of vehicles and tyres tested, the results cannot be deemed generally valid. From our own experience, though, the following assumptions regarding the extent to which these results can be applied to all vehicles and tyres may be made:
• With decreasing speed/load indices and smaller tyre sizes, the number of tyres offering good or sufficient performance, available in the aftermarket, is likely to rise. At the same time, there is reason to fear that in this segment the gap between the highest and lowest performance limits may even be wider. The lower the speed and load demands, the higher the number of tyres available from substandard, low-cost manufacturers or retreaders. Tyres from this range must be expected to present larger differences in performance and even more obvious effects on active driving safety
• At higher speed/load indices and larger sizes with low aspect ratios (e.g. sports cars, luxury class vehicles, sporty offroaders/SUVs, etc.) the technological demands placed on the tyres are very high. This is currently reflected by the limited availability of substandard tyres, yet in future, “second- and third-rate” tyre manufacturers will increasingly emerge as providers in this segment as well. As these types of vehicles require a particularly careful selection of tyres and thus may provide higher yet tighter limits in this context, a possible worst case scenario regarding the
______________________________________________________________ SURVEY ON MOTOR VEHICLE TYRES AND RELATED ASPECTS – 2003 -
Page 44
effects on stability and driving safety must be assessed much more critically.
A verification or refutation of these assumptions is only possible after a representative test. This should comprise at least 5 different vehicle categories (compact class, middle class, luxury class, sports cars, sport utility vehicles), each including at least 3 vehicles. For each vehicle, at least two approved/recommended OE tyre makes and 8 aftermarket tyres, taken from the expected medium to low performance end of the spectrum (including retreaded tyres, if applicable), should be compared. The tyre sizes to be examined should be the standard size as well as the biggest retrofitting size approved by the vehicle manufacturer.
With regard to the experiences gained in the tests discussed, a high-speed endurance rig test would appear to be reasonable, with parameters set by the actual operating conditions of the vehicle (camber, load, inflation pressure), thus allowing findings about operational safety to be obtained. As it can be assumed that critical deficits in objective test criteria would be detected with regard to handling, the test could be restricted to subjective handling assessments on wet and dry surfaces. For high acceptance, handling performance has to be assessed by neutral and unbiased test drivers, ideally in a “blind test”. If vehicles are fitted with electronic vehicle control systems, alternating tests should be driven with these systems on and off.
Should any tyre in combination with a particular vehicle raise technical safety concerns, i.e. insufficient and critical performance, the logical consequence might be a specification of makes, substantiated by respective engineering rationale, which may be applicable only to certain vehicle categories. The realisation of such a project requires legislators and their working groups to take action as quickly as possible to clarify the respective facts and circumstances.
2.2.3 CONCLUSION
Considering all the facts, and particularly with respect to the increasing “electronification” of motor vehicles and the emerging requirements on all components involved, it definitely appears reasonable to review certain parts of currently existing standards and regulations. In the authors’ view, the significance of the interaction between a tyre and the vehicle to which it is fitted has so far been underestimated. Nevertheless, knowing from our long-standing experience we dare to say that the vast majority of the tyres of European manufacturers and/or tyres found on the European market are efficient and reliable above the worldwide average and developed to provide the consumer with maximum levels of safety. The continuous improvement of passenger car and motorcycle tyres in terms of durability and road performance is an undeniable fact.
______________________________________________________________ SURVEY ON MOTOR VEHICLE TYRES AND RELATED ASPECTS – 2003 -
Page 45
At the same time, motor vehicles have become safer and more sophisticated, as well. Passive safety systems, which have seen rapid development in recent years (speaking of front, side and window airbags, side impact protection, crash safety of the vehicle body, seat belt pre-tensioners, etc.), have contributed substantially to the decrease of traffic fatalities as well as helping to reduce the severity of accidents in general. Nevertheless, it must be assumed that the developments in this field have reached a certain level of stagnation and saturation. Current developments in the automotive sector are showing a clear trend towards improving active driving safety with regard to reducing braking distance, while maintaining control of the vehicle (see ABS), improved driving stability and anti-skidding support (see ESP), advanced road holding abilities (see active suspensions systems) and better steering performance adapted to the particular driving situation, all the way to actively intervening in emergency situations. Details on these features and interactions can be taken from the chapter “State of the art and technological development” in this report. It cannot be denied that the effectiveness of all these features is more than closely linked to tyres and their performance. The positive contribution to driving safety as well as to the reliability of such systems can be judged to be relatively high, as long as the technical boundary conditions (i.e. level of grip and adhesion between tyre and road) stay within the range the systems were originally designed for.
It must be mentioned at this point that at present neither all vehicles are equipped with such a number of electronic systems, nor that all systems used are equally sensitive. Yet, considering the anticipated level of fitting vehicles with these systems within the next five to ten years, the question does arise whether it may not be reasonable to stipulate legal requirements regarding the suitability of tyre and vehicle characteristics (electronic systems on the one hand and chassis design layout, drive concept and axle load distribution on the other). To emphasize this point, one merely has to look at the fact that the same tyre may be fitted to a front-wheel-driven compact family van (e.g. VW Touran) as well as to a rear-wheel-driven two-seat roadster (BMW Z3), both having approvals for tyre dimension 205/55 R16 91 H. It goes without saying that the specific requirements placed on the tyre are completely different in either of these two cases.
______________________________________________________________ SURVEY ON MOTOR VEHICLE TYRES AND RELATED ASPECTS – 2003 -
Page 46
2.2.4 CONTRIBUTION OF THE TYRES TO TRAFFIC AND DRIVING SAFETY FROM A TECHNICAL
PERSPECTIVE (MOTORCYCLES)
The following chapter deals with the influence of tyres and related components on active driving safety of motorcycles. Basically, the functions of the motorcycle tyres are the same as with all three- or four-wheeled motor vehicles, i.e. the transmission of forces generated between the vehicle and the road surface during driving. However, the actual influence of the tyres on active driving safety goes far beyond this.
With motorcycles, active driving safety is defined by good handling, manoeuvrability and braking performance, while maintaining driving stability. This enables the driver to take appropriate action in case of suddenly appearing obstacles, or in any other emergency situation, in order to swing out, brake or accelerate, thus helping to avoid an accident or to at least alleviate its consequences. Driving stability and controllability, which significantly depends on the tyres and the suspension design, as well as on the brakes, electronic control systems and the engine/drive unit, plays an important role in this.
2.2.4.1 HANDLING AND MANOEUVRABILITY
Manoeuvrability is the ability of a vehicle to perform quick manoeuvres in terms of directional changes, i.e. to follow the driver’s command as quickly and controlled as possible.
Stationary performance can be assessed in standard manoeuvres e.g. by steady-state circular-course driving. The relevant criterion in this context is the quotient of steering torque and lateral acceleration, i.e. the quotient of the driver’s input parameter and the vehicle’s response. This characteristic value is not only influenced by chassis geometry, but also by the tyre’s properties (camber stiffness, cornering stiffness, tyre trail).
More important, however, is non-stationary performance. To evaluate this, the time required to convert the driver’s command into a change in direction is determined, for example, by measuring the delay between the change of steering torque and the build-up of lateral force. Another issue that affects handling is tyre width. A wider tyre causes a distinct migration of the contact patch away from the wheel centre plane. Consequently, more inclination is necessary at the same cornering speed, which makes the vehicle more sensitive to vibrations caused by an uneven road surface, thus requiring corrective intervention by the driver. On the other hand, wider tyres can be designed with a softer rubber compound which increases the transmittable forces. The tyre dimension and make chosen for a motorcycle is therefore always a compromise between grip and handling properties, matching the individual chassis design layout to the best possible extent.
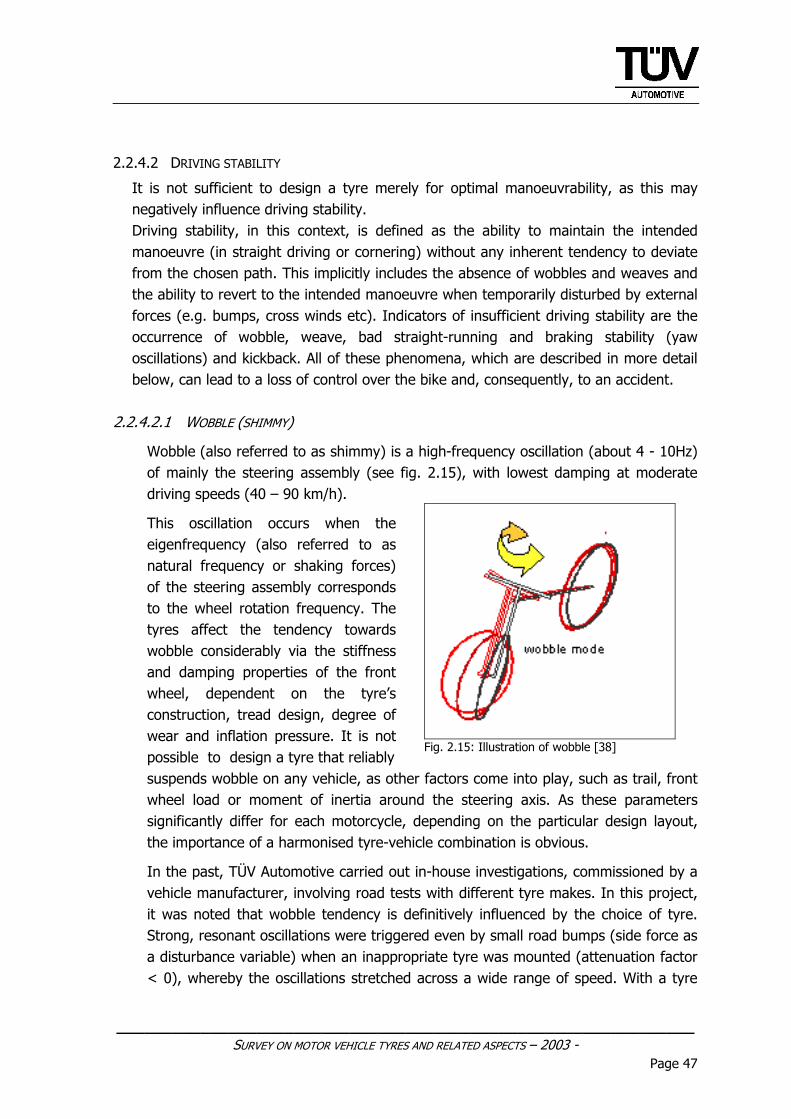
______________________________________________________________ SURVEY ON MOTOR VEHICLE TYRES AND RELATED ASPECTS – 2003 -
Page 47
2.2.4.2 DRIVING STABILITY
It is not sufficient to design a tyre merely for optimal manoeuvrability, as this may negatively influence driving stability. Driving stability, in this context, is defined as the ability to maintain the intended manoeuvre (in straight driving or cornering) without any inherent tendency to deviate from the chosen path. This implicitly includes the absence of wobbles and weaves and the ability to revert to the intended manoeuvre when temporarily disturbed by external forces (e.g. bumps, cross winds etc). Indicators of insufficient driving stability are the occurrence of wobble, weave, bad straight-running and braking stability (yaw oscillations) and kickback. All of these phenomena, which are described in more detail below, can lead to a loss of control over the bike and, consequently, to an accident.
2.2.4.2.1 WOBBLE (SHIMMY)
Wobble (also referred to as shimmy) is a high-frequency oscillation (about 4 - 10Hz) of mainly the steering assembly (see fig. 2.15), with lowest damping at moderate driving speeds (40 – 90 km/h).
This oscillation occurs when the eigenfrequency (also referred to as natural frequency or shaking forces) of the steering assembly corresponds to the wheel rotation frequency. The tyres affect the tendency towards wobble considerably via the stiffness and damping properties of the front wheel, dependent on the tyre’s construction, tread design, degree of wear and inflation pressure. It is not possible to design a tyre that reliably
Fig. 2.15: Illustration of wobble [38]
suspends wobble on any vehicle, as other factors come into play, such as trail, front wheel load or moment of inertia around the steering axis. As these parameters significantly differ for each motorcycle, depending on the particular design layout, the importance of a harmonised tyre-vehicle combination is obvious.
In the past, TÜV Automotive carried out in-house investigations, commissioned by a vehicle manufacturer, involving road tests with different tyre makes. In this project, it was noted that wobble tendency is definitively influenced by the choice of tyre. Strong, resonant oscillations were triggered even by small road bumps (side force as a disturbance variable) when an inappropriate tyre was mounted (attenuation factor < 0), whereby the oscillations stretched across a wide range of speed. With a tyre
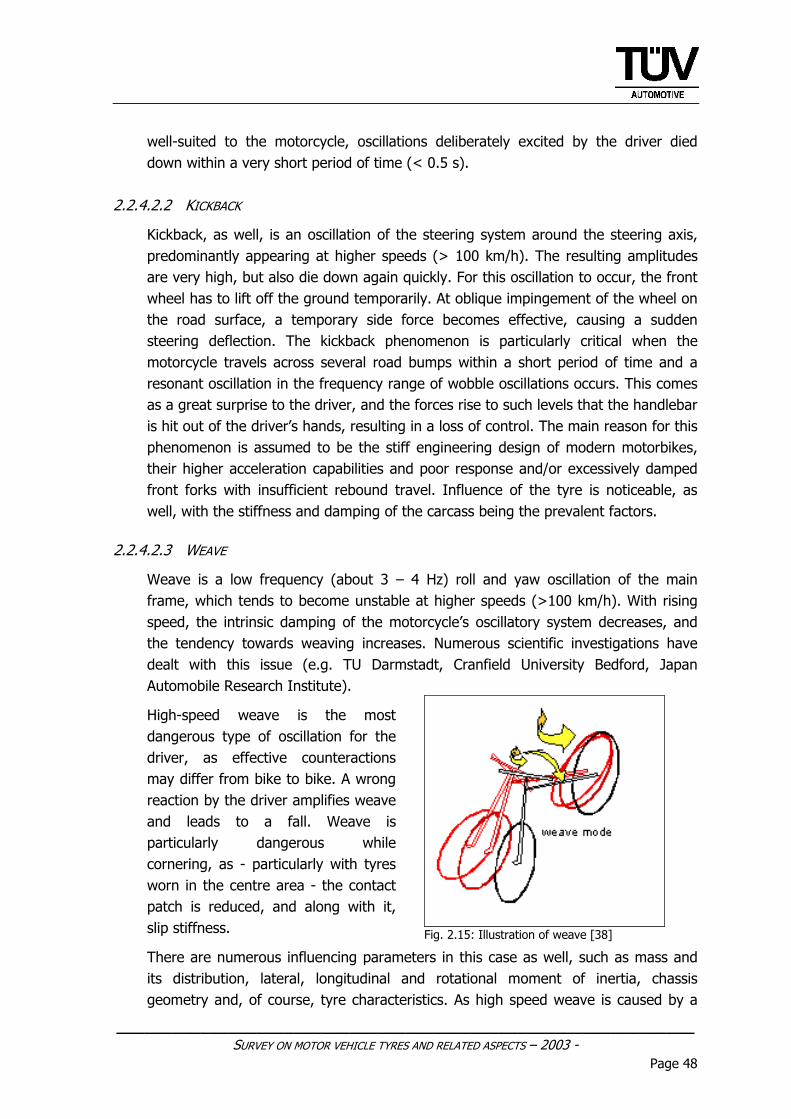
______________________________________________________________ SURVEY ON MOTOR VEHICLE TYRES AND RELATED ASPECTS – 2003 -
Page 48
well-suited to the motorcycle, oscillations deliberately excited by the driver died down within a very short period of time (< 0.5 s).
2.2.4.2.2 KICKBACK
Kickback, as well, is an oscillation of the steering system around the steering axis, predominantly appearing at higher speeds (> 100 km/h). The resulting amplitudes are very high, but also die down again quickly. For this oscillation to occur, the front wheel has to lift off the ground temporarily. At oblique impingement of the wheel on the road surface, a temporary side force becomes effective, causing a sudden steering deflection. The kickback phenomenon is particularly critical when the motorcycle travels across several road bumps within a short period of time and a resonant oscillation in the frequency range of wobble oscillations occurs. This comes as a great surprise to the driver, and the forces rise to such levels that the handlebar is hit out of the driver’s hands, resulting in a loss of control. The main reason for this phenomenon is assumed to be the stiff engineering design of modern motorbikes, their higher acceleration capabilities and poor response and/or excessively damped front forks with insufficient rebound travel. Influence of the tyre is noticeable, as well, with the stiffness and damping of the carcass being the prevalent factors.
2.2.4.2.3 WEAVE
Weave is a low frequency (about 3 – 4 Hz) roll and yaw oscillation of the main frame, which tends to become unstable at higher speeds (>100 km/h). With rising speed, the intrinsic damping of the motorcycle’s oscillatory system decreases, and the tendency towards weaving increases. Numerous scientific investigations have dealt with this issue (e.g. TU Darmstadt, Cranfield University Bedford, Japan Automobile Research Institute).
High-speed weave is the most dangerous type of oscillation for the driver, as effective counteractions may differ from bike to bike. A wrong reaction by the driver amplifies weave and leads to a fall. Weave is particularly dangerous while cornering, as - particularly with tyres worn in the centre area - the contact patch is reduced, and along with it, slip stiffness.
Fig. 2.15: Illustration of weave [38]
There are numerous influencing parameters in this case as well, such as mass and its distribution, lateral, longitudinal and rotational moment of inertia, chassis geometry and, of course, tyre characteristics. As high speed weave is caused by a
______________________________________________________________ SURVEY ON MOTOR VEHICLE TYRES AND RELATED ASPECTS – 2003 -
Page 49
combination of all of these factors, and because all of these factors interact, it is obvious that it is not possible to design a tyre capable of achieving optimum weave prevention on every type of motorcycle.
2.2.4.3 BRAKING/ACCELERATING
Safe acceleration and, above all, braking performance is probably the most important issue when considering the driveability of a motorcycle. The avoidance of wheel lock or longitudinal slip, while maintaining optimum deceleration/acceleration, is the predominant aim. Modern brake systems are designed to be so effective that the front wheel can lock after less than 0.5 s after using the brake. A locked front or rear wheel decreases deceleration performance and can easily lead to loss of control. Therefore, optimum matching of brake and tyre performance is essential. This not only applies to straight line braking, but also to braking in corners. Braking while cornering produces a steering momentum when brake force is applied, caused by the inclination that lets the contact patch migrate away from the wheel centre plane. This pushes the handlebar towards higher steering angles. Emerging rotational forces re-erect the motorbike, leading to an increase of the cornering radius, which may cause the driver to deviate from the road. Slip at acceleration, i.e. when the level of possible force transmission is exceeded, is similarly hazardous, particularly while cornering.
Considering the technical facts, an overriding effect on the behaviour at braking and acceleration comes from the tyres. This mainly concerns the tyre compound (µ-slip characteristics), dimension (size of contact patch), carcass stiffness and tyre contour.
Considerable influence on effective braking performance can be attributed to the driver, as well. Investigations by Vavryn and Winkelbauer [14] involving 110 individuals with different levels of driving experience produced mean decelerations between 3.3 and 8.1 m/s² on the same motorbike and under the same conditions. In-depth analysis of these results showed that many drivers are not aware of basic physical facts that affect braking, e.g. the dynamic load transfer towards the front wheel and the change of transmittable forces involved. Lack of driving experience can also influence stopping distance, as drivers may have no idea about the deceleration capabilities of motorbikes equipped with modern brake systems. The fear of a wheel lock and the associated danger of falling was found to be the main reason for insufficient deceleration.
2.2.4.4 SUMMARY AND CONCLUSION
As already mentioned in the statistical analysis, the actual effects of inappropriate or defective tyres and their influence on the number and types of accidents were not identifiable. This problem is primarily related to the quality of the statistics and thus the possibilities of reconstructing particular accidents. The interferences described above can only be ascertained beyond a doubt, if the driver is able to give this information after the accident. As with passenger cars, motorcycle accidents are
______________________________________________________________ SURVEY ON MOTOR VEHICLE TYRES AND RELATED ASPECTS – 2003 -
Page 50
usually attributed to excessive speed, if no other cause is obvious (e.g. oil, leaves or other factors affecting road grip).
The tyre defects known from the passenger car sector seem to play merely a secondary role in tyre-related accidents of motorcycles. Under-inflation is quickly recognised by the driver, as this noticeably affects driveability even in case of minor deviations from the recommended values. In addition, motorcycle drivers tend to be more aware of technical aspects and maintenance needs (including regular inflation pressures checks), as a great number of motorcyclists does not see the transportation from A to B in the foreground, but rather the use of the vehicle as a device for sports or leisure activity, where as a rule importance is attributed to an especially good technical maintenance condition. Another aspect is the fact that the wear of motorcycle tyres is relatively high compared to passenger cars. This means that tyres are usually replaced after one or two seasons, with positive effects on the incidence of aging defects. Both of these facts along with high production quality seem to prevent sudden blow-outs considerably.
The influence of the tyre on general active driving safety cannot be denied. Taking the technical facts and circumstances outlined above into account, it is obvious that tyres cannot be generally designed so as to effectively contribute to avoiding or positively influencing the potential of negative interferences on every type of motorbike, considering their basic differences in mechanical design and geometrical framework. Matching and harmonising tyres and bikes is essential, though, as the interaction between these two systems, the tyre and the motorcycle, is even more extensive and interdependent than with four-wheeled vehicles. With motorcycles, the tyre must be regarded as a basic engineering design element, the properties of which are essential factors driving the design of the remainder of the chassis, suspension and steering assembly, and vice versa. As these properties may vary considerably from one tyre make to another, it appears more than advisable for the consumer to follow the recommendations of the vehicle manufacturer, particularly when operating motorcycles with higher engine power. If the manufacturer deems it necessary to specify selected tyre makes for some of its products, previously proven to ensure maximum safety and performance for the driver, such specifications should not be discarded. During the workshop meetings information emerged, indicating that a considerable number of the tyres pre-selected during the development process have to be abandoned later for OE specification due to insufficient performance in single criteria or incompatibility with electronic control systems. It can be assumed that those tyres recommended or prescribed by the vehicle manufacturers represent the optimum compromise in terms of active driving safety and stability. There is no denying the fact that other makes exist which offer better performance in single criteria, but which cannot be recommended for reasons of economy or availability, for example.
______________________________________________________________ SURVEY ON MOTOR VEHICLE TYRES AND RELATED ASPECTS – 2003 -
Page 51
Manufacturers of motorcycle tyres and motorcycles are currently holding annual joint test sessions at the Idiada/Spain proving grounds, testing numerous new tyres and motorcycles together. In the end, this large-scale compatibility test of tyres and vehicles produces a so-called “positive-list”, reflecting all combinations found to present no concerns in terms of driving performance and safety. These lists by and large also provide the basis for the tyre recommendations published by the manufacturers. Based on these lists, motorcycle drivers have the possibility to choose from several tyres that have been proven to match their bike.
2.3 SUMMARY OF WORKSHOP MEETINGS
The following chapters summarise the contents of the workshops held within the scope of this survey. The main focus of these sessions was on obtaining input from parties having to deal with the technological facts and developments and being affected mostly by any changes in the field of tyres and related aspects. Of particular interest in these workshops were the concerns and potential fields of action, seen from the individual viewpoints. To organise these meetings, the secretaries general of relevant associated bodies were contacted and informed that, within the scope of a survey on tyres and related aspects, their participation in a workshop on the subject would be appreciated. Thereafter, it was up to the chairmen to forward the invitations to their membership and to coordinate the participation of respective representatives.
2.3.1 MEETINGS WITH REPRESENTATIVES OF TYRE MANUFACTURERS (ETRTO)
The workshops were held under the direction of TÜV Automotive at the ETRTO office in Brussels. They were attended by the chairman of ETRTO as well as representatives of Continental, Goodyear, Michelin and Pirelli.
In principle, ETRTO clearly stated that the tyre manufacturers are willing to assume requisite responsibility for their products within the scope of all the regulations concerned. Nevertheless, ETRTO warned against falling into the trap of special considerations that do not correspond to the recommended use of the tyre (load, inflation pressure, misuse, etc…). Concerning a contribution by ETRTO to the aspect of accident data analysis and the provision of data, it was stated that it would be very difficult for ETRTO to provide tyre failure statistics (which is an understandable position from the authors’ neutral point of view). In their view, there are no trends evident in Europe regarding tyre failures and accidents. Nevertheless, any conclusions to be drawn from the - admittedly not very specific - existing accident research data have to be treated with special caution, as in an accident undoubtedly involving a damaged tyre such damaged tyre may not necessarily have been the sole cause.
ETRTO expressed the need for the “tyre user” to contribute to safety - with regard to tyre usage - by complying with the tyre manufacturers’ recommendations of regularly
______________________________________________________________ SURVEY ON MOTOR VEHICLE TYRES AND RELATED ASPECTS – 2003 -
Page 52
inspecting the tyre. Nevertheless, it was clearly stated that any regulation or directive must be liberal enough not to obstruct innovation and technical progress.
In a brainstorming discussion, the influencing factors on traffic accident statistics, based on the tyres or related components, were compiled. ERTRO’s priority in this regard was clearly on accidents due structural tyre damage, but the issue of road performance was discussed as well. The predominant focus was on factors related to application, which the tyre manufacturers can hardly influence, and those related to the design concept of tyres. In this context, ETRTO stated that optimisation of the interaction between the tyre and the vehicle must be considered, without requiring the tyre to be a strictly customised product. In general, ETRTO considers the major portion of tyre-related accidents to be caused by misuse. The consumer therefore has to take responsibility for complying with the specified tyre operation parameters. Electronic monitoring systems, which differ in terms of effectiveness, depending on whether they are direct or indirect systems, cannot assume this responsibility completely. Provided that the use of their products complies with established regulations, tyre manufacturers are willing to take responsibility for their products. This should be supported, for example, by regular tyre inspections, similar to statutory vehicle inspections.
Within the workshops, technological developments, such as the use of electronic sensors or computer chips, were discussed as well. In this context, it was said that the so-called “Intelligent Tyre” does not provide any better performance than a normal tyre; the only thing it may be able to do is to give safety warnings to the driver. Standardisation, e.g. for tyre-embedded electronic chips or the transmission method to the vehicle’s electronics system, is necessary to ensure that tyres can be exchanged. The development of different individual solutions should be avoided.
Concerning the current and future systems to be used for monitoring inflation pressure and as a warning system to the driver, ETRTO strongly emphasized the differences between directly and indirectly operating systems. For reasons of effectiveness, only the direct systems with tyre-embedded or wheel-mounted active measuring sensors are able to serve as a monitoring system and are therefore to be favoured. Only these systems are able to indicate absolute pressure values. Indirect measuring systems, using ABS sensors, are at best able to serve as a run-flat indicator, however only with limited quality, as the response tolerances are too high (up to 20% below ETRTO recommended range of inflation is permitted) and therefore allow excessively long operation in under-inflated state.
While discussing concerns and issues of the tyre industry, further subjects were brought forward. This included the Integrated Product Policy (IPP) promoted by the EC. It is feared that this might considerably influence product development in future and might require rigorous rethinking. In any case, special consideration must be given to the fact that safety must not be sacrificed to support environmental issues. Another
______________________________________________________________ SURVEY ON MOTOR VEHICLE TYRES AND RELATED ASPECTS – 2003 -
Page 53
concern of the tyre industry are the anticipated bans on certain raw materials (in tyre production) and lead-balancing weights. Particularly the latter should be subjected to a thorough review of social, environmental and economic aspects.
From ETRTO’s point of view, the existence of an excessive number regulations is undesirable. ERTRO feels that this results in a host of different procedural legislation requirements (accompanied by a lot of bureaucracy), with no mutual recognition of the same intended performances. This causes a waste of time with additional costs, without adding value to the product nor benefit for the driver. Also, the existence of partly inappropriate regulations affecting consumers with regard to the use of tyres -wet-grip limits, for instance, may exclude special, purpose built tyres - was brought forward. It is feared that special winter tyres might have to be developed with decreasing performance on snow only to get wet grip approval, for example.
In principle, ERTRO would prefer the demand for higher safety to come from the consumer (a position which cannot be fully supported from a neutral point of view).
2.3.1.1 MEETINGS WITH REPRESENTATIVES OF PASSENGER CAR MANUFACTURERS (ACEA/VDA)
The workshops were held under the direction of TÜV Automotive at the ACEA office in Brussels and at TÜV Automotive headquarters in Munich. They were attended by the chairman of ACEA as well as representatives of Audi, BMW, Fiat, Ford, DaimlerChrysler, Renault, Porsche, and Volkswagen.
The discussions within the circle of vehicle manufacturers were largely focused on the issues and concerns arising from the current standards for tyres, which appear to be outdated from their point of view. Also, the importance of treating a motor vehicle and the tyre fitted to it as one interacting system, particularly with regard to the increasing use of electronic systems designed to improve driveability and safety, was discussed.
Currently existing norms and standards, particularly the wide range of geometrical tolerances for tyre width and diameter allowed by ETRTO, were focal points of interest of at least some car manufacturers. Negative influences from this are affecting not only the design of suspension parts or wheel arches, but also the effectiveness of electronic systems, such as ESP or ABS, not to mention even more sophisticated future developments.
Along with the geometrical tolerances, the strong performance differences of tyres on the market, especially in terms of safety relevant properties, present a huge problem from the vehicle manufacturers’ point of view. Many car manufacturers fear a loss of driving comfort and, above all, driving safety (an increasingly significant factor with high-performance cars having above-average engine power) by permitting any tyre to be fitted on any vehicle as long as it meets the minimum requirements of dimension, load and speed index. With regard to this, better consumer information would be the minimum requirement to be met. This could, for example, be achieved by improved
______________________________________________________________ SURVEY ON MOTOR VEHICLE TYRES AND RELATED ASPECTS – 2003 -
Page 54
tyre designations, making the actual properties of a tyre more obvious to buyers, and by informing them about how well the tyre matches the requirements of their particular vehicle. The problem of unsatisfactory tyre designations also applies to all-season and winter tyres, which so far have been lacking clear and meaningful definitions of their capabilities.
The lack of a standard for the special properties of tyres with run-flat-technology, which are already available on the market but not covered by any directive or regulation so far, was an important point of discussion, too.
Another aspect brought forward by vehicle manufacturers was the intended modification by ETRTO of the tyre standards concerning a limitation of the camber angle for new vehicles, which restricts the freedom of chassis designers (automatically preventing future application of combinations with tyres capable of handling camber angles beyond the new intended limits) and which might also result in problems for tyres for older vehicles.
The issue of desired standardisation and worldwide harmonisation of tyre electronics (e.g. inflation sensor units or electronic identification devices) is, similar to the tyre industry, a major concern of the vehicle manufacturers as well. This being due to the fact that automotive manufacturers aim to increase the number of vehicles fitted with pressure monitoring systems as either standard or optional equipment, and, in the long term, the preponderance of original equipment tyres is desired and assumed to consist of electronically monitored tyres.
2.3.1.2 MEETINGS WITH REPRESENTATIVES OF MOTORCYCLE MANUFACTURERS AND MOTOR
CYCLE TYRE MANUFACTURERS
A joint workshop under the direction of TÜV Automotive with both manufacturers of motorcycles and motorcycle tyres was held at the TÜV Automotive office in Munich/Garching. The meeting was attended by the chairman of IVM (Industrieverband Motorrad), by representatives of BMW Motorrad, Kawasaki, Suzuki and Yamaha as well as Bridgestone, Cooper Avon, Dunlop, Metzeler and Michelin.
The problem of the obvious non-existence of any significant statistics or accident research data on the influence of tyres, with particular regard to steering kickback, oscillations, shimmy, stuttering and juddering, etc. was confirmed by the participants. A survey on the subject currently conducted by IVM is scheduled to be finished by 2004, yet with no data available for the time being. The crux is, as with passenger car accidents, that accidents which might be at least co-caused by the tyres, are normally registered under the collective term of “excessive speed”. Even motorcycle drivers involved in an accident are normally unable to determine the exact causes. In this context, the problem of under-inflation is seen as less critical in the motorcycle sector, as the drivers are by and large more aware of technical aspects and maintain their
______________________________________________________________ SURVEY ON MOTOR VEHICLE TYRES AND RELATED ASPECTS – 2003 -
Page 55
vehicles (including the tyres) with requisite diligence. In addition, incorrect inflation of a motorcycle tyre is noticed rather quickly due to changes in driveability. Nevertheless, to increase operational safety, tyre manufacturers plan to introduce a pressure monitoring system in the near future. Also, tyres with run-flat-technology appear to be under preparation in this context, but no definite statements on their introduction and anticipated distribution were made. Manufacturers anticipate increasing consumer demand for fitting motorcycles with standard or optional ABS, and these systems should therefore become more and more prevalent in future. Electronic sensoring and identification devices for tyres are anticipated to make their way into the motorcycle sector as well. The past has shown that developments which have become accepted in the passenger car sector are usually – if applicable - introduced for motorcycles, too.
The importance of good, matching tyre performance and the positive contribution of tyres to the driving safety of motorcycles was an intensely discussed item during the workshop. It was agreed that both motorcycles and tyres are high-level quality products, yet cannot be combined arbitrarily and without restrictions. Differences between the various tyres are normally clearly noticeable, yet open to question to a certain extent due to underlying subjective assessments. Specifying a tyre make, as is current practice in Germany, makes an essential contribution to driving safety in the opinion of vehicle manufacturers. This practice involves intensive testing to make a pre-selection for the customer (a considerable percentage of tyres fails the OEM’s internal approval for reasons of stability, shimmy, driving characteristics or ABS incompatibility; according to the confidential figures of one motorcycle manufacturer, 90% of the tyres considered in pre-testing fail to meet internal quality requirements, 60% for reasons of driving stability alone). Considering the large number of different tyre and vehicle concepts, it is the position of the vehicle industry not to leave the testing to the customer, but to provide an already approved product combination. On the other hand, some tyre manufacturers seem to consider this practice to be predominantly an instrument for customer retention. Nevertheless, this practice obviously seems justified by the fact that tyres approved by the motorcycle manufacturers in Germany are recommended for other European countries, as well.
In this context, both parties again emphasized the high level of technical awareness possessed by motorcycle drivers, which is above average compared to other motorists. As a matter of fact, tyres that have received negative press coverage or have been rated as “dubious” within biker club circles or by friends are “a losing deal”. Consequently, sub-standard, low-cost tyres are not assumed to gain any significant market share.
For future developments, the main focus should be on high levels of active driving safety. In general, the participants of this workshop did not see any urgent need for changes to the current regulatory framework.
______________________________________________________________ SURVEY ON MOTOR VEHICLE TYRES AND RELATED ASPECTS – 2003 -
Page 56
3 RESEARCH OF THE CURRENT AND FUTURE STATE OF TECHNOLOGICAL DEVELOPMENTS WITH RESPECT TO TYRES AND RELATED COMPONENTS AND SYSTEMS
The focus of research on the technological state of the art and future developments in the field of tyres and related items, so far, concerned two major directions. On the one hand, the generally accessible data sources were searched, e.g. the Internet, academic libraries, professional journals and TÜV’s own information databases. At the same time, the input and contributions from industry during the workshop meetings were considered. 3.1 TYRES 3.1.1 TYRES AND COMBINED SYSTEMS WITH RUN-FLAT TECHNOLOGY
The growing application of run-flat tyre systems is, at the moment, the dominant new development in the field of passenger car tyres, now slowly but surely hitting the market. Various tyre manufacturers are developing different systems. For some passenger cars of European manufacturers, these systems are already available as optional or even standard equipment. In the following chapter, the different systems currently in existence, their functionality, potential problems involved and some application examples are described in detail.
The principal objective of run-flat-systems is to contribute substantially to an improvement of driving safety and stability in relevant situations. As the statistical evaluation has shown, the sudden or slow loss of tyre inflation pressure represents a major percentage of the causes of accidents that occur as a result of tyre failures. The technical consequences of driving with a normal, under-inflated tyre with respect to its liability to blow-up as well as its road performance have already been described in detail in chapter 2.2.2.1. Based on these facts, the purpose and function of such systems can be described as maintaining the tyre, if sudden or slow loss of inflation pressure occurs, in a stable mode in order to ensure that the vehicle can continue to be operated with certain limitations, yet safely.
Generally speaking, run-flat-systems currently under development or already available on the market are to be subdivided into three different categories. The differences concern special characteristics of engineering design and mode of operation. The main differentiation has to be made between tyres with run-flat-properties (self-supporting systems), add-on systems (supporting insert) for run-flat operation and tyre/wheel systems with run-flat-properties. The various systems are presented in detail below, with the relevant monitoring systems for pressure and temperature being considered separately.
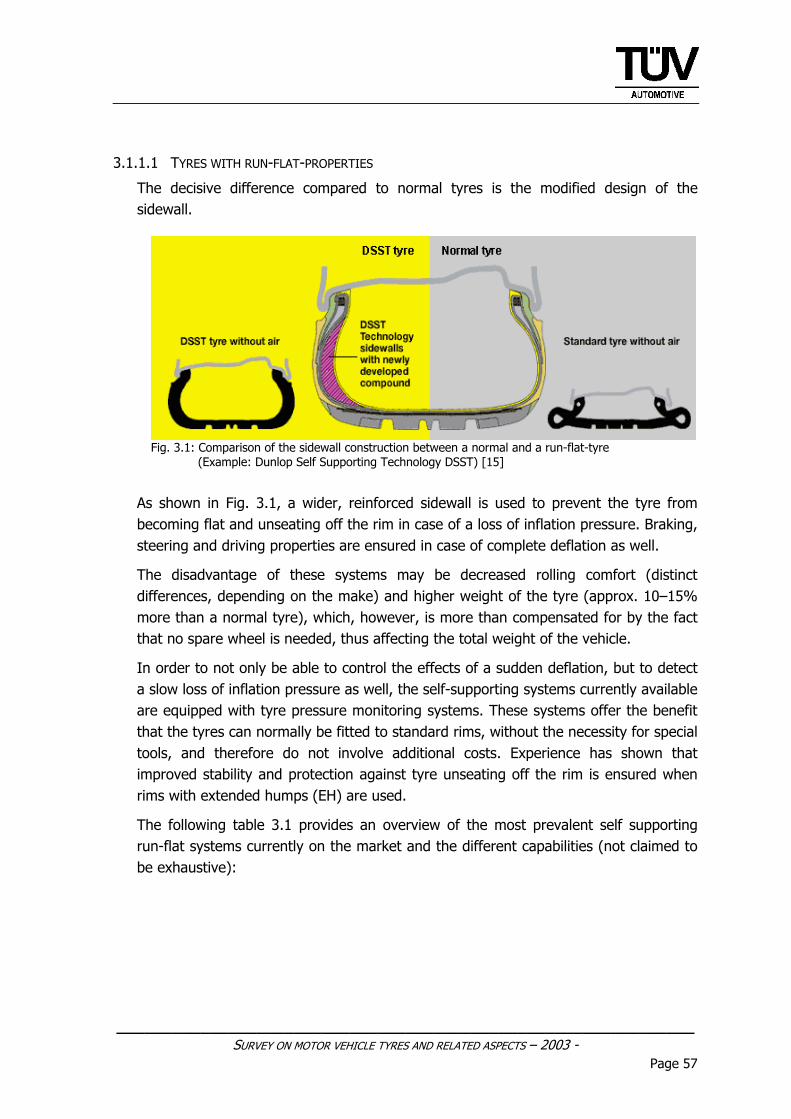
______________________________________________________________ SURVEY ON MOTOR VEHICLE TYRES AND RELATED ASPECTS – 2003 -
Page 57
3.1.1.1 TYRES WITH RUN-FLAT-PROPERTIES
The decisive difference compared to normal tyres is the modified design of the sidewall.
Fig. 3.1: Comparison of the sidewall construction between a normal and a run-flat-tyre
(Example: Dunlop Self Supporting Technology DSST) [15]
As shown in Fig. 3.1, a wider, reinforced sidewall is used to prevent the tyre from becoming flat and unseating off the rim in case of a loss of inflation pressure. Braking, steering and driving properties are ensured in case of complete deflation as well.
The disadvantage of these systems may be decreased rolling comfort (distinct differences, depending on the make) and higher weight of the tyre (approx. 10–15% more than a normal tyre), which, however, is more than compensated for by the fact that no spare wheel is needed, thus affecting the total weight of the vehicle.
In order to not only be able to control the effects of a sudden deflation, but to detect a slow loss of inflation pressure as well, the self-supporting systems currently available are equipped with tyre pressure monitoring systems. These systems offer the benefit that the tyres can normally be fitted to standard rims, without the necessity for special tools, and therefore do not involve additional costs. Experience has shown that improved stability and protection against tyre unseating off the rim is ensured when rims with extended humps (EH) are used.
The following table 3.1 provides an overview of the most prevalent self supporting run-flat systems currently on the market and the different capabilities (not claimed to be exhaustive):
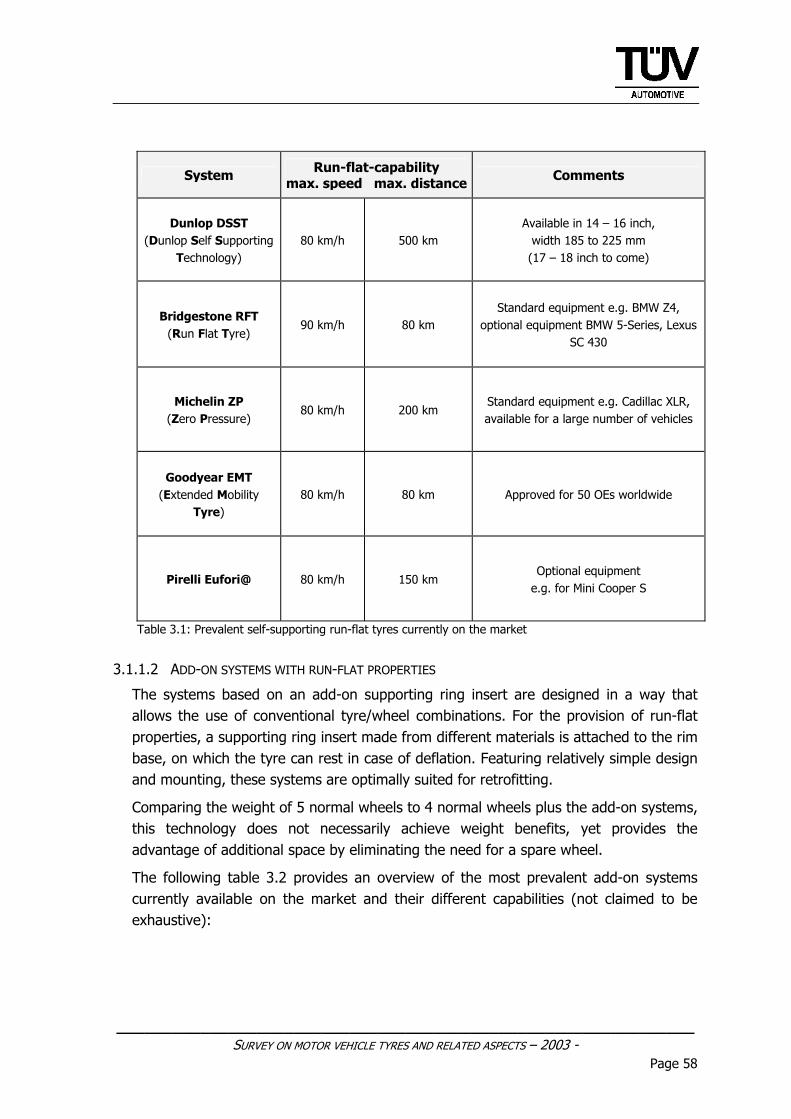
______________________________________________________________ SURVEY ON MOTOR VEHICLE TYRES AND RELATED ASPECTS – 2003 -
Page 58
System Run-flat-capability max. speed max. distance Comments
Dunlop DSST (Dunlop Self Supporting
Technology) 80 km/h 500 km
Available in 14 – 16 inch, width 185 to 225 mm (17 – 18 inch to come)
Bridgestone RFT (Run Flat Tyre)
90 km/h 80 km Standard equipment e.g. BMW Z4,
optional equipment BMW 5-Series, Lexus SC 430
Michelin ZP (Zero Pressure)
80 km/h 200 km Standard equipment e.g. Cadillac XLR, available for a large number of vehicles
Goodyear EMT (Extended Mobility
Tyre) 80 km/h 80 km Approved for 50 OEs worldwide
Pirelli Eufori@ 80 km/h 150 km Optional equipment
e.g. for Mini Cooper S
Table 3.1: Prevalent self-supporting run-flat tyres currently on the market
3.1.1.2 ADD-ON SYSTEMS WITH RUN-FLAT PROPERTIES
The systems based on an add-on supporting ring insert are designed in a way that allows the use of conventional tyre/wheel combinations. For the provision of run-flat properties, a supporting ring insert made from different materials is attached to the rim base, on which the tyre can rest in case of deflation. Featuring relatively simple design and mounting, these systems are optimally suited for retrofitting.
Comparing the weight of 5 normal wheels to 4 normal wheels plus the add-on systems, this technology does not necessarily achieve weight benefits, yet provides the advantage of additional space by eliminating the need for a spare wheel.
The following table 3.2 provides an overview of the most prevalent add-on systems currently available on the market and their different capabilities (not claimed to be exhaustive):
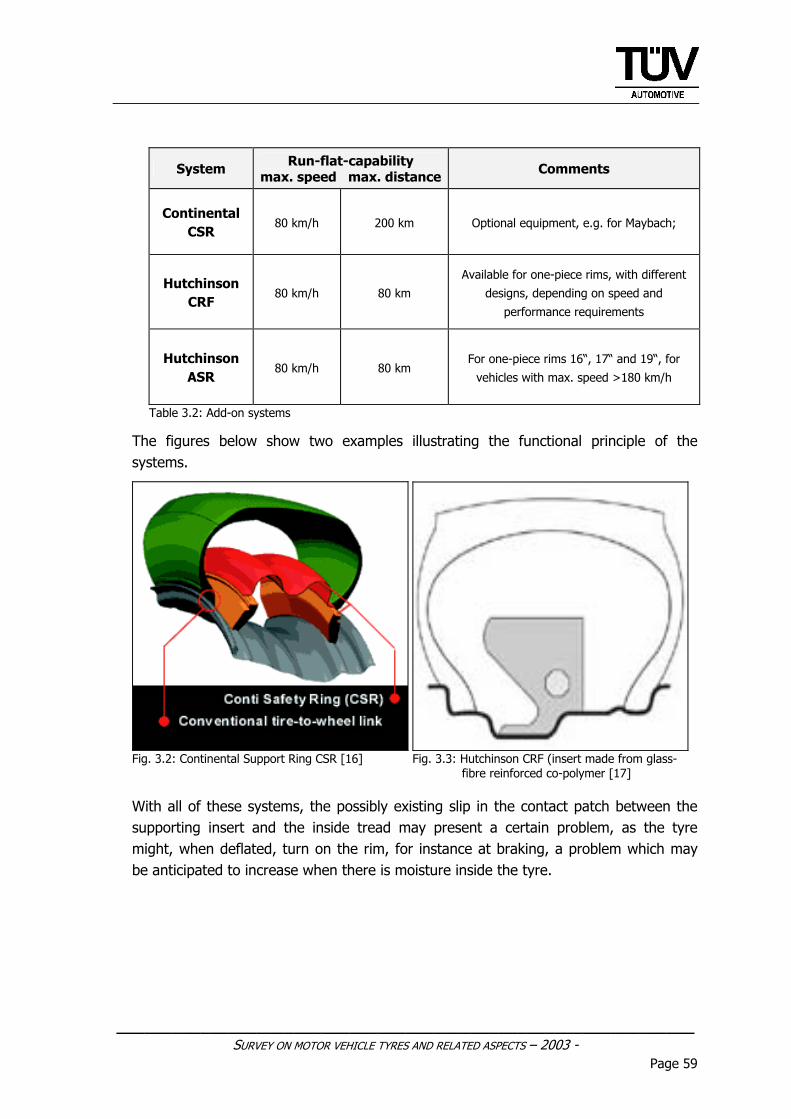
______________________________________________________________ SURVEY ON MOTOR VEHICLE TYRES AND RELATED ASPECTS – 2003 -
Page 59
System Run-flat-capability max. speed max. distance Comments
Continental CSR
80 km/h 200 km Optional equipment, e.g. for Maybach;
Hutchinson CRF
80 km/h 80 km
Available for one-piece rims, with different
designs, depending on speed and
performance requirements
Hutchinson ASR
80 km/h 80 km For one-piece rims 16“, 17“ and 19“, for
vehicles with max. speed >180 km/h
Table 3.2: Add-on systems
The figures below show two examples illustrating the functional principle of the systems.
Fig. 3.2: Continental Support Ring CSR [16] Fig. 3.3: Hutchinson CRF (insert made from glass-
fibre reinforced co-polymer [17]
With all of these systems, the possibly existing slip in the contact patch between the supporting insert and the inside tread may present a certain problem, as the tyre might, when deflated, turn on the rim, for instance at braking, a problem which may be anticipated to increase when there is moisture inside the tyre.
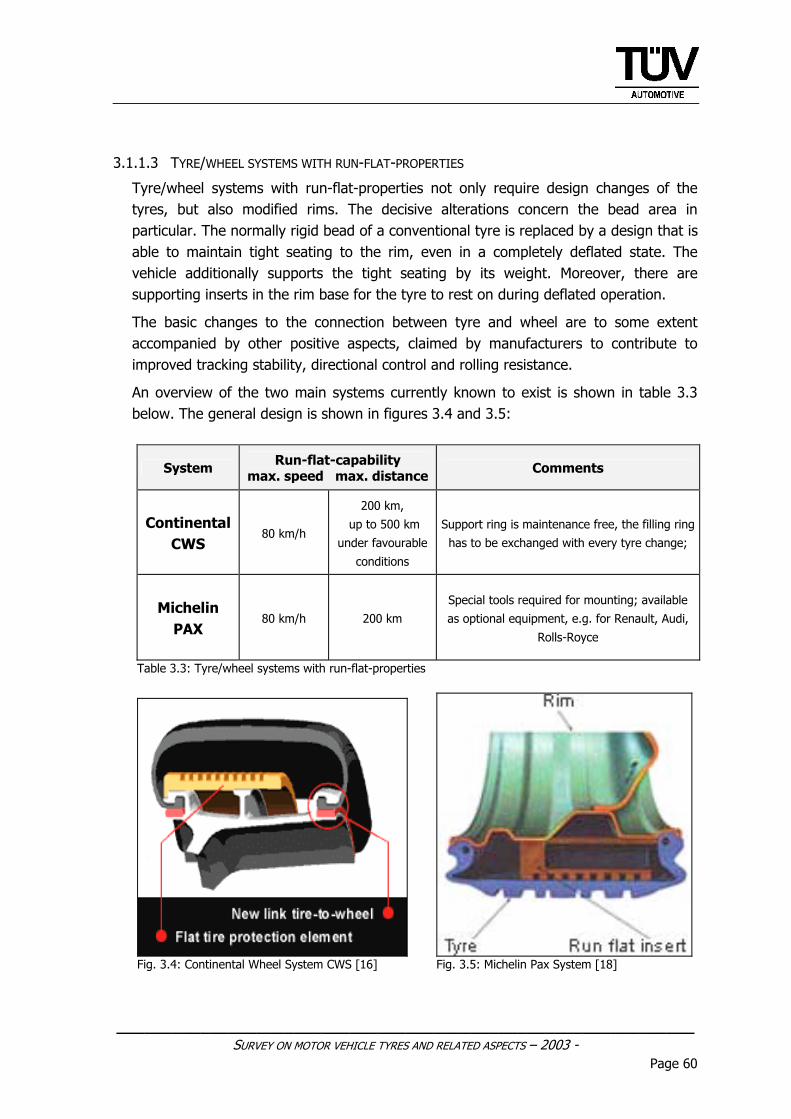
______________________________________________________________ SURVEY ON MOTOR VEHICLE TYRES AND RELATED ASPECTS – 2003 -
Page 60
3.1.1.3 TYRE/WHEEL SYSTEMS WITH RUN-FLAT-PROPERTIES
Tyre/wheel systems with run-flat-properties not only require design changes of the tyres, but also modified rims. The decisive alterations concern the bead area in particular. The normally rigid bead of a conventional tyre is replaced by a design that is able to maintain tight seating to the rim, even in a completely deflated state. The vehicle additionally supports the tight seating by its weight. Moreover, there are supporting inserts in the rim base for the tyre to rest on during deflated operation.
The basic changes to the connection between tyre and wheel are to some extent accompanied by other positive aspects, claimed by manufacturers to contribute to improved tracking stability, directional control and rolling resistance.
An overview of the two main systems currently known to exist is shown in table 3.3 below. The general design is shown in figures 3.4 and 3.5:
System Run-flat-capability max. speed max. distance Comments
Continental CWS
80 km/h
200 km,
up to 500 km
under favourable
conditions
Support ring is maintenance free, the filling ring
has to be exchanged with every tyre change;
Michelin PAX
80 km/h 200 km
Special tools required for mounting; available
as optional equipment, e.g. for Renault, Audi,
Rolls-Royce
Table 3.3: Tyre/wheel systems with run-flat-properties
Fig. 3.4: Continental Wheel System CWS [16] Fig. 3.5: Michelin Pax System [18]
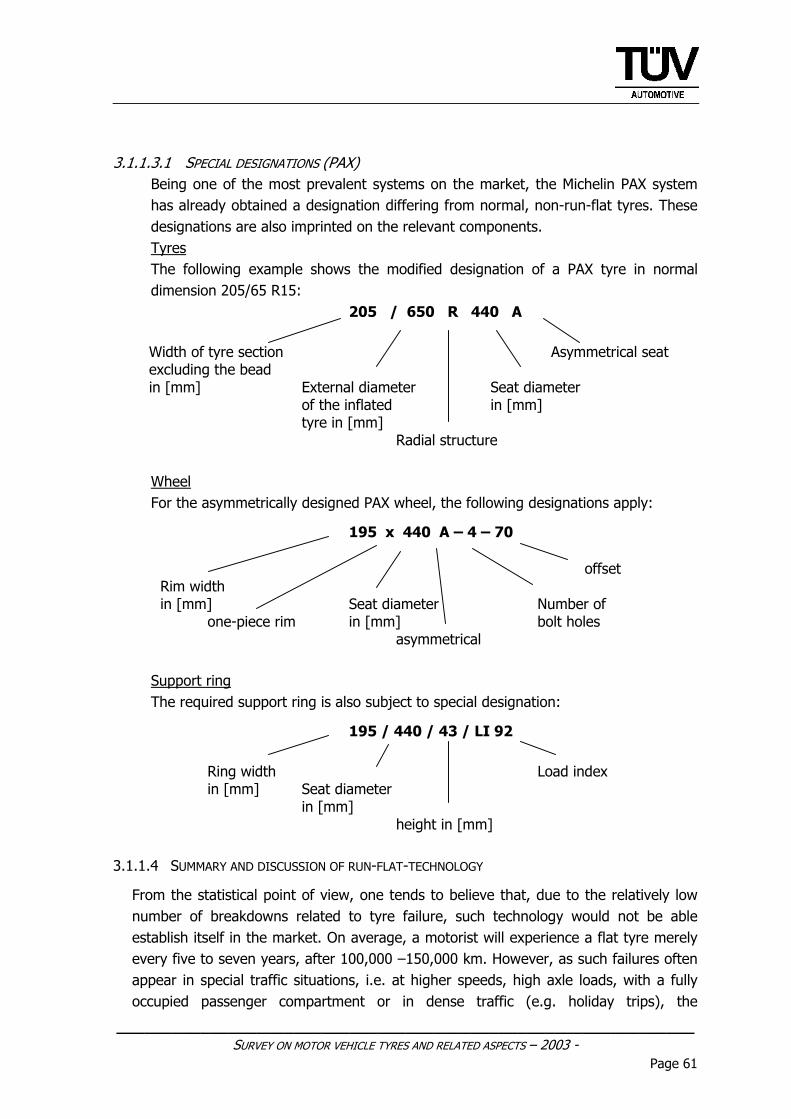
______________________________________________________________ SURVEY ON MOTOR VEHICLE TYRES AND RELATED ASPECTS – 2003 -
Page 61
3.1.1.3.1 SPECIAL DESIGNATIONS (PAX)
Being one of the most prevalent systems on the market, the Michelin PAX system has already obtained a designation differing from normal, non-run-flat tyres. These designations are also imprinted on the relevant components. Tyres The following example shows the modified designation of a PAX tyre in normal dimension 205/65 R15:
205 / 650 R 440 A
Width of tyre section Asymmetrical seat excluding the bead in [mm] External diameter Seat diameter of the inflated in [mm] tyre in [mm] Radial structure Wheel For the asymmetrically designed PAX wheel, the following designations apply:
195 x 440 A – 4 – 70
offset Rim width in [mm] Seat diameter Number of
one-piece rim in [mm] bolt holes asymmetrical
Support ring The required support ring is also subject to special designation:
195 / 440 / 43 / LI 92
Ring width Load index in [mm] Seat diameter in [mm] height in [mm] 3.1.1.4 SUMMARY AND DISCUSSION OF RUN-FLAT-TECHNOLOGY
From the statistical point of view, one tends to believe that, due to the relatively low number of breakdowns related to tyre failure, such technology would not be able establish itself in the market. On average, a motorist will experience a flat tyre merely every five to seven years, after 100,000 –150,000 km. However, as such failures often appear in special traffic situations, i.e. at higher speeds, high axle loads, with a fully occupied passenger compartment or in dense traffic (e.g. holiday trips), the
______________________________________________________________ SURVEY ON MOTOR VEHICLE TYRES AND RELATED ASPECTS – 2003 -
Page 62
contribution to traffic safety that comes from not having to perform an immediate roadside tyre change (with exposure to by-passing traffic) is obvious.
As far as driveability and performance are concerned, these systems have already achieved very high standards. A study by ÖAMTC in June 2002 has shown that road performance of passenger cars equipped with run-flat systems is not affected negatively. Five different run-flat tyres or systems were tested on relevant vehicles, and all of them received an overall rating of “recommendable” or “highly recommendable”.[19] Nevertheless, some considerations have to be taken into account in this context, primarily with regard to usage and consumer information.
When implementing such systems, the omission of a spare tyre would also lead to the previously mentioned weight and space savings, which might slightly reduce CO2-emissions by improving the vehicle’s fuel economy as well as providing package space for installation of forthcoming control systems (X-by-wire technologies) or additional fuel tanks (e.g. bi-fuel vehicles).
Though guaranteeing extended mobility in case of tyre failure, a run-flat tyre is, of course, not indestructible and responds to misuse in a similar way as a normal tyre would. Once the maximum mileage in deflated mode is exceeded, it is as liable to complete failure as a normal tyre. First and foremost, drivers must handle this technology with care and common sense. Pressure monitoring systems are very helpful, informing the driver about an abnormal inflation state, which helps to prevent at least unintended abuse. The pros and cons of direct- and indirect-measuring systems in this context are discussed extensively in the following chapter of this report.
Currently, this technology is exclusively being developed and offered by top tyre manufacturers, which are, no doubt, able to ensure full functionality and operating safety, as they have above-average quality standards and are forced to provide optimum products, none the least in the course of their close collaboration with vehicle manufacturers, if they are OE suppliers. However, there is no uniform legal standard for run-flat capabilities at present, and as can be seen from the previous tables, there are differences in terms of maximum speed and mileage in run-flat mode, depending on the respective system. During the collection of technical data and features, it was even noticed that publicly accessible sources reflected controversial statements on the properties of one and the same system. Once these run-flat-systems are established in the market at profitable volumes, also non-mainstream or even low-budget tyre manufacturers are expected to want a piece of the cake. For this reason, it is essential to pursue exact definitions of run-flat capacities and a uniform designation at this point in time, allowing the average customer, as well, to get quick and accurate information on how long and how fast he/she may drive with a deflated run-flat tyre. Tyres with run-flat technology are currently provided with an additional marking, e.g. RSC or RFT (Run-flat System Component or Tyre), but there is still room for improvement. Printed information on the tyre sidewall, broken down into categories (the fewer the better),
______________________________________________________________ SURVEY ON MOTOR VEHICLE TYRES AND RELATED ASPECTS – 2003 -
Page 63
depending on the capabilities (e.g. RSC-A, RSC-B, RSC-C, corresponding to different limits in speed and mileage) or directly based on a number combination, e.g. 50/100, 90/80, 80/500, etc., for speed and mileage could be means to achieve optimum consumer information. Also, stickers on the vehicle’s instrument panel providing this information may be conceivable. In principle, consideration must be given to who (i.e. tyre or vehicle manufacturer) would be responsible for providing this customer information.
Further problems may concern the treatment of run-flat tyres that have been operated in deflated mode. The decision whether the tyre can still be used depends significantly on the distance it has been driven in deflated mode and the degree of deflation, but, ideally, such tyre should be examined by a specially trained expert (e.g. in tyre shops or authorized garages, according to guidelines defined by the relevant system manufacturer). Also, the risk of possible damage to chassis parts or wheel alignment must be considered, as the systems, to some extent, show a substantial decrease of the damping rate in deflated mode and therefore apply higher forces to the vehicle.
As the systems, in some cases, work so well that the driver does not necessarily notice if driving with no or too little inflation pressure, manufacturers are currently linking the use of run-flat-systems with tyre pressure monitoring devices or, at least, a run-flat warning system, which gives information on abnormal inflation states. This combined usage is not regulated by law, but must be considered an indispensable requirement, if run-flat technology is used.
Additionally, as run-flat technology is expected to capture the retrofitting market as well, the combination of run-flat-technology and vehicles not originally designed for being fitted with such tyres must also be focussed on. Some run-flat systems (in particular those with reinforced sidewalls) have harder damping properties in normal operation mode, too, normally compensated for by a harmonised, possibly adaptive chassis and suspension design that is able to cope with those increased forces. The long-term influence on the durability of a run-flat-tyre on a “normal” chassis (i.e. not designed for optional use of run-flat-tyres) cannot be examined sufficiently so far to allow unrestricted use for the time being.
To address and resolve all of these potential issues and concerns and in order to establish generally accepted standards in the short term, close cooperation between the tyre and motor vehicle manufacturers will be required.
3.1.2 PRESSURE WARNING AND MONITORING SYSTEMS
Tyre pressure warning systems and control devices are primarily used to monitor the state of inflation during normal operation. In this context, it is of special importance to detect the slow loss of inflation pressure, which may cause long-lasting damage to the strength durability of a tyre. Run-flat-tyres are particularly affected by this, as their
______________________________________________________________ SURVEY ON MOTOR VEHICLE TYRES AND RELATED ASPECTS – 2003 -
Page 64
design (with reinforced sidewalls) provides acceptable road performance even with considerable under-inflation. This, however, causes overheating and the resulting long-term consequences for these tyres as well. In order to enable the driver to recognise under-inflation as early as possible and to take appropriate action against it, the detection quality of these systems is an essential issue. In the following chapter, the single systems are presented, being subdivided into two different categories, namely direct (active) and indirect (passive) systems.
3.1.2.1 PASSIVE/INDIRECT SYSTEMS
Indirect systems monitor tyre inflation pressure based on the reduced rolling diameter of an under-inflated tyre. As soon as tyre pressure decreases, the rolling diameter of the relevant tyre becomes smaller as well, accompanied by an increase of rotational speed. This specifically changed speed signal is recorded by the vehicle’s ABS sensors and detected by a special warning algorithm (tailored to the respective sensors) integrated in the software of the vehicle’s relevant electronic control unit. By permanently comparing the rotational speed of all tyres (actual and desired values), the system is able to detect if one or several tyres are operating in an abnormal mode.
Effective functional performance of these systems requires several preconditions to be met. Theoretically, all tyres would have to have the same rolling diameter, which hardly occurs in reality, either due to different degrees of wear, different tyre brands on front and rear axles (geometric tolerances) or different axle loads. These conditions are allowed for by including a vehicle-specific adjustment factor in the calculations. Following any tyre change, this adjustment factor has to be determined by the driver, tyre shop or garage by driving a certain distance with the system in its initialisation mode and correct tyre inflation pressure to provide the basis of reference for subsequent operation. In order to reduce the risk of malfunction or erroneous warnings, certain driving manoeuvres, such as fast acceleration or deceleration, or driving on loose or slippery surfaces, are recognised by an additional software.
By integrating them into the existing ABS software, these passive systems offer a comparably simply and economic solution. Of course, the main prerequisite for the application of such systems is that the vehicle is fitted with a four-channel antilock-brake-system. Additional costs would, in this case, be limited to those for the additional software and a visual and/or acoustic warning device in the vehicle’s cockpit. A further advantage is the fact that there is no need for installing separate sensors, and that the system does not require any additional power sources (batteries).
A considerable disadvantage of these indirect systems is their limited sensing range. Only aberrations of more than 30% from the desired inflation pressure are detected at present. This means that passive systems only make limited sense for detection of slow losses of inflation pressure. A tyre being operated at around 30% under-inflation (i.e. approx. 0.6 bar too low) over a longer period of time is already pre-damaged and
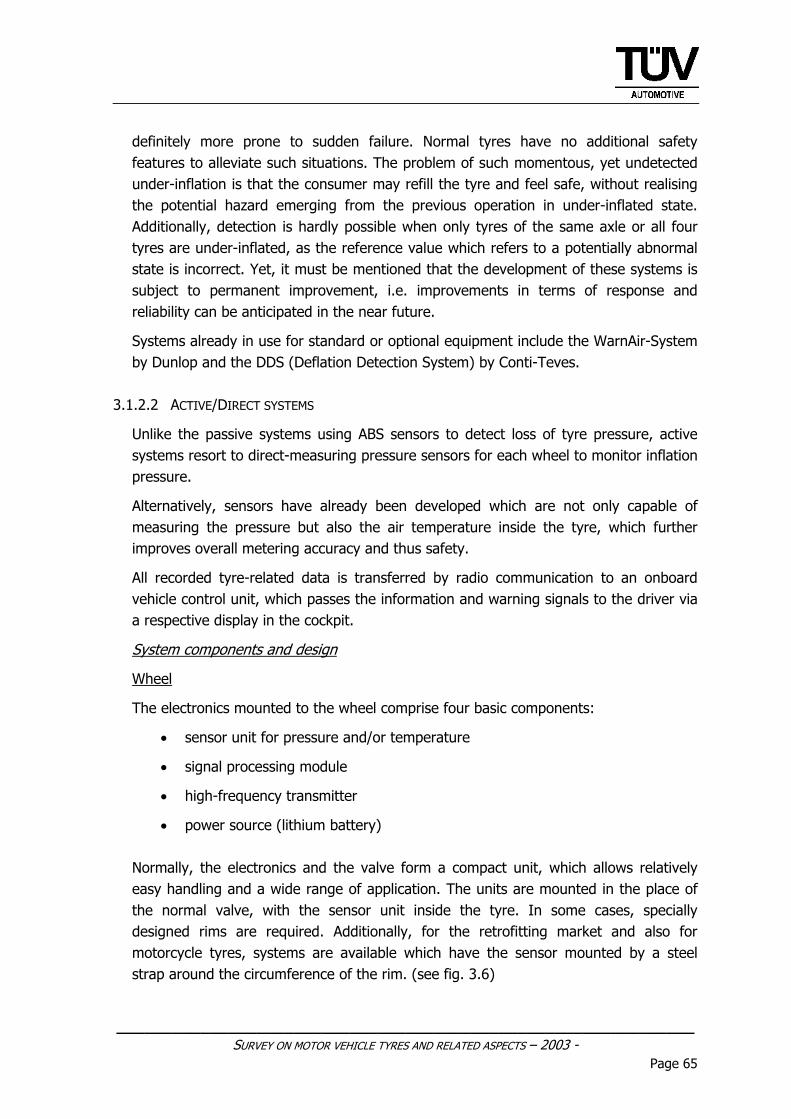
______________________________________________________________ SURVEY ON MOTOR VEHICLE TYRES AND RELATED ASPECTS – 2003 -
Page 65
definitely more prone to sudden failure. Normal tyres have no additional safety features to alleviate such situations. The problem of such momentous, yet undetected under-inflation is that the consumer may refill the tyre and feel safe, without realising the potential hazard emerging from the previous operation in under-inflated state. Additionally, detection is hardly possible when only tyres of the same axle or all four tyres are under-inflated, as the reference value which refers to a potentially abnormal state is incorrect. Yet, it must be mentioned that the development of these systems is subject to permanent improvement, i.e. improvements in terms of response and reliability can be anticipated in the near future.
Systems already in use for standard or optional equipment include the WarnAir-System by Dunlop and the DDS (Deflation Detection System) by Conti-Teves.
3.1.2.2 ACTIVE/DIRECT SYSTEMS
Unlike the passive systems using ABS sensors to detect loss of tyre pressure, active systems resort to direct-measuring pressure sensors for each wheel to monitor inflation pressure.
Alternatively, sensors have already been developed which are not only capable of measuring the pressure but also the air temperature inside the tyre, which further improves overall metering accuracy and thus safety.
All recorded tyre-related data is transferred by radio communication to an onboard vehicle control unit, which passes the information and warning signals to the driver via a respective display in the cockpit.
System components and design
Wheel
The electronics mounted to the wheel comprise four basic components:
• sensor unit for pressure and/or temperature
• signal processing module
• high-frequency transmitter
• power source (lithium battery) Normally, the electronics and the valve form a compact unit, which allows relatively easy handling and a wide range of application. The units are mounted in the place of the normal valve, with the sensor unit inside the tyre. In some cases, specially designed rims are required. Additionally, for the retrofitting market and also for motorcycle tyres, systems are available which have the sensor mounted by a steel strap around the circumference of the rim. (see fig. 3.6)
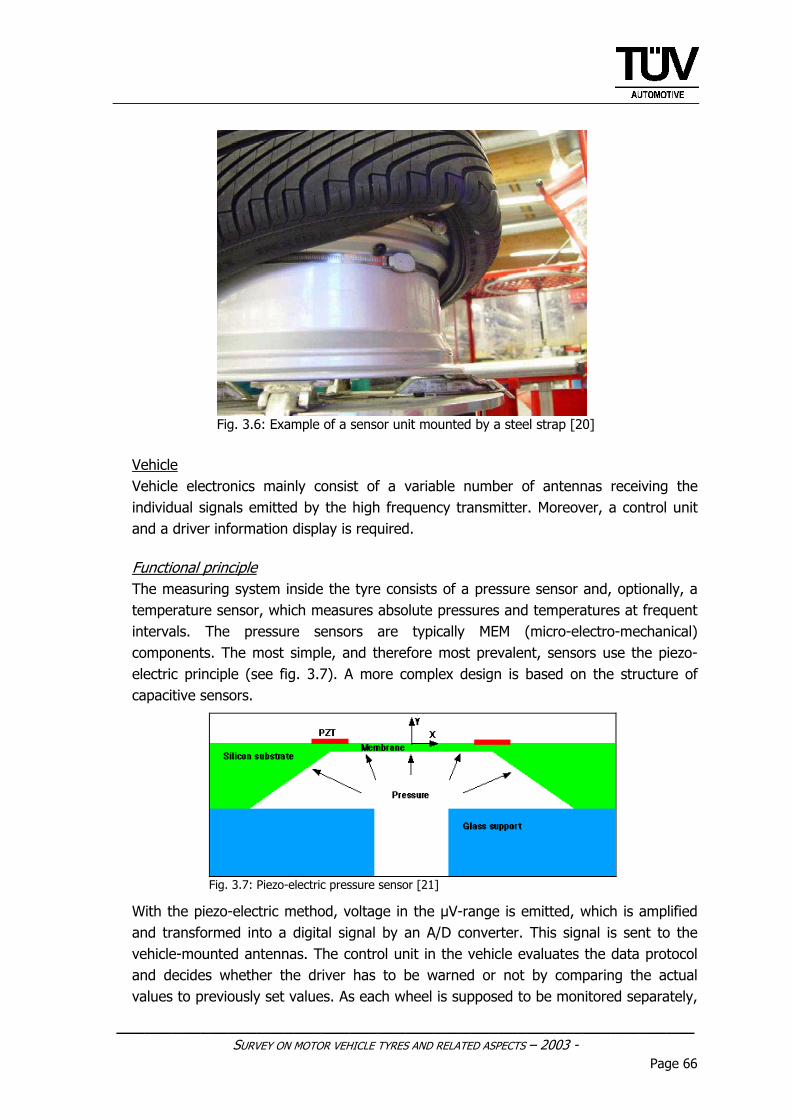
______________________________________________________________ SURVEY ON MOTOR VEHICLE TYRES AND RELATED ASPECTS – 2003 -
Page 66
Fig. 3.6: Example of a sensor unit mounted by a steel strap [20]
Vehicle Vehicle electronics mainly consist of a variable number of antennas receiving the individual signals emitted by the high frequency transmitter. Moreover, a control unit and a driver information display is required.
Functional principle The measuring system inside the tyre consists of a pressure sensor and, optionally, a temperature sensor, which measures absolute pressures and temperatures at frequent intervals. The pressure sensors are typically MEM (micro-electro-mechanical) components. The most simple, and therefore most prevalent, sensors use the piezo-electric principle (see fig. 3.7). A more complex design is based on the structure of capacitive sensors.
Fig. 3.7: Piezo-electric pressure sensor [21]
With the piezo-electric method, voltage in the µV-range is emitted, which is amplified and transformed into a digital signal by an A/D converter. This signal is sent to the vehicle-mounted antennas. The control unit in the vehicle evaluates the data protocol and decides whether the driver has to be warned or not by comparing the actual values to previously set values. As each wheel is supposed to be monitored separately,
______________________________________________________________ SURVEY ON MOTOR VEHICLE TYRES AND RELATED ASPECTS – 2003 -
Page 67
in addition to pressure-related information, an identifier is required. Only this combination is able to provide accurate information as to which of the tyres has abnormal inflation. Although there may be problems when the tyres are changed from the front to the rear axle, solutions already exist to address this situation. A coil mounted in the wheel arch is able to communicate with the wheel unit and allows absolutely certain identification of the position.
As the actual pressure inside the tyre is heavily dependent on the temperature, either a temperature-measuring unit is linked or a factor used to compensate for this.
The power supply of the wheel-mounted sensor units must be considered a major challenge. Most systems are currently using batteries (long-life lithium cells), which have to be replaced before they are fully discharged. In order to keep power consumption as low as possible, a detection mechanism for wheel rotation is reasonable. This requires an additional sensor, though. Due to the fact that they contain highly toxic electrolytes, the batteries currently in use have to be disposed of as hazardous waste.
Systems working according to the direct-measuring principle are offered by various manufacturers, including BERU, Conti/Teves, Nokian Tyres, Pacific Industrial Co., Schrader, Siemens VDO, SmarTire Systems Inc. or WABCO, to name only a few.
The positive effects of these systems is out of the question, as it is a benefit in the sense of technical safety, if the driver of a motor vehicle is informed on the inflation pressure of his tyres or if he is being warned whenever this pressure drops below a minimum limit. However, with regard to the issue of power supply, they might only be representing an interim solution.
There is another system (developed by IQ-mobil) currently known, scheduled for start of serial production in the near future, which does not require its own power supply for the tyre sensors and is even able to measure the temperature inside the tyre.
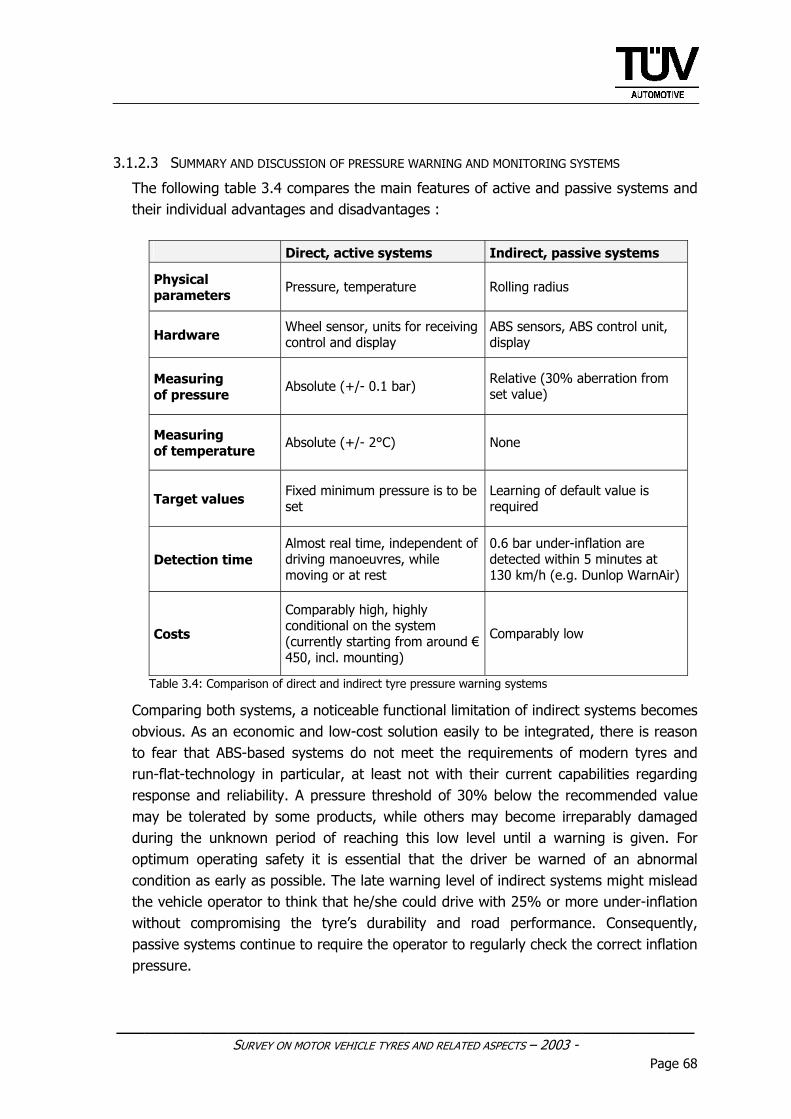
______________________________________________________________ SURVEY ON MOTOR VEHICLE TYRES AND RELATED ASPECTS – 2003 -
Page 68
3.1.2.3 SUMMARY AND DISCUSSION OF PRESSURE WARNING AND MONITORING SYSTEMS
The following table 3.4 compares the main features of active and passive systems and their individual advantages and disadvantages :
Direct, active systems Indirect, passive systems
Physical parameters
Pressure, temperature Rolling radius
Hardware Wheel sensor, units for receiving control and display
ABS sensors, ABS control unit, display
Measuring of pressure
Absolute (+/- 0.1 bar) Relative (30% aberration from set value)
Measuring of temperature
Absolute (+/- 2°C) None
Target values Fixed minimum pressure is to be set
Learning of default value is required
Detection time Almost real time, independent of driving manoeuvres, while moving or at rest
0.6 bar under-inflation are detected within 5 minutes at 130 km/h (e.g. Dunlop WarnAir)
Costs
Comparably high, highly conditional on the system (currently starting from around € 450, incl. mounting)
Comparably low
Table 3.4: Comparison of direct and indirect tyre pressure warning systems
Comparing both systems, a noticeable functional limitation of indirect systems becomes obvious. As an economic and low-cost solution easily to be integrated, there is reason to fear that ABS-based systems do not meet the requirements of modern tyres and run-flat-technology in particular, at least not with their current capabilities regarding response and reliability. A pressure threshold of 30% below the recommended value may be tolerated by some products, while others may become irreparably damaged during the unknown period of reaching this low level until a warning is given. For optimum operating safety it is essential that the driver be warned of an abnormal condition as early as possible. The late warning level of indirect systems might mislead the vehicle operator to think that he/she could drive with 25% or more under-inflation without compromising the tyre’s durability and road performance. Consequently, passive systems continue to require the operator to regularly check the correct inflation pressure.
______________________________________________________________ SURVEY ON MOTOR VEHICLE TYRES AND RELATED ASPECTS – 2003 -
Page 69
Unlike passive systems, active-measuring systems keep drivers relatively well informed about the actual inflation state of their tyres, particularly when linked with a display showing absolute inflation pressures. With these systems, however, there is room for improvement with regard to their comparably higher costs for sensors and installation as well as the complex procedures required by some systems when changing the tyres, from front to rear for example. Yet, the question remains as to whether or not the market as well as technical developments will be able to cope with active or passive systems without requiring any legislative intervention.
As a matter of principle, tyre and vehicle manufacturers should have to agree on which tyre-vehicle combination requires which warning system, as only they possess the specific technical background information. Such agreement may help to resolve product liability issues and related legal proceedings. For some run-flat-systems, backed up by a mechanical run-flat device (e.g. supporting insert), the indirect system may be sufficient. For normal, non-run-flat tyres, the direct systems for standard as well as for aftermarket equipment are to be favoured, as they doubtlessly provide higher safety and certainty of actual pressure conditions (assuming, of course, that the system constantly operates without errors or failures). As far as the retrofitting market is concerned, high demands will be placed on garages and tyre shops, requiring them to provide adequate advice to their customers and to ensure safe application and operation of the various systems.
A full investigation on the efficiency of existing TPM-systems was conducted by DOT/NHTSA, further particulars can be taken from this report [22].
3.1.3 PUNCTURE REPAIR SETS
3.1.3.1 INSTANT TYRE SEALANTS
Using a liquid tyre sealant basically extends the mobility of a vehicle in case of a tyre puncture and can also make a certain contribution to safety, as the repair in case of tyre damage is easier and shorter, compared to replacing a damaged tyre with a spare. These sealants have become more and more prevalent in recent years, last but not least due to their relatively light weight, compactness and lower cost vis-à-vis a spare wheel.
Functional principle The liquid is based on natural rubber and can be considered environmentally harmless. In case of a puncture, it has to be squirted from the bottle into the inside of a flat tyre through the tyre’s valve aperture. The liquid is able to seal punctures up to a size of approx. 6 mm in diameter, resulting, for example, from penetration by a nail, screw or similar object. A small air compressor, which is part of such systems and fed by the vehicle’s power supply via the cigarette lighter socket, is then used to refill the tyre up
______________________________________________________________ SURVEY ON MOTOR VEHICLE TYRES AND RELATED ASPECTS – 2003 -
Page 70
to the desired inflation pressure level. For an even distribution of the sealant in the tyre, it is recommended to drive for approx. ten minutes and then to recheck and adjust inflation, if necessary. Once the tyre is sealed, the driver can travel the distance to the next garage at a maximum speed of 80 km/h to have the tyre replaced (a repair of the damaged is not normally possible).
Safety and market prevalence From the perspective of technical safety, there are no objections to the use of such liquids, as long as the operator follows the manufacturer’s instructions. However, the fact that the distance which can be covered with this liquid in the tyre has not been precisely defined so far still presents a minor issue. The statement of “to the next garage” may give the driver excessive latitude. Naturally, this distance largely depends on the size of the puncture and on how long the tyre has been driven in a deflated state. Consequently, a more precise definition may be desirable in future, although tests and TÜV Automotive’s experience with products from acknowledged manufacturers have shown that a wide safety margin is assured. Many vehicle manufacturers offer the liquid sealant as an original equipment option instead of a spare tyre, and in the aftermarket, as well, a variety of these products is available.
In principle, only severe and deliberate misuse by exceeding the indicated speed or driving over several hundreds of kilometres may present a safety risk.
3.1.3.2 PREVENTIVE PUNCTURE SEALANT LIQUIDS
The basic difference between preventive and puncture sealants is that these liquids or agents are used as a preventive measure for an undamaged tyre. This means that the sealant, which either remains liquid or turns into a gel-like substance when heated, becomes effective the moment a puncture occurs, thus preventing most of the air to escape from the tyre. These liquids are currently only permitted for use in low-speed (commercial) vehicles, yet their application in the passenger car or motorcycle sector may be conceivable as well. Due to their particular concept, several disadvantages of theses preventive systems must be considered.
The main drawback is that, usually, the driver is no longer alerted to incidents of tyre damage (extent and number), as merely a small amount of air can usually escape before the leak is sealed. However, it is generally known that any damage to the tyre’s structure affects its strength durability and thus its liability to sudden failure (blow out). This situation is exacerbated, if the puncture does not appear in the tread but in the sidewall of the tyre. In addition to performing a regular check of inflation, the driver would also have to examine the condition of the tyres in terms of possible punctures after each trip. Considering the common negligence of drivers with regard to checking inflation, the likelihood of such puncture checks being performed regularly is rather dim, though. Basically, there is reason to fear that these preventive sealants may give the consumer a false sense of security.
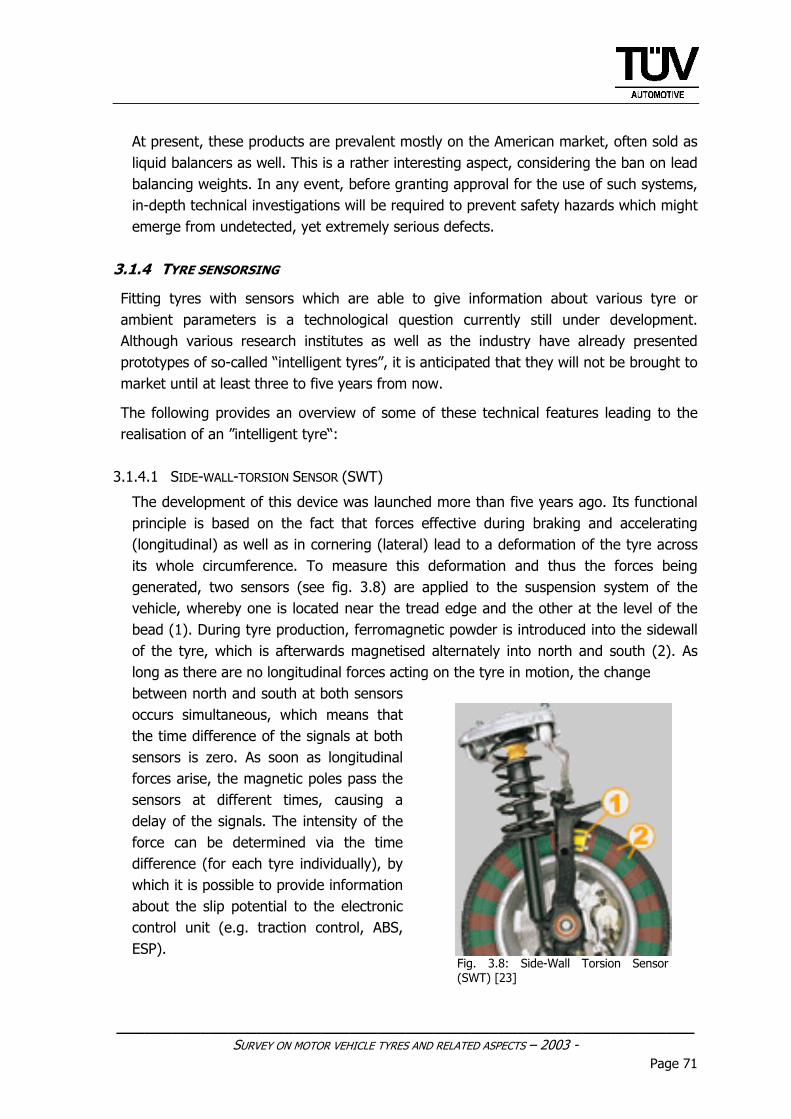
______________________________________________________________ SURVEY ON MOTOR VEHICLE TYRES AND RELATED ASPECTS – 2003 -
Page 71
At present, these products are prevalent mostly on the American market, often sold as liquid balancers as well. This is a rather interesting aspect, considering the ban on lead balancing weights. In any event, before granting approval for the use of such systems, in-depth technical investigations will be required to prevent safety hazards which might emerge from undetected, yet extremely serious defects.
3.1.4 TYRE SENSORSING
Fitting tyres with sensors which are able to give information about various tyre or ambient parameters is a technological question currently still under development. Although various research institutes as well as the industry have already presented prototypes of so-called “intelligent tyres”, it is anticipated that they will not be brought to market until at least three to five years from now.
The following provides an overview of some of these technical features leading to the realisation of an ”intelligent tyre“:
3.1.4.1 SIDE-WALL-TORSION SENSOR (SWT)
The development of this device was launched more than five years ago. Its functional principle is based on the fact that forces effective during braking and accelerating (longitudinal) as well as in cornering (lateral) lead to a deformation of the tyre across its whole circumference. To measure this deformation and thus the forces being generated, two sensors (see fig. 3.8) are applied to the suspension system of the vehicle, whereby one is located near the tread edge and the other at the level of the bead (1). During tyre production, ferromagnetic powder is introduced into the sidewall of the tyre, which is afterwards magnetised alternately into north and south (2). As long as there are no longitudinal forces acting on the tyre in motion, the change between north and south at both sensors occurs simultaneous, which means that the time difference of the signals at both sensors is zero. As soon as longitudinal forces arise, the magnetic poles pass the sensors at different times, causing a delay of the signals. The intensity of the force can be determined via the time difference (for each tyre individually), by which it is possible to provide information about the slip potential to the electronic control unit (e.g. traction control, ABS, ESP).
Fig. 3.8: Side-Wall Torsion Sensor (SWT) [23]
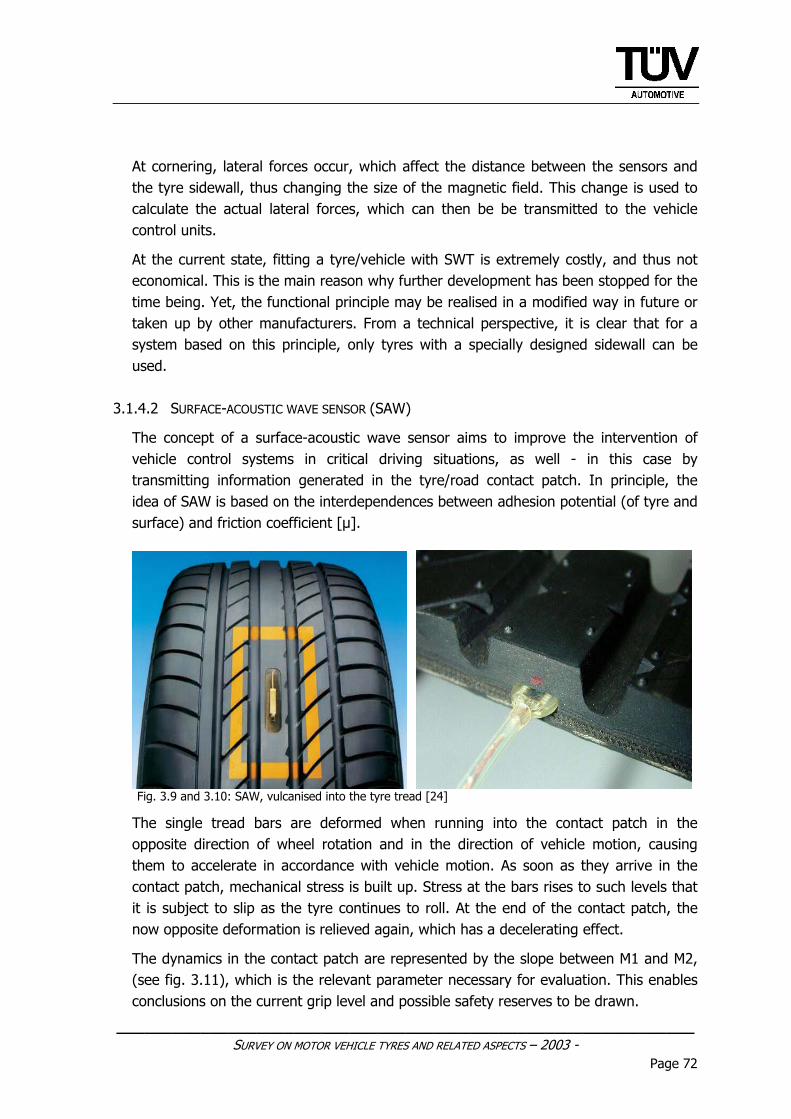
______________________________________________________________ SURVEY ON MOTOR VEHICLE TYRES AND RELATED ASPECTS – 2003 -
Page 72
At cornering, lateral forces occur, which affect the distance between the sensors and the tyre sidewall, thus changing the size of the magnetic field. This change is used to calculate the actual lateral forces, which can then be be transmitted to the vehicle control units.
At the current state, fitting a tyre/vehicle with SWT is extremely costly, and thus not economical. This is the main reason why further development has been stopped for the time being. Yet, the functional principle may be realised in a modified way in future or taken up by other manufacturers. From a technical perspective, it is clear that for a system based on this principle, only tyres with a specially designed sidewall can be used.
3.1.4.2 SURFACE-ACOUSTIC WAVE SENSOR (SAW)
The concept of a surface-acoustic wave sensor aims to improve the intervention of vehicle control systems in critical driving situations, as well - in this case by transmitting information generated in the tyre/road contact patch. In principle, the idea of SAW is based on the interdependences between adhesion potential (of tyre and surface) and friction coefficient [µ].
Fig. 3.9 and 3.10: SAW, vulcanised into the tyre tread [24]
The single tread bars are deformed when running into the contact patch in the opposite direction of wheel rotation and in the direction of vehicle motion, causing them to accelerate in accordance with vehicle motion. As soon as they arrive in the contact patch, mechanical stress is built up. Stress at the bars rises to such levels that it is subject to slip as the tyre continues to roll. At the end of the contact patch, the now opposite deformation is relieved again, which has a decelerating effect.
The dynamics in the contact patch are represented by the slope between M1 and M2, (see fig. 3.11), which is the relevant parameter necessary for evaluation. This enables conclusions on the current grip level and possible safety reserves to be drawn.
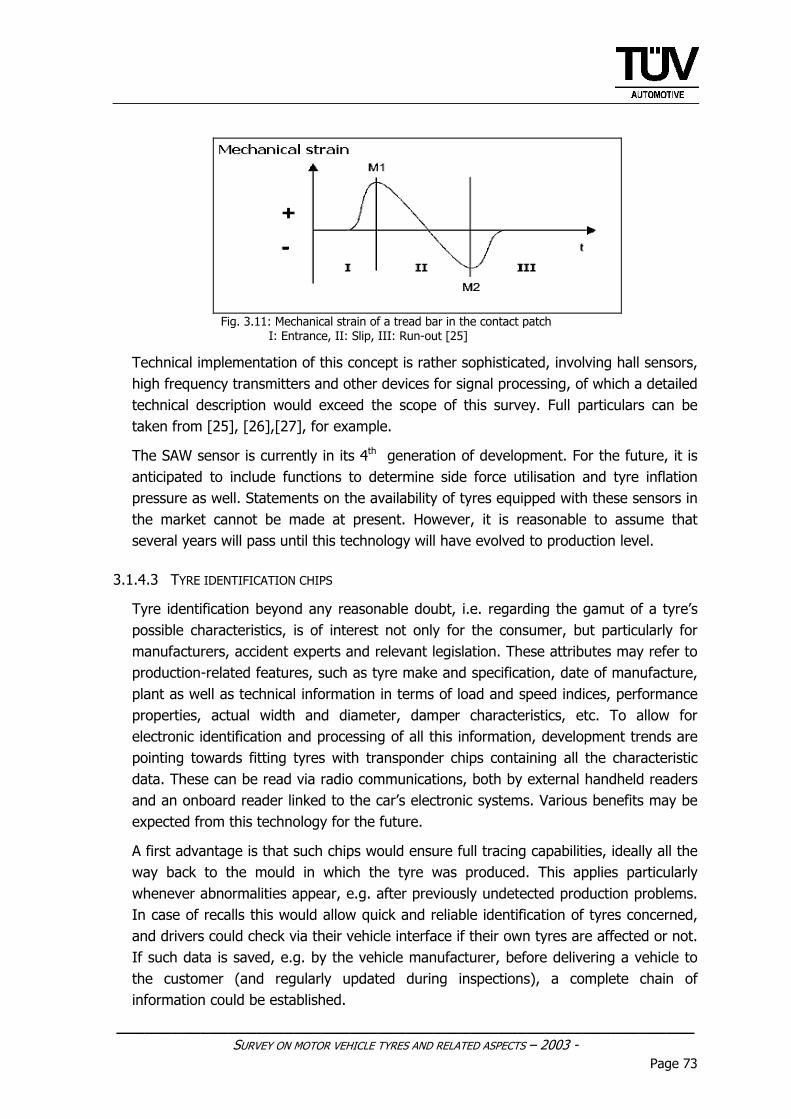
______________________________________________________________ SURVEY ON MOTOR VEHICLE TYRES AND RELATED ASPECTS – 2003 -
Page 73
Fig. 3.11: Mechanical strain of a tread bar in the contact patch
I: Entrance, II: Slip, III: Run-out [25]
Technical implementation of this concept is rather sophisticated, involving hall sensors, high frequency transmitters and other devices for signal processing, of which a detailed technical description would exceed the scope of this survey. Full particulars can be taken from [25], [26],[27], for example.
The SAW sensor is currently in its 4th generation of development. For the future, it is anticipated to include functions to determine side force utilisation and tyre inflation pressure as well. Statements on the availability of tyres equipped with these sensors in the market cannot be made at present. However, it is reasonable to assume that several years will pass until this technology will have evolved to production level.
3.1.4.3 TYRE IDENTIFICATION CHIPS
Tyre identification beyond any reasonable doubt, i.e. regarding the gamut of a tyre’s possible characteristics, is of interest not only for the consumer, but particularly for manufacturers, accident experts and relevant legislation. These attributes may refer to production-related features, such as tyre make and specification, date of manufacture, plant as well as technical information in terms of load and speed indices, performance properties, actual width and diameter, damper characteristics, etc. To allow for electronic identification and processing of all this information, development trends are pointing towards fitting tyres with transponder chips containing all the characteristic data. These can be read via radio communications, both by external handheld readers and an onboard reader linked to the car’s electronic systems. Various benefits may be expected from this technology for the future.
A first advantage is that such chips would ensure full tracing capabilities, ideally all the way back to the mould in which the tyre was produced. This applies particularly whenever abnormalities appear, e.g. after previously undetected production problems. In case of recalls this would allow quick and reliable identification of tyres concerned, and drivers could check via their vehicle interface if their own tyres are affected or not. If such data is saved, e.g. by the vehicle manufacturer, before delivering a vehicle to the customer (and regularly updated during inspections), a complete chain of information could be established.
______________________________________________________________ SURVEY ON MOTOR VEHICLE TYRES AND RELATED ASPECTS – 2003 -
Page 74
The same applies when it comes to recording an accident. The tyres could be identified quickly and easily at the scene (assuming that police are equipped with handheld readers). Looking at even further future prospects, it is conceivable to have these chips record and save the operating conditions (made available by inflation and temperature monitoring systems) of a certain elapsed period. Also, with respect to the establishment of a common accident database, this technology could facilitate detailed identification of certain tyres or tyre/vehicle combinations, enabling legislators to act on such data in a timely fashion.
Benefits to be anticipated for tyre manufacturers and tyre shops would be in the field of facilitating logistics processes and storage.
Last but not least, the provision of tyre-specific data could be an important source of information for the electronic control systems of the vehicle. Once these systems are able to recognise the tyres fitted to the vehicle (and thus their predetermined properties), it will be possible for them to select the special software version (e.g. for the stability program, ABS control, electric steering characteristics, etc.) optimised for the performance and geometry of the relevant tyre from several different versions on file. Beyond this, it is possible to limit vehicle speed electronically to the actual speed index of the tyre, e.g. when using winter tyres with a maximum speed below the vehicle’s maximum speed, or to reach higher accuracy of the speedometer when the actual rolling diameter of the tyres mounted can be considered. With regard to the large geometrical tolerances currently permitted, this potential improvement should not be neglected.
With regard to technical implementation, it would be conceivable that such a transponder chip might be permanently integrated into the tyre during or after production and parameterised by the tyre manufacturer with all relevant data. Possibly, some memory space should be reserved for the vehicle manufacturer to include additional information (e.g. date of mounting, inflation defaults, mounting position, last inspection date, etc.)
To enable worldwide use, a uniform standard for the design and functional performance of these chips has to be developed as soon as possible. Close cooperation between tyre manufacturers, as well as between them and motor vehicle manufacturers, is essential for this. In any event, efforts should be made to avoid a variety of systems regarding basic information contents, readability and data transfer method (frequency).
At present, Michelin is the first manufacturer planning to equip its tyres with such technology (presently called RFID = Radio Frequency Identification), starting serial production in 2005 [28]. Based on the insights gained during the workshops with the industry, large-scale introduction of these chips is anticipated in the near future by other tyre manufacturers, as well.
______________________________________________________________ SURVEY ON MOTOR VEHICLE TYRES AND RELATED ASPECTS – 2003 -
Page 75
3.1.4.4 SUMMARY AND DISCUSSION OF TYRE SENSORING
With respect to the properties claimed, the contribution of tyre sensoring to safety cannot be judged highly enough. Their actual effectiveness, however, remains to be seen, once the systems have found their way into serial production. Of course, it must be clearly stated that it is impossible, even for the “most intelligent” tyre, to go beyond the physical limits, which means that a tyre equipped with computer chips or sensors cannot perform any better than the same tyre not having these features.
As far as the basic possibilities that can be realised in future are concerned, several features of the “intelligent tyre” have become apparent [24]:
• Self-identification • Self-monitoring
- current adhesion potential - tread wear - inflation pressure and temperature - defects or damage
• Monitoring of ambient conditions • Occurrence of aquaplaning • Detection of forces and momentums
The tyres as the only link between a vehicle and the road surface have to fulfil those requirements (shock absorbance, transmission of longitudinal and lateral forces) which are essential for the driveability and stability of a vehicle. To ensure proper performance of supporting electronic vehicle control systems, such as anti-lock brakes or electronic stability programs, these systems require information on the forces acting between the road and the vehicle. These values are currently determined by approximation from secondary variables, such as engine power, brake pressure, wheel rotation speed and vehicle acceleration. For improved and more accurate performance, it would be necessary not to resort to these secondary variables, but to tap the required parameters where they are generated - at the tyre. Once it is possible to provide electronic vehicle systems with information on existing conditions in real time, the full potential and optimisation of the electronic interference can be tapped perfectly.
For the time being, no objections to these innovations exist from the technical perspective. Currently, the main issue in the field of tyre sensoring is the establishment of a common standard for data transfer (frequencies and protocols) in order to enable sufficient exchangeability and compatibility between the tyres and the vehicle.
A highly exhaustive consideration of the state of the art concerning the “Intelligent Tyre” and related sensoring is currently being prepared by a task force under

______________________________________________________________ SURVEY ON MOTOR VEHICLE TYRES AND RELATED ASPECTS – 2003 -
Page 76
coordination by the Technical Research Centre of Finland (VTT), funded by the European Community. [29]
3.2 RELATED SYSTEMS AND COMPONENTS 3.2.1 ELECTRONIC SYSTEMS FOR IMPROVED VEHICLE CONTROL
3.2.1.1 ANTI-LOCK BRAKE SYSTEM (ABS)
Considering the technical developments of the past 10 - 15 years, fitting passenger cars and motorcycles with ABS can be deemed to have made the single largest contribution towards higher driving safety. Basic research in the automotive sector started as far back as in the nineteen-seventies.
In short, the system prevents the wheels from locking when more braking force than transmittable to the road surface is applied, allowing the driver to brake and steer at the same without the risk of losing control of the vehicle. The shorter braking distances on most surfaces (predominantly with low friction values) provided by ABS, along with higher driveability in emergency situations, considerably increase driving safety
Practically all new passenger cars sold in the 15 countries of the European Union can currently be fitted with ABS as optional equipment, and without any legal intervention, it is anticipated that more than 90% of all new cars sold in the European Union (including also the 10 new member states joining the EU in 2004) within the next five years will have been fitted with ABS.
ABS has made its way into the motorcycle market as well, yet being considerably less prevalent there at the moment. (For details on ABS and motorcycles see chapter 3.4.2.1)
Over the years, the systems have become more and more sophisticated in terms of responsiveness and operation under established parameters. The use of other systems, like electronic brake force distribution (EBD, considering respective load conditions of the vehicle or lateral imbalance (at cornering), are now closely linked to ABS.
It is important to mention that the hardware used for ABS control (wheel rotation sensors, separately controllable wheel brake cylinders) provides the basis for most other electronic control systems, i.e. all subsequently used systems require the existence of ABS in the vehicle.
3.2.1.2 BRAKE ASSISTANT SYSTEMS
It is a well-known fact that many drivers are afraid to apply full braking force in an emergency situation or tend to brake more hesitantly than required by the situation. Brake assistant systems, offered by many vehicle manufacturers under different designations, are able to recognise an emergency braking situation (indicated by the speed at which the accelerator pedal is released, followed by braking), then applying
______________________________________________________________ SURVEY ON MOTOR VEHICLE TYRES AND RELATED ASPECTS – 2003 -
Page 77
full braking pressure irrespective of the pedal force applied by the driver. This maximizes the use of available braking power, thus shortening braking distance.
3.2.1.3 ELECTRONIC TRACTION CONTROL (ETC)
Electronic traction control systems (which many automotive manufacturers offer as either optional or standard equipment, predominantly for vehicles with higher engine power) prevent longitudinal wheel slip. By applying brake pressure to the respective wheel (often accompanied by automatic reduction of engine power), a wheel about to start spinning is braked, thus avoiding slip and loss of force transmission.
3.2.1.4 CORNERING BRAKE CONTROL
Cornering Brake Control (CBC) systems currently offered by BMW (for example) take the performance of ABS systems to new heights by improving driving stability, particularly when braking in corners. Wheel load transfer while cornering may reduce stability and cause the vehicle to over-steer. CBC counteracts this tendency by establishing a stabilising counter momentum through controlled application of brake force on one side of the vehicle when braking outside of the ABS control range.
3.2.1.5 ELECTRONIC STABILITY PROGRAM (ESP)
ESP (this acronym was introduced by the inventors, DaimlerChrysler; other manufacturers are using their own terms, such as DSC, PSM, CDS, etc.) is an extension of the ABS system and controls longitudinal dynamics as well as actively responding to the vehicle's transverse dynamics at the limits of adhesion (e.g. in the event of a skid). The concept behind ESP is that a skidding vehicle can be stabilised by specific braking of individual wheels, by reducing engine torque and (when linked to electronic steering devices) by making steering corrections.
ESP builds upon the technology involved in ABS (preventing wheel lock during braking) and traction control (preventing spin of the driven wheels) to provide more integrated control of the vehicle - and is therefore of benefit in a larger number of situations – e.g. preventing the vehicle from under- or over-steering while cornering. Techniques to influence the brake system automatically, or to automatically reduce torque have been in use for some time, while systems with automatic steering intervention are currently entering the market (for details, see relevant chapter 3.2.3.2).
ESP comprises a hydraulic modulator and a control unit with sensors for yaw rate and lateral acceleration, which detect and evaluate the respective driving situation. ESP hydraulics quickly build brake pressure on a single wheel in critical situations in order to counteract an undesirable skidding motion. This pressure increase occurs on the wheel automatically, without any driver involvement. The brake impulse is thus able to stabilize the vehicle at all times (as long as physical limitations are not exceeded),
______________________________________________________________ SURVEY ON MOTOR VEHICLE TYRES AND RELATED ASPECTS – 2003 -
Page 78
returning it to its proper course in case of any deviations. If required, the system also reduces engine torque to provide an added stabilizing effect.
Taking into account that many accidents are preceded by skidding, particularly in extra-urban areas, (a survey by GDV revealed that 25% of all accidents involving personal injury have been preceded by skidding [30]), electronic stability control systems can be deemed to make a major contribution to traffic and active driving safety. From the safety point of view, current trends showing roughly one third of all new passenger cars in Germany being fitted with optional or standard ESP, and a lower yet rising share in other European countries, are deemed a development in the right direction, although a large number of vehicles still remain without this highly effective safety feature.
3.2.2 BRAKING SYSTEMS
3.2.2.1 BRAKE-BY-WIRE (ELECTRO-HYDRAULIC AND -MECHANIC BRAKE SYSTEMS)
Electronic control systems started to make their way into braking technology years ago, starting with the introduction of ABS and follow-on developments derived from ABS, outlined in detail in previous chapters. Conventional hydraulic brake systems – a technology that has been in existence for nearly as long as the automobile itself - serve as the hardware for all of these systems. This is based on the principle that the brake pedal pressure applied by the driver is transmitted (boosted mostly by a vacuum brake booster) to the wheel brake cylinders by a hydraulic fluid. Latest developments are aimed at eliminating certain elements of these conventional systems, replacing some of the essential mechanical components of a braking system by electronically controlled actuators. Ultimately, this might lead to the complete elimination of any mechanical link between the driver’s foot and the wheel brakes.
There are currently two basic concepts known. Their functional principles are outlined below, using the developments by Conti-Teves as an example to illustrate the point. Nevertheless, other system manufacturers (e.g. TRW, Delphi) are known to be working on such systems, as well, based on the same or highly similar engineering designs.
In principle, the electro-hydraulic brake (EHB) continues to be a so called “wet” braking system, i.e. using brake fluid and conventional wheel brake cylinders to transmit and apply braking pressure. The characteristic feature of EHB is the use of an electronic brake pedal without any mechanical connection for force transmission. It is linked to an electro-hydraulic control unit in the engine compartment, which generates the required braking energy.
The pedal simulator communicates the driver's braking command to the modulator, and a closed-loop pressure control unit measures the pressure at the wheels once every millisecond. All brake applications are carried out by the system and not by the energy of the driver's foot on the pedal. In case of electrical failure, the system is
______________________________________________________________ SURVEY ON MOTOR VEHICLE TYRES AND RELATED ASPECTS – 2003 -
Page 79
equipped with a secondary hydraulic braking mode using the same functional principle as today's conventional systems.
Yet another step ahead are electro-mechanical brake systems (EMB). These systems are “dry”, i.e. no longer using any hydraulic fluid. Brake force is generated by individually controlled high-powered electric actuators, located at each wheel. The link between the electronic pedal simulator and the wheel brakes is only by wire. As the implementation of such EMB systems can only be realised in vehicles equipped with a 42V-power supply, the market launch of such systems remains highly improbable for the time being. Nevertheless, once the required supporting conditions are available, standard production of such systems may be launched within the next five to ten years.
The substantial efficiency improvements vis-à-vis conventional brake systems are mainly achieved by the accelerated dynamics of the system – particularly at lower temperatures. Moreover, intervention by electronic vehicle control systems (ABS, ESP, ETC) is optimised by achieving analogous brake pressure control. A clear contribution to improved driving safety may be expected to result from the up to 5% decrease of stopping distance which such systems are claimed to provide [31].
An overview on the systematic design of EHB and EMB vis-à-vis conventional brake systems is shown in figure 3.12 (following page).
Using the characteristic features of EHB, easier adjustment of the pedal position can be achieved, combined with optimised pedal feel (e.g. no more pulsation while braking in the ABS control range, which many drivers perceive as an undesirable side effect). The lack of a mechanical connection to the brake pedal can be expected to improve the vehicle’s crash performance, and of course, package space (no voluminous vacuum booster) and weight can be saved, as well. EMB promises to yield even higher weight savings, and the elimination of hydraulic fluid provides a welcome environmental effect.
An intermediate step from conventional to brake-by-wire systems is currently being put into practice by hybrid braking systems. These provide electronic actuators, e.g. for the parking brake function, while braking in normal driving continues to be handled by the conventional system.
The commonly known major problem involved with these brake-by-wire systems (as with all by-wire systems) is that their functional performance must be ensured even in case of power failure, or the failure of an electronic component. Basically, this can only be achieved by the continued provision of a hydraulic/mechanical back-up system, capable of taking over in case of a defect, or by the installation of a redundant unit, which, however, could not become effective in case of a complete power loss. These requirements considerably reduce the weight and space savings, which might otherwise be achieved by such systems. To keep from having to discard this new
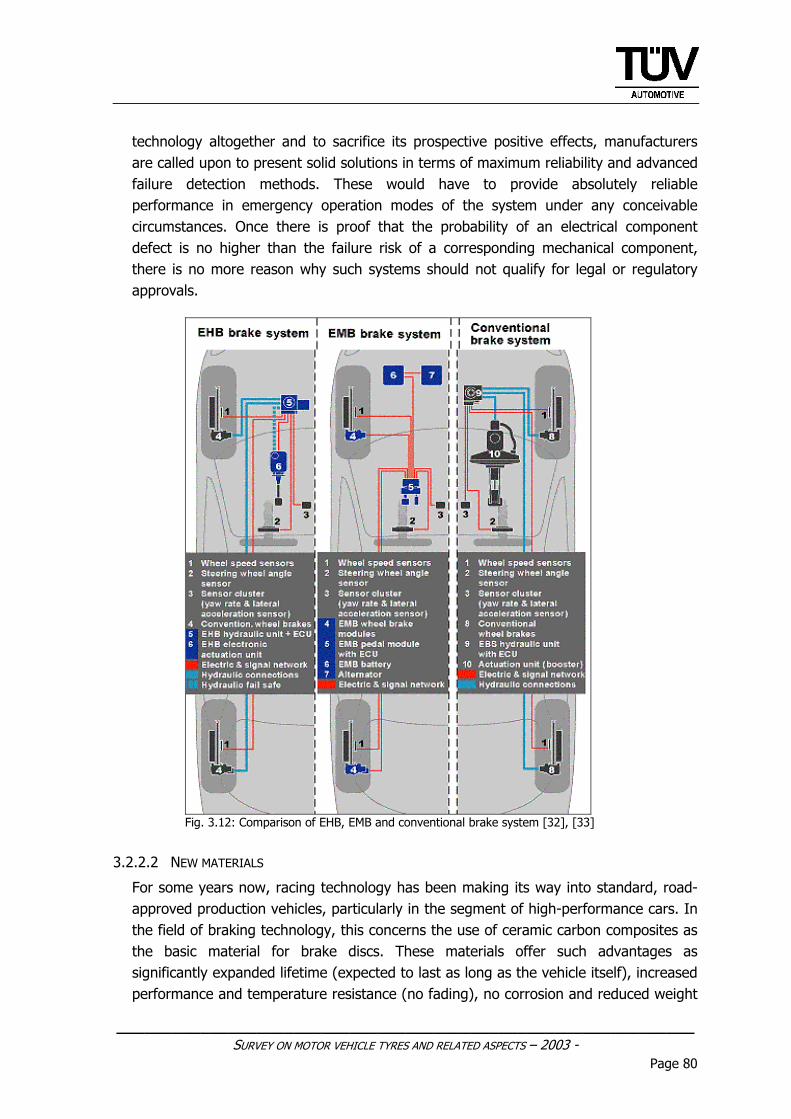
______________________________________________________________ SURVEY ON MOTOR VEHICLE TYRES AND RELATED ASPECTS – 2003 -
Page 80
technology altogether and to sacrifice its prospective positive effects, manufacturers are called upon to present solid solutions in terms of maximum reliability and advanced failure detection methods. These would have to provide absolutely reliable performance in emergency operation modes of the system under any conceivable circumstances. Once there is proof that the probability of an electrical component defect is no higher than the failure risk of a corresponding mechanical component, there is no more reason why such systems should not qualify for legal or regulatory approvals.
Fig. 3.12: Comparison of EHB, EMB and conventional brake system [32], [33]
3.2.2.2 NEW MATERIALS
For some years now, racing technology has been making its way into standard, road-approved production vehicles, particularly in the segment of high-performance cars. In the field of braking technology, this concerns the use of ceramic carbon composites as the basic material for brake discs. These materials offer such advantages as significantly expanded lifetime (expected to last as long as the vehicle itself), increased performance and temperature resistance (no fading), no corrosion and reduced weight
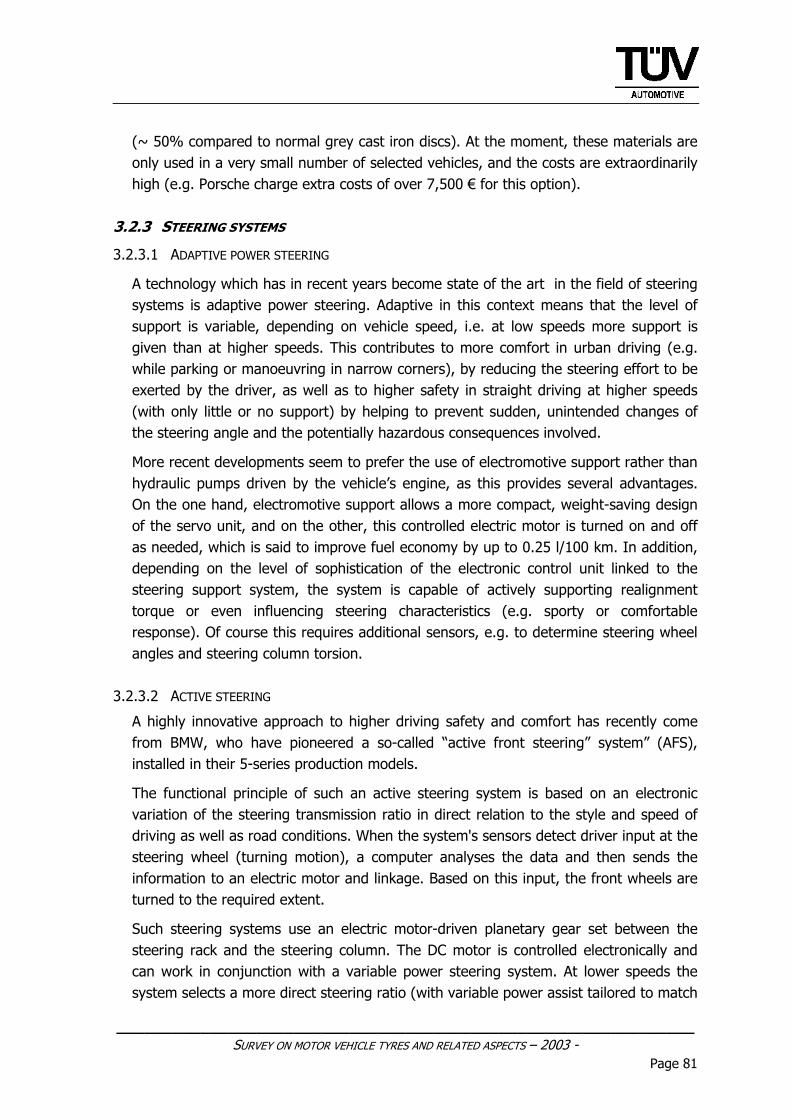
______________________________________________________________ SURVEY ON MOTOR VEHICLE TYRES AND RELATED ASPECTS – 2003 -
Page 81
(~ 50% compared to normal grey cast iron discs). At the moment, these materials are only used in a very small number of selected vehicles, and the costs are extraordinarily high (e.g. Porsche charge extra costs of over 7,500 € for this option).
3.2.3 STEERING SYSTEMS
3.2.3.1 ADAPTIVE POWER STEERING
A technology which has in recent years become state of the art in the field of steering systems is adaptive power steering. Adaptive in this context means that the level of support is variable, depending on vehicle speed, i.e. at low speeds more support is given than at higher speeds. This contributes to more comfort in urban driving (e.g. while parking or manoeuvring in narrow corners), by reducing the steering effort to be exerted by the driver, as well as to higher safety in straight driving at higher speeds (with only little or no support) by helping to prevent sudden, unintended changes of the steering angle and the potentially hazardous consequences involved.
More recent developments seem to prefer the use of electromotive support rather than hydraulic pumps driven by the vehicle’s engine, as this provides several advantages. On the one hand, electromotive support allows a more compact, weight-saving design of the servo unit, and on the other, this controlled electric motor is turned on and off as needed, which is said to improve fuel economy by up to 0.25 l/100 km. In addition, depending on the level of sophistication of the electronic control unit linked to the steering support system, the system is capable of actively supporting realignment torque or even influencing steering characteristics (e.g. sporty or comfortable response). Of course this requires additional sensors, e.g. to determine steering wheel angles and steering column torsion.
3.2.3.2 ACTIVE STEERING
A highly innovative approach to higher driving safety and comfort has recently come from BMW, who have pioneered a so-called “active front steering” system” (AFS), installed in their 5-series production models.
The functional principle of such an active steering system is based on an electronic variation of the steering transmission ratio in direct relation to the style and speed of driving as well as road conditions. When the system's sensors detect driver input at the steering wheel (turning motion), a computer analyses the data and then sends the information to an electric motor and linkage. Based on this input, the front wheels are turned to the required extent.
Such steering systems use an electric motor-driven planetary gear set between the steering rack and the steering column. The DC motor is controlled electronically and can work in conjunction with a variable power steering system. At lower speeds the system selects a more direct steering ratio (with variable power assist tailored to match
______________________________________________________________ SURVEY ON MOTOR VEHICLE TYRES AND RELATED ASPECTS – 2003 -
Page 82
anything from parking to medium speeds). Thus, a small movement of the steering wheel results in a greater movement of the road wheels. For the driver, this means that, under normal road conditions at low and medium speeds, steering becomes more direct, requiring less effort, while increasing the car’s agility in urban driving or when parking.
The actual gain in active driving safety arises from the fact that the active steering system, as presented by BMW, is able to communicate with the electronic stability programs to diffuse critical situations and to actively prevent skidding, for example. When the yaw sensors detect that the car may start to over-steer beyond a predetermined level, steering intervention (by stiffening steering or even increasing or decreasing the steering angle) becomes effective, helping the driver to remain on the road and keep control of the vehicle as long as the physical limits are not exceeded.
3.2.3.3 STEER-BY-WIRE
Steer-by-wire systems are the logical consequence of the afore-mentioned advances in steering technology, representing the ultimate step with regard to future systems, at least as long as motor vehicles continue to be steered by the movement of the front wheels. Steer-by-wire means the elimination of any mechanical link (i.e. the steering column) between the steering wheel and the road wheels, being replaced by electronic transmission devices - similar to brake-by-wire systems (see fig. 3.13).
The following advantages are anticipated to come from this new technology: • Increased crash safety by eliminating the steering column • Alleviation of limitations in drive train design • Easier design of right/left-hand drive vehicles • Inclusion of the steering system into electronic vehicle control • Realisation of a variable steering transmission ratio
Fig. 3.13: Design of a steer-by-wire system [34]
______________________________________________________________ SURVEY ON MOTOR VEHICLE TYRES AND RELATED ASPECTS – 2003 -
Page 83
When performing a steering manoeuvre, the driver applies a certain amount of steering force to the steering wheel. On the one hand, this force or moment has to be transmitted to the steering gear, yet has to be counteracted by a realignment torque produced by an electronically controlled electric actuator. In addition to ensuring that the system can operate in an emergency operation mode in case of failure, this ability to give feedback to the driver is the most important feature required of such systems. Producing a steering feel equal to conventional steering systems will be a prerequisite for providing the driver with essential feedback on road conditions, grip level, etc.
3.2.4 CHASSIS AND SUSPENSION
The field of chassis and suspension engineering is an extremely wide and highly sophisticated field, providing numerous individual solutions for improvements in road holding capabilities, riding comfort, stability, and thus active driving safety. As a basic principle, it can be stated here that, irrespective of any electronic vehicle control system and supporting device used, sound and elaborate mechanical and basic geometrical design is essential, with a significant impact on the vehicle’s driveability and stability to enable active safety potentials to be tapped fully. Various vehicle manufacturers are pursuing discernibly different strategies in chassis design, tied to respective brand strategies as well as demands by the market.
The scope of this survey does not allow the complete range of innovations in this field to be covered in detail. Moreover, the authors have deemed the presentation of a detailed and exhaustive list of chassis and suspension technologies currently in existence – all of which aim to improve active driving safety – of lesser relevance for the purposes of this study.
With regard to the tyre issue, mainly those systems are of interest which are able to interact actively or semi-actively with regard to road holding ability and driveability. Basically, this is achieved by a change of the vehicle’s level above the road, by influencing lateral or longitudinal inclination and an adaptation of spring and damper forces, all of them being conditional on the individual driving situation.
One technological feature that has become more and more prevalent in recent years, especially in the upper vehicle segment, is adaptive air suspension. In this system, the conventional metal spring is replaced by air bellows equipped with a valve system and fed by an air compressor and a pressure reservoir. This technology makes it possible to raise and lower the vehicle level depending on axle load, speed and road condition, while controlling each suspension unit individually, adapted to the specific driving conditions. The main advantages - besides improved riding comfort - are the lower centre of gravity at higher speeds for improved cornering stability and the provision of appropriate spring and damper characteristics specifically adaptable to high axle loads, for example.
______________________________________________________________ SURVEY ON MOTOR VEHICLE TYRES AND RELATED ASPECTS – 2003 -
Page 84
Often, such systems are combined with adaptive electronic damper controls. The rebound and compression stages of such damper units are adaptable by controllable valves. This allows adaptation to the spring characteristics and the respective driving conditions and contributes to even higher levels of road holding capability and stability.
Similar driveability improvements can be provided by active roll stabilization. Such systems normally resort to mechanical or hydraulic control of stabilizer stiffness, which is able to influence or even fully prevent the lateral inclination of the vehicle while cornering to the desired extent. These measures predominantly influence self-steering response, precision and throttle lag performance in a positive way.
As previously described, any system of this kind is able to deploy its optimum contribution to higher driving safety only as long as the basic chassis design is engineered at the requisite level of sophistication. Moreover, it is certainly conceivable that any effort invested in the development of such systems is useless, and safety improvements may be compromised, if vehicles are fitted with tyres that do not match their chassis layout (e.g. due to the tyre’s specific parameters, like sidewall characteristics, cornering stiffness or lateral grip transmission).
3.3 SUMMARY TABLE On the following two pages, the innovations and technical developments described above have been summarized in tabular form. These overviews include the major positive effects on traffic and driving safety and an assessment of the success of these effects. Moreover, projections regarding the prevalence and potentials for fitting vehicles currently as well as within the next few years and related information on current and/or future (estimated) costs are included.
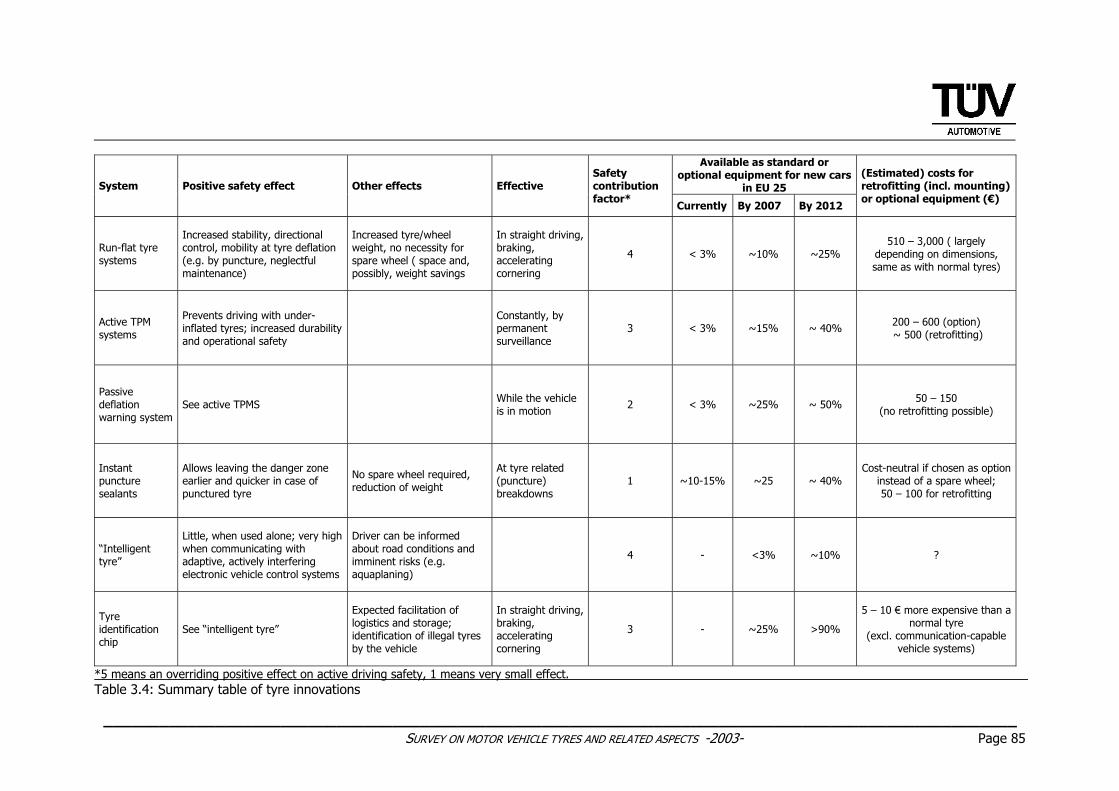
__________________________________________________________________________________________________ SURVEY ON MOTOR VEHICLE TYRES AND RELATED ASPECTS -2003- Page 85
Available as standard or optional equipment for new cars
in EU 25 System Positive safety effect Other effects Effective Safety contribution factor*
Currently By 2007 By 2012
(Estimated) costs for retrofitting (incl. mounting) or optional equipment (€)
Run-flat tyre systems
Increased stability, directional control, mobility at tyre deflation (e.g. by puncture, neglectful maintenance)
Increased tyre/wheel weight, no necessity for spare wheel ( space and, possibly, weight savings
In straight driving, braking, accelerating cornering
4 < 3% ~10% ~25% 510 – 3,000 ( largely
depending on dimensions, same as with normal tyres)
Active TPM systems
Prevents driving with under-inflated tyres; increased durability and operational safety
Constantly, by permanent surveillance
3 < 3% ~15% ~ 40% 200 – 600 (option) ~ 500 (retrofitting)
Passive deflation warning system
See active TPMS While the vehicle is in motion 2 < 3% ~25% ~ 50% 50 – 150
(no retrofitting possible)
Instant puncture sealants
Allows leaving the danger zone earlier and quicker in case of punctured tyre
No spare wheel required, reduction of weight
At tyre related (puncture) breakdowns
1 ~10-15% ~25 ~ 40% Cost-neutral if chosen as option
instead of a spare wheel; 50 – 100 for retrofitting
“Intelligent tyre”
Little, when used alone; very high when communicating with adaptive, actively interfering electronic vehicle control systems
Driver can be informed about road conditions and imminent risks (e.g. aquaplaning)
4 - <3% ~10% ?
Tyre identification chip
See “intelligent tyre”
Expected facilitation of logistics and storage; identification of illegal tyres by the vehicle
In straight driving, braking, accelerating cornering
3 - ~25% >90%
5 – 10 € more expensive than a normal tyre
(excl. communication-capable vehicle systems)
*5 means an overriding positive effect on active driving safety, 1 means very small effect. Table 3.4: Summary table of tyre innovations
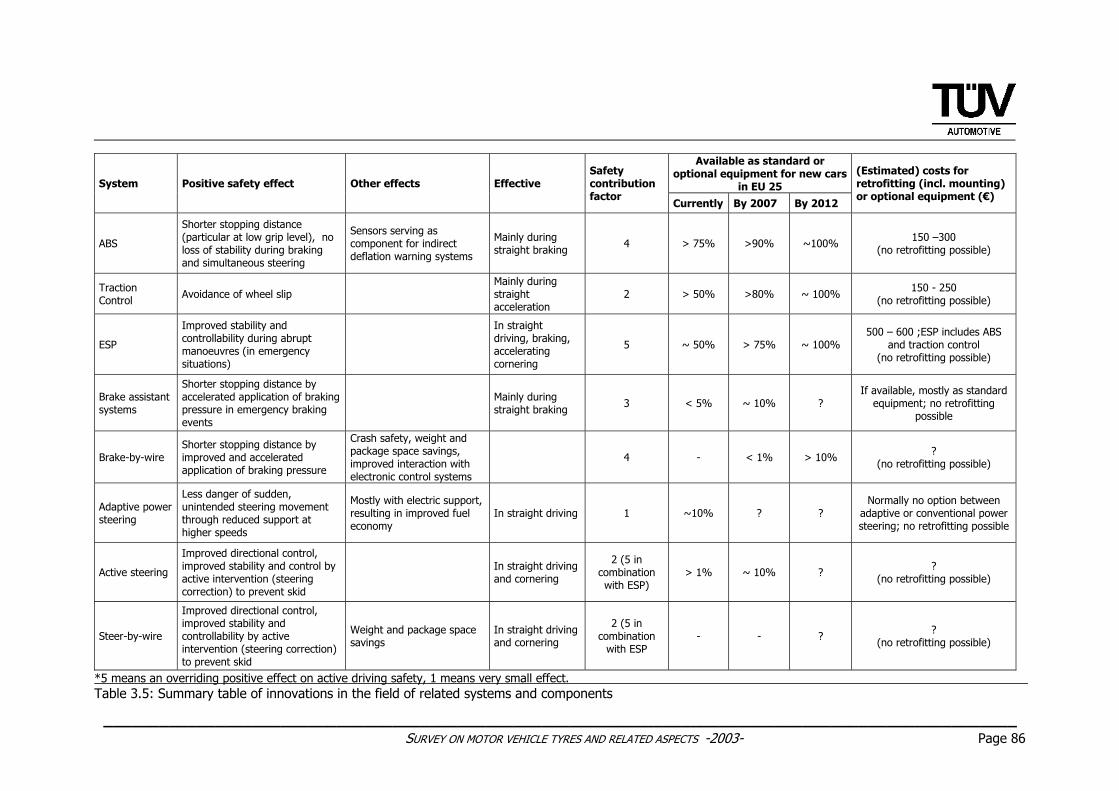
__________________________________________________________________________________________________ SURVEY ON MOTOR VEHICLE TYRES AND RELATED ASPECTS -2003- Page 86
Available as standard or optional equipment for new cars
in EU 25 System Positive safety effect Other effects Effective Safety contribution factor
Currently By 2007 By 2012
(Estimated) costs for retrofitting (incl. mounting) or optional equipment (€)
ABS
Shorter stopping distance (particular at low grip level), no loss of stability during braking and simultaneous steering
Sensors serving as component for indirect deflation warning systems
Mainly during straight braking 4 > 75% >90% ~100% 150 –300
(no retrofitting possible)
Traction Control Avoidance of wheel slip
Mainly during straight acceleration
2 > 50% >80% ~ 100% 150 - 250 (no retrofitting possible)
ESP
Improved stability and controllability during abrupt manoeuvres (in emergency situations)
In straight driving, braking, accelerating cornering
5 ~ 50% > 75% ~ 100% 500 – 600 ;ESP includes ABS
and traction control (no retrofitting possible)
Brake assistant systems
Shorter stopping distance by accelerated application of braking pressure in emergency braking events
Mainly during straight braking 3 < 5% ~ 10% ?
If available, mostly as standard equipment; no retrofitting
possible
Brake-by-wire Shorter stopping distance by improved and accelerated application of braking pressure
Crash safety, weight and package space savings, improved interaction with electronic control systems
4 - < 1% > 10% ? (no retrofitting possible)
Adaptive power steering
Less danger of sudden, unintended steering movement through reduced support at higher speeds
Mostly with electric support, resulting in improved fuel economy
In straight driving 1 ~10% ? ? Normally no option between
adaptive or conventional power steering; no retrofitting possible
Active steering
Improved directional control, improved stability and control by active intervention (steering correction) to prevent skid
In straight driving and cornering
2 (5 in combination with ESP)
> 1% ~ 10% ? ? (no retrofitting possible)
Steer-by-wire
Improved directional control, improved stability and controllability by active intervention (steering correction) to prevent skid
Weight and package space savings
In straight driving and cornering
2 (5 in combination
with ESP - - ? ?
(no retrofitting possible)
*5 means an overriding positive effect on active driving safety, 1 means very small effect. Table 3.5: Summary table of innovations in the field of related systems and components
______________________________________________________________ SURVEY ON MOTOR VEHICLE TYRES AND RELATED ASPECTS -2003-
Page 87
3.4 SPECIAL CONSIDERATIONS OF THE STATE OF THE ART AND TECHNOLOGICAL
DEVELOPMENTS IN THE MOTORCYCLE FIELD
Generally, it must be stated that technological development in the field of tyres and related systems and components in terms of improving active safety is proceeding rather slowly in comparison to passenger cars. Several reasons contribute to this fact:
• The market volumes of motorcycles in developed countries are smaller than those of passenger cars. This affects the potential financial investment into technological developments, as these may often not be cost-effective.
• The efficiencies of technical or electronic systems are, to some extent, limited with single-track vehicles, for instance, it has not been possible so far to implement cornering-capable ABS for motorcycles at justifiable cost-benefit ratios.
• Package space with motorcycles is highly limited, and low overall weight is one of the primary engineering design objectives. Also, power supply for additional energy consumption must be considered in this context.
• Customer acceptance of electronic systems has not been very high. This may be partially due to lack of information regarding their benefits.
• The costs for additional electronic systems in comparison to the overall purchase price of a motorcycle are out of proportion for many consumers.
For these reasons, most technical innovations are first introduced in the passenger car field, and once approved and established there, their use is expanded to other vehicle categories, to the extent feasible. 3.4.1 TYRES
Generally speaking, the current state and technological developments must be credited as having reached very high standards in terms of operational safety and performance. With regard to carcass design (switching from diagonal to radial design, 0°-belt) as well as compound technologies (Silica), developments have to be assessed very positively, certainly influenced by the general developments in the motorcycle field in terms of engine power and chassis technology, which required high levels of sophistication in the tyre field, as well. Consequently, merely minor progress worthy of mention should be anticipated within the next years.
3.4.1.1 RUN-FLAT TECHNOLGY
The requirements placed on motorcycle tyres with run flat technology are substantially higher than those for four-wheeled vehicles, as stability must be ensured at larger inclination angles, as well. This requires very stiff carcass design, which, of course, has considerable influence on stability and driveability in non-run-flat operation. Neither TÜV Automotive’s in-house research nor the input from the manufacturers side in the
______________________________________________________________ SURVEY ON MOTOR VEHICLE TYRES AND RELATED ASPECTS – 2003 -
Page 88
workshop discussions have provided any indications of any concrete developments in this area being pursued currently or in the near future. If and when run-flat systems have become established in the motorcycle field, as well, the issues will be the same as with passenger car tyres, i.e. the compulsory requirement of deflation warning systems and adequate consumer information about run-flat properties (including proper designation).
3.4.1.2 PRESSURE WARNING AND MONITORING SYSTEMS
These systems are about to be launched on the retrofitting market. They use direct measuring technology outlined in chapter 3.1.2.2, mostly with steel strap-mounted sensors and a small display (in the driver’s field of vision). Advantages and issues are the same in the motorcycle sector as with passenger cars. The primary target group for such systems are drivers of heavy touring and sport touring bikes often travelling over longer distances with pillion riders and luggage (i.e. maximum tyre loads).
Only few systems are currently available, e.g. by SmartTire and Pirelli (Bike X-pressure).
3.4.1.3 TYRE SENSORING, TYRE IDENTIFICATION CHIPS
In this field, it is expected that the motorcycle industry will wait for the systems ultimately prevailing in the passenger car sector. Future high-volume systems used for passenger car tyres will likely be adopted and adapted for use in motorcycle tyres in the mid-term.
3.4.2 RELATED SYSTEMS
3.4.2.1 VEHICLE CONTROL SYSTEMS
The only system used to a notable extent is ABS (current share in Germany is around 5%, and lower in the rest of Europe). As with passenger cars, this system prevents wheel lock in straight-line driving, which is particularly critical with motorcycles, as it may lead to a fall within split seconds.
Unlike first-generation anti-lock-brake systems, the control response of today’s systems is more sensitive. The control processes try to adapt themselves to the friction factor, which leads to improved comfort and stability (decrease of vibrations caused by control processes) and active driving safety (shorter stopping distance). This can only be achieved, however, if the tyre and ABS combination matches. As every tyre produces its maximum deceleration force at a different slip value, but only one maximum permissible slip parameter is set in the ABS software, unfavourable combinations may even lead to longer stopping distances.
It is reasonable to expect European motorcycle manufacturers to be fitting an increasing numbers of models with standard or available ABS in future, as the
______________________________________________________________ SURVEY ON MOTOR VEHICLE TYRES AND RELATED ASPECTS – 2003 -
Page 89
technology has reached high levels of control response and weight benefits as well as being offered by several suppliers. This not only applies to large touring bikes but scooters, as well. Admittedly, ABS is mostly offered as available equipment, at relatively high prices compared to the total vehicle price (up to 10% extra). Also, it provides only limited efficiency while cornering, as high steering torques arise from the control processes (the braking forces are applied eccentrically at the front wheel in cornering). These cannot be controlled by the driver, thus resulting in certain levels of instability. The development of cornering-capable ABS is a highly complex task, as any rigorous control intervention must be avoided. Current technology of the sensors required for such controls is highly sophisticated, elaborate and expensive.
3.4.2.2 BRAKING SYSTEMS
3.4.2.2.1 COMBINED BRAKING SYSTEM (CBS), INTEGRAL BRAKE
These systems were introduced to prevent rear wheel lock and to ensure better distribution of braking power to the front and rear wheels. When the rider applies pressure on the rear wheel brake pedal or lever, part of the pressure (either in a fixed ratio set by a mechanical assembly or by an electronically controlled distributor) is directed to the front wheel brake (either to one side of a two-disc brake or to single brake pistons) as well. Shorter stopping distances and avoidance of falls are the specific driving safety benefits offered by these systems.
3.4.2.2.2 BRAKE BOOSTER
With motorcycles, a brake booster is used to achieve quicker build-up of braking power in emergency situations. The use of such boosters, however, is only recommended for motorbikes equipped with ABS, as otherwise the danger of wheel lock and the resulting consequences increases considerably.
3.4.2.2.3 BRAKE-BY-WIRE SYSTEMS
The anticipated advantages of such systems for four-wheeled vehicles apply to motorcycles merely with considerable limitations. The quick build-up of full braking power in an emergency situation is only desirable in combination with ABS. Electronic stability programs, which could benefit most from such systems, are currently not available, nor will be for the near or mid-term future. The disadvantages continue to prevail for the time being, i.e. higher weight, package space requirements and the problems related to power supply and failure safety.
3.4.2.3 ALTERNATIVE SUSPENSIONS/WHEEL CONTROL
Basically, most motorcycles currently on the market follow identical rear wheel control design principles, i.e. designed as a swinging arm or fork. Alternative systems usually involve front wheel control, as this has a major impact on driveability. Front wheel
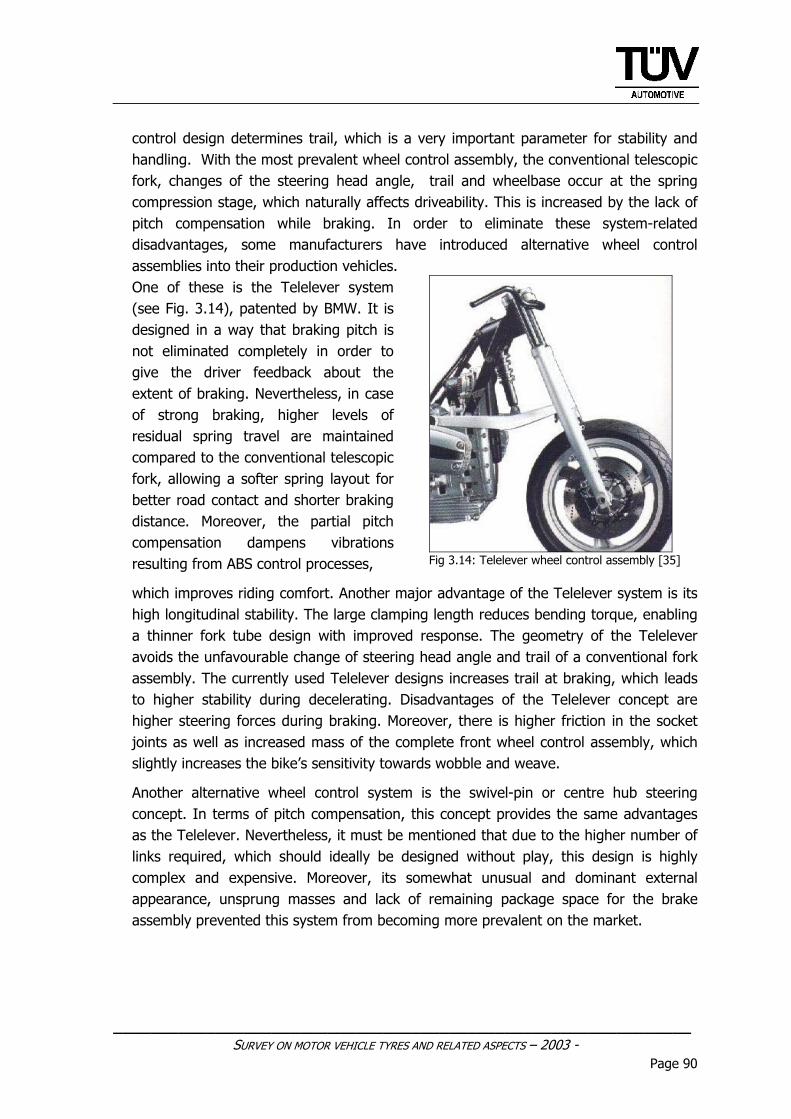
______________________________________________________________ SURVEY ON MOTOR VEHICLE TYRES AND RELATED ASPECTS – 2003 -
Page 90
control design determines trail, which is a very important parameter for stability and handling. With the most prevalent wheel control assembly, the conventional telescopic fork, changes of the steering head angle, trail and wheelbase occur at the spring compression stage, which naturally affects driveability. This is increased by the lack of pitch compensation while braking. In order to eliminate these system-related disadvantages, some manufacturers have introduced alternative wheel control assemblies into their production vehicles.
One of these is the Telelever system (see Fig. 3.14), patented by BMW. It is designed in a way that braking pitch is not eliminated completely in order to give the driver feedback about the extent of braking. Nevertheless, in case of strong braking, higher levels of residual spring travel are maintained compared to the conventional telescopic fork, allowing a softer spring layout for better road contact and shorter braking distance. Moreover, the partial pitch compensation dampens vibrations resulting from ABS control processes,
Fig 3.14: Telelever wheel control assembly [35]
which improves riding comfort. Another major advantage of the Telelever system is its high longitudinal stability. The large clamping length reduces bending torque, enabling a thinner fork tube design with improved response. The geometry of the Telelever avoids the unfavourable change of steering head angle and trail of a conventional fork assembly. The currently used Telelever designs increases trail at braking, which leads to higher stability during decelerating. Disadvantages of the Telelever concept are higher steering forces during braking. Moreover, there is higher friction in the socket joints as well as increased mass of the complete front wheel control assembly, which slightly increases the bike’s sensitivity towards wobble and weave.
Another alternative wheel control system is the swivel-pin or centre hub steering concept. In terms of pitch compensation, this concept provides the same advantages as the Telelever. Nevertheless, it must be mentioned that due to the higher number of links required, which should ideally be designed without play, this design is highly complex and expensive. Moreover, its somewhat unusual and dominant external appearance, unsprung masses and lack of remaining package space for the brake assembly prevented this system from becoming more prevalent on the market.
______________________________________________________________ SURVEY ON MOTOR VEHICLE TYRES AND RELATED ASPECTS – 2003 -
Page 91
4 ASSESSMENT OF THE ADEQUACY OF LAWS AND REGULATIONS APPLICABLE TO TYRES AND FITTING OF TYRES
4.1 CURRENT STATE OF LEGAL REQUIREMENTS FOR TYRES
The legal requirements for tyres contain a large number of general conditions which must be considered for the use of tyres. Within the scope of national Road Traffic Licencing Regulations reference to international regulations (EC directives and ECE regulations) is ensured by the provision of statutory type approvals for pneumatic tyres.
Sources of information dealing with the interaction between the tyre and vehicle are relatively scarce and are usually limited to sufficient load capacity, maximum speed related to the specific vehicle model and, with certain vehicles, to the prescribed use of tyres of uniform ply design (radial or diagonal).
Any references to the examination of braking and driving performance are solely contained in the regulations governing the use of temporary emergency spare tyres.
4.1.1 ADEQUACY OF CURRENT LEGISLATION AND RECOMMENDATIONS FOR
CHANGES/AMENDMENTS
In the following chapters, the authors are going to evaluate to what extent any changes/amendments to the legislative framework governing tyres and their fitting motor vehicles are desirable.
In this context, we will proceed from certain problem areas which
• were elaborated in various workshops with representatives from the vehicle and tyre industry.
• clearly emerged out of test results and evaluations by national transport and road authorities.
• resulted from an objective assessment of consumer interests, since consumers have justified expectations regarding quality, performance and safety.
The weaknesses of current directives will then be analysed on the above basis and appropriate fields of action defined. At this point, we would like to provide general recommendations on how to adjust the appropriate directives to the present state of the art and current requirements. Anticipated future developments should also be taken into account.
Apart from the above, proposals which take into account both the results of this study and the interests of individual groups, associations, industry and the citizens of the European Union are to be drawn up in technical and political committees.
______________________________________________________________ SURVEY ON MOTOR VEHICLE TYRES AND RELATED ASPECTS – 2003 -
Page 92
4.1.1.1 SNOW TYRE USE AND PERTINENT REQUIREMENTS
Although national regulations governing the use of snow tyres on snow-covered and icy roads are already in force in some Member States, a harmonised European Regulation has so far been missing. Advantages offered by tyres especially suitable for driving on snow-covered and icy roads compared to normal tyres include much shorter braking distances, increased lateral grip and improved vehicle control and have been acknowledged for a long time. The positive impact of such tyres on traffic safety and the disadvantages of not using them are thus irrefutable (cf. Chapter 2.1.5, page 20/21).
Appropriate, either revised or new directives, however, must not only address the use of such tyres but must also include performance requirements. So far, Council Directive 92/23 EEC only refers to the correct marking of such tyres (M+S) and the definition of these tyres is oriented primarily to optical details and not to their actual performance on ice and snow (cf. Chapter 4.1.1.3, last paragraph).
4.1.1.2 TYRE DIMENSION TOLERANCES
Within the scope of this work, geometrical tolerances must be emphasised as an important aspect. Significant in this context are the requirements of EC Directives (Directive 92/23/EEC, Annex II, section 6.1) and those of ETRTO standards, which grant tyre manufactures a wide range (up to 20 mm depending on tyre size) of dimensional tolerances in tyre manufacturing. This explains why, under the existing regulations and directives, commercially available tyres that in fact differ significantly in size can all fall under a single size category (tyres at the upper and lower limit of the tolerance range). These difficulties result from the following problem areas:
• Wheel arches must offer unnecessary space to provide for the large tolerances.
• Optimum functioning of modern electronic systems depends on narrow tolerances. A wide range of permissible rolling circumferences, for example, impacts negatively on the coordination between anti-lock brake systems (ABS), electronic traction control (ETC) systems and thus of course, also on electronic stability programmes (ESP).
• Particular problems may appear at vehicles with mixed tyre sizes at front and rear, especially in combination with all-wheel drive. The stress for the centre differential gear is higher the more the real circumferences differ from the predetermined values and may affect or disturb the force distribution between front and rear.
______________________________________________________________ SURVEY ON MOTOR VEHICLE TYRES AND RELATED ASPECTS – 2003 -
Page 93
• Differing tyre circumferences may affect the functionality of indirect tyre deflation warning systems and the speedometer, as these systems are calibrated to a given circumference of the tyre; safety-critical above all with indirect-measuring deflation warning systems, as the response tolerances may even be narrowed further.
From a technical perspective, at least the last three of the items listed above may negatively affect active driving safety under real-world driving conditions, thus increasing the risk of an accident due to inadequate performance of electronic control systems designed to maintain driving stability or due to malfunctions of monitoring systems, for example. High-performance vehicles warrant particular attention in this regard from a technical point of view. This pertains to vehicles, for example, which are capable of achieving far above-average maximum speeds, or vehicles with a low weight-to-power ratio, as well as vehicles with particularly high performance requirements placed on the tyres (due to high axle loads combined with high levels of engine power, for example). In the opinion of the authors, in these cases, it is advisable to reduce permissible tolerances with regard to tyre dimensions or, as a minimum, to afford vehicle manufacturers the opportunity to specify respective tyres meeting these requirements. To visibly identify such tyres it might be conceivable, for example, to include the actual outer diameter of the tyre as an additional parameter in the tyre size designation.
Environmental aspects, too, must not be neglected. Motor-vehicle approval according to EC directives requires, among other things, that the largest possible tyre of a tyre size in line with the standard can be fitted to the vehicle without any impairment by wheel suspension or steering (Annex IV of Directive 92/23/EEC). Until now, the majority of vehicle manufacturers have used tyres which range from the medium to the lower limit of the permissible tolerance range, but which carry the largest possible tyre size designation. Since applicable law no longer permits an unequivocal vehicle/tyre combination, an increasing number of tyres in the upper part of the tolerance ranges will be produced and used in future (since manufacturers will make full use of the available scope). This, in turn, means that tyres will become wider, larger and heavier, while tyre-size designations stay the same. Accordingly, more raw materials will be used and the negative impact on the environment will increase (e.g. an increase in CO2 emissions due to the processing of larger amounts of materials and higher fuel consumption of vehicles).
______________________________________________________________ SURVEY ON MOTOR VEHICLE TYRES AND RELATED ASPECTS – 2003 -
Page 94
4.1.1.3 QUALITY DIFFERENCES
Collective load, impairment and reliability of vehicle tyres, i.e. tyre durability in terms of individual vehicle/tyre combinations, has already been addressed in chapter 2.2.1.3. Nevertheless, this subject will be taken up briefly once more at this point.
Between the beginning and the specified end of their service lives, vehicle tyres must satisfy a large number of requirements. For all specified vehicle/tyre combinations and under all possible operating conditions, they must be able to fulfil their challenging functions reliably under the most varied environmental stresses (e.g. solar radiation, temperature, ozone, depending on the region in which they are used) and on an immense range of different grounds, extending from optimum road surfaces to the most demanding off-road terrain. Apart from all the influencing factors due primarily to users and how careful they are, the interaction between vehicle and tyre is equally decisive for tyre stress. For example, the load profile of a tyre is crucially influenced by geometrical, kinematic, elasto-kinematic, and thermodynamic correlations as well as the drive concept. It must therefore be expected that the test criteria generally valid today will be inadequate to guarantee the required extent of operational safety for real-life tyre operation on various vehicles. Analyses of the pertinent directives demonstrated that, of the above influencing parameters, current approval criteria for vehicle tyres and the tests provided for within these directives, essentially, consider merely speed and loads. The impact of the tyre-vehicle combination on tyre durability is given little or no consideration.
As already mentioned above, it must be concluded from the findings obtained during this project and from our long-standing experience that certain vehicles in combination with precisely defined tyres must be regarded as complete systems. Of course, the problem area of the impact of excessive tyre-size tolerances on the control quality of electronic systems, which is addressed in the Tyre Dimension Tolerances chapter, also applies to tyre performance, since the characteristics of these electronic systems are adjusted within narrow limits and are thus highly dependent on certain tyre characteristics (drive slip, lateral grip etc). However, as all tyres that satisfy the requirements of the above directives may be mounted on all suitable vehicles (suitable in terms of tyre size, speed and load index) operated in the European Market, serious conflicts are inevitable.
Beyond the aforementioned problems concerning tyre durability and service life, the higher performance (in terms of driving safety and driving dynamics) which, compared to the tyres sold on the aftermarket, is required in some instances of OE tyres (and tyres recommended by vehicle manufacturers) must be considered. Admittedly, assessment of the risk potential is made difficult by existing differences between OE and aftermarket specifications and between aftermarket tyres in particular. Nevertheless, the authors deem it necessary to limit the tolerance range of tyre
______________________________________________________________ SURVEY ON MOTOR VEHICLE TYRES AND RELATED ASPECTS – 2003 -
Page 95
properties approved for a vehicle to a technically manageable extent, with an approved OE tyre or a representative group of tyres ideally serving as a reference. Approval testing of replacement brake pads, which requires products to achieve a certain defined minimum performance compared to the OE part, may serve as an example in this case.
Particularly with regard to tyres, though, an objective comparative measurement alone (e.g. measurement of braking distance) is insufficient to assure comparability with a tyre that is part of the original equipment of a vehicle. With regard to operating safety, safe driving characteristics and predictable performance at the limits – the latter usually occurring in emergency situations or immediately preceding a crash – a number of tyre-related factors and their mutual interaction come into play. In the case of high-performance vehicles in particular, legislators should make use of the development work performed by vehicle manufacturers in collaboration with tyre manufacturers to select and adapt the tyres optimally suited to the particular vehicle. From a technical perspective, considering the need to guarantee optimum levels of road-holding abilities and operational safety, it appears highly sensible to afford manufacturers the possibility, by law, to specify the use of certain tyres confirmed to perform well and, above all, optimally adapted to the characteristics of the vehicle. Experience has shown that particularly vehicles characterised by extremely high maximum attainable speeds or high accelerating power (= low weight-to-performance ratio) reveal clearly discernible changes in driving properties at the limit, depending on the tyres used. In addition, vehicles must be considered, which place particularly high demands on tyres, especially in terms of operational safety, i.e. vehicles with above-average weight and relatively high maximum attainable speeds.
In any case, it must be avoided that tyre/vehicle combinations known to be unfavourable in terms of operational and driving safety might possibly be approved for public road traffic. To prevent this, vehicle manufacturers must be given at least the right to establish restrictions for certain tyres that are known to degrade a vehicle’s safety performance. By the same token, tyre manufacturers must be allowed to exclude their products for selected vehicles , based on the knowledge that their products may have problems with these, although being in line with basic legal requirements.
Highly interesting for vehicles that may have (due to their technical characteristics) the technical necessity for restricted usage of selected tyres only is the aforementioned (cf. chapter 2.2.4.4.) practice in the motorcycle field to create a so-called “positive list”. Especially for vehicles known as sensitive with respect to the tyre make or specification used, such tests appear highly prudent with respect to active safety. The consumer’s choice from several products would be possible after such tests, without involving the risk of selecting an inadequate tyre. As the case may be, the existence of such “positive lists” might facilitate the resolutions of product liability issues and related
______________________________________________________________ SURVEY ON MOTOR VEHICLE TYRES AND RELATED ASPECTS – 2003 -
Page 96
legal proceedings. The determination of the detailed criteria that have to be tested and proven as sufficient for the inclusion of a tyre /vehicle combination in such a positive list has to be clarified by working groups, including both tyre and vehicle manufacturers.
To improve transparency for consumers, tyres in line with OE specifications should also be clearly identified with regard to stress differences. If this is achieved, free tyre selection in the European Union can be continued without any problem, since consumers would be able to make informed choices regarding the product they decide to buy. To elucidate these issues, Chapter 2.2.2.2 includes examples illustrating the related technical aspects.
If differentiation between OE and aftermarket tyres cannot be realized by means of new directives, the required safety performance of motor-vehicle tyres will require more detailed definitions in future. Admittedly, within the scope of the UN-ECE GRRF Ad-Hoc Group "Tyre Wet Grip", the ECE is currently developing a new directive addressing the wet braking capability of tyres, and Article 3 of the Amendment 2001/43/EC to Council Directive 92/23/EEC already demands that safety aspects of tyres be investigated, namely "...to what extent technical progress would, without compromising safety..." allow the introduction of stricter noise emission limits. The issue, however, does not receive sufficient emphasis there. The previously discussed results obtained within the scope of our tests on the wet braking capability of tyres have shown, among other things, that action is called for in the field of safety performance.
Of course, different design and development objectives must also be taken into account in this context. As far as performance is concerned, design and development may have to satisfy highly different requirements, depending on the tyre’s primary intended use. While, for example, the differences and also the design and development conflicts between summer and snow tyres remain within certain limits (directives do not include any clear general performance definitions for snow tyres), the performance matrix of tyres designed for the Scandinavian market, for example, changes clearly in favour of winter characteristics at the expense of the tyre’s wet and dry performance. The same applies to environmental characteristics, unless manufacturers boast ultramodern tyre design and manufacturing. These areas call for balanced and detailed directives that also consider possible interactions in terms of various tyre requirements.
Regarding the broad range of tyre characteristics, other arguments must not be ignored either. Due to a lack of consumer information (technical magazines can only be used to a certain extent as information sources, since the manner in which tests are conducted is sometimes open to question), tyre purchasers in Europe are left by and large to their own devices. They are unable to classify tyres according to their performance and to purchase a product satisfying their requirements. This particularly applies to the M+S designation of tyres, which must, in many cases, be deemed
______________________________________________________________ SURVEY ON MOTOR VEHICLE TYRES AND RELATED ASPECTS – 2003 -
Page 97
inappropriate or misleading. It appears that, especially with regard to off-road vehicles or SUVs, it is common practice to mark tyres with this type of designation in order to circumvent the requirement of conformance between the maximum attainable speed of the vehicle and the performance capabilities of the tyre. A test of the performance capabilities of tyres bearing the M+S designation – such tyres having to perform clearly better on snow than normal tyres - is thus highly advisable with regard to consumer protection (cf. chapter 4.1.1.1).
4.1.1.4 INCLUSION OF RUN-FLAT TECHNOLOGY IN DIRECTIVES AND STANDARDS
Run-flat systems are designed to improve driving safety and stability in future and to reduce tyre-related accidents. As already discussed in detail in chapter 3.1.1, various systems are already available on the market and are included in original equipment by vehicle manufacturers. As already explained, existing systems are at present designed and installed only by leading tyre manufacturers in close cooperation with motor vehicle manufacturers. This ensures high quality and durability of these systems. Since these systems require several modifications to tyre or rim, however, and in future will be included not only in the original equipment but will also be available on the aftermarket, this run-flat technology will have to be covered by directives and standards as soon as possible.
The following issues have to be taken into account:
• Differences in permitted maximum speed and remaining distance to be covered in run-flat operation
• Market penetration by system manufacturers worldwide
• Marking of run-flat systems
• Are redundancy and control systems (TPMS) absolutely necessary?
• Do the different vehicle structures cope with the higher loads in run-flat operation (interaction: tyres/run-flat system/vehicle)?
• What framework conditions must be fulfilled in the case of retrofitting?
• What procedure is to be applied after run-flat operation? Who assesses the measures required? Can rims or other chassis components remain in use or do they have to be replaced?
• Use on the vehicle
• Definition of test regulations
To guarantee certain minimum levels of operational safety on the one hand and consumer information regarding the run-flat systems installed in their vehicles on the other, three steps are necessary. By means of a legally prescribed load test (while the tyre is deflated), analogous to the tests of standard tyres, the tyre’s
______________________________________________________________ SURVEY ON MOTOR VEHICLE TYRES AND RELATED ASPECTS – 2003 -
Page 98
run-flat properties must be tested and assured. In addition, a modified tyre designation is required for run flat tyres, enabling the customer to recognize a run-flat tyre and its particular run-flat properties at a glance (i.e. the maximum distance over and permissible speed at which the tyre may be driven in a run-flat state). Due to the fact that many run-flat tyres – and systems – in the deflated state (at least in largely stationary driving modes) reveal only minor changes in driving properties, a functioning tyre pressure monitoring system is another must from the technical perspective.
4.1.1.5 TYRE AGE / AGING
The impact of climate on tyre service life and durability has been addressed in the previous chapter on Quality Differences. The problem of tyre age or aging will be addressed once more at this point, since the analysis of accident data performed within the scope of this study called for action in this field.
The problem of different aging performance by various tyres must not be analysed simply in terms of their ages in years. Attention must be paid especially to operating conditions (e.g. including earlier damage caused by driving with inadequately inflated tyres), external influences and consumer behaviour, but also to visible signs of old age, such as damage and tread depth.
However, the deterioration of tyre properties (in terms of road-holding capabilities, particularly on wet roads, but also in terms of strength and thus operational safety) which occurs as tyres age makes the definition of a certain basic minimum age up to which a tyre may be used appear sensible to prevent the risk of accidents caused by such deterioration. From a technical perspective, a maximum of eight years is recommended in this context, a period, as from the date of manufacture, over which the tyre can be operated without giving rise to fears of any serious loss of the properties previously described.
Since, for the aforementioned reasons, a universally valid "best before" date does not appear to be the sole solution in this context, and since it is known that aging and wear performance of tyres differs from one tyre make to the other, mandatory in-depth tyre inspections after the expiration of this period may help to increase safety in this field.
Another possible measure that appears useful is to increase the required remaining tread depth, since this would ensure younger tyre age and would favourably influence the negative impacts on safety performance associated with diminished tread depth as well as with aging and hardening of the rubber. Especially with regard to wet grip performance, an increase of the remaining tread depth to 2.5 mm for regular tyres is expected to result in a clear increase of active driving safety. To ensure that their
______________________________________________________________ SURVEY ON MOTOR VEHICLE TYRES AND RELATED ASPECTS – 2003 -
Page 99
positive properties are preserved, snow tyres (bearing M+S designations) should not be operated below a residual tread depth of 4 mm.
4.1.1.6 TYRE MARKING AND CONSUMER INFORMATION
Of course, tyre age and aging performance are very closely connected with consumer behaviour. In this area, efforts to heighten awareness and detailed information of consumers would be a major step in the right direction. As demonstrated by the accident data analysis conducted within the scope of this study and as previously explained, most accidents caused by tyre damage are due to inadequate maintenance and careless tyre handling. Targeted consumer information will certainly help to reduce these accident statistics. Such "consumer information" could be supported further by clear tyre markings which can be understood by the general public.
Many of the arguments in favour of revised tyre marking have already been discussed in greater detail elsewhere. For this reason, the list below has been limited to necessary tyre markings.
New tyre-size designations limiting tyre dimension tolerances along with revised load and speed indices (without abbreviations that are incomprehensible to the general public), so as to provide sales organizations and consumers with unequivocal tyre data.
Clear definition of requirements pertaining to snow tyres with M+S marking.
Clearer information on tyre age and aging behaviour exceeding today's DOT codes.
Introduction of a consumer information system (quality ranking) since, at present, consumers can only classify tyres according to their performance and scope of application. This would enable them to buy products which satisfy their specific requirements based on specialist knowledge of tyre development processes and marketing policies (i.e. is there a specially developed OE tyre for my vehicle, can a certain aftermarket tyre guarantee the same safety performance?). In this field, as already mentioned previously, consumer information roughly in line with the American UTQGS system could be of assistance. Within the scope of such a system, criteria and evaluations must be given thorough consideration and agreed with industry.
4.1.1.7 ENVIRONMENTAL ASPECTS
Within the scope of the Green Paper on Integrated Product Policy (IPP), the European Commission has already found an approach to including environmental aspects in future directives. Intentions in the tyre sector are not to add any unnecessary new regulations, but to take intelligent, expedient measures in order to extend existing
______________________________________________________________ SURVEY ON MOTOR VEHICLE TYRES AND RELATED ASPECTS – 2003 -
Page 100
regulations. This includes a definition of the legal framework for voluntary measures, which in this case, however, are based on a life-cycle approach (from the extraction of raw materials through manufacturing, sales and use to waste disposal). Last but not least, environmentally friendly products should always guarantee high quality, long service life and low overall costs, as this is the only way for manufacturers to gain market acceptance.
Due to the high product requirements in terms of both the safety performance and service life of tyres, raw materials used in tyre production cannot be replaced arbitrarily nor production processes modified. Consequently, a target-oriented implementation of environmental-protection requirements appears very difficult.
A glance at retreaded tyres, which have a relatively small share in the passenger-car sector of the European market, shows that the IPP in this case (probably unwittingly) has already been implemented to a large extent. Unfortunately, particularly in the field of retreaded tyres, the absence of or failure to implement directives may lead to very large quality fluctuations which contribute to an above-average accident involvement of retreaded tyres (cf. Chapter 2.2.1.2). In light of the above, integration of ECE Directives 108 and 109 in European legislation or, as a minimum requirement, the adoption of these directives in the national law of the EU Member States should be an immediate aim. On the one hand, this measure would ensure a minimum quality standard for retreaded tyres sold on the European market and on the other, it would strengthen the market positions of manufacturers who are producing high-quality retreaded tyres already.
By introducing noise-emission limits as an element of tyre testing via Amendment Directive 2001/43/EC to Directive 92/23/EEC, approval authorities ventured to take a first, European-wide step in this direction. Almost all tyres available on the market, however, are far below the currently valid limits. A further development of this directive, in which lower limits are presented, would contribute substantially to a reduction in noise emissions caused by road transport. In the context of noise emissions, road-surface quality which, after all, is responsible for a large part of tyre-road noise, must be taken into account, as must be the noise produced by the vehicles themselves (noise emissions caused by engines and drive systems).
In improving the directives to integrate environmental aspects, it will be highly important also to consider the aforementioned environmental/safety performance interactions (e.g. noise and wet capability characteristics) and the previously discussed service life (anti-wear and abrasion performance) in tyre design. The current ECE work on "wet grip" performance of tyres includes this aspect, as does the aforementioned Article 3 of Directive 2001/43/EC.
Due to the necessity of curbing global CO2 emissions, the automotive industry is making a concerted effort to minimize the fuel consumption of vehicles. This should
______________________________________________________________ SURVEY ON MOTOR VEHICLE TYRES AND RELATED ASPECTS – 2003 -
Page 101
also be taken into account when tyre directives are further refined by increasingly defining limits on tyre rolling resistance or loss performance. One example showing that such limits are necessary is the so-called 3-litre car, which, for design reasons, can only achieve its high fuel economy in combination with certain tyre types. Since, however, current directives do not allow the specification of unequivocal vehicle/tyre make and tyre type combinations, optimised environmental characteristics of vehicles may be adversely influenced, if consumers, as they are entitled to do, replace tyres with optimised rolling resistance by a free choice of aftermarket tyres.
4.1.1.8 TYRE INFLATION PRESSURE
That tyre inflation pressure is one of the most important factors of an automotive tyre's safety performance and service life was known before the recent incidents in the United States and the modifications in FMVSS directives associated therewith. These requirements, however, receive too little attention. In the USA, directives have been drawn up, which integrate tyre durability under reduced inflation pressure in the approval process.
At this point, the authors have opted not to reiterate the advantages and disadvantages of active and passive safety systems, nor to discuss the influence of consumers who, without any doubt, play a major role regarding proper inflation pressures. Instead, the following chapter aims to provide ideas for possible changes in future.
The previous chapter on Quality Differences pointed out that the test criteria of today's directives do not suffice to ensure that all tyres can be safely operated on all vehicles. Wheel camber and alignment, for example, are not considered at all. It may be taken for granted that the additional factor of inadequate inflation pressure not only puts extreme stress on a tyre but also damages it. How such damage impacts on individual tyres has not yet been investigated. Similarly, today's test specifications do not provide for any information on possible tyre damage after the tyre has been operated with inadequate inflation pressure over a certain mileage. Since such damage may also occur in the presence of a tyre pressure monitoring system (because of the previously addressed system-dependent response times), TPMS should be included in future directives as well.
A basic pre-requisite for giving the consumer the possibility to check the inflation pressure regularly and reliably is their access to inflating devices.
It should be mentioned at this point that a European Directive on tyre pressure gauges (86/217/EEC) does exist, but that the mandatory, European-wide, free-of-charge provision of such equipment at places (for example petrol stations) which are easily accessible and regularly visited by motorists has not been regulated. Inflation-pressure monitoring systems, however, can only fulfil their safety-related purpose, if incorrect
______________________________________________________________ SURVEY ON MOTOR VEHICLE TYRES AND RELATED ASPECTS – 2003 -
Page 102
tyre inflation pressure can be corrected quickly and tyre damage caused by driving with inadequately inflated tyres prevented. Thus, infrastructure measures must also be taken into account when tyre directives are revised.
4.1.1.9 CLARIFICATION OF PRODUCT LIABILITY
In Europe, the issue of product liability has not been settled satisfactorily for consumers. With regard to technically more complex items or systems, e.g. tyre-vehicle systems in particular, consumers are usually left to their own devices. In cases of damage/accidents, it is almost impossible for consumers to determine the responsible party within the liability chain. This is also largely due to the fact that tyre and vehicle manufacturers tend to blame each other in such cases. Essentially, vehicle manufacturers argue that they have only limited influence regarding the use of different tyres on their vehicles and that they can only assume liability for vehicle/tyre combinations that have been appropriately tested and approved. Vehicle manufactures indicate that they are prepared to assume full product liability for the complete vehicle, provided certain prerequisites are met. From the vehicle manufacturers' point of view an essential prerequisite for their assumption of full liability is that the tyres used have been recommended by them and are designated as OE spare parts. Tyres, they argue, are the only components not bearing clear vehicle manufacturer identification. All other visible supply parts, e.g. window panes or instruments, are identified by the name of the vehicle manufacturer and not by the name of the supply part manufacturer (e.g. Sekurit or VDO). Vehicle manufacturers refuse to assume full responsibility for the vehicle/tyre system unless recommended tyres are used (the reasons, e.g. the wide range of tyre characteristics, have been explained above). If a consumer freely selects a tyre, consumer protection is limited, because the vehicle manufacturer will, in all likelihood, refuse to assume product liability.
Tyre manufacturers, too, are basically prepared to assume additional responsibility for their products in future. From their point of view, the assumption of liability is difficult at present, because vehicles respond differently to various tyre makes and types, and tyre manufacturers have only little or no influence on the design and development of the complete vehicle. Apart from the above, implementation of such a regulation is difficult without having regular access to tyres and subjecting them to periodic checks. Information about the technical condition of a tyre is highly significant in this context, if the manufacturer is to assume liability.
This point also illustrates the dilemma in which manufacturers find themselves, and which, in the end, is passed on to consumers. Vehicle manufacturers have only limited influence on a vehicle’s general and overall safety performance, if they have no influence on which tyres are used. Vice versa, tyre manufacturers can only make a limited judgement as to whether their tyres will function perfectly in combination with all passenger cars / motorcycles, since they do not have any insight into the design
______________________________________________________________ SURVEY ON MOTOR VEHICLE TYRES AND RELATED ASPECTS – 2003 -
Page 103
and development strategies of vehicle manufacturers. This applies, in particular, to tyre manufacturers not involved in original equipment supply.
4.1.1.10 VEHICLE-TYRE INTERACTION
Vehicle manufacturers attach different degrees of importance to the interaction between vehicles and tyres. This is due, among other things, to different design and development strategies and objectives. Basically, it can be said that for vehicle set-up, manufacturers rely on electronic aids (ESP) to different extents. Some manufacturers fine-tune their vehicles to achieve optimum levels of driving dynamics. In these cases, tyres usually play a significant role so that, ideally, electronic aids are not needed or are needed only in emergencies. ESP is merely used to provide additional safety, as a so-called sheet anchor. Most of these vehicles are sporty models with high levels of active driving safety. In these vehicles electronics are only used to optimise a near-perfect system. With other manufacturers, however, electronics play a key part in vehicle set-up. In this case, the vehicle is subjected to thorough basic tuning, capable of satisfying everyday requirements, and electronics are responsible for meeting all the other requirements of a state-of-the-art vehicle. In such cases, essential safety performance is provided by the vehicle’s electronic systems. The advantage of this design approach is that such vehicles do not respond sensitively to different tyres. The major disadvantage is that the available active safety potential is not fully used. Excessive statutory/regulatory standardization might restrict further improvement of active driving safety in this field.
4.1.1.11 STANDARDIZATION AND DESCRIPTION OF TYRE ELECTRONICS
In future, electronics used on and in tyres will become increasingly important. Communication between the control system and the tyre will be inevitable in future, if control systems and thus safety performance are to be improved even further. Standards must therefore be defined, ensuring that future compatibility requirements can be met as well. These standards must form a fixed framework, e.g. definition of transmission frequencies/data, yet must also be flexible enough not to restrict or prevent future developments. Ideally, future standards or regulations will precede new developments.
4.1.1.12 NEW VEHICLE SYSTEMS
It is evident that continuously new vehicle systems will be launched on the market. This is not only due to the fact that vehicle manufacturers must constantly present new technical features to their customers to document technical progress. Another cause may be seen in the fact that manufacturers also strive to provide customers with increasingly safe vehicles. Passive safety levels, however, have meanwhile reached levels leaving hardly any further room for improvement. As mentioned before, activities
______________________________________________________________ SURVEY ON MOTOR VEHICLE TYRES AND RELATED ASPECTS – 2003 -
Page 104
are thus focused increasingly on the field of active driving safety. Networking of different electronic aids has been proceeding more and more rapidly. ABS systems which receive tyre-parameter information and, at the same time, information about road-surface quality to ensure optimum coordination of braking power and control strategy may be mentioned in this context. But, in order to function, such a system needs additional electronics in the tyre. If no standards are defined, there is the risk that consumers, when such systems are launched on the market, will be strictly limited in their choice of tyres. If consumers wish to continue using the full potential offered by their vehicles, tyres will become spare parts. If, for example, tyres without electronics or tyres of which data cannot be read were fitted to a vehicle, consumers would have to accept a decrease in safety performance of the complete vehicle. The use of tyre data, however, is not limited to braking systems. Further improvements can be achieved, if the ESP and the steering system are provided with relevant information.
The interaction of all components, including tyres, helps to enhance road safety. The positive effect of such developments, however, can only be guaranteed for the future if data transfer standards have been established, and if design and development continue to progress (cf. Standardization and description of tyre electronics).
Another approach to enhancing traffic safety by means of reducing braking distance and enhancing safety reserves is offered e.g. by the design vehicle of DaimlerChrysler AG, the F400 Carving. This vehicle not only conquered new terrain via active camber adjustment up to 20°, but also in terms of innovative tyre and rim design. This vehicle boasts a special design which requires different tyre diameters at the rim's inner and outer sides. In line with the above, tyres require different designations on the outer and inner sides (outer side 255/45 R17 and inner side 255/35 R19). Advantages of this system are shorter braking distances, enhanced lateral grip and superior resistance to aquaplaning. Current standards and regulations must be updated so that such systems can become reality.
4.1.1.13 CAMBER LIMITING
ETRTO is considering a reduction of wheel camber, permissible on passenger cars, from 4° to 2°. From the tyre manufacturers' perspective, this measure is necessary, as with greater tyre widths combined with smaller cross-sections, the design and development efforts needed to cater for a maximum permissible camber of 4° will be too high in future. This measure is also problematic, however, since steps must be taken to ensure that such tyres are not fitted to passenger cars providing for a wheel camber of up to 4° (when vehicles are retrofitted with tyres/wheels of other dimensions or worn tyres replaced). Clear and comprehensive consumer information is therefore a must in order to maintain safety performance on roads. Additionally, in order not to adversely impact traffic safety, steps must be taken to ensure that consumers can choose from a sufficiently large number of tyres suitable for the
______________________________________________________________ SURVEY ON MOTOR VEHICLE TYRES AND RELATED ASPECTS – 2003 -
Page 105
vehicles already on the market. Consumers cannot be expected to re-equip vehicles with another wheel/tyre combination.
Last but not least, a reduction in camber also impedes progress in the development of new vehicle and chassis concepts (as mentioned in the previous chapter).
4.1.1.14 REGIONAL-MARKET-SPECIFIC VEHICLES/TYRES
Basically, globalisation of regulations and standards must be welcomed to further reduce trade barriers and facilitate access to international markets. These globalised regulations and standards, however, must be flexible enough to provide sufficient leeway for individual Member State requirements. A global regulation or standard must not extend so far that specialised products of manufacturers can no longer be approved. This applies, above all, if such product variants increase traffic safety in the Member States concerned. One example for tyres is the necessity of studded tyres or the use of so-called soft-compound tyres. Vehicle manufacturers, too, respond to regional requirements in order to enhance general as well as safety performance.
4.2 RECOMMENDATIONS FOR CHANGES TO LEGISLATION (FOUR-WHEEL VEHICLES)
Reviewing the facts and insights outlined so far, certain issues must be given higher priority than others. Within the scope of this study, from the authors’ perspective, the following items are deemed the most critical and urgent, thus warranting inclusion into any concrete proposals for changes or amendments to existing and/or new regulations:
The use of snow (M+S) tyres and related requirements
The legal minimum tread depth and the legal maximum age of tyres
Standards and regulations related to run-flat tyres and their use
The requirements of tyres with respect to their performance on wet surface
Vehicles with special performance characteristics and the tyres fitted to them
Elaborations on the reasons supporting the changes and recommendations proposed below have been provided in the relevant chapters of this report.
4.2.1 GENERAL RECOMMENDATIONS FOR THE USE OF TYRES
4.2.1.1 USE OF SNOW TYRES (M+S)
The national road traffic regulations of the Member States shall be amended in a way that the use of snow tyres is obligatory for those times of the year and/or for those regions in which winter conditions are likely to occur.
______________________________________________________________ SURVEY ON MOTOR VEHICLE TYRES AND RELATED ASPECTS – 2003 -
Page 106
Winter road conditions shall be characterised by:
dry road surfaces at maximum daytime outside temperatures of 5°C or below or
wet road surfaces at maximum daytime outside temperatures of 7°C or below or
road surfaces permanently or temporarily covered by ice and/or snow
During periods or in regions where one or several of these conditions apply to more than two thirds of the time or to the relevant area, the use of snow tyres shall be obligatory for vehicles of category M1 , M1SP, N1 and N1SP (for definitions of these categories, see recommended amendments to Directive 70/156 EEC). The relevant periods shall be determined for each country/region individually, based on official, long-term meteorological observations and in accordance with the particular climatic conditions.
The definitions of and requirements placed on a snow tyre are found in Council Directive 92/23/EEC, Annex II, paragraph 2.2 and new section 6.5 (see proposed amendments).
4.2.2 AMENDMENTS TO COUNCIL DIRECTIVE 89/549/EEC (TREAD DEPTH OF TYRES)
Amend Article 1 and 2 to read:
Article 1 Member States shall take all necessary steps to ensure that, throughout their service life on the road, tyres for category M1 , M1SP, N1 , N1SP , 01 and 02 vehicles as defined in Annex I to Council Directive 70/156/EEC on the approximation of the laws of the Member States relating to the type-approval of motor vehicles and their trailers have a tread depth in the main grooves of the tread surface of at least 2.5 mm.
For snow tyres marked M+S as defined in Annex II, paragraph 2.2, Council Directive 70/156/EEC, the legal minimum shall be 4 mm, at least at those times and in those regions where the use of snow tyres is regulated by national law.
Article 2 After consulting the Commission, Member States may exclude from the scope of this Directive, or make special provisions for, vehicles which are declared to be of historical interest and, originally equipped with tyres, whether pneumatic or other, which, when new, had a tread depth of less than 2.5 mm, provided that they are equipped with such tyres, are used in exceptional conditions and are never, or hardly ever, used on public roads.
______________________________________________________________ SURVEY ON MOTOR VEHICLE TYRES AND RELATED ASPECTS – 2003 -
Page 107
4.2.3 FORMULATION OF A NEW DIRECTIVE CONCERNING TYRE AGE
Article 1 Member States shall take all necessary steps to ensure that tyres for category M1 , M1SP, N1 , N1SP , 01 and 02 vehicles as defined in Annex I to Council Directive 70/156/EEC on the approximation of the laws of the Member States relating to the type-approval of motor vehicles and their trailers are not older than 8 years (referring to the production date indicated by the imprint as defined in Directive 92/23/EEC, Annex II, paragraph 3.1.9).
Article 2 In case the tyres are to be used beyond this date, a visual inspection with respect to aging defects by a duly qualified individual or institution (e.g. skilled tyre technician, authorised garage, Technical Service etc.) is obligatory, to be done every year after the first inspection. A document of compliance has to be issued by the inspecting individual or institution and carried onboard the vehicle.
Article 3 After consulting the Commission, Member States may exclude from the scope of this Directive, or make special provisions for, vehicles which are declared to be of historical interest, provided that they are used in exceptional conditions and are never, or hardly ever, used on public roads.
4.2.4 AMENDMENTS TO COUNCIL DIRECTIVE 70/156/EEC
The changes and amendments listed below refer to Directive 70/156/EEC dated 1 November 2003.
ANNEX I
Amend paragraph 6.6.1 to read
6.6.1 Tyre/wheel combination(s) (for regular or exceptional tyres as defined in Directive 92/23/EEC, Annex II, paragraph 2.38 and 2.39 indicate size designation, minimum load capacity index and minimum speed category symbol; for wheels indicate rim size(s) and offset(s)).
As a minimum, one combination with a regular tyre as defined in Council Directive 92/23/EEC, Annex II, paragraph 2.38, must be listed.
In the case of vehicles of category M1SP or N1SP, the listing of a regular tyre may be omitted.
______________________________________________________________ SURVEY ON MOTOR VEHICLE TYRES AND RELATED ASPECTS – 2003 -
Page 108
ANNEX II
Part A
Amend paragraph 1 to read:
1. Category M: Motor vehicles with at least four wheels used for the carriage of passengers.
Category M1: Vehicles used for the carriage of passengers and comprising no more than eight seats in addition to the driver’s seat.
Category M1SP: category M1 vehicles with special, additional characteristics, such as:
- a weight-to-power ratio (kerb weight [kg] ÷ engine power [kW]) of 11 kg/kW or lower, or
- a maximum attainable speed of 230 km/h or higher, or
- a maximum mass of 2.2 tonnes or higher and maximum attainable speed of 180 km/h or higher
Category M2: Vehicles used for the carriage of passengers, comprising more than eight seats in addition to the driver’s seat, and having a maximum mass not exceeding 5 tonnes.
Category M3: Vehicles used for the carriage of passengers, comprising more than eight seats in addition to the driver’s seat, and having a maximum mass exceeding 5 tonnes.
Amend paragraph 2 to read:
2. Category N: Motor vehicles with at least four wheels used for the carriage of goods.
Category N1: Vehicles used for the carriage of goods and having a maximum mass not exceeding 3.5 tonnes.
Category N1SP: category N1 vehicles, additionally characterised by special performance. This may apply to vehicles with a maximum attainable speed of 150 km/h or higher.
Category N2: Vehicles used for the carriage of goods and having a maximum mass exceeding 3.5 tonnes but not exceeding 12 tonnes.
Category N3: Vehicles used for the carriage of goods and having a maximum mass exceeding 12 tonnes.
______________________________________________________________ SURVEY ON MOTOR VEHICLE TYRES AND RELATED ASPECTS – 2003 -
Page 109
ANNEX III
Amend paragraph 6.6.1 to read
6.6.1 Tyre/wheel combination(s) (for regular or exceptional tyres as defined in Directive 92/23/EEC, Annex II, paragraph 2.38 and 2.39 indicate size designation, minimum load capacity index and minimum speed category symbol; for wheels indicate rim size(s) and offset(s)).
At minimum, one combination with a regular tyre as defined in Directive 92/23/EEC, Annex II, paragraph 2.38 must be listed.
In case of vehicles of category M1SP or N1SP the listing of a regular tyre may be omitted.
4.2.5 AMENDMENTS TO COUNCIL DIRECTIVE 92/23/EEC
The following proposals for amendments to Directive 92/23/EEC are largely limited to sections and paragraphs that deal with technical issues. The changes and amendments refer to the Directive dated 1 November 2003.
Paragraphs and sections dealing with administrative provisions or information documents have by and large not been considered. Hence, an appropriate revision in accordance with the changes to the technical provisions may be required.
Amend Article 1a to read:
1. The requirements set out in Annex V, VII and VIII shall apply to tyres intended to be fitted to vehicles first used on or after 1 October 1980.
2. The requirements set out in Annex VIII shall apply to tyres marked as snow or M+S tyres and intended to be fitted to vehicles first used on or after 1 October 1980.
3. The requirements set out in Annex VIII shall apply only to tyres of class C1 and C2 as defined in section 2.4 of Annex VII.
4. The requirements set out in Annex V, VII and VIII shall not apply to:
(a) tyres whose speed rating is less than 80 km/h
(b) tyres whose nominal rim diameter does not exceed 254 mm (or code 10) or is 635 mm or more (code 25)
(c) T type temporary use spare tyres as defined in paragraph 2.3.6 of Annex II
(d) tyres designed only to be fitted to vehicles registered for the first time before 1 October 1980
______________________________________________________________ SURVEY ON MOTOR VEHICLE TYRES AND RELATED ASPECTS – 2003 -
Page 110
Add Annex VII to list of contents: Annex VII Procedure for wet grip performance tests Add Annex VIII to list of contents: Annex VIII Procedure for snow performance tests
ANNEX II
Amend paragraph 2.17.1 to read:
2.17.1. on regular tyres as defined in paragraph 2.38 a designation showing
Insert new paragraphs 2.17.1.5 and 2.17.1.6 to read:
2.17.1.5 in case of a run-flat tyre or run-flat system tyre, the minimum distance over which the tyre may be operated in deflated condition
2.17.1.6 in case of a run-flat tyre or run-flat-system tyre, the maximum speed at which the tyre may be operated in deflated condition
Insert new section 2.17.2 to read:
2.17.2 on exceptional tyres as defined in paragraph 2.39 a designation showing:
2.17.2.1. the nominal section width expressed in mm
2.17.2.2. the external diameter of the inflated tyre expressed in mm
2.17.2.3. the nominal aspect ratio
2.17.2.4. a conventional number ‘d’ denoting the nominal rim diameter expressed in inch
2.17.2.5 in case of a run-flat tyre or run-flat system tyre, the minimum distance over which the tyre may be operated in deflated condition
2.17.2.6 in case of a run-flat tyre or run-flat-system tyre, the maximum speed at which the tyre may be operated in deflated condition
______________________________________________________________ SURVEY ON MOTOR VEHICLE TYRES AND RELATED ASPECTS – 2003 -
Page 111
Amend paragraph 2.29.3 and 2.29.4 to read:
2.29.3. The speed categories are as shown in the table below:
Speed category symbol Corresponding speed [km/]F 80G 90J 100K 110L 120M 130N 140P 150Q 160R 170S 180T 190U 200H 210V 240W 270Y 300
2.29.4. Tyres suitable for maximum speeds higher than 300 km/h are identified by
means of the letter code ‘Z’ placed within the tyre size designation. Amend paragraph 2.31.2 and 2.31.3 to read:
2.31.2. in the case of passenger car tyres suitable for speeds exceeding 210 km/h, but not exceeding 300 km/h (tyres classified with speed category symbol ‘V’, ‘W’ and ‘Y’), the maximum load rating must not exceed the percentage of the value associated with the load capacity index of the tyre, indicated in the table below, with reference to the speed capability of the vehicle to which the tyre is fitted.
Speed category symbol
V W Y Maximum speed
[km/h] Load (%)
210 100 100 100
220 97 100 100
230 94 100 100
240 91 100 100
250 95 100
260 90 100
270 85 100
280 95
290 90
300 85
For intermediate maximum speeds linear interpolations of the maximum load rating are allowed.
______________________________________________________________ SURVEY ON MOTOR VEHICLE TYRES AND RELATED ASPECTS – 2003 -
Page 112
2.31.3. For speeds exceeding 300 km/h (Z-rated tyres) the maximum load rating must
not exceed the value specified by the tyre manufacturer with reference to the maximum speed capability of the vehicle to which it is fitted.
Insert new paragraphs 2.38 to 2.49 to read
2.38 “Regular tyre” means any tyre that has the characteristics laid down in article 1 and 1a and does not have the characteristics of an exceptional tyre.
2.39. ‘Exceptional tyre’ means a tyre that is designed and manufactured in a way that it fulfils more stringent legal requirements than those to be met by regular tyres, including:
- adherence to stricter tolerances regarding the dimensions of a tyre
- exceeding the requirements of the load/speed test
- exceeding the requirements of the tyre noise test
- exceeding the requirements of the wet grip performance test
- exceeding the requirements of the snow performance test in case of a snow tyre
The external distinguishing mark of a special tyre is a different tyre size designation than that of a regular tyre (see paragraph 3.1.13)
In case the tyre is fitted to a vehicle of category M1SP or N1SP as defined in Council Directive 70/156/EEC, Annex II Part A, paragraph 2 and 3, an additional code consisting of a maximum two digits (letters or numbers or symbols or a combination thereof) may be printed on the tyre. This code identifies the special qualification of the tyre for fitting to certain vehicle models. The special qualifications have to be agreed between the manufacturer of the tyre and the manufacturer of the relevant vehicle model(s).
2.40 ‘Run-flat tyre’ means a regular or exceptional tyre that is designed to be operated in an inflated mode and capable of running at least a specified distance under prescribed conditions in case the tyre does not hold air. A run-flat tyre is characterised by the fact that it does not require an adapted rim or any further supporting components.
The external distinguishing mark of a run-flat tyre is a different tyre size designation than that of a regular tyre (see paragraph 3.1.14).
______________________________________________________________ SURVEY ON MOTOR VEHICLE TYRES AND RELATED ASPECTS – 2003 -
Page 113
2.41 ‘Run-flat-system-tyre’ means a regular or special tyre that is – only in combination with an adapted rim or supporting components - designed to be operated in an inflated mode and capable of running at least a specified distance under prescribed conditions in case the tyre does not hold air.
The external distinguishing mark of a run-flat system tyre is a different tyre size designation than that of a regular tyre (see paragraph 3.1.15).
2.42 ‘Standard Reference Test Tyre (SRTT)’ means a tyre that is produced, controlled and stored in accordance with the American Society for Testing and Materials (ASTM) Standard E 1136 – 93 (Re-approved 1998).
2.43 ‘Candidate tyre’ means a tyre, representative of the type, that is submitted for approval in accordance with this Directive.
2.44 ‘Control tyre’ means a normal production tyre that is used to establish the wet grip performance of tyre sizes unable to be fitted to the same vehicle as the Standard Reference Test Tyre – see paragraph 2.2.2.16 of Annex VII of this Directive.
2.45 ‘Wet grip index (G)’ means the ratio between the performance of the candidate tyre and the performance of the Standard Reference Test Tyre.
2.46 ‘Mean fully developed deceleration (mfdd)’ means the average deceleration calculated on the basis of the measured distance recorded when decelerating a vehicle between two specified speeds.
2.47 ‘Peak Brake Force Coefficient (pbfc)’ means the maximum value of the ratio of braking force to vertical load on the tyre prior to wheel lock-up.
2.48 ‘Normal Production Reference Tyre (NPRT)’ is defined as a tyre that
- is a regular production tyre.
- is on free sale in at least one Member State at the time of performing the test.
- is EC-type-approved and bears the EC type approval marking.
- is not explicitly marked as a snow tyre according to paragraph 2.2.
- is not older than 18 months.
- has not been used for any other performance tests except on snow or a smooth icy surface.
- bears the same size designation and Load Index as the candidate tyre.
2.49 ‘Snow Index (S)’ means the ratio between the performance of the candidate tyre and the performance of the NPRT
______________________________________________________________ SURVEY ON MOTOR VEHICLE TYRES AND RELATED ASPECTS – 2003 -
Page 114
Insert new paragraphs 3.1.2.1 and 3.1.2.2 to read:
3.1.2.1 on regular tyres a tyre size designation as defined in section 2.17.1
3.1.2.2 on exceptional tyres a tyre size designation as defined in section 2.17.2
Amend paragraph 3.1.3.2 to read:
3.1.3.2 on radial-ply tyres, the letter ‘R’ placed in front of the nominal in diameter marking and, optionally, the word ‘RADIAL’; on exceptional run-flat tyres or run-flat-system tyres, this letter ‘R’ may be omitted.
Amend paragraph 3.1.4 to read:
3.1.4. an indication of the tyre's speed category by means of the symbol shown in section 2.29; in the case of tyres suitable for speeds higher than 300 km/h the speed category of the tyre must be indicated by the letter code ‘Z’ placed in front of the indication of the structure (see section 3.1.3);
Amend paragraph 3.1.9 to read:
3.1.9 The date of manufacture in the form of a group of four digits, the first two showing the week and the last two the year of manufacture; e.g. 4203 means week 42 in year 2003
Insert new paragraphs 3.1.13 to 3.1.16 to read:
3.1.13 in case of exceptional tyres, the arrangement of the markings is the same as for regular tyres as defined in Appendix 3, except that the outer tyre diameter in mm is arranged between the section width and the aspect ratio and divided by a slash (/)
e.g. 225/635/45 R17
3.1.14 on run-flat tyres, the letters ‘RFT’ placed in front of the nominal rim diameter marking
e.g. 205/55 RFT 16
3.1.15 on run-flat-system tyres, the letters ‘RST’ placed in front of the nominal rim diameter marking
e.g. 205/55 RST 16
3.1.16 on both run-flat tyres and run-flat-system tyres the maximum speed and minimum distance for operation in deflated condition are divided by a slash (/) and put into a rectangular frame
e.g. 205/55 RFT 16 91V 80/200
______________________________________________________________ SURVEY ON MOTOR VEHICLE TYRES AND RELATED ASPECTS – 2003 -
Page 115
Correct paragraph 6.1.2.1 to read
6.1.2.1 Except as provided by section 6.1.2.2, the outer diameter of a tyre is calculated by the following formula:
D = d + 2H
where:
D = the outer diameter expressed in mm,
d = the conventional number defined in section 2.17.1.3, expressed in mm,
H = the nominal section height in mm and is equal to S1 × 0.01 Ra;
where:
Ra = the nominal aspect ratio,
all as shown on the sidewall of the tyre in the tyre-size designation in conformity with the requirements of section 3.
Amend paragraphs 6.1.4.2.1 and 6.1.4.2.2 to read:
6.1.4.2.1. in case of regular, diagonal (bias-ply) tyres: 6% for passenger car tyres, 8% for commercial vehicle tyres;
in case of exceptional, diagonal (bias-ply) tyres: 3% for passenger car tyres, 4% for commercial vehicle tyres
6.1.4.2.2. in case of regular, radial-ply tyres: 4%; in case of exceptional, radial-ply tyres: 2%
Amend paragraph 6.1.5.3.1 and 6.1.5.3.2 to read:
6.1.5.3.1 coefficient ‘a’: ‘a’ = 0.97 for regular tyres; ‘a’ = 0.99 for exceptional tyres
6.1.5.3.2 coefficient ‘b’:
for regular tyres
Passenger car tyres Commercial vehicle
tyres Category of use
Radial Bias Radial Bias
Normal 1.04 1.08 1.04 1.07
Special - - 1.06 1.09
Snow 1.04 1.08 1.04 1.07
Temporary-use 1.04 1.08 - -
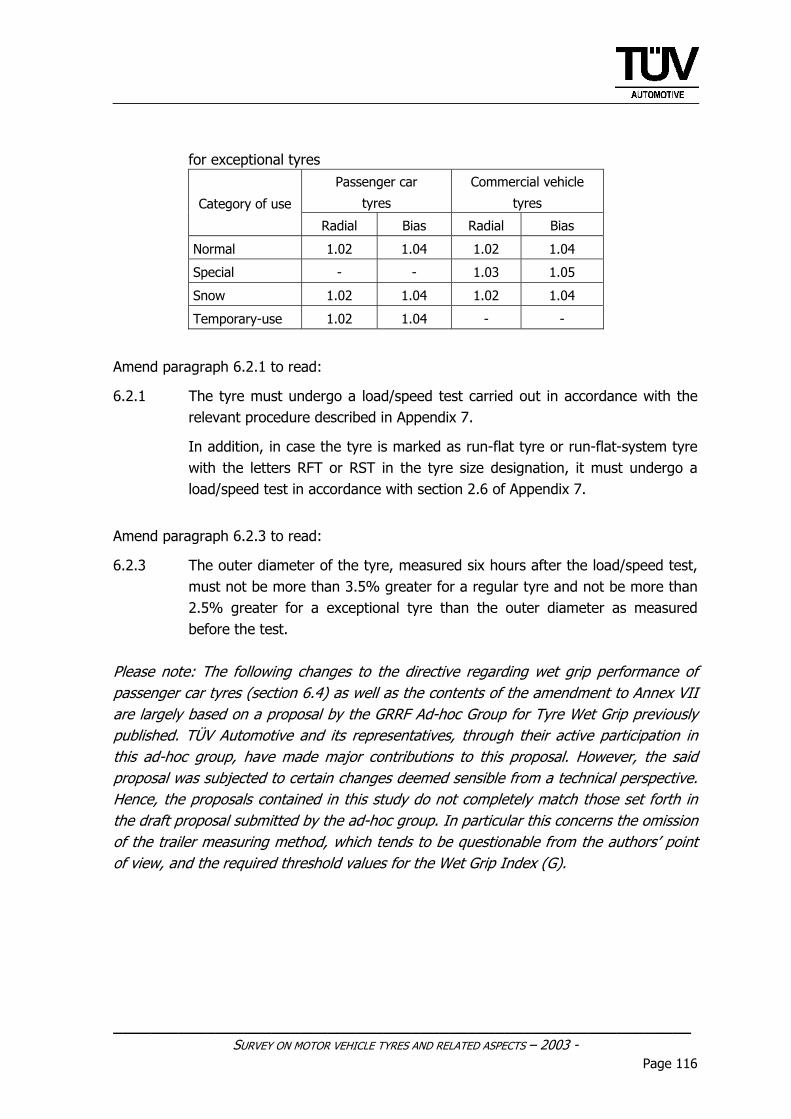
______________________________________________________________ SURVEY ON MOTOR VEHICLE TYRES AND RELATED ASPECTS – 2003 -
Page 116
for exceptional tyres
Passenger car
tyres
Commercial vehicle
tyres Category of use
Radial Bias Radial Bias
Normal 1.02 1.04 1.02 1.04
Special - - 1.03 1.05
Snow 1.02 1.04 1.02 1.04
Temporary-use 1.02 1.04 - -
Amend paragraph 6.2.1 to read:
6.2.1 The tyre must undergo a load/speed test carried out in accordance with the relevant procedure described in Appendix 7.
In addition, in case the tyre is marked as run-flat tyre or run-flat-system tyre with the letters RFT or RST in the tyre size designation, it must undergo a load/speed test in accordance with section 2.6 of Appendix 7.
Amend paragraph 6.2.3 to read:
6.2.3 The outer diameter of the tyre, measured six hours after the load/speed test, must not be more than 3.5% greater for a regular tyre and not be more than 2.5% greater for a exceptional tyre than the outer diameter as measured before the test.
Please note: The following changes to the directive regarding wet grip performance of passenger car tyres (section 6.4) as well as the contents of the amendment to Annex VII are largely based on a proposal by the GRRF Ad-hoc Group for Tyre Wet Grip previously published. TÜV Automotive and its representatives, through their active participation in this ad-hoc group, have made major contributions to this proposal. However, the said proposal was subjected to certain changes deemed sensible from a technical perspective. Hence, the proposals contained in this study do not completely match those set forth in the draft proposal submitted by the ad-hoc group. In particular this concerns the omission of the trailer measuring method, which tends to be questionable from the authors’ point of view, and the required threshold values for the Wet Grip Index (G).
______________________________________________________________ SURVEY ON MOTOR VEHICLE TYRES AND RELATED ASPECTS – 2003 -
Page 117
Insert new section 6.4 to read:
6.4 Wet grip performance
6.4.1 The test of wet grip performance applies only to tyres of class C1 and C2 (defined in Annex V, paragraph 2.4). The wet grip performance will be based on a procedure that compares mean fully developed deceleration (mfdd) against values achieved by a Standard Reference Test Tyre (SRTT). The relative performance shall be indicated by a Wet Grip Index (G).
6.4.1 When tested in accordance with the procedure given in Annex VII the tyre shall meet the following requirements:
6.4.1.1 In the case of a normal (road type) tyre, the Wet grip index (G) shall be ≥ 1.15 for regular tyres and shall be ≥ 1.25 for exceptional tyres.
6.4.1.2 In the case of a snow tyre, that is, a tyre marked in accordance with paragraph 3.1.5 and that bears a speed symbol indicating a maximum permissible speed not greater than 160km/h (“Q”), the Wet grip index (G) shall be ≥ 1.0.
6.4.1.3 In the case of a Snow tyre, that is, a tyre marked in accordance with paragraph 3.1.5 and that bears a speed symbol indicating a maximum permissible speed greater than 160 km/h (“R” and above, plus “H”) the Wet grip index (G) shall be ≥ 1.1 for regular tyres and shall be ≥ 1.15 for exceptional tyres.
Insert new section 6.5 to read:
6.5 Snow performance for tyres marked as snow tyres
6.5.1 The test of snow performance applies only to tyres of class C1 and C2 (defined in Annex V, paragraph 2.4) that are marked as snow tyres in accordance with paragraph 3.1.5.
The test is based on a procedure that compares the mean fully developed deceleration (mfdd) against values achieved by a Normal Production Reference Tyre (NPRT). The relative performance shall be indicated by a Snow Index (S).
6.5.2 When tested in accordance with the procedure given in Annex VIII, the Snow Index (S) shall be ≥ 1.4 for regular tyres and shall be ≥ 1.6 for exceptional tyres.
______________________________________________________________ SURVEY ON MOTOR VEHICLE TYRES AND RELATED ASPECTS – 2003 -
Page 118
APPENDIX 7
Amend footnote 1) to read:
1) In the case of passenger car tyres intended for vehicles designed for a maximum speed greater than 300 km/h (Z-rated tyres), until uniform test procedures have been agreed the manufacturer of the tyre must satisfy the technical service that his test procedure and results are acceptable.
PART A:
Amend the paragraph 1.2 to read
1.2 It is inflated to the appropriate pressure as given in the table below:
Test pressure [bar]
Diagonal (bias-ply) tyres Radial tyres Bias-belted
tyres
Ply-rating Speed
category
4 6 8 Standard Reinforced Standard
L,M,N 2.3 2.7 3.0 2.4 - -
P,Q,R,S 2.6 3.0 3.3 2.6 3.0 2.6
T,U,H 2.8 3.2 3.5 2.8 3.2 2.8
V 3.0 3.4 3.7 3.0 3.4 -
W,Y - - - 3.2 3.6 -
T-type temporary-use spare tyres: to 4.2 bar
Amend paragraph 2.2 to read:
2.2 Apply to the test axle a load equal to
Amend paragraphs 2.2.1 and 2.2.2 to read:
2.2.1 80% of the maximum load rating equated to the load capacity index for regular tyres with speed symbols L to H inclusive.
2.2.2 80% of the maximum load rating associated with a maximum speed of 240 km/h for regular tyres with speed symbol ‘V’ (see section 2.31.2 of Annex II).
______________________________________________________________ SURVEY ON MOTOR VEHICLE TYRES AND RELATED ASPECTS – 2003 -
Page 119
Insert new paragraphs 2.2.3 to 2.2.8 to read:
2.2.3 80% of the maximum load rating associated with a maximum speed of 270 km/h for regular tyres with speed symbol ‘W’ (see section 2.31.2 of Annex II).
2.2.4 80% of the maximum load rating associated with a maximum speed of 300 km/h for regular tyres with speed symbol ‘Y’ (see section 2.31.2 of Annex II).
2.2.5 85% of the maximum load rating equated to the load capacity index for exceptional tyres with speed symbols L to H inclusive.
2.2.6 85% of the maximum load rating associated with a maximum speed of 240 km/h for exceptional tyres with speed symbol ‘V’ (see section 2.31.2 of Annex II).
2.2.7 85% of the maximum load rating associated with a maximum speed of 270 km/h for exceptional tyres with speed symbol ‘W’ (see section 2.31.2 of Annex II).
2.2.8 85% of the maximum load rating associated with a maximum speed of 270 km/h for exceptional tyres with speed symbol ‘W’ (see section 2.31.2 of Annex II).
Insert new section 2.6
2.6 Subsequent to the test defined in paragraphs 2.1 to 2.5.6, run-flat tyres and run-flat-system tyres shall be tested in deflated state as well. For this test, the following procedure shall be used:
2.6.1 Procedure for load/speed testing of run-flat tyres or run-flat-system tyres
2.6.1.1 The test of a run-flat tyre or a run-flat-system tyre shall be carried out with the same tyre that has been used for the normal load/speed test.
2.6.1.2 In case of a run-flat tyre, the tyre shall be mounted on the test rim specified by the manufacturer pursuant to section 6.11, Annex I, Appendix 1.
2.6.1.3 In case of a run-flat-system tyre, the tyre shall be mounted together with all supporting components required to ensure safe operation in deflated condition over the distance and at the speed as stated by the addition to the tyre size designation defined in Annex II, paragraphs 2.17.2.5 and 2.17.2.6.
Where applicable, the run-flat-system tyre shall be mounted on an adapted test rim/wheel specified by the manufacturer.
2.6.1.4 Before testing, the tyre shall be conditioned in inflated state on the test rig at a speed of half the max. speed indicated by the speed symbol, and under the same load condition as during the normal load/speed test, for 10 minutes. After this, the tyre shall be deflated completely by removing the valve insert.
______________________________________________________________ SURVEY ON MOTOR VEHICLE TYRES AND RELATED ASPECTS – 2003 -
Page 120
2.6.1.5 The assembly shall be mounted on a test axle and pressed against the outer face of a smooth wheel 1.70 m ± 1% or 2 m ± 1% in diameter.
2.6.1.6 For testing, the same load shall be applied as during the normal load/speed test.
2.6.1.7 During the test, the temperature in the test room shall be maintained at a level between 20 ºC and 30 ºC, or higher, if the manufacturer agrees.
2.6.1.8 The test shall be carried out without any interruption in conformance with the following particulars:
2.6.1.8.1 Time taken to pass from zero speed to initial test speed: max. 10 minutes
2.6.1.8.2 Initial speed: prescribed maximum speed for the type of tyre, less 40 km/h in the case of the smooth wheel having a diameter of 1.70 m ± 1%, or less 30 km/h in the case of the smooth wheel having a diameter of 2 m ± 1%
2.6.1.8.3 Time taken to pass from initial speed down to test speed: max. 10 minutes
2.6.1.8.4 Test speed: 1.1 times the maximum permitted run-flat speed defined by the addition to the tyre size designation
e.g. for a run-flat tyre 205/55 RFT 16 91V the test speed is 1.1 x 80 km/h = 88 km/h
2.6.1.8.5 Duration of test 1.1 times the period derived from the quotient of the maximum permissible distance for operation in deflated condition in km, divided by the maximum permissible speed for operation in deflated condition in km/h
e.g. for a run-flat tyre 205/55 RFT 16 91 V the test period is 1.1 x (200 km/ 80 km/h) = 2.75 h
2.6.1.8.6 Other methods than those described in section 2.6.1 may be used, provided their equivalency has been proved.
PART B:
Amend paragraph 2.2 to read
2.2 For regular tyres, apply to the test axle a series of test loads expressed as a percentage of the load indicated in Appendix 2, opposite the load index moulded on the sidewall of the tyre, in accordance with the load/speed test programme shown in the table below.
For exceptional tyres, these test loads shall be increased by 5%. If the tyre has load capacity indices for both single and twin utilization, the reference load for single utilization shall be taken as the basis for the test loads.
80/200
80/200
______________________________________________________________ SURVEY ON MOTOR VEHICLE TYRES AND RELATED ASPECTS – 2003 -
Page 121
ANNEX IV
Insert new paragraph 3.2.4 to read:
3.2.4 In the case of a vehicle belonging to category M1SP or N1SP, for which the vehicle manufacturer has specified the use of certain tyre makes, all tyres fitted to the vehicle must conform to these specifications. The use of tyre makes other than those approved by the vehicle manufacturer is permissible, provided that a document of compliance has been issued for such use. Such document of compliance, following the performance of requisite testing, may be issued either by the vehicle manufacturer, the tyre manufacturer, a national approving authority of a Member State or a certified Technical Service. The document of compliance shall be carried by the vehicle operator at all times.
Insert new section 3.9 to read:
3.9. Specifications for the use of run-flat tyres or run-flat system units
3.9.1 Every vehicle fitted with a run-flat tyre or a run-flat system shall be provided with a tyre pressure monitoring device that gives information to the driver on the inflation condition of the vehicle’s tyres. This device must be able to warn the driver in the event of a loss of inflation pressure below a predetermined limit of one or several tyres within a predetermined time period.
3.9.2 The warning shall be given by audible and/or visual warning signals.
3.9.3 The warning signals shall be released not later than at the point in time when inflation pressure is 30% or more below the normal level. The normal inflation pressure is the pressure given by the vehicle manufacturer for the fitted tyre.
3.9.4 The warning signal(s) must be released not later than 150 seconds after the inflation pressure has dropped below the limit pressure as defined in paragraph 3.9.3.
3.9.5 Procedures to be followed after operating a run-flat tyre or run-flat-system tyre in deflated condition
3.9.5.1 When a run-flat tyre or run-flat-system tyre has been operated in deflated condition, it should only be reused after the tyre has been inspected with respect to defects, punctures and similar types of damage by a duly qualified individual or institution (e.g. skilled tyre technician, authorised garage, Technical Service etc.).
3.9.5.2 Any repair of a run-flat tyre or run-flat-system tyre shall only be carried out, if the tyre manufacturer has permitted such repair for the relevant type of tyre.
______________________________________________________________ SURVEY ON MOTOR VEHICLE TYRES AND RELATED ASPECTS – 2003 -
Page 122
ANNEX V
Amend paragraph 4.2 to read:
4.2. For regular tyres, the noise levels determined in accordance with section 4.5, Appendix 1, shall not exceed the limits defined in sections 4.2.1 to 4.2.3.
For exceptional tyres the limit values defined in sections 4.2.1 to 4.2.3 shall be reduced by 1 db(A).
Insert new Annex VII to read:
ANNEX VII
TEST PROCEDURE FOR MEASURING WET GRIP
1 General Test Conditions
1.1 Track Characteristics
The track shall have a dense asphalt surface with a gradient in any direction not exceeding 2%. It shall be of uniform age, composition, and wear and shall be free of loose material or foreign deposits.
1.1.1 Test method for surface characteristics
The surface friction value for the wetted track shall be established by the British Pendulum Number (BPN) method.
The averaged British Pendulum Number (BPN) of the wetted track, measured in accordance with the procedure given in the American Society for Testing and Materials (ASTM) Standard 303-93 (Re-approved 1998) and using the Pad as specified in ASTM Standard E 501 - 94, shall be between 40 and 60 after temperature correction. Unless temperature correction recommendations are indicated by the pendulum manufacturer, the following formula can be used:
BPN = BPN (Measured value) + 0.34 t − 0.0018 t² − 6.1
where:
t = is the wetted track surface temperature in degrees Celsius [°C]
The BPN shall be measured at intervals of 10 m along the length of the lanes and at 200 mm intervals across the width of the lanes of the track to be used during the wet grip tests. The BPN shall be measured 5 times at each point and the coefficient of variation of the BPN averages shall not exceed 10%.
1.1.2 The type approval authority shall satisfy itself of the characteristics of the track on the basis of evidence produced in test reports.
______________________________________________________________ SURVEY ON MOTOR VEHICLE TYRES AND RELATED ASPECTS – 2003 -
Page 123
1.2 Wetting conditions
The surface may be wetted from the track-side or by a wetting system incorporated into the test vehicle or the trailer.
If a track-side system is used, the test surface shall be wetted for at least half an hour prior to testing in order to equalise the surface temperature and water temperature. It is recommended that track-side wetting be continuously applied throughout testing.
The water depth shall be between 0.5 and 1.5 mm.
1.3 The wind conditions shall not interfere with wetting of the surface (wind-shields are permitted).
The wetted surface temperature shall be between 10°C and 35°C and shall not vary during the test by more than 10°C (the lower temperature may be 5°C in case of snow tyres.)
2 Test Procedure
The comparative wet grip performance shall be established, using a standard production passenger carrying vehicle (M1 category as defined in the Consolidated Resolution on the Construction of Vehicles (RE 3) contained in document TRANS/WP.29/78/Rev.1.).
2.1 The vehicle shall be a standard M1 Category vehicle, capable of a minimum speed of 90km/h and equipped with an anti-lock braking system (ABS).
2.1.1 The vehicle shall not be modified except:
- to allow the fitting of an increased range of wheel and tyre sizes
- to allow mechanical (including hydraulic, electrical or pneumatic) operation of the service brake control. The system may be operated automatically by signals from devices incorporated in, or adjacent to, the track.
2.2 Test procedure
2.2.1 Tyre conditioning
Candidate tyre and SRTT shall be ‘run-in’ over a distance of 100 – 150 km on normal roads prior to testing to remove compound nodules or other tyre pattern characteristics resulting from the moulding process. The tyres fitted to the test vehicle shall rotate in the same direction and be mounted on the same position as when they were run-in. Candidate tyres that have already been used for the rolling noise tests and (if applicable) for snow performance tests as described in Annex V and VIII may be used for wet grip performance tests.
______________________________________________________________ SURVEY ON MOTOR VEHICLE TYRES AND RELATED ASPECTS – 2003 -
Page 124
2.2.3 The tyres shall be mounted on the test rim declared by the tyre manufacturer in the approval application and shall be inflated to the same inflation values as for the rolling noise measurements (see Annex V, paragraph 2.5.3).
2.2.4 The tyres shall be conditioned for a minimum of two hours adjacent to the test track such that it is stabilised at the ambient temperature of the test track area.
2.2.5 The static load on the tyre shall be:
- between 381 kg and 572 kg in the case of the SRTT and
- between 60% and 90% of the load value corresponding to the Load Index of the tyre in any other case.
The variation in load on tyres on the same axle shall be such that the load borne by the more lightly loaded tyre shall not be less than 90% of that of the tyre bearing the greater load.
2.2.6 Shortly before testing, the track shall be conditioned by carrying out at least ten braking tests from 90 km/h to 20 km/h on the part of the track to be used for the performance test programme but using tyres not involved in that programme.
2.2.7 Immediately prior to testing, the tyre inflation pressure shall be checked and reset, if necessary, to the values given in 2.2.4
2.2.8 Starting from an initial speed of between 87 km/h and 83 km/h, a constant force sufficient to cause operation of the ABS on all wheels of the vehicle and to result in stable deceleration of the vehicle prior to the speed being reduced to 80 km/h, shall be applied to the service brake control and this force shall be maintained until the vehicle has been brought to rest.
The braking test shall be carried out with the clutch of a manual transmission disengaged or with the selector of an automatic transmission in the neutral position.
2.2.9 The direction of the test shall be the same for each set of tests and shall be the same for the candidate test tyre as that used for the SRTT with which its performance is to be compared.
2.2.10 In the case of new tyres, two test runs shall be carried out to condition the tyres. These tests may be used to check the operation of the recording equipment but the results shall not be taken into account in the performance assessment.
2.2.11 Each SRTT shall be discarded after a maximum of 60 braking test runs.
______________________________________________________________ SURVEY ON MOTOR VEHICLE TYRES AND RELATED ASPECTS – 2003 -
Page 125
2.2.12 For the evaluation of the performance of any tyre compared with that of the SRTT, the braking test shall be carried out from the same point and in the same lane of the test track.
2.2.13 The order of testing shall be:
R1 – T – R2 where
R1 is the initial test of the SRTT, R2 is the repeat test of the SRTT and T is the test of the candidate tyre to be evaluated.
A maximum of three candidate tyres may be tested before repeating the SRTT test, for example:
R1–T1 – T2 – T3 - R2
2.2.14 The mean fully developed deceleration (mfdd) between 80km/h and 20km/h shall be calculated for at least three valid results in the case of the SRTT and 6 valid results in the case of the candidate tyres.
The mean fully developed deceleration (mfdd) is given by:
AD = 231.48 / SW where:
SW is the measured stopping distance between 80km/h and 20km/h.
For results to be considered to be valid, the coefficient of variation as determined by the standard deviation divided by the average result, expressed as a percentage, shall be within 3%. If this is cannot achieved with the repeat testing of the SRTT, the evaluation of the candidate tyre(s) shall be discarded and the entire order of testing shall be repeated.
The results shall be invalid if the initial and repeat tests of the SRTT are not within 2.5% of each other.
The average of the calculated values of mfdd shall be determined for each series of test runs.
2.2.15 Using the value of the average mfdd for each series of test runs:
In the case of the order of testing R1 – T – R2, the mfdd of the SRTT to be used in the comparison of the performance of the candidate tyre shall be taken to be:
(R1 + R2)/2 where
R1 is the average mfdd for the first series of test runs of the SRTT and R2 is the average mfdd for the second series of test runs of the SRTT.
______________________________________________________________ SURVEY ON MOTOR VEHICLE TYRES AND RELATED ASPECTS – 2003 -
Page 126
In the case of the order of testing R1 – T1 – T2 – R2, the mfdd of the SRTT shall be taken to be:
2/3R1 + 1/3R2 for comparison with the candidate tyre T1 and
1/3R1 + 2/3R2 for comparison with the candidate tyre T2.
In the case of the order of testing R1 – T1 – T2 – T3 – R2, the mfdd of the SRTT shall be taken to be:
3/4R1 + 1/4R2 for comparison with the candidate tyre T1
(R1 + R2)/2 for comparison with the candidate tyre T2 and
1/4R1 + 3/4R2 for comparison with the candidate tyre T3.
2.2.16 The wet grip index (G) shall be calculated as:
G = average mfdd of candidate tyre ÷ mfdd of SRTT
2.2.17 In the case where the candidate tyres cannot be fitted to the same vehicle as the SRTT, for example, due to tyre size, inability to achieve required loading and so on, comparison shall be made using intermediate tyres, hereinafter referred to as “control tyres”, and two different vehicles. One vehicle shall be capable of being fitted with the SRTT and the control tyre and the other vehicle shall be capable of being fitted with the control tyre and the candidate tyre.
The wet grip index of the control tyre relative to the SRTT (G1) and of the candidate tyre relative to the control tyre (G2) shall be established using the procedure in 2.2.1 to 2.2.16.
The wet grip index of the candidate tyre relative to the SRTT shall be the product of the two resulting wet grip indices, that is G1 x G2.
2.2.17.1 The track, and the portion of the track, shall be the same for all of the tests and the ambient conditions shall be comparable, for example, the surface temperature of the wetted track shall be within ± 5°C. All tests shall be completed within the same day.
2.2.17.2 The same set of control tyres shall be used for comparison with the SRTT and with the candidate tyre and shall be fitted in the same wheel positions.
2.2.17.3 Control tyres that have been used for testing shall subsequently be stored under the same conditions as required for the SRTT, that is, in accordance with ASTM E 1136 – 93 (Re-approved in 1998).
2.2.17.4 Control tyres shall be discarded if there is irregular wear or damage or when the performance appears to have deteriorated.
______________________________________________________________ SURVEY ON MOTOR VEHICLE TYRES AND RELATED ASPECTS – 2003 -
Page 127
Insert new Annex VIII to read:
ANNEX VIII
TEST PROCEDURE FOR MEASURING SNOW PERFORMANCE
1. General Test Conditions
1.1 Track and environmental characteristics
The track shall have an asphalt or ice surface fully covered with a layer of packed snow and a gradient in any direction not exceeding 2%. The layer of snow must be of a kind ensuring that the sub-surface does not emerge throughout the test. If required, regular re-preparation of the snow surface between the test of two tyres is permitted. The layer of snow shall be of uniform composition throughout the tests and shall be free of foreign deposits (e.g. gravel, ice chunks, etc).
The suitability of the track to serve as test track for an approval test in accordance with this Annex shall be verified by means of the candidate tyre and the NPRT. As long as the mean fully developed deceleration does not exceed 4.5 m/s² for the candidate tyre and 3 m/s² for the NPRT and does not fall below 2 m/s² for the candidate tyre and 1.33 m/s² for the NPRT in a pre-test carried out in the same manner as the approval test, a valid approval test may be carried out.
The snow surface temperature shall be between –15°C and -3°C and shall not vary during the test by more than 5°C.
The ambient air temperature shall be between –20°C and 0°C and shall not vary during the test by more than 10°C.
2 Test Procedure
The comparative snow performance shall be established, using a standard production passenger carrying vehicle and doing a braking test of the candidate tyre against a normal production reference tyre (NPRT). The vehicle shall be a standard M1 Category vehicle, capable of a minimum speed of 90 km/h and equipped with an anti-lock braking system (ABS).
2.1 The vehicle shall not be modified except:
- to allow the fitting of an increased range of wheel and tyre sizes
- to allow mechanical (including hydraulic, electrical or pneumatic) operation of the service brake control. The system may be operated automatically by signals from devices incorporated in, or adjacent to, the track.
______________________________________________________________ SURVEY ON MOTOR VEHICLE TYRES AND RELATED ASPECTS – 2003 -
Page 128
2.2 Selection of a Normal Production Reference Tyre (NPRT)
2.2.1 An appropriate NPRT as defined in Annex II, paragraph 2.44, shall be selected by the Type Approval Authority or the operating Technical Service. The selection shall be made only after consultation with the manufacturer of the candidate tyre.
2.2.2 The NPRT shall be provided by the manufacturer of the candidate tyre or the operating Technical Service. In case the NPRT is provided by the manufacturer, it shall be a tyre that is not produced by the manufacturer of the candidate tyre or a company that belongs to, is associated or affiliated with, or linked by any other close business relation to the manufacturer of the candidate tyre. In case the tyre is provided by the operating Technical Service, these restrictions do not apply.
2.3. Tyre conditioning
Candidate tyre and NPRT shall be ‘run in’ over a distance of 100 – 150 km on normal roads prior to testing to remove compound nodules or other tyre pattern characteristics resulting from the moulding process. The tyres fitted to the test vehicle shall rotate in the same direction and be mounted at the same position as during the run-in period. Test tyres used for the rolling noise tests as described in Annex V may be re-used for snow performance tests and vice versa. Candidate tyres used for snow performance tests and/or rolling noise measurements may later be re-used for wet grip measurements in accordance with annex VII.
2.2.3 The tyres shall be mounted on the test rim declared by the tyre manufacturer in the approval application and shall be inflated to the same inflation values as for the rolling noise measurements (see Annex V, paragraph 2.5.3).
2.2.4 The tyres shall be conditioned for a minimum of one hour adjacent to the test track such that it is stabilised at the ambient temperature of the test track area.
2.2.5 The static load on the candidate tyre and NPRT shall be between 60% and 90% of the load value corresponding to the Load Index of the tyre.
The variation in load on tyres on the same axle shall be such that the load borne by the more lightly loaded tyre shall not be less than 90% of that of the tyre bearing the greater load.
2.2.6 Immediately prior to testing, the tyre inflation pressure shall be checked and reset, if necessary, to the values defined in 2.2.3.
______________________________________________________________ SURVEY ON MOTOR VEHICLE TYRES AND RELATED ASPECTS – 2003 -
Page 129
2.2.7 Starting from an initial speed of between 45 km/h and 40 km/h, a constant force sufficient to cause operation of the ABS on all wheels of the vehicle and to result in stable deceleration of the vehicle prior to the speed being reduced to 35 km/h, shall be applied to the service brake control and this force shall be maintained until the vehicle has been brought to rest.
The braking test shall be carried out with the clutch of a manual transmission disengaged or with the selector of an automatic transmission in the neutral position.
2.2.8 The direction of the test shall be the same for each set of tests and shall be the same for the test tyre as that used for the reference tyre with which its performance is to be compared.
2.2.9 Before the test, two runs shall be carried out to condition the tyres. These tests may be used to check the operation of the recording equipment but the results shall not be taken into account in the performance assessment.
2.2.10 Each tyre shall ideally be tested on an unused or freshly prepared part of the track, providing the same starting conditions for each tyre.
2.2.11 The order of testing shall be:
R1 – T – R2 where
R1 is the initial test of the NPRT, R2 is the repeat test of the NPRT and T is the test of the candidate tyre to be evaluated.
A maximum of two candidate tyres may be tested before repeating the NPRT test, for example:
R1–T1 – T2 – R2
2.2.14 The mean fully developed deceleration (mfdd) between 35 km/h and 10 km/h shall be calculated for at least 6 valid results
The mean fully developed deceleration (mfdd) is given by:
AD = 43.40 / SS where
SS is the measured stopping distance between 35 km/h and 10 km/h.
For results to be considered to be valid, the coefficient of variation as determined by the standard deviation divided by the average result, expressed as a percentage, shall be within 5%. If this is cannot be achieved with the repeat testing of the NPRT, the evaluation of the candidate tyre(s) shall be discarded and the entire order of testing shall be repeated.
______________________________________________________________ SURVEY ON MOTOR VEHICLE TYRES AND RELATED ASPECTS – 2003 -
Page 130
The results shall be invalid if the initial and repeat tests of the NPRT are not within 15% of each other.
The average of the calculated values of mfdd shall be determined for each series of test runs.
2.2.15 Using the value of the average mfdd for each series of test runs:
In the case of the order of testing R1 – T – R2, the mfdd of the NPRT to be used in the comparison of the performance of the candidate tyre shall be taken to be:
(R1 + R2)/2 where
R1 is the average mfdd for the first series of test runs of the NPRT and R2 is the average mfdd for the second series of test runs of the NPRT.
In the case of the order of testing R1 – T1 – T2 – R2, the mfdd of the NPRT shall be taken to be:
2/3R1 + 1/3R2 for comparison with the candidate tyre T1 and
1/3R1 + 2/3R2 for comparison with the candidate tyre T2
2.2.16 The snow index (S) shall be calculated as:
S = average mfdd of candidate tyre ÷ mfdd of NPRT
2.2.17 The track shall be the same for all of the tests. Ideally, the tests are conducted at times when the test track is not exposed to direct sunlight (e.g. overcast sky). All tests shall be completed within the same day.
4.3 RECOMMENDATIONS FOR CHANGES TO LEGISLATION (MOTORCYCLES)
4.3.1 CHANGES TO DIRECTIVE 2002/24/EC
Changes refer to Directive 2002/24/EC dated 1 November 2003.
ANNEX II
Part 1
Insert new paragraph 5.2.7 to read:
5.2.7 Tyre make combination(s) approved by the vehicle manufacturer for the vehicle m)
______________________________________________________________ SURVEY ON MOTOR VEHICLE TYRES AND RELATED ASPECTS – 2003 -
Page 131
Insert the following new footnote m)
m) Shall only apply to Class Le3 vehicles for which the vehicle manufacturer, for reasons of driving and traffic safety, may optionally approve the combination of certain tyre makes. The possible use of other tyre makes and combinations thereof has been set forth in Directive 97/24 EEC, annex III, paragraph 1.2.4.
ANNEX IV
Amend item 32, page 2, to read:
32 Tyre size designations:
Axle 1:……………………………………… Axle 2:…………………………………………
In the event of restrictions to combinations of certain tyre makes (a minimum of two approved combinations must be stated):
Combination 1 Axle 1:............................... Axle 2:...............................
Combination 2 Axle 1:..................…….....… Axle 2:...............................
(this list may be expanded by other combinations, if applicable)
4.3.2 CHANGES TO DIRECTIVE 97/24/EC
Annex III
Insert the following new paragraph 1.2.4:
1.2.4 In the case of Class L3e motorcycles (as defined by Directive 2002/24 EC, chapter 1, article 1, paragraph 2, sub-paragraph b) for which the vehicle manufacturer, for reasons of driving and traffic safety, has restricted the tyres to be used to one or several combinations of certain tyre makes, the tyres fitted to the vehicle must conform to these specifications. The use of tyre makes other than those approved by the vehicle manufacturer is permissible, provided that a document of compliance has been issued for such use. Such document of compliance, following the performance of requisite testing, may be issued either by the vehicle manufacturer, the tyre manufacturer, a national approving authority of a Member State or a certified Technical Service. The document of compliance shall be carried by the vehicle operator at all times.
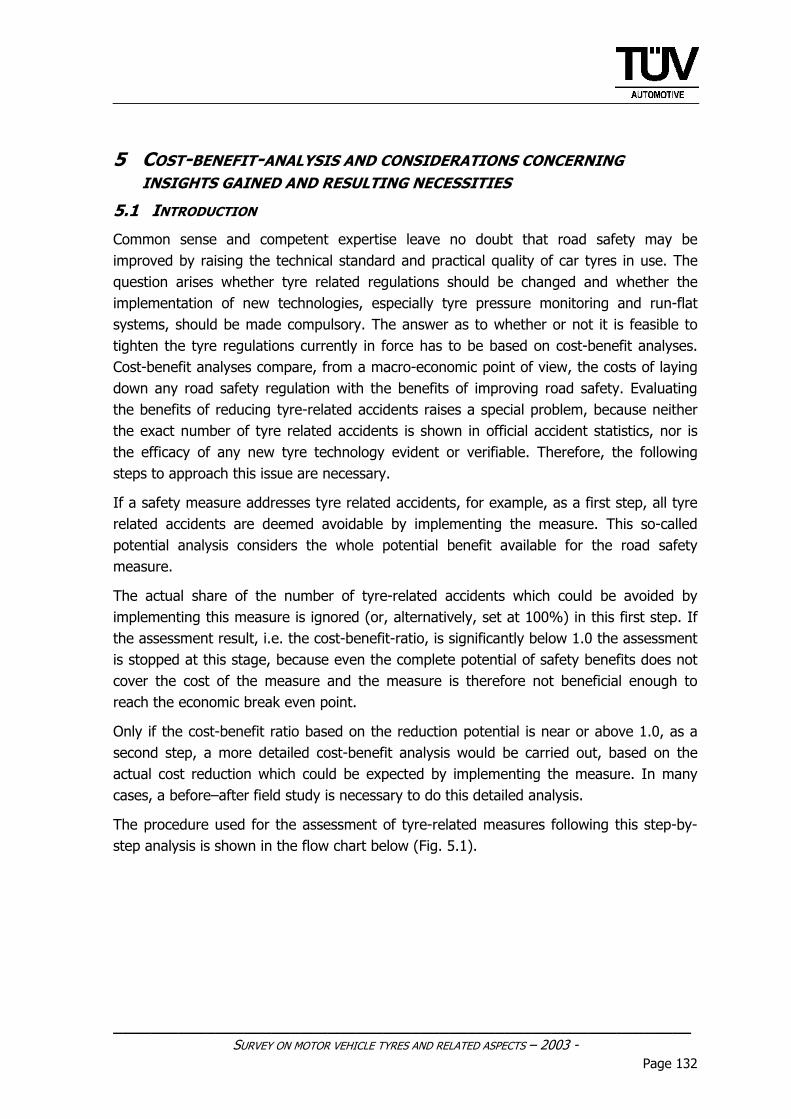
______________________________________________________________ SURVEY ON MOTOR VEHICLE TYRES AND RELATED ASPECTS – 2003 -
Page 132
5 COST-BENEFIT-ANALYSIS AND CONSIDERATIONS CONCERNING INSIGHTS GAINED AND RESULTING NECESSITIES
5.1 INTRODUCTION
Common sense and competent expertise leave no doubt that road safety may be improved by raising the technical standard and practical quality of car tyres in use. The question arises whether tyre related regulations should be changed and whether the implementation of new technologies, especially tyre pressure monitoring and run-flat systems, should be made compulsory. The answer as to whether or not it is feasible to tighten the tyre regulations currently in force has to be based on cost-benefit analyses. Cost-benefit analyses compare, from a macro-economic point of view, the costs of laying down any road safety regulation with the benefits of improving road safety. Evaluating the benefits of reducing tyre-related accidents raises a special problem, because neither the exact number of tyre related accidents is shown in official accident statistics, nor is the efficacy of any new tyre technology evident or verifiable. Therefore, the following steps to approach this issue are necessary.
If a safety measure addresses tyre related accidents, for example, as a first step, all tyre related accidents are deemed avoidable by implementing the measure. This so-called potential analysis considers the whole potential benefit available for the road safety measure.
The actual share of the number of tyre-related accidents which could be avoided by implementing this measure is ignored (or, alternatively, set at 100%) in this first step. If the assessment result, i.e. the cost-benefit-ratio, is significantly below 1.0 the assessment is stopped at this stage, because even the complete potential of safety benefits does not cover the cost of the measure and the measure is therefore not beneficial enough to reach the economic break even point.
Only if the cost-benefit ratio based on the reduction potential is near or above 1.0, as a second step, a more detailed cost-benefit analysis would be carried out, based on the actual cost reduction which could be expected by implementing the measure. In many cases, a before–after field study is necessary to do this detailed analysis.
The procedure used for the assessment of tyre-related measures following this step-by-step analysis is shown in the flow chart below (Fig. 5.1).
______________________________________________________________ SURVEY ON MOTOR VEHICLE TYRES AND RELATED ASPECTS – 2003 -
Page 133
ReductionPotential
Benefits Costs
CBA1st stage
BCR >= 1,0 BCR < 1,0 Stop
RealReduction
CBA
BCR < 1,0BCR >= 1,0
Recommendation Rejection
2nd stage
Rejection
Figure 5.1: Assessment procedure (flow chart)
The following tyre-related safety measures were evaluated by this CBA approach:
• raising the legal minimum tread depth
• large-scale introduction of tyre-related technologies (active and passive tyre pressure monitoring systems, run-flat technology).
The analyses and evaluations concerning these measures should refer to the European Community of 15 countries and therefore be based on an adequate database. An inquiry with the European accident database, CARE, resulted in the conclusion that breaking
______________________________________________________________ SURVEY ON MOTOR VEHICLE TYRES AND RELATED ASPECTS – 2003 -
Page 134
down the European accident data by causes of accidents related to tyre failure is not possible. Even information on the number of accidents due to any type of technical failure is not available in CARE (Community Road Accident Database).
Neither does IRTAD (International Road Transport and Accident Database) - an international database run by OECD and hosted by BASt - provide the information needed for CBA on tyre related improvements. IRTAD is an international database that explicitly looks at international comparability of data on roads, traffic and accidents. Even if national definitions differ, comparability is sometimes induced by internationally agreed adjustment factors. Nevertheless, the IRTAD-data set is limited to comparable and reliable data variables. Information concerning the causes of accidents or technical/maintenance faults has not been included due to widely differing definitions. Therefore, the following analyses could only be based on German accident statistics, which allows a break-down by tyre-related technical causes of accidents. Because of this lack of European data, the calculations refer to Germany only.
Nevertheless, this inevitable weakness allows a decisive interpretation of the results and valid conclusions for Europe at large because this constraint does not influence the results of the CBA to an unacceptable degree. There is obviously no evidence that the technical and economical circumstances in Germany differ fundamentally from the mean standard in the European Community in general, and there is consequently no reason to expect that the cost-benefit ratio of the technical measures under discussion could considerably deviate from the facts given in Germany. If, for example, a few European countries had - due to lower (respectively higher) tyre quality - relatively more (respectively less) tyre-related accidents, any tyre-related safety measures to improve the tyre standard in those countries would result in higher (respectively lower) costs as well as in higher (respectively lower) safety benefits than a respectively equal measure introduced in Germany would. This means that the cost and benefits would be influenced in the same direction. In any event, the cost-benefit ratio would be affected to a lesser or greater extent by a rather negligible degree, only. The result of CBA based on German accident cost and tyre figures and prices can therefore be used as a well-founded decision base for answering the question as to whether or not a considerable improvement of regulations would be feasible.
5.2 INCREASED MINUMUM TREAD DEPTH
An increase of minimum tread depth would reduce the levels of tyre utilisation. The level of reduction depends on the definition of the new minimum tread depth.
To carry out a cost-benefit analysis the following assumptions were made:
• Legal minimum tread depth is raised from 1.6 mm to 2.5 mm for normal tyres and to 4 mm for snow tyres. For calculations, an average value of 3 mm was assumed.
• Start date: January 1st, 2003
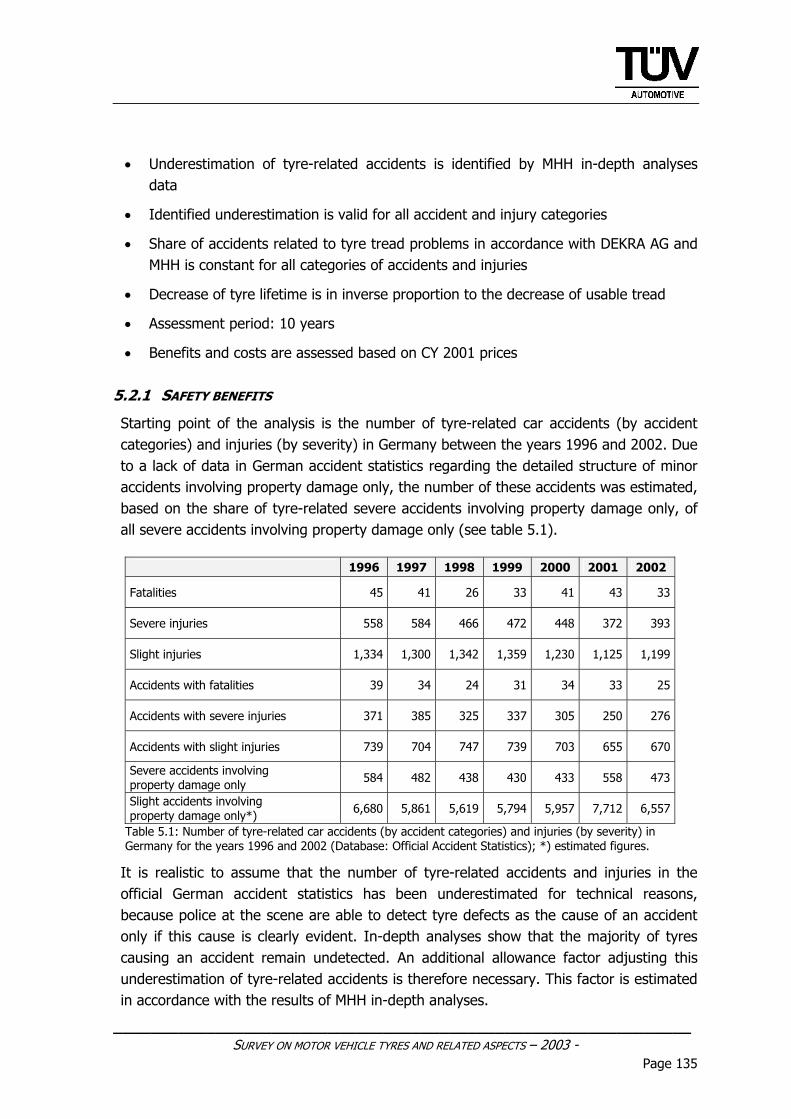
______________________________________________________________ SURVEY ON MOTOR VEHICLE TYRES AND RELATED ASPECTS – 2003 -
Page 135
• Underestimation of tyre-related accidents is identified by MHH in-depth analyses data
• Identified underestimation is valid for all accident and injury categories
• Share of accidents related to tyre tread problems in accordance with DEKRA AG and MHH is constant for all categories of accidents and injuries
• Decrease of tyre lifetime is in inverse proportion to the decrease of usable tread
• Assessment period: 10 years
• Benefits and costs are assessed based on CY 2001 prices 5.2.1 SAFETY BENEFITS
Starting point of the analysis is the number of tyre-related car accidents (by accident categories) and injuries (by severity) in Germany between the years 1996 and 2002. Due to a lack of data in German accident statistics regarding the detailed structure of minor accidents involving property damage only, the number of these accidents was estimated, based on the share of tyre-related severe accidents involving property damage only, of all severe accidents involving property damage only (see table 5.1).
1996 1997 1998 1999 2000 2001 2002
Fatalities 45 41 26 33 41 43 33
Severe injuries 558 584 466 472 448 372 393
Slight injuries 1,334 1,300 1,342 1,359 1,230 1,125 1,199
Accidents with fatalities 39 34 24 31 34 33 25
Accidents with severe injuries 371 385 325 337 305 250 276
Accidents with slight injuries 739 704 747 739 703 655 670
Severe accidents involving property damage only 584 482 438 430 433 558 473
Slight accidents involving property damage only*) 6,680 5,861 5,619 5,794 5,957 7,712 6,557
Table 5.1: Number of tyre-related car accidents (by accident categories) and injuries (by severity) in Germany for the years 1996 and 2002 (Database: Official Accident Statistics); *) estimated figures.
It is realistic to assume that the number of tyre-related accidents and injuries in the official German accident statistics has been underestimated for technical reasons, because police at the scene are able to detect tyre defects as the cause of an accident only if this cause is clearly evident. In-depth analyses show that the majority of tyres causing an accident remain undetected. An additional allowance factor adjusting this underestimation of tyre-related accidents is therefore necessary. This factor is estimated in accordance with the results of MHH in-depth analyses.
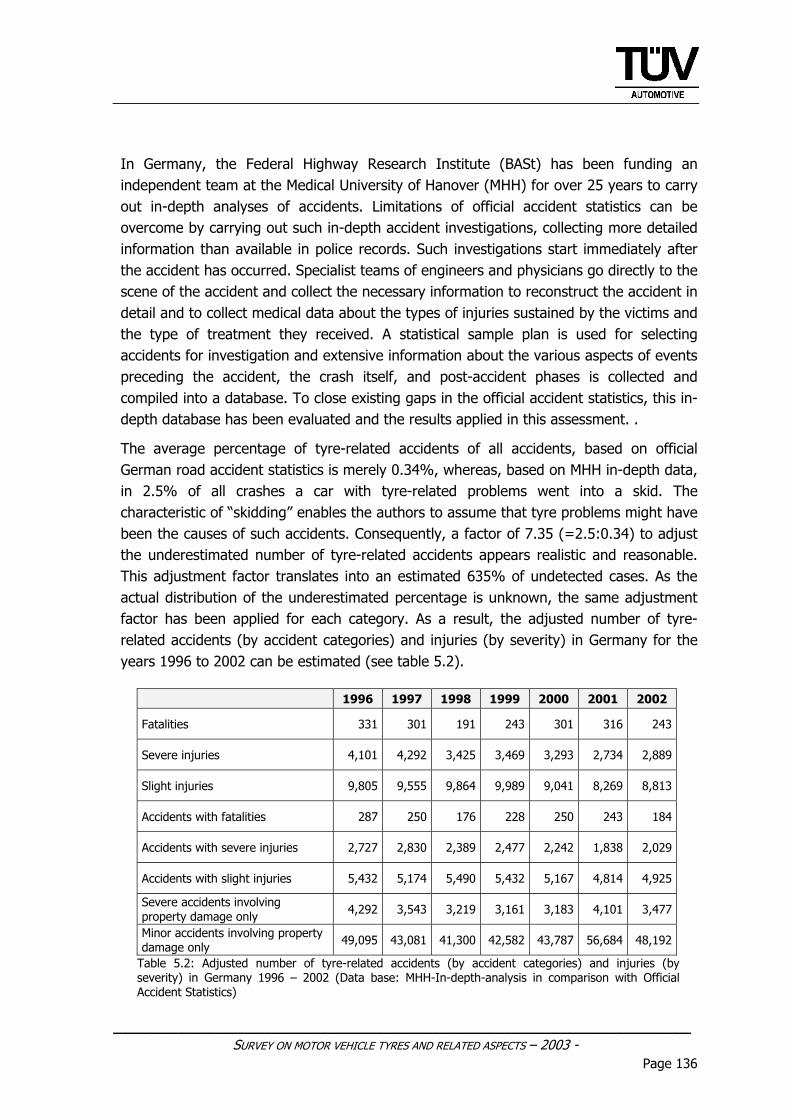
______________________________________________________________ SURVEY ON MOTOR VEHICLE TYRES AND RELATED ASPECTS – 2003 -
Page 136
In Germany, the Federal Highway Research Institute (BASt) has been funding an independent team at the Medical University of Hanover (MHH) for over 25 years to carry out in-depth analyses of accidents. Limitations of official accident statistics can be overcome by carrying out such in-depth accident investigations, collecting more detailed information than available in police records. Such investigations start immediately after the accident has occurred. Specialist teams of engineers and physicians go directly to the scene of the accident and collect the necessary information to reconstruct the accident in detail and to collect medical data about the types of injuries sustained by the victims and the type of treatment they received. A statistical sample plan is used for selecting accidents for investigation and extensive information about the various aspects of events preceding the accident, the crash itself, and post-accident phases is collected and compiled into a database. To close existing gaps in the official accident statistics, this in-depth database has been evaluated and the results applied in this assessment. .
The average percentage of tyre-related accidents of all accidents, based on official German road accident statistics is merely 0.34%, whereas, based on MHH in-depth data, in 2.5% of all crashes a car with tyre-related problems went into a skid. The characteristic of “skidding” enables the authors to assume that tyre problems might have been the causes of such accidents. Consequently, a factor of 7.35 (=2.5:0.34) to adjust the underestimated number of tyre-related accidents appears realistic and reasonable. This adjustment factor translates into an estimated 635% of undetected cases. As the actual distribution of the underestimated percentage is unknown, the same adjustment factor has been applied for each category. As a result, the adjusted number of tyre-related accidents (by accident categories) and injuries (by severity) in Germany for the years 1996 to 2002 can be estimated (see table 5.2).
1996 1997 1998 1999 2000 2001 2002
Fatalities 331 301 191 243 301 316 243
Severe injuries 4,101 4,292 3,425 3,469 3,293 2,734 2,889
Slight injuries 9,805 9,555 9,864 9,989 9,041 8,269 8,813
Accidents with fatalities 287 250 176 228 250 243 184
Accidents with severe injuries 2,727 2,830 2,389 2,477 2,242 1,838 2,029
Accidents with slight injuries 5,432 5,174 5,490 5,432 5,167 4,814 4,925
Severe accidents involving property damage only 4,292 3,543 3,219 3,161 3,183 4,101 3,477
Minor accidents involving property damage only 49,095 43,081 41,300 42,582 43,787 56,684 48,192
Table 5.2: Adjusted number of tyre-related accidents (by accident categories) and injuries (by severity) in Germany 1996 – 2002 (Data base: MHH-In-depth-analysis in comparison with Official Accident Statistics)
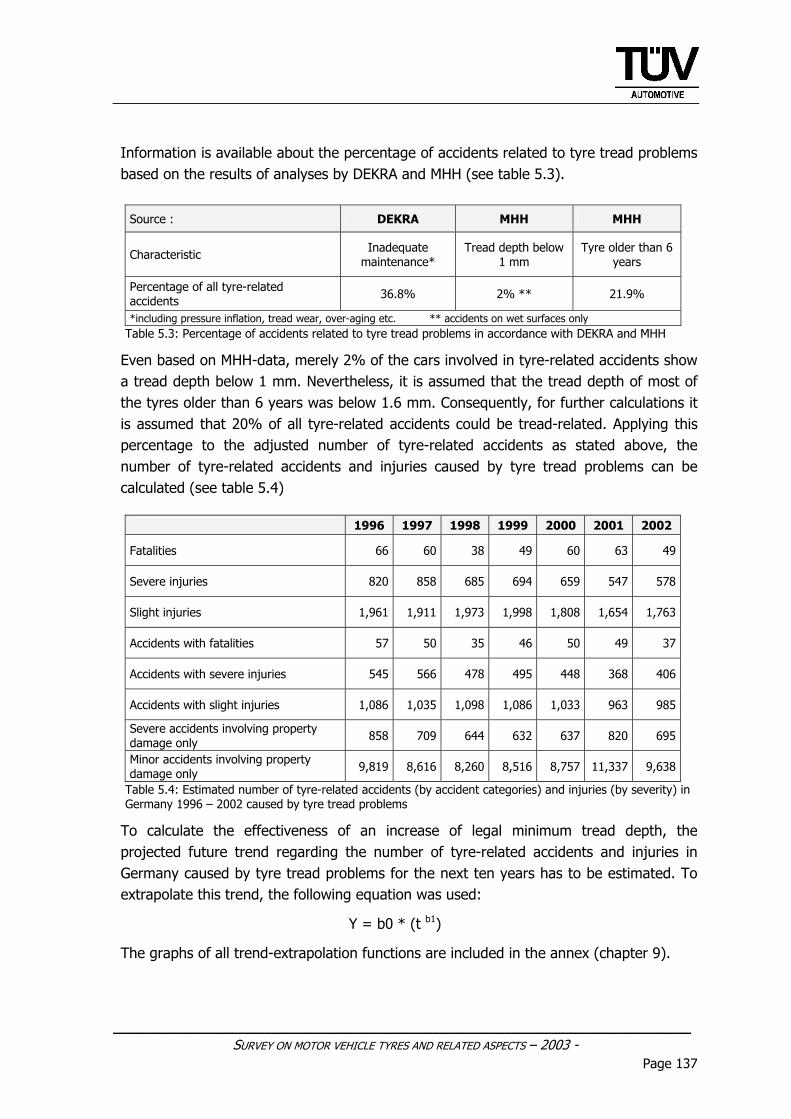
______________________________________________________________ SURVEY ON MOTOR VEHICLE TYRES AND RELATED ASPECTS – 2003 -
Page 137
Information is available about the percentage of accidents related to tyre tread problems based on the results of analyses by DEKRA and MHH (see table 5.3).
Source : DEKRA MHH MHH
Characteristic Inadequate maintenance*
Tread depth below 1 mm
Tyre older than 6 years
Percentage of all tyre-related accidents 36.8% 2% ** 21.9%
*including pressure inflation, tread wear, over-aging etc. ** accidents on wet surfaces only Table 5.3: Percentage of accidents related to tyre tread problems in accordance with DEKRA and MHH
Even based on MHH-data, merely 2% of the cars involved in tyre-related accidents show a tread depth below 1 mm. Nevertheless, it is assumed that the tread depth of most of the tyres older than 6 years was below 1.6 mm. Consequently, for further calculations it is assumed that 20% of all tyre-related accidents could be tread-related. Applying this percentage to the adjusted number of tyre-related accidents as stated above, the number of tyre-related accidents and injuries caused by tyre tread problems can be calculated (see table 5.4)
1996 1997 1998 1999 2000 2001 2002
Fatalities 66 60 38 49 60 63 49
Severe injuries 820 858 685 694 659 547 578
Slight injuries 1,961 1,911 1,973 1,998 1,808 1,654 1,763
Accidents with fatalities 57 50 35 46 50 49 37
Accidents with severe injuries 545 566 478 495 448 368 406
Accidents with slight injuries 1,086 1,035 1,098 1,086 1,033 963 985
Severe accidents involving property damage only 858 709 644 632 637 820 695
Minor accidents involving property damage only 9,819 8,616 8,260 8,516 8,757 11,337 9,638
Table 5.4: Estimated number of tyre-related accidents (by accident categories) and injuries (by severity) in Germany 1996 – 2002 caused by tyre tread problems
To calculate the effectiveness of an increase of legal minimum tread depth, the projected future trend regarding the number of tyre-related accidents and injuries in Germany caused by tyre tread problems for the next ten years has to be estimated. To extrapolate this trend, the following equation was used:
Y = b0 * (t b1)
The graphs of all trend-extrapolation functions are included in the annex (chapter 9).
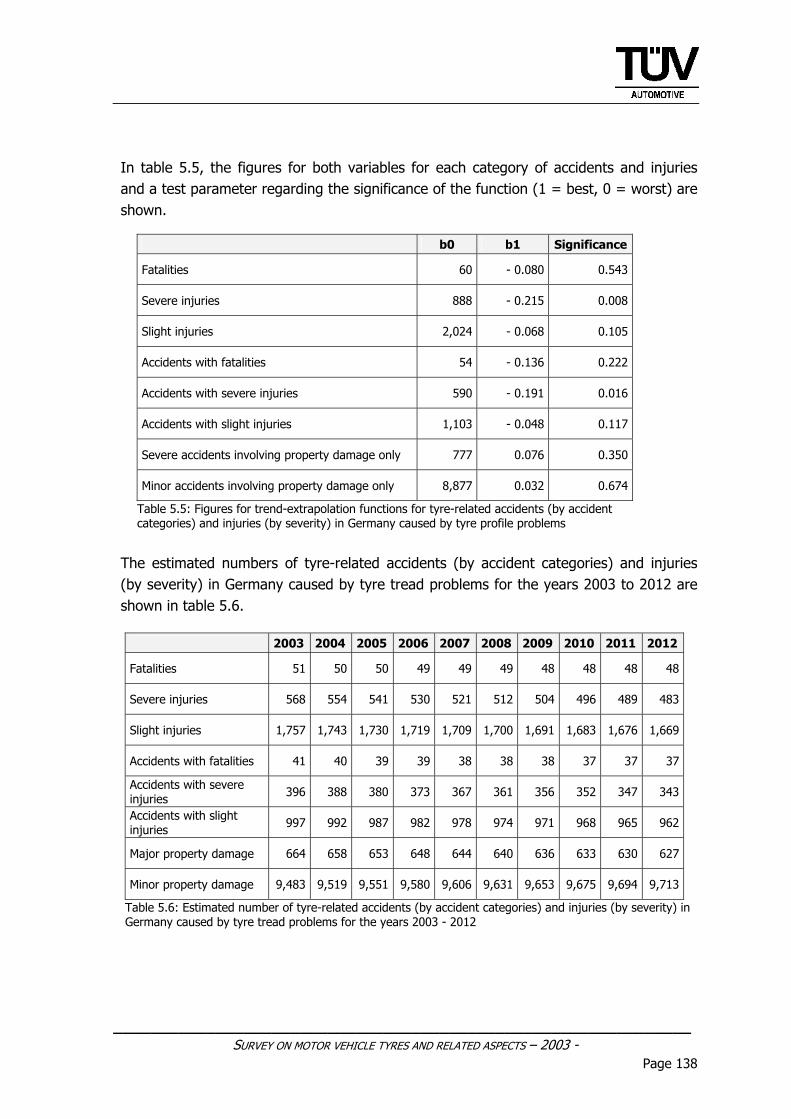
______________________________________________________________ SURVEY ON MOTOR VEHICLE TYRES AND RELATED ASPECTS – 2003 -
Page 138
In table 5.5, the figures for both variables for each category of accidents and injuries and a test parameter regarding the significance of the function (1 = best, 0 = worst) are shown.
b0 b1 Significance
Fatalities 60 - 0.080 0.543
Severe injuries 888 - 0.215 0.008
Slight injuries 2,024 - 0.068 0.105
Accidents with fatalities 54 - 0.136 0.222
Accidents with severe injuries 590 - 0.191 0.016
Accidents with slight injuries 1,103 - 0.048 0.117
Severe accidents involving property damage only 777 0.076 0.350
Minor accidents involving property damage only 8,877 0.032 0.674
Table 5.5: Figures for trend-extrapolation functions for tyre-related accidents (by accident categories) and injuries (by severity) in Germany caused by tyre profile problems
The estimated numbers of tyre-related accidents (by accident categories) and injuries (by severity) in Germany caused by tyre tread problems for the years 2003 to 2012 are shown in table 5.6.
2003 2004 2005 2006 2007 2008 2009 2010 2011 2012
Fatalities 51 50 50 49 49 49 48 48 48 48
Severe injuries 568 554 541 530 521 512 504 496 489 483
Slight injuries 1,757 1,743 1,730 1,719 1,709 1,700 1,691 1,683 1,676 1,669
Accidents with fatalities 41 40 39 39 38 38 38 37 37 37
Accidents with severe injuries 396 388 380 373 367 361 356 352 347 343
Accidents with slight injuries 997 992 987 982 978 974 971 968 965 962
Major property damage 664 658 653 648 644 640 636 633 630 627
Minor property damage 9,483 9,519 9,551 9,580 9,606 9,631 9,653 9,675 9,694 9,713
Table 5.6: Estimated number of tyre-related accidents (by accident categories) and injuries (by severity) in Germany caused by tyre tread problems for the years 2003 - 2012
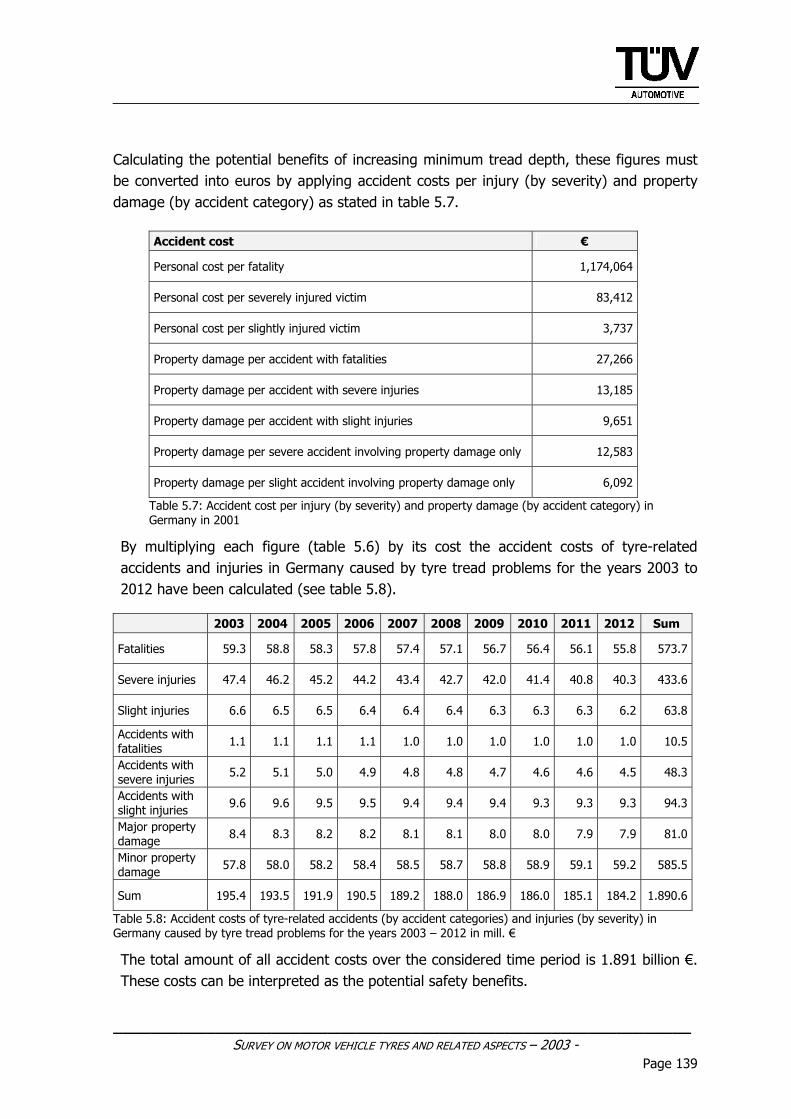
______________________________________________________________ SURVEY ON MOTOR VEHICLE TYRES AND RELATED ASPECTS – 2003 -
Page 139
Calculating the potential benefits of increasing minimum tread depth, these figures must be converted into euros by applying accident costs per injury (by severity) and property damage (by accident category) as stated in table 5.7.
Accident cost €
Personal cost per fatality 1,174,064
Personal cost per severely injured victim 83,412
Personal cost per slightly injured victim 3,737
Property damage per accident with fatalities 27,266
Property damage per accident with severe injuries 13,185
Property damage per accident with slight injuries 9,651
Property damage per severe accident involving property damage only 12,583
Property damage per slight accident involving property damage only 6,092
Table 5.7: Accident cost per injury (by severity) and property damage (by accident category) in Germany in 2001
By multiplying each figure (table 5.6) by its cost the accident costs of tyre-related accidents and injuries in Germany caused by tyre tread problems for the years 2003 to 2012 have been calculated (see table 5.8).
2003 2004 2005 2006 2007 2008 2009 2010 2011 2012 Sum
Fatalities 59.3 58.8 58.3 57.8 57.4 57.1 56.7 56.4 56.1 55.8 573.7
Severe injuries 47.4 46.2 45.2 44.2 43.4 42.7 42.0 41.4 40.8 40.3 433.6
Slight injuries 6.6 6.5 6.5 6.4 6.4 6.4 6.3 6.3 6.3 6.2 63.8
Accidents with fatalities 1.1 1.1 1.1 1.1 1.0 1.0 1.0 1.0 1.0 1.0 10.5
Accidents with severe injuries 5.2 5.1 5.0 4.9 4.8 4.8 4.7 4.6 4.6 4.5 48.3
Accidents with slight injuries 9.6 9.6 9.5 9.5 9.4 9.4 9.4 9.3 9.3 9.3 94.3
Major property damage 8.4 8.3 8.2 8.2 8.1 8.1 8.0 8.0 7.9 7.9 81.0
Minor property damage 57.8 58.0 58.2 58.4 58.5 58.7 58.8 58.9 59.1 59.2 585.5
Sum 195.4 193.5 191.9 190.5 189.2 188.0 186.9 186.0 185.1 184.2 1.890.6
Table 5.8: Accident costs of tyre-related accidents (by accident categories) and injuries (by severity) in Germany caused by tyre tread problems for the years 2003 – 2012 in mill. €
The total amount of all accident costs over the considered time period is 1.891 billion €. These costs can be interpreted as the potential safety benefits.
______________________________________________________________ SURVEY ON MOTOR VEHICLE TYRES AND RELATED ASPECTS – 2003 -
Page 140
5.2.2 COSTS
The average start tread depths versus recent and proposed legal minimum tread depths of car tyres are documented in table 5.9.
Start tread depth Current legal minimum tread depth
Proposed legal minimum tread depth
8.9 1.6 2.5
Table 5.9: Start tread depth, current and proposed legal minimum tread depth in mm
As a prerequisite for calculating the implementation costs of the envisioned measure, it is necessary to know the number of car tyres replaced. These figures are provided in table 5.10.
1995 1996 1997 1998 1999 2000 2001 2002 2003
38.28 39.96 40.60 41.12 42.92 38.75 38.88 39.16 39.16*
* BVR prognosis Table 5.10: Number of car tyres replaced in Germany for the years 1993 – 2003 in millions
To calculate the costs of an increase of the legal minimum tread depth, the future trend regarding the number of car tyres to be replaced in Germany for the next ten years must be estimated. To extrapolate this trend, the following equation was used:
Y = b0 + (b1 * t)
In table 5.11 the figures for both variables and a test parameter regarding the significance of the functions (1 = best, 0 = worst) are shown.
b0 b1 Significance
Replaced tyres 40.26 - 0.078 0.708
Table 5.11: Figures for trend-extrapolation functions applied to number of car tyres replaced in Germany
Based on the above mathematical functions, the number of tyres replaced in Germany for the years 2003 to 2012 was estimated (table 5.12).
2003 2004 2005 2006 2007 2008 2009 2010 2011 2012
39.16* 39.48 39.40 39.32 39.24 39.17 39.09 39.01 38.93 38.85
* BVR prognosis Table 5.12: Estimated number of tyres replaced in Germany for the years 2003 – 2012 in mill.
Today, given an average tyre start tread depth of 8.9 mm, the maximum allowed tread loss for an average tyre equates to a loss of 7.3 mm (=100%). Considering the proposed minimum tread depth of 2.5 mm, the new permissible utilisation span of an average tyre would be reduced to 6.4 mm (87.7%) of tread loss. This is a reduction by 12.3%. For the further calculations it has been assumed that the replacement frequency for car tyres is raised by the reciprocal value of the reduced utilisation span
______________________________________________________________ SURVEY ON MOTOR VEHICLE TYRES AND RELATED ASPECTS – 2003 -
Page 141
(=100:87.7=114.0), this means an increase by 14%. This enables us to estimate the number of replaced tyres in accordance with the proposed legal minimum tread depth in Germany for the years 2003 to 2012 (see table 5.13).
2003 2004 2005 2006 2007 2008 2009 2010 2011 2012
4.82 4.86 4.85 4.84 4.83 4.82 4.81 4.80 4.79 4.78
Table 5.13: Additional number of tyres replaced in Germany for the years 2003 – 2012 in million
The costs for additionally replaced tyres in Germany for the years 2003 to 2012 comprise three different cost components. In the first place, the average price per car tyre forms the core of the whole costs. The average price per car tyre in Germany is € 61.6. Table 5.14 shows the annual costs of the additional number of tyres replaced in Germany for the years 2003 to 2012, converted into euros based on average market prices.
2003 2004 2005 2006 2007 2008 2009 2010 2011 2012
296.71 299.13 298.53 297.92 297.31 296.78 296.18 295.57 294.96 294.36
Table 5.14: Costs for additionally replaced tyres in Germany for the years 2003 – 2012 in million €
Secondly, the additional costs for tyre mounting have to be considered. The average price per tyre for mounting is € 3.64 (table 5.15).
2003 2004 2005 2006 2007 2008 2009 2010 2011 2012
17.53 17.68 17.64 17.60 17.57 17.54 17.50 17.47 17.43 17.39
Table 5.15: Additional costs for mounting of replaced tyres in Germany for the years 2003 to 2012 in million €
Thirdly, the disposal costs for additionally replaced tyres in Germany have to be considered. The average disposal costs per tyre amount to € 1.84 (see table 5.16).
2003 2004 2005 2006 2007 2008 2009 2010 2011 2012
8.86 8.94 8.92 8.90 8.88 8.86 8.85 8.83 8.81 8.79
Table 5.16: Costs for disposal of additionally replaced tyres in Germany for the years 2003 – 2012 in million €
The annual sum totals of the three cost categories are shown in table 17. Over the whole decade, the total costs of earlier tyre replacement amount to 3.231 billion €.
2003 2004 2005 2006 2007 2008 2009 2010 2011 2012
323.10 325.74 325.08 324.42 323.76 323.19 322.53 321.87 321.21 320.55
Table 17: Total costs for additionally replaced tyres in Germany for the years 2003 – 2012
______________________________________________________________ SURVEY ON MOTOR VEHICLE TYRES AND RELATED ASPECTS – 2003 -
Page 142
5.2.3 POTENTIAL COST-BENEFIT RATIO AND COST-BENEFIT DIFFERENCE
The -cost-benefit ratio, CBR, is calculated by:
CBR =
Benefits Costs
The cost-benefit ratio for the envisioned measure is 0.59. This is a relatively poor result, revealing that the measure would be rather inefficient.
This statement is supported by the cost-benefit difference. The general economic loss resulting from the implementation of this measure amounts to 1.340 Bill € for the ten-year-period.
5.2.4 DISCUSSION AND FURTHER ANALYSIS
A random sample test, performed by BASt, measuring the tyre tread depths of discarded tyres revealed actual end tread depth to be above 3 mm. Considering this result, raising the legal minimum tread depth to 2.5 mm would neither create additional costs nor additional benefits. In this case, the measure would be of absolutely no use, as the tread depths of tyres still in use would not be affected by the measure.
Additional to the assessment above, a status quo assessment was carried out, assuming that the number of accidents and injuries would remain at the level of the year 2002, without any change throughout the ten-year period. In this case, the total amount of all accident costs, i.e. the potential safety benefits over the time period considered would rise by less than 0.1 billion € to 1.95 billion €. This change has only minor influence on the cost-benefit ratios/differences and the negative assessment.
The cost-benefit ratio for the envisioned measure would be 0.31. This is nearly the same poor result as in the basic assessment, and the measure would still be highly inefficient. The general economic loss resulting from the implementation of this measure amounts to 4.302 billion € for the ten-year-period, only 60 million less than in the basic case.
5.2.5 CONCLUSION
Considering the poor results of the cost-benefit analysis, raising the legal tyre minimum tread depth cannot be recommended.
______________________________________________________________ SURVEY ON MOTOR VEHICLE TYRES AND RELATED ASPECTS – 2003 -
Page 143
5.3 NEW TECHNICAL SOLUTIONS FOR TYRE-RELATED ACCIDENTS
The following chapter describes cost-benefit analyses for implementing several technical solutions for tyre-related accidents, in particular for accidents caused by pressure-problems (under-inflation):
• Passive (indirect) TPMS
• Active (direct) TPMS
• Run-Flat-Tyre-Systems
To carry out a cost-benefit analysis in these cases several assumptions were necessary:
• Start date: January 1st, 2003
• Underestimation of tyre-related accidents is identified by MHH data
• Identified underestimation is valid for all categories of accidents and injuries
• Percentage of accidents related to tyre pressure problems in accordance with DEKRA and MHH is constant for all accident and injury categories
• Assessment period: 10 years
• Benefits are evaluated at CY 2001 accident cost figures. 5.3.1 SAFETY BENEFITS
Information is available about the percentage of accidents related to pressure problems based on the results of analyses by DEKRA and MHH (see table 5.18). Based on the MHH data, it is assumed that 3.3% of all tyre-related accidents could be pressure-related. Consequently, the number of tyre-related accidents in Germany for the years 1996 to 2002 caused by tyre pressure problems can be estimated by using the basic data from table 5.2 (for results see table 5.19).
Source : DEKRA DEKRA MHH
Characteristic Inadequate maintenance*
Damage in operation** Pressure problems
Percentage of all tyre-related accidents 36.8% 14.6% 3.3%
*including pressure inflation, tread wear, over-aging etc. ** including punctures, etc. Table 5.18: Percentage of accidents related to tyre pressure problems according to DEKRA and MHH
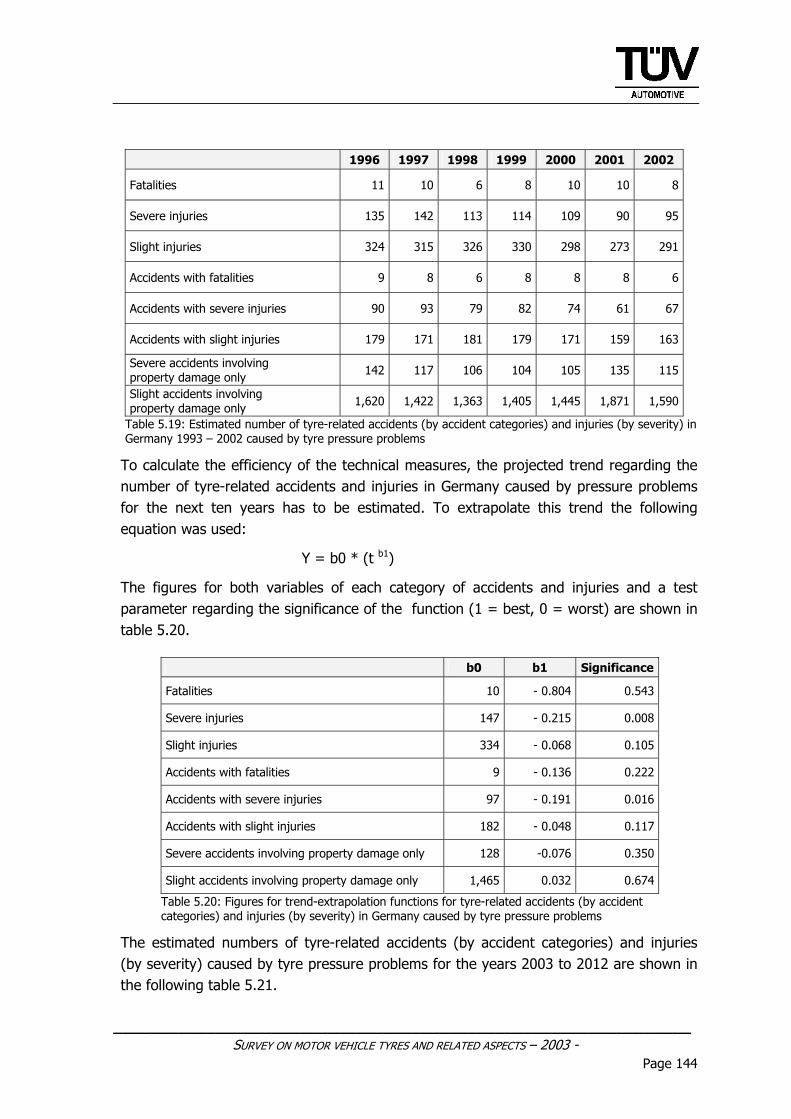
______________________________________________________________ SURVEY ON MOTOR VEHICLE TYRES AND RELATED ASPECTS – 2003 -
Page 144
1996 1997 1998 1999 2000 2001 2002
Fatalities 11 10 6 8 10 10 8
Severe injuries 135 142 113 114 109 90 95
Slight injuries 324 315 326 330 298 273 291
Accidents with fatalities 9 8 6 8 8 8 6
Accidents with severe injuries 90 93 79 82 74 61 67
Accidents with slight injuries 179 171 181 179 171 159 163
Severe accidents involving property damage only 142 117 106 104 105 135 115
Slight accidents involving property damage only 1,620 1,422 1,363 1,405 1,445 1,871 1,590
Table 5.19: Estimated number of tyre-related accidents (by accident categories) and injuries (by severity) in Germany 1993 – 2002 caused by tyre pressure problems
To calculate the efficiency of the technical measures, the projected trend regarding the number of tyre-related accidents and injuries in Germany caused by pressure problems for the next ten years has to be estimated. To extrapolate this trend the following equation was used:
Y = b0 * (t b1)
The figures for both variables of each category of accidents and injuries and a test parameter regarding the significance of the function (1 = best, 0 = worst) are shown in table 5.20.
b0 b1 Significance
Fatalities 10 - 0.804 0.543
Severe injuries 147 - 0.215 0.008
Slight injuries 334 - 0.068 0.105
Accidents with fatalities 9 - 0.136 0.222
Accidents with severe injuries 97 - 0.191 0.016
Accidents with slight injuries 182 - 0.048 0.117
Severe accidents involving property damage only 128 -0.076 0.350
Slight accidents involving property damage only 1,465 0.032 0.674
Table 5.20: Figures for trend-extrapolation functions for tyre-related accidents (by accident categories) and injuries (by severity) in Germany caused by tyre pressure problems
The estimated numbers of tyre-related accidents (by accident categories) and injuries (by severity) caused by tyre pressure problems for the years 2003 to 2012 are shown in the following table 5.21.
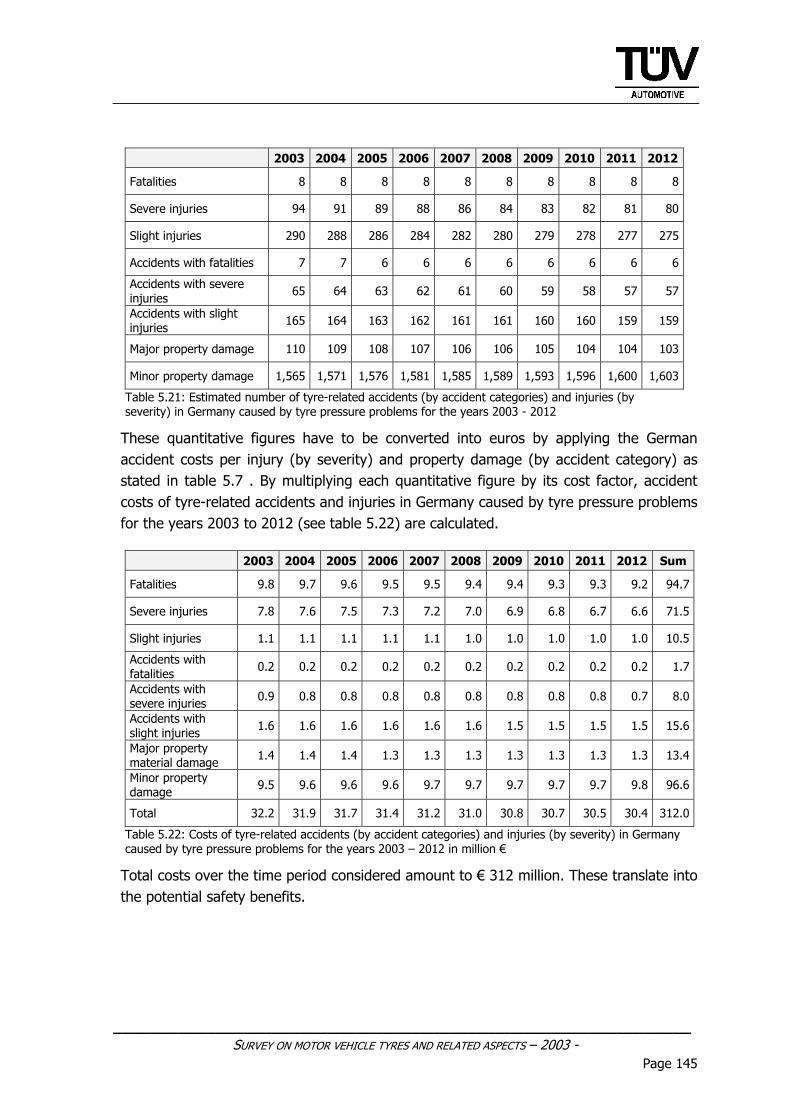
______________________________________________________________ SURVEY ON MOTOR VEHICLE TYRES AND RELATED ASPECTS – 2003 -
Page 145
2003 2004 2005 2006 2007 2008 2009 2010 2011 2012
Fatalities 8 8 8 8 8 8 8 8 8 8
Severe injuries 94 91 89 88 86 84 83 82 81 80
Slight injuries 290 288 286 284 282 280 279 278 277 275
Accidents with fatalities 7 7 6 6 6 6 6 6 6 6
Accidents with severe injuries 65 64 63 62 61 60 59 58 57 57
Accidents with slight injuries 165 164 163 162 161 161 160 160 159 159
Major property damage 110 109 108 107 106 106 105 104 104 103
Minor property damage 1,565 1,571 1,576 1,581 1,585 1,589 1,593 1,596 1,600 1,603
Table 5.21: Estimated number of tyre-related accidents (by accident categories) and injuries (by severity) in Germany caused by tyre pressure problems for the years 2003 - 2012
These quantitative figures have to be converted into euros by applying the German accident costs per injury (by severity) and property damage (by accident category) as stated in table 5.7 . By multiplying each quantitative figure by its cost factor, accident costs of tyre-related accidents and injuries in Germany caused by tyre pressure problems for the years 2003 to 2012 (see table 5.22) are calculated.
2003 2004 2005 2006 2007 2008 2009 2010 2011 2012 Sum
Fatalities 9.8 9.7 9.6 9.5 9.5 9.4 9.4 9.3 9.3 9.2 94.7
Severe injuries 7.8 7.6 7.5 7.3 7.2 7.0 6.9 6.8 6.7 6.6 71.5
Slight injuries 1.1 1.1 1.1 1.1 1.1 1.0 1.0 1.0 1.0 1.0 10.5
Accidents with fatalities 0.2 0.2 0.2 0.2 0.2 0.2 0.2 0.2 0.2 0.2 1.7
Accidents with severe injuries 0.9 0.8 0.8 0.8 0.8 0.8 0.8 0.8 0.8 0.7 8.0
Accidents with slight injuries 1.6 1.6 1.6 1.6 1.6 1.6 1.5 1.5 1.5 1.5 15.6
Major property material damage 1.4 1.4 1.4 1.3 1.3 1.3 1.3 1.3 1.3 1.3 13.4
Minor property damage 9.5 9.6 9.6 9.6 9.7 9.7 9.7 9.7 9.7 9.8 96.6
Total 32.2 31.9 31.7 31.4 31.2 31.0 30.8 30.7 30.5 30.4 312.0
Table 5.22: Costs of tyre-related accidents (by accident categories) and injuries (by severity) in Germany caused by tyre pressure problems for the years 2003 – 2012 in million €
Total costs over the time period considered amount to € 312 million. These translate into the potential safety benefits.
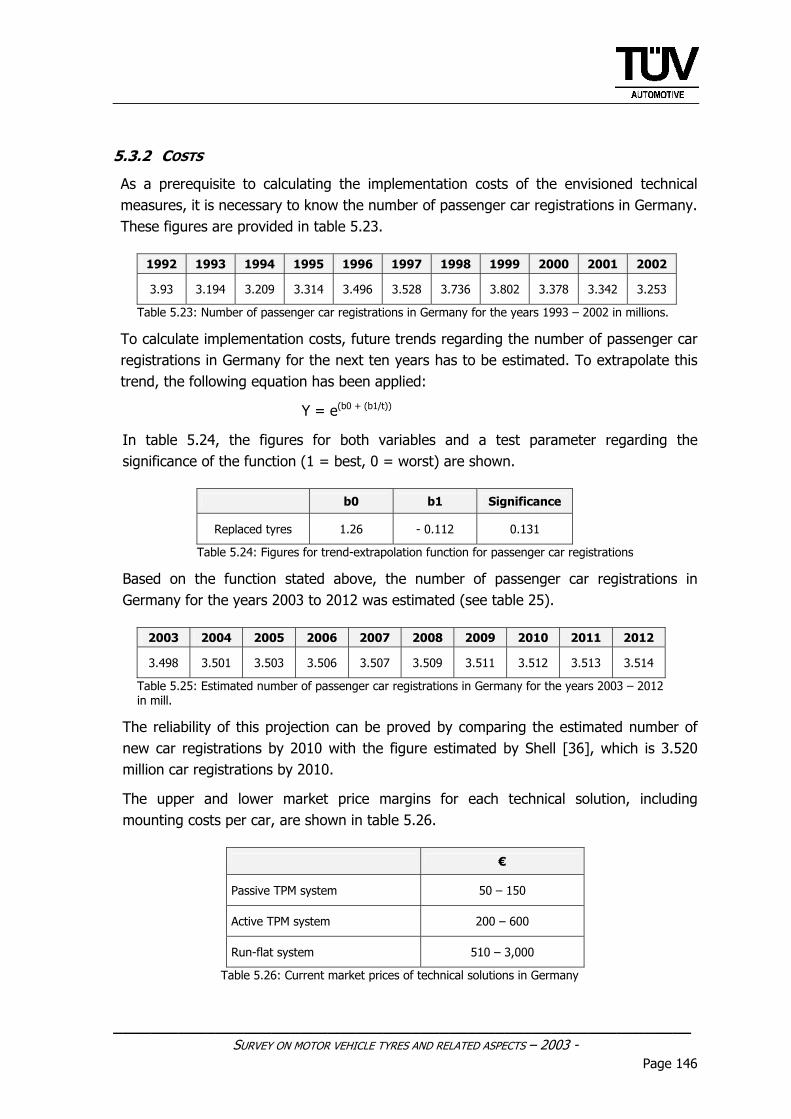
______________________________________________________________ SURVEY ON MOTOR VEHICLE TYRES AND RELATED ASPECTS – 2003 -
Page 146
5.3.2 COSTS
As a prerequisite to calculating the implementation costs of the envisioned technical measures, it is necessary to know the number of passenger car registrations in Germany. These figures are provided in table 5.23.
1992 1993 1994 1995 1996 1997 1998 1999 2000 2001 2002
3.93 3.194 3.209 3.314 3.496 3.528 3.736 3.802 3.378 3.342 3.253
Table 5.23: Number of passenger car registrations in Germany for the years 1993 – 2002 in millions.
To calculate implementation costs, future trends regarding the number of passenger car registrations in Germany for the next ten years has to be estimated. To extrapolate this trend, the following equation has been applied:
Y = e(b0 + (b1/t))
In table 5.24, the figures for both variables and a test parameter regarding the significance of the function (1 = best, 0 = worst) are shown.
b0 b1 Significance
Replaced tyres 1.26 - 0.112 0.131
Table 5.24: Figures for trend-extrapolation function for passenger car registrations
Based on the function stated above, the number of passenger car registrations in Germany for the years 2003 to 2012 was estimated (see table 25).
2003 2004 2005 2006 2007 2008 2009 2010 2011 2012
3.498 3.501 3.503 3.506 3.507 3.509 3.511 3.512 3.513 3.514
Table 5.25: Estimated number of passenger car registrations in Germany for the years 2003 – 2012 in mill.
The reliability of this projection can be proved by comparing the estimated number of new car registrations by 2010 with the figure estimated by Shell [36], which is 3.520 million car registrations by 2010.
The upper and lower market price margins for each technical solution, including mounting costs per car, are shown in table 5.26.
€
Passive TPM system 50 – 150
Active TPM system 200 – 600
Run-flat system 510 – 3,000
Table 5.26: Current market prices of technical solutions in Germany
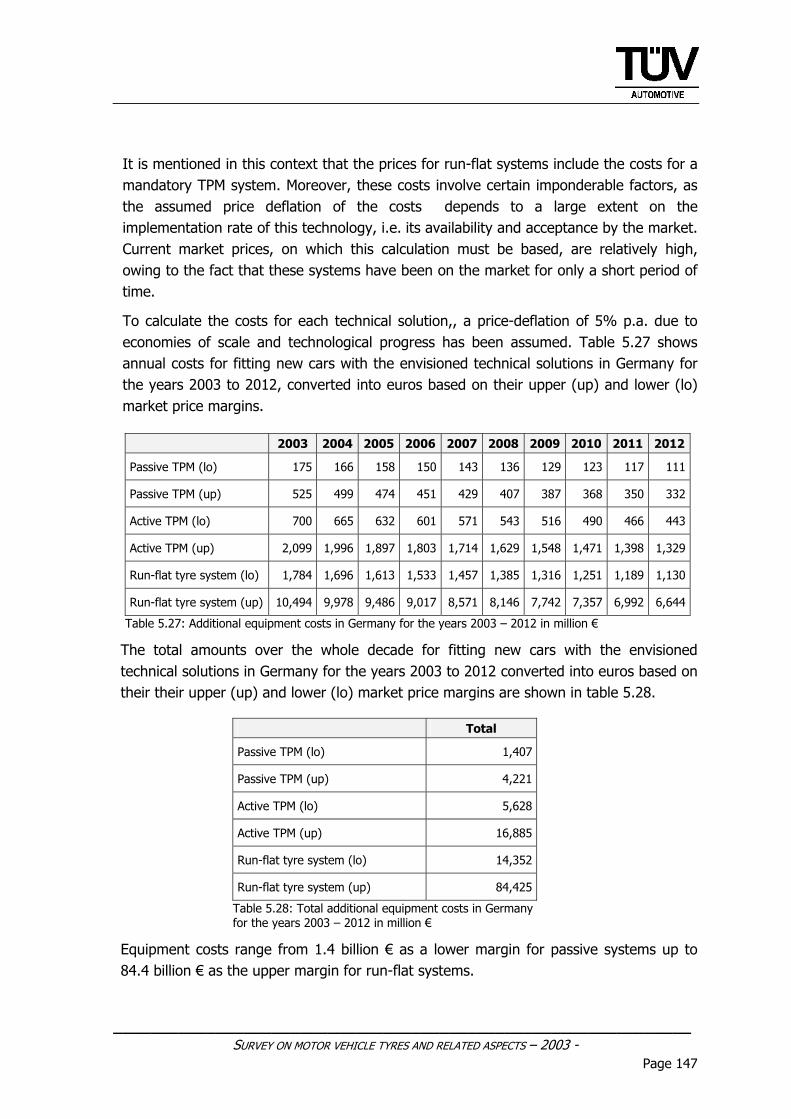
______________________________________________________________ SURVEY ON MOTOR VEHICLE TYRES AND RELATED ASPECTS – 2003 -
Page 147
It is mentioned in this context that the prices for run-flat systems include the costs for a mandatory TPM system. Moreover, these costs involve certain imponderable factors, as the assumed price deflation of the costs depends to a large extent on the implementation rate of this technology, i.e. its availability and acceptance by the market. Current market prices, on which this calculation must be based, are relatively high, owing to the fact that these systems have been on the market for only a short period of time.
To calculate the costs for each technical solution,, a price-deflation of 5% p.a. due to economies of scale and technological progress has been assumed. Table 5.27 shows annual costs for fitting new cars with the envisioned technical solutions in Germany for the years 2003 to 2012, converted into euros based on their upper (up) and lower (lo) market price margins.
2003 2004 2005 2006 2007 2008 2009 2010 2011 2012
Passive TPM (lo) 175 166 158 150 143 136 129 123 117 111
Passive TPM (up) 525 499 474 451 429 407 387 368 350 332
Active TPM (lo) 700 665 632 601 571 543 516 490 466 443
Active TPM (up) 2,099 1,996 1,897 1,803 1,714 1,629 1,548 1,471 1,398 1,329
Run-flat tyre system (lo) 1,784 1,696 1,613 1,533 1,457 1,385 1,316 1,251 1,189 1,130
Run-flat tyre system (up) 10,494 9,978 9,486 9,017 8,571 8,146 7,742 7,357 6,992 6,644
Table 5.27: Additional equipment costs in Germany for the years 2003 – 2012 in million €
The total amounts over the whole decade for fitting new cars with the envisioned technical solutions in Germany for the years 2003 to 2012 converted into euros based on their their upper (up) and lower (lo) market price margins are shown in table 5.28.
Total
Passive TPM (lo) 1,407
Passive TPM (up) 4,221
Active TPM (lo) 5,628
Active TPM (up) 16,885
Run-flat tyre system (lo) 14,352
Run-flat tyre system (up) 84,425
Table 5.28: Total additional equipment costs in Germany for the years 2003 – 2012 in million €
Equipment costs range from 1.4 billion € as a lower margin for passive systems up to 84.4 billion € as the upper margin for run-flat systems.
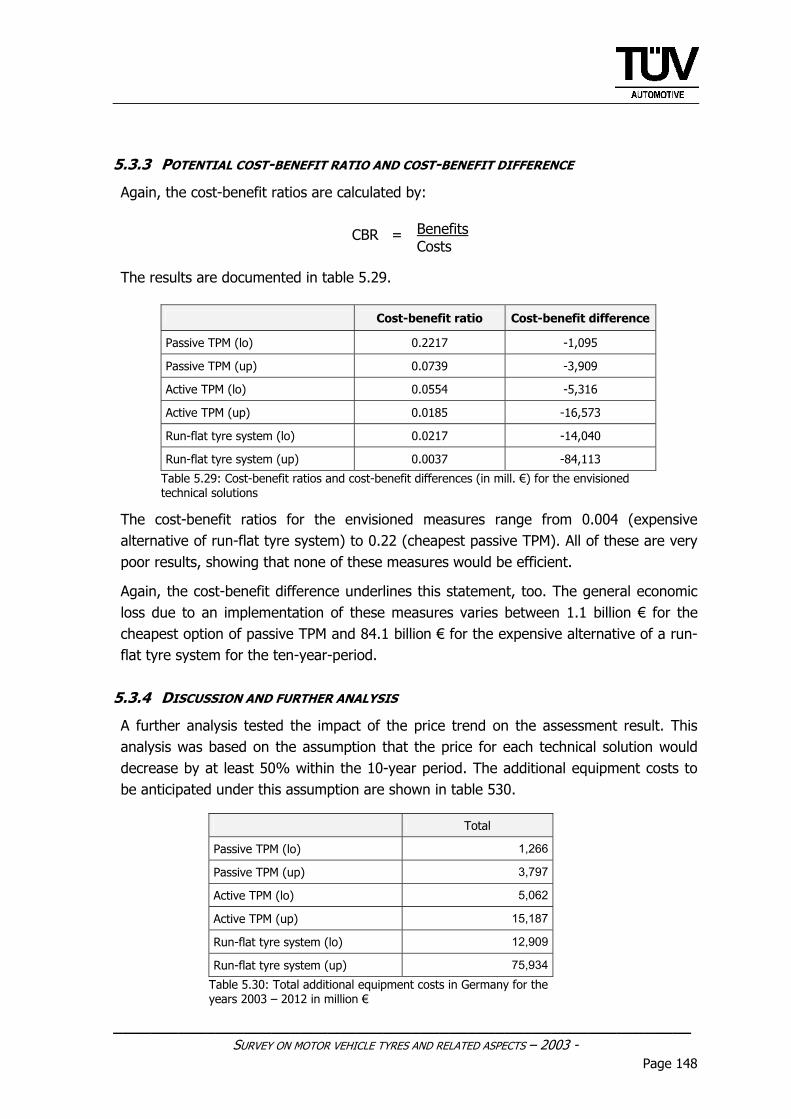
______________________________________________________________ SURVEY ON MOTOR VEHICLE TYRES AND RELATED ASPECTS – 2003 -
Page 148
5.3.3 POTENTIAL COST-BENEFIT RATIO AND COST-BENEFIT DIFFERENCE
Again, the cost-benefit ratios are calculated by:
CBR =
Benefits Costs
The results are documented in table 5.29.
Cost-benefit ratio Cost-benefit difference
Passive TPM (lo) 0.2217 -1,095
Passive TPM (up) 0.0739 -3,909
Active TPM (lo) 0.0554 -5,316
Active TPM (up) 0.0185 -16,573
Run-flat tyre system (lo) 0.0217 -14,040
Run-flat tyre system (up) 0.0037 -84,113
Table 5.29: Cost-benefit ratios and cost-benefit differences (in mill. €) for the envisioned technical solutions
The cost-benefit ratios for the envisioned measures range from 0.004 (expensive alternative of run-flat tyre system) to 0.22 (cheapest passive TPM). All of these are very poor results, showing that none of these measures would be efficient.
Again, the cost-benefit difference underlines this statement, too. The general economic loss due to an implementation of these measures varies between 1.1 billion € for the cheapest option of passive TPM and 84.1 billion € for the expensive alternative of a run-flat tyre system for the ten-year-period.
5.3.4 DISCUSSION AND FURTHER ANALYSIS
A further analysis tested the impact of the price trend on the assessment result. This analysis was based on the assumption that the price for each technical solution would decrease by at least 50% within the 10-year period. The additional equipment costs to be anticipated under this assumption are shown in table 530.
Total
Passive TPM (lo) 1,266
Passive TPM (up) 3,797
Active TPM (lo) 5,062
Active TPM (up) 15,187
Run-flat tyre system (lo) 12,909
Run-flat tyre system (up) 75,934Table 5.30: Total additional equipment costs in Germany for the years 2003 – 2012 in million €
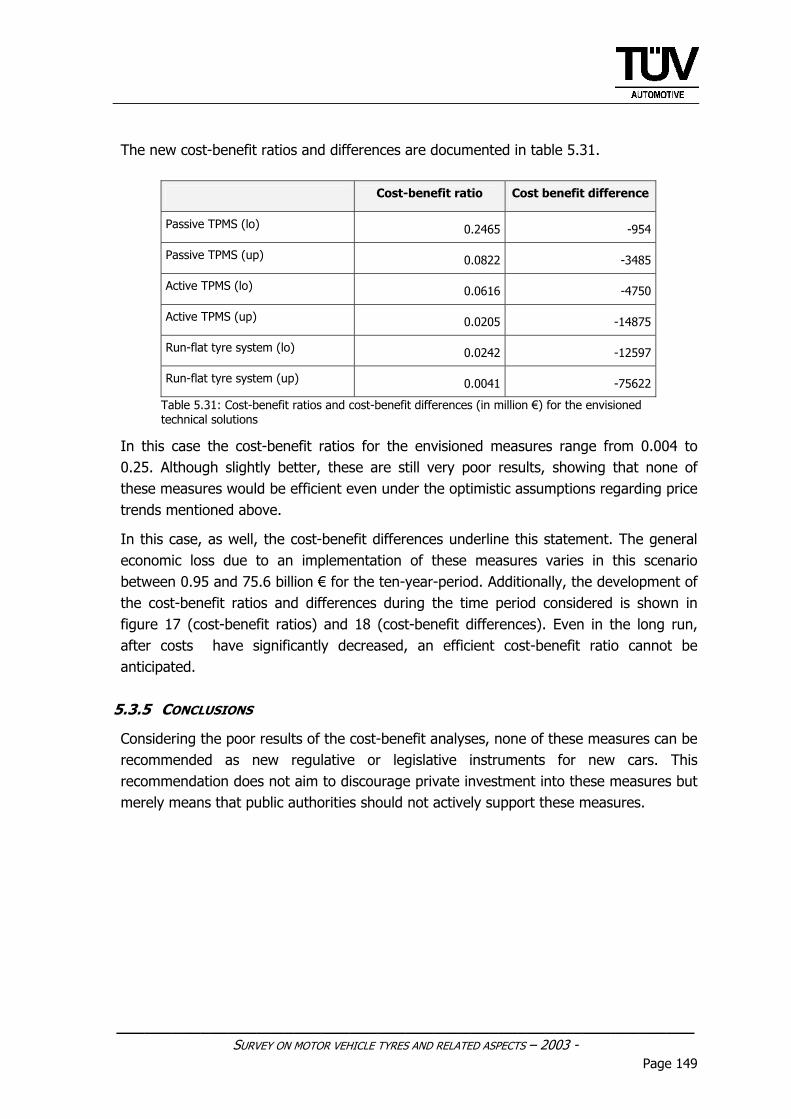
______________________________________________________________ SURVEY ON MOTOR VEHICLE TYRES AND RELATED ASPECTS – 2003 -
Page 149
The new cost-benefit ratios and differences are documented in table 5.31.
Cost-benefit ratio Cost benefit difference
Passive TPMS (lo) 0.2465 -954
Passive TPMS (up) 0.0822 -3485
Active TPMS (lo) 0.0616 -4750
Active TPMS (up) 0.0205 -14875
Run-flat tyre system (lo) 0.0242 -12597
Run-flat tyre system (up) 0.0041 -75622
Table 5.31: Cost-benefit ratios and cost-benefit differences (in million €) for the envisioned technical solutions
In this case the cost-benefit ratios for the envisioned measures range from 0.004 to 0.25. Although slightly better, these are still very poor results, showing that none of these measures would be efficient even under the optimistic assumptions regarding price trends mentioned above.
In this case, as well, the cost-benefit differences underline this statement. The general economic loss due to an implementation of these measures varies in this scenario between 0.95 and 75.6 billion € for the ten-year-period. Additionally, the development of the cost-benefit ratios and differences during the time period considered is shown in figure 17 (cost-benefit ratios) and 18 (cost-benefit differences). Even in the long run, after costs have significantly decreased, an efficient cost-benefit ratio cannot be anticipated.
5.3.5 CONCLUSIONS
Considering the poor results of the cost-benefit analyses, none of these measures can be recommended as new regulative or legislative instruments for new cars. This recommendation does not aim to discourage private investment into these measures but merely means that public authorities should not actively support these measures.
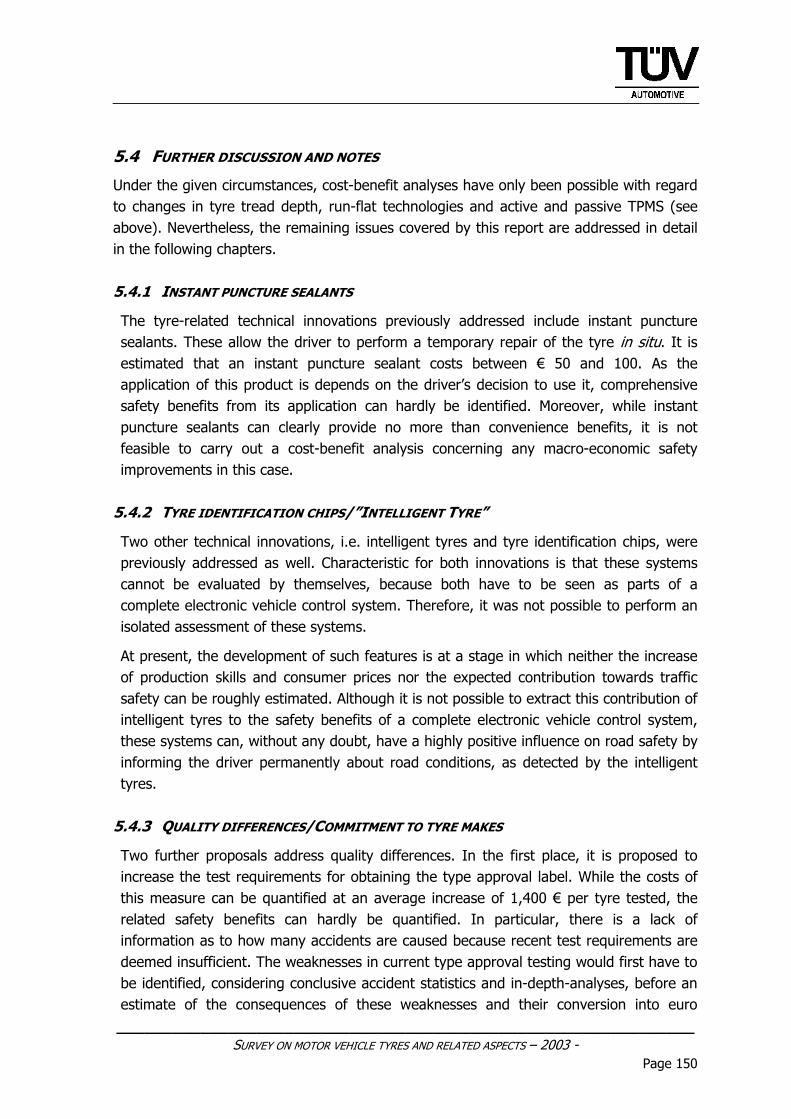
______________________________________________________________ SURVEY ON MOTOR VEHICLE TYRES AND RELATED ASPECTS – 2003 -
Page 150
5.4 FURTHER DISCUSSION AND NOTES
Under the given circumstances, cost-benefit analyses have only been possible with regard to changes in tyre tread depth, run-flat technologies and active and passive TPMS (see above). Nevertheless, the remaining issues covered by this report are addressed in detail in the following chapters. 5.4.1 INSTANT PUNCTURE SEALANTS
The tyre-related technical innovations previously addressed include instant puncture sealants. These allow the driver to perform a temporary repair of the tyre in situ. It is estimated that an instant puncture sealant costs between € 50 and 100. As the application of this product is depends on the driver’s decision to use it, comprehensive safety benefits from its application can hardly be identified. Moreover, while instant puncture sealants can clearly provide no more than convenience benefits, it is not feasible to carry out a cost-benefit analysis concerning any macro-economic safety improvements in this case.
5.4.2 TYRE IDENTIFICATION CHIPS/”INTELLIGENT TYRE”
Two other technical innovations, i.e. intelligent tyres and tyre identification chips, were previously addressed as well. Characteristic for both innovations is that these systems cannot be evaluated by themselves, because both have to be seen as parts of a complete electronic vehicle control system. Therefore, it was not possible to perform an isolated assessment of these systems.
At present, the development of such features is at a stage in which neither the increase of production skills and consumer prices nor the expected contribution towards traffic safety can be roughly estimated. Although it is not possible to extract this contribution of intelligent tyres to the safety benefits of a complete electronic vehicle control system, these systems can, without any doubt, have a highly positive influence on road safety by informing the driver permanently about road conditions, as detected by the intelligent tyres.
5.4.3 QUALITY DIFFERENCES/COMMITMENT TO TYRE MAKES
Two further proposals address quality differences. In the first place, it is proposed to increase the test requirements for obtaining the type approval label. While the costs of this measure can be quantified at an average increase of 1,400 € per tyre tested, the related safety benefits can hardly be quantified. In particular, there is a lack of information as to how many accidents are caused because recent test requirements are deemed insufficient. The weaknesses in current type approval testing would first have to be identified, considering conclusive accident statistics and in-depth-analyses, before an estimate of the consequences of these weaknesses and their conversion into euro
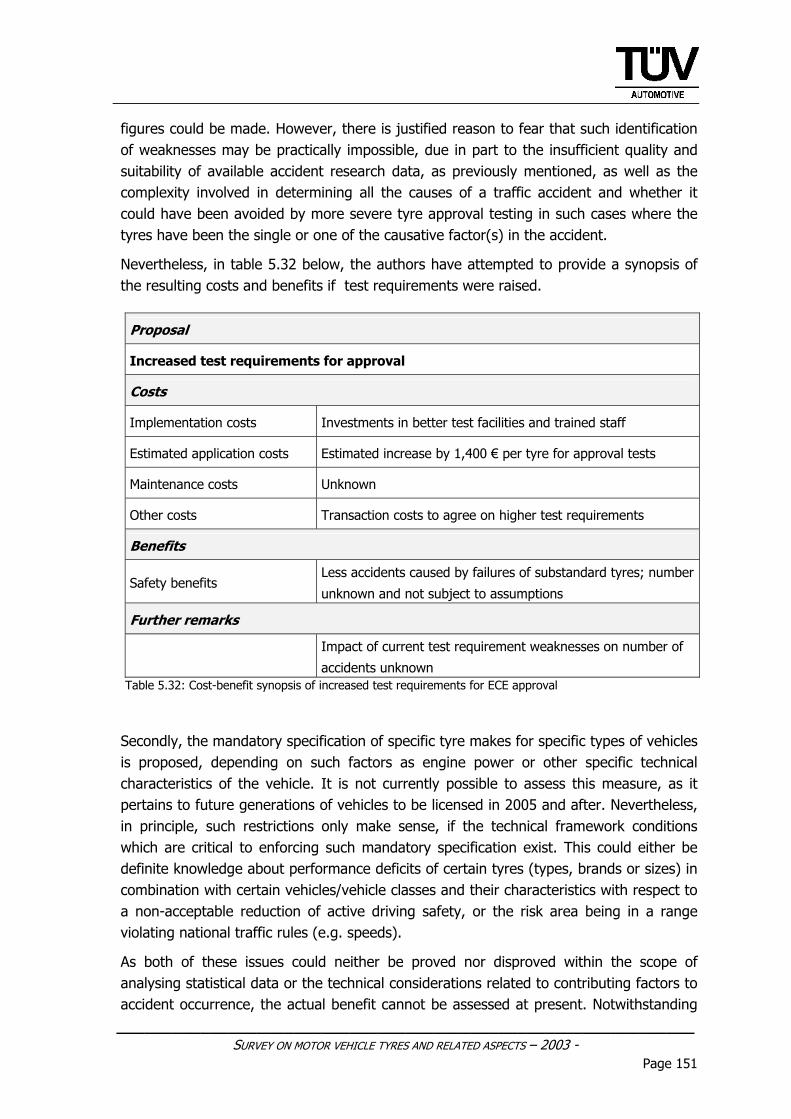
______________________________________________________________ SURVEY ON MOTOR VEHICLE TYRES AND RELATED ASPECTS – 2003 -
Page 151
figures could be made. However, there is justified reason to fear that such identification of weaknesses may be practically impossible, due in part to the insufficient quality and suitability of available accident research data, as previously mentioned, as well as the complexity involved in determining all the causes of a traffic accident and whether it could have been avoided by more severe tyre approval testing in such cases where the tyres have been the single or one of the causative factor(s) in the accident.
Nevertheless, in table 5.32 below, the authors have attempted to provide a synopsis of the resulting costs and benefits if test requirements were raised.
Proposal
Increased test requirements for approval
Costs
Implementation costs Investments in better test facilities and trained staff
Estimated application costs Estimated increase by 1,400 € per tyre for approval tests
Maintenance costs Unknown
Other costs Transaction costs to agree on higher test requirements
Benefits
Safety benefits Less accidents caused by failures of substandard tyres; number
unknown and not subject to assumptions
Further remarks
Impact of current test requirement weaknesses on number of
accidents unknown Table 5.32: Cost-benefit synopsis of increased test requirements for ECE approval
Secondly, the mandatory specification of specific tyre makes for specific types of vehicles is proposed, depending on such factors as engine power or other specific technical characteristics of the vehicle. It is not currently possible to assess this measure, as it pertains to future generations of vehicles to be licensed in 2005 and after. Nevertheless, in principle, such restrictions only make sense, if the technical framework conditions which are critical to enforcing such mandatory specification exist. This could either be definite knowledge about performance deficits of certain tyres (types, brands or sizes) in combination with certain vehicles/vehicle classes and their characteristics with respect to a non-acceptable reduction of active driving safety, or the risk area being in a range violating national traffic rules (e.g. speeds).
As both of these issues could neither be proved nor disproved within the scope of analysing statistical data or the technical considerations related to contributing factors to accident occurrence, the actual benefit cannot be assessed at present. Notwithstanding
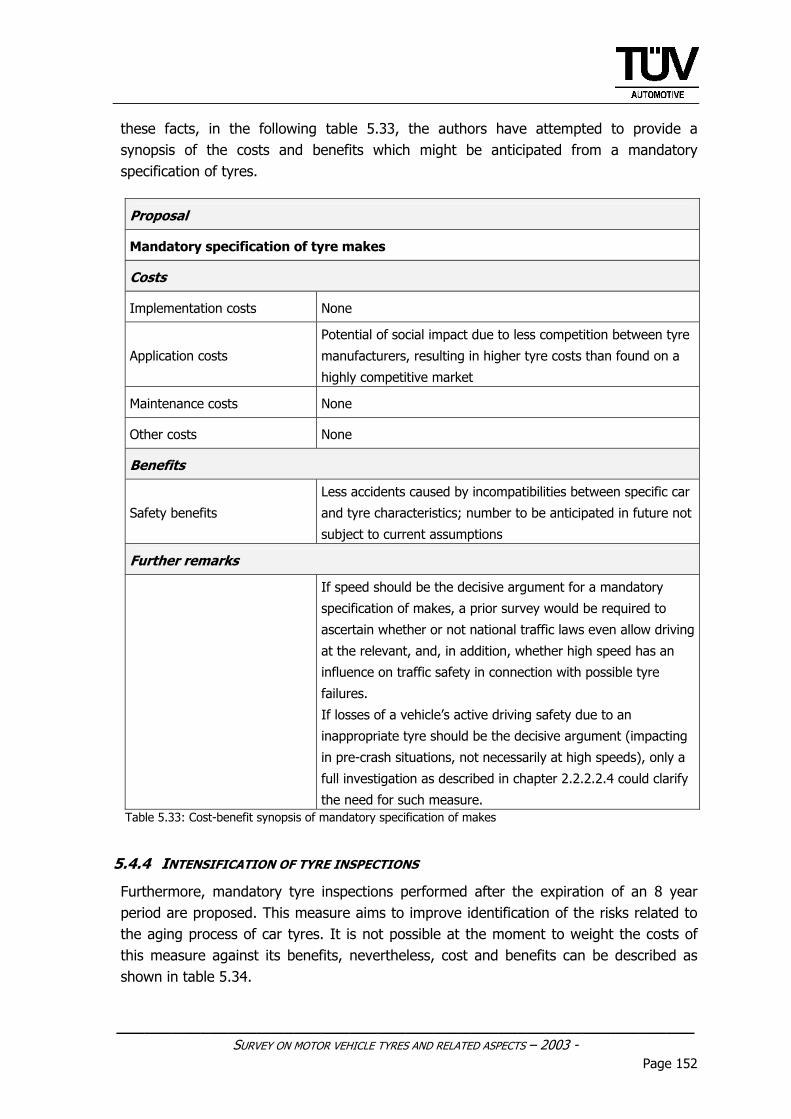
______________________________________________________________ SURVEY ON MOTOR VEHICLE TYRES AND RELATED ASPECTS – 2003 -
Page 152
these facts, in the following table 5.33, the authors have attempted to provide a synopsis of the costs and benefits which might be anticipated from a mandatory specification of tyres.
Proposal
Mandatory specification of tyre makes
Costs
Implementation costs None
Application costs
Potential of social impact due to less competition between tyre
manufacturers, resulting in higher tyre costs than found on a
highly competitive market
Maintenance costs None
Other costs None
Benefits
Safety benefits
Less accidents caused by incompatibilities between specific car
and tyre characteristics; number to be anticipated in future not
subject to current assumptions
Further remarks
If speed should be the decisive argument for a mandatory
specification of makes, a prior survey would be required to
ascertain whether or not national traffic laws even allow driving
at the relevant, and, in addition, whether high speed has an
influence on traffic safety in connection with possible tyre
failures.
If losses of a vehicle’s active driving safety due to an
inappropriate tyre should be the decisive argument (impacting
in pre-crash situations, not necessarily at high speeds), only a
full investigation as described in chapter 2.2.2.2.4 could clarify
the need for such measure. Table 5.33: Cost-benefit synopsis of mandatory specification of makes
5.4.4 INTENSIFICATION OF TYRE INSPECTIONS
Furthermore, mandatory tyre inspections performed after the expiration of an 8 year period are proposed. This measure aims to improve identification of the risks related to the aging process of car tyres. It is not possible at the moment to weight the costs of this measure against its benefits, nevertheless, cost and benefits can be described as shown in table 5.34.
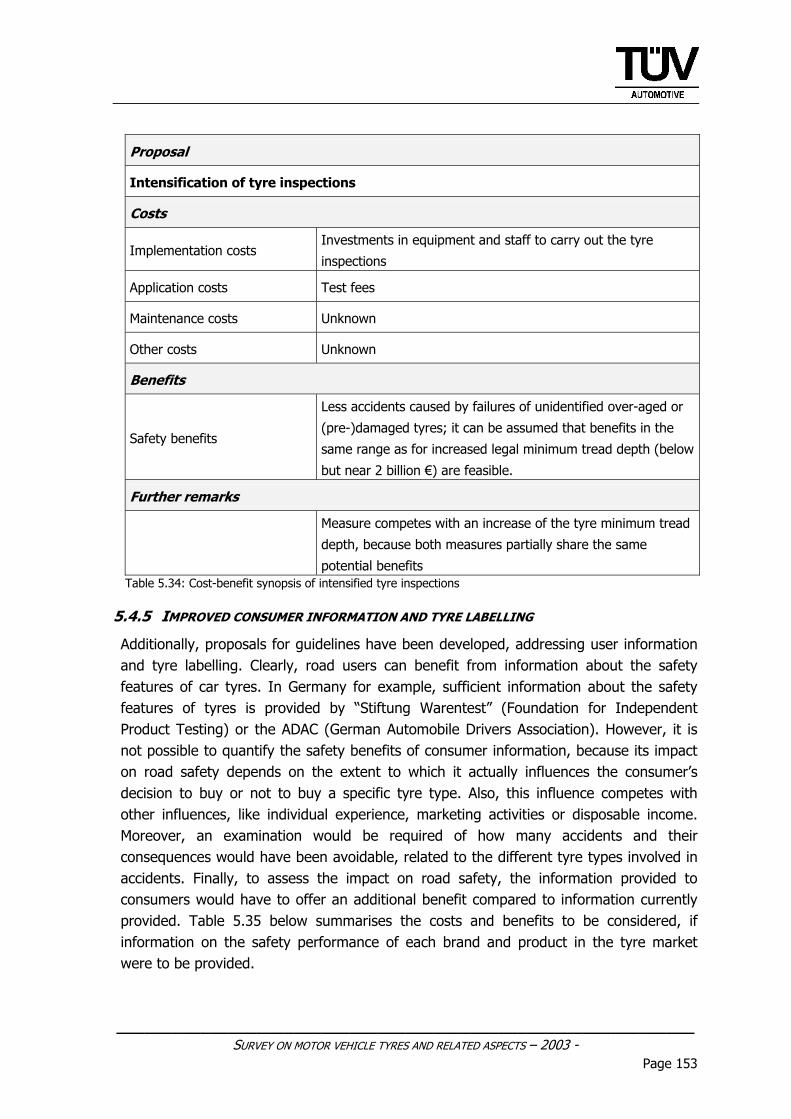
______________________________________________________________ SURVEY ON MOTOR VEHICLE TYRES AND RELATED ASPECTS – 2003 -
Page 153
Proposal
Intensification of tyre inspections
Costs
Implementation costs Investments in equipment and staff to carry out the tyre
inspections
Application costs Test fees
Maintenance costs Unknown
Other costs Unknown
Benefits
Safety benefits
Less accidents caused by failures of unidentified over-aged or
(pre-)damaged tyres; it can be assumed that benefits in the
same range as for increased legal minimum tread depth (below
but near 2 billion €) are feasible.
Further remarks
Measure competes with an increase of the tyre minimum tread
depth, because both measures partially share the same
potential benefits Table 5.34: Cost-benefit synopsis of intensified tyre inspections
5.4.5 IMPROVED CONSUMER INFORMATION AND TYRE LABELLING
Additionally, proposals for guidelines have been developed, addressing user information and tyre labelling. Clearly, road users can benefit from information about the safety features of car tyres. In Germany for example, sufficient information about the safety features of tyres is provided by “Stiftung Warentest” (Foundation for Independent Product Testing) or the ADAC (German Automobile Drivers Association). However, it is not possible to quantify the safety benefits of consumer information, because its impact on road safety depends on the extent to which it actually influences the consumer’s decision to buy or not to buy a specific tyre type. Also, this influence competes with other influences, like individual experience, marketing activities or disposable income. Moreover, an examination would be required of how many accidents and their consequences would have been avoidable, related to the different tyre types involved in accidents. Finally, to assess the impact on road safety, the information provided to consumers would have to offer an additional benefit compared to information currently provided. Table 5.35 below summarises the costs and benefits to be considered, if information on the safety performance of each brand and product in the tyre market were to be provided.
______________________________________________________________ SURVEY ON MOTOR VEHICLE TYRES AND RELATED ASPECTS – 2003 -
Page 154
Proposal
Provision of information on the performance of each brand and product
Costs
Implementation costs
Investment in equipment and staff to carry out safety
performance tests;
investment in equipment and staff to publish information about
test results
Application costs Costs for testing, further costs depending on the media used
Maintenance costs Depending on the media used
Other costs Potential business loss for already established public and
private information providers
Benefits
Safety benefits Less accidents due to fewer tyre makes and types in use with
weak safety performance
Further remarks
• Information is largely being provided already
• Influence of consumer information on purchasing decision is
difficult to analyse
• Accident reduction potential related to tyre industry and
products unknown Table 5.35: Cost-benefit synopsis of improved consumer information
Additional proposals for guidelines with a relatively long-range focus have been developed.
Some of them are beneficial as a matter of principle, such as clear rules for product liability or the globalisation of guidelines and standards. Moreover, to retain sufficient possibilities for car manufacturers to realise their own visions and targets, without compromising the full scope of needs for rules and guidelines, translates one of the basic concepts of market economy in the field of tyres into action, and is therefore widely accepted as beneficiary.
5.5 ENVIRONMENTAL EFFECTS
As outlined in chapter 4.1.1.7, it is suggested that legislators, in addition to tightened tyre noise thresholds, consider the inclusion of rolling resistance limits into type approvals for passenger car tyres. Besides an increased use of so-called “smooth running” tyres which have been available on the market for years, the general reduction of rolling resistance of all tyres could naturally have positive environmental effects, predominantly in terms of reduced fuel consumption. As previously mentioned in the report, a decrease of rolling
______________________________________________________________ SURVEY ON MOTOR VEHICLE TYRES AND RELATED ASPECTS – 2003 -
Page 155
resistance by 30% for example (a possible difference revealed by our own tests) could improve the fuel economy of passenger cars by up to 5%. The highest savings potential can be achieved in urban traffic and at average speeds on country roads.
With respect to a cost-benefit analysis, it must be stated that it is not possible to make any realistic calculations, as too many uncertain assumptions would have to be made to draw realistic conclusions on the situation on European roads. Neither the distribution of passenger car tyres on the market concerning their rolling resistance performance is known, nor the acceptance of low rolling resistance by consumers, nor the implementation costs for the tyre manufacturers to bring their tyres below a defined rolling resistance limit. The latter in particular may strongly vary, depending on the sophistication and technologies used by the individual tyre manufacturer. A further unknown variable comes from the potentially negative influence of decreased grip performance. Although it cannot be stated that an improvement in rolling resistance (and rolling noise) would inevitably lead to a general deterioration of wet grip for example, in tests performed by TÜV Automotive such tendencies were detectable with certain less sophisticated tyres (see annex, chapter 8.1).
According to an investigation by the German Federal Environmental Agency (UBA) [37], the purchasing costs for special low-rolling-resistance tyres incurred by the consumer are equal or only marginally higher than those of regular tyres. In this investigation, with reference to the German market only, the potential benefit with respect to a reduction of CO2-emissions was examined, too. However, these considerations refer to tyres for commercial vehicles and passenger cars as a whole, without any differentiation. UBA has based its calculations on a four-year launch period and a 90-per cent implementation rate with passenger cars and 60% for trucks. Under this prerequisite, a potential CO2 reduction of 4.4 million tonnes for 2005, 5.8 million tonnes for 2010 and 5.4 million tonnes for 2020 could be anticipated.
According to the same investigation, 1 million tonnes of CO2 saves fuel in the amount of € 496 million (petrol) and € 362 million (diesel), based on the taxed price of € 1.16 per litre of petrol and € 0.95 per litre of diesel. As the quantification of transaction costs cannot be determined at present, a cost-benefit analysis is not applicable in this case. However, as consumers have the free choice of tyres, they can resort to low-rolling-resistance tyres without incurring any considerably higher expense. As previously mentioned, a clear marking of such tyres (e.g. with the existing eco labels, such as the “Blue Angel” or the “Nordic Swan” or printing of rolling resistance data) and a public promotion campaign might be helpful in this context.
______________________________________________________________ SURVEY ON MOTOR VEHICLE TYRES AND RELATED ASPECTS – 2003 -
Page 156
6 CONCLUDING REMARKS For one of the main objectives of this study, i.e. evaluation of the extent to which damaged or unsuitable tyres play an active role in causing traffic accidents, an only partially satisfying result was achieved. The positive and negative impacts on active driving safety caused and influenced by tyres were described at length in the previous chapters and underpinned by appropriate test results or case studies. From the point of view of accident statistics, however, isolating the actual share of accidents caused by damaged or unsuitable tyres and thus proving and corroborating their significance proved next to impossible. This is due not only to the largely unsatisfactory accuracy with which available and accessible accident data bases record the exact causes of accidents, especially where technical defects are concerned. Another principal reason is the complexity of the subject, which also renders it extremely difficult to ascertain beyond doubt that tyre defects or situation-related deficits were the cause of an accident. In-depth explanations concerning technical framework conditions and related aspects, however, could help create a solid basis for clearly outlining the necessary action in terms of potential amendments and additions to existing directives and for suggesting a number of specific changes to key issues.
From our point of view, the changes suggested in this report can contribute considerably to increasing active vehicle safety on EU roads and thus help reduce the number of accidents. Nevertheless, to achieve broad acceptance and optimum alignment with current and future technological developments, we consider it important to discuss the appropriate suggestions, and to amend them if necessary, in a task force to be especially convened. In the context of this study, TÜV Automotive would gladly assume appropriate responsibility and actively participate in such a task force. ________________________________________________________________________ TÜV Automotive GmbH Institute for Automotive Technology Munich, June 2004 Dipl.-Ing. (FH) Walter Reithmaier Dipl.-Ing. (FH) Thomas Salzinger Project Manager Assistant Project Manager
______________________________________________________________ SURVEY ON MOTOR VEHICLE TYRES AND RELATED ASPECTS -2003-
- ANNEX - Page 157
C. ANNEX
7 LIST OF REFERENCES [1] Federal Statistical Office Germany (Statistisches Bundesamt Deutschland)
“Accident reports by police at the accident location” [2] Federal Highway Research Institute (Bundesanstalt für Straßenwesen) „Overview on road traffic accident occurrence in 2001“ [3] DEKRA Fachschrift Nr. 55/01 [4] Assogomma/Federpneus: “Campagna Sociale Pneumatici Sotto Controllo“
http://www.infomotori.com/a_165_IT_2152_1.html
[5] Police Service of Northern Ireland http://www.psni.police.uk/calendar_stats3.doc
[6] National Center for Statistics and Analysis (NCSA) Fatality Analysis Reporting System (FARS) [7] Institute for Traffic Accident Research and Data Analysis (ITARDA)
http://www.itarda.or.jp
[8] Gesellschaft für Technische Überwachung mbH (“GTÜ”)
[9] http://www.motorradreifen.org/reifen_haupt.htm [10] BERU AG
http://www.beru.com/english/aktuelles/presse/20010911-BI115.php [11] Bundesverband Reifenhandel http://www.bundesverband-reifenhandel.de/verbraucher-
infos/reifen_a_z.html#luftdruck_reifenfuelldruck [12] Deutscher Verkehrssicherheitsrat e.V.
http://www.reifencheck2003.de/reifen.asp
______________________________________________________________ SURVEY ON MOTOR VEHICLE TYRES AND RELATED ASPECTS -2003-
- ANNEX - Page 158
[13] Michelin, found in: Neue Reifenzeitung: Vol. 11/2001 [14] Vavryn, Kurt / Winkelbauer, Martin
„Beurteilung der Bremsbedienung bei Motorradfahrern“ Zeitschrift für Verkehrsrecht. 4/2001.
[15] Dunlop Tyres http://www.dunloptyres.co.uk/site/tyres/car/technicalInfo/#dsst [16] Continental AG http://www.conti-online.com/generator/www/com/en/continental/portal/
general/innovation/inno_run_flat_systems_en.html [17] Hutchinson Defense and Security Division http://www.hutchinson-defense-security.com [18] Michelin
http://www.michelin.com/corporate/en/avenir/how1998.jsp
[19] Österreichischer Automobil-, Motorrad- und Touring-Club (ÖAMTC) http://www.oeamtc.at/netautor/html_seiten/runflat-test/
[20] Nokian Tyres
http://www.roadsnoop.com/files/howtoinstalltehsystem.pdf
[21] http://dmtwww.epfl.ch/ims/micsys/ANASYS/tp/press.html [22] US Department of Transportation/National Highway Traffic Safety Administration “An Evaluation Of Existing Tire Pressure Monitoring Systems” [23] Automotive Design & Production http://www.autofieldguide.com/articles/109906.html [24] Prof. Dr. rer. nat. Hermann Winner VDI, Darmstadt (Hrsg.)
4. Darmstädter Reifenkolloquium Verkehrstechnik/Fahrzeugtechnik, Fortschritt - Berichte VDI Reihe 12 Nr.511
______________________________________________________________ SURVEY ON MOTOR VEHICLE TYRES AND RELATED ASPECTS -2003-
- ANNEX - Page 159
[25] Passive OFW Funksensorik für den „intelligenten“ Reifen 7. VDI Fachtagung Reifen, Fahrwerk, Fahrbahn Hannover 21.-22.10.1999 [26] Roth, J. Untersuchungen zur Kraftübertragung zwischen Pkw - Reifen und
Fahrbahn unter besonderer Berücksichtigung der Kraftschlusserkennung am rotierenden Rad. Dissertation TH Darmstadt, Fortschritt - Berichte VDI Reihe 12 Nr. 195, VDI - Verlag, Düsseldorf (1993)
[27] Bericht: Reibwerterkennung mit Darmstädter Reifensensor, Fortschritt - Berichte
VDI Reihe Nr. 511, VDI - Verlag, Düsseldorf (2002) [28] der innovations-report
http://www.innovationsreport.de/html/berichte/innovative_produkte/bericht-15756.html
[29] The Apollo Consortium “Intelligent Tyres – State-of-the-art and potential technologies”; Deliverable D7 http://www.vtt.fi/tuo/projects/apollo/deliverables/apollo_state_of_art.pdf [30] German Insurance Association / Institute for Vehicle Safety
Klaus Langwieder http://www.gdv-ifm.de/downloads/pfd-Bericht%20englisch.PDF
[31] TRW Automotive
http://www.accidentreconstruction.com/news/sep01/091701a.asp
[32] Conti-Teves http://www.conti-online.com/generator/www/de/en/continentalteves/
continentalteves/themes/products/electronic_brake_systems/brake_by_wire/ ehb_0602_en.html
[33] Conti-Teves http://www.conti-online.com/generator/www/de/en/continentalteves/
continentalteves/themes/products/electronic_brake_systems/brake_by_wire/ emb_0602_en.html
[34] Paul Yih “Toward steer-by-wire”, November 2001
http://www.stanford.edu/~pyih/docs/bywire.pdf
______________________________________________________________ SURVEY ON MOTOR VEHICLE TYRES AND RELATED ASPECTS -2003-
- ANNEX - Page 160
[35] www.micapeak.com/bmw/gs/gs_tel1.html [36] Deutsche Shell AG, Mehr Autos – weniger Emissionen, Szenarien des Pkw-
Bestandes und der Neuzulassungen in Deutschland bis zum Jahr 2020, Hamburg 1999.
[37] German Federal Environmental Agency (Umweltbundesamt)
CO2-Minderung im Verkehr – Sachstandsbericht, September 2003
[38] www.dinamoto.it [39] Swedish National Road and Transport Research Institute http://www.vti.se/pdf/reports/R479.pdf
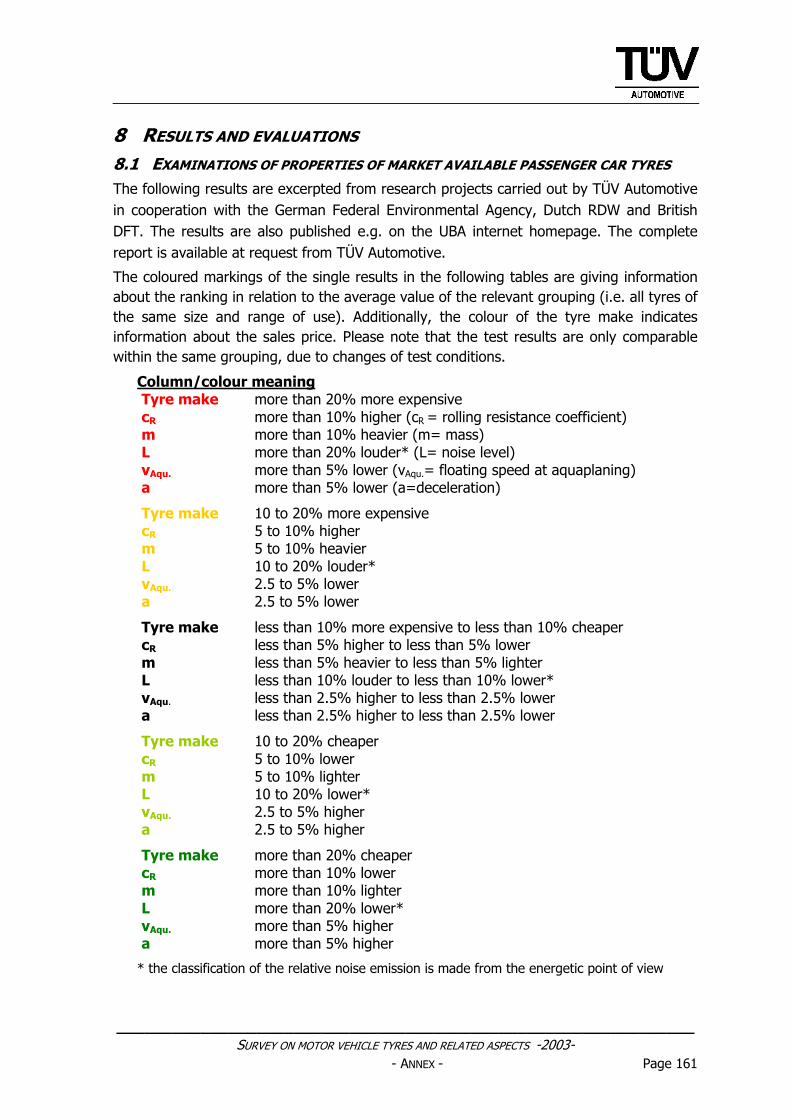
______________________________________________________________ SURVEY ON MOTOR VEHICLE TYRES AND RELATED ASPECTS -2003-
- ANNEX - Page 161
8 RESULTS AND EVALUATIONS 8.1 EXAMINATIONS OF PROPERTIES OF MARKET AVAILABLE PASSENGER CAR TYRES The following results are excerpted from research projects carried out by TÜV Automotive in cooperation with the German Federal Environmental Agency, Dutch RDW and British DFT. The results are also published e.g. on the UBA internet homepage. The complete report is available at request from TÜV Automotive.
The coloured markings of the single results in the following tables are giving information about the ranking in relation to the average value of the relevant grouping (i.e. all tyres of the same size and range of use). Additionally, the colour of the tyre make indicates information about the sales price. Please note that the test results are only comparable within the same grouping, due to changes of test conditions.
Column/colour meaning Tyre make more than 20% more expensive cR more than 10% higher (cR = rolling resistance coefficient) m more than 10% heavier (m= mass) L more than 20% louder* (L= noise level) vAqu. more than 5% lower (vAqu.= floating speed at aquaplaning) a more than 5% lower (a=deceleration)
Tyre make 10 to 20% more expensive cR 5 to 10% higher m 5 to 10% heavier L 10 to 20% louder* vAqu. 2.5 to 5% lower a 2.5 to 5% lower
Tyre make less than 10% more expensive to less than 10% cheaper cR less than 5% higher to less than 5% lower m less than 5% heavier to less than 5% lighter L less than 10% louder to less than 10% lower* vAqu. less than 2.5% higher to less than 2.5% lower a less than 2.5% higher to less than 2.5% lower
Tyre make 10 to 20% cheaper cR 5 to 10% lower m 5 to 10% lighter L 10 to 20% lower* vAqu. 2.5 to 5% higher a 2.5 to 5% higher
Tyre make more than 20% cheaper cR more than 10% lower m more than 10% lighter L more than 20% lower* vAqu. more than 5% higher a more than 5% higher
* the classification of the relative noise emission is made from the energetic point of view
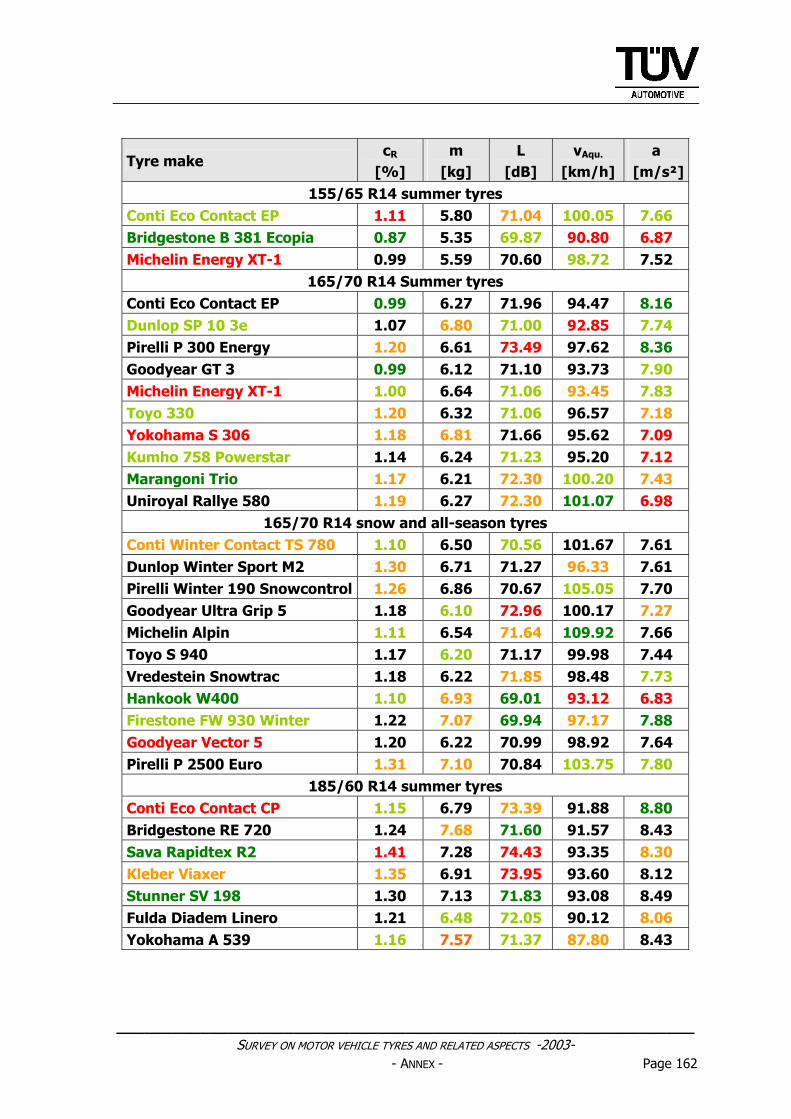
______________________________________________________________ SURVEY ON MOTOR VEHICLE TYRES AND RELATED ASPECTS -2003-
- ANNEX - Page 162
Tyre make cR
[%] m
[kg] L
[dB] vAqu.
[km/h] a
[m/s²]155/65 R14 summer tyres
Conti Eco Contact EP 1.11 5.80 71.04 100.05 7.66 Bridgestone B 381 Ecopia 0.87 5.35 69.87 90.80 6.87 Michelin Energy XT-1 0.99 5.59 70.60 98.72 7.52
165/70 R14 Summer tyres Conti Eco Contact EP 0.99 6.27 71.96 94.47 8.16 Dunlop SP 10 3e 1.07 6.80 71.00 92.85 7.74 Pirelli P 300 Energy 1.20 6.61 73.49 97.62 8.36 Goodyear GT 3 0.99 6.12 71.10 93.73 7.90 Michelin Energy XT-1 1.00 6.64 71.06 93.45 7.83 Toyo 330 1.20 6.32 71.06 96.57 7.18 Yokohama S 306 1.18 6.81 71.66 95.62 7.09 Kumho 758 Powerstar 1.14 6.24 71.23 95.20 7.12 Marangoni Trio 1.17 6.21 72.30 100.20 7.43 Uniroyal Rallye 580 1.19 6.27 72.30 101.07 6.98
165/70 R14 snow and all-season tyres Conti Winter Contact TS 780 1.10 6.50 70.56 101.67 7.61 Dunlop Winter Sport M2 1.30 6.71 71.27 96.33 7.61 Pirelli Winter 190 Snowcontrol 1.26 6.86 70.67 105.05 7.70 Goodyear Ultra Grip 5 1.18 6.10 72.96 100.17 7.27 Michelin Alpin 1.11 6.54 71.64 109.92 7.66 Toyo S 940 1.17 6.20 71.17 99.98 7.44 Vredestein Snowtrac 1.18 6.22 71.85 98.48 7.73 Hankook W400 1.10 6.93 69.01 93.12 6.83 Firestone FW 930 Winter 1.22 7.07 69.94 97.17 7.88 Goodyear Vector 5 1.20 6.22 70.99 98.92 7.64 Pirelli P 2500 Euro 1.31 7.10 70.84 103.75 7.80
185/60 R14 summer tyres Conti Eco Contact CP 1.15 6.79 73.39 91.88 8.80 Bridgestone RE 720 1.24 7.68 71.60 91.57 8.43 Sava Rapidtex R2 1.41 7.28 74.43 93.35 8.30 Kleber Viaxer 1.35 6.91 73.95 93.60 8.12 Stunner SV 198 1.30 7.13 71.83 93.08 8.49 Fulda Diadem Linero 1.21 6.48 72.05 90.12 8.06 Yokohama A 539 1.16 7.57 71.37 87.80 8.43
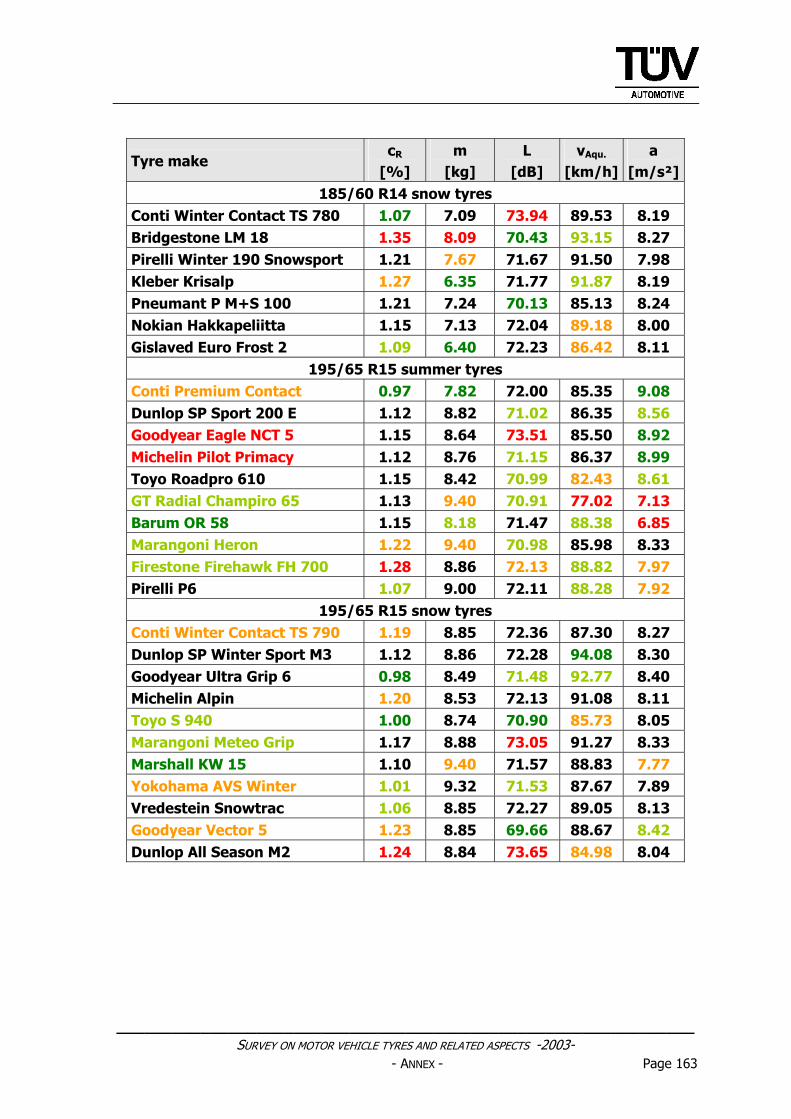
______________________________________________________________ SURVEY ON MOTOR VEHICLE TYRES AND RELATED ASPECTS -2003-
- ANNEX - Page 163
Tyre make cR
[%] m
[kg] L
[dB] vAqu.
[km/h] a
[m/s²]185/60 R14 snow tyres
Conti Winter Contact TS 780 1.07 7.09 73.94 89.53 8.19 Bridgestone LM 18 1.35 8.09 70.43 93.15 8.27 Pirelli Winter 190 Snowsport 1.21 7.67 71.67 91.50 7.98 Kleber Krisalp 1.27 6.35 71.77 91.87 8.19 Pneumant P M+S 100 1.21 7.24 70.13 85.13 8.24 Nokian Hakkapeliitta 1.15 7.13 72.04 89.18 8.00 Gislaved Euro Frost 2 1.09 6.40 72.23 86.42 8.11
195/65 R15 summer tyres Conti Premium Contact 0.97 7.82 72.00 85.35 9.08 Dunlop SP Sport 200 E 1.12 8.82 71.02 86.35 8.56 Goodyear Eagle NCT 5 1.15 8.64 73.51 85.50 8.92 Michelin Pilot Primacy 1.12 8.76 71.15 86.37 8.99 Toyo Roadpro 610 1.15 8.42 70.99 82.43 8.61 GT Radial Champiro 65 1.13 9.40 70.91 77.02 7.13 Barum OR 58 1.15 8.18 71.47 88.38 6.85 Marangoni Heron 1.22 9.40 70.98 85.98 8.33 Firestone Firehawk FH 700 1.28 8.86 72.13 88.82 7.97 Pirelli P6 1.07 9.00 72.11 88.28 7.92
195/65 R15 snow tyres Conti Winter Contact TS 790 1.19 8.85 72.36 87.30 8.27 Dunlop SP Winter Sport M3 1.12 8.86 72.28 94.08 8.30 Goodyear Ultra Grip 6 0.98 8.49 71.48 92.77 8.40 Michelin Alpin 1.20 8.53 72.13 91.08 8.11 Toyo S 940 1.00 8.74 70.90 85.73 8.05 Marangoni Meteo Grip 1.17 8.88 73.05 91.27 8.33 Marshall KW 15 1.10 9.40 71.57 88.83 7.77 Yokohama AVS Winter 1.01 9.32 71.53 87.67 7.89 Vredestein Snowtrac 1.06 8.85 72.27 89.05 8.13 Goodyear Vector 5 1.23 8.85 69.66 88.67 8.42 Dunlop All Season M2 1.24 8.84 73.65 84.98 8.04
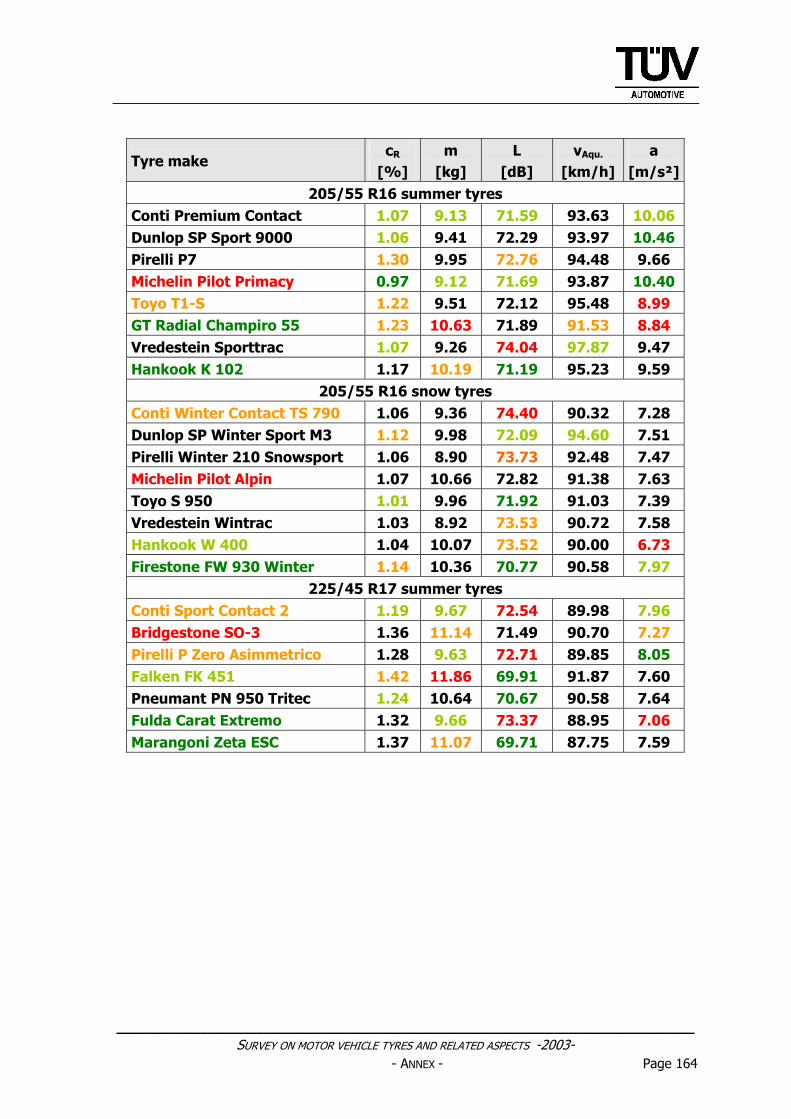
______________________________________________________________ SURVEY ON MOTOR VEHICLE TYRES AND RELATED ASPECTS -2003-
- ANNEX - Page 164
Tyre make cR
[%] m
[kg] L
[dB] vAqu.
[km/h] a
[m/s²]205/55 R16 summer tyres
Conti Premium Contact 1.07 9.13 71.59 93.63 10.06Dunlop SP Sport 9000 1.06 9.41 72.29 93.97 10.46Pirelli P7 1.30 9.95 72.76 94.48 9.66 Michelin Pilot Primacy 0.97 9.12 71.69 93.87 10.40Toyo T1-S 1.22 9.51 72.12 95.48 8.99 GT Radial Champiro 55 1.23 10.63 71.89 91.53 8.84 Vredestein Sporttrac 1.07 9.26 74.04 97.87 9.47 Hankook K 102 1.17 10.19 71.19 95.23 9.59
205/55 R16 snow tyres Conti Winter Contact TS 790 1.06 9.36 74.40 90.32 7.28 Dunlop SP Winter Sport M3 1.12 9.98 72.09 94.60 7.51 Pirelli Winter 210 Snowsport 1.06 8.90 73.73 92.48 7.47 Michelin Pilot Alpin 1.07 10.66 72.82 91.38 7.63 Toyo S 950 1.01 9.96 71.92 91.03 7.39 Vredestein Wintrac 1.03 8.92 73.53 90.72 7.58 Hankook W 400 1.04 10.07 73.52 90.00 6.73 Firestone FW 930 Winter 1.14 10.36 70.77 90.58 7.97
225/45 R17 summer tyres Conti Sport Contact 2 1.19 9.67 72.54 89.98 7.96 Bridgestone SO-3 1.36 11.14 71.49 90.70 7.27 Pirelli P Zero Asimmetrico 1.28 9.63 72.71 89.85 8.05 Falken FK 451 1.42 11.86 69.91 91.87 7.60 Pneumant PN 950 Tritec 1.24 10.64 70.67 90.58 7.64 Fulda Carat Extremo 1.32 9.66 73.37 88.95 7.06 Marangoni Zeta ESC 1.37 11.07 69.71 87.75 7.59
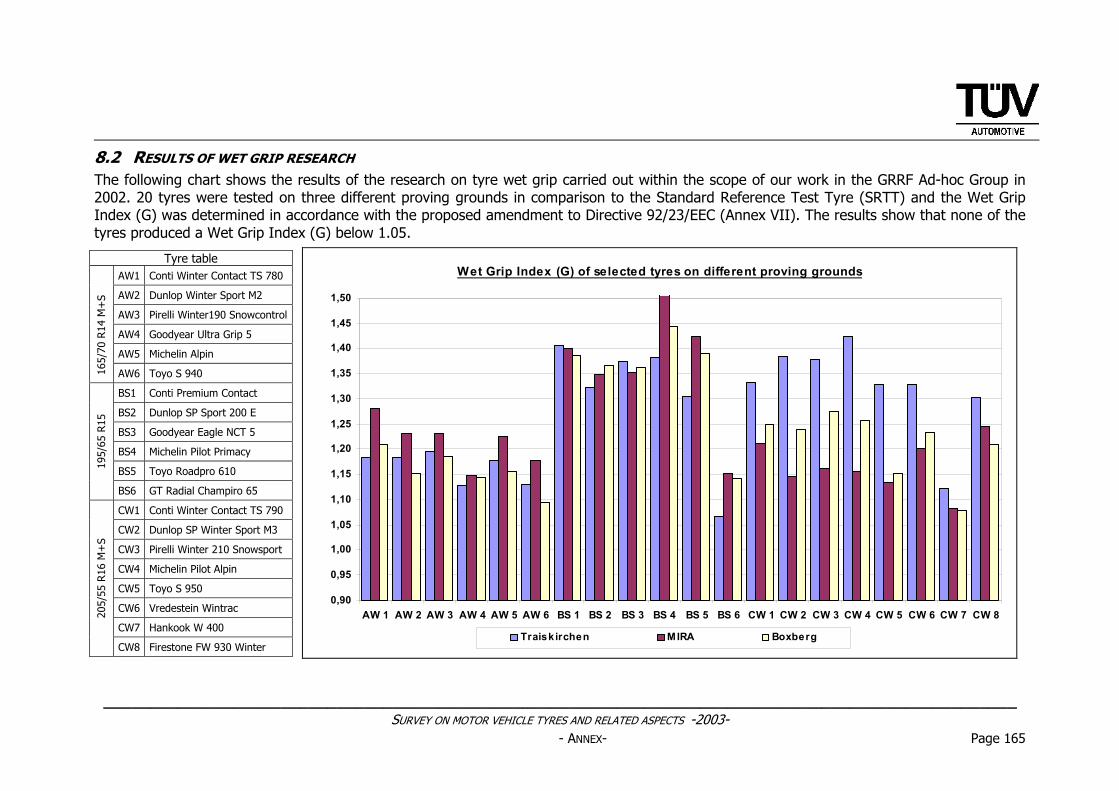
__________________________________________________________________________________________________ SURVEY ON MOTOR VEHICLE TYRES AND RELATED ASPECTS -2003-
- ANNEX- Page 165
8.2 RESULTS OF WET GRIP RESEARCH The following chart shows the results of the research on tyre wet grip carried out within the scope of our work in the GRRF Ad-hoc Group in 2002. 20 tyres were tested on three different proving grounds in comparison to the Standard Reference Test Tyre (SRTT) and the Wet Grip Index (G) was determined in accordance with the proposed amendment to Directive 92/23/EEC (Annex VII). The results show that none of the tyres produced a Wet Grip Index (G) below 1.05.
Wet Grip Index (G) of selected tyres on different proving grounds
0,90
0,95
1,00
1,05
1,10
1,15
1,20
1,25
1,30
1,35
1,40
1,45
1,50
AW 1 AW 2 AW 3 AW 4 AW 5 AW 6 BS 1 BS 2 BS 3 BS 4 BS 5 BS 6 CW 1 CW 2 CW 3 CW 4 CW 5 CW 6 CW 7 CW 8
Traiskirchen MIRA Boxberg
Tyre table AW1 Conti Winter Contact TS 780
AW2 Dunlop Winter Sport M2
AW3 Pirelli Winter190 Snowcontrol
AW4 Goodyear Ultra Grip 5
AW5 Michelin Alpin
165/
70 R
14 M
+S
AW6 Toyo S 940
BS1 Conti Premium Contact
BS2 Dunlop SP Sport 200 E
BS3 Goodyear Eagle NCT 5
BS4 Michelin Pilot Primacy
BS5 Toyo Roadpro 610 195/
65 R
15
BS6 GT Radial Champiro 65
CW1 Conti Winter Contact TS 790
CW2 Dunlop SP Winter Sport M3
CW3 Pirelli Winter 210 Snowsport
CW4 Michelin Pilot Alpin
CW5 Toyo S 950
CW6 Vredestein Wintrac
CW7 Hankook W 400
205/
55 R
16 M
+S
CW8 Firestone FW 930 Winter
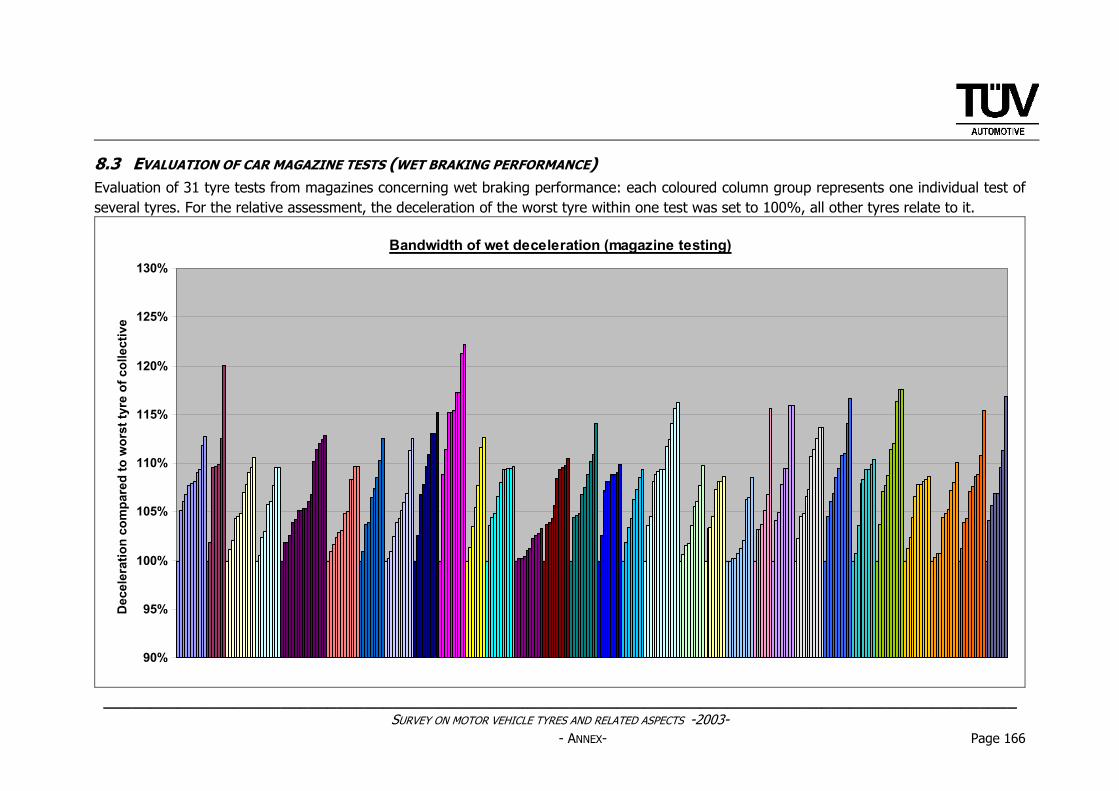
__________________________________________________________________________________________________ SURVEY ON MOTOR VEHICLE TYRES AND RELATED ASPECTS -2003-
- ANNEX- Page 166
8.3 EVALUATION OF CAR MAGAZINE TESTS (WET BRAKING PERFORMANCE) Evaluation of 31 tyre tests from magazines concerning wet braking performance: each coloured column group represents one individual test of several tyres. For the relative assessment, the deceleration of the worst tyre within one test was set to 100%, all other tyres relate to it.
Bandwidth of wet deceleration (magazine testing)
90%
95%
100%
105%
110%
115%
120%
125%
130%
Dec
eler
atio
n co
mpa
red
to w
orst
tyre
of c
olle
ctiv
e
______________________________________________________________ SURVEY ON MOTOR VEHICLE TYRES AND RELATED ASPECTS -2003-
- ANNEX - Page 167
8.4 COMPARISON BETWEEN TYRES FROM ORIGINAL EQUIPMENT AND THE
AFTERMARKET (ANONYMISED SHORT VERSION OF TEST REPORT) TEST DETAILS
Tyres
Size: 205/55 R16 91 W
Original equipment tyres: • OEA1 (Japanese make) • OEA2 (French make) • OEB1 (English/American make) • OEB2 (German make)
OE for vehicle A
OE for vehicle B
Aftermarket tyres:
• AM1 (German make, follow-up model of OEB2) • AM2 (Japanese make) • AM3 (American/Japanese make) • AM4 (Own-label of a German chain of tyre dealers) • AM5 (less known, low-cost Italian make)
Test vehicles
Both test vehicles were middle class saloon passenger cars, engine power ~ 130 kW. • Vehicle A: front wheel drive, Diesel engine • Vehicle B: rear wheel drive, petrol engine
HIGH SPEED ENDURANCE (Procedure acc. to ECE R30, but with test load 83% of tyre load capacity, 4° camber and tyre inflation of 2.7 bar) Looking at the overall results of the high-speed endurance tests, the tested tyres showed noticeable differences. The chosen testing program made higher demands on the tyres by the deviation from the legally required standard conditions (0° camber, 3.2 bar tyre inflation), in order to reveal the reliability under circumstances not fully complying with the intended operation conditions (i.e. misaligned chassis geometry, slight tyre underinflation).
Although none of the tyres in this test survived the highest speed stage given by the speed index (270 km/h) of the tyres without failure, all tyres in OE specification got damaged only at 270 or 260 km/h. Two tyres from the aftermarket also failed only at the highest speed stage; however, two other aftermarket makes were able to withstand 240 km/h only without damage. The damage resulted in a sudden blowout at one of the OE tyres as well as at one of the aftermarket tyres. Comparing the worst OE to the worst Aftermarket tyre in the test, a 4% higher safety factor appeared for the OE tyre.
______________________________________________________________ SURVEY ON MOTOR VEHICLE TYRES AND RELATED ASPECTS -2003-
- ANNEX- Page 168
ROLLING RESISTANCE (procedure acc. to DIN ISO 8767) The rolling resistance tests displayed considerable advantages of the OE-tyres compared to the aftermarket. The worst tyre had a rolling resistance coefficient cR of 30% higher than the best, which would affect the fuel consumption of a vehicle in real traffic with an increase of approx. 5%. Summing up, the tested 4 OE-specifications had an averaged cR of 0.98, compared to an average of 1.16 of the 5 aftermarket tyres, a difference of 18% higher rolling resistance.
BRAKING ON DRY SURFACE (ABS-braking from 100 to 10 km/h) The difference in deceleration ability on dry asphalt surface was in a comparably narrow range. The maximum differences in deceleration between the best and the worst tyre was 8%, which corresponds a prolongation of braking distance of 3 m when braking from 100 to 0 km/h. The vehicle with the worse tyres has a remaining speed of 25 km/h while the vehicle with the better tyres already stands still.
BRAKING ON WET SURFACE (ABS braking on artificially rained asphalt and concrete surface from 80 to 20 km/h) At braking on wet surface, the complete test population was ranging within a rather narrow band, too. The balanced performance was positively disturbed only by one outlier on asphalt surface of one aftermarket tyre with a surpassing performance.
The mean values of OE and aftermarket tyres are on an identical level on concrete. The asphalt results are affected by the mentioned outlier (approx. 8% better deceleration than the next best tyre), slight differences (~2%) for the AM tyres appear, rectified the same level for OE and AM tyres would result.
In principle, none of the tested tyres presented a safety critical performance at braking on wet road surface.
AQUAPLANING LONGITUDINAL Also here all tested tyres showed very stable performance (± 1%), only affected by a drop of one OE-specification, which had a floating speed of around 4% lower than the next worst tyre. Yet no critical performance is attributed to any of the tested tyres.
AQUAPLANING LATERAL Contrary to the behaviour in aquaplaning longitudinal, the tests of aquaplaning lateral, where the good harmonisation of the tyre performance and the conceptual chassis lay out design has decisive effect, brought up larger differences.
The worst tyre on both vehicles show a relatively linear and thus actually rather uncritical decrease of transmittable lateral forces, but the level at only 2 mm water depth
______________________________________________________________ SURVEY ON MOTOR VEHICLE TYRES AND RELATED ASPECTS -2003-
- ANNEX- Page 169
is e.g. already 10% below the top values with the rear wheel driven car, rising up to unacceptable 40% below the best at 6 mm water depth.
A further aftermarket tyre stood out due to a comparably distinct and progressive decrease of lateral acceleration with increasing water depth, which indicates critical driveability at the limits.
Basically, the performance of the largest part of the tyres was adequate and uncritical on both vehicles, with differences in an acceptable bandwidth. Particularly on one vehicle, for two tyres from the aftermarket slight concerns do exist with regard to a deterioration of active driving safety, due to the abovementioned reasons.
To get an overview on the totality of the objectively measured test results of the single tyres, the results are summarized in a chart at the end of this annex chapter. For the relative evaluation, the average of the population was determined for each individual test, and then the deviation of the single tyres was related to this average value. HANDLING DRY AND WET As expected, the largest differences between the tyres occurred in the vehicle handling. Generally, the OE-specifications for the individual vehicles obtained the best assessments, which can be attributed last but not least to the best balance of performance in the relevant single criteria. The test tyres from the aftermarket partly showed very different performances. Here, the difficulty became apparent to maintain a persistently good level of performance in all main criteria, i.e. steering behaviour, longitudinal dynamics and cornering behaviour/driving stability.
Especially the importance of a matching adaptation between the tyre properties and the vehicle’s and chassis’ specific characteristics. While e.g. one of the AM tyres reached - on the rear wheel driven car - an overall assessment close to OE-standard, on the front wheel driven vehicle no such good overall result could be reached with the same tyre, mainly due to only mediocre performance on wet surface. Conversely, another AM tyre got very good ratings in the wet handling but showed deficits in the dry.
Summarizing, 3 of 5 tested AM tyres show good respectively sufficient performance, (partly with certain losses in driveability but tolerable from the viewpoint of active safety) to serve as replacement tyres without any concerns. To one of the AM tyres even an overall performance close to OE qualification was attested (AM3 on vehicle B). At two of the AM tyres, critical driveability with regard to safety relevant criteria (vehicle control at lane change, throttle lag reactions, cornering stability at higher speeds) was revealed, in dependence on the vehicle the tyres were fitted to. Additionally, to some AM tyres a certain sensitivity to thermal stress had to be attributed, i.e. a noticeable drop of performance at warming of the tyres.
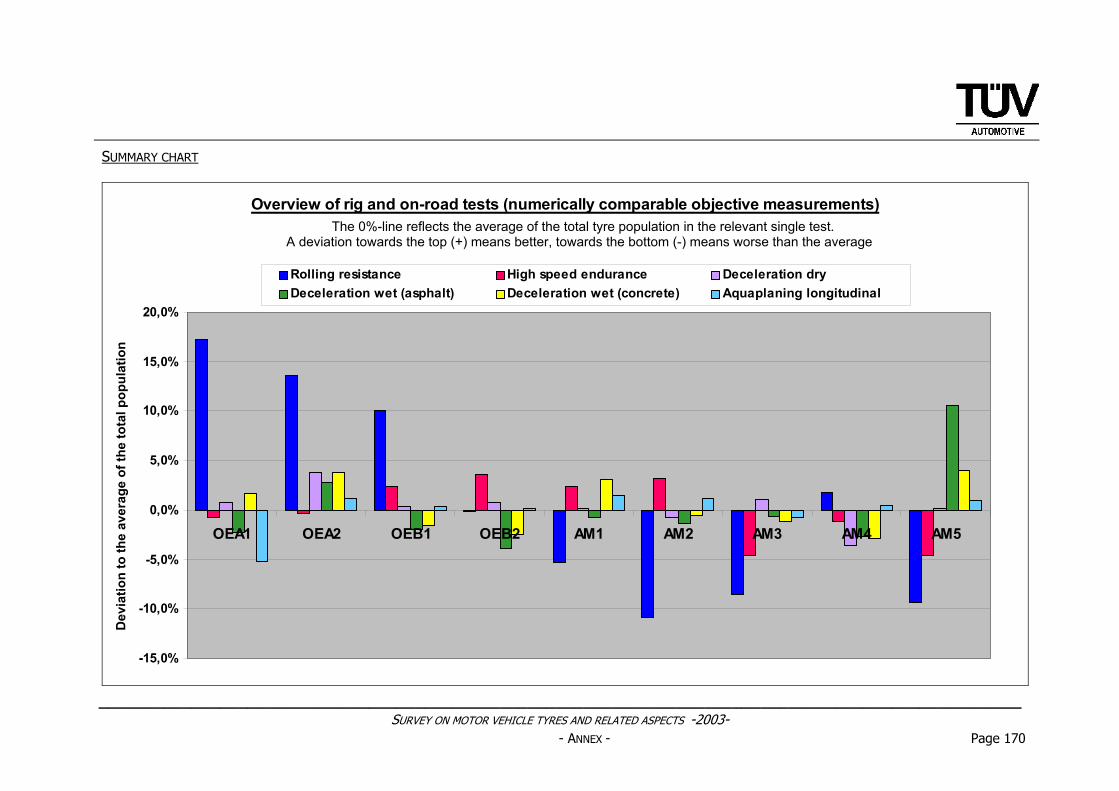
___________________________________________________________________________________________________ SURVEY ON MOTOR VEHICLE TYRES AND RELATED ASPECTS -2003-
- ANNEX - Page 170
SUMMARY CHART
Overview of rig and on-road tests (numerically comparable objective measurements)
-15,0%
-10,0%
-5,0%
0,0%
5,0%
10,0%
15,0%
20,0%
OEA1 OEA2 OEB1 OEB2 AM1 AM2 AM3 AM4 AM5
Dev
iatio
n to
the
aver
age
of th
e to
tal p
opul
atio
n
Rolling resistance High speed endurance Deceleration dryDeceleration wet (asphalt) Deceleration wet (concrete) Aquaplaning longitudinal
The 0%-line reflects the average of the total tyre population in the relevant single test. A deviation towards the top (+) means better, towards the bottom (-) means worse than the average
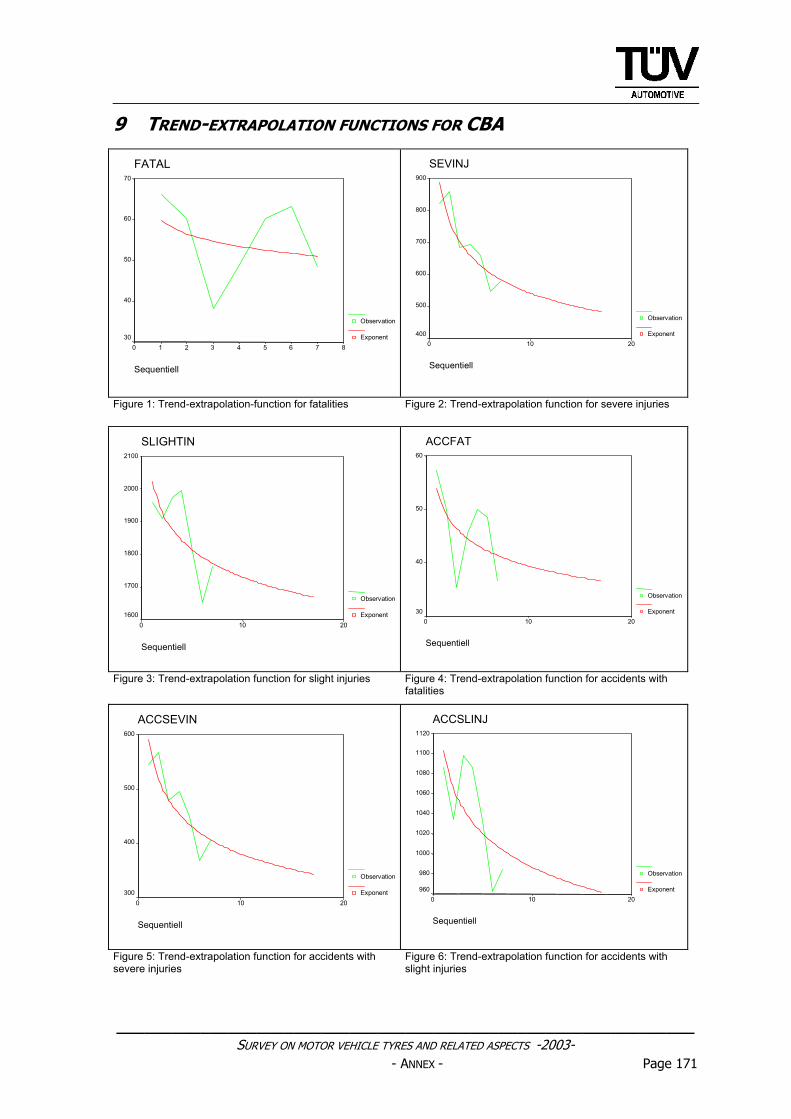
______________________________________________________________ SURVEY ON MOTOR VEHICLE TYRES AND RELATED ASPECTS -2003-
- ANNEX - Page 171
9 TREND-EXTRAPOLATION FUNCTIONS FOR CBA
FATAL
Sequentiell
876543210
70
60
50
40
30
Observation
Exponent
SEVINJ
Sequentiell
20100
900
800
700
600
500
400
Observation
Exponent
Figure 1: Trend-extrapolation-function for fatalities Figure 2: Trend-extrapolation function for severe injuries
SLIGHTIN
Sequentiell
20100
2100
2000
1900
1800
1700
1600
Observation
Exponent
ACCFAT
Sequentiell
20100
60
50
40
30
Observation
Exponent
Figure 3: Trend-extrapolation function for slight injuries Figure 4: Trend-extrapolation function for accidents with
fatalities
ACCSEVIN
Sequentiell
20100
600
500
400
300
Observation
Exponent
ACCSLINJ
Sequentiell
20100
1120
1100
1080
1060
1040
1020
1000
980
960
Observation
Exponent
Figure 5: Trend-extrapolation function for accidents with severe injuries
Figure 6: Trend-extrapolation function for accidents with slight injuries
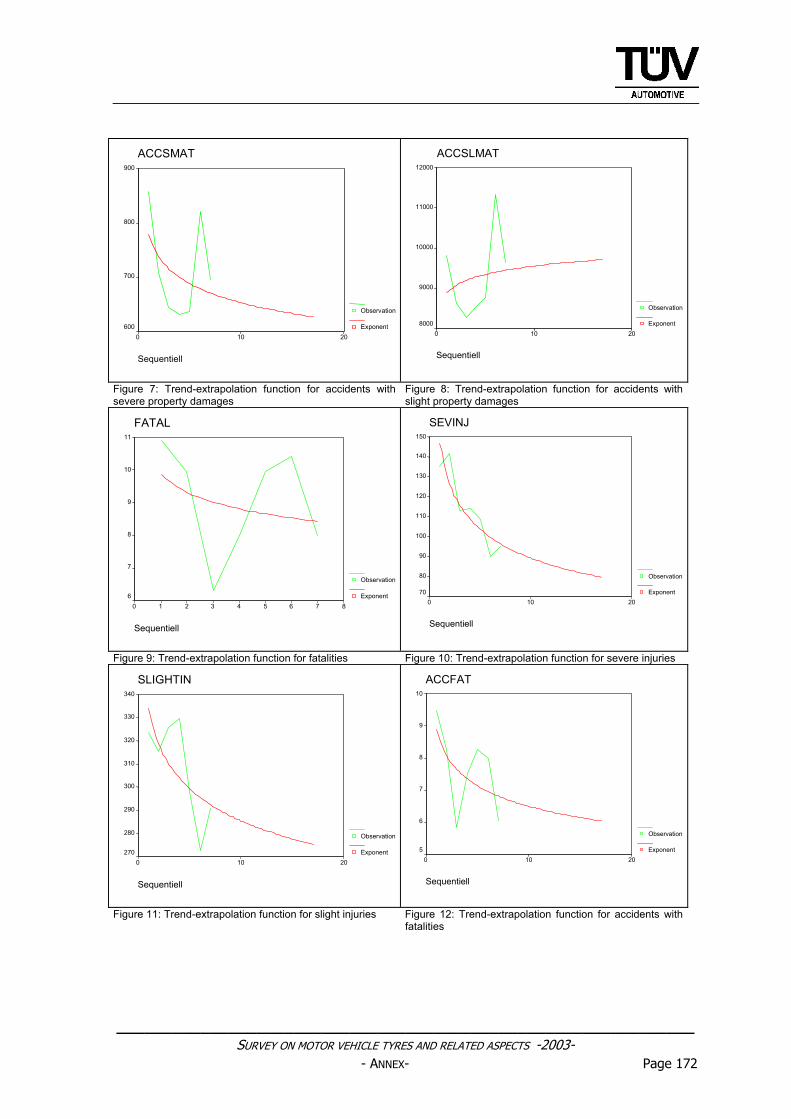
______________________________________________________________ SURVEY ON MOTOR VEHICLE TYRES AND RELATED ASPECTS -2003-
- ANNEX- Page 172
ACCSMAT
Sequentiell
20100
900
800
700
600
Observation
Exponent
ACCSLMAT
Sequentiell
20100
12000
11000
10000
9000
8000
Observation
Exponent
Figure 7: Trend-extrapolation function for accidents with severe property damages
Figure 8: Trend-extrapolation function for accidents with slight property damages
FATAL
Sequentiell
876543210
11
10
9
8
7
6
Observation
Exponent
SEVINJ
Sequentiell
20100
150
140
130
120
110
100
90
80
70
Observation
Exponent
Figure 9: Trend-extrapolation function for fatalities Figure 10: Trend-extrapolation function for severe injuries
SLIGHTIN
Sequentiell
20100
340
330
320
310
300
290
280
270
Observation
Exponent
ACCFAT
Sequentiell
20100
10
9
8
7
6
5
Observation
Exponent
Figure 11: Trend-extrapolation function for slight injuries Figure 12: Trend-extrapolation function for accidents with
fatalities
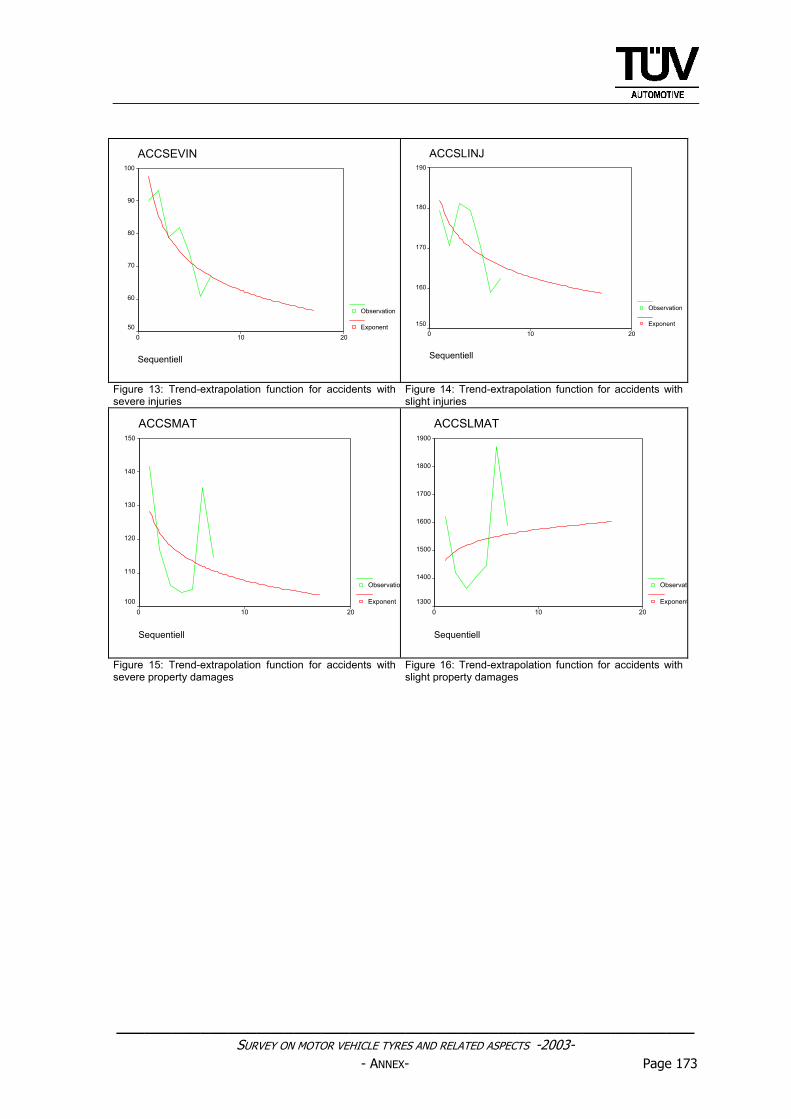
______________________________________________________________ SURVEY ON MOTOR VEHICLE TYRES AND RELATED ASPECTS -2003-
- ANNEX- Page 173
ACCSEVIN
Sequentiell
20100
100
90
80
70
60
50
Observation
Exponent
ACCSLINJ
Sequentiell
20100
190
180
170
160
150
Observation
Exponent
Figure 13: Trend-extrapolation function for accidents with severe injuries
Figure 14: Trend-extrapolation function for accidents with slight injuries
ACCSMAT
Sequentiell
20100
150
140
130
120
110
100
Observatio
Exponent
ACCSLMAT
Sequentiell
20100
1900
1800
1700
1600
1500
1400
1300
Observat
Exponent
Figure 15: Trend-extrapolation function for accidents with severe property damages
Figure 16: Trend-extrapolation function for accidents with slight property damages