Embed Size (px)
Citation preview
Survey of Medical Informatics
CS 493 – Fall 2004
November 1, 2004
V. “Juggy” Jagannathan
Streamlining Patient Safety Reporting
Part III: Patient Safety - Achieving a New Standard of Care.
IOM Report
Patient Safety data applications Clinical Performance data
regulators for accountability purposes Individual or organizations for purchasing
decisions Care providers to improve care processes
IOM Recommendation To develop an event taxonomy and common
report format to submit data to national patient safety databases
Patient Safety Reporting Systems and Applications
Chapter 8: Patient Safety - Achieving a New Standard of Care.
IOM Report
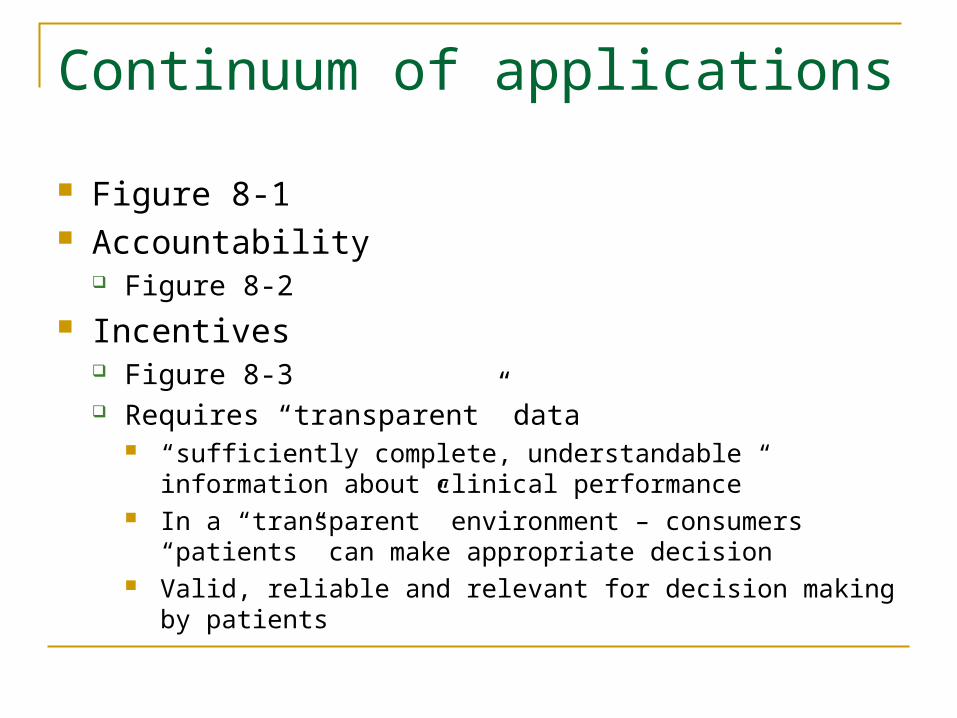
Continuum of applications
Figure 8-1 Accountability
Figure 8-2 Incentives
Figure 8-3 Requires “transparent” data
“sufficiently complete, understandable information about clinical performance”
In a “transparent” environment – consumers “patients” can make appropriate decision
Valid, reliable and relevant for decision making by patients
Performance data
Public reporting of performance data – sparse
Focus currently on hospitals, nursing homes, some surgical interventions
Very little on medical groups and physicians (ambulatory care)
Data: process-of-care measures, patient perceptions of care and accreditation status
Performance data
Even when they are available, currently they are not impacting consumer choice
Probably because: Lack of awareness on the existence of the data Limitations placed on choice of health plans and
providers Overly complex performance data Trustworthiness of the data
Benefits of public reporting
Promoting safer care produces fewer injuries and reduces legal and malpractice exposure
Promotes health providers to set goals for improving quality
System Redesign
Figure 8-4: Page 260 & 261 Accountability approach
Address performance problems which falls below minimum standards
Learning approach Reduce variability of performance Focus on continuous process improvement
Case Study
1986-1992 HCFA release mortality outcomes across 5,500 hospitals
Labeled based on statistical analysis: High Mortality outliers [highest 5%] – bad outcomes Low mortality outliers [bottom 5%] – good outcomes
Goal of HCFA to increase awareness of poorly performing institutions
However, analysis of measures revealed that categorization had significant error rates
In 1993, HCFA discontinued practice of reporting mortality measures
Selection of measures
Box 8-1, 264 Outcome measures aggregated over
geographic region – more reliable Measures can be used to improve processes
better than to build accountability systems
Cycle of fear
Figure 8-5 pg 266
Concept of preventability
Preventable errors vs. unavoidable treatment consequences
Example: 28% of ADE in one hospital was allergic reaction with patients with no prior history of such reaction even in this case policies can provide mitigating strategies.
Implications for patient safety data systems Data system design Standardized data Patient safety data audits
Standardized Reporting
Chapter 9: Patient Safety - Achieving a New Standard of Care.
IOM Report
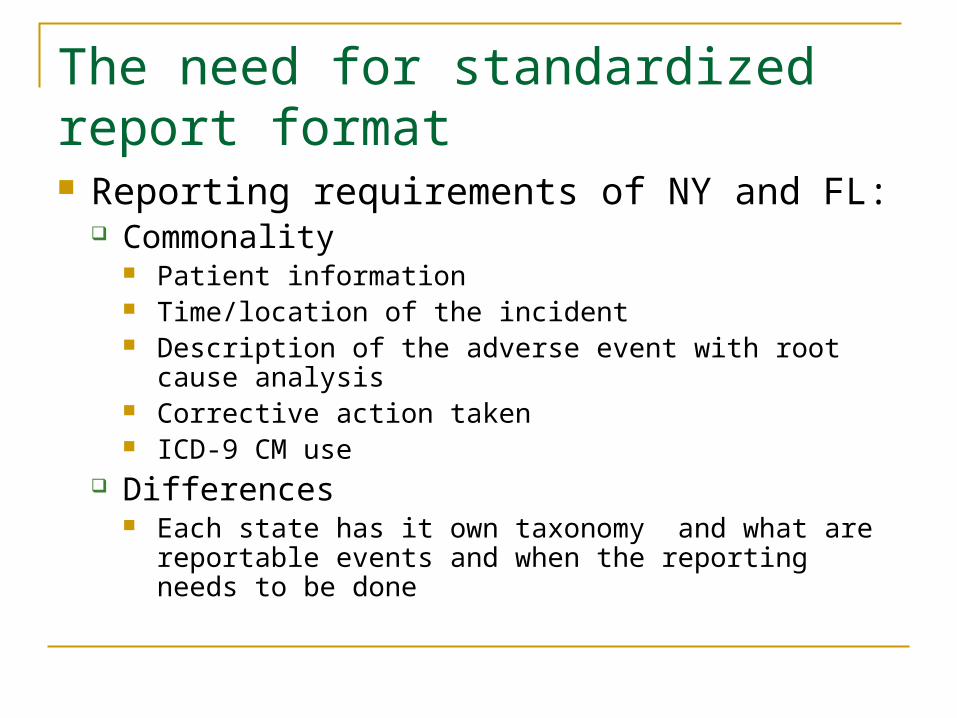
The need for standardized report format Reporting requirements of NY and FL:
Commonality Patient information Time/location of the incident Description of the adverse event with root cause
analysis Corrective action taken ICD-9 CM use
Differences Each state has it own taxonomy and what are
reportable events and when the reporting needs to be done
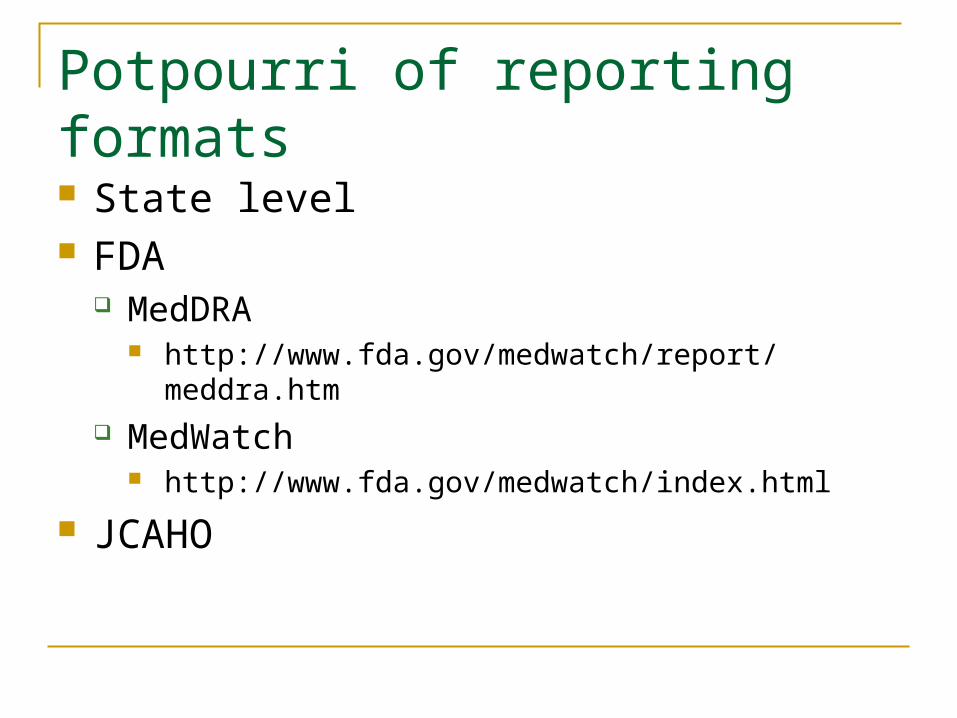
Potpourri of reporting formats State level FDA
MedDRA http://www.fda.gov/medwatch/report/meddra.htm
MedWatch http://www.fda.gov/medwatch/index.html
JCAHO
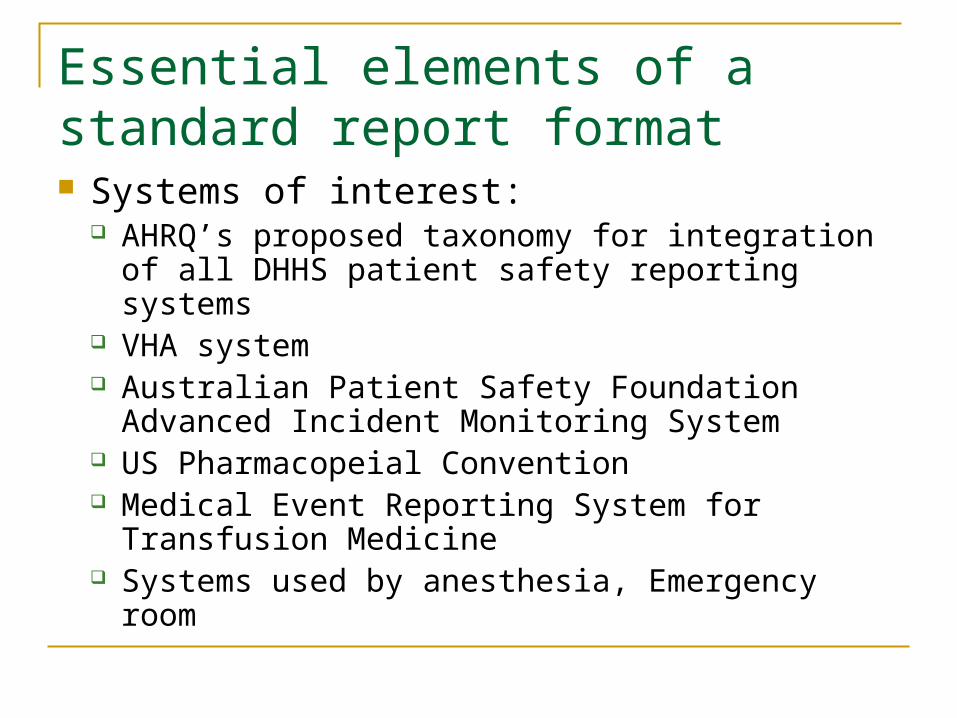
Essential elements of a standard report format Systems of interest:
AHRQ’s proposed taxonomy for integration of all DHHS patient safety reporting systems
VHA system Australian Patient Safety Foundation Advanced
Incident Monitoring System US Pharmacopeial Convention Medical Event Reporting System for Transfusion
Medicine Systems used by anesthesia, Emergency room
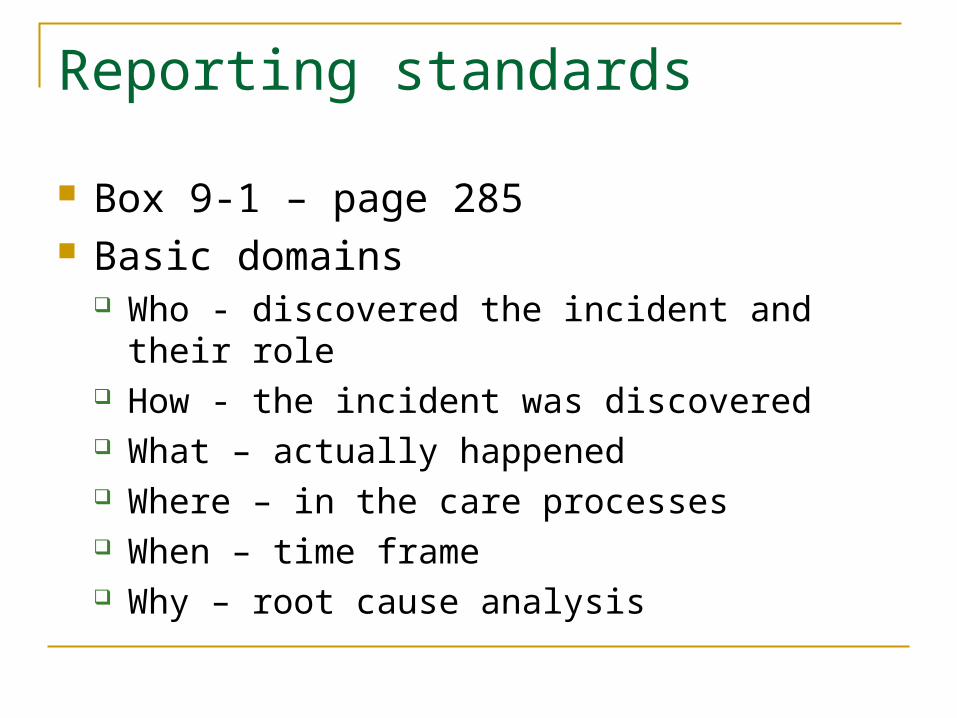
Reporting standards
Box 9-1 – page 285 Basic domains
Who - discovered the incident and their role How - the incident was discovered What – actually happened Where – in the care processes When – time frame Why – root cause analysis
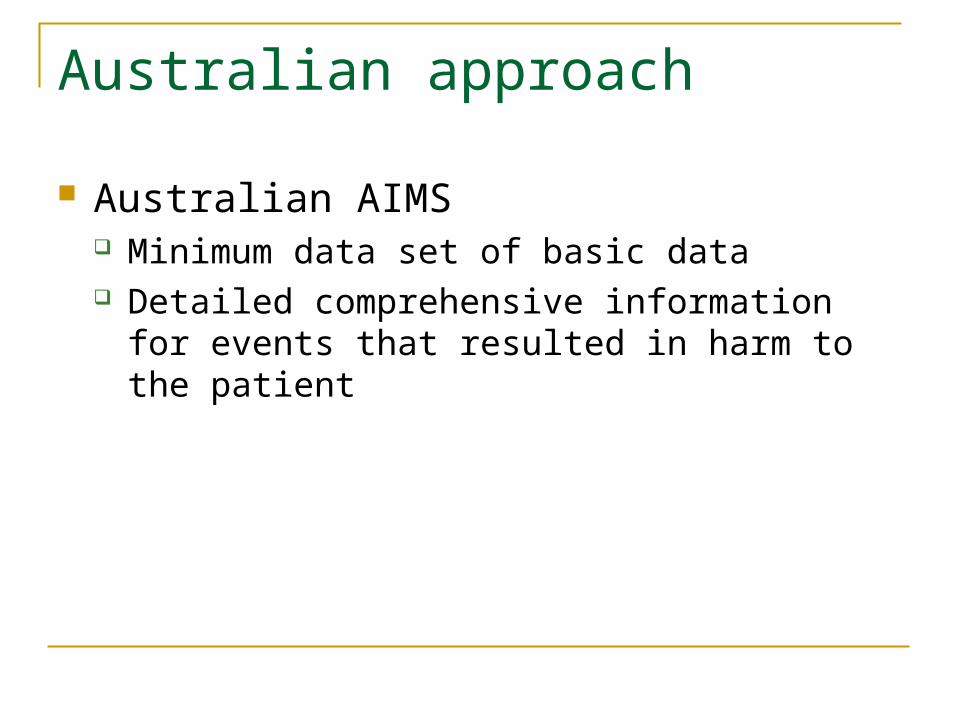
Australian approach
Australian AIMS Minimum data set of basic data Detailed comprehensive information for events
that resulted in harm to the patient
Event-type taxonomy
Multiple taxonomies in existence – and none are comprehensive
ICD-9/10 CM External Causes and Injury Codes (E-codes) and LOINC codes
E-Codes problems Lack temporal information Ambiguous clinical content Cannot differentiate events that occurred prior to
hospitalization from those that occurred during hospitalization
Lack of ability to categorize degree of harm Lack of ability to capture near misses
Patient Safety Terminology
Anesthesia domain – available in SNOMED CT
Australia AIMS uses a Generic Reference Model (GRM)
Health Incident Type taxonomy of event categories: falls, medication etc.
Risk assessment index
Scale measuring risk from near miss to death USP MedMARx ranks medication events –
Table 9-1 – page 293 (http://www.usp.org/medmarx/index.html )
AIMS risk assessment based on VHA model – Table 9-2 – pg 294
MERS TM – risk assessment index – Table 9-3 pg – 294
(http://www.mers-tm.net/ )
Causal Analysis
Root cause analysis on serious events VHA National Center for Patient Safety:
http://www.patientsafety.gov/tools.html Root cause analysis factors: (http://www.patientsafety.gov/concepts.html )
Human factors communication Human factors training Human factors fatigue/scheduling Environment and equipment Rules, policies, and procedures Barriers (safeguards)
Figure 9-1 page 297
Causal analysis
Eindhoven Classification model – fig 9-2 pg 299 Technical factors – equipment, software Organizational factors – policies, procedures,
protocols Human factors
Table 9-4, pg 300
Summary of domain areas for a common report format Box 9-2 pg 303 WHO has contracted with JCAHO for defining
standard reports
Implementation of the report format AHRQ should be given the lead to implement
the report format HL7 Patient Safety Special Interest Group Tools such as the one made available from
AIMS
De-identification and data protection External reports need to be de-identified Fear of law suits abound
Primary and secondary uses of report data Primary use to improve care processes Secondary use – epidemiological research,
public health, drug safety surveillance, Health Insurance bonus to physicians
Example of improvement in care process Ensuring Correct surgery directive of VHA Child health Accountability Initiative
Table 9-5 page 312