Embed Size (px)
Citation preview
Survey of Household Solid Waste Generation and Public
Awareness on Waste Separation and Compositing Practices in
Cebu City
June 2011
Compiled and Edited By
D.G.J.Premakumara
This survey on household solid waste generation and composition in Cebu City was carried out as part of the Community-Based Solid Waste Management System Development Project in Cebu City.
IGES – Kitakyushu Urban Centre
International Village Center 2F, 1‐1‐1, Hirano,
Yahata‐Higashi‐Ku, Kitakyushu City, Japan
Phone: 81‐93‐681‐1563 Facsimile: 81‐93‐681‐1564
SURVEY OF HOUSEHOLD SOLID WASTE GENERATION AND PUBLIC AWARENESS ON WASTE SEPARATION AND COMPOSITING PRACTICES IN CEBU CITY
June 1, 2011
2
1. Introduction
1.1 About this survey This survey on household solid waste generation and composition in Cebu City was carried out as part of the Community-Based Solid Waste Management System Development Project (2010-2013) implemented by Cebu City with the technical cooperation of the Kitakyushu International Techno-Cooperative Association (KITA) and the Institute for Global Environmental Strategies (IGES) under the funding assistance from the Japan Fund for Global Environment (JFGE). The project aims to establish a model for community-based solid waste reduction system through a corporation among key stakeholders, including citizens, NGOs and local government, by introducing the practice of composting for organic waste management, the segregation of recyclable, and awareness building and environmental education for citizens at the Barangay level. For these purposes, the survey focused on the following key aspects: To get an idea of the amount of waste produced by an average household To get an idea of the average composition of household waste, and In addition, members of these households were also asked a few questions, pertaining to
their usual behaviour and their knowledge and attitudes towards solid waste management. The report is structured as follows: Section 1 gives some background information about the current situation regarding solid
waste management in Cebu City, and the basic laws and regulations governing the various aspects of the solid waste in the city.
Section 2 presents the main results of the household survey carried out in the eight pilot Barangays.
Section 3 summarizes the important points raised in the preceding sections and recommendations are made to consider in planning and implementation of the community-based solid waste management system development projects in Cebu City.
1.2 Methodology and Limitations In order to obtain general information on organizational and practical aspects of solid waste management in Cebu city, interviews were conducted by the relevant government officials in both city office and Barangays. Interviews were both formal and informal using open-ended guide questions followed by relevant probing queries. Additional documents on solid waste management in Cebu City were also collected and reviewed for obtaining secondary data. Waste production and composition at household level was measured by household survey carried out in eight pilot Baranagays in Cebu City in September 2010. A sample of 118 households was randomly selected from these pilot Barangays after consultation with both city officials and Barangay officials. The Table 1 gives the basic information about the pilot Barangays.
SURVEY OF HOUSEHOLD SOLID WASTE GENERATION AND PUBLIC AWARENESS ON WASTE SEPARATION AND COMPOSITING PRACTICES IN CEBU CITY
June 1, 2011
3
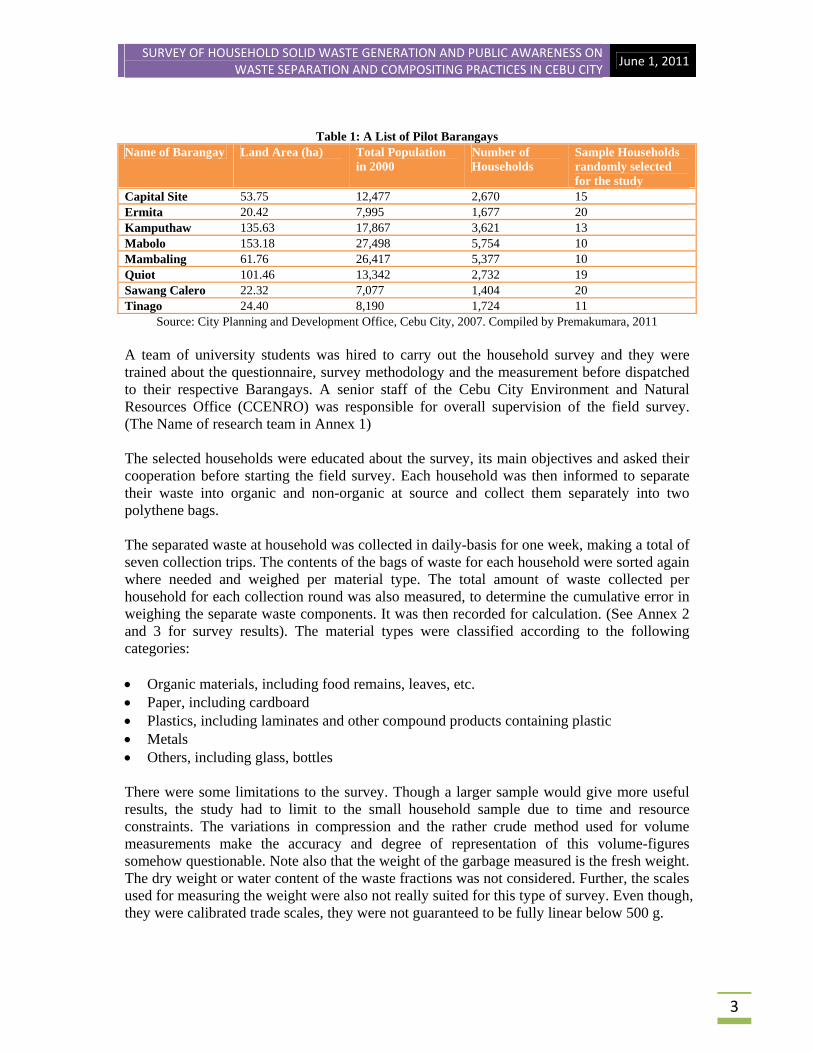
Table 1: A List of Pilot Barangays Name of Barangay Land Area (ha) Total Population
in 2000 Number of Households
Sample Households randomly selected for the study
Capital Site 53.75 12,477 2,670 15 Ermita 20.42 7,995 1,677 20 Kamputhaw 135.63 17,867 3,621 13 Mabolo 153.18 27,498 5,754 10 Mambaling 61.76 26,417 5,377 10 Quiot 101.46 13,342 2,732 19 Sawang Calero 22.32 7,077 1,404 20 Tinago 24.40 8,190 1,724 11
Source: City Planning and Development Office, Cebu City, 2007. Compiled by Premakumara, 2011 A team of university students was hired to carry out the household survey and they were trained about the questionnaire, survey methodology and the measurement before dispatched to their respective Barangays. A senior staff of the Cebu City Environment and Natural Resources Office (CCENRO) was responsible for overall supervision of the field survey. (The Name of research team in Annex 1) The selected households were educated about the survey, its main objectives and asked their cooperation before starting the field survey. Each household was then informed to separate their waste into organic and non-organic at source and collect them separately into two polythene bags. The separated waste at household was collected in daily-basis for one week, making a total of seven collection trips. The contents of the bags of waste for each household were sorted again where needed and weighed per material type. The total amount of waste collected per household for each collection round was also measured, to determine the cumulative error in weighing the separate waste components. It was then recorded for calculation. (See Annex 2 and 3 for survey results). The material types were classified according to the following categories: Organic materials, including food remains, leaves, etc. Paper, including cardboard Plastics, including laminates and other compound products containing plastic Metals Others, including glass, bottles
There were some limitations to the survey. Though a larger sample would give more useful results, the study had to limit to the small household sample due to time and resource constraints. The variations in compression and the rather crude method used for volume measurements make the accuracy and degree of representation of this volume-figures somehow questionable. Note also that the weight of the garbage measured is the fresh weight. The dry weight or water content of the waste fractions was not considered. Further, the scales used for measuring the weight were also not really suited for this type of survey. Even though, they were calibrated trade scales, they were not guaranteed to be fully linear below 500 g.
SURVEY OF HOUSEHOLD SOLID WASTE GENERATION AND PUBLIC AWARENESS ON WASTE SEPARATION AND COMPOSITING PRACTICES IN CEBU CITY
June 1, 2011
2. Solid Waste Management in Cebu City
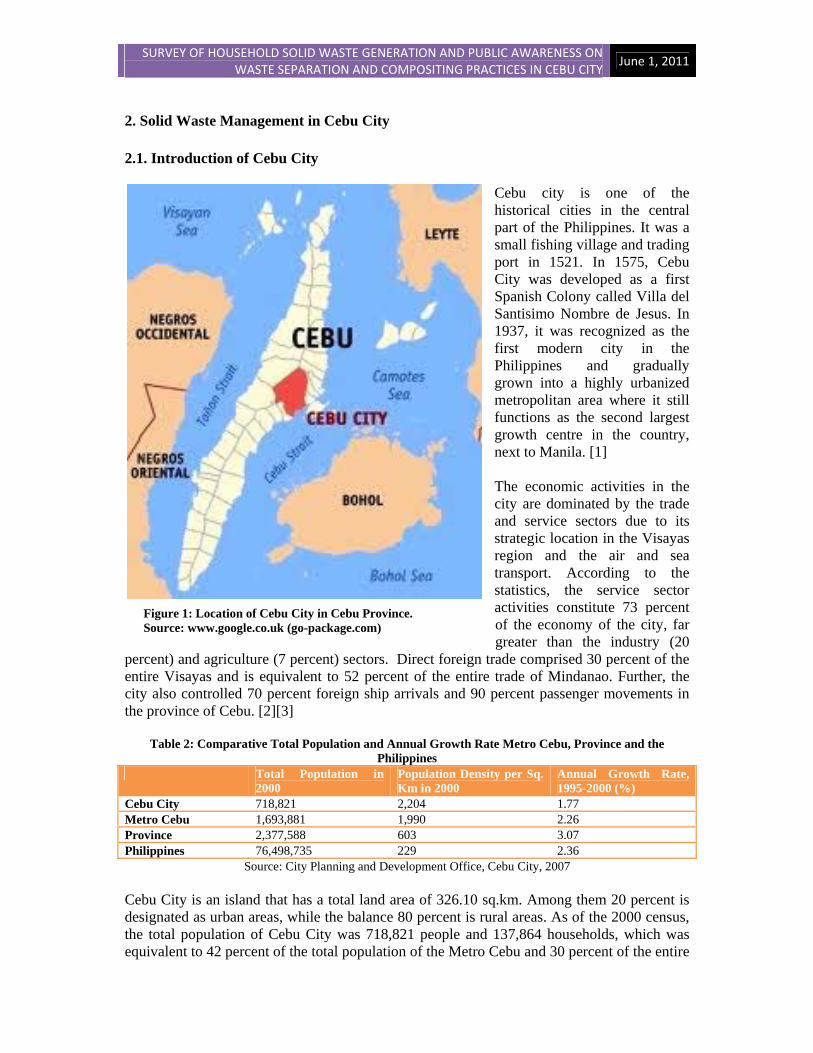
2.1. Introduction of Cebu City Cebu city is one of the historical cities in the central part of the Philippines. It was a small fishing village and trading port in 1521. In 1575, Cebu City was developed as a first Spanish Colony called Villa del Santisimo Nombre de Jesus. In 1937, it was recognized as the first modern city in the Philippines and gradually grown into a highly urbanized metropolitan area where it still functions as the second largest growth centre in the country, next to Manila. [1] The economic activities in the city are dominated by the trade and service sectors due to its strategic location in the Visayas region and the air and sea transport. According to the statistics, the service sector activities constitute 73 percent of the economy of the city, far greater than the industry (20
percent) and agriculture (7 percent) sectors. Direct foreign trade comprised 30 percent of the entire Visayas and is equivalent to 52 percent of the entire trade of Mindanao. Further, the city also controlled 70 percent foreign ship arrivals and 90 percent passenger movements in the province of Cebu. [2][3]
Table 2: Comparative Total Population and Annual Growth Rate Metro Cebu, Province and the Philippines
Total Population in 2000
Population Density per Sq. Km in 2000
Annual Growth Rate, 1995-2000 (%)
Cebu City 718,821 2,204 1.77 Metro Cebu 1,693,881 1,990 2.26 Province 2,377,588 603 3.07 Philippines 76,498,735 229 2.36
Source: City Planning and Development Office, Cebu City, 2007 Cebu City is an island that has a total land area of 326.10 sq.km. Among them 20 percent is designated as urban areas, while the balance 80 percent is rural areas. As of the 2000 census, the total population of Cebu City was 718,821 people and 137,864 households, which was equivalent to 42 percent of the total population of the Metro Cebu and 30 percent of the entire
Figure 1: Location of Cebu City in Cebu Province. Source: www.google.co.uk (go-package.com)
SURVEY OF HOUSEHOLD SOLID WASTE GENERATION AND PUBLIC AWARENESS ON WASTE SEPARATION AND COMPOSITING PRACTICES IN CEBU CITY
June 1, 2011
5
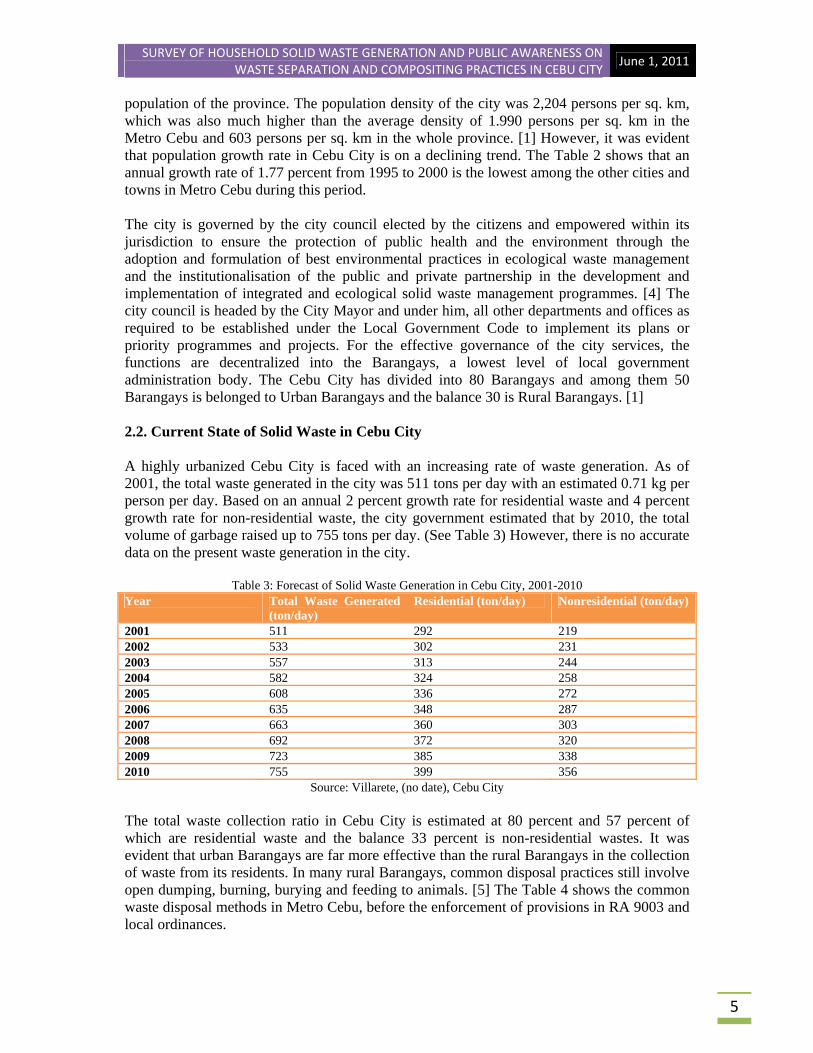
population of the province. The population density of the city was 2,204 persons per sq. km, which was also much higher than the average density of 1.990 persons per sq. km in the Metro Cebu and 603 persons per sq. km in the whole province. [1] However, it was evident that population growth rate in Cebu City is on a declining trend. The Table 2 shows that an annual growth rate of 1.77 percent from 1995 to 2000 is the lowest among the other cities and towns in Metro Cebu during this period. The city is governed by the city council elected by the citizens and empowered within its jurisdiction to ensure the protection of public health and the environment through the adoption and formulation of best environmental practices in ecological waste management and the institutionalisation of the public and private partnership in the development and implementation of integrated and ecological solid waste management programmes. [4] The city council is headed by the City Mayor and under him, all other departments and offices as required to be established under the Local Government Code to implement its plans or priority programmes and projects. For the effective governance of the city services, the functions are decentralized into the Barangays, a lowest level of local government administration body. The Cebu City has divided into 80 Barangays and among them 50 Barangays is belonged to Urban Barangays and the balance 30 is Rural Barangays. [1] 2.2. Current State of Solid Waste in Cebu City A highly urbanized Cebu City is faced with an increasing rate of waste generation. As of 2001, the total waste generated in the city was 511 tons per day with an estimated 0.71 kg per person per day. Based on an annual 2 percent growth rate for residential waste and 4 percent growth rate for non-residential waste, the city government estimated that by 2010, the total volume of garbage raised up to 755 tons per day. (See Table 3) However, there is no accurate data on the present waste generation in the city.
Table 3: Forecast of Solid Waste Generation in Cebu City, 2001-2010 Year Total Waste Generated
(ton/day) Residential (ton/day) Nonresidential (ton/day)
2001 511 292 219 2002 533 302 231 2003 557 313 244 2004 582 324 258 2005 608 336 272 2006 635 348 287 2007 663 360 303 2008 692 372 320 2009 723 385 338 2010 755 399 356
Source: Villarete, (no date), Cebu City The total waste collection ratio in Cebu City is estimated at 80 percent and 57 percent of which are residential waste and the balance 33 percent is non-residential wastes. It was evident that urban Barangays are far more effective than the rural Barangays in the collection of waste from its residents. In many rural Barangays, common disposal practices still involve open dumping, burning, burying and feeding to animals. [5] The Table 4 shows the common waste disposal methods in Metro Cebu, before the enforcement of provisions in RA 9003 and local ordinances.
SURVEY OF HOUSEHOLD SOLID WASTE GENERATION AND PUBLIC AWARENESS ON WASTE SEPARATION AND COMPOSITING PRACTICES IN CEBU CITY
June 1, 2011
Table 4: Common Waste Disposal Methods in Metro Cebu, 2000
Method of Waste Disposal Household Total Number Percentage (%)
All Methods 676,401 100 Pickup by garbage trucks 212,652 31.5 Dumping 71,192 10.5 Burning 331,762 49.1 Composting 16,891 2.5 Burying 16,891 2.5 Feeding to animals 11,929 1.8 Others 4,272 0.6
Source: UNEP, 2009 Table 5 estimated that the composition of municipal solid waste of Cebu City as follows: 50 percent of organic waste, 16 percent of plastic, 16 percent of paper, 4 percent of metal and 14 percent of others.
Table 5: Physical Composition of Waste in Cebu City, 2011 Physical Composition Percentage Organic waste 50% Plastic 16% Paper 16% Metal 4% Others 14%
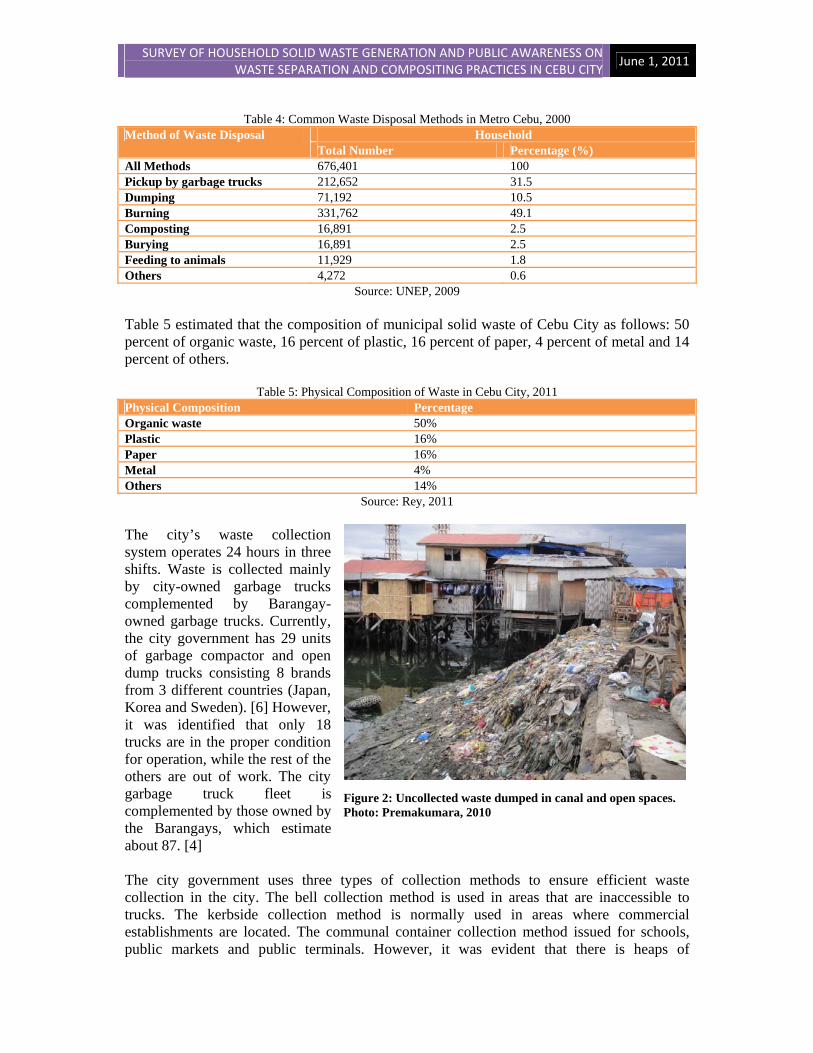
Source: Rey, 2011 The city’s waste collection system operates 24 hours in three shifts. Waste is collected mainly by city-owned garbage trucks complemented by Barangay-owned garbage trucks. Currently, the city government has 29 units of garbage compactor and open dump trucks consisting 8 brands from 3 different countries (Japan, Korea and Sweden). [6] However, it was identified that only 18 trucks are in the proper condition for operation, while the rest of the others are out of work. The city garbage truck fleet is complemented by those owned by the Barangays, which estimate about 87. [4] The city government uses three types of collection methods to ensure efficient waste collection in the city. The bell collection method is used in areas that are inaccessible to trucks. The kerbside collection method is normally used in areas where commercial establishments are located. The communal container collection method issued for schools, public markets and public terminals. However, it was evident that there is heaps of
Figure 2: Uncollected waste dumped in canal and open spaces. Photo: Premakumara, 2010
SURVEY OF HOUSEHOLD SOLID WASTE GENERATION AND PUBLIC AWARENESS ON WASTE SEPARATION AND COMPOSITING PRACTICES IN CEBU CITY
June 1, 2011
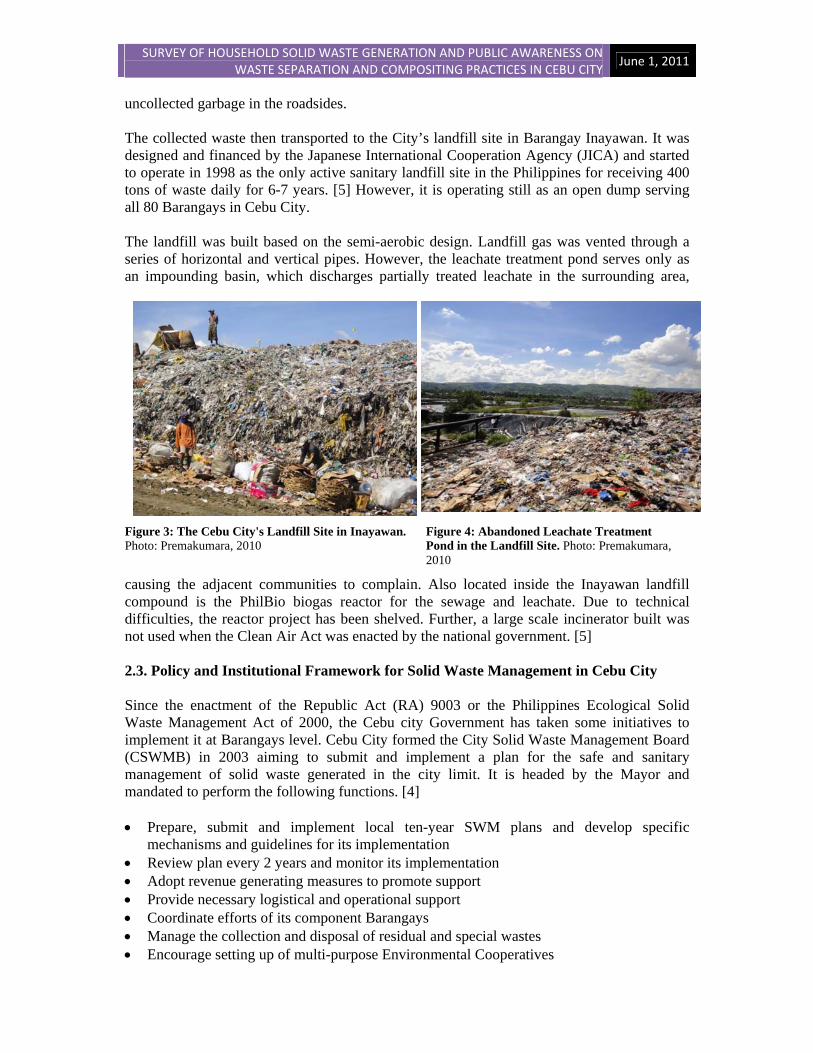
uncollected garbage in the roadsides. The collected waste then transported to the City’s landfill site in Barangay Inayawan. It was designed and financed by the Japanese International Cooperation Agency (JICA) and started to operate in 1998 as the only active sanitary landfill site in the Philippines for receiving 400 tons of waste daily for 6-7 years. [5] However, it is operating still as an open dump serving all 80 Barangays in Cebu City. The landfill was built based on the semi-aerobic design. Landfill gas was vented through a series of horizontal and vertical pipes. However, the leachate treatment pond serves only as an impounding basin, which discharges partially treated leachate in the surrounding area,
causing the adjacent communities to complain. Also located inside the Inayawan landfill compound is the PhilBio biogas reactor for the sewage and leachate. Due to technical difficulties, the reactor project has been shelved. Further, a large scale incinerator built was not used when the Clean Air Act was enacted by the national government. [5] 2.3. Policy and Institutional Framework for Solid Waste Management in Cebu City Since the enactment of the Republic Act (RA) 9003 or the Philippines Ecological Solid Waste Management Act of 2000, the Cebu city Government has taken some initiatives to implement it at Barangays level. Cebu City formed the City Solid Waste Management Board (CSWMB) in 2003 aiming to submit and implement a plan for the safe and sanitary management of solid waste generated in the city limit. It is headed by the Mayor and mandated to perform the following functions. [4] Prepare, submit and implement local ten-year SWM plans and develop specific
mechanisms and guidelines for its implementation Review plan every 2 years and monitor its implementation Adopt revenue generating measures to promote support Provide necessary logistical and operational support Coordinate efforts of its component Barangays Manage the collection and disposal of residual and special wastes Encourage setting up of multi-purpose Environmental Cooperatives
Figure 3: The Cebu City's Landfill Site in Inayawan. Photo: Premakumara, 2010
Figure 4: Abandoned Leachate Treatment Pond in the Landfill Site. Photo: Premakumara, 2010
SURVEY OF HOUSEHOLD SOLID WASTE GENERATION AND PUBLIC AWARENESS ON WASTE SEPARATION AND COMPOSITING PRACTICES IN CEBU CITY
June 1, 2011
8
The CSWMB has already drafted a Solid Waste Management Framework for Cebu City in 2005 with the technical assistance of Fort Collins, Colorado, USA, which is the resource city of Cebu under the Resource Cities Programme of the International City/County Management Association. The framework is comprised of the city’s practical visions, strategies, and action plan for the next 10 years (2005-2015). In the brief for the Kitakyushu Initiative Network, Cebu City identified the following actions in the Solid Waste Management Framework. [3] Institutional capability building through various training programmes Public information and awareness by involving NGOs Waste segregation at source Improvement in the practices of waste separation and recycling at disposal Management of medical waste by the private sector and industrial waste management
with the involvement of Chambers of Commerce Promotion of composting and recycling with the help of agricultural department Energy conservation and construction of biogas digester Efficient garbage collection system by acquiring new equipment and vehicles The Department of Public Services (DPS) is responsible for solid waste management and disposal, street cleaning, street lighting, potable water supply, and the repair and maintenance of garbage trucks in the city. Further, Cebu Environmental Sanitation Enforcement Team (CESET) was established recently for mobilizing the participation of communities in waste separation through enforcing environmental laws. Incorporated into this, the city government also used the mechanism of fees, penalties and fines to encourage the observance of RA 9003 and its enabling city ordinances. Under the Section 7 of the RA 9003, each Barangay is required to establish the Barangay Solid Waste Management Committee (BSWMC) for the following functions and responsibilities. [5] Formulate of the solid waste management programme consistent with the city
municipality plan Segregation and collection of biodegradable, compostable, reusable wastes Establish materials recovery facility Allocate Barangay funds and look for outside sources of funds Organizes core coordinators Submit monthly report to the city However, a study conducted by the law students of the University of Cebu found that only Barangay Luz had fully complied with the provisions of RA 9003. [7] Most of other Barangays fell short in establishing Material Recovery Facility (MRF) and promotion of composting for organic waste reduction. This has forced the city authority to ban the un-segregated waste transporting to Inayawan landfill by the Barangays since 1 of April 2011. As Mayor Michael Rama said the idea is to have garbage sorted out into biodegradable matter that can be composted in the Barangays and non-biodegradable materials that can be recycled, with the remaining residual waste taken to the Inayawan landfill. [8]
SURVEY OF HOUSEHOLD SOLID WASTE GENERATION AND PUBLIC AWARENESS ON WASTE SEPARATION AND COMPOSITING PRACTICES IN CEBU CITY
June 1, 2011
‐
1,000
2,000
3,000
4,000
5,000
6,000
7,000
1 6
11
16
21
26
31
36
41
46
51
56
61
66
71
76
81
86
91
96
101
106
111
116
121
126
131
136
141
Average
Household W
aste Generation per Day (gr)
Capital Site
Sawang Calero
Mambaling
Mabolo Tinago
Quiot
Total Households
3. Results of Household Survey
3.1 Waste production
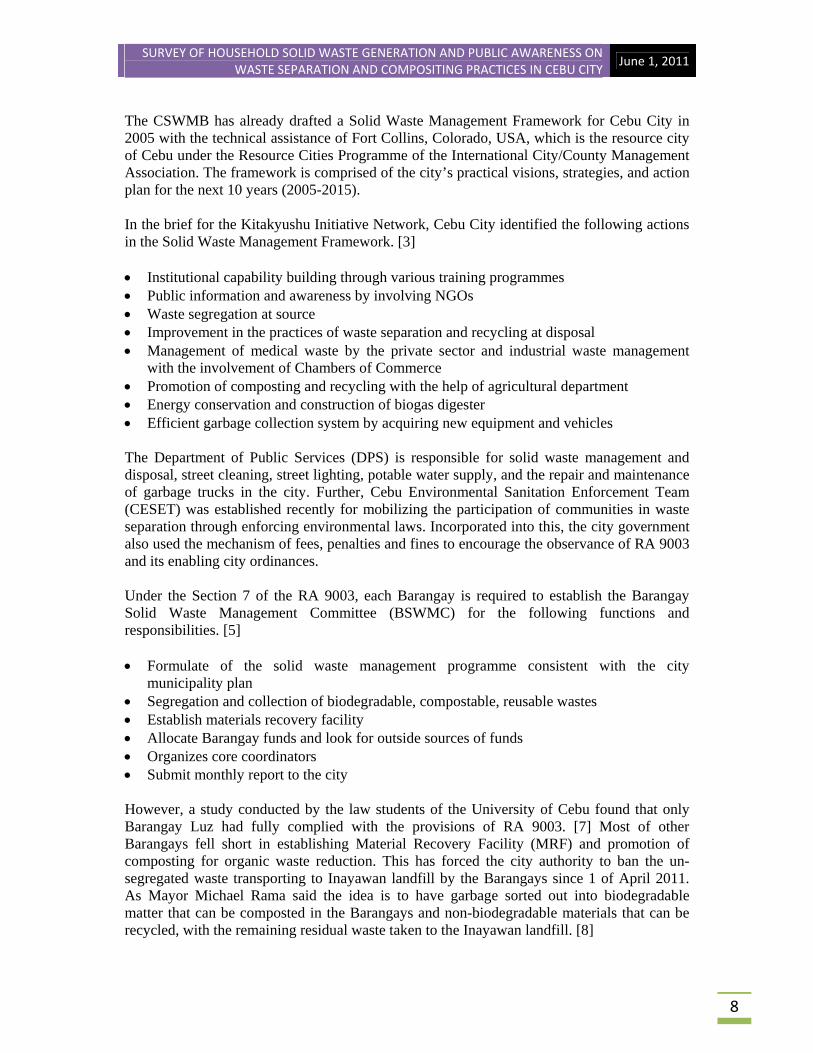
Amounts As Figure 5 shows the average household waste generation have significant variation between pilot Barangays and also within a single Barangay. This can be happened due to the following reasons, such as samples are quite small and the number of factors governing waste production among households can be enormous, the phenomenon of selective collection can also be a source of error and variation that is not accounted for, people may not always throw all of their waste into the provided bags, causing a lower production to be measured, and possibly also a shift in composition and a lack of understanding the purpose of the survey might cause them to sometime include waste from other sources as well, thereby increasing the amounts measured.
Though the variation makes it difficult to generalize the average amount of garbage produced by the households in pilot Barangays, it shows some order of magnitude of solid waste production by these households. The findings reveal that household waste generation about 750–1500 grams per household per day, depending on the sort of area in which the households are located and a number of other factors, such as income and family size. Further,
Ermita Kamputha
Figure 2: Average Household Waste Generation per Day per gr. Source: Compiled by Premakumara, 2011
SURVEY OF HOUSEHOLD SOLID WASTE GENERATION AND PUBLIC AWARENESS ON WASTE SEPARATION AND COMPOSITING PRACTICES IN CEBU CITY
June 1, 2011
0.00
500.00
1000.00
1500.00
2000.00
2500.00
3000.00
3500.00
0 20 40 60 80 100 120 140 160
Average
Waste Generation by Person
per Day (gr)
Total Households
Capital Site
Sawang Calero
Mambaling
Mabolo
Tinago
Quiot
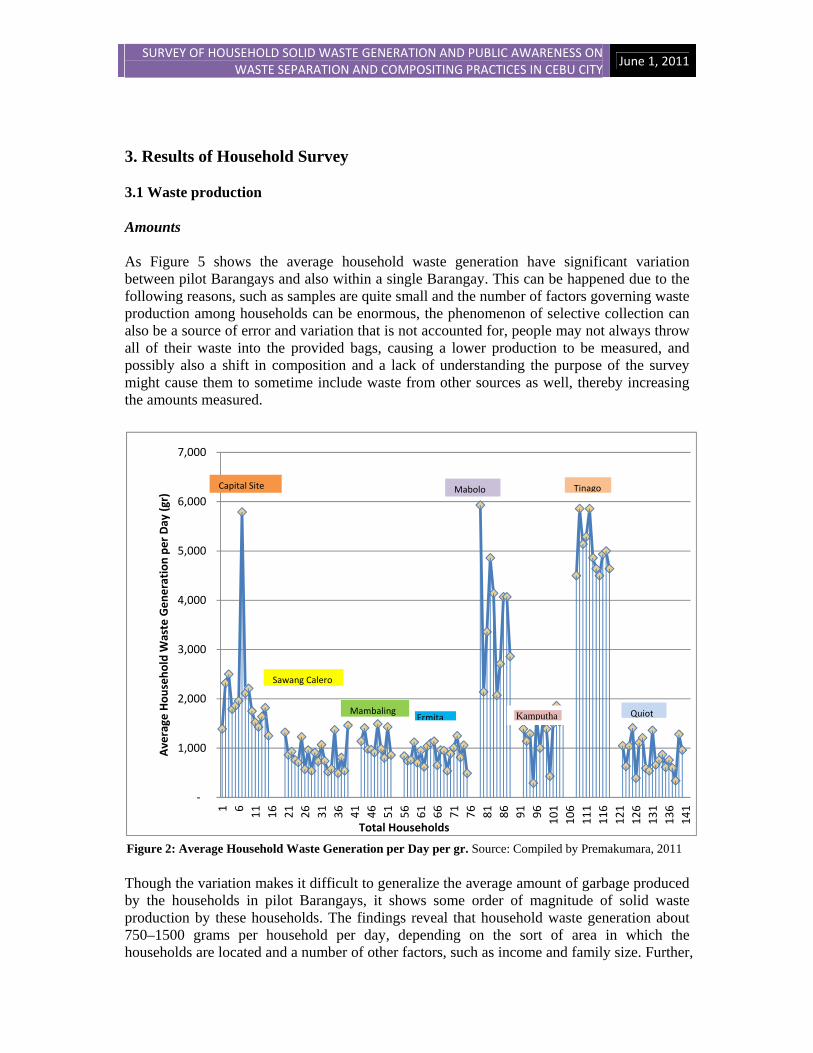
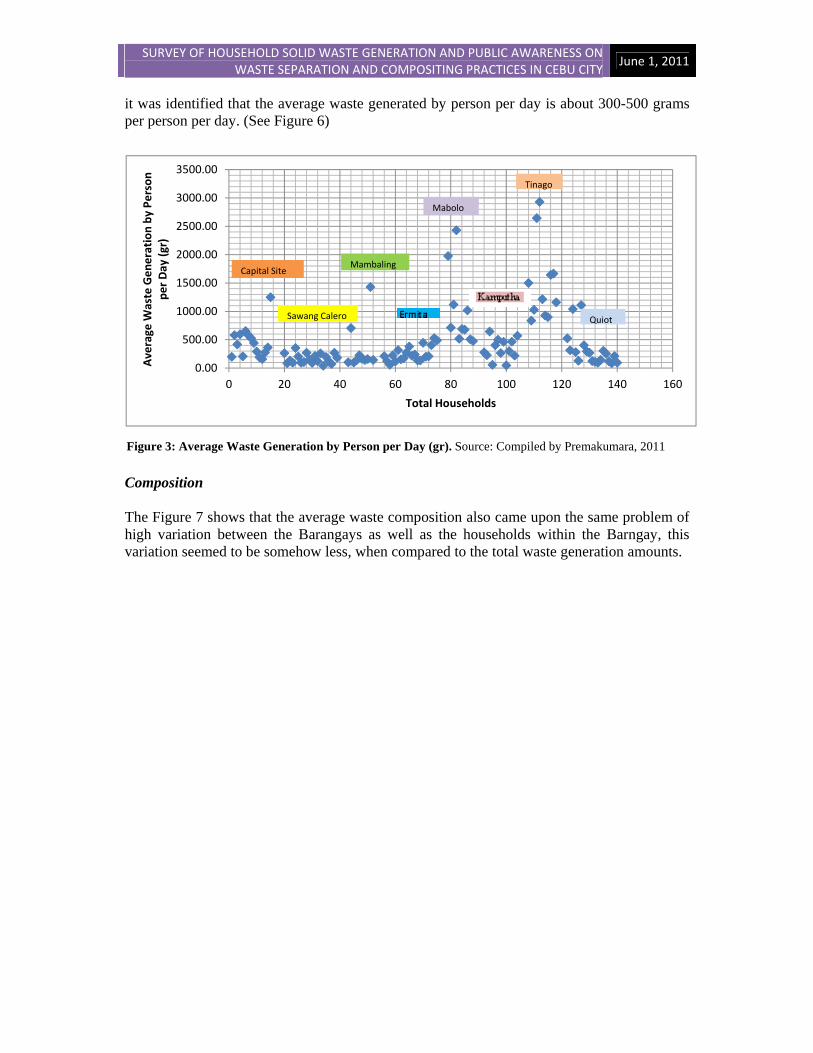
it was identified that the average waste generated by person per day is about 300-500 grams per person per day. (See Figure 6)
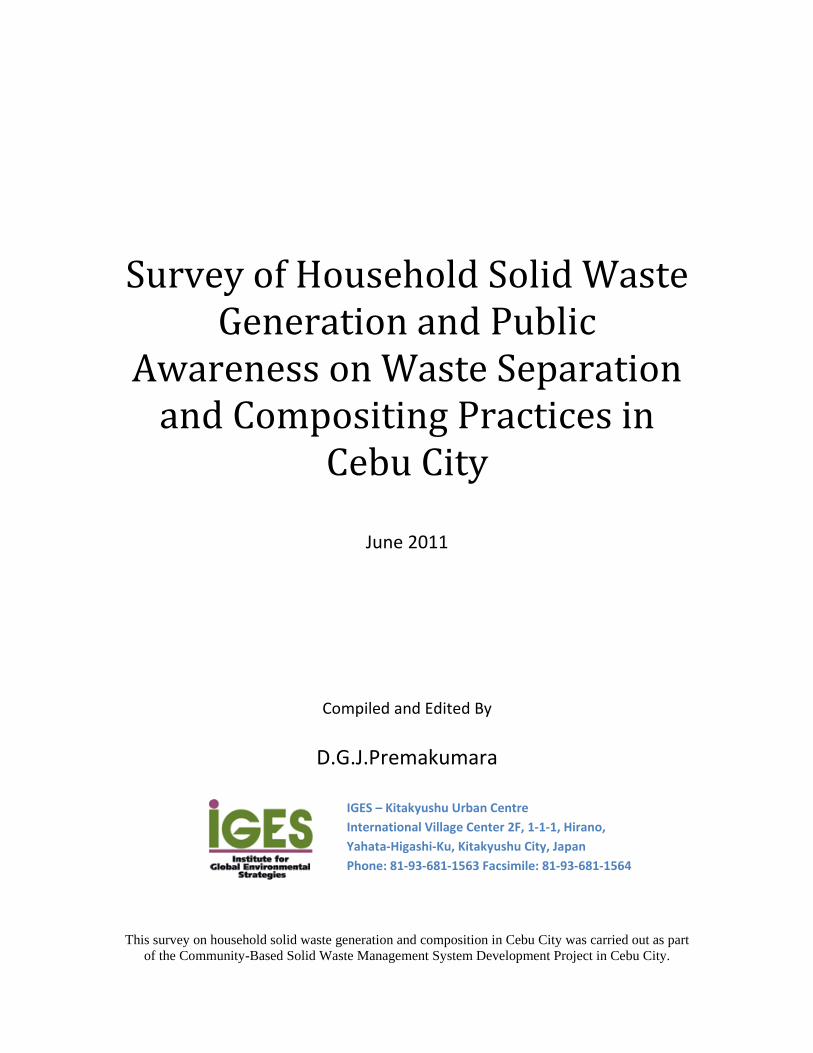
Composition The Figure 7 shows that the average waste composition also came upon the same problem of high variation between the Barangays as well as the households within the Barngay, this variation seemed to be somehow less, when compared to the total waste generation amounts.
Figure 3: Average Waste Generation by Person per Day (gr). Source: Compiled by Premakumara, 2011
SURVEY OF HOUSEHOLD SOLID WASTE GENERATION AND PUBLIC AWARENESS ON WASTE SEPARATION AND COMPOSITING PRACTICES IN CEBU CITY
June 1, 2011
0
20
40
60
80
100
120
Bin/Can/Bottle
Metal
Plastic
Paper
Organic
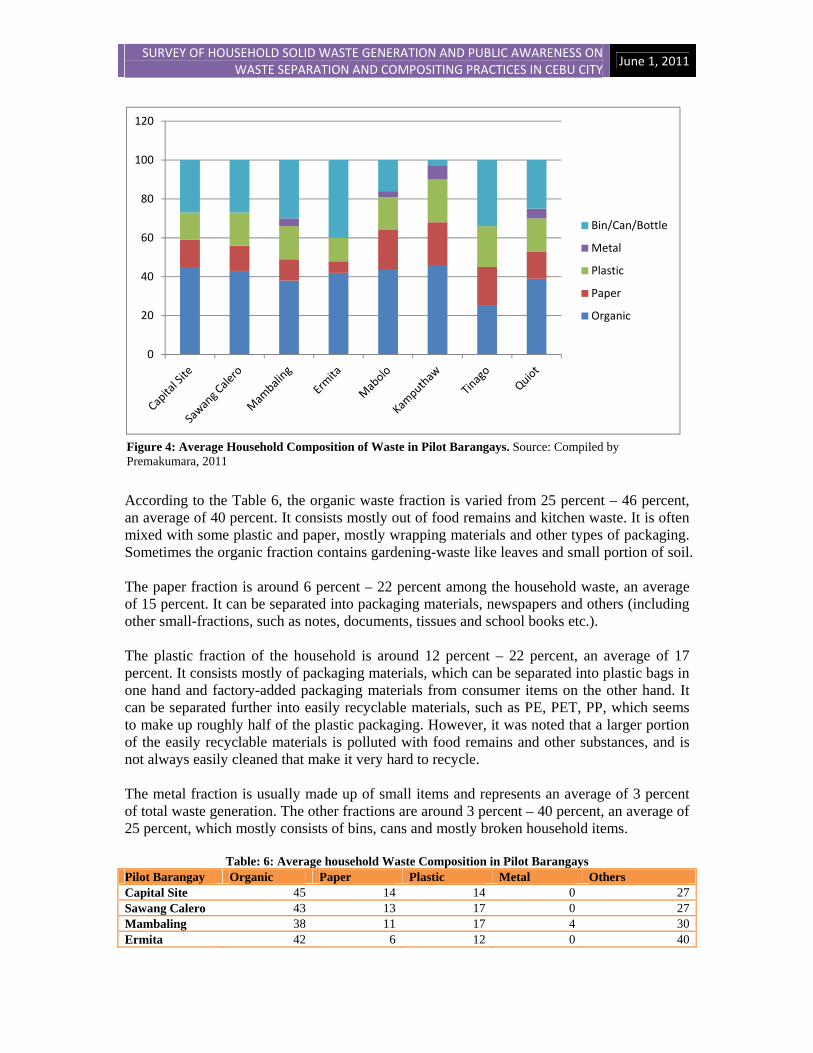
According to the Table 6, the organic waste fraction is varied from 25 percent – 46 percent, an average of 40 percent. It consists mostly out of food remains and kitchen waste. It is often mixed with some plastic and paper, mostly wrapping materials and other types of packaging. Sometimes the organic fraction contains gardening-waste like leaves and small portion of soil. The paper fraction is around 6 percent – 22 percent among the household waste, an average of 15 percent. It can be separated into packaging materials, newspapers and others (including other small-fractions, such as notes, documents, tissues and school books etc.). The plastic fraction of the household is around 12 percent – 22 percent, an average of 17 percent. It consists mostly of packaging materials, which can be separated into plastic bags in one hand and factory-added packaging materials from consumer items on the other hand. It can be separated further into easily recyclable materials, such as PE, PET, PP, which seems to make up roughly half of the plastic packaging. However, it was noted that a larger portion of the easily recyclable materials is polluted with food remains and other substances, and is not always easily cleaned that make it very hard to recycle. The metal fraction is usually made up of small items and represents an average of 3 percent of total waste generation. The other fractions are around 3 percent – 40 percent, an average of 25 percent, which mostly consists of bins, cans and mostly broken household items.
Table: 6: Average household Waste Composition in Pilot Barangays Pilot Barangay Organic Paper Plastic Metal Others Capital Site 45 14 14 0 27Sawang Calero 43 13 17 0 27Mambaling 38 11 17 4 30Ermita 42 6 12 0 40
Figure 4: Average Household Composition of Waste in Pilot Barangays. Source: Compiled by Premakumara, 2011
SURVEY OF HOUSEHOLD SOLID WASTE GENERATION AND PUBLIC AWARENESS ON WASTE SEPARATION AND COMPOSITING PRACTICES IN CEBU CITY
June 1, 2011
12
Mabolo 44 20 17 3 16Kamputhaw 46 22 22 7 3Tinago 25 20 21 0 34Quiot 39 14 17 5 25Average 40 15 17 3 25
Source: Compiled by Premakumara, 2011 3.2. Public Awareness and Attitude As this study was only able to complete the questionnaires for a small number of households from a selected Barangays, the results were few and might not say very much in detailed. In order to establish the main subjects and angles for a good awareness campaign, more study would be required in the future. However, even in the little and often superficial answers we did get, some important trends can be identified. Awareness
Table 7: Do you know what happened to your garbage after disposed? Response Capital
Site Sawang Calero
Mambaling
Ermita Mabolo
Kamputhaw
Timago
Quito Total
Yes 11 55%
16 80%
5 50%
13 65%
3 15%
6 45%
1 9%
12 63%
67 56%
No 4 45%
4 20%
5 50%
7 35%
7 85%
7 55%
10 91%
7 37%
51 44%
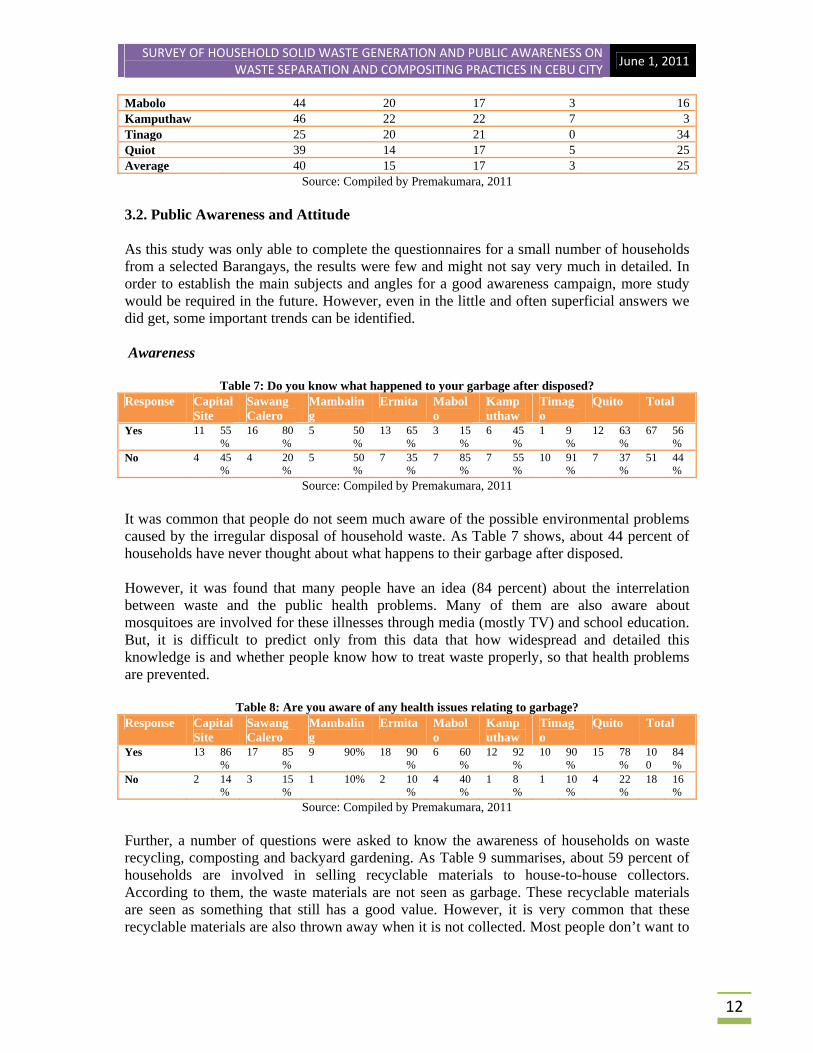
Source: Compiled by Premakumara, 2011 It was common that people do not seem much aware of the possible environmental problems caused by the irregular disposal of household waste. As Table 7 shows, about 44 percent of households have never thought about what happens to their garbage after disposed. However, it was found that many people have an idea (84 percent) about the interrelation between waste and the public health problems. Many of them are also aware about mosquitoes are involved for these illnesses through media (mostly TV) and school education. But, it is difficult to predict only from this data that how widespread and detailed this knowledge is and whether people know how to treat waste properly, so that health problems are prevented.
Table 8: Are you aware of any health issues relating to garbage? Response Capital
Site Sawang Calero
Mambaling
Ermita Mabolo
Kamputhaw
Timago
Quito Total
Yes 13 86%
17 85%
9 90% 18 90%
6 60%
12 92%
10 90%
15 78%
100
84%
No 2 14%
3 15%
1 10% 2 10%
4 40%
1 8%
1 10%
4 22%
18 16%
Source: Compiled by Premakumara, 2011 Further, a number of questions were asked to know the awareness of households on waste recycling, composting and backyard gardening. As Table 9 summarises, about 59 percent of households are involved in selling recyclable materials to house-to-house collectors. According to them, the waste materials are not seen as garbage. These recyclable materials are seen as something that still has a good value. However, it is very common that these recyclable materials are also thrown away when it is not collected. Most people don’t want to
SURVEY OF HOUSEHOLD SOLID WASTE GENERATION AND PUBLIC AWARENESS ON WASTE SEPARATION AND COMPOSITING PRACTICES IN CEBU CITY
June 1, 2011
13
take any trouble to store much of the material for collection or extra time to deliver it in a junk shop by themselves.
Table 9: Do you recycle things yourself? Response Capital
Site Sawang Calero
Mambaling
Ermita Mabolo
Kamputhaw
Timago Quito Total
Yes 10 66%
13 65% 5 50%
10 50%
4 40%
7 53% 7 63% 14 73%
70 59%
No 5 34%
7 35% 5 50%
10 50%
6 60%
6 47% 4 37% 5 27%
48 41%
Source: Compiled by Premakumara, 2011
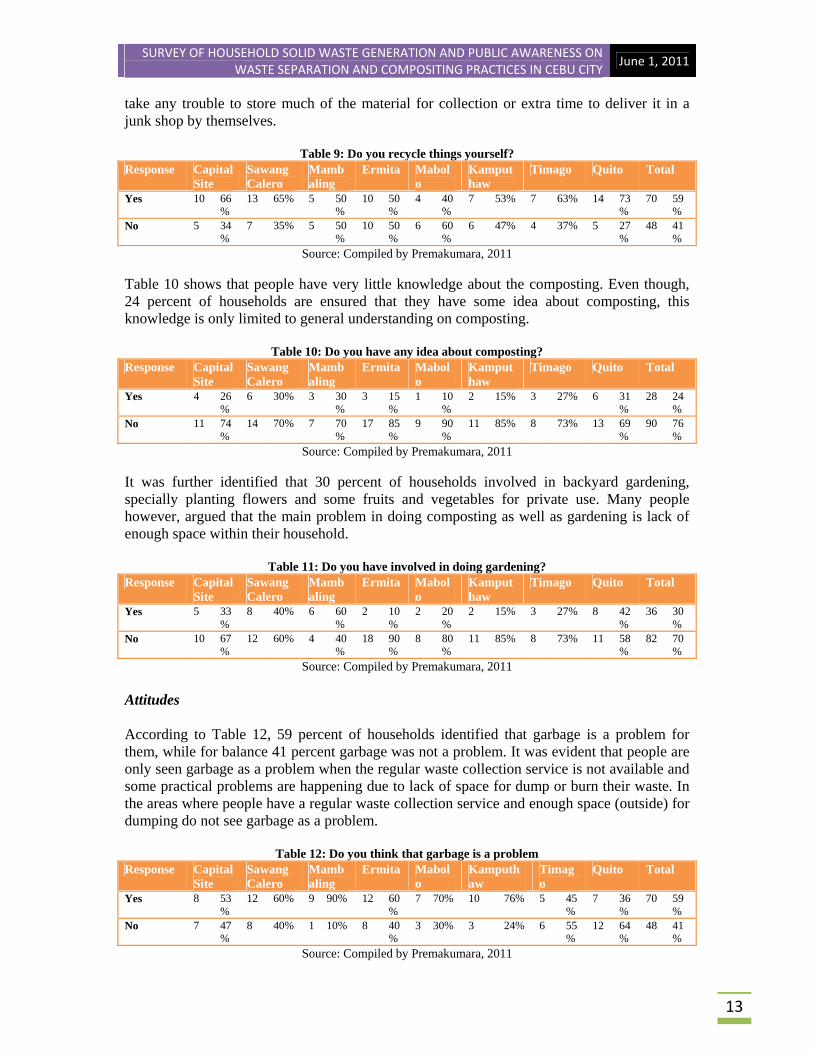
Table 10 shows that people have very little knowledge about the composting. Even though, 24 percent of households are ensured that they have some idea about composting, this knowledge is only limited to general understanding on composting.
Table 10: Do you have any idea about composting? Response Capital
Site Sawang Calero
Mambaling
Ermita Mabolo
Kamputhaw
Timago Quito Total
Yes 4 26%
6 30% 3 30%
3 15%
1 10%
2 15% 3 27% 6 31%
28 24%
No 11 74%
14 70% 7 70%
17 85%
9 90%
11 85% 8 73% 13 69%
90 76%
Source: Compiled by Premakumara, 2011
It was further identified that 30 percent of households involved in backyard gardening, specially planting flowers and some fruits and vegetables for private use. Many people however, argued that the main problem in doing composting as well as gardening is lack of enough space within their household.
Table 11: Do you have involved in doing gardening? Response Capital
Site Sawang Calero
Mambaling
Ermita Mabolo
Kamputhaw
Timago Quito Total
Yes 5 33%
8 40% 6 60%
2 10%
2 20%
2 15% 3 27% 8 42%
36 30%
No 10 67%
12 60% 4 40%
18 90%
8 80%
11 85% 8 73% 11 58%
82 70%
Source: Compiled by Premakumara, 2011 Attitudes According to Table 12, 59 percent of households identified that garbage is a problem for them, while for balance 41 percent garbage was not a problem. It was evident that people are only seen garbage as a problem when the regular waste collection service is not available and some practical problems are happening due to lack of space for dump or burn their waste. In the areas where people have a regular waste collection service and enough space (outside) for dumping do not see garbage as a problem.
Table 12: Do you think that garbage is a problem Response Capital
Site Sawang Calero
Mambaling
Ermita Mabolo
Kamputhaw
Timago
Quito Total
Yes 8 53%
12 60% 9 90% 12 60%
7 70% 10 76% 5 45%
7 36%
70 59%
No 7 47%
8 40% 1 10% 8 40%
3 30% 3 24% 6 55%
12 64%
48 41%
Source: Compiled by Premakumara, 2011
SURVEY OF HOUSEHOLD SOLID WASTE GENERATION AND PUBLIC AWARENESS ON WASTE SEPARATION AND COMPOSITING PRACTICES IN CEBU CITY
June 1, 2011
14
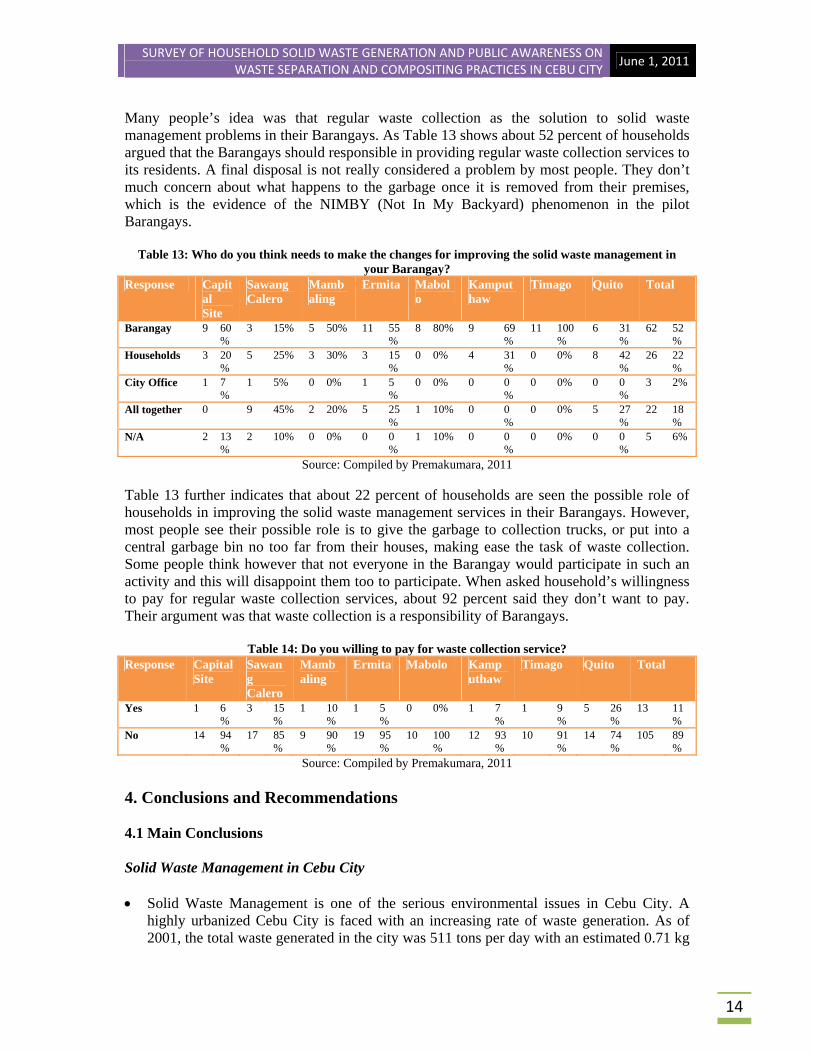
Many people’s idea was that regular waste collection as the solution to solid waste management problems in their Barangays. As Table 13 shows about 52 percent of households argued that the Barangays should responsible in providing regular waste collection services to its residents. A final disposal is not really considered a problem by most people. They don’t much concern about what happens to the garbage once it is removed from their premises, which is the evidence of the NIMBY (Not In My Backyard) phenomenon in the pilot Barangays.
Table 13: Who do you think needs to make the changes for improving the solid waste management in your Barangay?
Response Capital Site
Sawang Calero
Mambaling
Ermita Mabolo
Kamputhaw
Timago Quito Total
Barangay 9 60%
3 15% 5 50% 11 55%
8 80% 9 69%
11 100%
6 31%
62 52%
Households 3 20%
5 25% 3 30% 3 15%
0 0% 4 31%
0 0% 8 42%
26 22%
City Office 1 7%
1 5% 0 0% 1 5%
0 0% 0 0%
0 0% 0 0%
3 2%
All together 0 9 45% 2 20% 5 25%
1 10% 0 0%
0 0% 5 27%
22 18%
N/A 2 13%
2 10% 0 0% 0 0%
1 10% 0 0%
0 0% 0 0%
5 6%
Source: Compiled by Premakumara, 2011
Table 13 further indicates that about 22 percent of households are seen the possible role of households in improving the solid waste management services in their Barangays. However, most people see their possible role is to give the garbage to collection trucks, or put into a central garbage bin no too far from their houses, making ease the task of waste collection. Some people think however that not everyone in the Barangay would participate in such an activity and this will disappoint them too to participate. When asked household’s willingness to pay for regular waste collection services, about 92 percent said they don’t want to pay. Their argument was that waste collection is a responsibility of Barangays.
Table 14: Do you willing to pay for waste collection service? Response Capital
Site Sawang Calero
Mambaling
Ermita Mabolo Kamputhaw
Timago Quito Total
Yes 1 6%
3 15%
1 10%
1 5%
0 0% 1 7%
1 9%
5 26%
13 11%
No 14 94%
17 85%
9 90%
19 95%
10 100%
12 93%
10 91%
14 74%
105 89%
Source: Compiled by Premakumara, 2011 4. Conclusions and Recommendations 4.1 Main Conclusions Solid Waste Management in Cebu City Solid Waste Management is one of the serious environmental issues in Cebu City. A
highly urbanized Cebu City is faced with an increasing rate of waste generation. As of 2001, the total waste generated in the city was 511 tons per day with an estimated 0.71 kg
SURVEY OF HOUSEHOLD SOLID WASTE GENERATION AND PUBLIC AWARENESS ON WASTE SEPARATION AND COMPOSITING PRACTICES IN CEBU CITY
June 1, 2011
15
per person per day. It was estimated that by 2010, the total volume of garbage raised up to 755 tons per day. However, there are no accurate data on the present waste generation in the city. The city has estimated that the composition of municipal solid waste as follows: 50 percent organic waste, 16 percent paper, 16 percent plastic, 4 percent metal and 14 percent others.
The city’s waste collection system operates 24 hours in three shifts using three types of
waste collection methods, including bell collection, kerbside collection and communal collection. However, urban areas are often littered with garbage due to absent of sufficient waste collection services due to lack of collection vehicles, budget and manpower.
The collected waste is transported to the central landfill site in Barangay Inayawan. Though it was designed and constructed by the JICA as a sanitary landfill site in 1998, currently operates as an open dump without any measures to control leachate, dust, odour, landfill gas or vermin resulting health and environmental problems. It can be seen that the PhilBio biogas reactor was constructed inside the Inayawan landfill compound for the sewage and leachate. However, the reactor project has been shelved, Due to technical difficulties. Further, a large scale incinerator built was not used when the Clean Air Act was enacted by the national government.
Since the enactment of the RA 9003 or the Philippine Ecological Solid Waste Management Act of 2000, Cebu City has been spearheading its implementation in all the Barangays in the city. Cebu City established the CSWMB in 2003 aiming to submit and implement a plan for the safe and sanitary management of solid waste generated in the city limit. It has already prepared the Ten Years Solid Waste Management Framework for Cebu City in 2005 with the technical assistance of Fort Collins, Colorado, USA.
The DPS is responsible for carrying out the solid waste management activities in the city. Further, CESET was established recently for mobilizing the participation of communities in waste separation through enforcing environmental laws. Under the Section 7 of the RA 9003, each Barangay is required to establish the BSWMC for formulating a solid waste management programme within its limit.
The section 20 of RA 9003 mandates the local governments to divert at least 25 percent of all solid waste from final waste disposal facilities through promoting re-use, recycling, composting and other resource recovery activities by 2006 and this target had to be increased every three years thereafter. Further, it was mandated to establish a Materials Recovery Facility (MRF) in every Barangays for final sorting, segregation, composting and recycling. Only residual waste should be transferred to a sanitary landfill or a controlled dumpsite. It is also mandated to apply the user pay principle for solid waste management services.
However, it was identified that only Barangay Luz had fully complied with the provisions of RA 9003. All the other Barangays fell short in establishing Material Recovery Facility (MRF) and promotion of composting for organic waste reduction. This has forced the city authority to ban the un-segregated waste transporting to Inayawan landfill by the Barangays since 1 of April 2011.
SURVEY OF HOUSEHOLD SOLID WASTE GENERATION AND PUBLIC AWARENESS ON WASTE SEPARATION AND COMPOSITING PRACTICES IN CEBU CITY
June 1, 2011
16
Waste Generation and Composition at Household Level
Though the reliability of the figures is shown some limitations due to small sample-size, large variations and selective collection of households leading to biased results, the household survey gave some order of magnitude of solid waste production by the households.
Waste production of the households was in the range of 750-1500 grams per household per day, depending on the sort of area in which the households are located and a number of other factors, such as income and family size. Further, it was identified that the average waste generation by person per day was roughly 300-500 grams per person per day.
The average composition of the household waste that was measured by weight are as follows: Organic waste (40 percent), Paper (15 percent), Plastic (17 percent), Metal (3 percent), and Others (25 percent).
The organic waste fraction makes a relatively large contribution to the total weight and it consists mostly out of food remains, kitchen waste, and some gardening-waste like leaves and small portion of soil. The paper fraction is included packaging materials, newspapers and others (including other small-fractions, such as notes, documents, tissues and school books etc.). The plastic fraction consists mostly of packaging materials, which can be separated into plastic bags and factory-added packaging materials from consumer items. A significant part of the paper and plastic fractions can be easily separated for recycling and organic fraction can be used for composting. Public Awareness and Attitudes on Solid Waste Management
It was common that many people do not seem aware of the potential environmental problems caused by disposal of solid waste. Waste is often seen as a problem because of practical reasons. They don’t much concern about what happens to the garbage once it is removed from their premises, which is the evidence of the NIMBY (Not In My Backyard) phenomenon.
Most people seem to know about health problems (especially mosquitoes) relating to garbage from school education and mass media.
Some households are involved in selling recyclable materials to house-to-house collectors. The waste materials that can still be sold are not really seen as garbage. These recyclable materials are seen as something that still has some value. However, it is usually thrown away when not collected.
Very few have an idea about composting and practice in gardening. Many people argued that the main problem for doing composting and backyard gardening is lack of enough space within their households.
Regular waste collection by Barangays is seen by many households as a solution to the garbage problem. However, some people argued about the possible role of households, which was limited to giving the garbage to collection trucks, or put into a central garbage
SURVEY OF HOUSEHOLD SOLID WASTE GENERATION AND PUBLIC AWARENESS ON WASTE SEPARATION AND COMPOSITING PRACTICES IN CEBU CITY
June 1, 2011
17
bin no too far from their houses, making ease the task of waste collection. Almost all households don’t want to pay extra fees for waste collection service and argued that it is a responsibility of Barangay.
4.2 Some Recommendations for Designing Local Action for Solid Waste Management in Pilot Barangays As mandated by the Section 32 of RA 9003, each Barangay needs to establish its own
Solid Waste Management Programme, including both holistic vision with achievable targets and practical actions to setup MRF. Major operational components need to be considered in making this plan is; waste reduction and segregation at source, effective waste collection and transport, resource recovery and processing at the MRF (promotion of recycling, composting, and marketing) and information, education and communication campaign. Further, it needs to be generated through active participation of all stakeholders, including Barangay officials, residents, civil society organizations and both, formal and informal business sector.
For the effective planning and implementation of community-based solid waste
management system, it is essential to have the support of the local community. The households are the ones that have to initially sort out their waste at source, store the waste materials that are to be collected for recycling and participate in household composting activities. Therefore to ensure strong co-operation, the local people must be involved from the very beginning in setting up the system and their concerns need to be considered.
According to the survey results, many people in the pilot Barangays do not aware of the
environmental problems caused by dumping waste without proper treatment as well as about what happened to their waste after it collected by the Barangay staff. Moreover, a very few have involved in recycling activities and their basic knowledge in composting is also limited. Therefore it is very important that involving local community in the very beginning of the project planning and correctly informed them on proper sorting of waste materials, composting techniques and management of household waste in general as well as motivating them to realize that they are responsible for making society more liveable by responding to the pressing issues and concerns in their own community.
The process of making local community aware of the solid waste management issues in
their Barangay and making them responsible for taking initiatives can be done through the properly designed awareness programmes and internalization of the cleanliness precepts into the vision making. For example, Barangay Luz carried out a series of seminars and training programmes for its residents before starting its widely-acknowledged community-based solid waste management programme. [9] These seminars and training programmes were part of the larger information, education, and communication campaign (IEC) that aimed to highlight the waste problem as an urgent and serious issue in the Barangay. Further, the people are reminded of their household and community responsibilities as well as how to sort waste and make compost, and also on what not to do. This is very important but often forgotten. The instruction briefings on many projects only focus on what to do, but not on what to avoid.
The implementation of the IEC campaign was carried out under the Sitio’s of the
Barangay. (Sitio is a community) A Bayanihan Center (Community Centre) was established in each 15 Sitios and elected its own set of officers, including the Chairperson,
SURVEY OF HOUSEHOLD SOLID WASTE GENERATION AND PUBLIC AWARENESS ON WASTE SEPARATION AND COMPOSITING PRACTICES IN CEBU CITY
June 1, 2011
18
Vice-Chairperson, Treasurer, Secretary and Bookkeeper for carrying out its tasks. During the IEC campaign, people were also informed to obey the community rules, such as segregate waste at source, cleaning individual surroundings and immediate premises, and give their garbage at the specific time of the waste collection and the penalties and fines as defined in City ordinance 1361, if not. The main enforcers of the implementation are the members of the Bayanihan Centre and volunteers of the local solid waste management board in the Brangay Luz. They are visiting the area regularly and penalize those that have been remiss in their responsibilities. This can be a fine of 300-1,000 Pesos or a render of community service for one day to one week.
The survey findings identified that people are used to throw recyclable materials, when it
is not collected regularly. They don’t want to take any trouble to store much of the material for collection. Therefore, it was recommended to establish the proper waste sorting, collection and processing system, before starting the awareness rising of the new waste management system. A separated recyclable material needs to be collected in specific schedule and send back to recycling factories or junk shops or utilize for promotion of community production.
A separated organic material can be utilized for making compost. This can be done at the
household (household composting) or community level (community composting centre). However, it needs to be carefully considered some elements of composting, such as technical, financial, socio-cultural and institutional aspects prior to select a suitable approach. For example, household composting could be a very simple, easy to manage, less costly and less institutional barriers when compared to the community composting centres that required small capital cost, suitable space for shelter, management system, staff and resources. But, household composting has required a high level of interest and commitment among the members in the household, awareness of composting, space for gardening when compared to community composting centre approach. The survey findings however suggested that very few have basic knowledge of composting as well as involved in backyard gardening. Further, many people feel that composting did not fit in their living condition in closely spaced neighbourhoods.
The people in pilot Barangays are seen waste as a practical problem rather than as an
environmental problem. Most people feel that waste management is a responsibility of the Barangays and would only be willing to take action themselves if it gives sufficient benefit. This issue can be overcome by encouraging people to recycle their garbage or making compost in exchange for money. For example, Barangay Luz established the Kwarta Sa Basura Programme (KSBP) to buy the recyclable materials from the households. It was implemented by the Bayanihan Center and the Barangay Luz Homeowners Multipurpose Cooperative. The households are advised to bring their recyclable materials to the Barangay hall or any other designated centres in the Barangay every Saturday for collection. The materials that residents are brought measured and gave a price based on the market value. The total amount generated from the recyclables will be deposited as savings in the cooperative under the name of the person. Each member has a passbook and saving will be given an annual interest of 7 percent. Members can withdraw the savings anytime whenever they need it.
The experience of Barangay Luz shows its success in generating livelihood out of trash and reducing the volume of garbage at the source. However, the low benefits of selling waste materials are mostly caused by the fact that one household does not produce much
SURVEY OF HOUSEHOLD SOLID WASTE GENERATION AND PUBLIC AWARENESS ON WASTE SEPARATION AND COMPOSITING PRACTICES IN CEBU CITY
June 1, 2011
19
recyclable waste, and does therefore not get much income from selling it. This problem can be avoided by incorporating the informal collection and recycling routes that already exist in the Barangay. This existing system of "informal waste collection" can then be extended to include the waste materials that are currently not (sufficiently) collected and/or recycled. When implemented correctly, this could result in benefits for everyone involved (households, collectors, resellers, recyclers).
Similar to recyclable materials, the use of the final compost products also needs to be
considered. The final products of household composting can be used for backyard gardening if enough space is available within the household. Otherwise, a system can be established as similar to the KSBP to exchange household compost for money. The final products of the community composting centre can also find a market. But, it depends on the quality, cost and other market related factors, such as awareness on organic farming and subsidies for commercial fertilizer etc. Further, compost products can be utilized for greening park and streets in the Barangay.
The experience of Barangay Luz shows that a creating space for collective actions among
community members and giving some incentives recognizing their active participation in community activities can be motivated community members, Bayanihan centres and Sitio for taking new initiatives to achieve environmentally sustainable communities. Some of these programmes are; clean and green contest for the cleanest Sitio, best recycling products from waste contest, a contest for the highest number of kilos segregated in the Sitio, Christmas décor contest using recyclable material and contest of sustainable composting centres.
Finally, it can be concluded that a strong political will, clear strategies and commitment
of staff in the Barangay are essential for the success of community-based solid waste management system. The Cebu City Government can be provided legal framework, subsidies for the establishment of MRF, technical support and awarding system for recognizing the local initiatives taken by the Barangays. NGOs or any other Civil Society Organizations can play a significant role in initiating awareness building programmes, technical and methodological advice, and assist in creating market mechanisms. While international institutions can play a number of vital roles, such as building networks among partners, providing technical and logistical advice, know-how and capacity building opportunities, and providing of development assistance mechanisms in cooperation with other programme and development agencies.
References: [1] Cebu City, Cebu City Profile, Philippines, City Planning and Development Office, Cebu City Hall, 2007 [2] Villarete, N.P.C, Solid Waste Management in Cebu City, http://www.kitakyushu.iges.or.jp/docs/mtgs/.../3%20Cebu%20(Paper).pdf, referred on 21/05/2011 [3] Villarete, N.P.C, Second Meeting of the Kitakyushu Initiative Network (Mayors’ Segment), http://www. kitakyushu.iges.or.jp/docs/network_meetings/kin2/.../17.../Cebu.pdf, referred on 21/05/2011
SURVEY OF HOUSEHOLD SOLID WASTE GENERATION AND PUBLIC AWARENESS ON WASTE SEPARATION AND COMPOSITING PRACTICES IN CEBU CITY
June 1, 2011
20
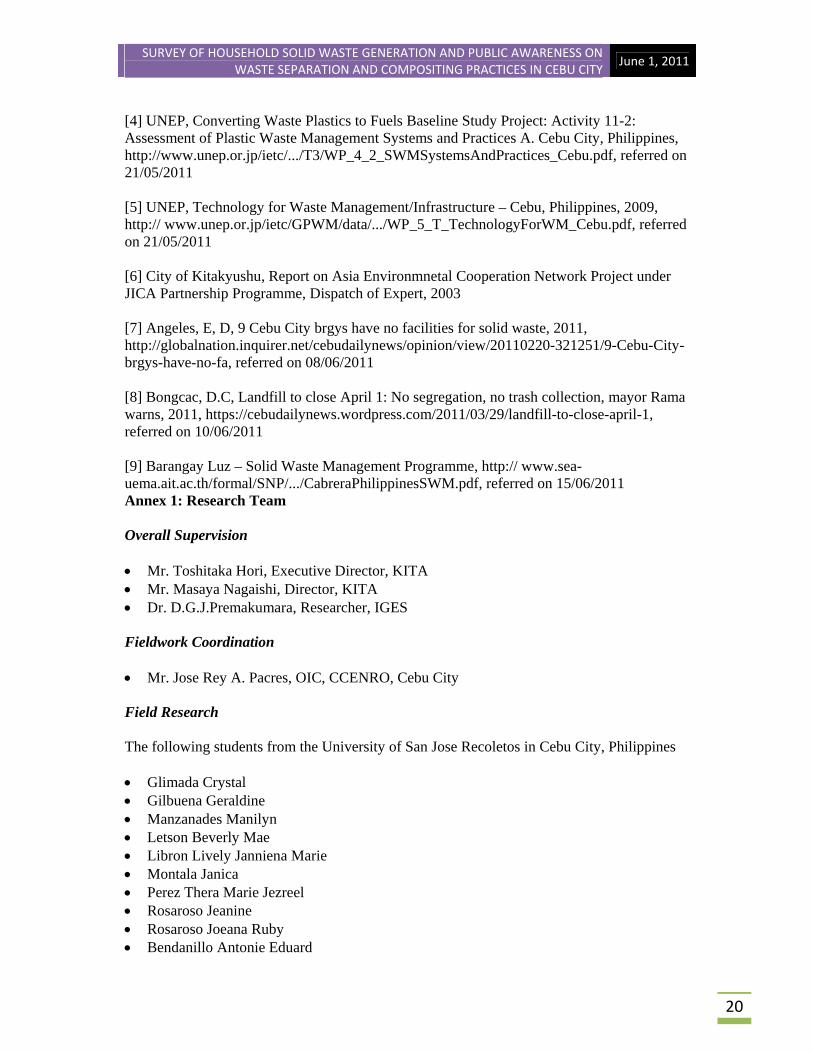
[4] UNEP, Converting Waste Plastics to Fuels Baseline Study Project: Activity 11-2: Assessment of Plastic Waste Management Systems and Practices A. Cebu City, Philippines, http://www.unep.or.jp/ietc/.../T3/WP_4_2_SWMSystemsAndPractices_Cebu.pdf, referred on 21/05/2011 [5] UNEP, Technology for Waste Management/Infrastructure – Cebu, Philippines, 2009, http:// www.unep.or.jp/ietc/GPWM/data/.../WP_5_T_TechnologyForWM_Cebu.pdf, referred on 21/05/2011 [6] City of Kitakyushu, Report on Asia Environmnetal Cooperation Network Project under JICA Partnership Programme, Dispatch of Expert, 2003 [7] Angeles, E, D, 9 Cebu City brgys have no facilities for solid waste, 2011, http://globalnation.inquirer.net/cebudailynews/opinion/view/20110220-321251/9-Cebu-City-brgys-have-no-fa, referred on 08/06/2011 [8] Bongcac, D.C, Landfill to close April 1: No segregation, no trash collection, mayor Rama warns, 2011, https://cebudailynews.wordpress.com/2011/03/29/landfill-to-close-april-1, referred on 10/06/2011 [9] Barangay Luz – Solid Waste Management Programme, http:// www.sea-uema.ait.ac.th/formal/SNP/.../CabreraPhilippinesSWM.pdf, referred on 15/06/2011 Annex 1: Research Team Overall Supervision Mr. Toshitaka Hori, Executive Director, KITA Mr. Masaya Nagaishi, Director, KITA Dr. D.G.J.Premakumara, Researcher, IGES Fieldwork Coordination Mr. Jose Rey A. Pacres, OIC, CCENRO, Cebu City Field Research The following students from the University of San Jose Recoletos in Cebu City, Philippines Glimada Crystal Gilbuena Geraldine Manzanades Manilyn Letson Beverly Mae Libron Lively Janniena Marie Montala Janica Perez Thera Marie Jezreel Rosaroso Jeanine Rosaroso Joeana Ruby Bendanillo Antonie Eduard
SURVEY OF HOUSEHOLD SOLID WASTE GENERATION AND PUBLIC AWARENESS ON WASTE SEPARATION AND COMPOSITING PRACTICES IN CEBU CITY
June 1, 2011
21
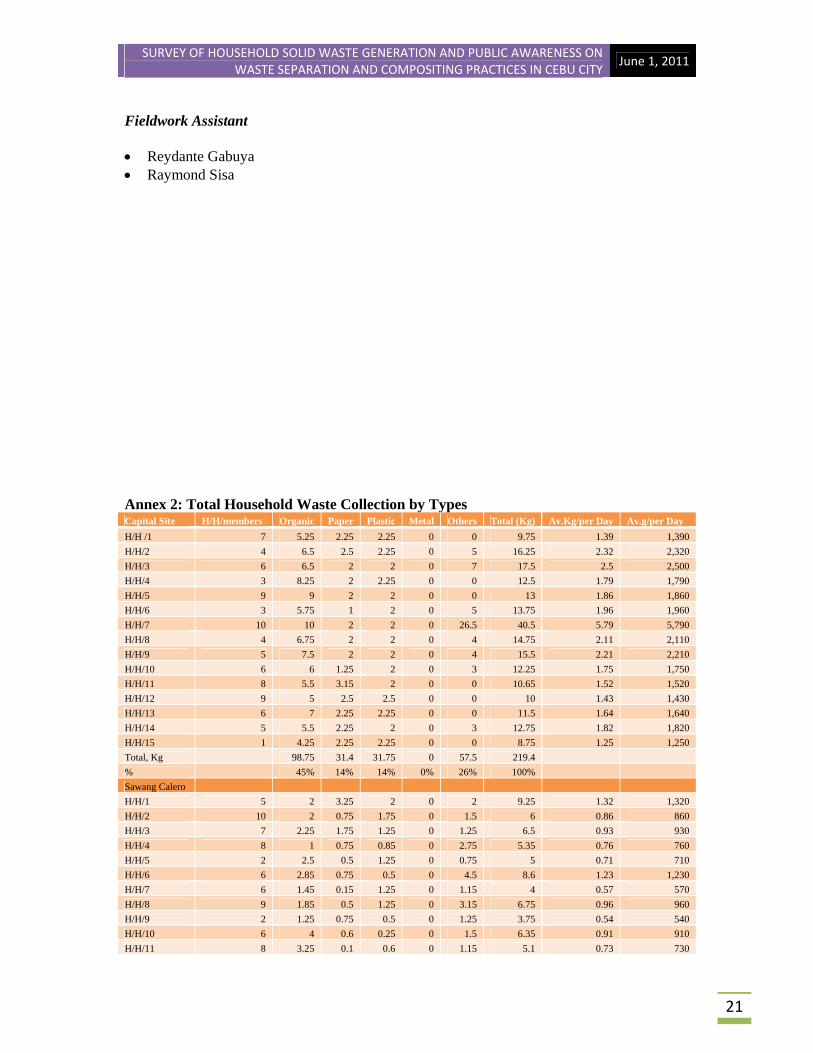
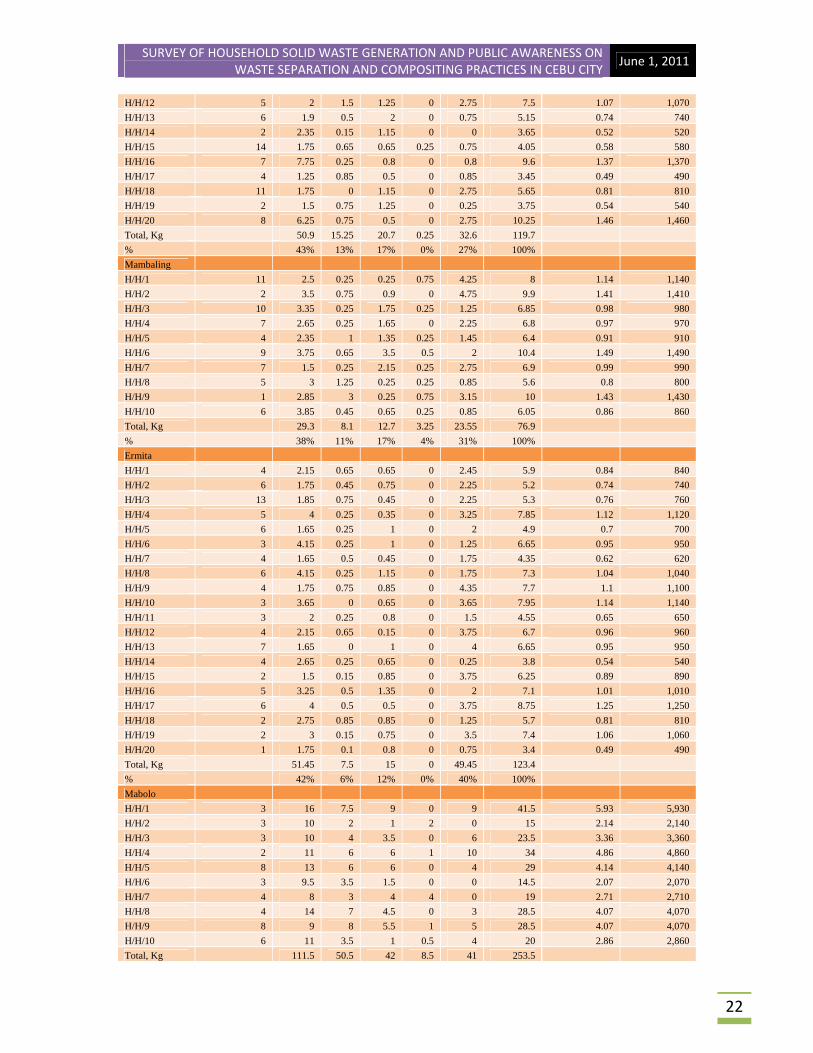
Fieldwork Assistant Reydante Gabuya Raymond Sisa Annex 2: Total Household Waste Collection by Types Capital Site H/H/members Organic Paper Plastic Metal Others Total (Kg) Av.Kg/per Day Av.g/per Day
H/H /1 7 5.25 2.25 2.25 0 0 9.75 1.39 1,390
H/H/2 4 6.5 2.5 2.25 0 5 16.25 2.32 2,320
H/H/3 6 6.5 2 2 0 7 17.5 2.5 2,500
H/H/4 3 8.25 2 2.25 0 0 12.5 1.79 1,790
H/H/5 9 9 2 2 0 0 13 1.86 1,860
H/H/6 3 5.75 1 2 0 5 13.75 1.96 1,960
H/H/7 10 10 2 2 0 26.5 40.5 5.79 5,790
H/H/8 4 6.75 2 2 0 4 14.75 2.11 2,110
H/H/9 5 7.5 2 2 0 4 15.5 2.21 2,210
H/H/10 6 6 1.25 2 0 3 12.25 1.75 1,750
H/H/11 8 5.5 3.15 2 0 0 10.65 1.52 1,520
H/H/12 9 5 2.5 2.5 0 0 10 1.43 1,430
H/H/13 6 7 2.25 2.25 0 0 11.5 1.64 1,640
H/H/14 5 5.5 2.25 2 0 3 12.75 1.82 1,820
H/H/15 1 4.25 2.25 2.25 0 0 8.75 1.25 1,250
Total, Kg 98.75 31.4 31.75 0 57.5 219.4
% 45% 14% 14% 0% 26% 100%
Sawang Calero
H/H/1 5 2 3.25 2 0 2 9.25 1.32 1,320
H/H/2 10 2 0.75 1.75 0 1.5 6 0.86 860
H/H/3 7 2.25 1.75 1.25 0 1.25 6.5 0.93 930
H/H/4 8 1 0.75 0.85 0 2.75 5.35 0.76 760
H/H/5 2 2.5 0.5 1.25 0 0.75 5 0.71 710
H/H/6 6 2.85 0.75 0.5 0 4.5 8.6 1.23 1,230
H/H/7 6 1.45 0.15 1.25 0 1.15 4 0.57 570
H/H/8 9 1.85 0.5 1.25 0 3.15 6.75 0.96 960
H/H/9 2 1.25 0.75 0.5 0 1.25 3.75 0.54 540
H/H/10 6 4 0.6 0.25 0 1.5 6.35 0.91 910
H/H/11 8 3.25 0.1 0.6 0 1.15 5.1 0.73 730
SURVEY OF HOUSEHOLD SOLID WASTE GENERATION AND PUBLIC AWARENESS ON WASTE SEPARATION AND COMPOSITING PRACTICES IN CEBU CITY
June 1, 2011
22
H/H/12 5 2 1.5 1.25 0 2.75 7.5 1.07 1,070
H/H/13 6 1.9 0.5 2 0 0.75 5.15 0.74 740
H/H/14 2 2.35 0.15 1.15 0 0 3.65 0.52 520
H/H/15 14 1.75 0.65 0.65 0.25 0.75 4.05 0.58 580
H/H/16 7 7.75 0.25 0.8 0 0.8 9.6 1.37 1,370
H/H/17 4 1.25 0.85 0.5 0 0.85 3.45 0.49 490
H/H/18 11 1.75 0 1.15 0 2.75 5.65 0.81 810
H/H/19 2 1.5 0.75 1.25 0 0.25 3.75 0.54 540
H/H/20 8 6.25 0.75 0.5 0 2.75 10.25 1.46 1,460
Total, Kg 50.9 15.25 20.7 0.25 32.6 119.7
% 43% 13% 17% 0% 27% 100%
Mambaling
H/H/1 11 2.5 0.25 0.25 0.75 4.25 8 1.14 1,140
H/H/2 2 3.5 0.75 0.9 0 4.75 9.9 1.41 1,410
H/H/3 10 3.35 0.25 1.75 0.25 1.25 6.85 0.98 980
H/H/4 7 2.65 0.25 1.65 0 2.25 6.8 0.97 970
H/H/5 4 2.35 1 1.35 0.25 1.45 6.4 0.91 910
H/H/6 9 3.75 0.65 3.5 0.5 2 10.4 1.49 1,490
H/H/7 7 1.5 0.25 2.15 0.25 2.75 6.9 0.99 990
H/H/8 5 3 1.25 0.25 0.25 0.85 5.6 0.8 800
H/H/9 1 2.85 3 0.25 0.75 3.15 10 1.43 1,430
H/H/10 6 3.85 0.45 0.65 0.25 0.85 6.05 0.86 860
Total, Kg 29.3 8.1 12.7 3.25 23.55 76.9
% 38% 11% 17% 4% 31% 100%
Ermita
H/H/1 4 2.15 0.65 0.65 0 2.45 5.9 0.84 840
H/H/2 6 1.75 0.45 0.75 0 2.25 5.2 0.74 740
H/H/3 13 1.85 0.75 0.45 0 2.25 5.3 0.76 760
H/H/4 5 4 0.25 0.35 0 3.25 7.85 1.12 1,120
H/H/5 6 1.65 0.25 1 0 2 4.9 0.7 700
H/H/6 3 4.15 0.25 1 0 1.25 6.65 0.95 950
H/H/7 4 1.65 0.5 0.45 0 1.75 4.35 0.62 620
H/H/8 6 4.15 0.25 1.15 0 1.75 7.3 1.04 1,040
H/H/9 4 1.75 0.75 0.85 0 4.35 7.7 1.1 1,100
H/H/10 3 3.65 0 0.65 0 3.65 7.95 1.14 1,140
H/H/11 3 2 0.25 0.8 0 1.5 4.55 0.65 650
H/H/12 4 2.15 0.65 0.15 0 3.75 6.7 0.96 960
H/H/13 7 1.65 0 1 0 4 6.65 0.95 950
H/H/14 4 2.65 0.25 0.65 0 0.25 3.8 0.54 540
H/H/15 2 1.5 0.15 0.85 0 3.75 6.25 0.89 890
H/H/16 5 3.25 0.5 1.35 0 2 7.1 1.01 1,010
H/H/17 6 4 0.5 0.5 0 3.75 8.75 1.25 1,250
H/H/18 2 2.75 0.85 0.85 0 1.25 5.7 0.81 810
H/H/19 2 3 0.15 0.75 0 3.5 7.4 1.06 1,060
H/H/20 1 1.75 0.1 0.8 0 0.75 3.4 0.49 490
Total, Kg 51.45 7.5 15 0 49.45 123.4
% 42% 6% 12% 0% 40% 100%
Mabolo
H/H/1 3 16 7.5 9 0 9 41.5 5.93 5,930
H/H/2 3 10 2 1 2 0 15 2.14 2,140
H/H/3 3 10 4 3.5 0 6 23.5 3.36 3,360
H/H/4 2 11 6 6 1 10 34 4.86 4,860
H/H/5 8 13 6 6 0 4 29 4.14 4,140
H/H/6 3 9.5 3.5 1.5 0 0 14.5 2.07 2,070
H/H/7 4 8 3 4 4 0 19 2.71 2,710
H/H/8 4 14 7 4.5 0 3 28.5 4.07 4,070
H/H/9 8 9 8 5.5 1 5 28.5 4.07 4,070
H/H/10 6 11 3.5 1 0.5 4 20 2.86 2,860
Total, Kg 111.5 50.5 42 8.5 41 253.5
SURVEY OF HOUSEHOLD SOLID WASTE GENERATION AND PUBLIC AWARENESS ON WASTE SEPARATION AND COMPOSITING PRACTICES IN CEBU CITY
June 1, 2011
23
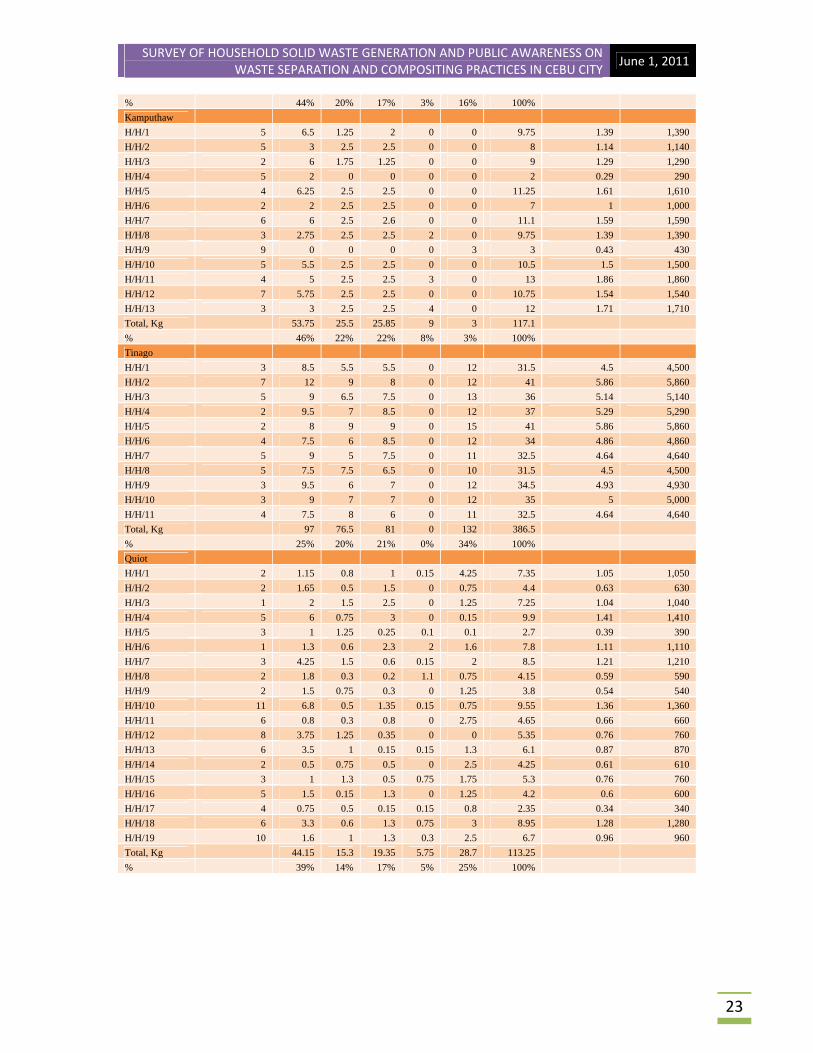
% 44% 20% 17% 3% 16% 100%
Kamputhaw
H/H/1 5 6.5 1.25 2 0 0 9.75 1.39 1,390
H/H/2 5 3 2.5 2.5 0 0 8 1.14 1,140
H/H/3 2 6 1.75 1.25 0 0 9 1.29 1,290
H/H/4 5 2 0 0 0 0 2 0.29 290
H/H/5 4 6.25 2.5 2.5 0 0 11.25 1.61 1,610
H/H/6 2 2 2.5 2.5 0 0 7 1 1,000
H/H/7 6 6 2.5 2.6 0 0 11.1 1.59 1,590
H/H/8 3 2.75 2.5 2.5 2 0 9.75 1.39 1,390
H/H/9 9 0 0 0 0 3 3 0.43 430
H/H/10 5 5.5 2.5 2.5 0 0 10.5 1.5 1,500
H/H/11 4 5 2.5 2.5 3 0 13 1.86 1,860
H/H/12 7 5.75 2.5 2.5 0 0 10.75 1.54 1,540
H/H/13 3 3 2.5 2.5 4 0 12 1.71 1,710
Total, Kg 53.75 25.5 25.85 9 3 117.1
% 46% 22% 22% 8% 3% 100%
Tinago
H/H/1 3 8.5 5.5 5.5 0 12 31.5 4.5 4,500
H/H/2 7 12 9 8 0 12 41 5.86 5,860
H/H/3 5 9 6.5 7.5 0 13 36 5.14 5,140
H/H/4 2 9.5 7 8.5 0 12 37 5.29 5,290
H/H/5 2 8 9 9 0 15 41 5.86 5,860
H/H/6 4 7.5 6 8.5 0 12 34 4.86 4,860
H/H/7 5 9 5 7.5 0 11 32.5 4.64 4,640
H/H/8 5 7.5 7.5 6.5 0 10 31.5 4.5 4,500
H/H/9 3 9.5 6 7 0 12 34.5 4.93 4,930
H/H/10 3 9 7 7 0 12 35 5 5,000
H/H/11 4 7.5 8 6 0 11 32.5 4.64 4,640
Total, Kg 97 76.5 81 0 132 386.5
% 25% 20% 21% 0% 34% 100%
Quiot
H/H/1 2 1.15 0.8 1 0.15 4.25 7.35 1.05 1,050
H/H/2 2 1.65 0.5 1.5 0 0.75 4.4 0.63 630
H/H/3 1 2 1.5 2.5 0 1.25 7.25 1.04 1,040
H/H/4 5 6 0.75 3 0 0.15 9.9 1.41 1,410
H/H/5 3 1 1.25 0.25 0.1 0.1 2.7 0.39 390
H/H/6 1 1.3 0.6 2.3 2 1.6 7.8 1.11 1,110
H/H/7 3 4.25 1.5 0.6 0.15 2 8.5 1.21 1,210
H/H/8 2 1.8 0.3 0.2 1.1 0.75 4.15 0.59 590
H/H/9 2 1.5 0.75 0.3 0 1.25 3.8 0.54 540
H/H/10 11 6.8 0.5 1.35 0.15 0.75 9.55 1.36 1,360
H/H/11 6 0.8 0.3 0.8 0 2.75 4.65 0.66 660
H/H/12 8 3.75 1.25 0.35 0 0 5.35 0.76 760
H/H/13 6 3.5 1 0.15 0.15 1.3 6.1 0.87 870
H/H/14 2 0.5 0.75 0.5 0 2.5 4.25 0.61 610
H/H/15 3 1 1.3 0.5 0.75 1.75 5.3 0.76 760
H/H/16 5 1.5 0.15 1.3 0 1.25 4.2 0.6 600
H/H/17 4 0.75 0.5 0.15 0.15 0.8 2.35 0.34 340
H/H/18 6 3.3 0.6 1.3 0.75 3 8.95 1.28 1,280
H/H/19 10 1.6 1 1.3 0.3 2.5 6.7 0.96 960
Total, Kg 44.15 15.3 19.35 5.75 28.7 113.25
% 39% 14% 17% 5% 25% 100%
SURVEY OF HOUSEHOLD SOLID WASTE GENERATION AND PUBLIC AWARENESS ON WASTE SEPARATION AND COMPOSITING PRACTICES IN CEBU CITY
June 1, 2011
24
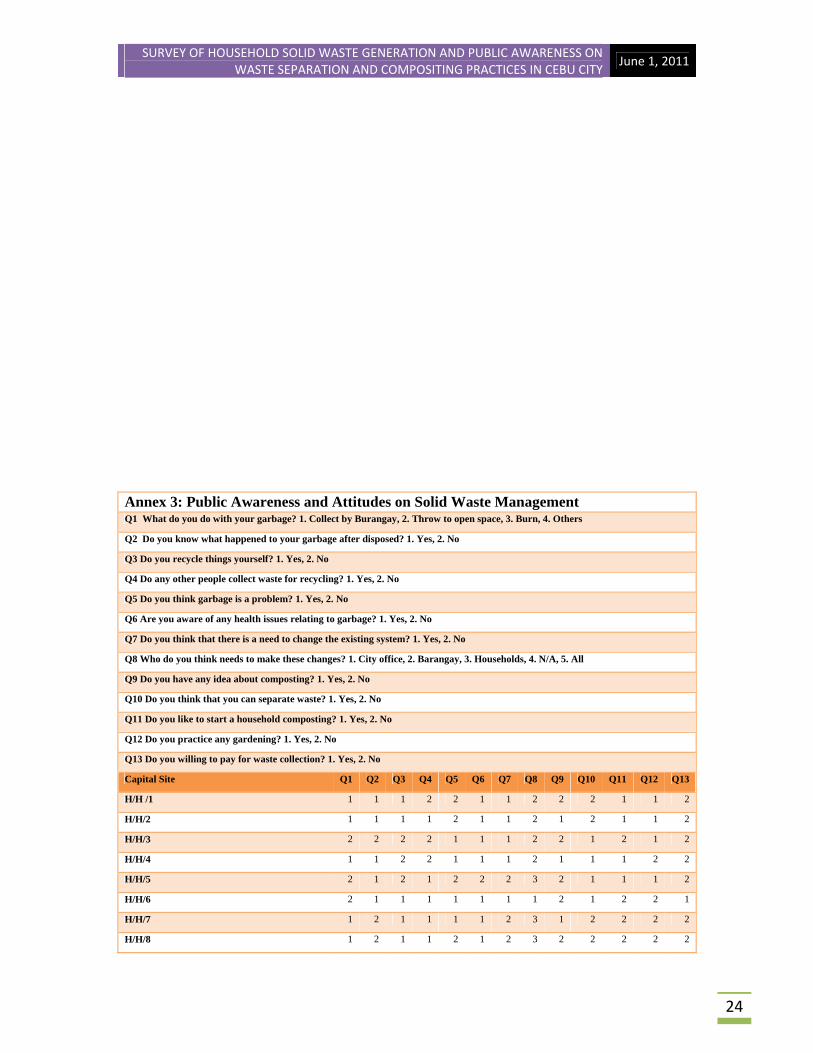
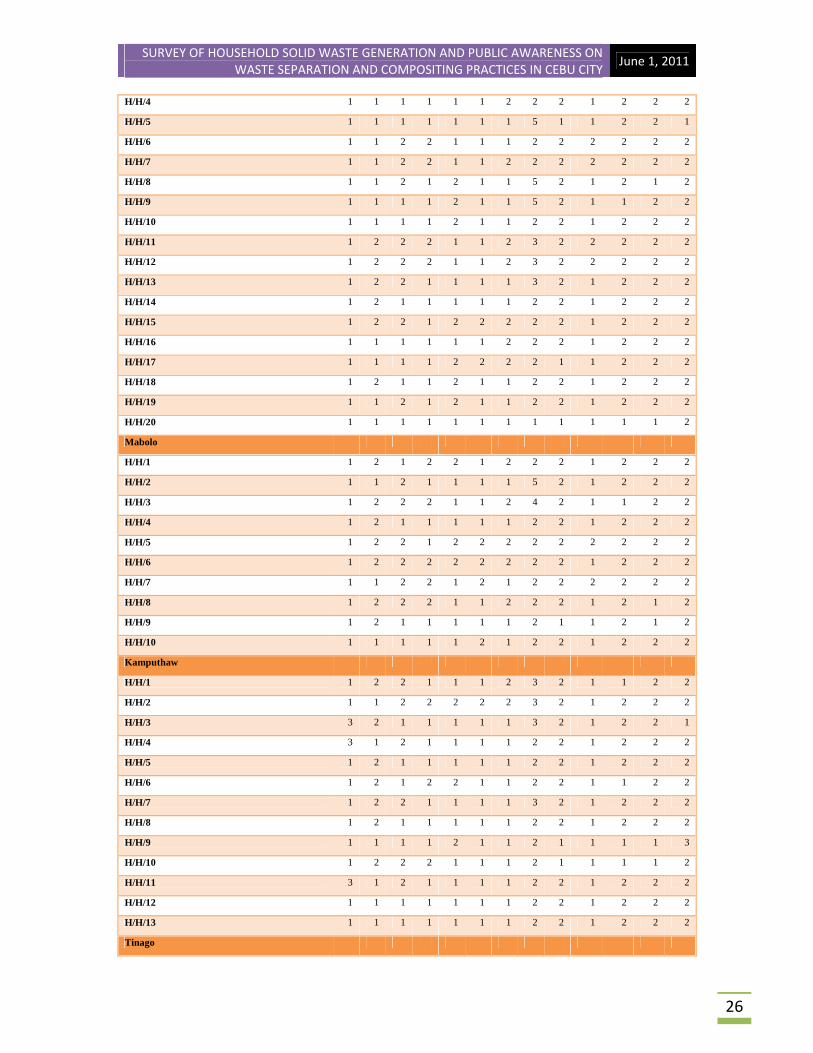
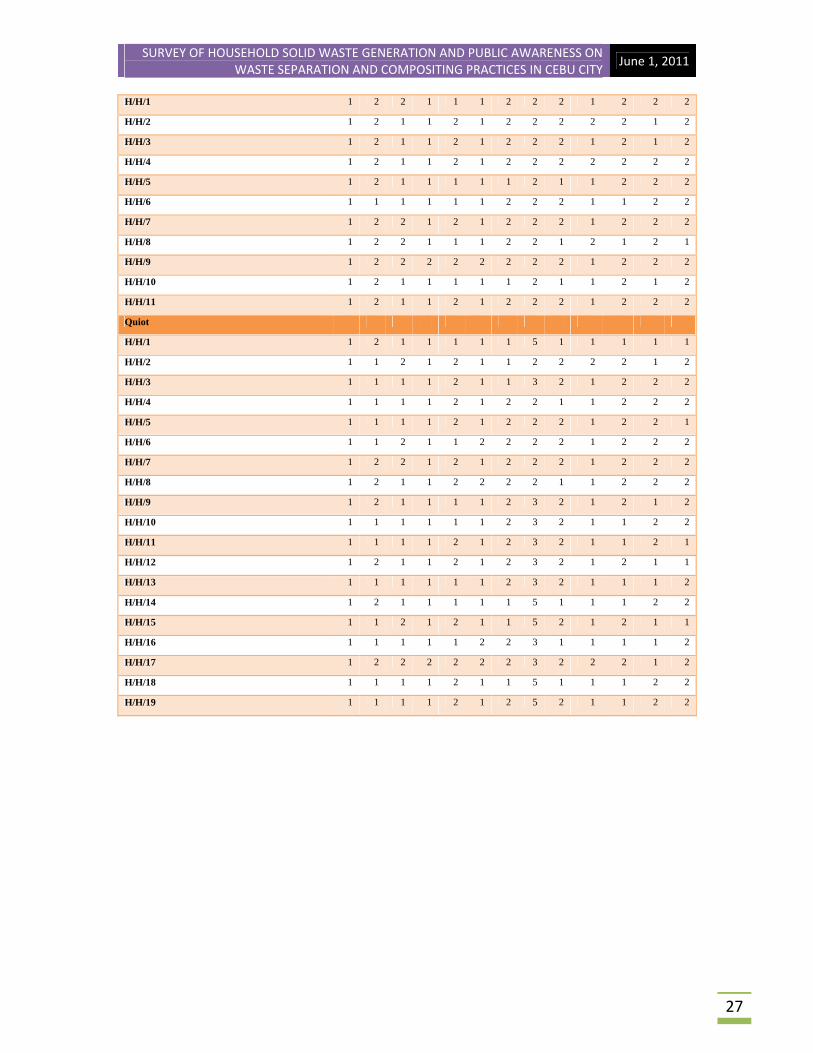
Annex 3: Public Awareness and Attitudes on Solid Waste Management Q1 What do you do with your garbage? 1. Collect by Burangay, 2. Throw to open space, 3. Burn, 4. Others
Q2 Do you know what happened to your garbage after disposed? 1. Yes, 2. No
Q3 Do you recycle things yourself? 1. Yes, 2. No
Q4 Do any other people collect waste for recycling? 1. Yes, 2. No
Q5 Do you think garbage is a problem? 1. Yes, 2. No
Q6 Are you aware of any health issues relating to garbage? 1. Yes, 2. No
Q7 Do you think that there is a need to change the existing system? 1. Yes, 2. No
Q8 Who do you think needs to make these changes? 1. City office, 2. Barangay, 3. Households, 4. N/A, 5. All
Q9 Do you have any idea about composting? 1. Yes, 2. No
Q10 Do you think that you can separate waste? 1. Yes, 2. No
Q11 Do you like to start a household composting? 1. Yes, 2. No
Q12 Do you practice any gardening? 1. Yes, 2. No
Q13 Do you willing to pay for waste collection? 1. Yes, 2. No
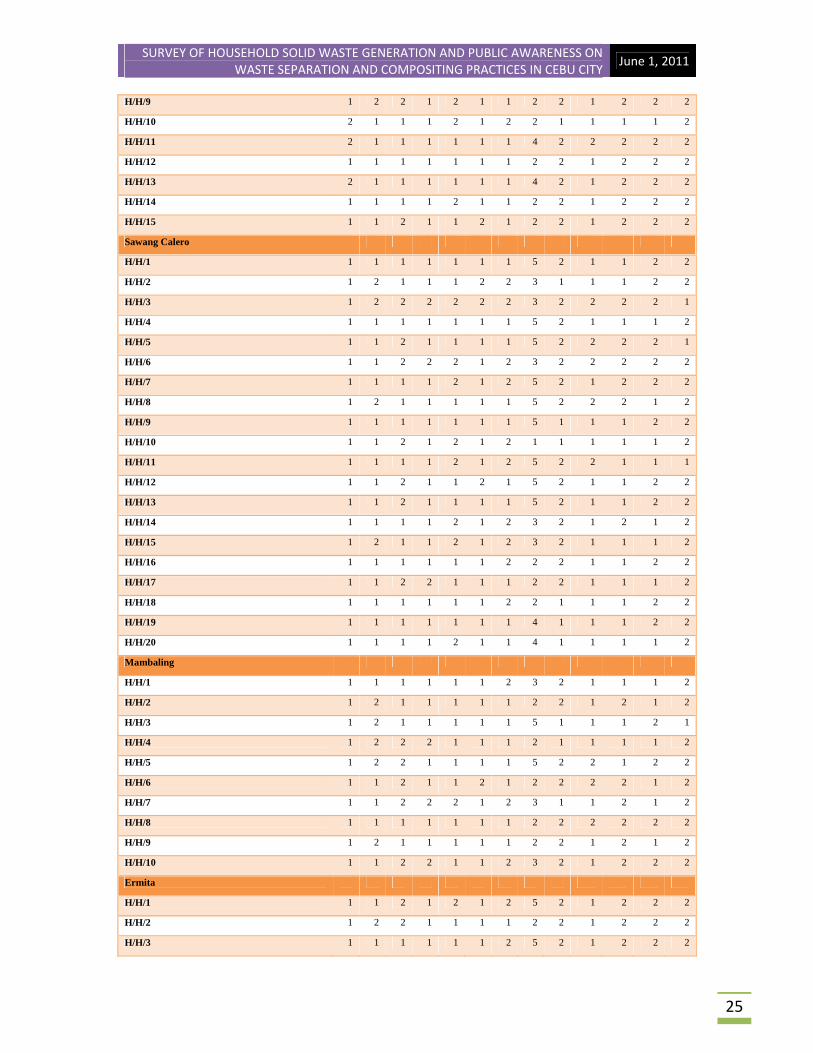
Capital Site Q1 Q2 Q3 Q4 Q5 Q6 Q7 Q8 Q9 Q10 Q11 Q12 Q13
H/H /1 1 1 1 2 2 1 1 2 2 2 1 1 2
H/H/2 1 1 1 1 2 1 1 2 1 2 1 1 2
H/H/3 2 2 2 2 1 1 1 2 2 1 2 1 2
H/H/4 1 1 2 2 1 1 1 2 1 1 1 2 2
H/H/5 2 1 2 1 2 2 2 3 2 1 1 1 2
H/H/6 2 1 1 1 1 1 1 1 2 1 2 2 1
H/H/7 1 2 1 1 1 1 2 3 1 2 2 2 2
H/H/8 1 2 1 1 2 1 2 3 2 2 2 2 2
SURVEY OF HOUSEHOLD SOLID WASTE GENERATION AND PUBLIC AWARENESS ON WASTE SEPARATION AND COMPOSITING PRACTICES IN CEBU CITY
June 1, 2011
25
H/H/9 1 2 2 1 2 1 1 2 2 1 2 2 2
H/H/10 2 1 1 1 2 1 2 2 1 1 1 1 2
H/H/11 2 1 1 1 1 1 1 4 2 2 2 2 2
H/H/12 1 1 1 1 1 1 1 2 2 1 2 2 2
H/H/13 2 1 1 1 1 1 1 4 2 1 2 2 2
H/H/14 1 1 1 1 2 1 1 2 2 1 2 2 2
H/H/15 1 1 2 1 1 2 1 2 2 1 2 2 2
Sawang Calero
H/H/1 1 1 1 1 1 1 1 5 2 1 1 2 2
H/H/2 1 2 1 1 1 2 2 3 1 1 1 2 2
H/H/3 1 2 2 2 2 2 2 3 2 2 2 2 1
H/H/4 1 1 1 1 1 1 1 5 2 1 1 1 2
H/H/5 1 1 2 1 1 1 1 5 2 2 2 2 1
H/H/6 1 1 2 2 2 1 2 3 2 2 2 2 2
H/H/7 1 1 1 1 2 1 2 5 2 1 2 2 2
H/H/8 1 2 1 1 1 1 1 5 2 2 2 1 2
H/H/9 1 1 1 1 1 1 1 5 1 1 1 2 2
H/H/10 1 1 2 1 2 1 2 1 1 1 1 1 2
H/H/11 1 1 1 1 2 1 2 5 2 2 1 1 1
H/H/12 1 1 2 1 1 2 1 5 2 1 1 2 2
H/H/13 1 1 2 1 1 1 1 5 2 1 1 2 2
H/H/14 1 1 1 1 2 1 2 3 2 1 2 1 2
H/H/15 1 2 1 1 2 1 2 3 2 1 1 1 2
H/H/16 1 1 1 1 1 1 2 2 2 1 1 2 2
H/H/17 1 1 2 2 1 1 1 2 2 1 1 1 2
H/H/18 1 1 1 1 1 1 2 2 1 1 1 2 2
H/H/19 1 1 1 1 1 1 1 4 1 1 1 2 2
H/H/20 1 1 1 1 2 1 1 4 1 1 1 1 2
Mambaling
H/H/1 1 1 1 1 1 1 2 3 2 1 1 1 2
H/H/2 1 2 1 1 1 1 1 2 2 1 2 1 2
H/H/3 1 2 1 1 1 1 1 5 1 1 1 2 1
H/H/4 1 2 2 2 1 1 1 2 1 1 1 1 2
H/H/5 1 2 2 1 1 1 1 5 2 2 1 2 2
H/H/6 1 1 2 1 1 2 1 2 2 2 2 1 2
H/H/7 1 1 2 2 2 1 2 3 1 1 2 1 2
H/H/8 1 1 1 1 1 1 1 2 2 2 2 2 2
H/H/9 1 2 1 1 1 1 1 2 2 1 2 1 2
H/H/10 1 1 2 2 1 1 2 3 2 1 2 2 2
Ermita
H/H/1 1 1 2 1 2 1 2 5 2 1 2 2 2
H/H/2 1 2 2 1 1 1 1 2 2 1 2 2 2
H/H/3 1 1 1 1 1 1 2 5 2 1 2 2 2
SURVEY OF HOUSEHOLD SOLID WASTE GENERATION AND PUBLIC AWARENESS ON WASTE SEPARATION AND COMPOSITING PRACTICES IN CEBU CITY
June 1, 2011
26
H/H/4 1 1 1 1 1 1 2 2 2 1 2 2 2
H/H/5 1 1 1 1 1 1 1 5 1 1 2 2 1
H/H/6 1 1 2 2 1 1 1 2 2 2 2 2 2
H/H/7 1 1 2 2 1 1 2 2 2 2 2 2 2
H/H/8 1 1 2 1 2 1 1 5 2 1 2 1 2
H/H/9 1 1 1 1 2 1 1 5 2 1 1 2 2
H/H/10 1 1 1 1 2 1 1 2 2 1 2 2 2
H/H/11 1 2 2 2 1 1 2 3 2 2 2 2 2
H/H/12 1 2 2 2 1 1 2 3 2 2 2 2 2
H/H/13 1 2 2 1 1 1 1 3 2 1 2 2 2
H/H/14 1 2 1 1 1 1 1 2 2 1 2 2 2
H/H/15 1 2 2 1 2 2 2 2 2 1 2 2 2
H/H/16 1 1 1 1 1 1 2 2 2 1 2 2 2
H/H/17 1 1 1 1 2 2 2 2 1 1 2 2 2
H/H/18 1 2 1 1 2 1 1 2 2 1 2 2 2
H/H/19 1 1 2 1 2 1 1 2 2 1 2 2 2
H/H/20 1 1 1 1 1 1 1 1 1 1 1 1 2
Mabolo
H/H/1 1 2 1 2 2 1 2 2 2 1 2 2 2
H/H/2 1 1 2 1 1 1 1 5 2 1 2 2 2
H/H/3 1 2 2 2 1 1 2 4 2 1 1 2 2
H/H/4 1 2 1 1 1 1 1 2 2 1 2 2 2
H/H/5 1 2 2 1 2 2 2 2 2 2 2 2 2
H/H/6 1 2 2 2 2 2 2 2 2 1 2 2 2
H/H/7 1 1 2 2 1 2 1 2 2 2 2 2 2
H/H/8 1 2 2 2 1 1 2 2 2 1 2 1 2
H/H/9 1 2 1 1 1 1 1 2 1 1 2 1 2
H/H/10 1 1 1 1 1 2 1 2 2 1 2 2 2
Kamputhaw
H/H/1 1 2 2 1 1 1 2 3 2 1 1 2 2
H/H/2 1 1 2 2 2 2 2 3 2 1 2 2 2
H/H/3 3 2 1 1 1 1 1 3 2 1 2 2 1
H/H/4 3 1 2 1 1 1 1 2 2 1 2 2 2
H/H/5 1 2 1 1 1 1 1 2 2 1 2 2 2
H/H/6 1 2 1 2 2 1 1 2 2 1 1 2 2
H/H/7 1 2 2 1 1 1 1 3 2 1 2 2 2
H/H/8 1 2 1 1 1 1 1 2 2 1 2 2 2
H/H/9 1 1 1 1 2 1 1 2 1 1 1 1 3
H/H/10 1 2 2 2 1 1 1 2 1 1 1 1 2
H/H/11 3 1 2 1 1 1 1 2 2 1 2 2 2
H/H/12 1 1 1 1 1 1 1 2 2 1 2 2 2
H/H/13 1 1 1 1 1 1 1 2 2 1 2 2 2
Tinago
SURVEY OF HOUSEHOLD SOLID WASTE GENERATION AND PUBLIC AWARENESS ON WASTE SEPARATION AND COMPOSITING PRACTICES IN CEBU CITY
June 1, 2011
27
H/H/1 1 2 2 1 1 1 2 2 2 1 2 2 2
H/H/2 1 2 1 1 2 1 2 2 2 2 2 1 2
H/H/3 1 2 1 1 2 1 2 2 2 1 2 1 2
H/H/4 1 2 1 1 2 1 2 2 2 2 2 2 2
H/H/5 1 2 1 1 1 1 1 2 1 1 2 2 2
H/H/6 1 1 1 1 1 1 2 2 2 1 1 2 2
H/H/7 1 2 2 1 2 1 2 2 2 1 2 2 2
H/H/8 1 2 2 1 1 1 2 2 1 2 1 2 1
H/H/9 1 2 2 2 2 2 2 2 2 1 2 2 2
H/H/10 1 2 1 1 1 1 1 2 1 1 2 1 2
H/H/11 1 2 1 1 2 1 2 2 2 1 2 2 2
Quiot
H/H/1 1 2 1 1 1 1 1 5 1 1 1 1 1
H/H/2 1 1 2 1 2 1 1 2 2 2 2 1 2
H/H/3 1 1 1 1 2 1 1 3 2 1 2 2 2
H/H/4 1 1 1 1 2 1 2 2 1 1 2 2 2
H/H/5 1 1 1 1 2 1 2 2 2 1 2 2 1
H/H/6 1 1 2 1 1 2 2 2 2 1 2 2 2
H/H/7 1 2 2 1 2 1 2 2 2 1 2 2 2
H/H/8 1 2 1 1 2 2 2 2 1 1 2 2 2
H/H/9 1 2 1 1 1 1 2 3 2 1 2 1 2
H/H/10 1 1 1 1 1 1 2 3 2 1 1 2 2
H/H/11 1 1 1 1 2 1 2 3 2 1 1 2 1
H/H/12 1 2 1 1 2 1 2 3 2 1 2 1 1
H/H/13 1 1 1 1 1 1 2 3 2 1 1 1 2
H/H/14 1 2 1 1 1 1 1 5 1 1 1 2 2
H/H/15 1 1 2 1 2 1 1 5 2 1 2 1 1
H/H/16 1 1 1 1 1 2 2 3 1 1 1 1 2
H/H/17 1 2 2 2 2 2 2 3 2 2 2 1 2
H/H/18 1 1 1 1 2 1 1 5 1 1 1 2 2
H/H/19 1 1 1 1 2 1 2 5 2 1 1 2 2