Embed Size (px)
Citation preview
Accelerating Urban Sanitation in India
Policy Evolution, Progress, Implementation
Challenges and Research Questions
Srinivas Chary – Director, Administrative Staff College of India (ASCI)

1. Urban Transformation : India
Urban Transformation
India is the second largest urban
system next to China
India is urbanizing fast

Report on Indian Urban Infrastructure and Services
India is urbanising...
India’s urban population to increase
• From 350 mn today to 600 mn by 2031
• From 50 cities with population of 1 mn and above today to 87 by 2031
On average, 25 per cent of the population in Indian cities lives in slums.
Urban planning, urban infrastructure development and public service delivery of universal
standards must address this challenge.

Cities and Economy
Cities and Economy
• Engines of Growth – over 60% contribution to the economy
• Hubs for enterprise, innovation, people and politics
• Increasing dependence of national / provincial economic growth on the productivity of cities
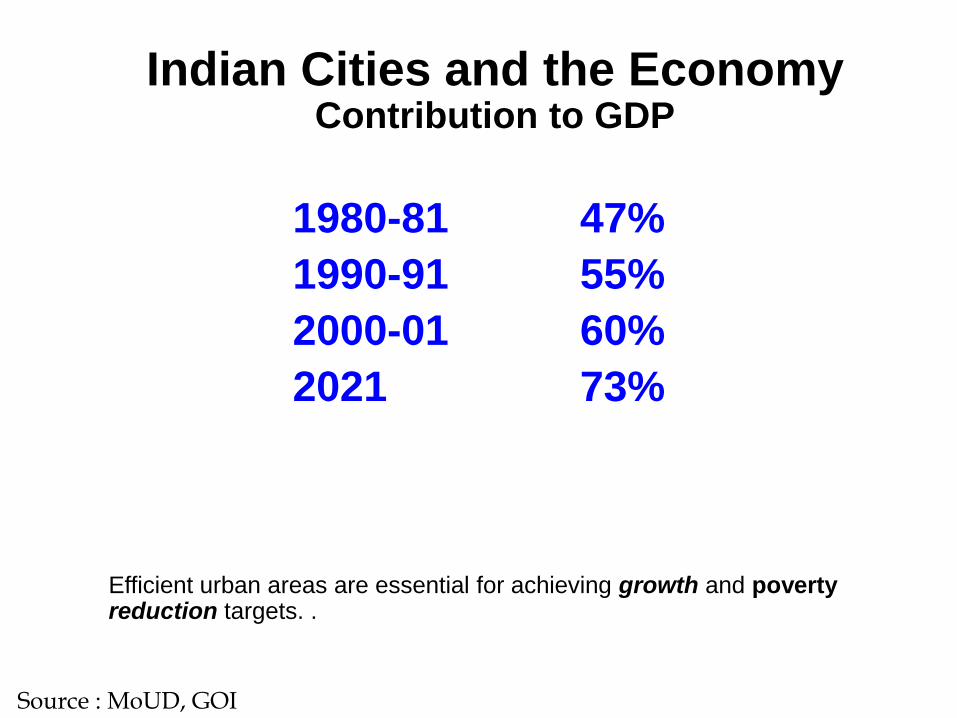
1980-81 47%
1990-91 55%
2000-01 60%
2021 73%
Indian Cities and the Economy Contribution to GDP
Source : MoUD, GOI
Efficient urban areas are essential for achieving growth and poverty reduction targets. .
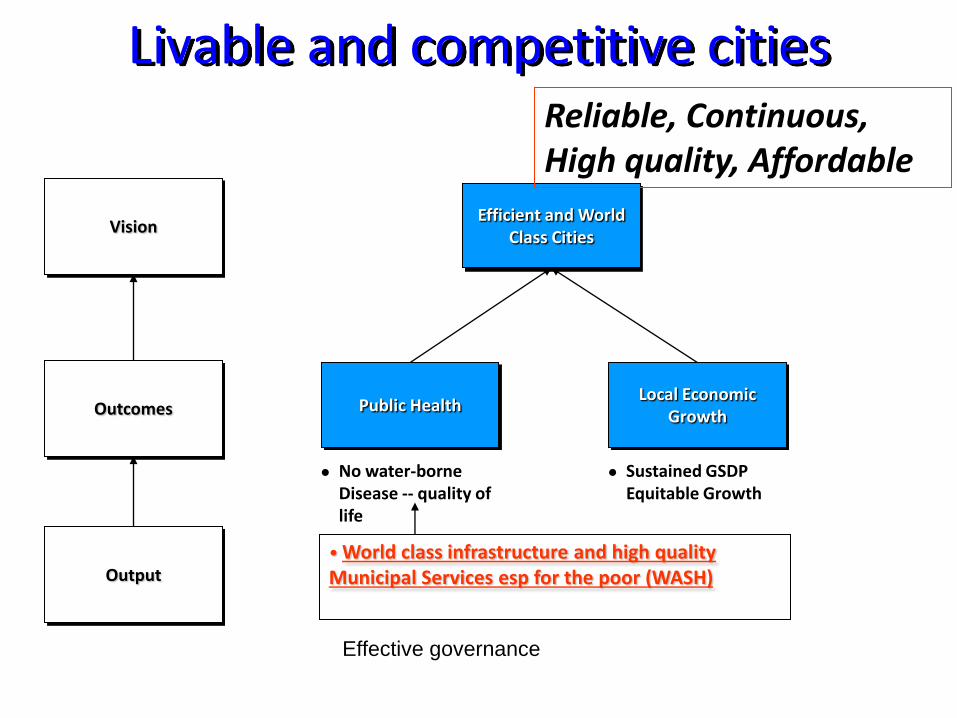
Livable and competitive cities
Vision
Outcomes
Output
Efficient and World Class Cities
No water-borne Disease -- quality of life
Public Health
Sustained GSDP Equitable Growth
Local Economic Growth
• World class infrastructure and high quality Municipal Services esp for the poor (WASH)
Effective governance
Reliable, Continuous, High quality, Affordable
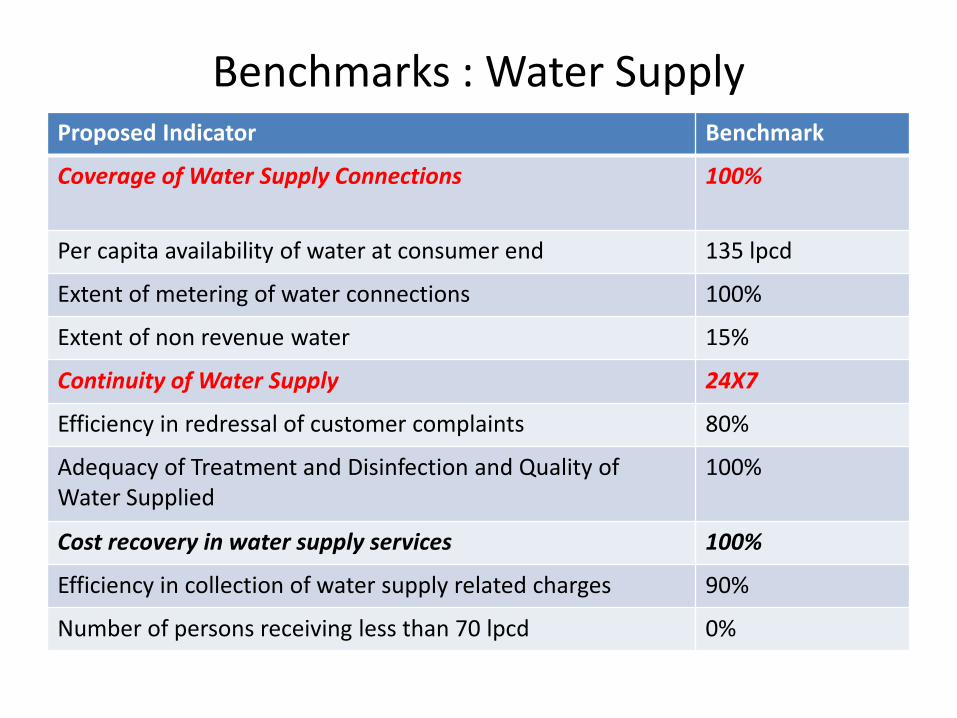
Benchmarks : Water Supply Proposed Indicator Benchmark
Coverage of Water Supply Connections
100%
Per capita availability of water at consumer end 135 lpcd
Extent of metering of water connections 100%
Extent of non revenue water 15%
Continuity of Water Supply 24X7
Efficiency in redressal of customer complaints 80%
Adequacy of Treatment and Disinfection and Quality of Water Supplied
100%
Cost recovery in water supply services 100%
Efficiency in collection of water supply related charges 90%
Number of persons receiving less than 70 lpcd 0%
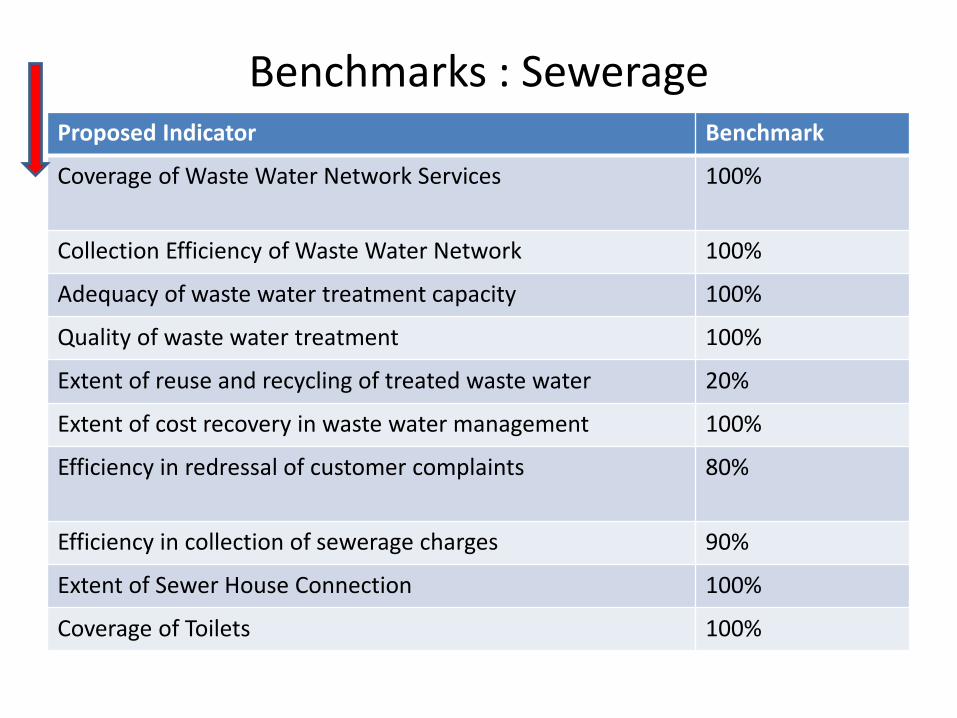
Benchmarks : Sewerage Proposed Indicator Benchmark
Coverage of Waste Water Network Services
100%
Collection Efficiency of Waste Water Network 100%
Adequacy of waste water treatment capacity 100%
Quality of waste water treatment 100%
Extent of reuse and recycling of treated waste water 20%
Extent of cost recovery in waste water management 100%
Efficiency in redressal of customer complaints 80%
Efficiency in collection of sewerage charges 90%
Extent of Sewer House Connection 100%
Coverage of Toilets 100%
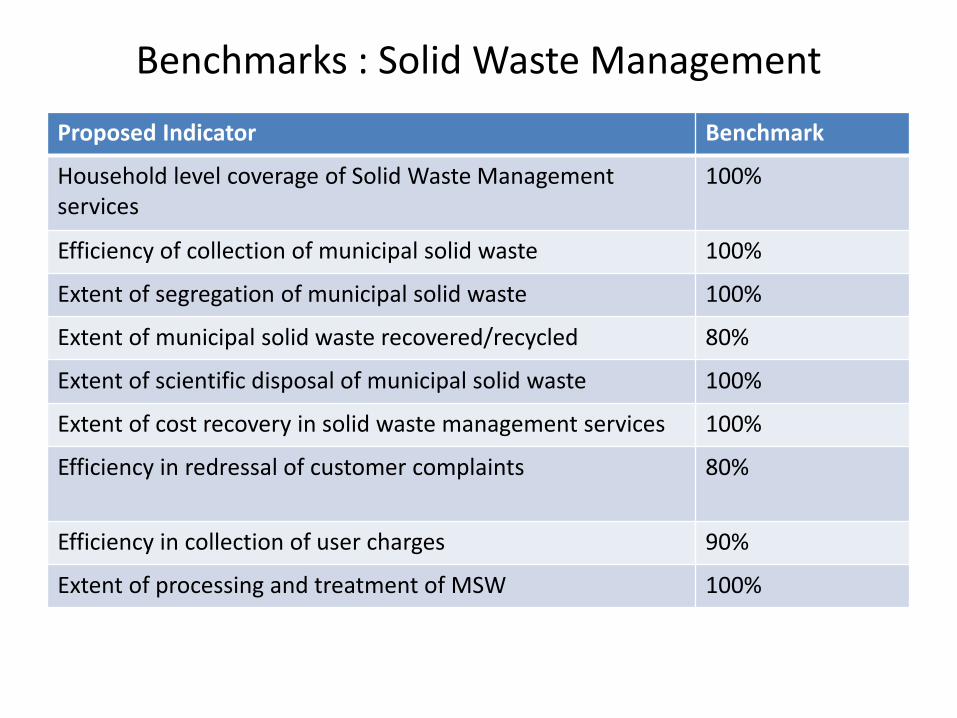
Benchmarks : Solid Waste Management
Proposed Indicator Benchmark
Household level coverage of Solid Waste Management services
100%
Efficiency of collection of municipal solid waste 100%
Extent of segregation of municipal solid waste 100%
Extent of municipal solid waste recovered/recycled 80%
Extent of scientific disposal of municipal solid waste 100%
Extent of cost recovery in solid waste management services 100%
Efficiency in redressal of customer complaints 80%
Efficiency in collection of user charges 90%
Extent of processing and treatment of MSW 100%
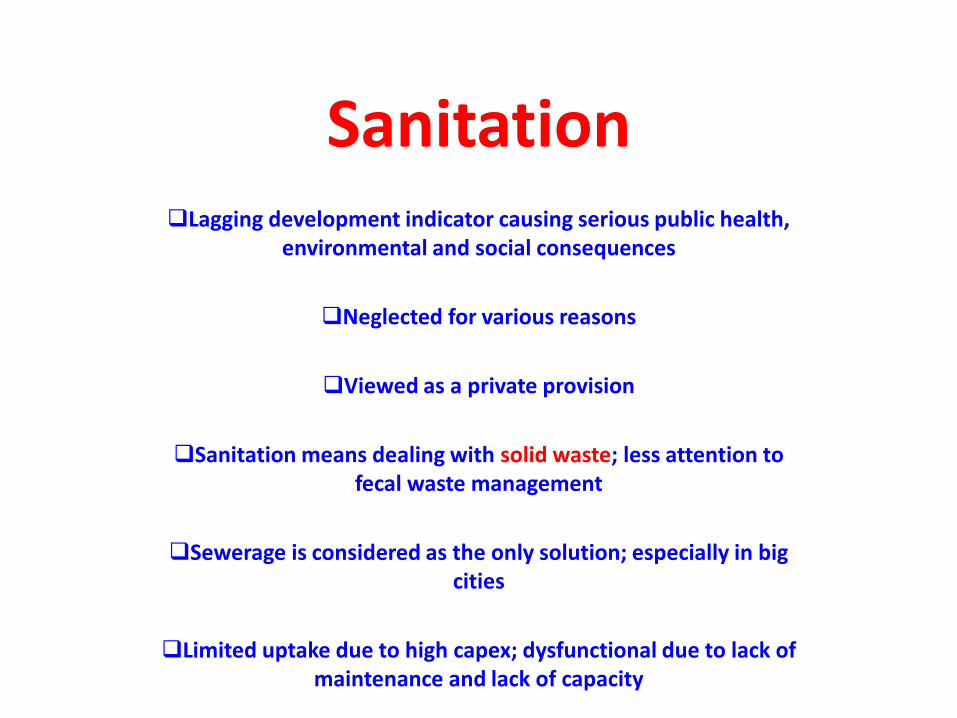
Sanitation Lagging development indicator causing serious public health,
environmental and social consequences
Neglected for various reasons
Viewed as a private provision
Sanitation means dealing with solid waste; less attention to fecal waste management
Sewerage is considered as the only solution; especially in big cities
Limited uptake due to high capex; dysfunctional due to lack of maintenance and lack of capacity
2. Urban Sanitation : Status
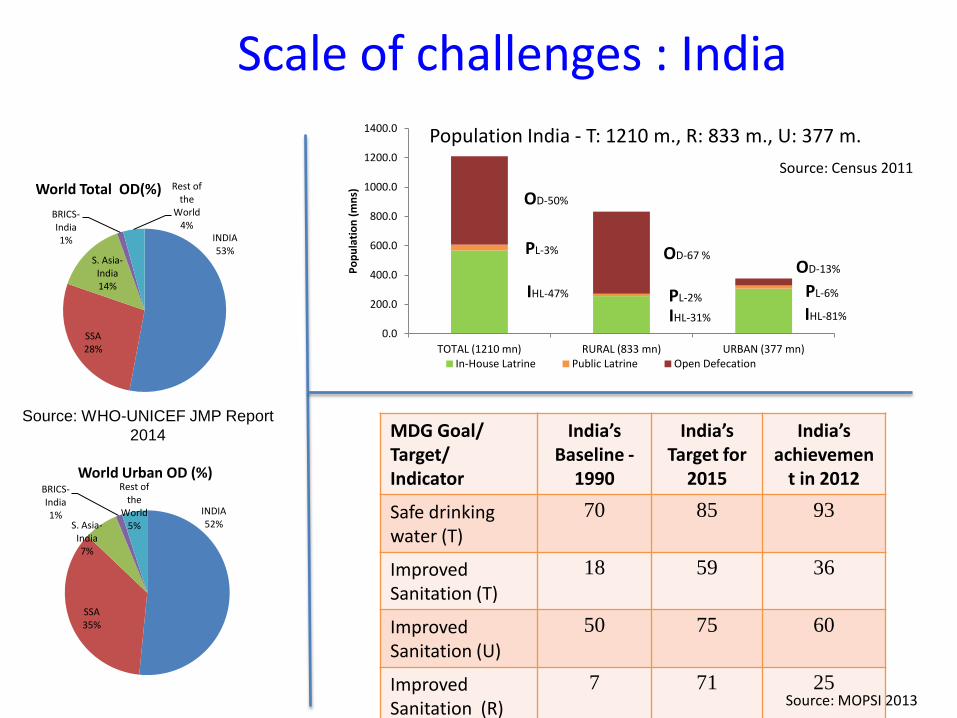
Scale of challenges : India
Source: WHO-UNICEF JMP Report
2014
INDIA 53%
SSA 28%
S. Asia-India 14%
BRICS-India 1%
Rest of the
World 4%
World Total OD(%)
INDIA 52%
SSA 35%
S. Asia-India 7%
BRICS-India 1%
Rest of the
World 5%
World Urban OD (%)
IHL-47%
IHL-31% IHL-81%
PL-3%
PL-2% PL-6%
OD-50%
OD-67 % OD-13%
0.0
200.0
400.0
600.0
800.0
1000.0
1200.0
1400.0
TOTAL (1210 mn) RURAL (833 mn) URBAN (377 mn) P
op
ula
tio
n (
mn
s)
In-House Latrine Public Latrine Open Defecation
MDG Goal/ Target/ Indicator
India’s Baseline -
1990
India’s Target for
2015
India’s achievemen
t in 2012
Safe drinking water (T)
70 85 93
Improved Sanitation (T)
18 59 36
Improved Sanitation (U)
50 75 60
Improved Sanitation (R)
7 71 25
Population India - T: 1210 m., R: 833 m., U: 377 m.
Source: Census 2011
Source: MOPSI 2013
Lack of credible data and evidence on health impact of sanitation

Urban Sanitation provision in India: Choices people make
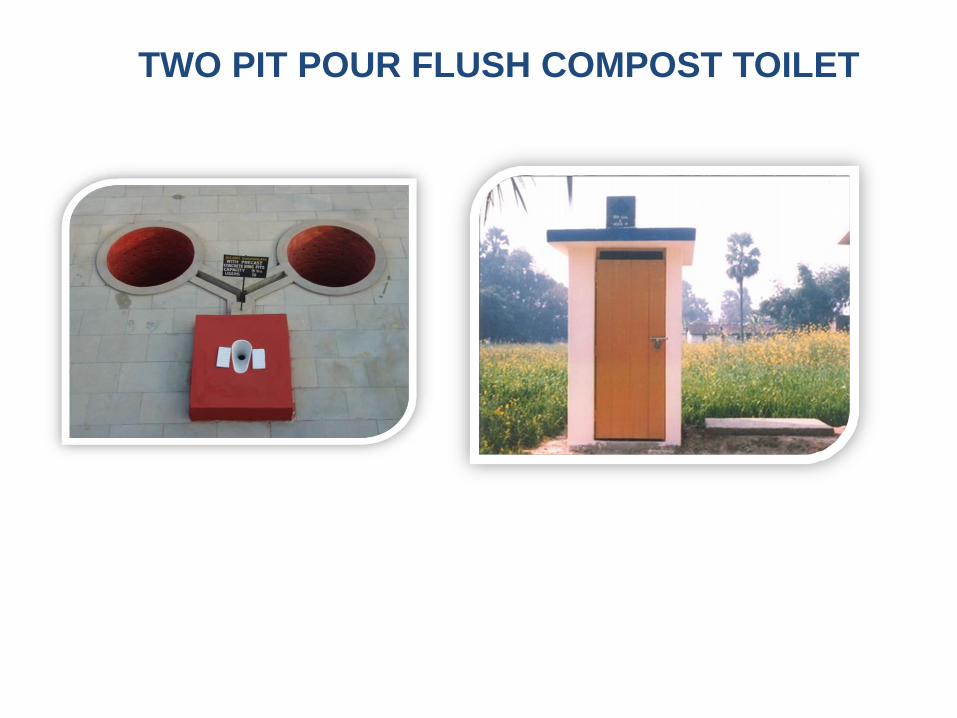
TWO PIT POUR FLUSH COMPOST TOILET
• 75% of fresh water resource which is being used for drinking purpose is contaminated.
• Sewage contributes 60% of total pollution load.
• 93% of total domestic wastewater is generated in Class-I cities.
Ref.: CPCB Report, 2009
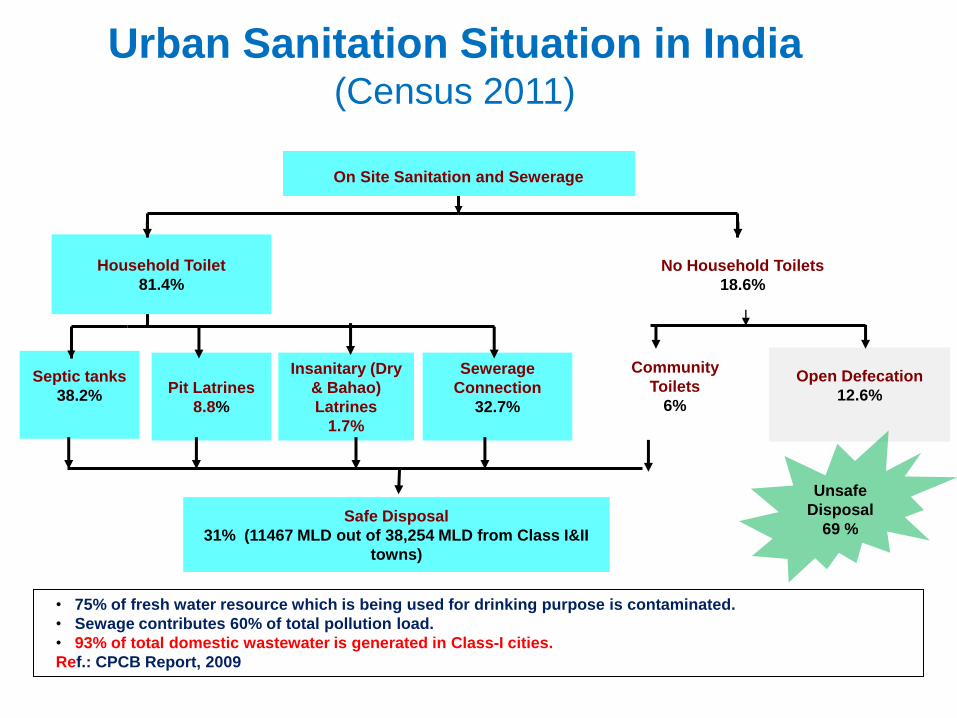
Urban Sanitation Situation in India (Census 2011)
Septic tanks
38.2%
On Site Sanitation and Sewerage
Household Toilet
81.4%
No Household Toilets
18.6%
Pit Latrines
8.8%
Community
Toilets
6%
Open Defecation
12.6%
Safe Disposal
31% (11467 MLD out of 38,254 MLD from Class I&II
towns)
Unsafe
Disposal
69 %
Sewerage
Connection
32.7%
Insanitary (Dry
& Bahao)
Latrines
1.7%
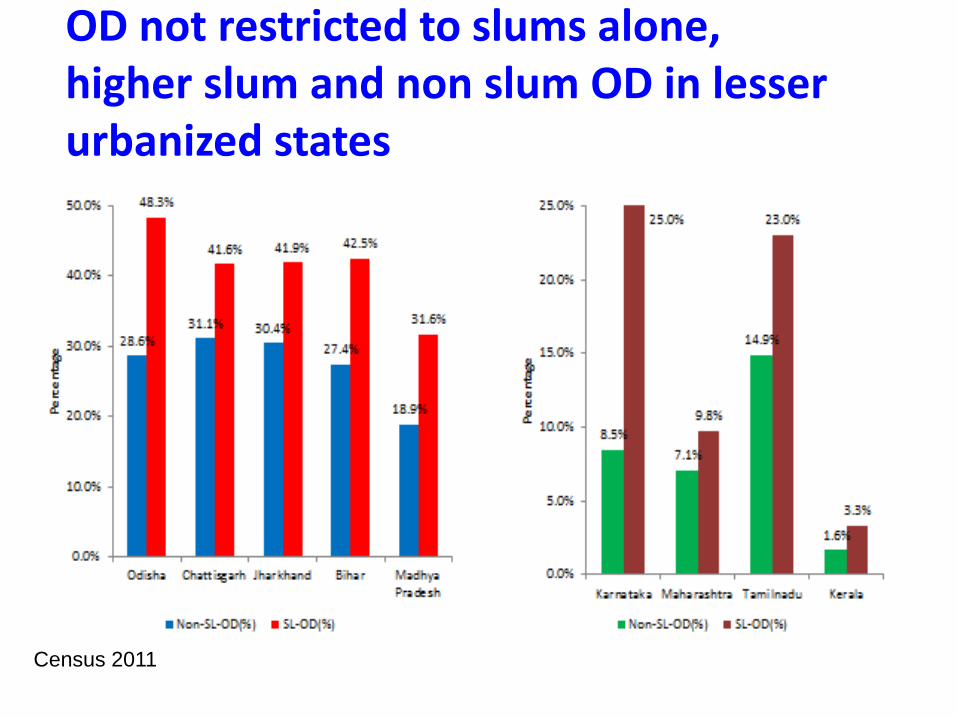
OD not restricted to slums alone, higher slum and non slum OD in lesser urbanized states
Census 2011
Policy Response : Evolution
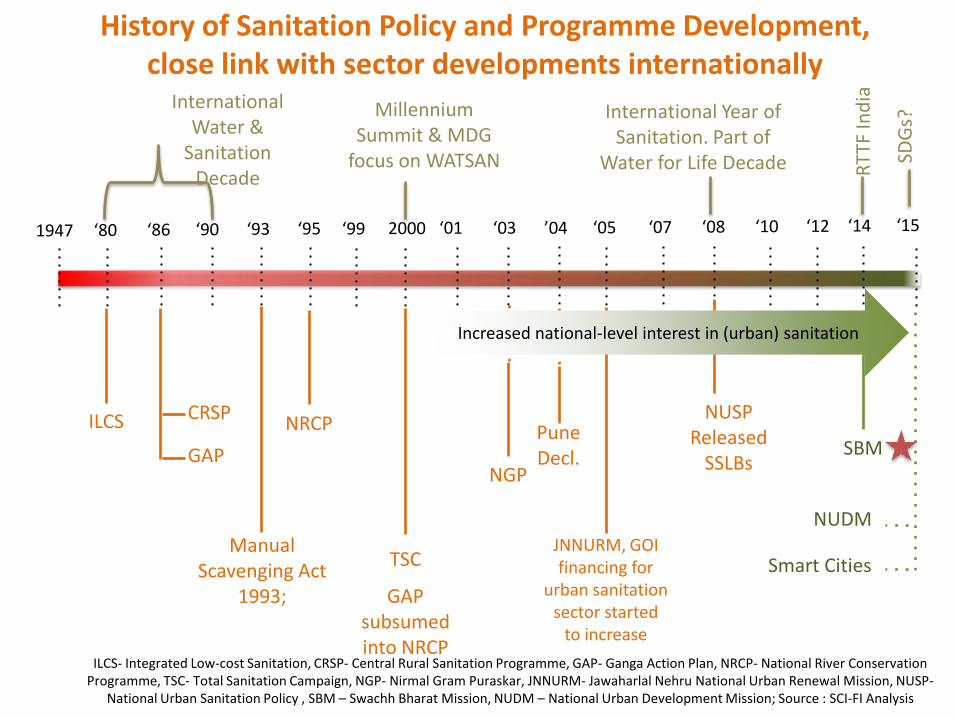
History of Sanitation Policy and Programme Development, close link with sector developments internationally
1947 ‘80 ‘86 ‘90 ‘93 ‘95 ‘99 2000 ‘01 ‘03 ’04 ‘05 ‘07 ‘08 ‘10 ‘12 ‘14 ‘15
ILCS- Integrated Low-cost Sanitation, CRSP- Central Rural Sanitation Programme, GAP- Ganga Action Plan, NRCP- National River Conservation Programme, TSC- Total Sanitation Campaign, NGP- Nirmal Gram Puraskar, JNNURM- Jawaharlal Nehru National Urban Renewal Mission, NUSP-
National Urban Sanitation Policy , SBM – Swachh Bharat Mission, NUDM – National Urban Development Mission; Source : SCI-FI Analysis
International Water &
Sanitation Decade
Millennium Summit & MDG
focus on WATSAN
International Year of Sanitation. Part of
Water for Life Decade SDG
s?
ILCS CRSP
GAP
Manual Scavenging Act
1993;
NRCP
GAP subsumed into NRCP
NGP
Pune Decl.
JNNURM, GOI financing for
urban sanitation sector started
to increase
NUSP Released
SSLBs SBM
NUDM
Smart Cities TSC
Increased national-level interest in (urban) sanitation
RT
TF In
dia
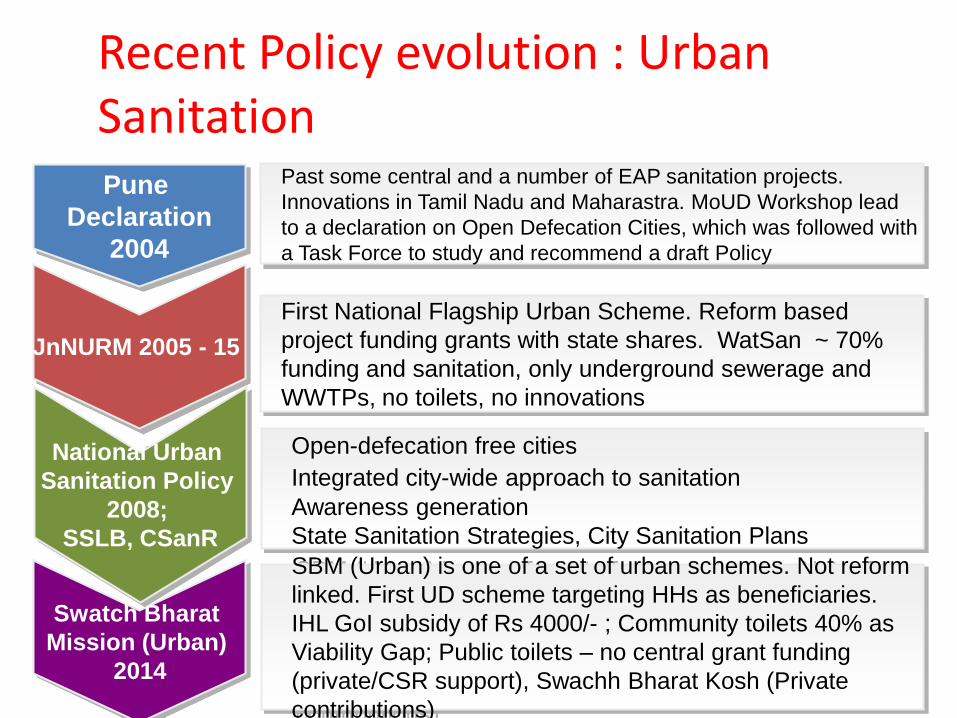
JnNURM 2005 - 15
Pune
Declaration
2004
Swatch Bharat
Mission (Urban)
2014
Past some central and a number of EAP sanitation projects.
Innovations in Tamil Nadu and Maharastra. MoUD Workshop lead
to a declaration on Open Defecation Cities, which was followed with
a Task Force to study and recommend a draft Policy
First National Flagship Urban Scheme. Reform based
project funding grants with state shares. WatSan ~ 70%
funding and sanitation, only underground sewerage and
WWTPs, no toilets, no innovations
Open-defecation free cities
Integrated city-wide approach to sanitation Awareness generation
State Sanitation Strategies, City Sanitation Plans
SBM (Urban) is one of a set of urban schemes. Not reform
linked. First UD scheme targeting HHs as beneficiaries.
IHL GoI subsidy of Rs 4000/- ; Community toilets 40% as
Viability Gap; Public toilets – no central grant funding
(private/CSR support), Swachh Bharat Kosh (Private
contributions)
National Urban
Sanitation Policy
2008;
SSLB, CSanR
Recent Policy evolution : Urban Sanitation
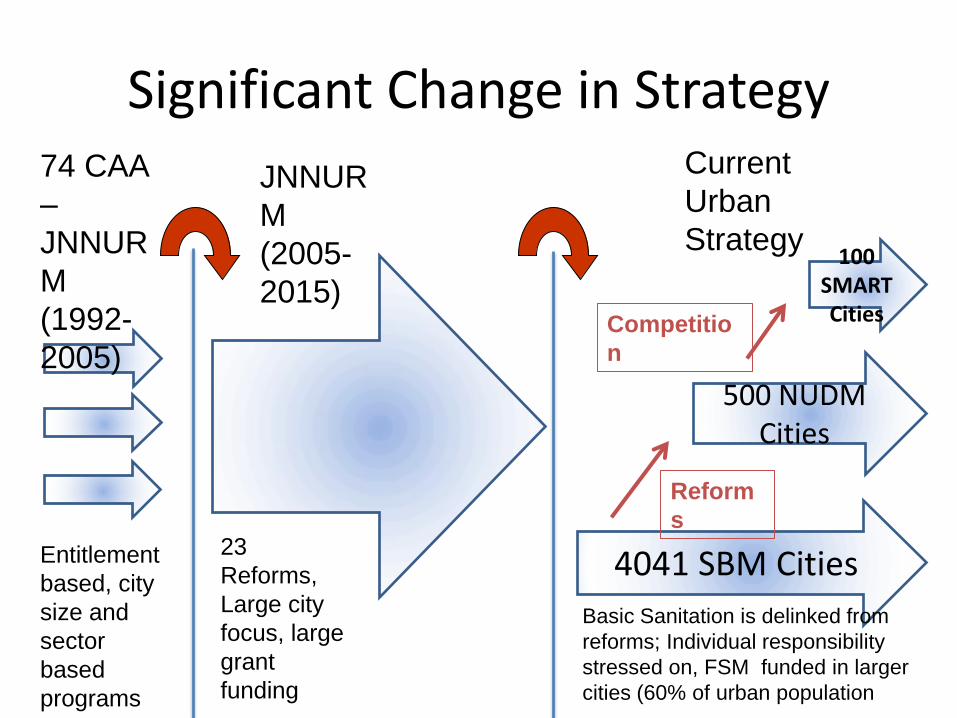
Significant Change in Strategy
4041 SBM Cities
500 NUDM Cities
100 SMART Cities
JNNUR
M
(2005-
2015)
Current
Urban
Strategy
74 CAA
–
JNNUR
M
(1992-
2005)
Reform
s
Competitio
n
Entitlement
based, city
size and
sector
based
programs
23
Reforms,
Large city
focus, large
grant
funding
Basic Sanitation is delinked from
reforms; Individual responsibility
stressed on, FSM funded in larger
cities (60% of urban population
Recognition for OSS vis a vis Sewerage system
From Toilet Provision to City-wide
Sanitation

Swachh Bharat Mission
(Clean India Mission)
Sanitation is more important than Independence
+ 30 billion USD programme
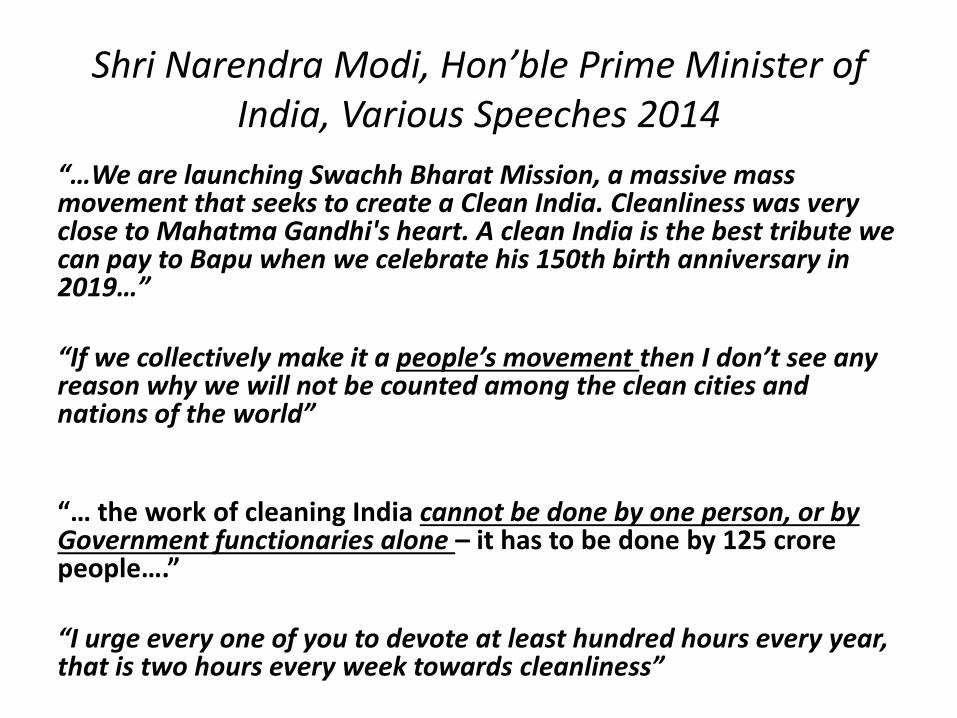
Shri Narendra Modi, Hon’ble Prime Minister of India, Various Speeches 2014
“…We are launching Swachh Bharat Mission, a massive mass movement that seeks to create a Clean India. Cleanliness was very close to Mahatma Gandhi's heart. A clean India is the best tribute we can pay to Bapu when we celebrate his 150th birth anniversary in 2019…” “If we collectively make it a people’s movement then I don’t see any reason why we will not be counted among the clean cities and nations of the world” “… the work of cleaning India cannot be done by one person, or by Government functionaries alone – it has to be done by 125 crore people….” “I urge every one of you to devote at least hundred hours every year, that is two hours every week towards cleanliness”
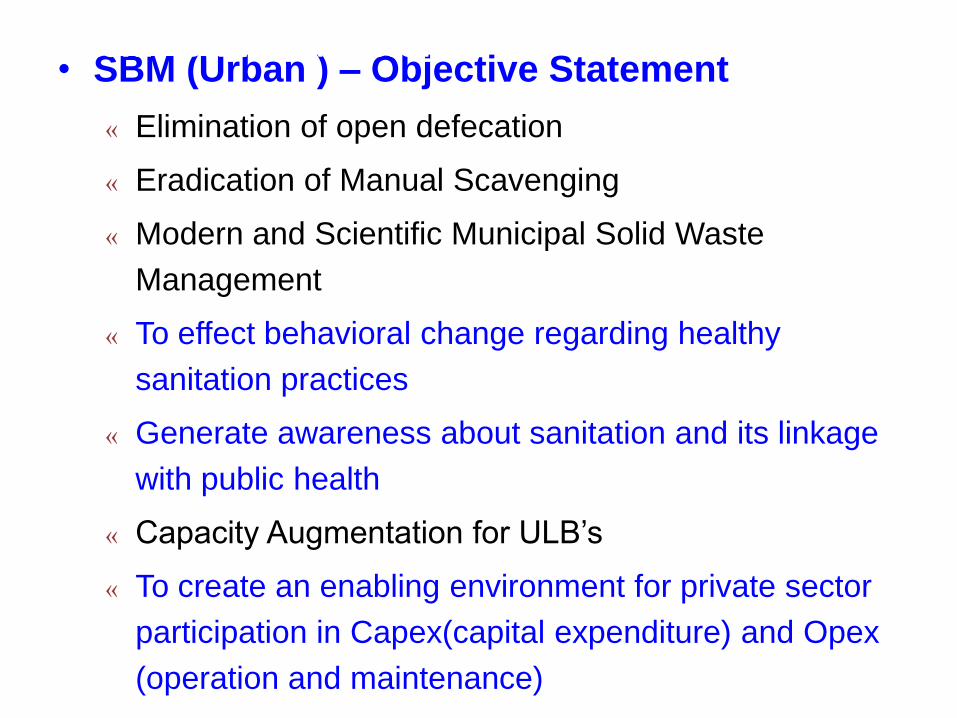
• SBM (Urban ) – Objective Statement
« Elimination of open defecation
« Eradication of Manual Scavenging
« Modern and Scientific Municipal Solid Waste
Management
« To effect behavioral change regarding healthy
sanitation practices
« Generate awareness about sanitation and its linkage
with public health
« Capacity Augmentation for ULB’s
« To create an enabling environment for private sector
participation in Capex(capital expenditure) and Opex
(operation and maintenance)
Swachh Bharat Mission
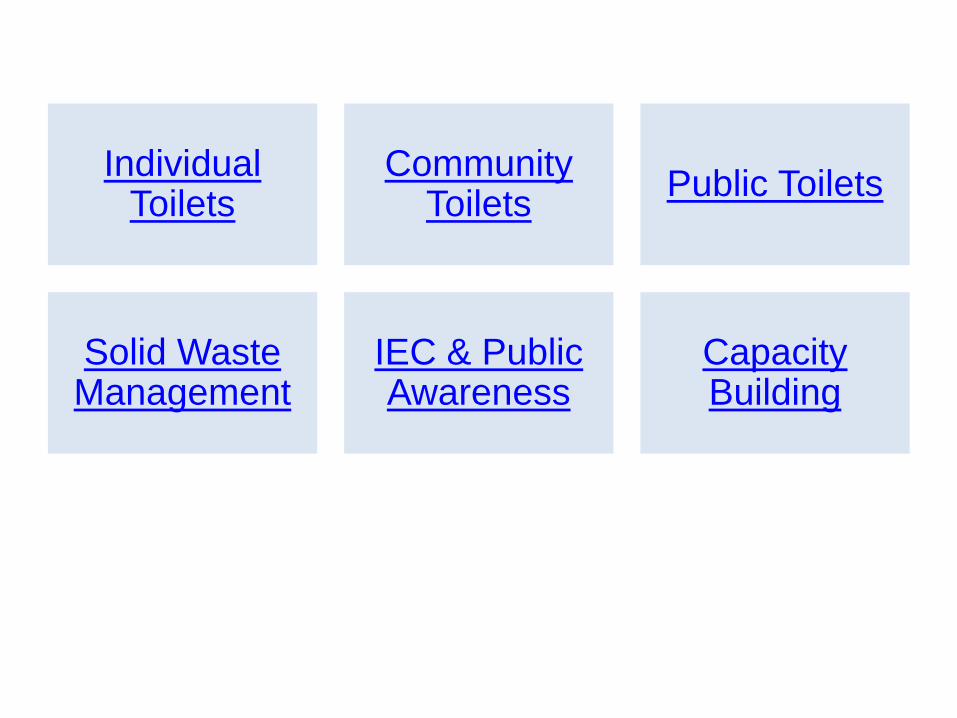
Individual Toilets
Community Toilets
Public Toilets
Solid Waste Management
IEC & Public Awareness
Capacity Building
Mission Components
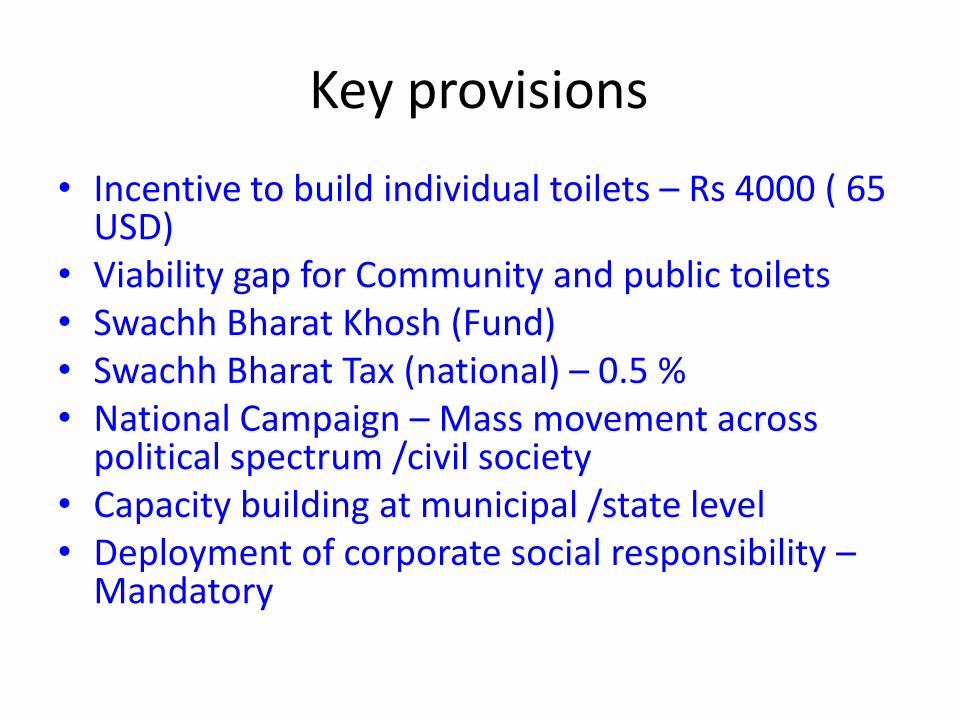
Key provisions
• Incentive to build individual toilets – Rs 4000 ( 65 USD)
• Viability gap for Community and public toilets • Swachh Bharat Khosh (Fund) • Swachh Bharat Tax (national) – 0.5 % • National Campaign – Mass movement across
political spectrum /civil society • Capacity building at municipal /state level • Deployment of corporate social responsibility –
Mandatory
SWACHH VIDHYALA (CLEAN SCHOOLS)
Program is aligned with national
missions
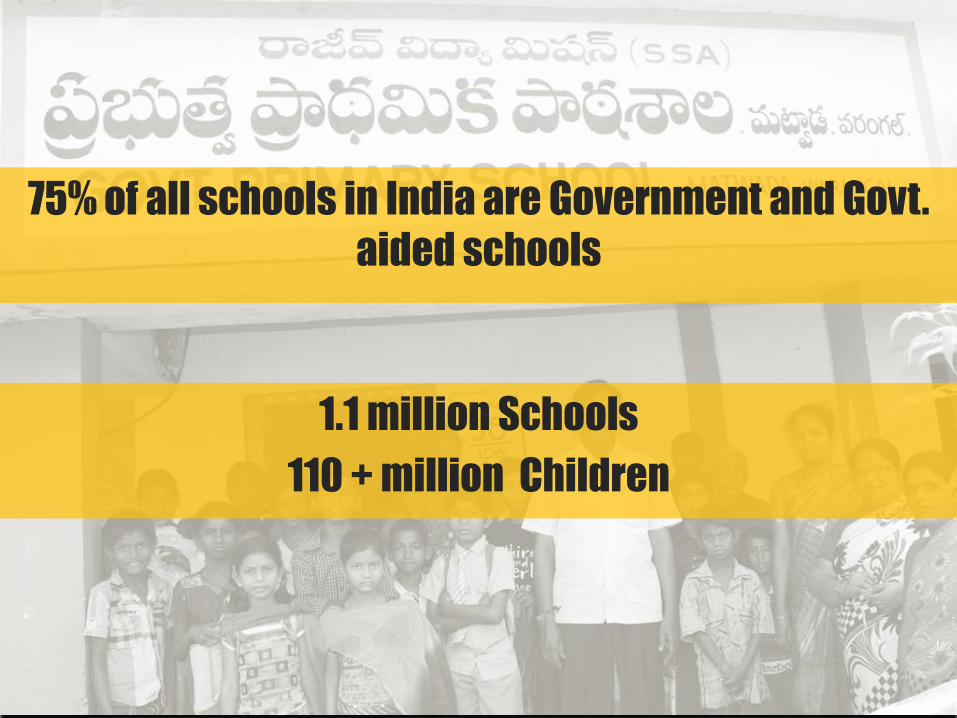
75% of all schools in India are Government and Govt.
aided schools
1.1 million Schools
110 + million Children
1000 children die everyday in
India because of diarrheal
diseases
Poor Quality Water and
Sanitation and Hygiene
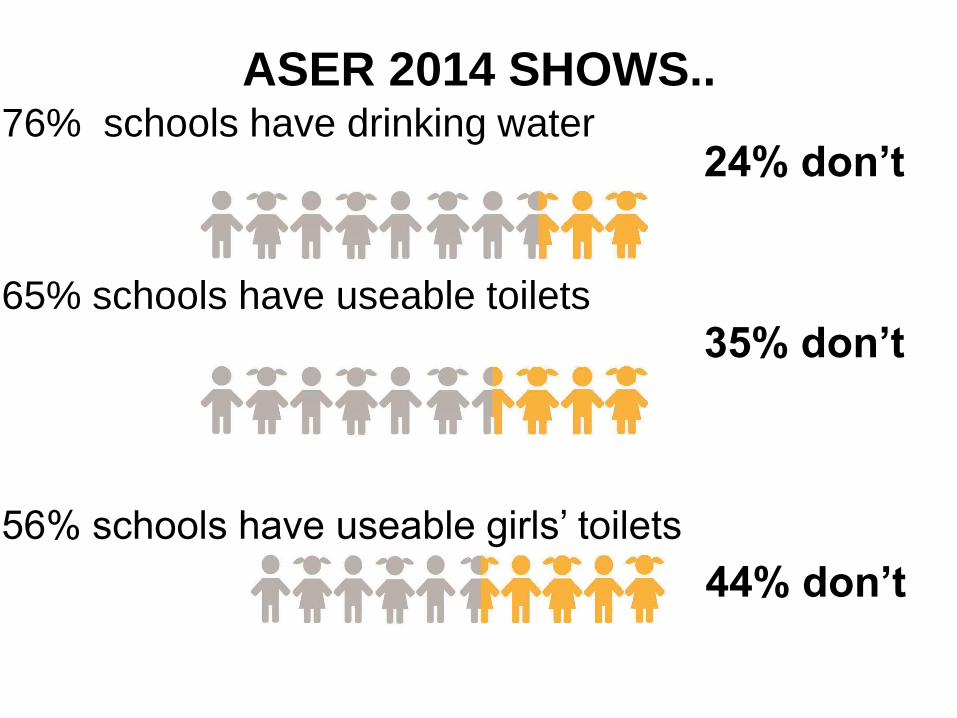
ASER 2014 SHOWS.. 76% schools have drinking water
65% schools have useable toilets
56% schools have useable girls’ toilets
24% don’t
35% don’t
44% don’t
55% of schools do not have
hand washing facility near
toilet/urinal
Source: DISE 2013-14

WASH IN SCHOOLS
Progress
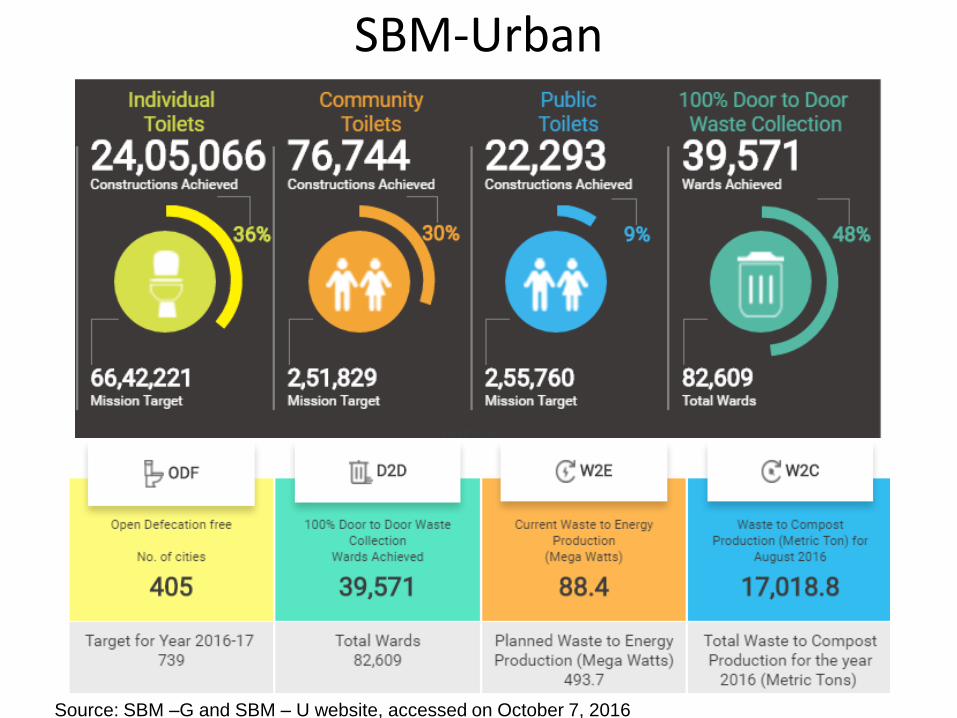
SBM-Urban
Source: SBM –G and SBM – U website, accessed on October 7, 2016
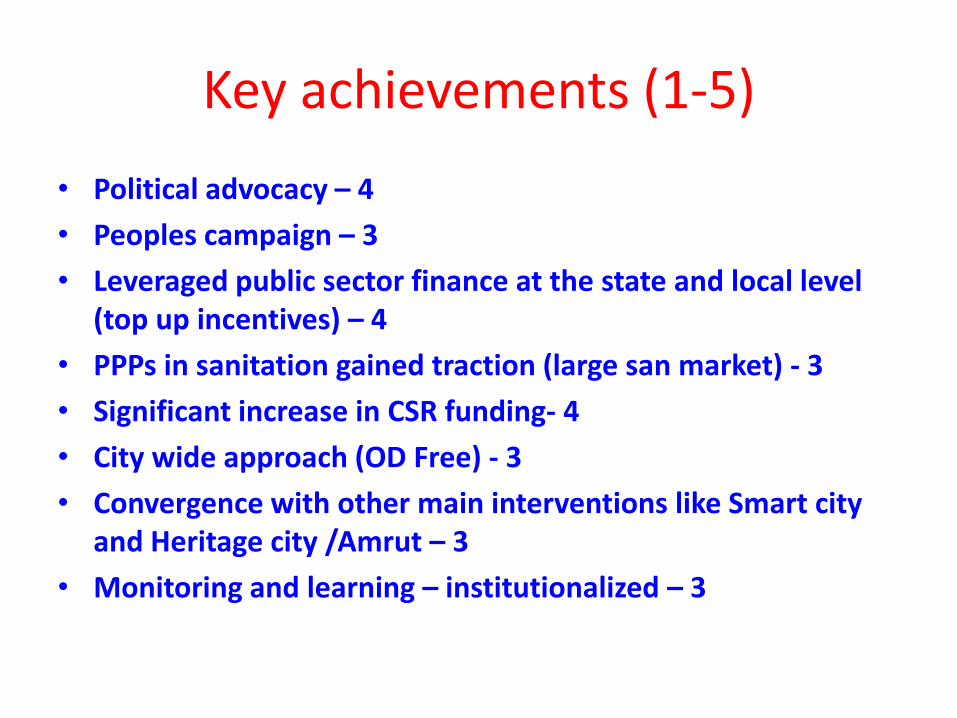
Key achievements (1-5)
• Political advocacy – 4
• Peoples campaign – 3
• Leveraged public sector finance at the state and local level (top up incentives) – 4
• PPPs in sanitation gained traction (large san market) - 3
• Significant increase in CSR funding- 4
• City wide approach (OD Free) - 3
• Convergence with other main interventions like Smart city and Heritage city /Amrut – 3
• Monitoring and learning – institutionalized – 3
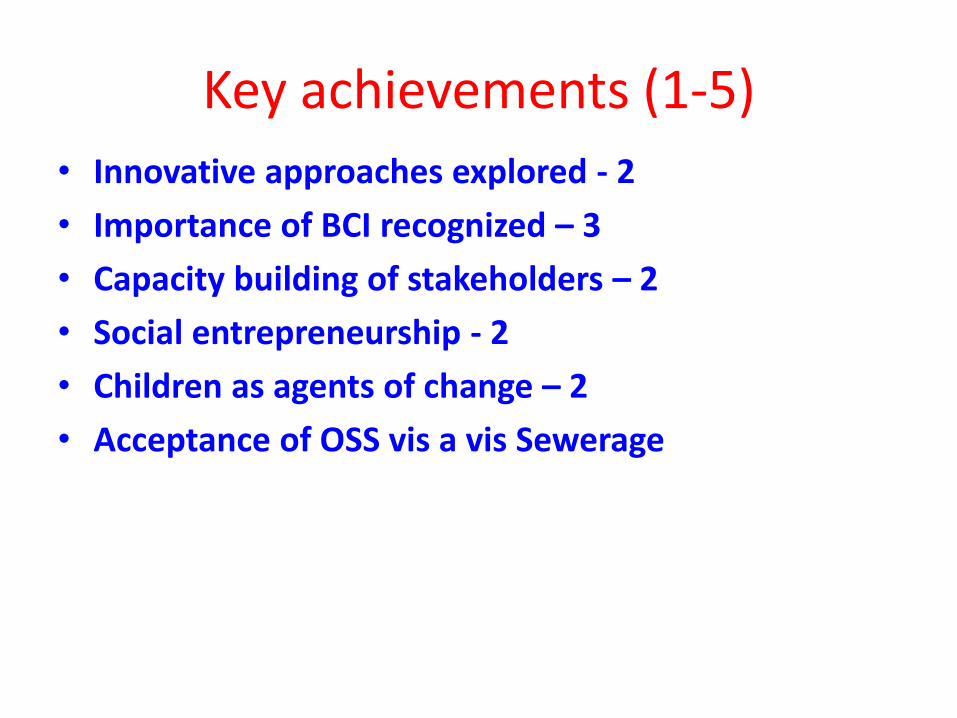
Key achievements (1-5)
• Innovative approaches explored - 2
• Importance of BCI recognized – 3
• Capacity building of stakeholders – 2
• Social entrepreneurship - 2
• Children as agents of change – 2
• Acceptance of OSS vis a vis Sewerage
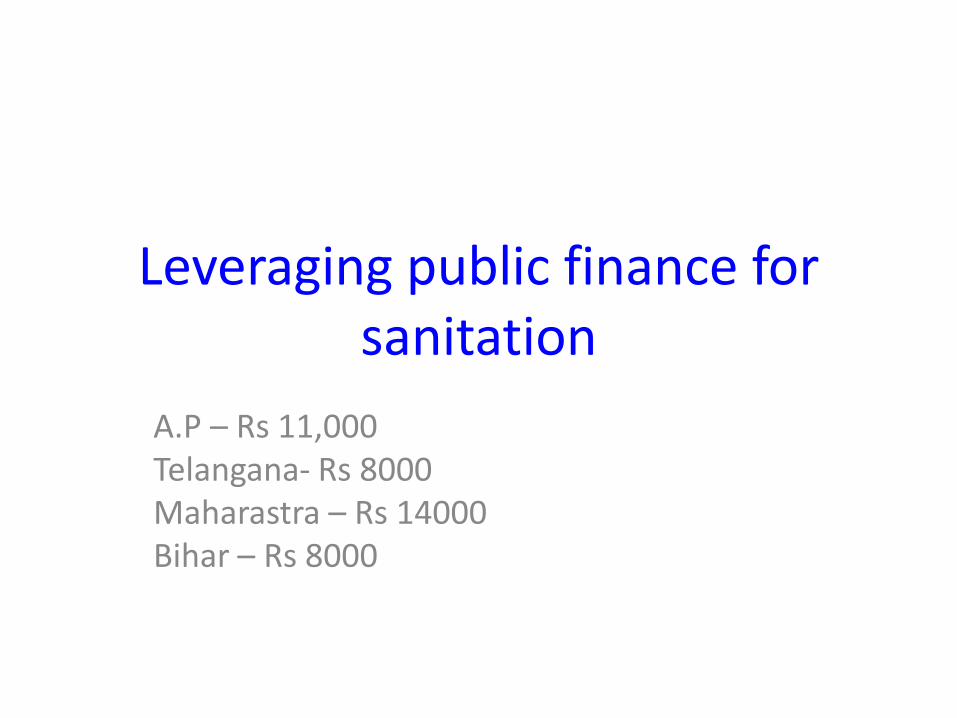
Leveraging public finance for sanitation
A.P – Rs 11,000 Telangana- Rs 8000 Maharastra – Rs 14000 Bihar – Rs 8000
Emergence of social enterprise models
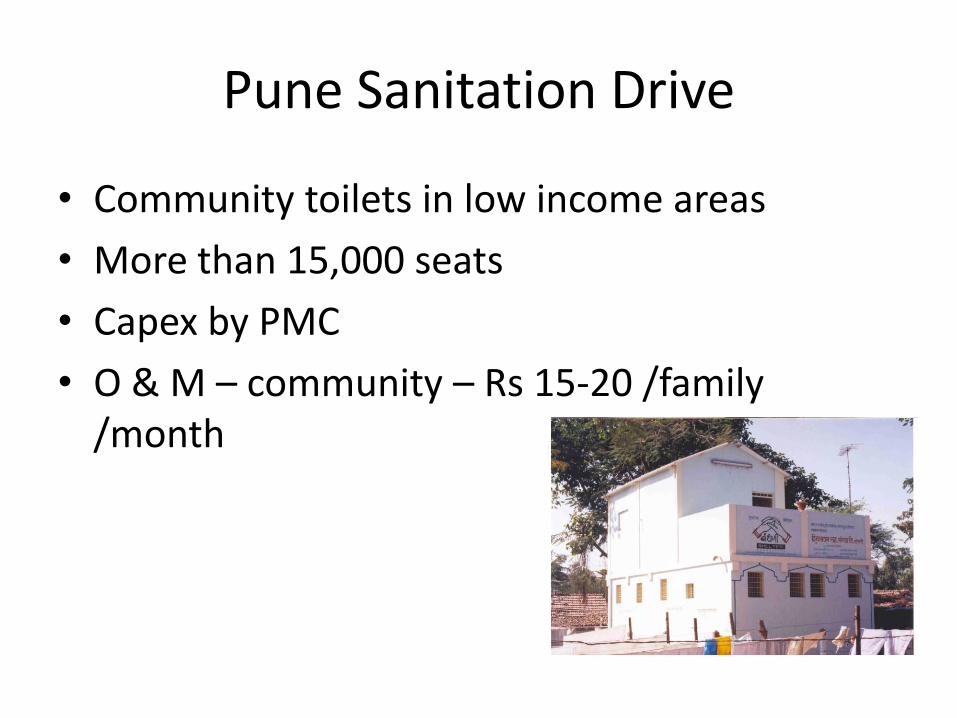
Pune Sanitation Drive
• Community toilets in low income areas
• More than 15,000 seats
• Capex by PMC
• O & M – community – Rs 15-20 /family /month
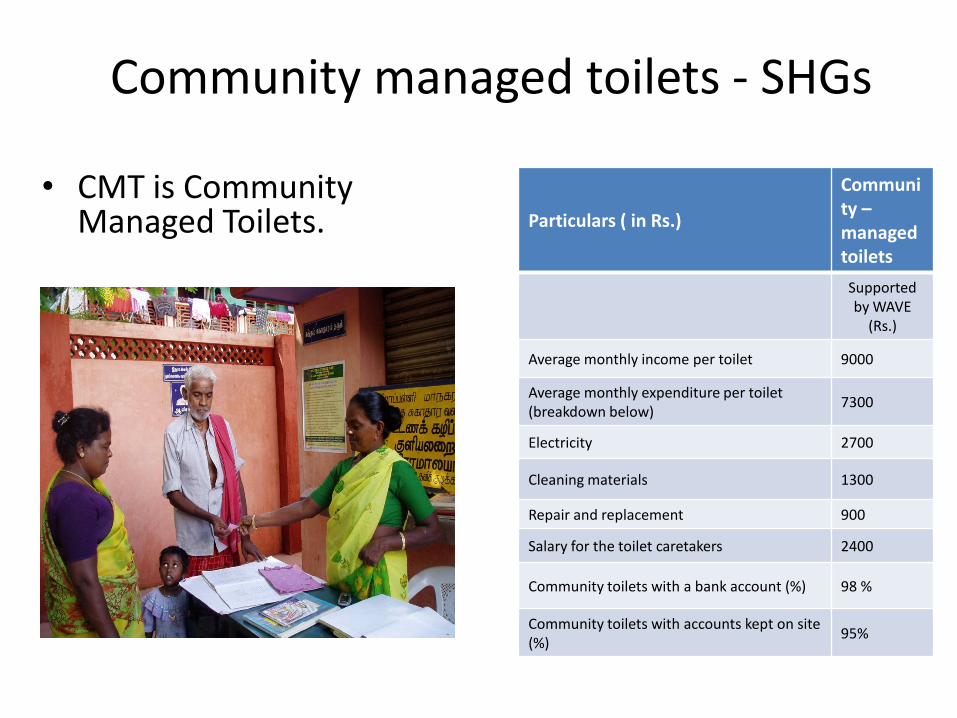
Community managed toilets - SHGs
• CMT is Community Managed Toilets. Particulars ( in Rs.)
Community – managed toilets
Supported by WAVE
(Rs.)
Average monthly income per toilet 9000
Average monthly expenditure per toilet (breakdown below)
7300
Electricity 2700
Cleaning materials 1300
Repair and replacement 900
Salary for the toilet caretakers 2400
Community toilets with a bank account (%) 98 %
Community toilets with accounts kept on site (%)
95%
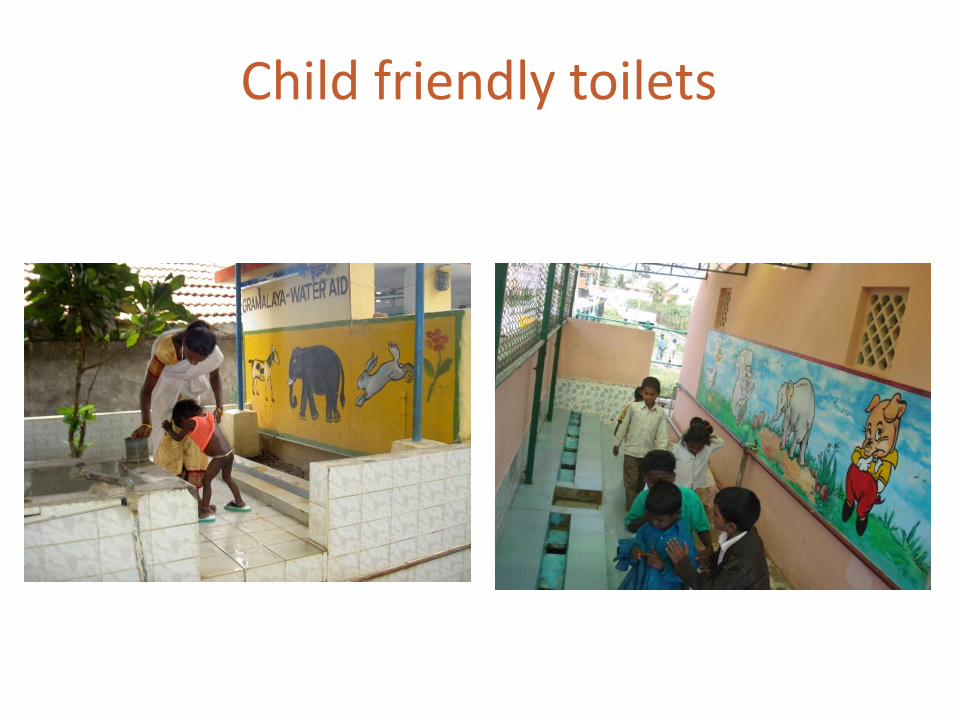
Child friendly toilets
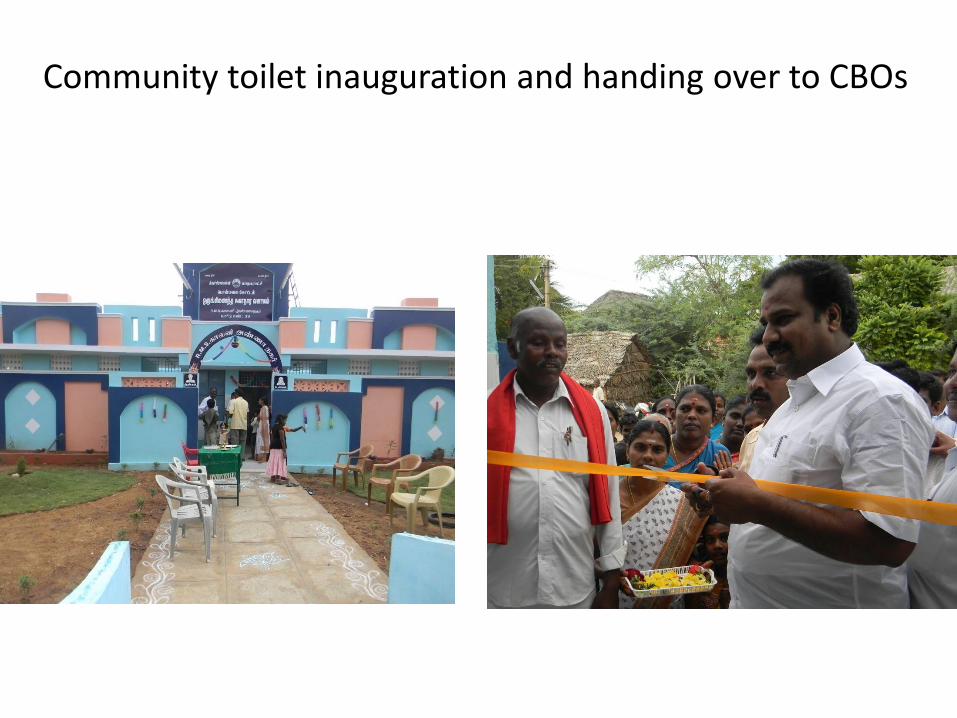
Community toilet inauguration and handing over to CBOs
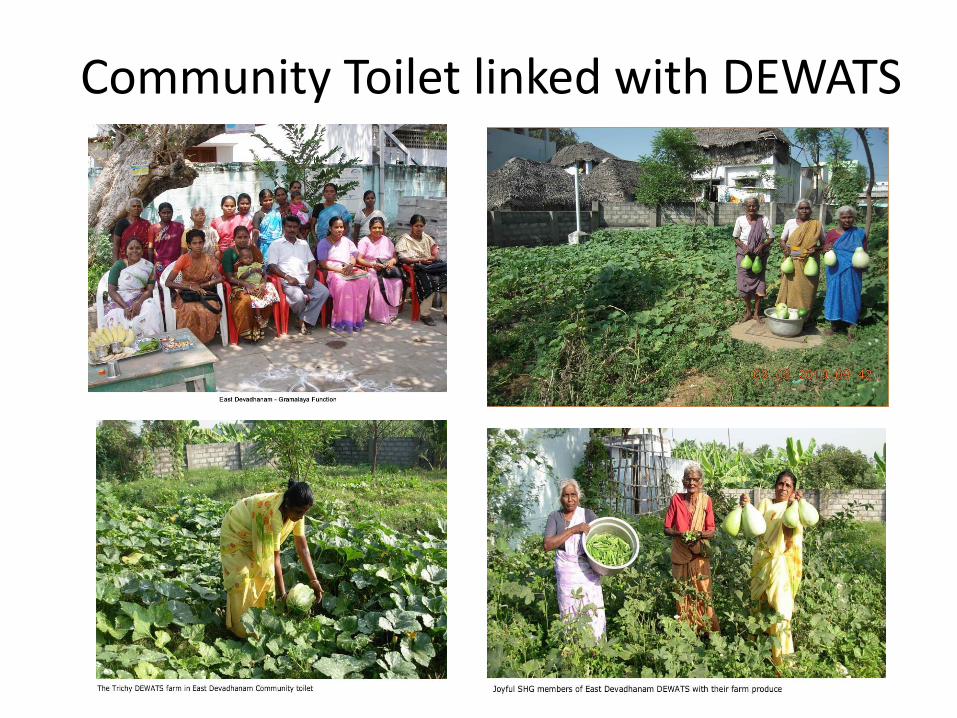
Community Toilet linked with DEWATS

Challenges and opportunities 1. Target driven – mission mode approach with limited focus on
sustainability
2. Potential Slippage – technical, water security, bad masonry
3. Conversion of insanitary toilets
4. Maintenance of created assets
5. Going beyond toilets – focusing on sanitation/health outcomes
6. FS/Septage disposal – Institutionalized open defecation
7. Capacity gaps at every level
8. Institutional accountability at the municipal level
9. Public finance reforms for sustenance
10. Sustaining BCI
11. Sustaining political capital for sanitation
12. Lack of robust real time monitoring

Slippage
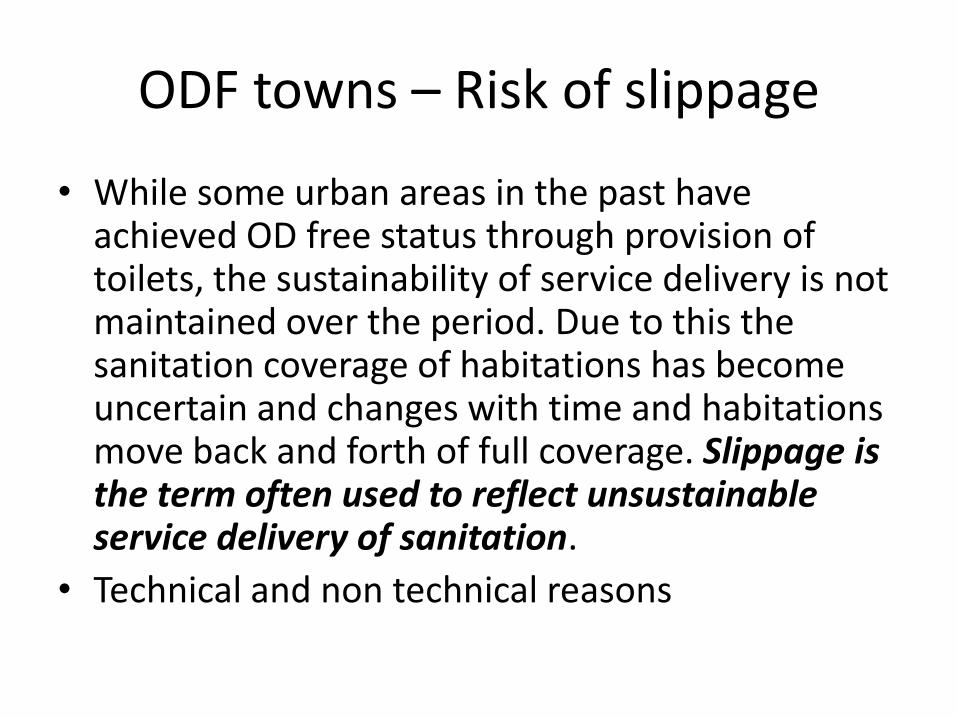
ODF towns – Risk of slippage
• While some urban areas in the past have achieved OD free status through provision of toilets, the sustainability of service delivery is not maintained over the period. Due to this the sanitation coverage of habitations has become uncertain and changes with time and habitations move back and forth of full coverage. Slippage is the term often used to reflect unsustainable service delivery of sanitation.
• Technical and non technical reasons
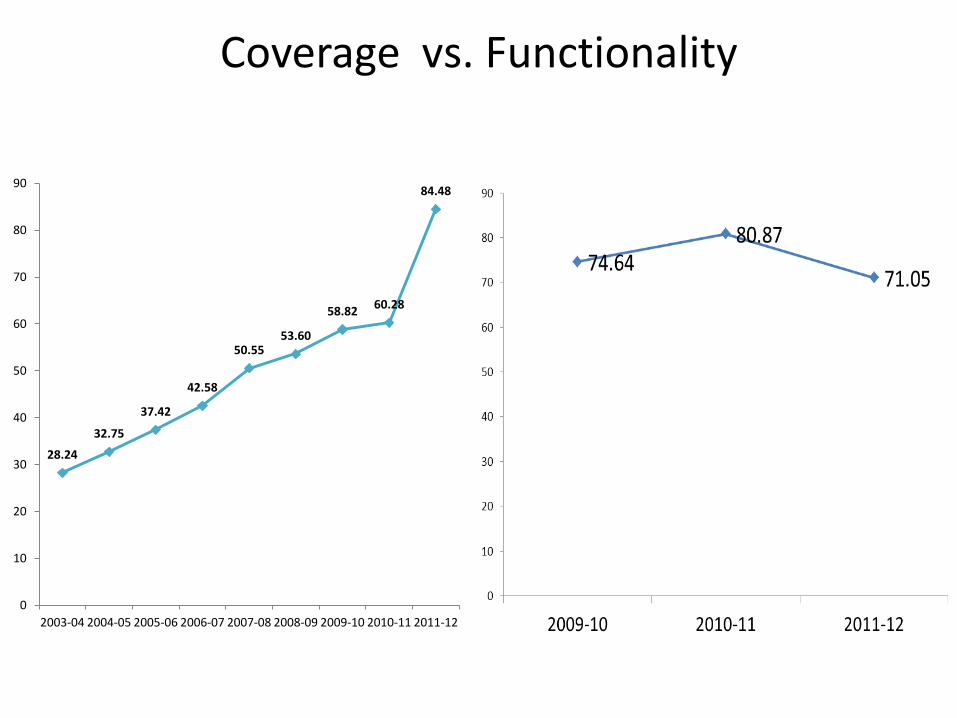
Coverage vs. Functionality
28.24
32.75
37.42
42.58
50.55 53.60
58.82 60.28
84.48
0
10
20
30
40
50
60
70
80
90
2003-04 2004-05 2005-06 2006-07 2007-08 2008-09 2009-10 2010-11 2011-12
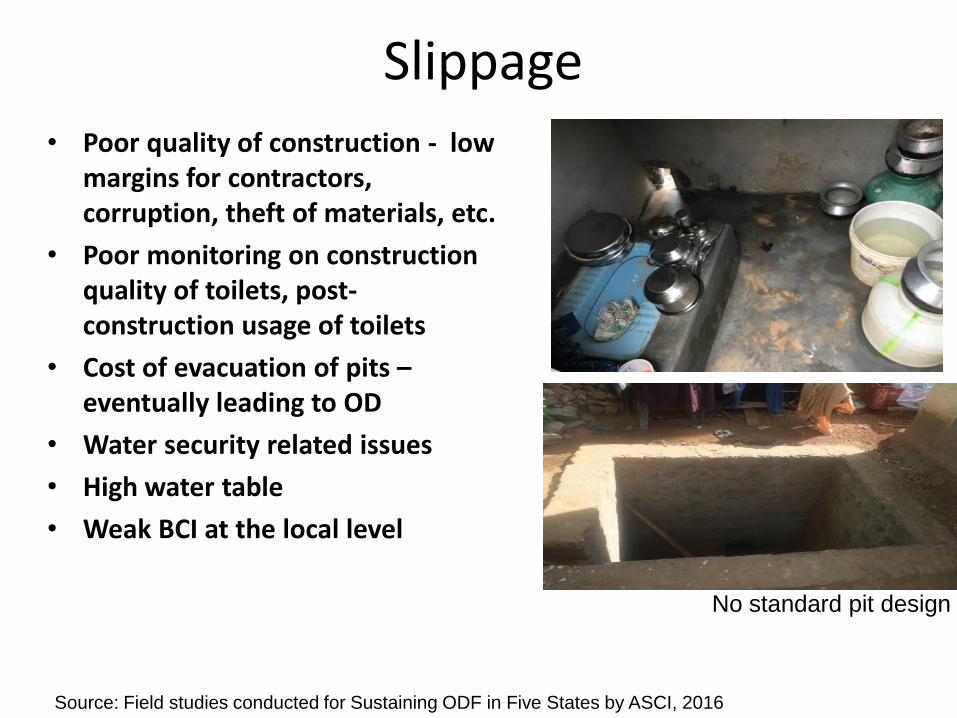
Slippage • Poor quality of construction - low
margins for contractors, corruption, theft of materials, etc.
• Poor monitoring on construction quality of toilets, post-construction usage of toilets
• Cost of evacuation of pits – eventually leading to OD
• Water security related issues
• High water table
• Weak BCI at the local level
No standard pit design
Source: Field studies conducted for Sustaining ODF in Five States by ASCI, 2016
Lack of child friendly designs
Weak Operation and Maintenance
Sanitation is beyond toilets
Experience shows that provision of toilets and toilet
technology alone cannot address sanitation problems
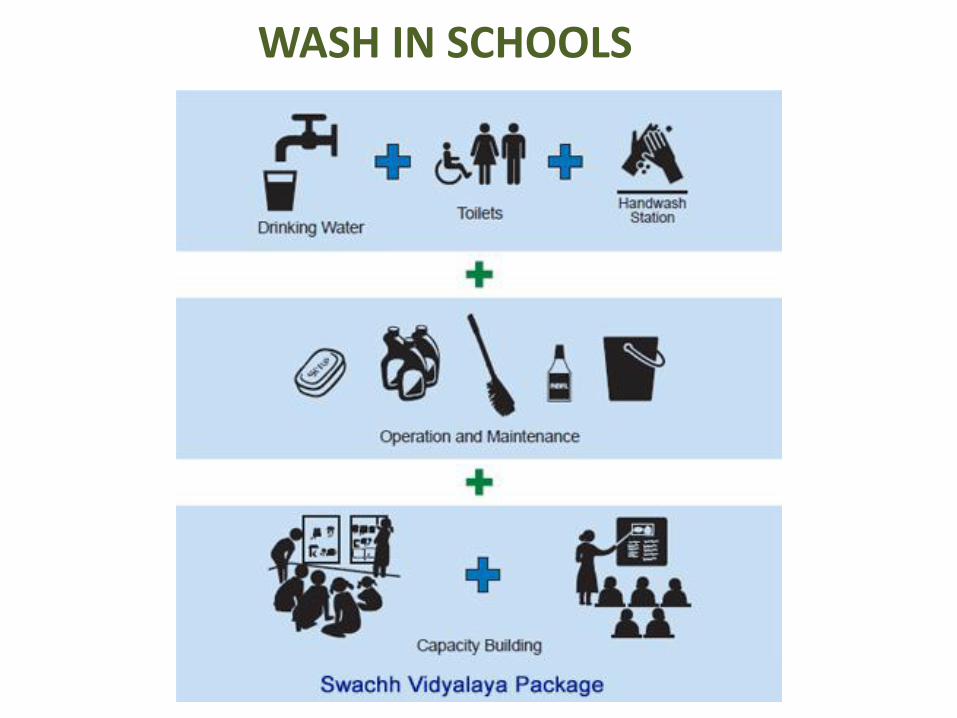
WASH IN SCHOOLS
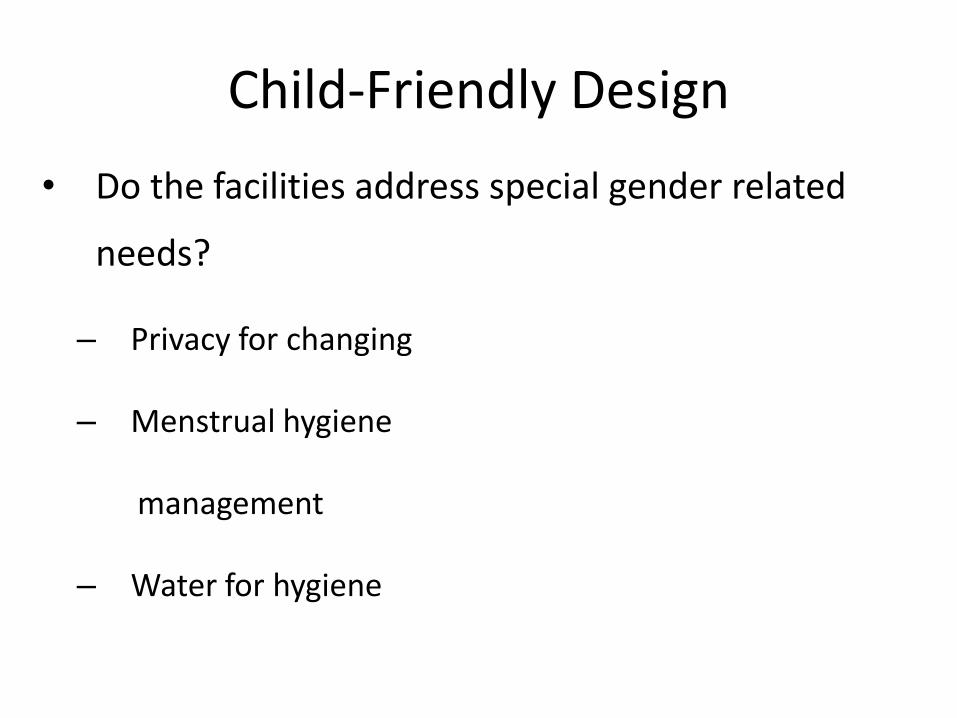
Child-Friendly Design
• Do the facilities address special gender related
needs?
– Privacy for changing
– Menstrual hygiene
management
– Water for hygiene
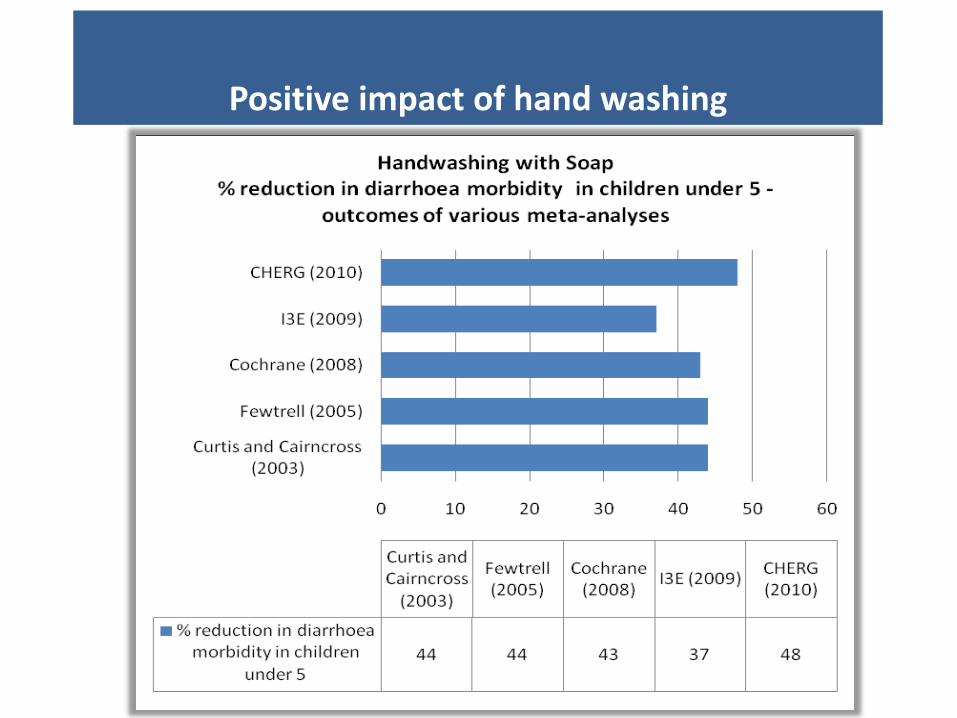
Positive impact of hand washing
Institutionalizing open defecation
Addressing environmental sanitation issues through effective FSM
ODF+
62
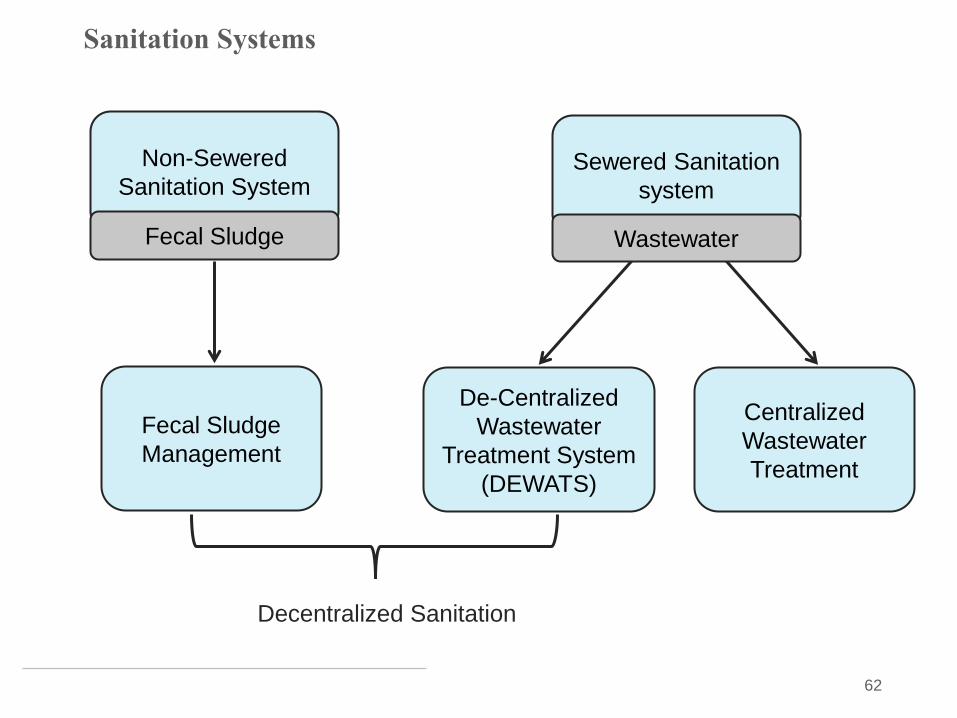
Sanitation Systems
Non-Sewered
Sanitation System Sewered Sanitation
system
Centralized
Wastewater
Treatment
De-Centralized
Wastewater
Treatment System
(DEWATS)
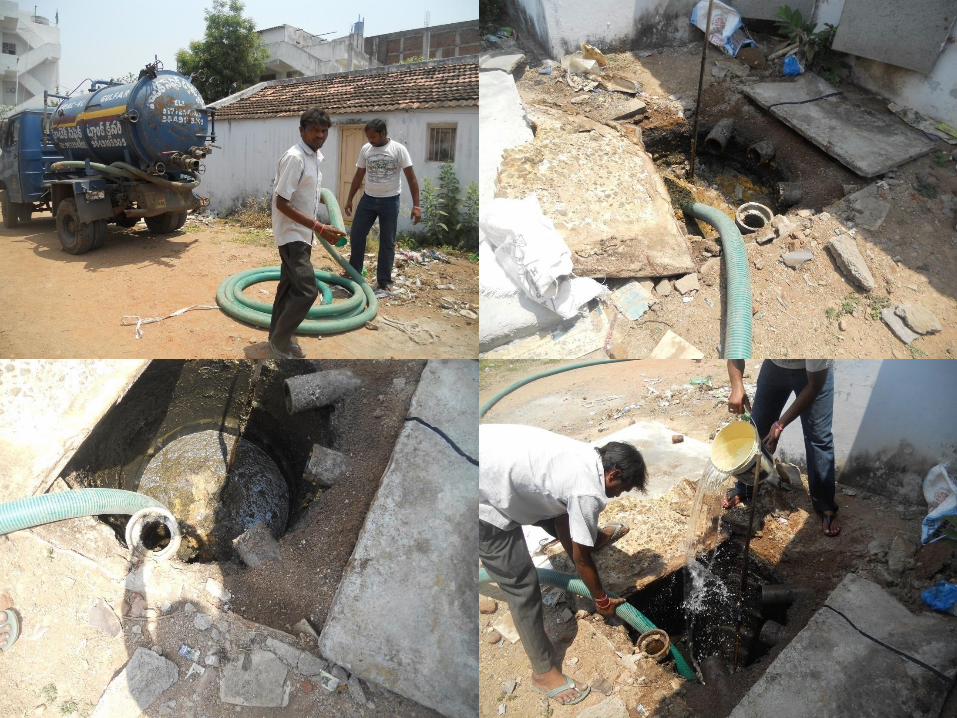
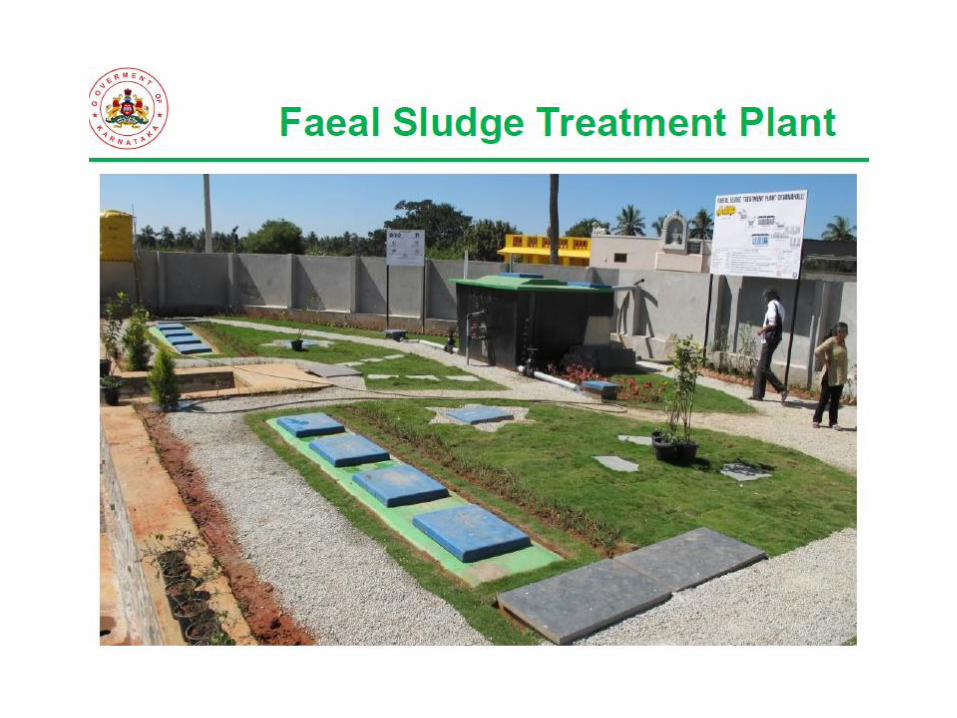
Fecal Sludge
Management
Decentralized Sanitation
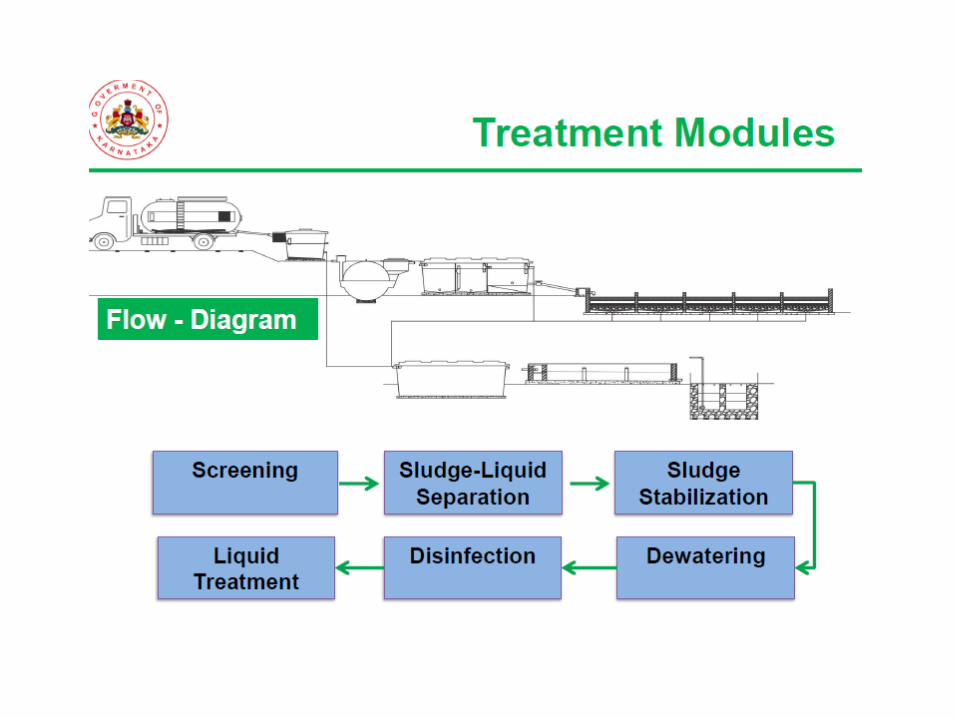
Fecal Sludge Wastewater
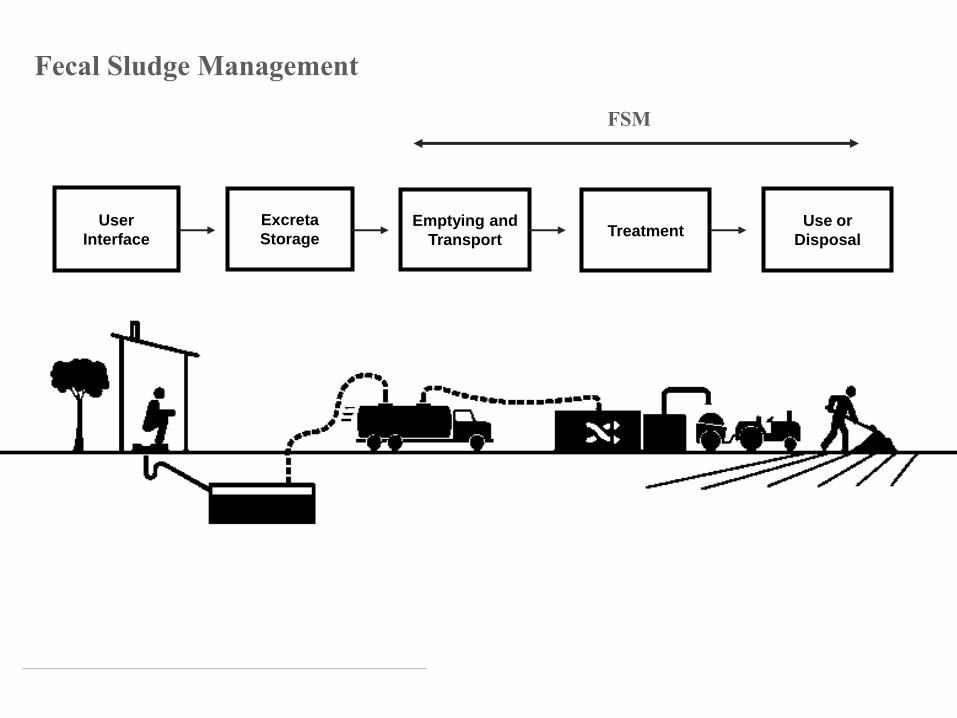
Fecal Sludge Management
User
Interface
Excreta
Storage Emptying and
Transport
Use or
Disposal
FSM
Treatment
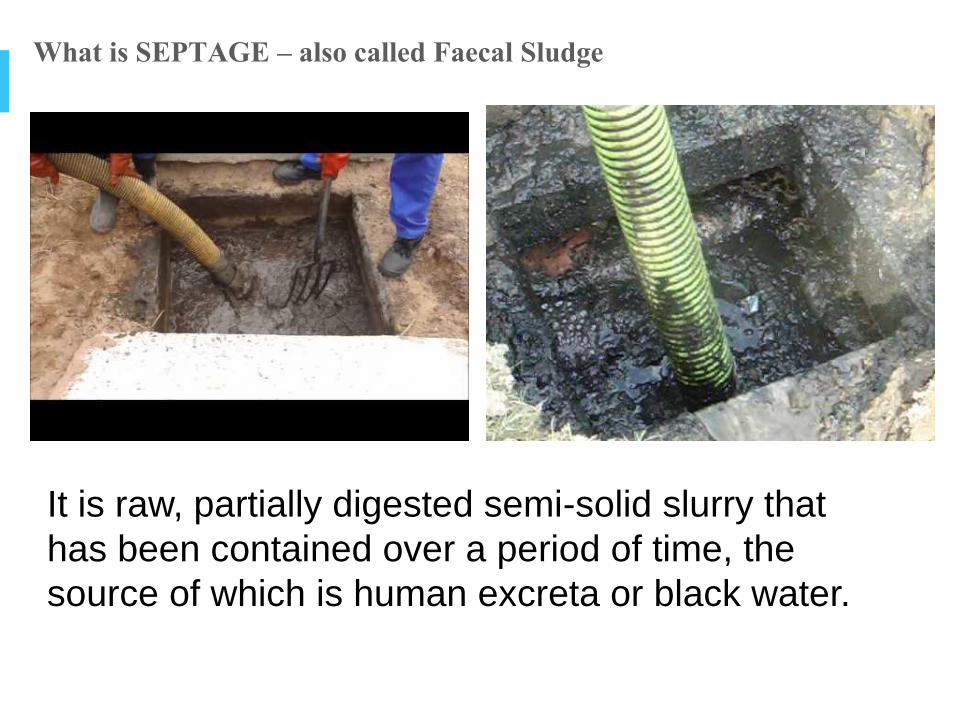
What is SEPTAGE – also called Faecal Sludge
It is raw, partially digested semi-solid slurry that
has been contained over a period of time, the
source of which is human excreta or black water.
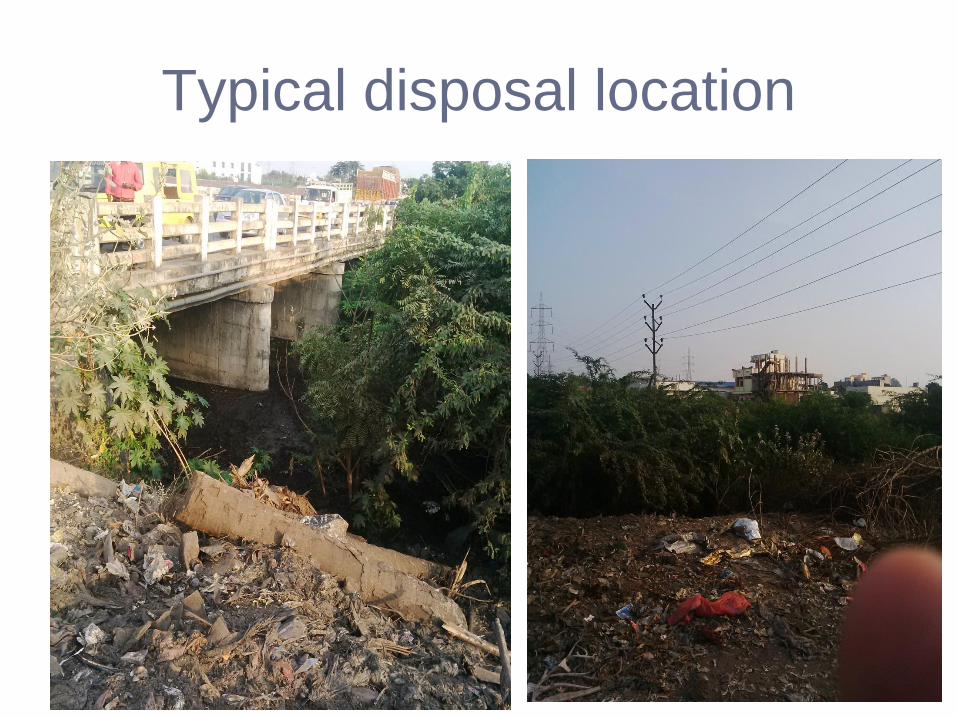
Typical disposal location
68
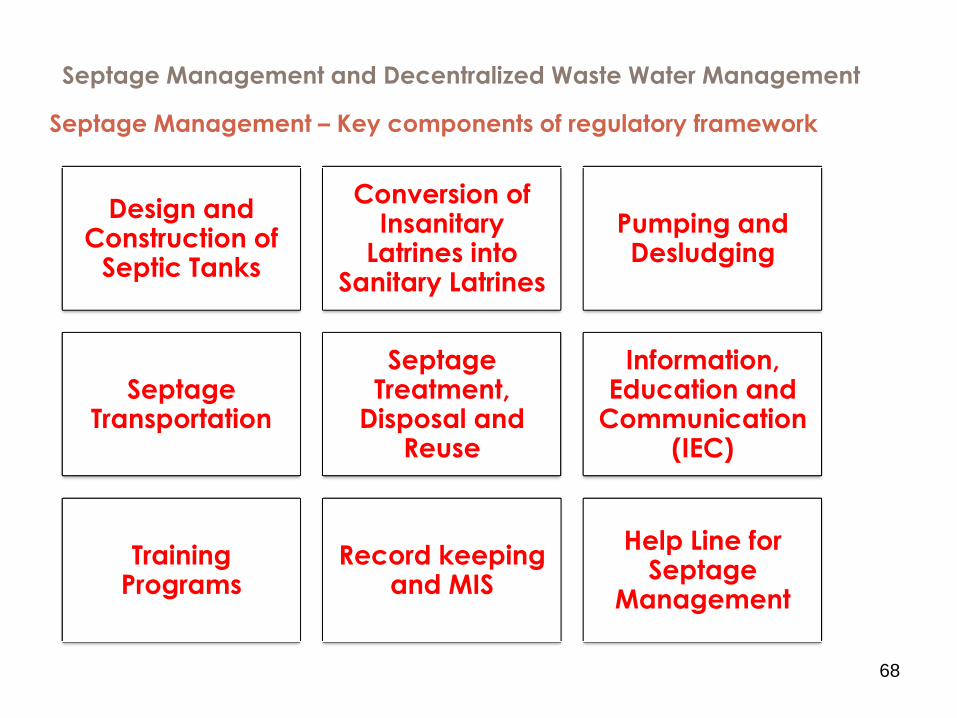
Septage Management and Decentralized Waste Water Management
Design and Construction of
Septic Tanks
Conversion of Insanitary
Latrines into Sanitary Latrines
Pumping and Desludging
Septage Transportation
Septage Treatment,
Disposal and Reuse
Information, Education and
Communication (IEC)
Training Programs
Record keeping and MIS
Help Line for Septage
Management
Septage Management – Key components of regulatory framework
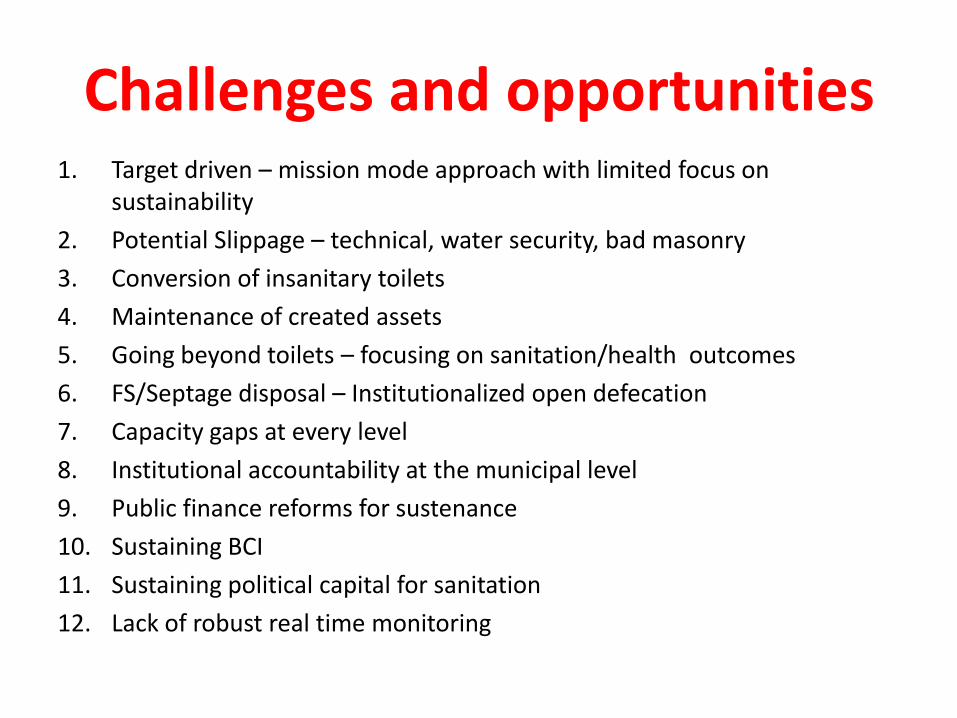
Challenges and opportunities 1. Target driven – mission mode approach with limited focus on
sustainability
2. Potential Slippage – technical, water security, bad masonry
3. Conversion of insanitary toilets
4. Maintenance of created assets
5. Going beyond toilets – focusing on sanitation/health outcomes
6. FS/Septage disposal – Institutionalized open defecation
7. Capacity gaps at every level
8. Institutional accountability at the municipal level
9. Public finance reforms for sustenance
10. Sustaining BCI
11. Sustaining political capital for sanitation
12. Lack of robust real time monitoring
Effective BCI
Accelerating Urban Sanitation
What next ?
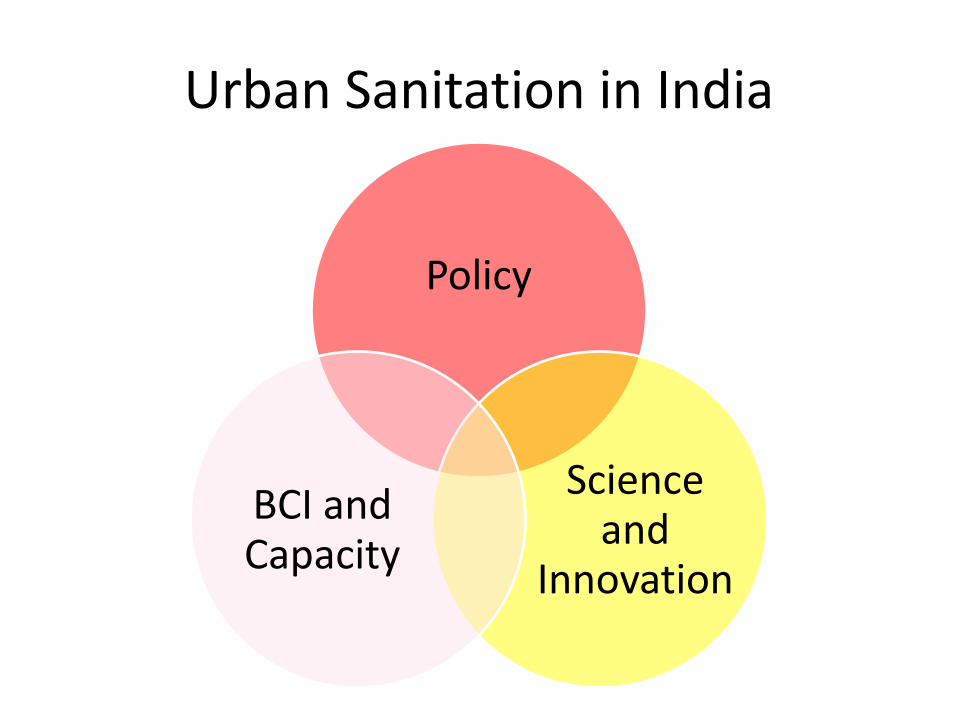
Urban Sanitation in India
Policy
Science and
Innovation
BCI and Capacity
Innovations in Sanitation
Provision
Late mover advantage Technology is rapidly evolving
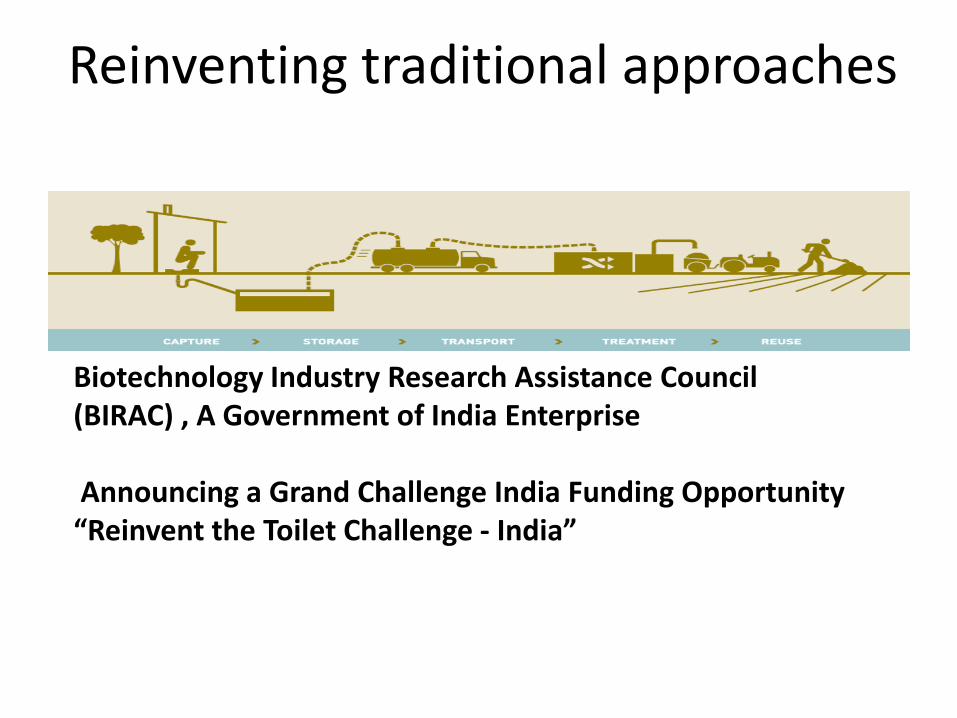
Reinventing traditional approaches
Biotechnology Industry Research Assistance Council (BIRAC) , A Government of India Enterprise Announcing a Grand Challenge India Funding Opportunity “Reinvent the Toilet Challenge - India”
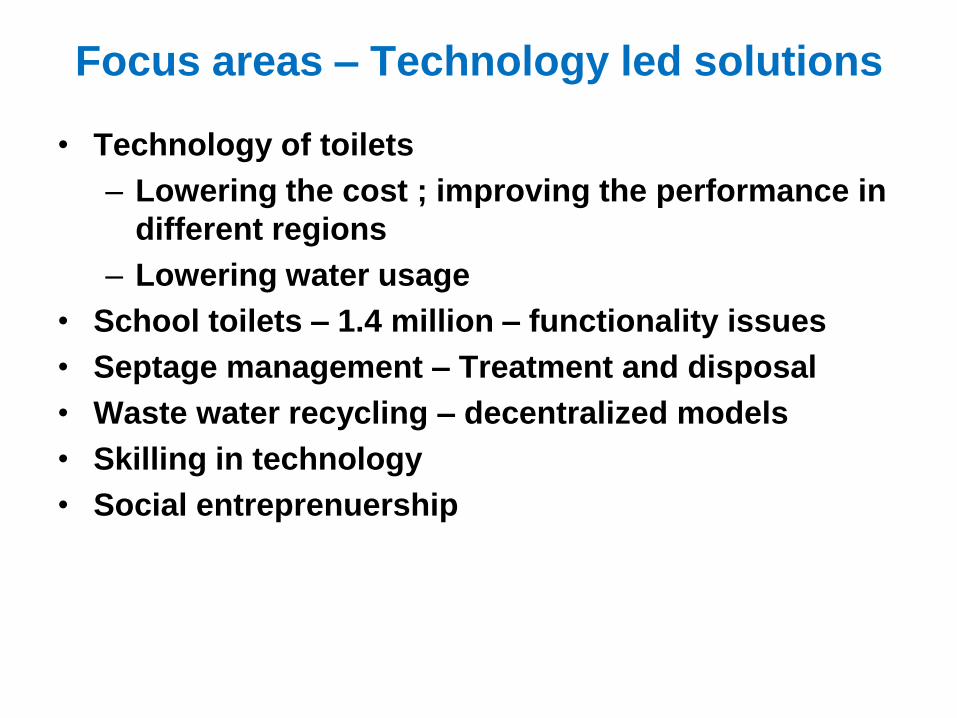
Focus areas – Technology led solutions
• Technology of toilets
– Lowering the cost ; improving the performance in
different regions
– Lowering water usage
• School toilets – 1.4 million – functionality issues
• Septage management – Treatment and disposal
• Waste water recycling – decentralized models
• Skilling in technology
• Social entreprenuership
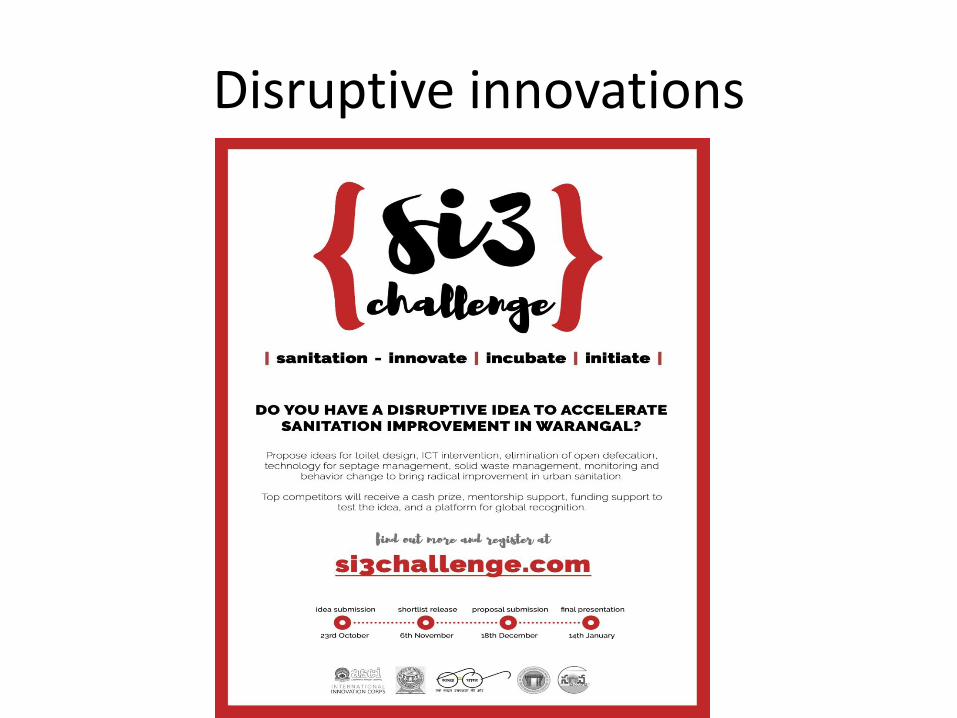
Disruptive innovations