Embed Size (px)
Citation preview
EPA-456/R-95-003
Survey of Control Technologies for Low Concentration Or-ganic Vapor Gas Streams
CONTROL TECHNOLOGY CENTER
Sponsored by
Information Transfer and Program Integration DivisionOffice of Air Quality Planning and Standards
U.S. Environmental Protection AgencyResearch Triangle Park, NC 27711
and
Air and Energy Engineering Research LaboratoryOffice of Research and Development
U.S. Environmental Protection AgencyResearch Triangle Park, NC 27711
May 1995
EPA-456/R-95-003
May 1995
Survey of Control Technologies for Low Concentration Or-ganic Vapor Gas Streams
Prepared by:
Robert A. ZerboniaJames J. Spivey
Sanjay K. AgarwalAshok S. Damle
Charles W. SanfordResearch Triangle Institute
Research Triangle Park, NC 27709
EPA Contract No. 68-D1-0118Work Assignment No. 114RTI Project No. 5846-114
Project Manager
Robert J. BlaszczakInformation Transfer and Program Integration Division
Office of Air Quality Planning and StandardsU.S. Environmental Protection Agency
Research Triangle Park, NC 27711
Prepared for
Control Technology CenterU.S. Envionrmental Protection Agency
Research Triangle Park, NC 27711
EPA REVIEW NOTICE
This report has been reviewed by the Control Technology Center (CTC) established by
the Office of Research and Development (ORD) and the Office of Air Quality Planning and
Standards (OAQPS) of the U.S. Environmental Protection Agency (EPA), and has been
approved for publication. Approval does not signify that the comments necessarily reflect
the view and policies of EPA, nor does mention of trade names, organization names, or
commercial products constitute endorsement or recommendation for use.
This document is available to the public through the National Technical Information
Service, Springfield, Virginia, 22161, (800) 553-6847.
PREFACE
The Control Technology Center was established by the U.S. Environmental Protection
Agency’s (EPA’s) Office of Research and Development (ORD) to provide technical assis-
tance to State and local air pollution agencies. Several levels of assistance can be provided
when appropriate. These include the following:
•CTC HOTLINE provides quick access to EPA expertise, information, and assistance on
matters relating to control technology (919/541-0800).
•Engineering Assistance Projects provide more in-depth assistance to State and local
agencies when needed to address a specific pollution problem or source.
•Technical Guidance Projects address problems or source categories of regional or national
interest by developing technical guidance documents, computer software, or presentation
of workshops on control technology issues.
•Federal Small Business Assistance Program (SBAP) coordinates efforts among EPA centers
participating in the Federal Small Business Assistance Program to assist State SBAPs.
•RACT/BACT/LAER Clearinghouse (RBLC) bulletin board system (BBS) provides access to
more than 3,100 pollution prevention (P2) and control technology determinations
addressing over 200 pollutants. Select the RBLC from the technical BBS menu on the
OAQPS Technology Transfer Center (TTN) BBS (919/541-5742).
•
CTC BBS on the OAQPS TTN provides around-the-clock access to all CTC services,
including downloadable copies of many CTC products. Select CTC from the TTN BBS
Technical BBS menu (919/541-5742).
•CTC NEWS is a quarterly newsletter published by the CTC. It contains updates on all CTC
activities including the RBLC and Federal SBAP. Call or write the CTC to get on the CTC
NEWS mailing list.
This document was funded by EPA’s Control Technology Center and prepared by
Research Triangle Institute (RTI). This document is the result of a request for technical
assistance from the State and Territorial Air Pollution Program Administrators and the
Association of Local Air Pollution Control Officials (STAPPA/ALAPCO) to identify control
technologies that are effective on treating gas streams with low concentrations of volatile
organic compounds (VOC) and/or organic hazardous air pollutants (HAP). This document
presents the results of a series of studies conducted to identify commercially available
control technologies applicable to low organic concentration gas streams. Technical and
economic background information relevant to the control technologies is presented by
technology type. Performance of the air pollution control devices is documented in the
form of source test reports or permits issued by State or local air pollution control agencies.
The document with the information and data presented provides the basis for evaluating the
availability and efficacy of air pollution control devices in reducing organic emission in low
concentration, high flow rate gas streams.
TABLE OF CONTENTS
Section Page
PREFACE vii
LIST OF TABLES xiii
LIST OF FIGURES xv
1 INTRODUCTION 11.1 BACKGROUND 11.2 SCOPE 31.3 CONCLUSIONS 51.4 RECOMMENDATIONS 8
2 INCINERATION 112.1 CATALYTIC INCINERATION 132.1.1 ARI’s Fluid-Bed Catalytic Incinerator 162.1.1.1 Pilot Plant Tests 162.1.1.2 Wurtsmith Air Force Base 192.1.1.3 McClellan Air Force Base 212.1.2 Anguil 222.1.3 Monsanto Enviro-Chem 222.1.4 CSM 232.1.5 Amcec 232.1.6 Alzeta 232.1.7 Thermo Electron 262.1.8 Catalytica 26
2.1.9 Costs 262.2 REGENERATIVE THERMAL INCINERATION 282.2.1 Smith Engineering Systems 292.2.1.1 Source Test Data 292.2.1.2 Permit Conditions 342.2.2 Reeco 352.2.2.2 Source Test Data 372.2.2.3 Permit Conditions 372.2.3 Other Manufacturers 392.2.4 Costs 392.3 RECUPERATIVE HEAT RECOVERY 392.4 FLARES 392.5 BOILERS AND PROCESS HEATERS 44
3 ADSORPTION 453.1 NONREGENERABLE ADSORPTION SYSTEMS 463.1.1 Principle of Operation 463.2 REGENERABLE FIXED BED ADSORPTION SYSTEMS 473.2.1 Principle of Operation 473.2.2 Applications 493.3 MODIFIED ADSORPTION SYSTEMS 51
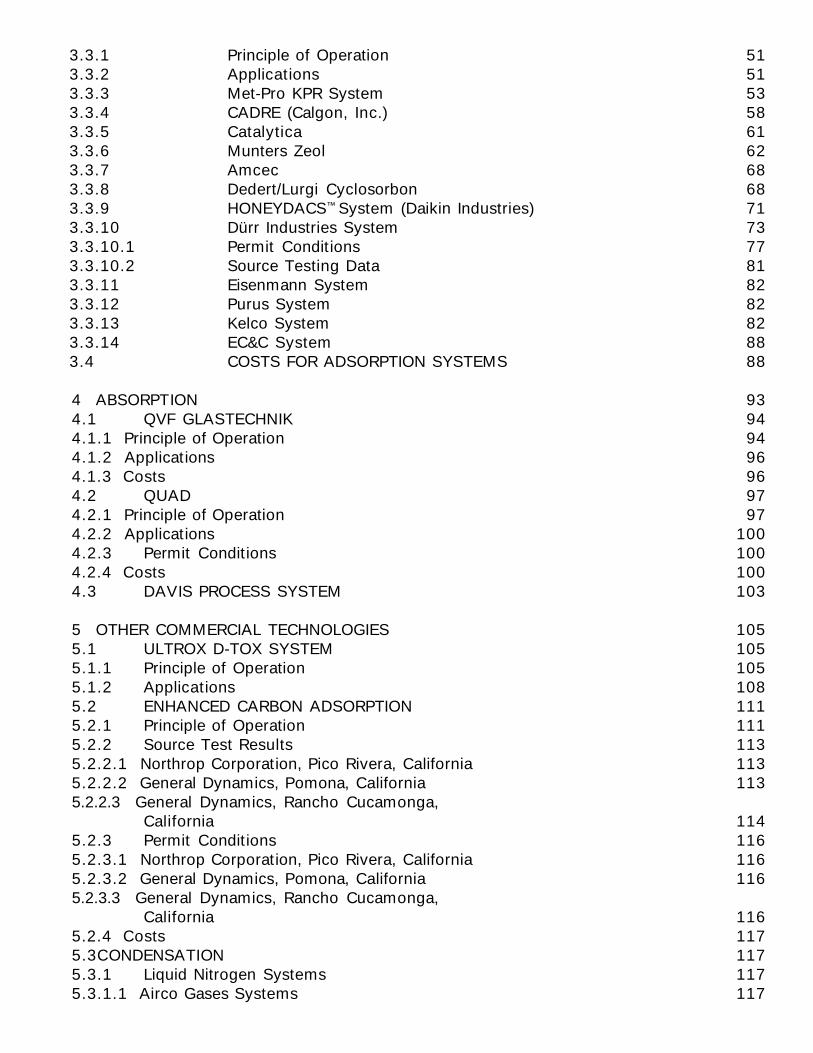
3.3.1 Principle of Operation 513.3.2 Applications 513.3.3 Met-Pro KPR System 533.3.4 CADRE (Calgon, Inc.) 583.3.5 Catalytica 613.3.6 Munters Zeol 623.3.7 Amcec 683.3.8 Dedert/Lurgi Cyclosorbon 683.3.9 HONEYDACS™ System (Daikin Industries) 713.3.10 Dürr Industries System 733.3.10.1 Permit Conditions 773.3.10.2 Source Testing Data 813.3.11 Eisenmann System 823.3.12 Purus System 823.3.13 Kelco System 823.3.14 EC&C System 883.4 COSTS FOR ADSORPTION SYSTEMS 88
4 ABSORPTION 934.1 QVF GLASTECHNIK 944.1.1 Principle of Operation 944.1.2 Applications 964.1.3 Costs 964.2 QUAD 974.2.1 Principle of Operation 974.2.2 Applications 1004.2.3 Permit Conditions 1004.2.4 Costs 1004.3 DAVIS PROCESS SYSTEM 103
5 OTHER COMMERCIAL TECHNOLOGIES 1055.1 ULTROX D-TOX SYSTEM 1055.1.1 Principle of Operation 1055.1.2 Applications 1085.2 ENHANCED CARBON ADSORPTION 1115.2.1 Principle of Operation 1115.2.2 Source Test Results 1135.2.2.1 Northrop Corporation, Pico Rivera, California 1135.2.2.2 General Dynamics, Pomona, California 1135.2.2.3 General Dynamics, Rancho Cucamonga,
California 1145.2.3 Permit Conditions 1165.2.3.1 Northrop Corporation, Pico Rivera, California 1165.2.3.2 General Dynamics, Pomona, California 1165.2.3.3 General Dynamics, Rancho Cucamonga,
California 1165.2.4 Costs 1175.3CONDENSATION 1175.3.1 Liquid Nitrogen Systems 1175.3.1.1 Airco Gases Systems 117
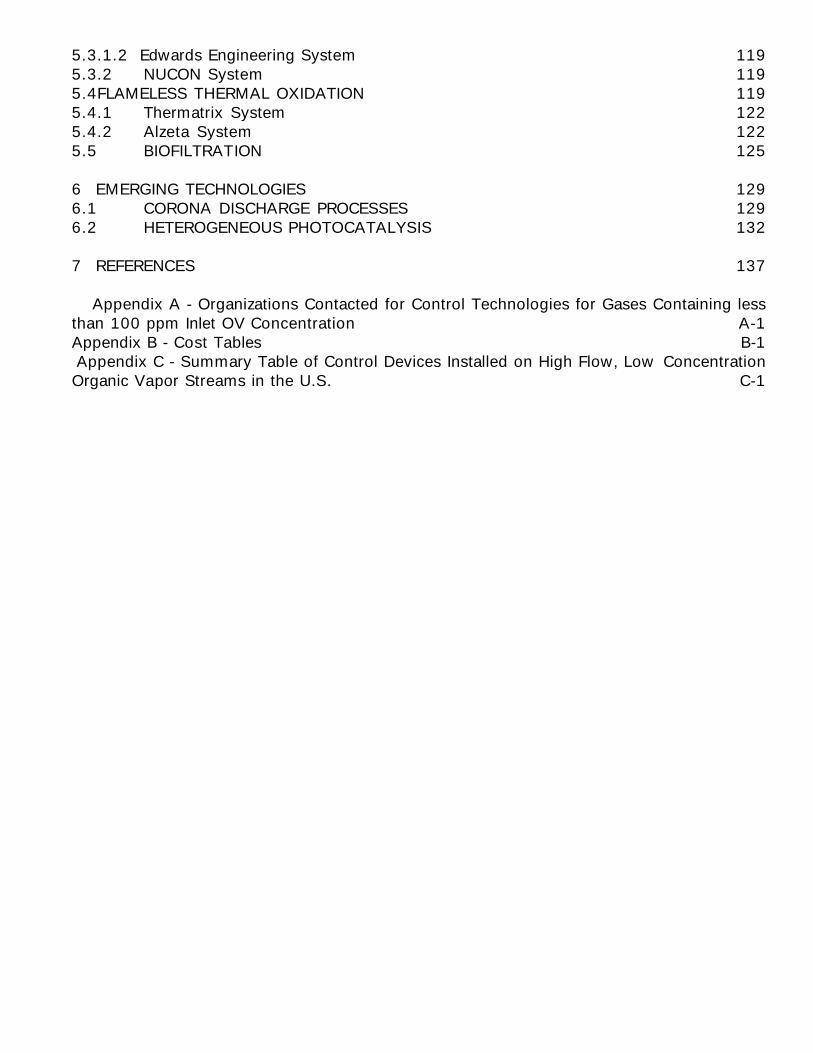
5.3.1.2 Edwards Engineering System 1195.3.2 NUCON System 1195.4FLAMELESS THERMAL OXIDATION 1195.4.1 Thermatrix System 1225.4.2 Alzeta System 1225.5 BIOFILTRATION 125
6 EMERGING TECHNOLOGIES 1296.1 CORONA DISCHARGE PROCESSES 1296.2 HETEROGENEOUS PHOTOCATALYSIS 132
7 REFERENCES 137
Appendix A - Organizations Contacted for Control Technologies for Gases Containing lessthan 100 ppm Inlet OV Concentration A-1Appendix B - Cost Tables B-1Appendix C - Summary Table of Control Devices Installed on High Flow, Low Concentration
Organic Vapor Streams in the U.S. C-1
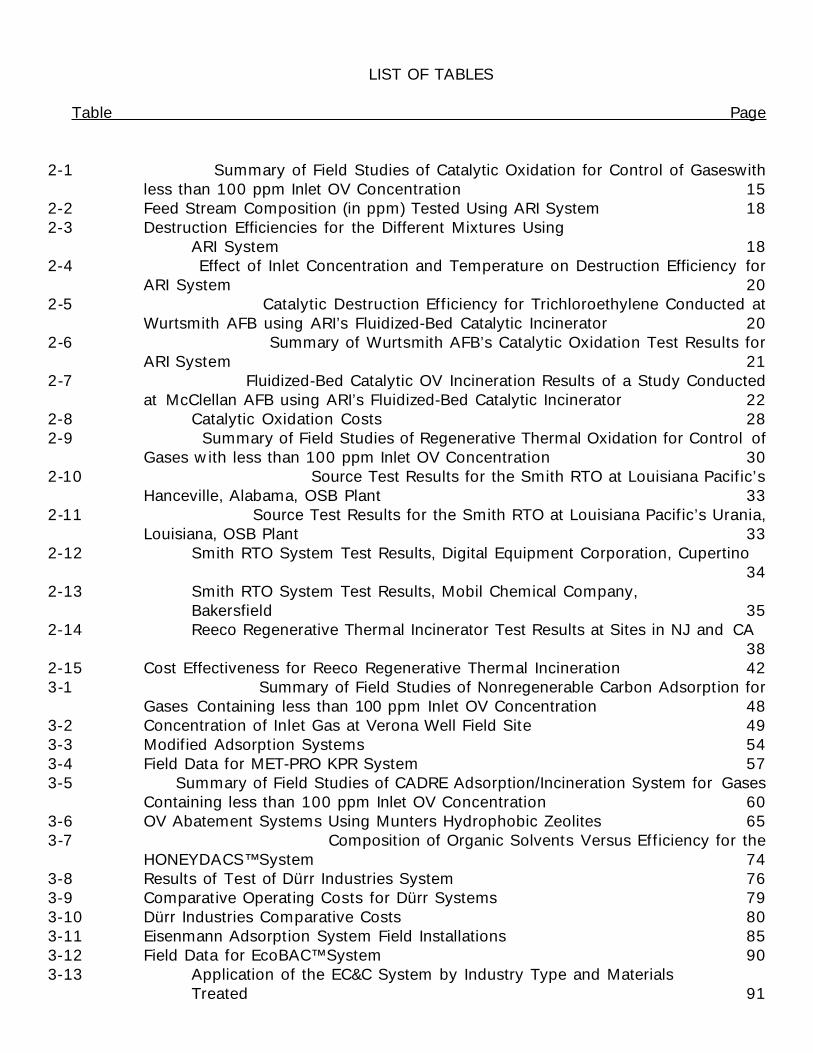
LIST OF TABLES
Table Page
2-1 Summary of Field Studies of Catalytic Oxidation for Control of Gaseswithless than 100 ppm Inlet OV Concentration 15
2-2 Feed Stream Composition (in ppm) Tested Using ARI System 182-3 Destruction Efficiencies for the Different Mixtures Using
ARI System 182-4 Effect of Inlet Concentration and Temperature on Destruction Efficiency for
ARI System 202-5 Catalytic Destruction Efficiency for Trichloroethylene Conducted at
Wurtsmith AFB using ARI’s Fluidized-Bed Catalytic Incinerator 202-6 Summary of Wurtsmith AFB’s Catalytic Oxidation Test Results for
ARI System 212-7 Fluidized-Bed Catalytic OV Incineration Results of a Study Conducted
at McClellan AFB using ARI’s Fluidized-Bed Catalytic Incinerator 222-8 Catalytic Oxidation Costs 282-9 Summary of Field Studies of Regenerative Thermal Oxidation for Control of
Gases with less than 100 ppm Inlet OV Concentration 302-10 Source Test Results for the Smith RTO at Louisiana Pacific’s
Hanceville, Alabama, OSB Plant 332-11 Source Test Results for the Smith RTO at Louisiana Pacific’s Urania,
Louisiana, OSB Plant 332-12 Smith RTO System Test Results, Digital Equipment Corporation, Cupertino
342-13 Smith RTO System Test Results, Mobil Chemical Company,
Bakersfield 352-14 Reeco Regenerative Thermal Incinerator Test Results at Sites in NJ and CA
382-15 Cost Effectiveness for Reeco Regenerative Thermal Incineration 423-1 Summary of Field Studies of Nonregenerable Carbon Adsorption for
Gases Containing less than 100 ppm Inlet OV Concentration 483-2 Concentration of Inlet Gas at Verona Well Field Site 493-3 Modified Adsorption Systems 543-4 Field Data for MET-PRO KPR System 573-5 Summary of Field Studies of CADRE Adsorption/Incineration System for Gases
Containing less than 100 ppm Inlet OV Concentration 603-6 OV Abatement Systems Using Munters Hydrophobic Zeolites 653-7 Composition of Organic Solvents Versus Efficiency for the
HONEYDACS™ System 743-8 Results of Test of Dürr Industries System 763-9 Comparative Operating Costs for Dürr Systems 793-10 Dürr Industries Comparative Costs 803-11 Eisenmann Adsorption System Field Installations 853-12 Field Data for EcoBAC™ System 903-13 Application of the EC&C System by Industry Type and Materials
Treated 91
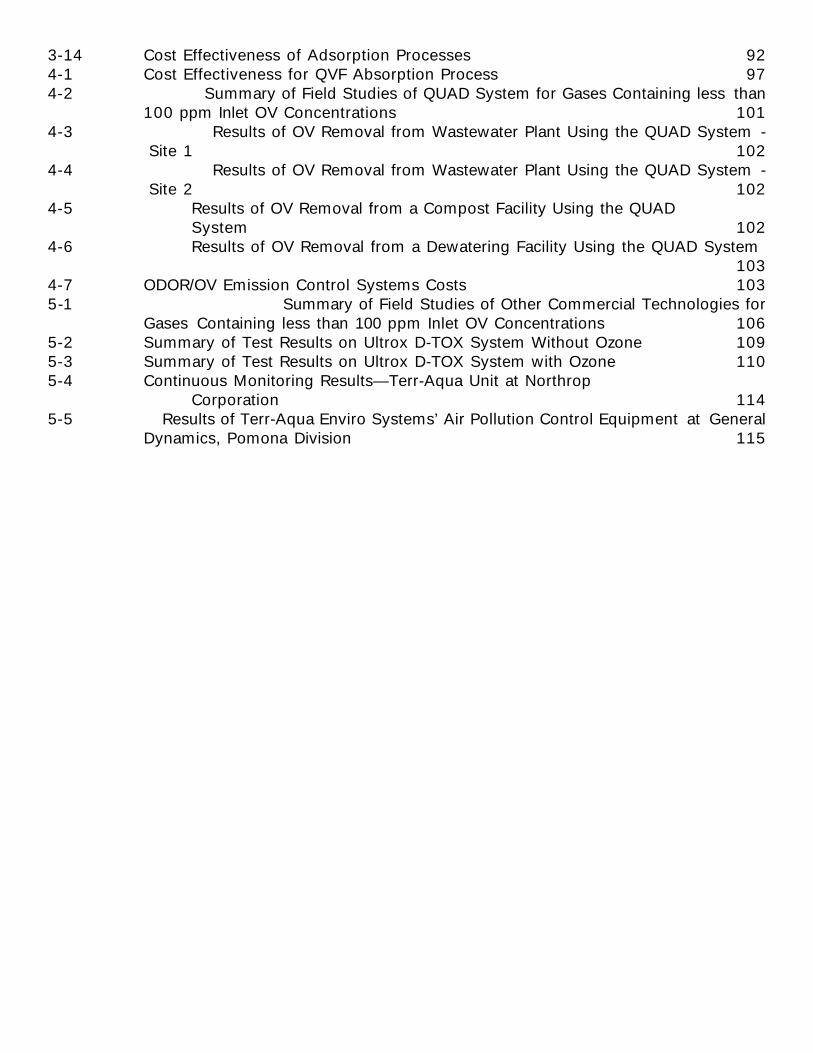
3-14 Cost Effectiveness of Adsorption Processes 924-1 Cost Effectiveness for QVF Absorption Process 974-2 Summary of Field Studies of QUAD System for Gases Containing less than
100 ppm Inlet OV Concentrations 1014-3 Results of OV Removal from Wastewater Plant Using the QUAD System -
Site 1 1024-4 Results of OV Removal from Wastewater Plant Using the QUAD System -
Site 2 1024-5 Results of OV Removal from a Compost Facility Using the QUAD
System 1024-6 Results of OV Removal from a Dewatering Facility Using the QUAD System
1034-7 ODOR/OV Emission Control Systems Costs 1035-1 Summary of Field Studies of Other Commercial Technologies for
Gases Containing less than 100 ppm Inlet OV Concentrations 1065-2 Summary of Test Results on Ultrox D-TOX System Without Ozone 1095-3 Summary of Test Results on Ultrox D-TOX System with Ozone 1105-4 Continuous Monitoring Results—Terr-Aqua Unit at Northrop
Corporation 1145-5 Results of Terr-Aqua Enviro Systems’ Air Pollution Control Equipment at General
Dynamics, Pomona Division 115
LIST OF FIGURES
Figure Page
2-1 Schematic Diagram of a Catalytic Incineration System 142-2 Ari Fluid-Bed Catalytic Incinerator 172-3 Monsanto Enviro-Chem Dynacycle Regenerative Unsteady State
Catalytic Oxidizer 242-4 Alzeta Adiabatic Radiant Burner 252-5 Schematic of Smith Engineering Systems’ Regenerative Thermal
Vapor Incinerator 312-6 Schematic of Reeco’s Regenerative Thermal Incinerator 362-7 Reeco’s Regenerative Thermal Incinerator—Horizontal Flow Design 402-8 Dürr Regenerative Thermal Incinerator—Horizontal Flow Design 412-9 Schematic of the Basic Components of a Steam-Assisted Elevated
Flare System 433-1 General Process Flow Diagram of an Adsorption Process for OV
Recovery 503-2 Rotary Carousel System 523-3 KPR System Flow Chart 553-4 CADRE Adsorption-Regeneration Process 593-5 Munters Zeol System 633-6 Munters’ Hydrophobic Zeolite Showing Inlet Solvent Concentration
Versus Adsorption Capacity 643-7 Munters’ Hydrophobic Zeolite Showing Relative Humidity Versus Adsorption
Capacity 643-8 Amcec HYBRID Adsorption/Oxidizer Process 693-9 Supersorbon Solvent Recovery Plant 703-10 Dedert/Lurgi Cyclosorbon Modified Adsorption System 723-11 Schematic Diagram of a Dürr Industires Rotary Concentrator 743-12 Outlet Concentration Profiles for Carbon Honeycomb Blocks for
Solvent Mixture 753-13 Dürr Industries Concentration Versus Flow Rate Application Chart 783-14 The Eisenmann Rotary Adsorber 833-15 The Eisenmann Rotary Adsorber Coupled With Condensation System
for Solvent Recovery 843-16 PADRE™ Schematic: Soil or Water Remediation Vapor Treatment
System 863-17 Kelco VAPOREX™ System 873-18 ECC EcoBAC™ System 894-1 QVF Process 954-2 Schematic Diagram of an Atomized Mist System – QUAD System 994-3 Typical Triplex™Scrubber System Operational Flow Diagram 104
5-1 Schematic Diagram of Pilot-Scale Ultrox D-TOX UV-Catalytic TestSystem 107
5-2 Schematic of Terr-Aqua Enviro Systems’ Air Pollution ControlSystem 112
5-3 Vapor Recovery System: Refrigeration Liquid Nitrogen Sections 1185-4 Refrigeration Vapor Recovery System: Components 120
5-5 The Braysorb® Process Regeneration Flow Diagram 1215-6 Thermatrix System’s Porous Surface Radiant Burner 1235-7 Alzeta Adiabatic Radiant Burner 1245-8 Alzeta VOC Flameless Thermal Oxidizer 1265-9 Schematic of an Open Single-Bed Biofilter System 1276-1 Schematic of a Packed-Bed Corona Reactor 1306-2 Schematic of Pulsed Corona Reactor 1316-3 Toluene Destruction Variac 44, 40 Pf, 1 L/min (48 ppm Toluene) 1336-4 Effect of Increasing Voltage on Power Usage and Destruction Efficiency for
the Packed-Bed Corona System 1346-5 Experimental Heterogeneous Photocatalysis System Used for
Experiments at NCSU 135
SECTION 1INTRODUCTION
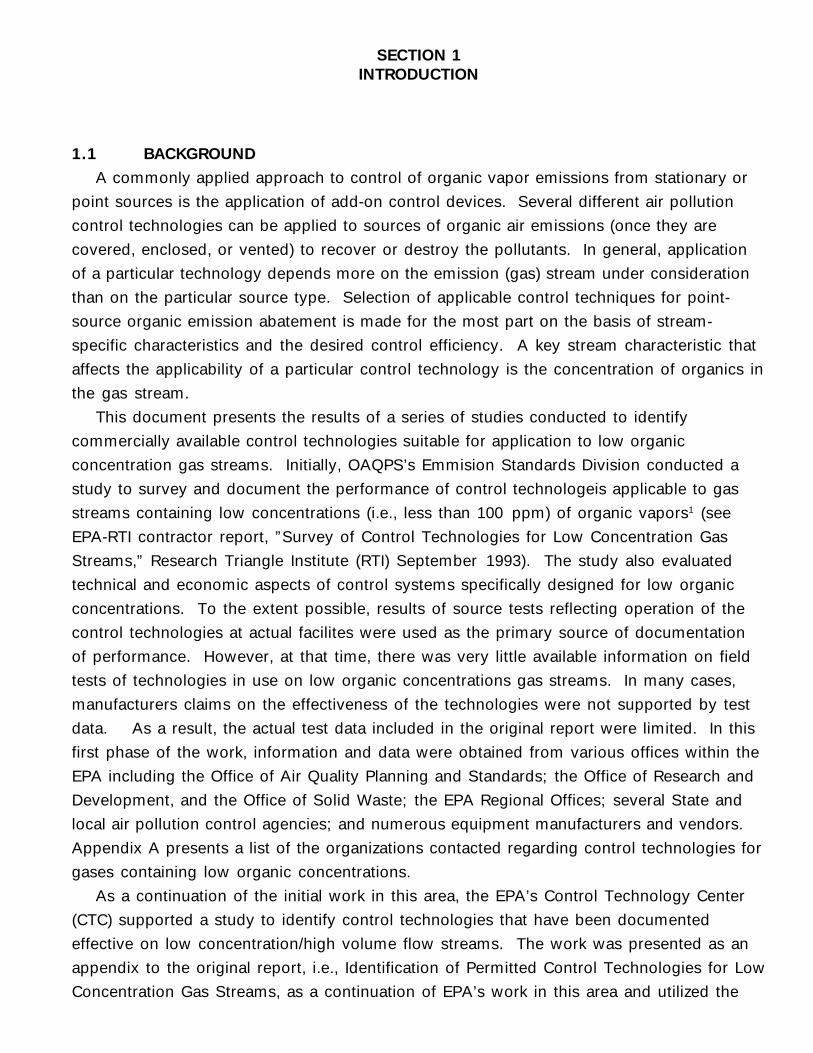
1.1 BACKGROUND
A commonly applied approach to control of organic vapor emissions from stationary or
point sources is the application of add-on control devices. Several different air pollution
control technologies can be applied to sources of organic air emissions (once they are
covered, enclosed, or vented) to recover or destroy the pollutants. In general, application
of a particular technology depends more on the emission (gas) stream under consideration
than on the particular source type. Selection of applicable control techniques for point-
source organic emission abatement is made for the most part on the basis of stream-
specific characteristics and the desired control efficiency. A key stream characteristic that
affects the applicability of a particular control technology is the concentration of organics in
the gas stream.
This document presents the results of a series of studies conducted to identify
commercially available control technologies suitable for application to low organic
concentration gas streams. Initially, OAQPS’s Emmision Standards Division conducted a
study to survey and document the performance of control technologeis applicable to gas
streams containing low concentrations (i.e., less than 100 ppm) of organic vapors1 (see
EPA-RTI contractor report, ”Survey of Control Technologies for Low Concentration Gas
Streams,” Research Triangle Institute (RTI) September 1993). The study also evaluated
technical and economic aspects of control systems specifically designed for low organic
concentrations. To the extent possible, results of source tests reflecting operation of the
control technologies at actual facilites were used as the primary source of documentation
of performance. However, at that time, there was very little available information on field
tests of technologies in use on low organic concentrations gas streams. In many cases,
manufacturers claims on the effectiveness of the technologies were not supported by test
data. As a result, the actual test data included in the original report were limited. In this
first phase of the work, information and data were obtained from various offices within the
EPA including the Office of Air Quality Planning and Standards; the Office of Research and
Development, and the Office of Solid Waste; the EPA Regional Offices; several State and
local air pollution control agencies; and numerous equipment manufacturers and vendors.
Appendix A presents a list of the organizations contacted regarding control technologies for
gases containing low organic concentrations.
As a continuation of the initial work in this area, the EPA’s Control Technology Center
(CTC) supported a study to identify control technologies that have been documented
effective on low concentration/high volume flow streams. The work was presented as an
appendix to the original report, i.e., Identification of Permitted Control Technologies for Low
Concentration Gas Streams, as a continuation of EPA’s work in this area and utilized the
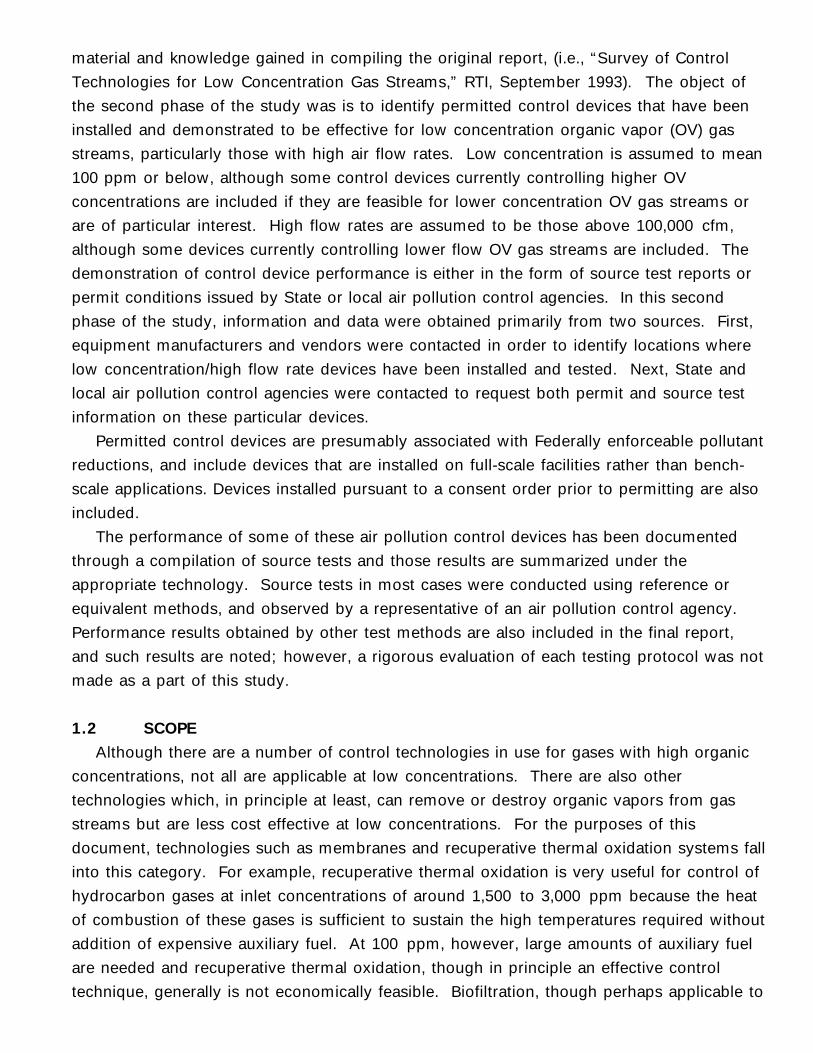
material and knowledge gained in compiling the original report, (i.e., “Survey of Control
Technologies for Low Concentration Gas Streams,” RTI, September 1993). The object of
the second phase of the study was is to identify permitted control devices that have been
installed and demonstrated to be effective for low concentration organic vapor (OV) gas
streams, particularly those with high air flow rates. Low concentration is assumed to mean
100 ppm or below, although some control devices currently controlling higher OV
concentrations are included if they are feasible for lower concentration OV gas streams or
are of particular interest. High flow rates are assumed to be those above 100,000 cfm,
although some devices currently controlling lower flow OV gas streams are included. The
demonstration of control device performance is either in the form of source test reports or
permit conditions issued by State or local air pollution control agencies. In this second
phase of the study, information and data were obtained primarily from two sources. First,
equipment manufacturers and vendors were contacted in order to identify locations where
low concentration/high flow rate devices have been installed and tested. Next, State and
local air pollution control agencies were contacted to request both permit and source test
information on these particular devices.
Permitted control devices are presumably associated with Federally enforceable pollutant
reductions, and include devices that are installed on full-scale facilities rather than bench-
scale applications. Devices installed pursuant to a consent order prior to permitting are also
included.
The performance of some of these air pollution control devices has been documented
through a compilation of source tests and those results are summarized under the
appropriate technology. Source tests in most cases were conducted using reference or
equivalent methods, and observed by a representative of an air pollution control agency.
Performance results obtained by other test methods are also included in the final report,
and such results are noted; however, a rigorous evaluation of each testing protocol was not
made as a part of this study.
1.2 SCOPE
Although there are a number of control technologies in use for gases with high organic
concentrations, not all are applicable at low concentrations. There are also other
technologies which, in principle at least, can remove or destroy organic vapors from gas
streams but are less cost effective at low concentrations. For the purposes of this
document, technologies such as membranes and recuperative thermal oxidation systems fall
into this category. For example, recuperative thermal oxidation is very useful for control of
hydrocarbon gases at inlet concentrations of around 1,500 to 3,000 ppm because the heat
of combustion of these gases is sufficient to sustain the high temperatures required without
addition of expensive auxiliary fuel. At 100 ppm, however, large amounts of auxiliary fuel
are needed and recuperative thermal oxidation, though in principle an effective control
technique, generally is not economically feasible. Biofiltration, though perhaps applicable to
low organic concentration gases, is also not within the scope of this study.2 A brief
description of the biofiltration process is included in Section 5.0 for background
information. The technologies that were evaluated for this document include the following:
• incineration- catalytic- regenerative thermal
• adsorption- nonregenerable- modified regenerable (including adsorption/incineration)
• absorption
• other commercial technologies- UV/ozone catalytic oxidation- enhanced adsorption
• emerging technologies- corona destruction- heterogeneous photocatalysis.
The results of the studies are summarized and presented in this document by
technology beginning in Section 2.0. In general, the overall performance of the control
technologies was found to be poorly documented relative to EPA standards. For example,
the lack of rigorous analyses (using test data) of the inlet and outlet gas compositions in all
but a few cases makes a comprehensive evaluation of these technologies difficult.
The cost-effectiveness ($/ton OV removed) of these technologies was calculated
using the model gas streams and general methods described by the OAQPS Control Cost
Manual.3 Though cost information for model streams was requested from vendors of all
technologies, responses were few. Therefore, to compare the technologies on a common
basis, capital and operating costs were calculated using published values and vendor-
supplied cost factors to the extent possible on four model gas streams. These were 100
and 10 ppm benzene in air and 100 and 10 ppm tetrachloroethylene in air, all at a flow rate
of 10,000 scfm. Estimates of total annualized cost for the various technologies based on
the model gas streams are presented in Appendix B.
Because of the uncertainty associated with both the emission reduction and the
costs, the accuracy of the cost-effectiveness values in some cases is probably no better
than order of magnitude and thus conclusions should not be drawn about relative cost
effectiveness when differences are small, e.g., between regenerative thermal incineration
and regenerable fixed-bed adsorption for 100 ppm benzene. Overall, cost-effectiveness
values range from $2,000 to about $67,000 per ton of OV removed (in 1991 dollars).
These relatively high values reflect the very dilute concentrations of interest. As expected,
cost-effectiveness values are much higher for lower concentrations.
1.3 CONCLUSIONS
1. The control of low concentration organic gas streams is currently one of the most
dynamic segments of the air pollution control technology industry. The technologies as
well as their applications are undergoing rapid change and development. Since originally
compiling the information and data for this document, performance data have become more
available and most recent indications are that the cost-effectiveness of some of the
technologies has improved. For this reason, some of the data and information in the
document may be outdated.
2. Commercially available technologies exist for control of gas streams containing less
than 100 ppm OV. Destruction and removal efficiencies >99 percent have been
demonstrated at a number of sites for each of the technologies discussed here. As
expected, the lower the concentration the higher the cost-effectiveness of the controls.
3. Based on the number of commercial installations, adsorption-based processes are
most widely applicable to low concentration gases. A recent development by several
vendors is the pairing of adsorption and desorption steps that concentrate the OV with a
separate step to treat the concentrated OV. These systems are specifically designed for
low concentrations.
4. Concentrating adsorption systems (including but not limited to rotary carbon or
zeolite absorbers from Dürr and Munters Zeol) are increasingly proposed by vendors in
conjunction with incinerators (or other devices) to control low concentration, high flow OV
streams. These adsorption systems are more widely demonstrated in Europe, probably
because of more stringent regulations.
5. In addition to adsorption-based processes, other technologies are being used
specifically for low concentration gases. These include absorption/stripping process and
UV/ozone catalytic oxidation. Preliminary evaluation suggests that absorption may be
competitive with the more widely used adsorption-based processes at concentrations close
to 100 ppm. Insufficient cost information was available to evaluate the cost effectiveness
of UV/ozone technologies.
6. Thermal or catalytic incinerator systems with regenerative heat recovery are being
proposed more widely by vendors. Regenerative heat recovery is often more cost effective
than recuperative heat recovery for systems with flows above 50,000 scfm.4 A number of
combinations of these regenerative systems are available, although not all are demonstrated
at the concentration (and flow rate) examined in this study. Pure thermal oxidizers without
heat recovery were not proposed for low concentration, high flow OV streams by any
vendor contacted.
7. There is a trend for vendors to collaborate on proposal to provide “best-of-breed”
combinations of devices to make up a (case-specific) control system. An example of this is
a system proposed using a Dürr rotary concentrator, an Anguil recuperative incinerator, and
a Johnson Matthey catalyst. Numerous such systems are proposed and are available with
a performance warranty.
8. The development of these modified or hybred systems and devices is proceeding at
a rapid pace. These devices are generally installed on new sources or existing sources
affected by newly implemented regulation, and so this rapid technological development
appears to be largely driven by the implementation of new and existing regulations.
9. Twenty-five (25) control devices for low concentration, high flow OV gas streams
are currently known to exist in the U.S. All are either permitted, being permitted, or
installed under a consent order. Documentation in the form of permits and source test
results was requested for all these devices. A table containing the relevant details on these
devices (e.g., inlet concentration, flow-rate, industrial application, and location) is provided
in Appendix C.
10. A need exists to more rigorously document the performance of field systems.
Reliable and complete inlet/outlet gas composition measurements taken at conditions of
practical interest are scarce. Data reported on many field tests are incomplete or
inconsistent. In addition, the acquisition of performance data on these devices was
hindered by the reluctance of some vendors to disclose the identity of their clients, and the
limited access to state and local air pollution control agencies’s files.
1.4 RECOMMENDATIONS
1. Further research on documenting the performance of control devices for low
concentraiton OV streams with high flows should be conducted; this would include
continued gathering of information on field tests of technology in use on low organic
concentration gas streams, especially those with high flow rates. Much of the information
requested was not received. Therefore, collection of additional permit information and field
test data will likely require commitment of resources, e.g., it may be necessary to travel to
various local, State, or regional air offices to collect the information directly. Visits to a
few State and local air pollution control agencies may be the quickest and least expensive
method of gathering such data if detailed and/or extensive documentation is desired.
2. Several of the technologies applicable to low concentration, high flow streams now
have a better defined cost history. The capital and annual operating costs reported in the
original study were, in large part, based on either EPA estimates or vendor estimates
because of the limited number of these technologies in actual field applications in 1991.
The number of these devices in full scale operation has dramatically increased over the past
few years and many of these technologies now have several years of operating history.
Updated capital and operating cost information could be obtained that would better reflect
current actual costs. Additional cost effectiveness studies also could be performed to
determine which technologies are most cost-effective for low OV concentrations and high
gas flow rates. This may involve formally requesting vendors to develop quotes. Detailed
costs were not available for the modified regenerable adsorption systems. The fact that
they are being commercially used does, however, suggest that they are of comparable cost
to the conventional regenerable systems.
3. Consideration should be given to conducting field tests of some demonstrated
devices to better document performance at realistic conditions and as a means of
broadening the concept of availability (for use during standards setting). The modified (or
hybred) adsorption systems and the alternative design, i.e., horizontal flow, regenerative
thermal oxidizers appear to be good candidates for performance testing.
4. There is an increasing number of technologies being applied to control of indoor air
pollution in large buildings (e.g., the ozone/catalyst system developed by Union Carbide5,6).
The very low concentration of indoor air contaminants (typically around 1 ppm) and large
flow rates in buildings make these technologies of interest for study. However, these
technologies were not evaluated as a part of this study, though they may be of particular
interest for concentrations near 1 ppm OV.
SECTION 2INCINERATION
Incineration is an oxidation process which ideally converts organic compounds, whether
hydrocarbon or oxygenated, to CO2 and H2O. If the organic is halogenated, the
corresponding halogen acids will be formed as products of combustion. Incineration is
widely used for the destruction of a wide variety of OV. It is best suited to applications
where the gas stream has a consistent flow rate and concentration. There are two main
types of incinerators: thermal and catalytic. In thermal incineration, the OV-containing
stream is heated to very high temperatures to oxidize the organic compounds in the gas
phase. In catalytic incineration, a catalyst promotes the oxidation reaction on its surface
(i.e., solid-gas interface) at lower temperatures by providing alternative reaction pathways
that have faster rates than the corresponding gas-phase reactions. A thermal incinerator
burns the OV at very high temperatures, usually in the 750 to 1,000 °C range; catalytic
incinerators operate between 350 and 500 °C.
To save fuel, a heat exchanger often is used to recover the valuable heat generated
during incineration by preheating the inlet gas. Thermal incinerators without heat recovery
are not known to be used to control high flow, low concentration OV gas streams. This is
due to the high rate of fuel consumption in pure thermal systems when compared to
systems using heat recovery or catalysis. Numerous companies such as the John Zink Co.7
(now including McGill) market small thermal incinerators for the control of low
concentration OV gas streams, but they are typically for low flow applications such as
small air stripper outlets.
Depending upon the type of heat recovery unit, incinerators are further classified as
(1) regenerative or (2) recuperative. Thermal and catalytic oxidizers are available with or
without recuperative or regenerative heat recovery. Regenerative thermal incinerators
consist of a flame-based combustion chamber that connects two (or three) fixed beds
containing inert (e.g., ceramic) packing. Incoming gas enters one of the beds where it is
preheated. The heated gas flows into the combustion chamber, burns, and the hot flue
gases flow through the packed beds which capture, store, and permit recovery of the heat
generated during oxidation. The packed beds store the heat energy during one cycle and
then release it as the beds preheat the incoming OV-laden gas during the second cycle. Up
to 95 percent of the energy in the flue gas can be recovered in this manner. The packed
beds, in effect, are direct contact heat exchangers.
A recuperative thermal incinerator uses a shell and tube heat exchanger to transfer the
heat generated by incineration to preheat the feed stream. Recuperative thermal
incineration has a much lower thermal efficiency and as a result it is far less economical for
low OV concentrations. The lack of recuperative thermal incinerators in high flow, low
concentration OV streams is probably driven by the high operating costs for these systems.
Recuperative thermal incineration is not considered further in this document. The
regenerative thermal incinerator is better suited for low concentration OV streams because
its higher thermal efficiency makes it more economical at low OV concentrations8; these
systems are discussed in Section 2.2.
Catalytic incinerators modify the flame-based incinerator concept by adding a catalyst
to promote the oxidation reaction, allowing faster reaction and/or reduced reaction
temperature. This may allow more cost-effective operation at low OV concentrations than
even regenerative thermal incineration. A faster reaction requires a smaller vessel, thus
reducing capital costs; and low operating temperatures generally reduce auxiliary fuel
requirements, thus reducing operating costs. Catalytic incineration, however, is not as
broadly applicable as thermal incineration because of its greater sensitivity to pollutant
characteristics and process conditions. Design and operating considerations are therefore
critical because the catalyst may be adversely affected by high temperatures, high
concentrations of organics, fouling from particulate matter or polymers, and deactivation by
halogens or certain metals.
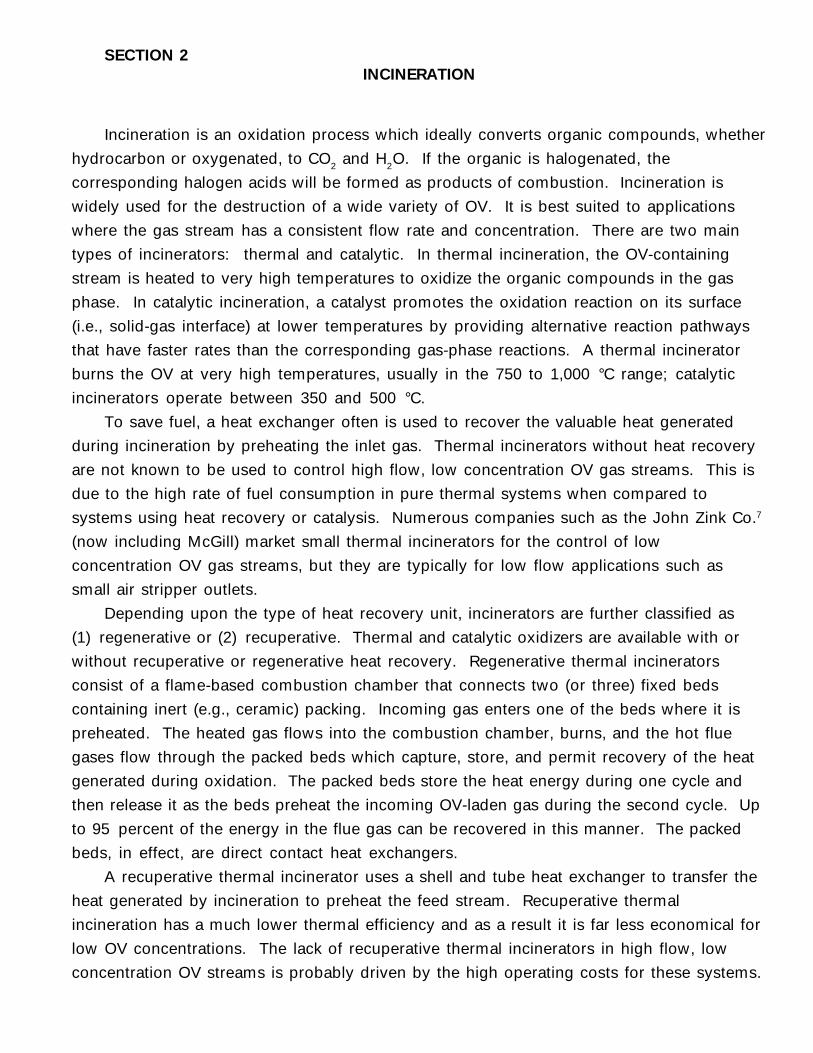
2.1 CATALYTIC INCINERATION
Figure 2-1 shows the schematic of a catalytic incinerator system.9 The OV-containing
gas is first indirectly preheated by the exhaust gas. For the low concentrations of interest
here, supplemental fuel is used to further preheat the gas, usually in an open flame burner,
to the reaction temperature. The gas then passes over the catalyst, where the OV is
oxidized. The operating temperature to achieve a particular destruction efficiency depends
on the concentration and composition of the OV in the emission stream and the type of
catalyst used. Commercial catalysts usually consist of noble metals or metal oxides. The
type of catalyst used depends on the type of OV. For example, some noble metal catalysts
may be poisoned by chlorinated OV, even at the very low concentrations of interest here.
In such cases metal oxides that are more resistant to halogenated compounds must be
used.
Several companies market catalytic incinerators for OV destruction. These companies
include ARI Technologies, Wheelabrator, Hunington Energy Systems, Anguil, Monsanto
Enviro-Chem, CSM, Amcec, Alzeta, and Thermo Electron. However, the only information
obtained on systems used for concentrations less than 100 ppm is for units made by ARI
Technologies, Inc. (Palatine, IL). This group of companies markets a full range of
incinerators, including the fluidized bed Econ-Abator® catalytic oxidizer. These systems are
available with recuperative heat exchangers for smaller flows, and regenerative heat
exchangers for larger flows. Other vendors of catalytic incinerators were contacted, but
none reported having field units operating on gases with OV concentrations less than 100
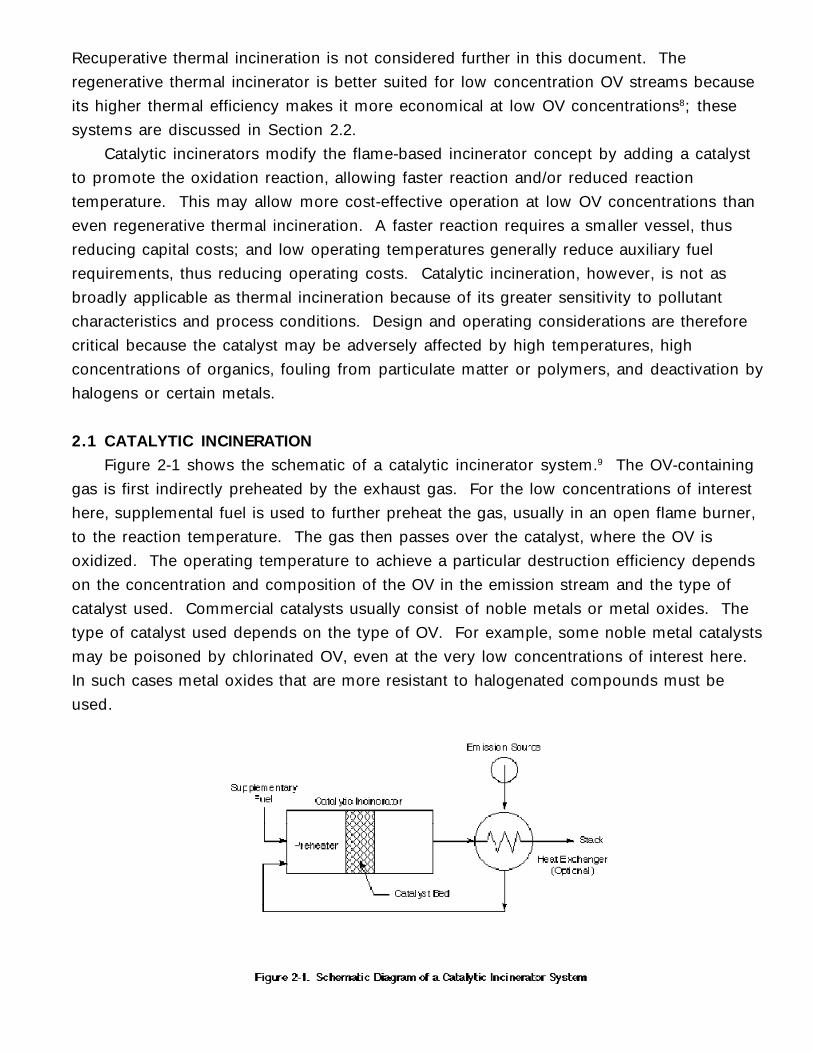
ppm. Table 2-1 shows the available information on catalytic incinerators used for OV
concentrations less than 100 ppm. No ARI systems are known to
Table 2-1. Summary of Field Studies of Catalytic Oxidation for Control of Gaseswith less than 100 ppm Inlet OV Concentration
Vendor Site Gas flow Inlet Outlet Destruction/ Comments/(scfm) concentration concentration removal Reference
(ppm) (ppm) efficiency (%)ARI Mobile Unita 500 3-200 NRb 72-98 Six gas
streamstested;Palazzolo etal., 198610
ARI Wurtsmith AFB, MIc 1,200 1-2 0.01 98-99 Majorcontaminant istrichloroethylene;Hylton, 199011
ARI Wurtsmith AFB, MIc 1,200 2.1 .072 96.6d Different feedgases fromgroundwaterair stripper;Hylton, 199012
ARI McClellan AFB, CA 348-691 6-44e .05-0.3 >99 Paint sprayboothemissions;Ritts, et al.,199013
aPilot scale tests conducted in RTP, NC, using a mobile unit.bNot reported.cUnit was tested on several gases from an operating air stripper.dThese are results for a second test at this site using a different feed which contained benzene, toluene, and three C1 - C2 chlorocarbons plusone CFC.eCalculated assuming an average molecular weight of 80. Feed consisted of hydrocarbon and oxygenated hydrocarbon compounds. Up to 100 ppm CO was present in the exhaust.
be installed in the U.S. on high flow, low concentration organic vapor streams.14 (Note: The
permit for the 3M Company’s facility in St. Paul (No. 23GS-93-0T-1)15 lists an ARI, Econ-
Abator fluidized bed catalytic oxidizer as in-use control equipment. The unit is listed as having
a 95% design construction efficiency and an exhaust (stack) gas flow rate of 19,511 scfm
(43,774 acfm at 680°F). This unit serves several emission units at the plant that are reported
in the permit as Emission Point No. 2.
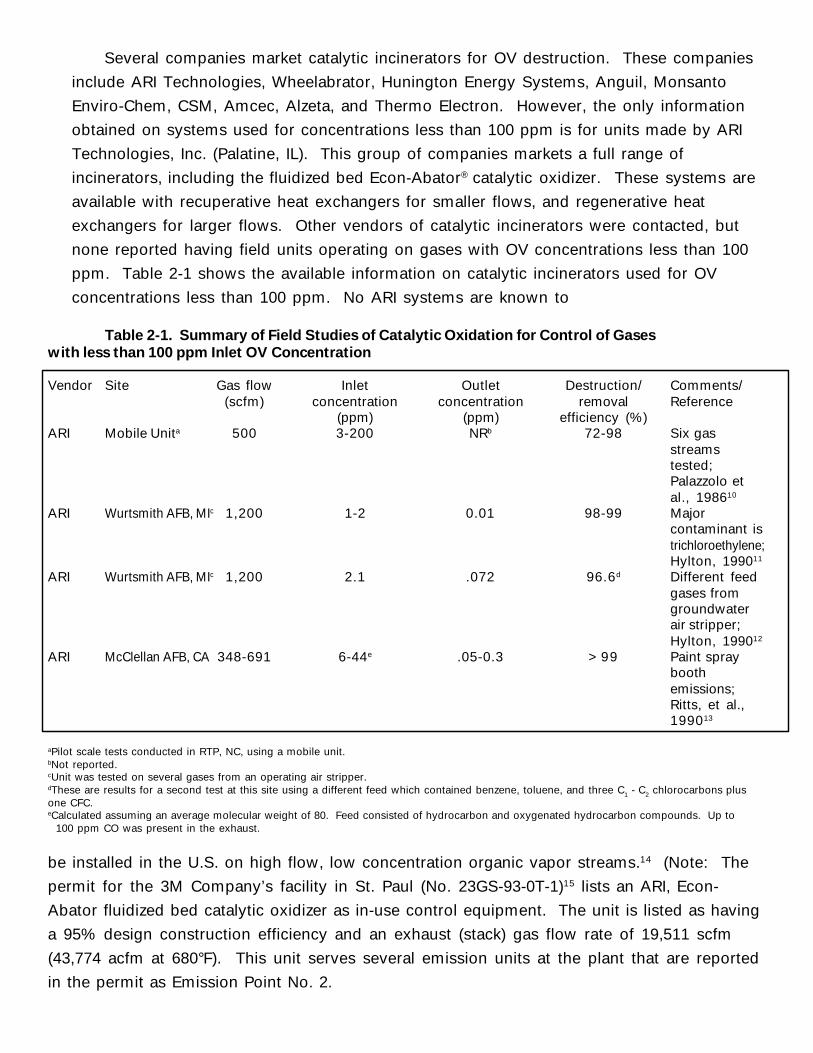
2.1.1 ARI’s Fluid-Bed Catalytic Incinerator
ARI markets a fluid-bed catalytic incinerator for OV oxidation. This system uses a
chromia-alumina catalyst suitable for oxidation of both hydrocarbons and halogenated
compounds. The catalyst is in the form of small beads through which the gas passes in an
upward direction. Figure 2-2 shows a schematic of the unit which, in principle, is similar to
other catalytic processes as shown in Figure 2-1, the only difference being that the gas flows
upward through a fluid bed of catalyst. The gradual attrition of the catalyst is claimed to avoid
catalyst deactivation by continually exposing fresh catalyst surface. The purchased equipment
costs of the ARI units are somewhat higher than fixed-bed units of the same size,16 but the
ARI catalyst is one of the few commercially available that is designed to oxidize chlorinated
OV.
2.1.1.1 Pilot Plant Tests
ARI’s fluidized bed has been tested for the destruction of low concentration OV streams.17
The particular system was designed to handle 500 scfm. Various feed streams with inlet OV
concentration ranging from 3 to 200 ppm were investigated to determine overall destruction
efficiency. Two types of feedstreams were studied: one containing only chlorocarbons and
the other containing a mixture of hydrocarbons and trichloroethylene. Table 2-2 summarizes
the composition of the five streams used in this work.
Table 2-3 presents the destruction efficiencies for the different feedstreams that are less
than 100 ppm as a function of space velocity and inlet temperature.
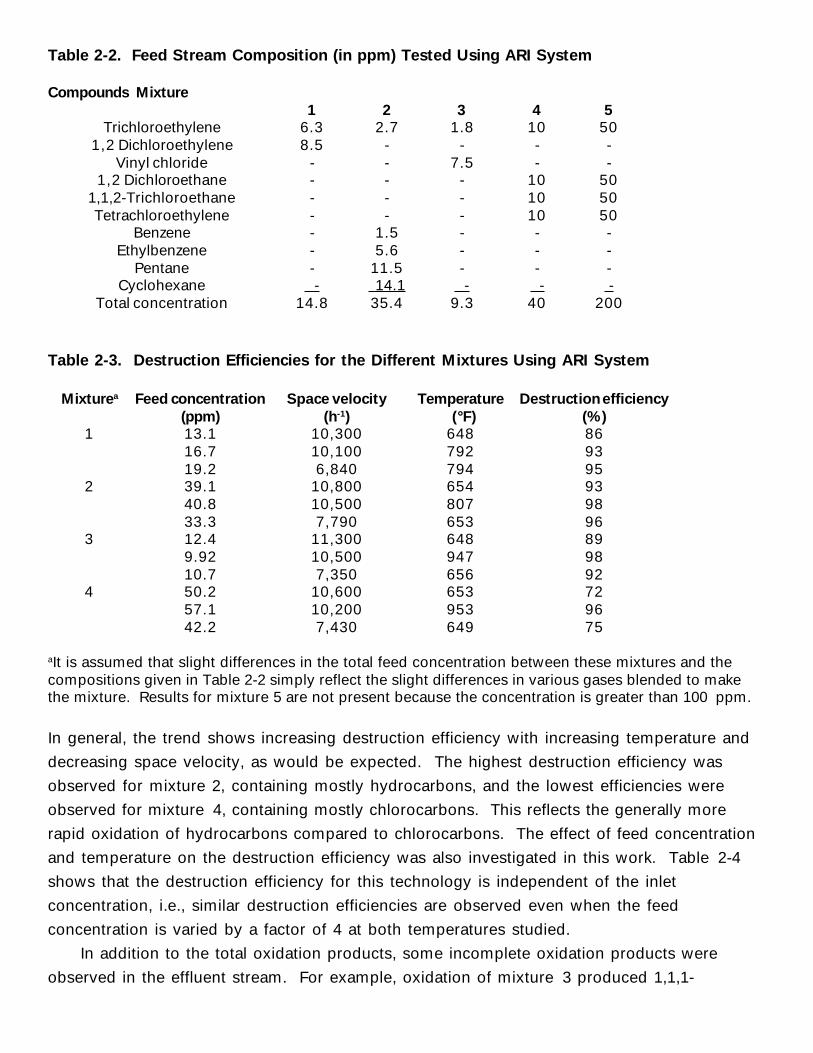
Table 2-2. Feed Stream Composition (in ppm) Tested Using ARI System
Compounds Mixture1 2 3 4 5
Trichloroethylene 6.3 2.7 1.8 10 501,2 Dichloroethylene 8.5 - - - -
Vinyl chloride - - 7.5 - -1,2 Dichloroethane - - - 10 50
1,1,2-Trichloroethane - - - 10 50Tetrachloroethylene - - - 10 50
Benzene - 1.5 - - -Ethylbenzene - 5.6 - - -
Pentane - 11.5 - - -Cyclohexane - 14.1 - - -
Total concentration 14.8 35.4 9.3 40 200
Table 2-3. Destruction Efficiencies for the Different Mixtures Using ARI System
Mixturea Feed concentration Space velocity Temperature Destruction efficiency(ppm) (h-1) (°F) (%)
1 13.1 10,300 648 8616.7 10,100 792 9319.2 6,840 794 95
2 39.1 10,800 654 9340.8 10,500 807 9833.3 7,790 653 96
3 12.4 11,300 648 899.92 10,500 947 9810.7 7,350 656 92
4 50.2 10,600 653 7257.1 10,200 953 9642.2 7,430 649 75
aIt is assumed that slight differences in the total feed concentration between these mixtures and thecompositions given in Table 2-2 simply reflect the slight differences in various gases blended to makethe mixture. Results for mixture 5 are not present because the concentration is greater than 100 ppm.
In general, the trend shows increasing destruction efficiency with increasing temperature and
decreasing space velocity, as would be expected. The highest destruction efficiency was
observed for mixture 2, containing mostly hydrocarbons, and the lowest efficiencies were
observed for mixture 4, containing mostly chlorocarbons. This reflects the generally more
rapid oxidation of hydrocarbons compared to chlorocarbons. The effect of feed concentration
and temperature on the destruction efficiency was also investigated in this work. Table 2-4
shows that the destruction efficiency for this technology is independent of the inlet
concentration, i.e., similar destruction efficiencies are observed even when the feed
concentration is varied by a factor of 4 at both temperatures studied.
In addition to the total oxidation products, some incomplete oxidation products were
observed in the effluent stream. For example, oxidation of mixture 3 produced 1,1,1-
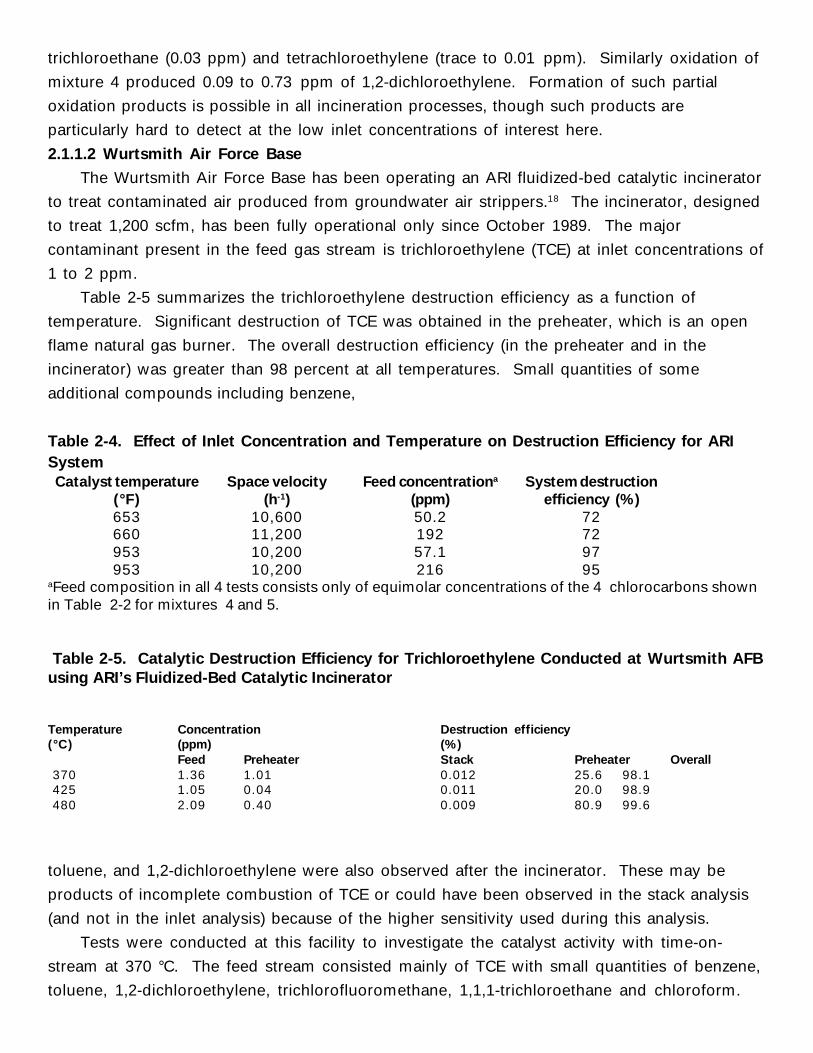
trichloroethane (0.03 ppm) and tetrachloroethylene (trace to 0.01 ppm). Similarly oxidation of
mixture 4 produced 0.09 to 0.73 ppm of 1,2-dichloroethylene. Formation of such partial
oxidation products is possible in all incineration processes, though such products are
particularly hard to detect at the low inlet concentrations of interest here.
2.1.1.2 Wurtsmith Air Force Base
The Wurtsmith Air Force Base has been operating an ARI fluidized-bed catalytic incinerator
to treat contaminated air produced from groundwater air strippers.18 The incinerator, designed
to treat 1,200 scfm, has been fully operational only since October 1989. The major
contaminant present in the feed gas stream is trichloroethylene (TCE) at inlet concentrations of
1 to 2 ppm.
Table 2-5 summarizes the trichloroethylene destruction efficiency as a function of
temperature. Significant destruction of TCE was obtained in the preheater, which is an open
flame natural gas burner. The overall destruction efficiency (in the preheater and in the
incinerator) was greater than 98 percent at all temperatures. Small quantities of some
additional compounds including benzene,
Table 2-4. Effect of Inlet Concentration and Temperature on Destruction Efficiency for ARISystemCatalyst temperature Space velocity Feed concentrationa System destruction
(°F) (h-1) (ppm) efficiency (%)653 10,600 50.2 72660 11,200 192 72953 10,200 57.1 97953 10,200 216 95
aFeed composition in all 4 tests consists only of equimolar concentrations of the 4 chlorocarbons shownin Table 2-2 for mixtures 4 and 5.
Table 2-5. Catalytic Destruction Efficiency for Trichloroethylene Conducted at Wurtsmith AFBusing ARI’s Fluidized-Bed Catalytic Incinerator
Temperature Concentration Destruction efficiency(°C) (ppm) (%)
Feed Preheater Stack Preheater Overall370 1.36 1.01 0.012 25.6 98.1425 1.05 0.04 0.011 20.0 98.9480 2.09 0.40 0.009 80.9 99.6
toluene, and 1,2-dichloroethylene were also observed after the incinerator. These may be
products of incomplete combustion of TCE or could have been observed in the stack analysis
(and not in the inlet analysis) because of the higher sensitivity used during this analysis.
Tests were conducted at this facility to investigate the catalyst activity with time-on-
stream at 370 °C. The feed stream consisted mainly of TCE with small quantities of benzene,
toluene, 1,2-dichloroethylene, trichlorofluoromethane, 1,1,1-trichloroethane and chloroform.
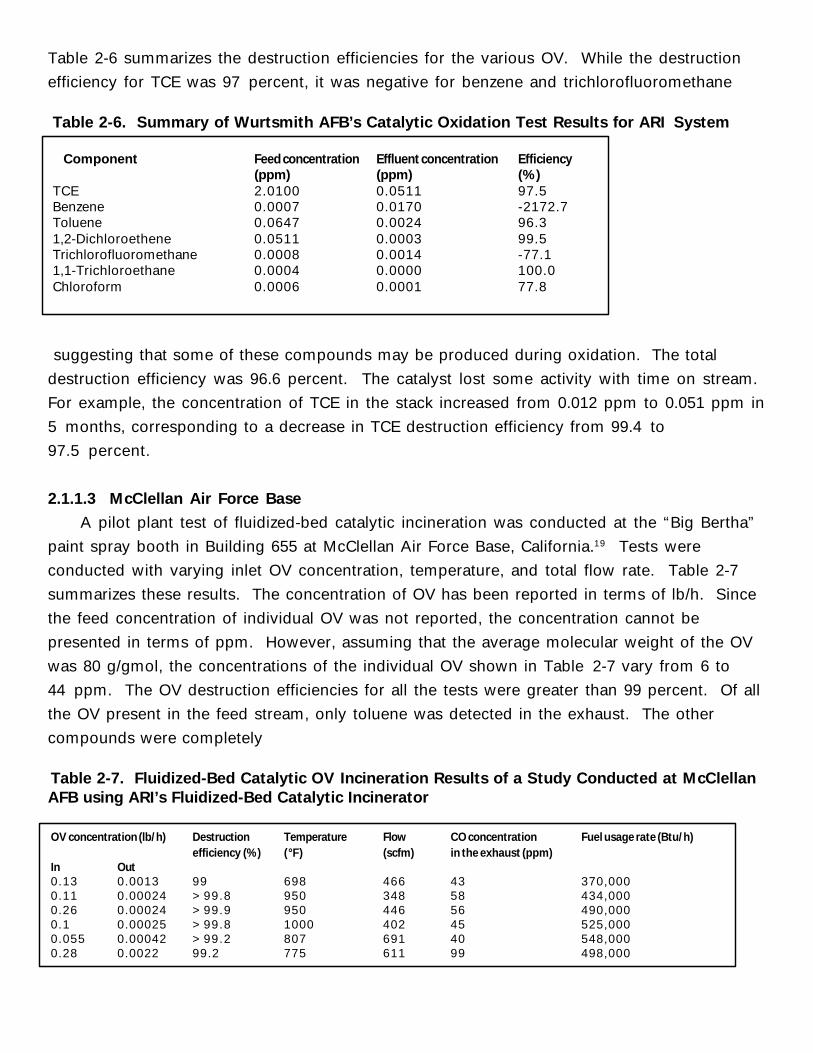
Table 2-6 summarizes the destruction efficiencies for the various OV. While the destruction
efficiency for TCE was 97 percent, it was negative for benzene and trichlorofluoromethane
Table 2-6. Summary of Wurtsmith AFB’s Catalytic Oxidation Test Results for ARI System
Component Feed concentration Effluent concentration Efficiency(ppm) (ppm) (%)
TCE 2.0100 0.0511 97.5Benzene 0.0007 0.0170 -2172.7Toluene 0.0647 0.0024 96.31,2-Dichloroethene 0.0511 0.0003 99.5Trichlorofluoromethane 0.0008 0.0014 -77.11,1-Trichloroethane 0.0004 0.0000 100.0Chloroform 0.0006 0.0001 77.8
suggesting that some of these compounds may be produced during oxidation. The total
destruction efficiency was 96.6 percent. The catalyst lost some activity with time on stream.
For example, the concentration of TCE in the stack increased from 0.012 ppm to 0.051 ppm in
5 months, corresponding to a decrease in TCE destruction efficiency from 99.4 to
97.5 percent.
2.1.1.3 McClellan Air Force Base
A pilot plant test of fluidized-bed catalytic incineration was conducted at the “Big Bertha”
paint spray booth in Building 655 at McClellan Air Force Base, California.19 Tests were
conducted with varying inlet OV concentration, temperature, and total flow rate. Table 2-7
summarizes these results. The concentration of OV has been reported in terms of lb/h. Since
the feed concentration of individual OV was not reported, the concentration cannot be
presented in terms of ppm. However, assuming that the average molecular weight of the OV
was 80 g/gmol, the concentrations of the individual OV shown in Table 2-7 vary from 6 to
44 ppm. The OV destruction efficiencies for all the tests were greater than 99 percent. Of all
the OV present in the feed stream, only toluene was detected in the exhaust. The other
compounds were completely
Table 2-7. Fluidized-Bed Catalytic OV Incineration Results of a Study Conducted at McClellanAFB using ARI’s Fluidized-Bed Catalytic Incinerator
OV concentration (lb/h) Destruction Temperature Flow CO concentration Fuel usage rate (Btu/h)efficiency (%) (°F) (scfm) in the exhaust (ppm)
In Out0.13 0.0013 99 698 466 43 370,0000.11 0.00024 >99.8 950 348 58 434,0000.26 0.00024 >99.9 950 446 56 490,0000.1 0.00025 >99.8 1000 402 45 525,0000.055 0.00042 >99.2 807 691 40 548,0000.28 0.0022 99.2 775 611 99 498,000
oxidized. In addition to CO2, produced by complete combustion, some amount of CO was also
present in the exhaust.
2.1.2 Anguil
Anguil manufactures various systems including oxidizing with regenerative heat
exchangers, recuperative heat exchangers, catalysts, and concentrators. Projects are usually
in the 100 to 35,000 scfm airstream flow rate range; however, the company has recently
expanded its product line to include equipment in the 100,000 scfm range due to market
demands.20 Anguil has no system known to be installed currently in the U.S. on high flow,
low concentration organic vapor streams.21
2.1.3 Monsanto Enviro-Chem
Monsanto Enviro-Chem manufactures a wide range of control devices including the
DynaCycle regenerative unsteady state catalytic oxidizer (RUSCO) which has been
demonstrated to provide 99 percent reduction of OV from oriented strand board manufacture.
RUSCO has been used for the removal of sulfur dioxide with oxygen over vanadium, titanium,
and tungsten oxides; oxidation of carbon monoxide with air over copper, chromium, and iron
oxides; destruction of C1, C4, C6, and C8 alcohols; destruction of phenols, formaldehyde,
hydrogen cyanide, acrylonitrile, ethyl acetate, cyclohexanone, and other compounds. It has
not, however, been demonstrated in the U.S. at high flow rates.22
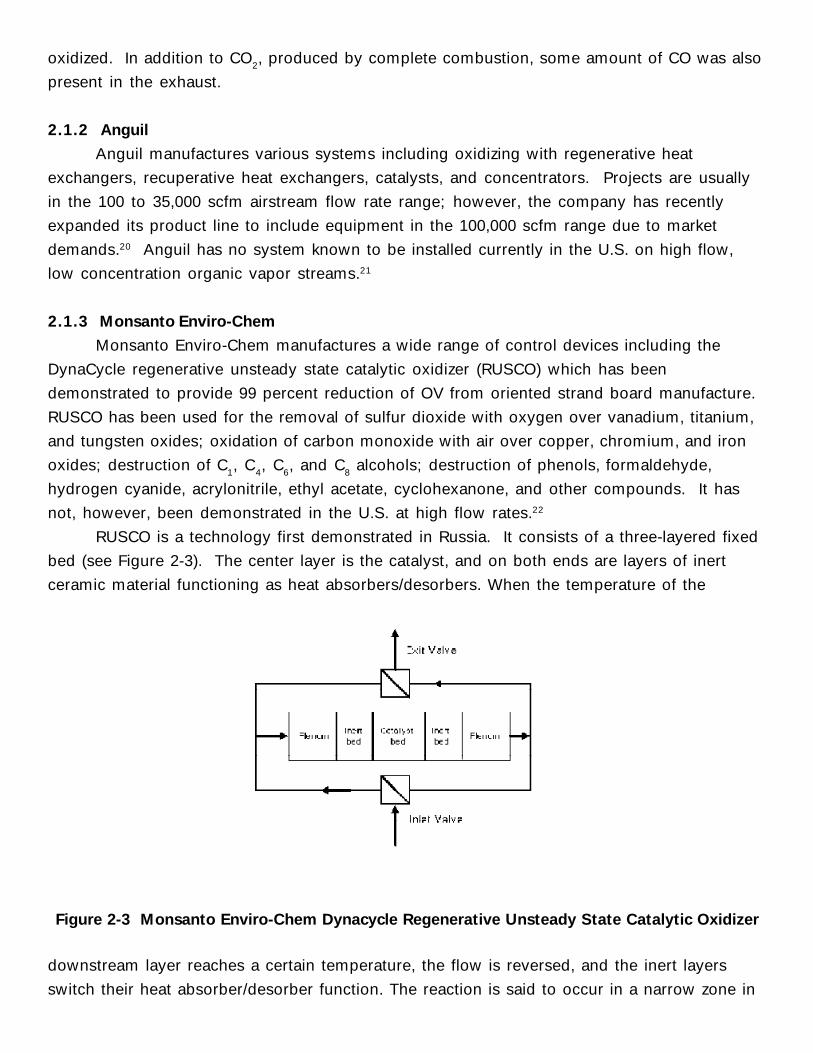
RUSCO is a technology first demonstrated in Russia. It consists of a three-layered fixed
bed (see Figure 2-3). The center layer is the catalyst, and on both ends are layers of inert
ceramic material functioning as heat absorbers/desorbers. When the temperature of the
Figure 2-3 Monsanto Enviro-Chem Dynacycle Regenerative Unsteady State Catalytic Oxidizer
downstream layer reaches a certain temperature, the flow is reversed, and the inert layers
switch their heat absorber/desorber function. The reaction is said to occur in a narrow zone in
the catalyst layer, which suggests that the rate of reaction is very high. Oxidation is
essentially complete for reversible and irreversible reactions, and efficiencies measured below
100 percent appear to be due only to the short time required for the switching valves to cycle.
Unlike steady-state devices, temperatures in a RUSCO device never approach the theoretical
equilibrium, and so the RUSCO device is self-optimizing.23
2.1.4 CSM
CSM manufactures mainly catalytic oxidizers, but has none installed in the U.S. for
control of low concentration, high flow OV streams.24
2.1.5 Amcec
Amcec has no catalyst based control systems operating on low concentration, high flow
OV streams in the U.S.25
2.1.6 Alzeta
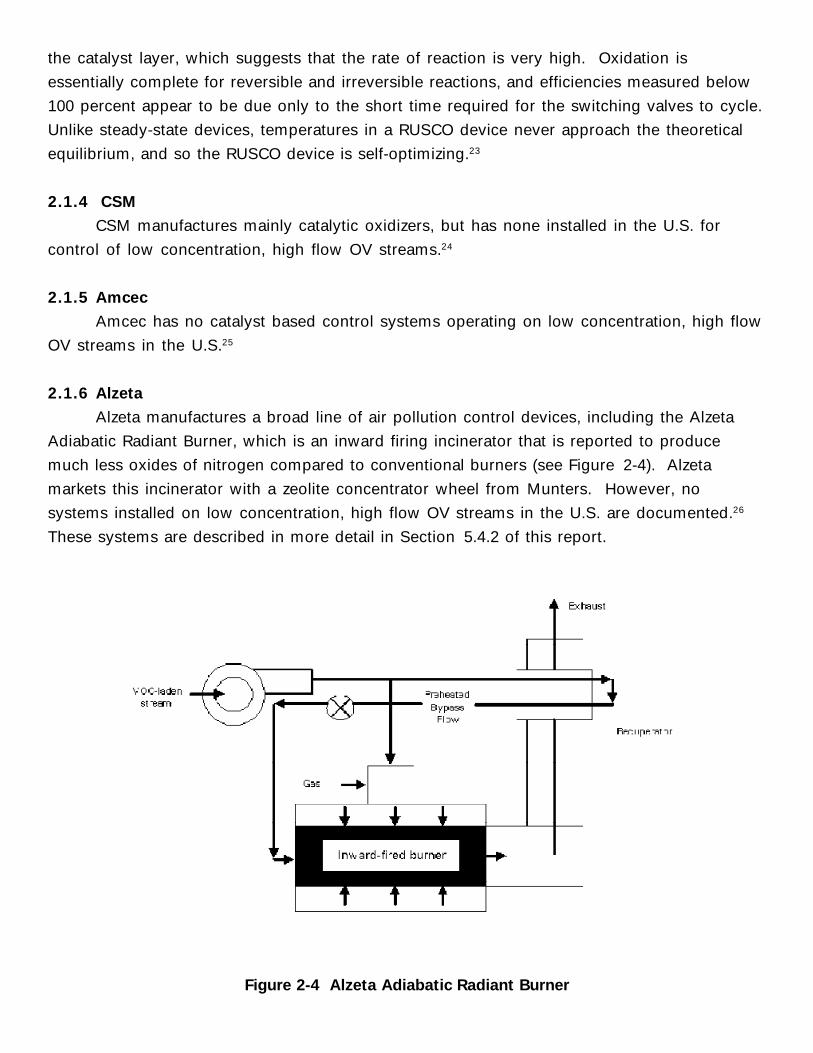
Alzeta manufactures a broad line of air pollution control devices, including the Alzeta
Adiabatic Radiant Burner, which is an inward firing incinerator that is reported to produce
much less oxides of nitrogen compared to conventional burners (see Figure 2-4). Alzeta
markets this incinerator with a zeolite concentrator wheel from Munters. However, no
systems installed on low concentration, high flow OV streams in the U.S. are documented.26
These systems are described in more detail in Section 5.4.2 of this report.
Figure 2-4 Alzeta Adiabatic Radiant Burner
2.1.7 Thermo Electron
Thermo Electron has no control systems operating on low concentration, high flow OV
streams in the U.S.27
2.1.8 Catalytica
Catalytica has no control systems operating on low concentration, high flow OV streams
in the U.S.28
2.1.9 Costs
Costs for catalytic oxidation units were developed using the methodology given in the
OAQPS Control Cost Manual.29 All costs presented here are calculated from factored
estimates and are given in detail in Appendix B. Though several vendors were contacted about
supplying costs, none responded.
Costs were developed for four cases:• 100 ppm benzene,• 10 ppm benzene,• 100 ppm tetrachloroethylene, and• 10 ppm tetrachloroethylene.
All these cases are for continuous streams; other stream conditions are:
• OV in clean air,• 10,000 scfm,• 70 percent relative humidity,• 70 °F inlet temperature, and• 95 percent destruction efficiency.
Assumption for the cost calculations are as follows:
• Catalyst replacement for streams containing benzene is required every 3 years andfor streams containing tetrachloroethylene every 2 years,
• Operating temperature for the benzene-containing gas is 399 °C (750 °F) and forthe tetrachloroethylene-containing gas is 427 °C (800 °F),
• 95 percent overall destruction or removal efficiency,30
• 8,000 h/yr operation,
• 104 h-1 space velocity,
• 10,000 scfm (283,000 L/min), and
• 70 percent heat recovery for the unit.
All other costs (operating and supervisory labor, maintenance costs, and indirects) are
calculated as shown in the OAQPS Control Cost.31 Total capital investment (TCI) is calculated
based on purchased equipment costs (PEC) and 79 percent installation costs.32 PECs are a
function of volumetric throughput (scfm) and percent heat recovery and are given in cost
curves presented in the OAQPS Control Cost Manual.33
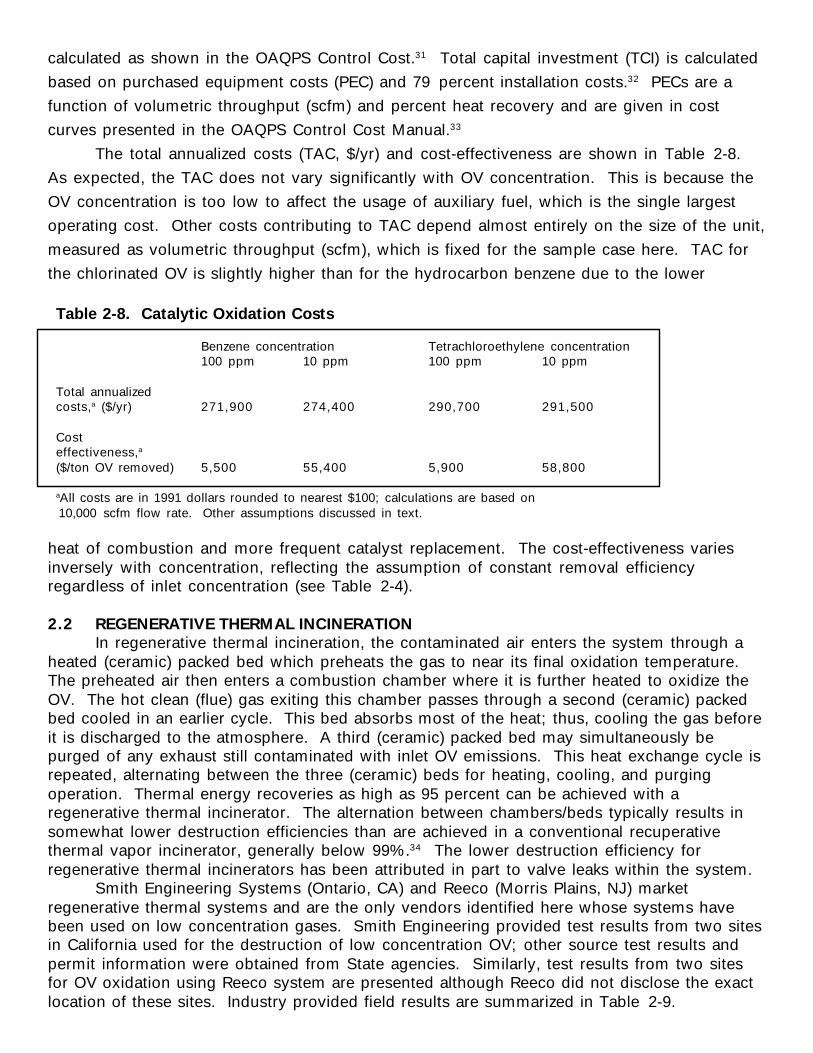
The total annualized costs (TAC, $/yr) and cost-effectiveness are shown in Table 2-8.
As expected, the TAC does not vary significantly with OV concentration. This is because the
OV concentration is too low to affect the usage of auxiliary fuel, which is the single largest
operating cost. Other costs contributing to TAC depend almost entirely on the size of the unit,
measured as volumetric throughput (scfm), which is fixed for the sample case here. TAC for
the chlorinated OV is slightly higher than for the hydrocarbon benzene due to the lower
Table 2-8. Catalytic Oxidation Costs
Benzene concentration Tetrachloroethylene concentration100 ppm 10 ppm 100 ppm 10 ppm
Total annualizedcosts,a ($/yr) 271,900 274,400 290,700 291,500
Costeffectiveness,a
($/ton OV removed) 5,500 55,400 5,900 58,800
aAll costs are in 1991 dollars rounded to nearest $100; calculations are based on 10,000 scfm flow rate. Other assumptions discussed in text.
heat of combustion and more frequent catalyst replacement. The cost-effectiveness variesinversely with concentration, reflecting the assumption of constant removal efficiencyregardless of inlet concentration (see Table 2-4).
2.2 REGENERATIVE THERMAL INCINERATIONIn regenerative thermal incineration, the contaminated air enters the system through a
heated (ceramic) packed bed which preheats the gas to near its final oxidation temperature.The preheated air then enters a combustion chamber where it is further heated to oxidize theOV. The hot clean (flue) gas exiting this chamber passes through a second (ceramic) packedbed cooled in an earlier cycle. This bed absorbs most of the heat; thus, cooling the gas beforeit is discharged to the atmosphere. A third (ceramic) packed bed may simultaneously bepurged of any exhaust still contaminated with inlet OV emissions. This heat exchange cycle isrepeated, alternating between the three (ceramic) beds for heating, cooling, and purgingoperation. Thermal energy recoveries as high as 95 percent can be achieved with aregenerative thermal incinerator. The alternation between chambers/beds typically results insomewhat lower destruction efficiencies than are achieved in a conventional recuperativethermal vapor incinerator, generally below 99%.34 The lower destruction efficiency forregenerative thermal incinerators has been attributed in part to valve leaks within the system.
Smith Engineering Systems (Ontario, CA) and Reeco (Morris Plains, NJ) marketregenerative thermal systems and are the only vendors identified here whose systems havebeen used on low concentration gases. Smith Engineering provided test results from two sitesin California used for the destruction of low concentration OV; other source test results andpermit information were obtained from State agencies. Similarly, test results from two sitesfor OV oxidation using Reeco system are presented although Reeco did not disclose the exactlocation of these sites. Industry provided field results are summarized in Table 2-9.
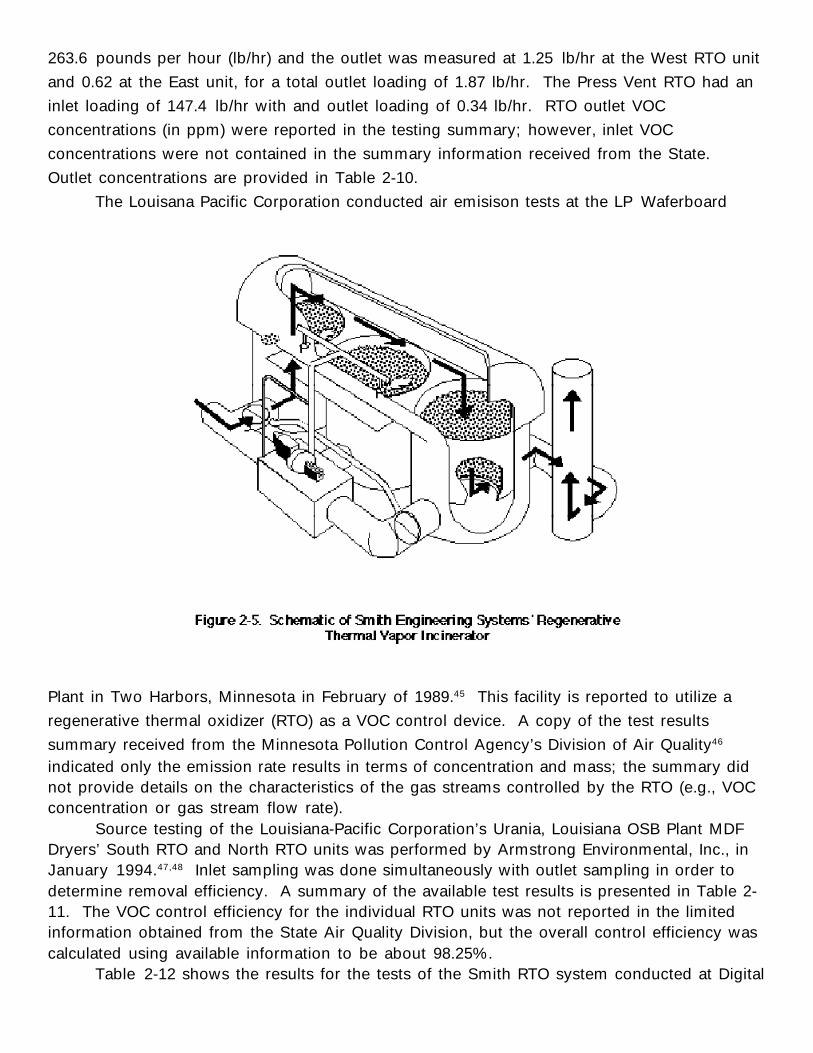
2.2.1 Smith Engineering SystemsSmith Engineering Company (Smith, SEC) manufactures recuperative, regenerative, and
catalytic oxidizers. Figure 2-5 shows the schematic of a regenerative thermal incinerator madeby Smith Engineering Systems (Ontario, CA) to destroy OV from contaminated air.35 Itconsists of three ceramic packed beds that are alternately heated and cooled during the heatexchange cycle. Smith regenerative incinerators have been used at numerous sites for thedestruction of low concentration OV emissions. They have seven regenerative oxidizersinstalled in the U.S. on high flow, low concentration organic vapor streams.36 All are at fiberboard manufacturing facilities owned by Louisiana Pacific. These devices were installedpursuant to orders of consent, and will be permitted at some time in the future.37
2.2.1.1 Source Test DataLouisiana Pacific Corporation (LPC ) in Hanceville, Alabama has 3 Smith regenerative
thermal oxidation (RTO) systems at the facility. Two control emissions from 5 oriented strandboard (OSB) Dryers and 1 unit controls emissions from a process vent. These units weretested for air emissions in June 1994 by Environmental Monitoring Laboratories, Inc. Testingwas performed to determine emissions of particulate matter, volatile organic compounds(VOC), formaldehyde, nitrogen oxides, and carbon monoxide. Testing was simultaneouslyperformed at the RTO inlets and outlets in order to determine removal efficiency. The testreport
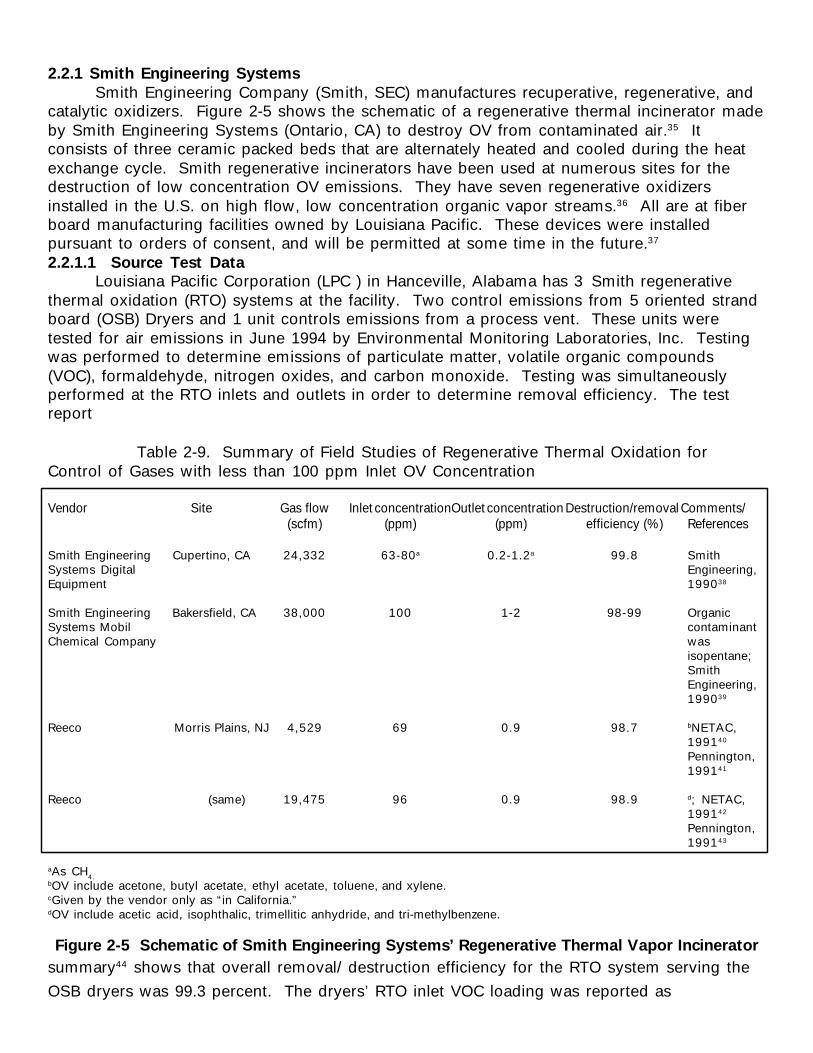
Table 2-9. Summary of Field Studies of Regenerative Thermal Oxidation forControl of Gases with less than 100 ppm Inlet OV Concentration
Vendor Site Gas flow Inlet concentrationOutlet concentration Destruction/removal Comments/(scfm) (ppm) (ppm) efficiency (%) References
Smith Engineering Cupertino, CA 24,332 63-80a 0.2-1.2a 99.8 SmithSystems Digital Engineering,Equipment 199038
Smith Engineering Bakersfield, CA 38,000 100 1-2 98-99 OrganicSystems Mobil contaminantChemical Company was
isopentane;SmithEngineering,199039
Reeco Morris Plains, NJ 4,529 69 0.9 98.7 bNETAC,199140
Pennington,199141
Reeco (same) 19,475 96 0.9 98.9 d; NETAC,199142
Pennington,199143
aAs CH4.bOV include acetone, butyl acetate, ethyl acetate, toluene, and xylene.cGiven by the vendor only as “in California.”dOV include acetic acid, isophthalic, trimellitic anhydride, and tri-methylbenzene.
Figure 2-5 Schematic of Smith Engineering Systems’ Regenerative Thermal Vapor Incineratorsummary44 shows that overall removal/ destruction efficiency for the RTO system serving the
OSB dryers was 99.3 percent. The dryers’ RTO inlet VOC loading was reported as
263.6 pounds per hour (lb/hr) and the outlet was measured at 1.25 lb/hr at the West RTO unit
and 0.62 at the East unit, for a total outlet loading of 1.87 lb/hr. The Press Vent RTO had an
inlet loading of 147.4 lb/hr with and outlet loading of 0.34 lb/hr. RTO outlet VOC
concentrations (in ppm) were reported in the testing summary; however, inlet VOC
concentrations were not contained in the summary information received from the State.
Outlet concentrations are provided in Table 2-10.
The Louisana Pacific Corporation conducted air emisison tests at the LP Waferboard
Plant in Two Harbors, Minnesota in February of 1989.45 This facility is reported to utilize a
regenerative thermal oxidizer (RTO) as a VOC control device. A copy of the test results
summary received from the Minnesota Pollution Control Agency’s Division of Air Quality46
indicated only the emission rate results in terms of concentration and mass; the summary didnot provide details on the characteristics of the gas streams controlled by the RTO (e.g., VOCconcentration or gas stream flow rate).
Source testing of the Louisiana-Pacific Corporation’s Urania, Louisiana OSB Plant MDFDryers’ South RTO and North RTO units was performed by Armstrong Environmental, Inc., inJanuary 1994.47,48 Inlet sampling was done simultaneously with outlet sampling in order todetermine removal efficiency. A summary of the available test results is presented in Table 2-11. The VOC control efficiency for the individual RTO units was not reported in the limitedinformation obtained from the State Air Quality Division, but the overall control efficiency wascalculated using available information to be about 98.25%.
Table 2-12 shows the results for the tests of the Smith RTO system conducted at Digital
Equipment Corporation, Cupertino, CA.49 In all four tests, the overall destruction efficiencywas above 98 percent. The feed stream contained a mixture of several OV.
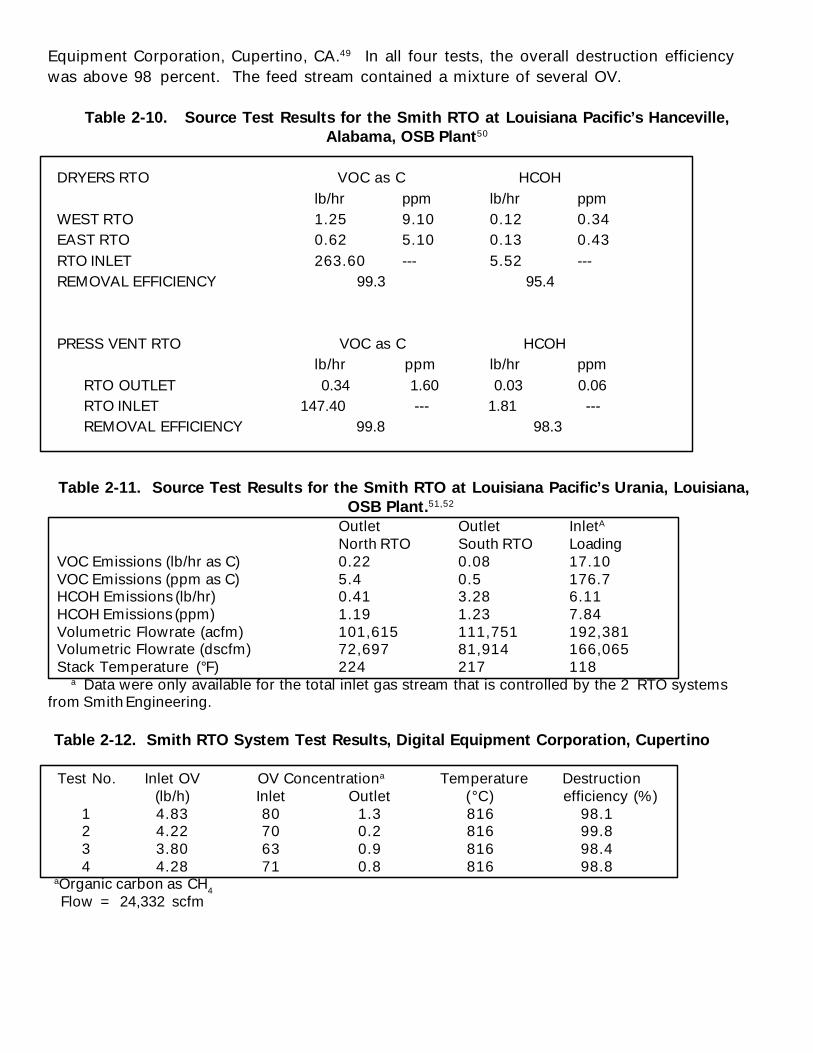
Table 2-10. Source Test Results for the Smith RTO at Louisiana Pacific’s Hanceville,Alabama, OSB Plant50
DRYERS RTO VOC as C HCOHlb/hr ppm lb/hr ppm
WEST RTO 1.25 9.10 0.12 0.34EAST RTO 0.62 5.10 0.13 0.43RTO INLET 263.60 --- 5.52 ---REMOVAL EFFICIENCY 99.3 95.4
PRESS VENT RTO VOC as C HCOHlb/hr ppm lb/hr ppm
RTO OUTLET 0.34 1.60 0.03 0.06RTO INLET 147.40 --- 1.81 ---REMOVAL EFFICIENCY 99.8 98.3
Table 2-11. Source Test Results for the Smith RTO at Louisiana Pacific’s Urania, Louisiana,OSB Plant.51,52
Outlet Outlet InletA
North RTO South RTO LoadingVOC Emissions (lb/hr as C) 0.22 0.08 17.10VOC Emissions (ppm as C) 5.4 0.5 176.7HCOH Emissions (lb/hr) 0.41 3.28 6.11HCOH Emissions (ppm) 1.19 1.23 7.84Volumetric Flowrate (acfm) 101,615 111,751 192,381Volumetric Flowrate (dscfm) 72,697 81,914 166,065Stack Temperature (°F) 224 217 118
a Data were only available for the total inlet gas stream that is controlled by the 2 RTO systemsfrom Smith Engineering.
Table 2-12. Smith RTO System Test Results, Digital Equipment Corporation, Cupertino
Test No. Inlet OV OV Concentrationa Temperature Destruction(lb/h) Inlet Outlet (°C) efficiency (%)
1 4.83 80 1.3 816 98.12 4.22 70 0.2 816 99.83 3.80 63 0.9 816 98.44 4.28 71 0.8 816 98.8
aOrganic carbon as CH4
Flow = 24,332 scfm
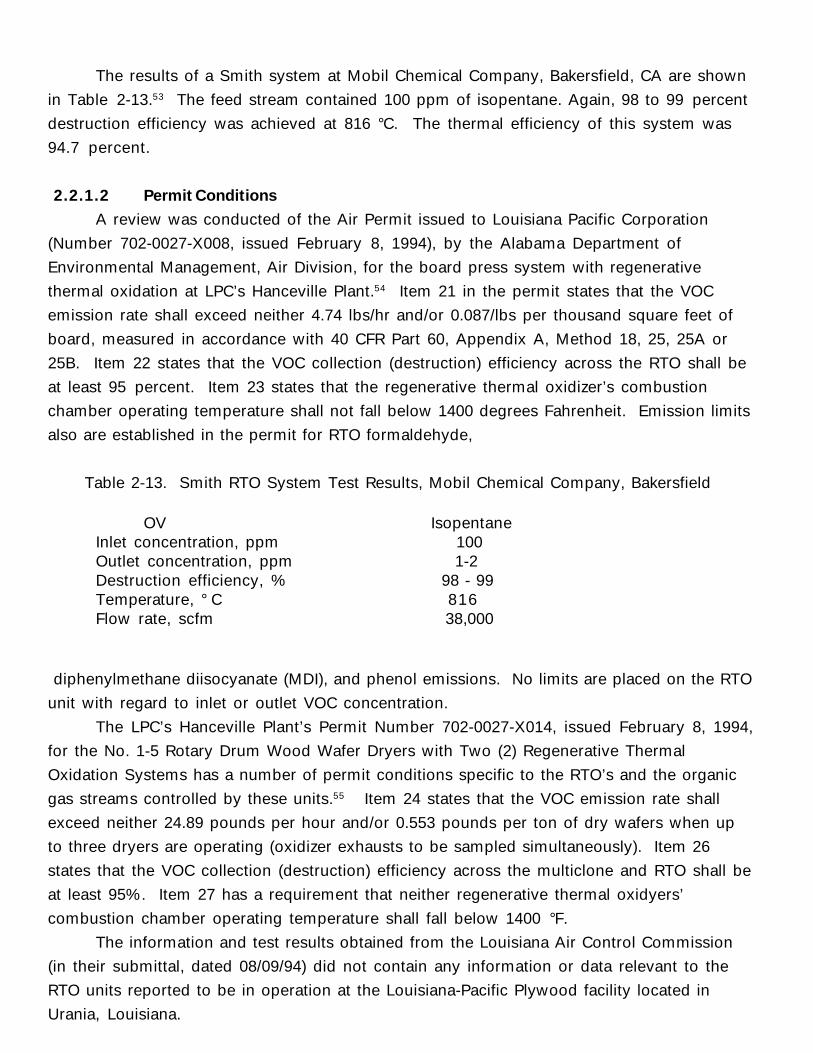
The results of a Smith system at Mobil Chemical Company, Bakersfield, CA are shown
in Table 2-13.53 The feed stream contained 100 ppm of isopentane. Again, 98 to 99 percent
destruction efficiency was achieved at 816 °C. The thermal efficiency of this system was
94.7 percent.
2.2.1.2 Permit Conditions
A review was conducted of the Air Permit issued to Louisiana Pacific Corporation
(Number 702-0027-X008, issued February 8, 1994), by the Alabama Department of
Environmental Management, Air Division, for the board press system with regenerative
thermal oxidation at LPC’s Hanceville Plant.54 Item 21 in the permit states that the VOC
emission rate shall exceed neither 4.74 lbs/hr and/or 0.087/lbs per thousand square feet of
board, measured in accordance with 40 CFR Part 60, Appendix A, Method 18, 25, 25A or
25B. Item 22 states that the VOC collection (destruction) efficiency across the RTO shall be
at least 95 percent. Item 23 states that the regenerative thermal oxidizer’s combustion
chamber operating temperature shall not fall below 1400 degrees Fahrenheit. Emission limits
also are established in the permit for RTO formaldehyde,
Table 2-13. Smith RTO System Test Results, Mobil Chemical Company, Bakersfield
OV IsopentaneInlet concentration, ppm 100Outlet concentration, ppm 1-2Destruction efficiency, % 98 - 99Temperature, ° C 816Flow rate, scfm 38,000
diphenylmethane diisocyanate (MDI), and phenol emissions. No limits are placed on the RTO
unit with regard to inlet or outlet VOC concentration.
The LPC’s Hanceville Plant’s Permit Number 702-0027-X014, issued February 8, 1994,
for the No. 1-5 Rotary Drum Wood Wafer Dryers with Two (2) Regenerative Thermal
Oxidation Systems has a number of permit conditions specific to the RTO’s and the organic
gas streams controlled by these units.55 Item 24 states that the VOC emission rate shall
exceed neither 24.89 pounds per hour and/or 0.553 pounds per ton of dry wafers when up
to three dryers are operating (oxidizer exhausts to be sampled simultaneously). Item 26
states that the VOC collection (destruction) efficiency across the multiclone and RTO shall be
at least 95%. Item 27 has a requirement that neither regenerative thermal oxidyers’
combustion chamber operating temperature shall fall below 1400 °F.
The information and test results obtained from the Louisiana Air Control Commission
(in their submittal, dated 08/09/94) did not contain any information or data relevant to the
RTO units reported to be in operation at the Louisiana-Pacific Plywood facility located in
Urania, Louisiana.
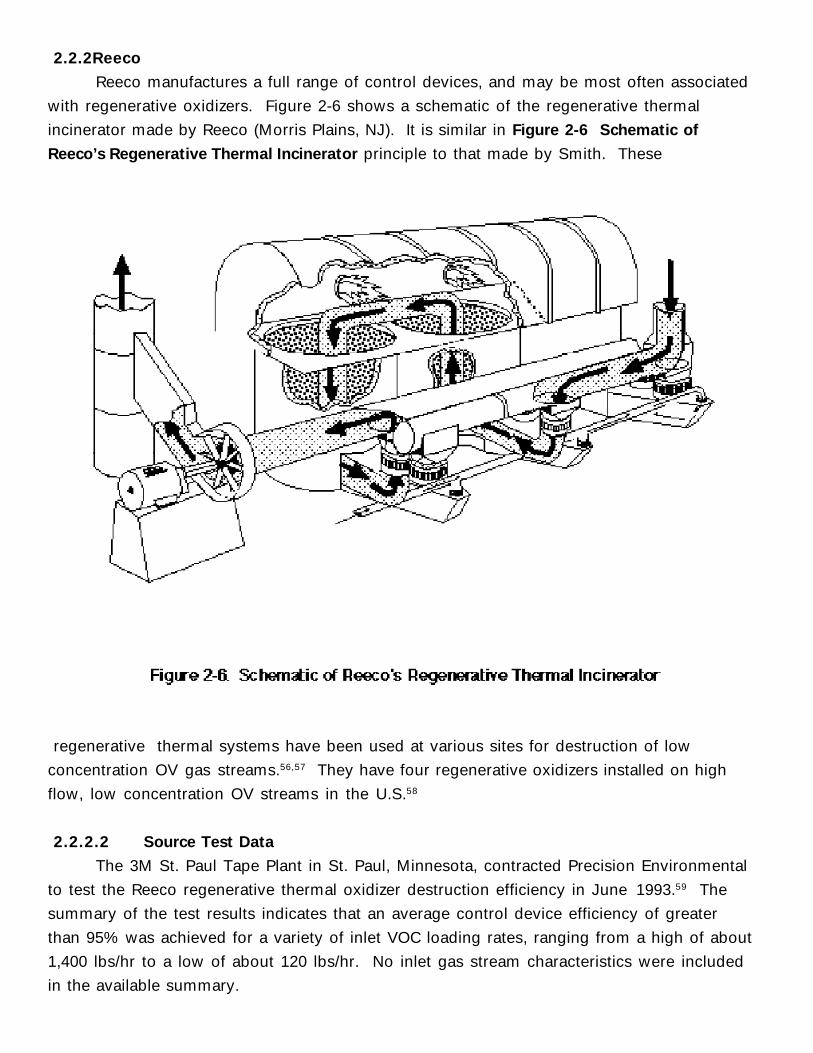
2.2.2Reeco
Reeco manufactures a full range of control devices, and may be most often associated
with regenerative oxidizers. Figure 2-6 shows a schematic of the regenerative thermal
incinerator made by Reeco (Morris Plains, NJ). It is similar in Figure 2-6 Schematic of
Reeco’s Regenerative Thermal Incinerator principle to that made by Smith. These
regenerative thermal systems have been used at various sites for destruction of low
concentration OV gas streams.56,57 They have four regenerative oxidizers installed on high
flow, low concentration OV streams in the U.S.58
2.2.2.2 Source Test Data
The 3M St. Paul Tape Plant in St. Paul, Minnesota, contracted Precision Environmental
to test the Reeco regenerative thermal oxidizer destruction efficiency in June 1993.59 The
summary of the test results indicates that an average control device efficiency of greater
than 95% was achieved for a variety of inlet VOC loading rates, ranging from a high of about
1,400 lbs/hr to a low of about 120 lbs/hr. No inlet gas stream characteristics were included
in the available summary.
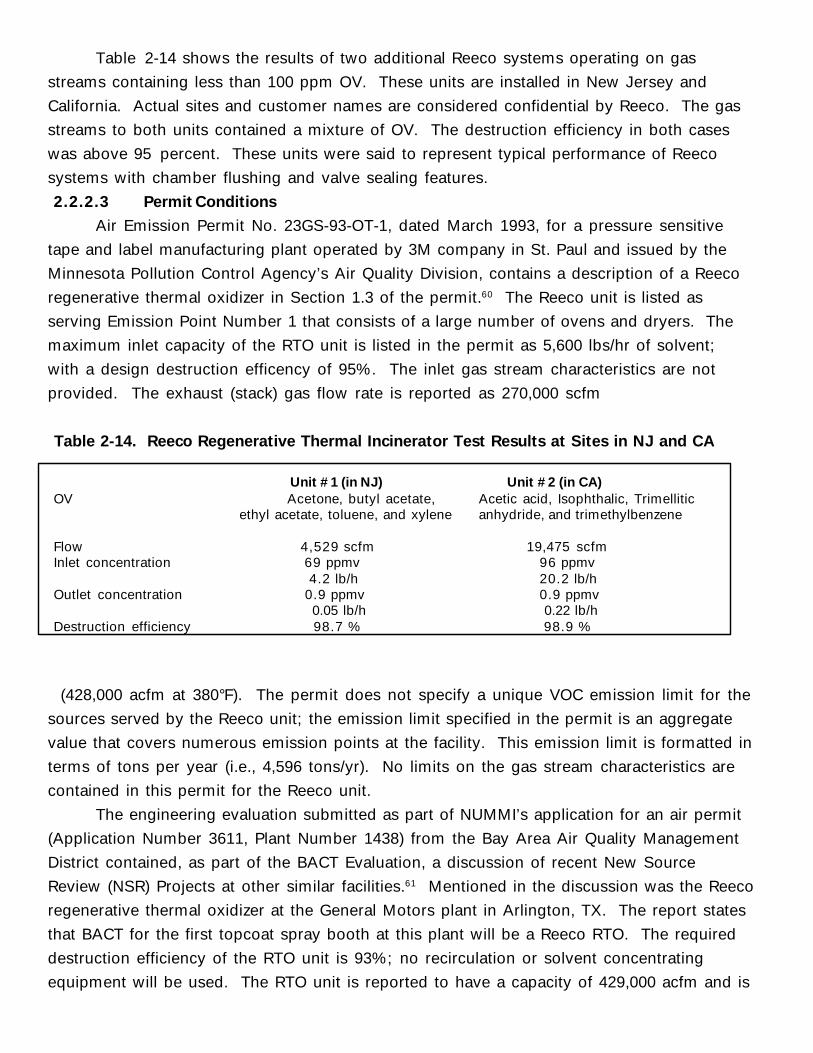
Table 2-14 shows the results of two additional Reeco systems operating on gas
streams containing less than 100 ppm OV. These units are installed in New Jersey and
California. Actual sites and customer names are considered confidential by Reeco. The gas
streams to both units contained a mixture of OV. The destruction efficiency in both cases
was above 95 percent. These units were said to represent typical performance of Reeco
systems with chamber flushing and valve sealing features.
2.2.2.3 Permit Conditions
Air Emission Permit No. 23GS-93-OT-1, dated March 1993, for a pressure sensitive
tape and label manufacturing plant operated by 3M company in St. Paul and issued by the
Minnesota Pollution Control Agency’s Air Quality Division, contains a description of a Reeco
regenerative thermal oxidizer in Section 1.3 of the permit.60 The Reeco unit is listed as
serving Emission Point Number 1 that consists of a large number of ovens and dryers. The
maximum inlet capacity of the RTO unit is listed in the permit as 5,600 lbs/hr of solvent;
with a design destruction efficency of 95%. The inlet gas stream characteristics are not
provided. The exhaust (stack) gas flow rate is reported as 270,000 scfm
Table 2-14. Reeco Regenerative Thermal Incinerator Test Results at Sites in NJ and CA
Unit #1 (in NJ) Unit #2 (in CA)OV Acetone, butyl acetate, Acetic acid, Isophthalic, Trimellitic
ethyl acetate, toluene, and xylene anhydride, and trimethylbenzene
Flow 4,529 scfm 19,475 scfmInlet concentration 69 ppmv 96 ppmv
4.2 lb/h 20.2 lb/hOutlet concentration 0.9 ppmv 0.9 ppmv
0.05 lb/h 0.22 lb/hDestruction efficiency 98.7 % 98.9 %
(428,000 acfm at 380°F). The permit does not specify a unique VOC emission limit for the
sources served by the Reeco unit; the emission limit specified in the permit is an aggregate
value that covers numerous emission points at the facility. This emission limit is formatted in
terms of tons per year (i.e., 4,596 tons/yr). No limits on the gas stream characteristics are
contained in this permit for the Reeco unit.
The engineering evaluation submitted as part of NUMMI’s application for an air permit
(Application Number 3611, Plant Number 1438) from the Bay Area Air Quality Management
District contained, as part of the BACT Evaluation, a discussion of recent New Source
Review (NSR) Projects at other similar facilities.61 Mentioned in the discussion was the Reeco
regenerative thermal oxidizer at the General Motors plant in Arlington, TX. The report states
that BACT for the first topcoat spray booth at this plant will be a Reeco RTO. The required
destruction efficiency of the RTO unit is 93%; no recirculation or solvent concentrating
equipment will be used. The RTO unit is reported to have a capacity of 429,000 acfm and is
an existing unit installed on the previous topcoat spray booth to meet RACT requirements.
2.2.3Other Manufacturers
Regenerative thermal oxidizers, such as those made by Dürr, Huntington, and
Eisenmann, are not discussed in any detail in this document even though this technology has
recently undergone considerable development. In principle, these systems, which are similar
in design to the regenerative thermal oxidizer systems previous described, will oxidize low
concentration gases; Somary (1993)62 claims that the Eisenmann regenerative thermal
oxidizer can be used for concentrations as low as 100 ppm, although there are apparently no
such field installations.
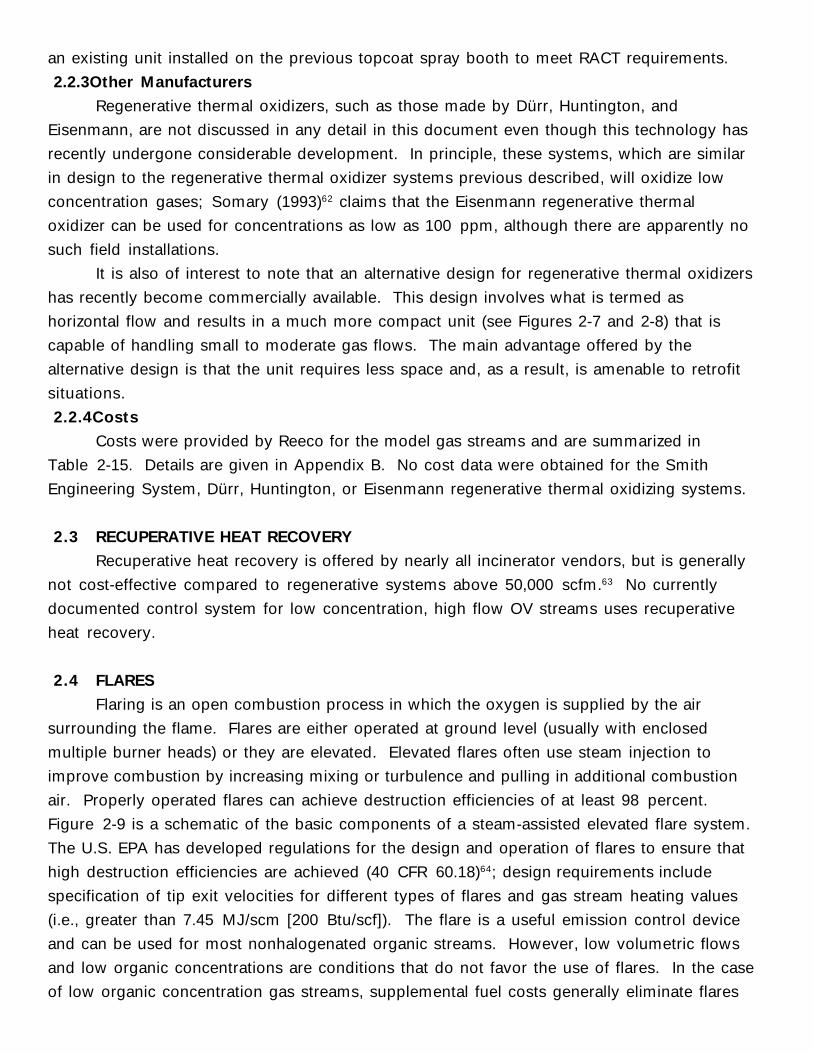
It is also of interest to note that an alternative design for regenerative thermal oxidizers
has recently become commercially available. This design involves what is termed as
horizontal flow and results in a much more compact unit (see Figures 2-7 and 2-8) that is
capable of handling small to moderate gas flows. The main advantage offered by the
alternative design is that the unit requires less space and, as a result, is amenable to retrofit
situations.
2.2.4Costs
Costs were provided by Reeco for the model gas streams and are summarized in
Table 2-15. Details are given in Appendix B. No cost data were obtained for the Smith
Engineering System, Dürr, Huntington, or Eisenmann regenerative thermal oxidizing systems.
2.3 RECUPERATIVE HEAT RECOVERY
Recuperative heat recovery is offered by nearly all incinerator vendors, but is generally
not cost-effective compared to regenerative systems above 50,000 scfm.63 No currently
documented control system for low concentration, high flow OV streams uses recuperative
heat recovery.
2.4 FLARES
Flaring is an open combustion process in which the oxygen is supplied by the air
surrounding the flame. Flares are either operated at ground level (usually with enclosed
multiple burner heads) or they are elevated. Elevated flares often use steam injection to
improve combustion by increasing mixing or turbulence and pulling in additional combustion
air. Properly operated flares can achieve destruction efficiencies of at least 98 percent.
Figure 2-9 is a schematic of the basic components of a steam-assisted elevated flare system.
The U.S. EPA has developed regulations for the design and operation of flares to ensure that
high destruction efficiencies are achieved (40 CFR 60.18)64; design requirements include
specification of tip exit velocities for different types of flares and gas stream heating values
(i.e., greater than 7.45 MJ/scm [200 Btu/scf]). The flare is a useful emission control device
and can be used for most nonhalogenated organic streams. However, low volumetric flows
and low organic concentrations are conditions that do not favor the use of flares. In the case
of low organic concentration gas streams, supplemental fuel costs generally eliminate flares
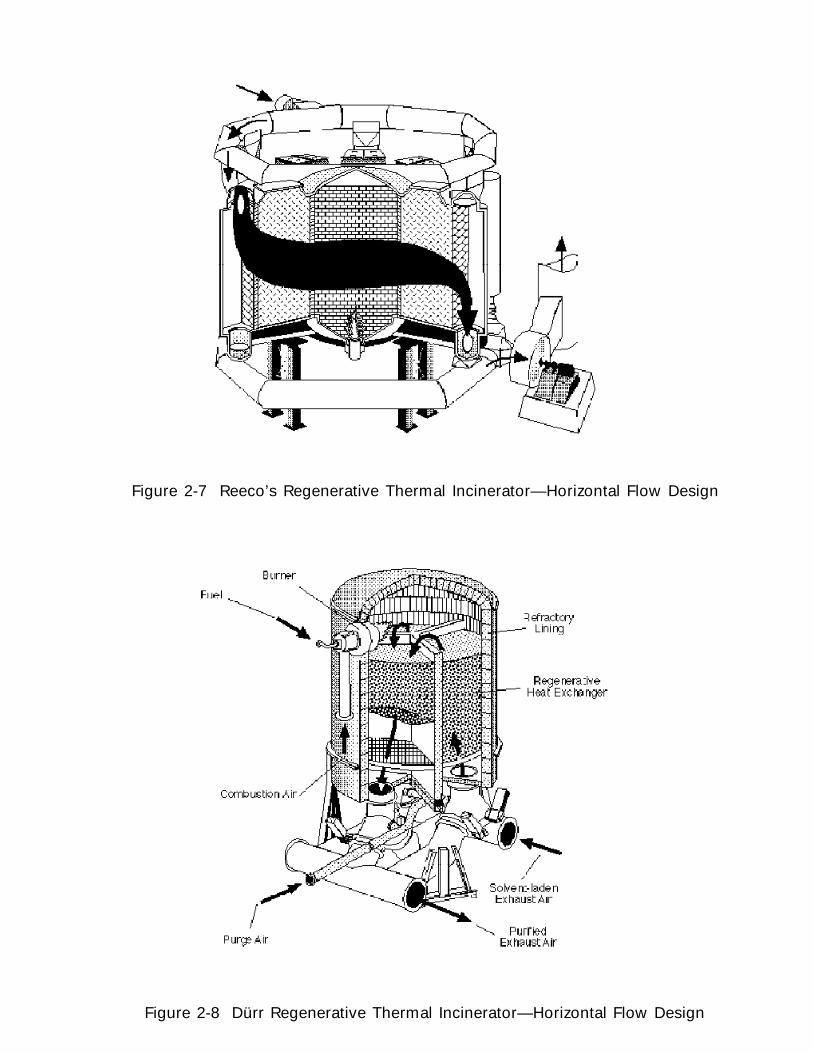
Figure 2-7 Reeco’s Regenerative Thermal Incinerator—Horizontal Flow Design
Figure 2-8 Dürr Regenerative Thermal Incinerator—Horizontal Flow Design
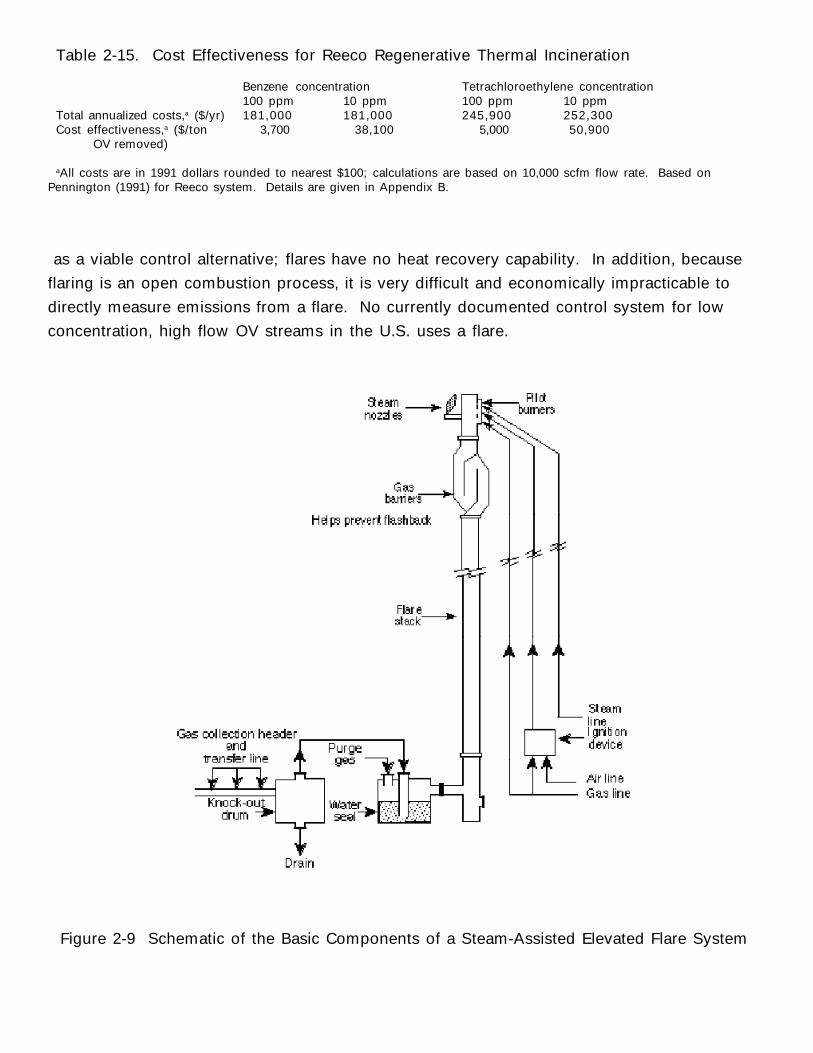
Table 2-15. Cost Effectiveness for Reeco Regenerative Thermal Incineration
Benzene concentration Tetrachloroethylene concentration100 ppm 10 ppm 100 ppm 10 ppm
Total annualized costs,a ($/yr) 181,000 181,000 245,900 252,300Cost effectiveness,a ($/ton 3,700 38,100 5,000 50,900 OV removed)
aAll costs are in 1991 dollars rounded to nearest $100; calculations are based on 10,000 scfm flow rate. Based onPennington (1991) for Reeco system. Details are given in Appendix B.
as a viable control alternative; flares have no heat recovery capability. In addition, because
flaring is an open combustion process, it is very difficult and economically impracticable to
directly measure emissions from a flare. No currently documented control system for low
concentration, high flow OV streams in the U.S. uses a flare.
Figure 2-9 Schematic of the Basic Components of a Steam-Assisted Elevated Flare System
2.5 BOILERS AND PROCESS HEATERS
Boilers, process heaters, and other existing combustion devices can be used as control
devices to limit organic emissions by incorporating the vent stream into the inlet fuel or
injection through a separate burner, or by feeding the stream into the boiler or process
heater, etc., as combustion air. Where applicable, use of existing combustion devices can
achieve high destruction efficiencies for organic emissions at a reasonable cost.65
The parameters that affect the thermal efficiency of a boiler or process heater are the
same parameters that affect the efficiency of these units when they function as air pollution
control devices. These are combustion temperature, residence time, inlet organic
concentration, compound type, and flow regime (i.e., mixing). A series of U.S. EPA-
sponsored studies of organic vapor destruction efficiencies for industrial boilers and process
heaters have been conducted.66 The results of these tests showed 98 to 99 percent overall
destruction efficiencies for OV; however, none of the tests involved low-concentration (i.e.,
less than 100 ppm) organic gas streams. No currently documented control system for low
concentration, high flow OV streams in the U.S. using boilers or process heaters was
identified.
SECTION 3ADSORPTION
Adsorption is one of the most widely applied control technologies for organic vapors
(OV). In the adsorption process, organics are selectively collected on the surface of a porous
solid. Activated carbon is by far the adsorbent most often used for low organic gas
concentrations because of its low cost and relative insensitivity to water vapor at relative
humidities below about 50 percent.67 Other common adsorption media include silica and
alumina-based adsorbates. In addition, recently developed hydrophobic zeolites have been
incorporated into systems which, in principle, are similar to those based on carbon. The basic
principles of adsorption for separation of gas mixtures are described in a number of texts and
are not discussed here.68,69,70 Because adsorption processes simply separate the contaminant
(OV) from the gas stream, adsorption processes must be used in conjunction with other unit
operations to recover or destroy OV.
The carbon adsorption capacity for organics is affected by the concentration of organics
in the gas stream. Carbon manufacturers generally have equilibrium data for specific
compounds and their specific carbon types. For virtually any adsorbate, the adsorption
capacity is enhanced by lower operating temperatures and higher organic concentrations. As
the concentration of an organic constituent in the gas stream decreases, it becomes more
difficult to adsorb the constituent on activated carbon. In theory, activated carbon can be
tailor-made to remove pollutants at very low organic concentrations. However, a carbon
adsorption system designed to achieve a 95 percent control efficiency for a given organic
present at 1,000 ppm may not achieve a 95 percent control efficiency for the same
constituent present at a lower concentration, e.g., 10 ppm.
Carbon adsorbers are essentially constant outlet concentration devices; prior to
breakthrough, outlet concentration generally remains constant through an adsorption cycle
even though the inlet concentration may vary more than an order of magnitude.71 Inlet
concentrations are typically limited by the adsorption capacity of the carbon bed or by safety
problems. The maximum practical inlet concentration is usually about 10,000 ppm. Outlet
concentrations around 50 ppm can be routinely achieved with state-of-the-art systems;
concentrations as low as 5 to 10 ppm can be achieved with some compounds.72 For organic
concentrations above 100 ppm, carbon absorbers can achieve control efficiencies of at least
95 percent, and control levels of 97 to 99 percent have been demonstrated in many
applications. Theoretically, fresh activated carbon should remove nearly all organics from an
air stream containing organics at concentrations of 100 ppm and less; but performance data,
which are quite limited, indicate that high removal efficiencies are not attained in a significant
number of cases handling these low organic concentration.73,74,75 The reasons for the low
removal efficiencies have not been clearly established.
There are two types of adsorption systems that can be used for removal of OV from gas
streams. These are nonregenerable (e.g., carbon canisters) and regenerable (e.g., fixed bed
systems).
3.1 NONREGENERABLE ADSORPTION SYSTEMS
3.1.1 Principle of Operation
These systems typically consist of one or two fixed beds of adsorbent (e.g., granular
carbon). The OV-containing gas flows upward through one bed. The OV is adsorbed over a
period of time until breakthrough occurs. In practice, the outlet gas stream is seldom
monitored to determine this breakthrough point, though regulatory compliance requirements
are changing this.76 In most cases, the bed is simply replaced on a time schedule determined
by calculating the bed life from the inlet concentration and the working capacity of the carbon
bed. Once breakthrough occurs, the carbon is returned for reactivation to the vendor or a
central reactivation facility, at which point other emissions may be generated during the
reactivation process.
In principle, nonregenerable systems are simple and find many applications in cases
where the flow rate and/or OV concentration is low. Table 3-1 summarizes the performance
of nonregenerable adsorption system at sites treating inlet gases containing less than 100 ppm
OV. Nonregenerable adsorption systems are especially attractive if, in addition, the OV is
difficult to desorb. These applications include odor control and control of indoor air. As a
guideline for their use, Stenzel and Bourdeau state that nonregenerable systems are
economically feasible when the carbon life is expected to exceed 3 months.77
An example of such a system is the Verona Well Field site, at which two 314 ft3 carbon
beds are used to control 5,350 cfm offgas from an air stripper.78,79 The total concentration of
the inlet gas to the carbon bed is shown in Table 3-2. Assuming 5 wt% working capacity of
the carbon before breakthrough,80 it can be shown that this bed will last 257 days of
continuous use.
It is important to note that at concentrations approaching 100 ppm and above, the
capacity of nonregenerable systems may not be sufficient to remain on line for a reasonable
time. In the above example, for instance, a 100 ppm inlet concentration would require
replacement every 2.6 days. No currently documented control system for low concentration,
high flow OV streams in the U.S. uses nonregenerable adsorption systems.
3.2 REGENERABLE FIXED BED ADSORPTION SYSTEMS
3.2.1 Principle of Operation
A fixed-bed regenerable system consists of two or more vessels, each containing
adsorbent. Figure 3-1 shows a general flow scheme.81 One vessel is on line while a second is
being regenerated, usually with low pressure
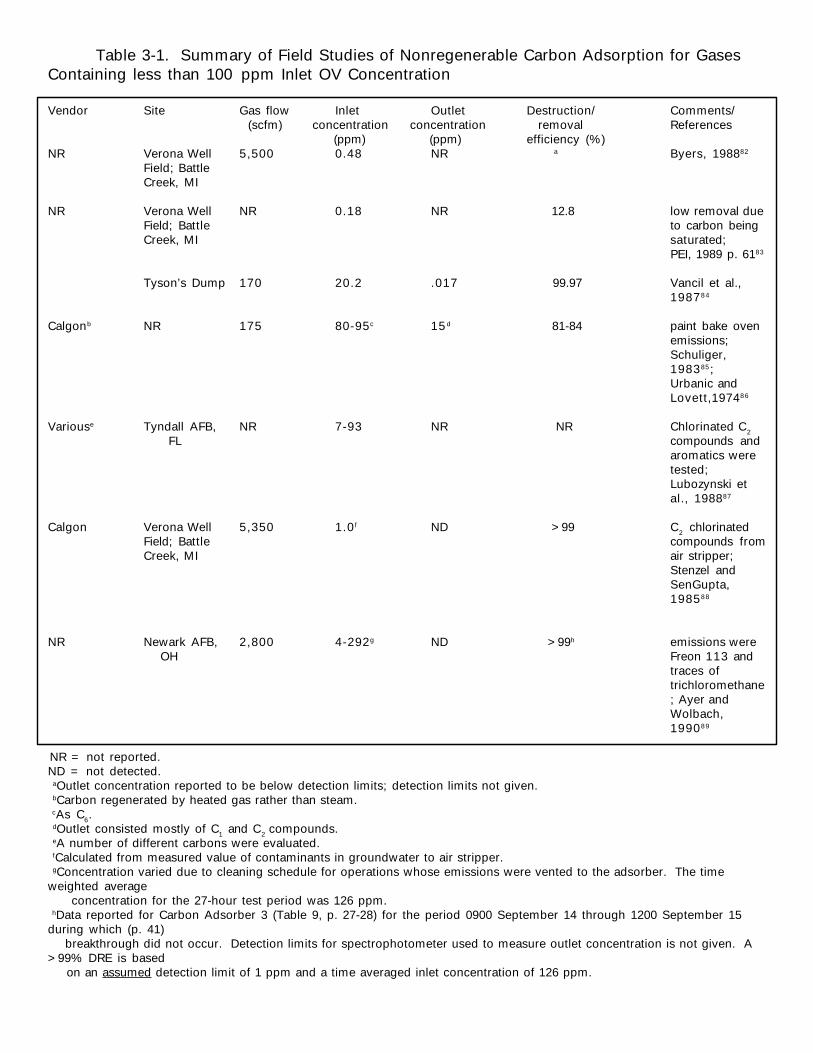
Table 3-1. Summary of Field Studies of Nonregenerable Carbon Adsorption for GasesContaining less than 100 ppm Inlet OV Concentration
Vendor Site Gas flow Inlet Outlet Destruction/ Comments/ (scfm) concentration concentration removal References
(ppm) (ppm) efficiency (%)NR Verona Well 5,500 0.48 NR a Byers, 198882
Field; BattleCreek, MI
NR Verona Well NR 0.18 NR 12.8 low removal dueField; Battle to carbon beingCreek, MI saturated;
PEI, 1989 p. 6183
Tyson’s Dump 170 20.2 .017 99.97 Vancil et al.,198784
Calgonb NR 175 80-95c 15 d 81-84 paint bake ovenemissions;Schuliger,198385;Urbanic andLovett,197486
Variouse Tyndall AFB, NR 7-93 NR NR Chlorinated C2
FL compounds andaromatics weretested;Lubozynski etal., 198887
Calgon Verona Well 5,350 1.0 f ND >99 C2 chlorinatedField; Battle compounds fromCreek, MI air stripper;
Stenzel andSenGupta,198588
NR Newark AFB, 2,800 4-292g ND >99h emissions were OH Freon 113 and
traces oftrichloromethane; Ayer andWolbach,199089
NR = not reported.ND = not detected. aOutlet concentration reported to be below detection limits; detection limits not given. bCarbon regenerated by heated gas rather than steam. cAs C6. dOutlet consisted mostly of C1 and C2 compounds. eA number of different carbons were evaluated. fCalculated from measured value of contaminants in groundwater to air stripper. gConcentration varied due to cleaning schedule for operations whose emissions were vented to the adsorber. The timeweighted average concentration for the 27-hour test period was 126 ppm. hData reported for Carbon Adsorber 3 (Table 9, p. 27-28) for the period 0900 September 14 through 1200 September 15during which (p. 41) breakthrough did not occur. Detection limits for spectrophotometer used to measure outlet concentration is not given. A>99% DRE is based on an assumed detection limit of 1 ppm and a time averaged inlet concentration of 126 ppm.
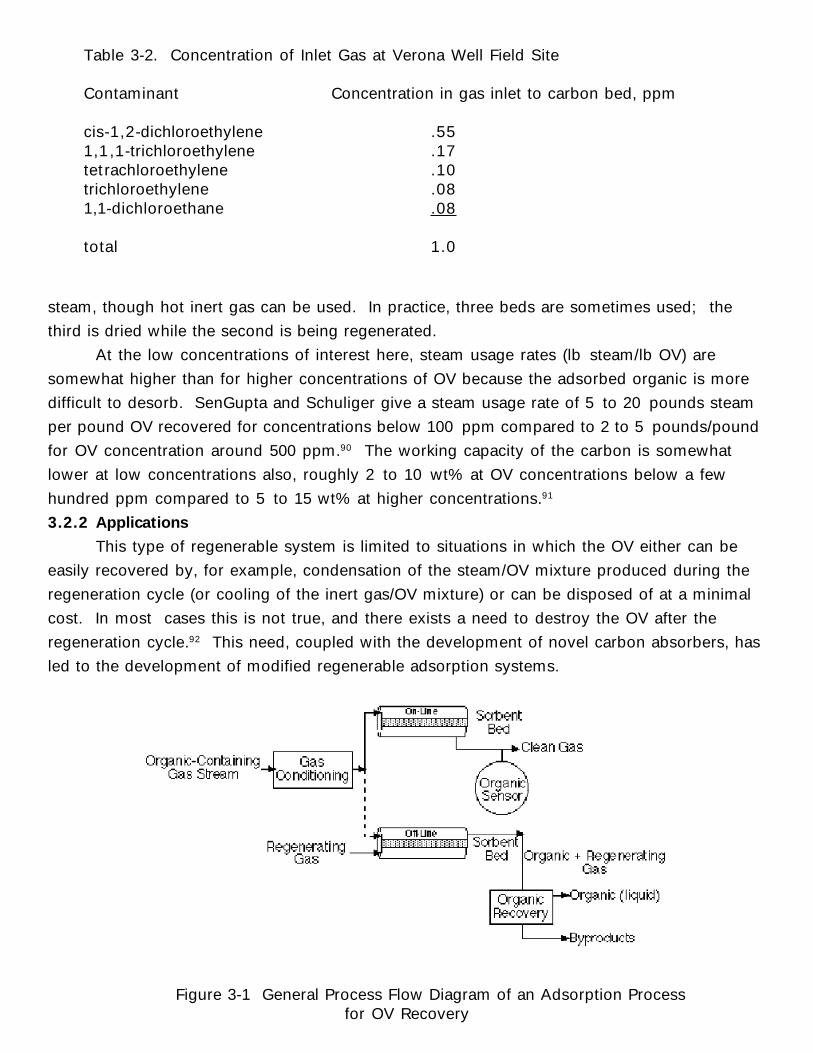
Table 3-2. Concentration of Inlet Gas at Verona Well Field Site
Contaminant Concentration in gas inlet to carbon bed, ppm
cis-1,2-dichloroethylene .551,1 ,1-trichloroethylene .17tetrachloroethylene .10trichloroethylene .081,1-dichloroethane .08
total 1.0
steam, though hot inert gas can be used. In practice, three beds are sometimes used; the
third is dried while the second is being regenerated.
At the low concentrations of interest here, steam usage rates (lb steam/lb OV) are
somewhat higher than for higher concentrations of OV because the adsorbed organic is more
difficult to desorb. SenGupta and Schuliger give a steam usage rate of 5 to 20 pounds steam
per pound OV recovered for concentrations below 100 ppm compared to 2 to 5 pounds/pound
for OV concentration around 500 ppm.90 The working capacity of the carbon is somewhat
lower at low concentrations also, roughly 2 to 10 wt% at OV concentrations below a few
hundred ppm compared to 5 to 15 wt% at higher concentrations.91
3.2.2 Applications
This type of regenerable system is limited to situations in which the OV either can be
easily recovered by, for example, condensation of the steam/OV mixture produced during the
regeneration cycle (or cooling of the inert gas/OV mixture) or can be disposed of at a minimal
cost. In most cases this is not true, and there exists a need to destroy the OV after the
regeneration cycle.92 This need, coupled with the development of novel carbon absorbers, has
led to the development of modified regenerable adsorption systems.
Figure 3-1 General Process Flow Diagram of an Adsorption Processfor OV Recovery
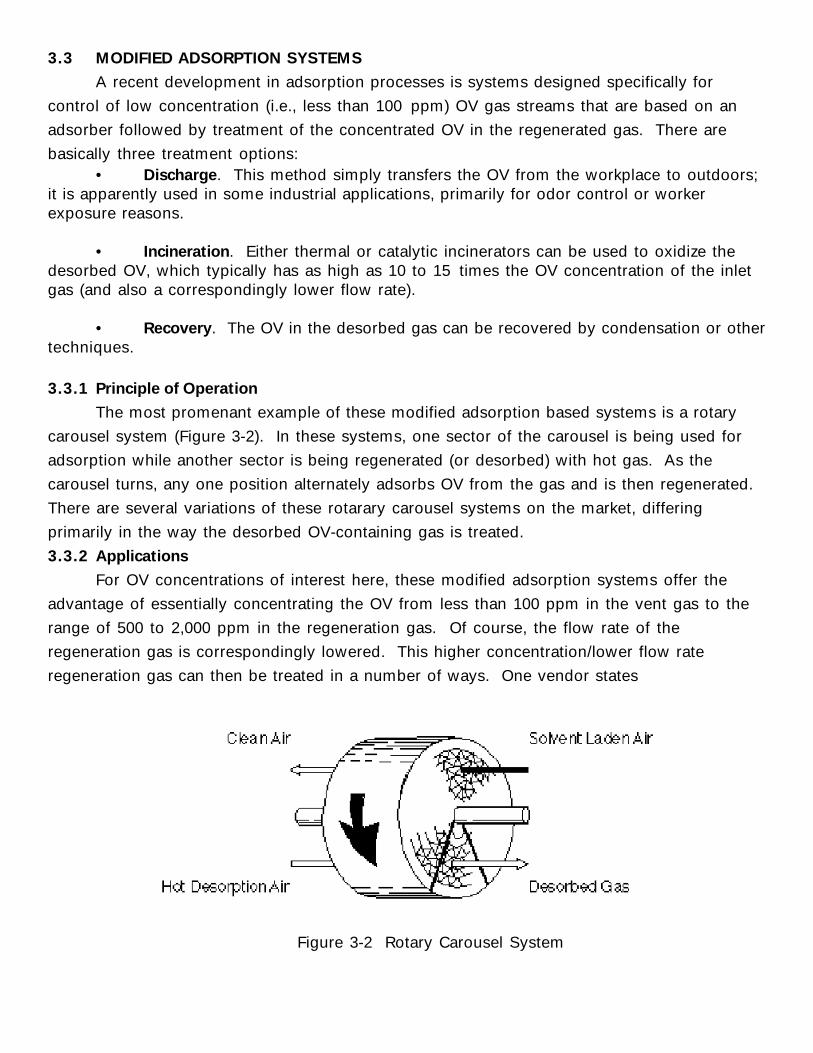
3.3 MODIFIED ADSORPTION SYSTEMS
A recent development in adsorption processes is systems designed specifically for
control of low concentration (i.e., less than 100 ppm) OV gas streams that are based on an
adsorber followed by treatment of the concentrated OV in the regenerated gas. There are
basically three treatment options:• Discharge. This method simply transfers the OV from the workplace to outdoors;
it is apparently used in some industrial applications, primarily for odor control or workerexposure reasons.
• Incineration. Either thermal or catalytic incinerators can be used to oxidize thedesorbed OV, which typically has as high as 10 to 15 times the OV concentration of the inletgas (and also a correspondingly lower flow rate).
• Recovery. The OV in the desorbed gas can be recovered by condensation or othertechniques.
3.3.1 Principle of Operation
The most promenant example of these modified adsorption based systems is a rotary
carousel system (Figure 3-2). In these systems, one sector of the carousel is being used for
adsorption while another sector is being regenerated (or desorbed) with hot gas. As the
carousel turns, any one position alternately adsorbs OV from the gas and is then regenerated.
There are several variations of these rotarary carousel systems on the market, differing
primarily in the way the desorbed OV-containing gas is treated.
3.3.2 Applications
For OV concentrations of interest here, these modified adsorption systems offer the
advantage of essentially concentrating the OV from less than 100 ppm in the vent gas to the
range of 500 to 2,000 ppm in the regeneration gas. Of course, the flow rate of the
regeneration gas is correspondingly lowered. This higher concentration/lower flow rate
regeneration gas can then be treated in a number of ways. One vendor states
Figure 3-2 Rotary Carousel System
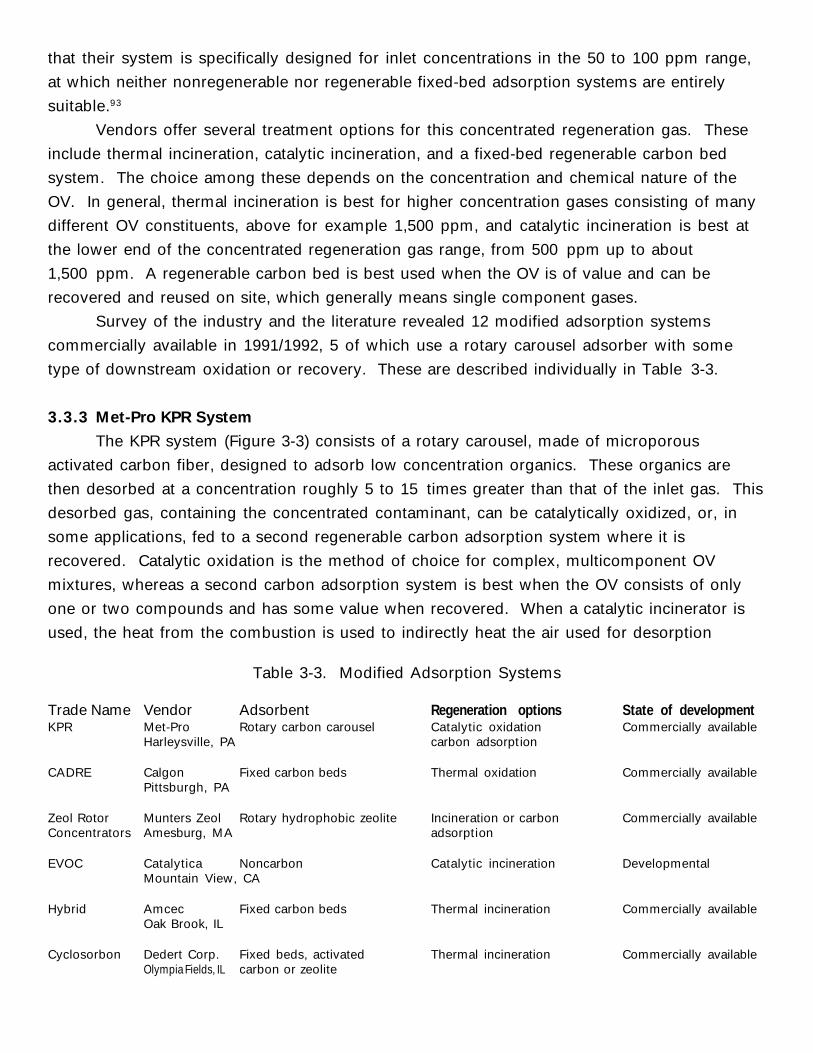
that their system is specifically designed for inlet concentrations in the 50 to 100 ppm range,
at which neither nonregenerable nor regenerable fixed-bed adsorption systems are entirely
suitable.93
Vendors offer several treatment options for this concentrated regeneration gas. These
include thermal incineration, catalytic incineration, and a fixed-bed regenerable carbon bed
system. The choice among these depends on the concentration and chemical nature of the
OV. In general, thermal incineration is best for higher concentration gases consisting of many
different OV constituents, above for example 1,500 ppm, and catalytic incineration is best at
the lower end of the concentrated regeneration gas range, from 500 ppm up to about
1,500 ppm. A regenerable carbon bed is best used when the OV is of value and can be
recovered and reused on site, which generally means single component gases.
Survey of the industry and the literature revealed 12 modified adsorption systems
commercially available in 1991/1992, 5 of which use a rotary carousel adsorber with some
type of downstream oxidation or recovery. These are described individually in Table 3-3.
3.3.3 Met-Pro KPR System
The KPR system (Figure 3-3) consists of a rotary carousel, made of microporous
activated carbon fiber, designed to adsorb low concentration organics. These organics are
then desorbed at a concentration roughly 5 to 15 times greater than that of the inlet gas. This
desorbed gas, containing the concentrated contaminant, can be catalytically oxidized, or, in
some applications, fed to a second regenerable carbon adsorption system where it is
recovered. Catalytic oxidation is the method of choice for complex, multicomponent OV
mixtures, whereas a second carbon adsorption system is best when the OV consists of only
one or two compounds and has some value when recovered. When a catalytic incinerator is
used, the heat from the combustion is used to indirectly heat the air used for desorption
Table 3-3. Modified Adsorption Systems
Trade Name Vendor Adsorbent Regeneration options State of developmentKPR Met-Pro Rotary carbon carousel Catalytic oxidation Commercially available
Harleysville, PA carbon adsorption
CADRE Calgon Fixed carbon beds Thermal oxidation Commercially availablePittsburgh, PA
Zeol Rotor Munters Zeol Rotary hydrophobic zeolite Incineration or carbon Commercially availableConcentrators Amesburg, MA adsorption
EVOC Catalytica Noncarbon Catalytic incineration DevelopmentalMountain View, CA
Hybrid Amcec Fixed carbon beds Thermal incineration Commercially availableOak Brook, IL
Cyclosorbon Dedert Corp. Fixed beds, activated Thermal incineration Commercially availableOlympia Fields, IL carbon or zeolite
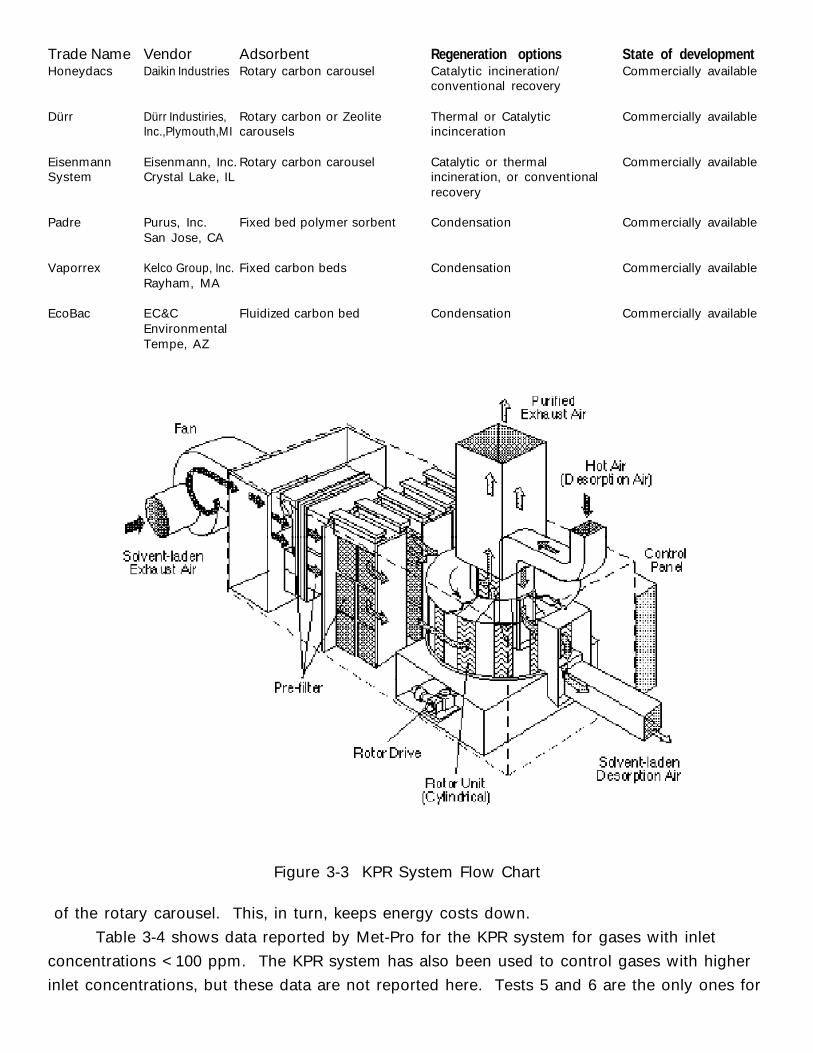
Trade Name Vendor Adsorbent Regeneration options State of developmentHoneydacs Daikin Industries Rotary carbon carousel Catalytic incineration/ Commercially available
conventional recovery
Dürr Dürr Industiries, Rotary carbon or Zeolite Thermal or Catalytic Commercially availableInc.,Plymouth,MI carousels incinceration
Eisenmann Eisenmann, Inc. Rotary carbon carousel Catalytic or thermal Commercially availableSystem Crystal Lake, IL incineration, or conventional
recovery
Padre Purus, Inc. Fixed bed polymer sorbent Condensation Commercially availableSan Jose, CA
Vaporrex Kelco Group, Inc. Fixed carbon beds Condensation Commercially availableRayham, MA
EcoBac EC&C Fluidized carbon bed Condensation Commercially availableEnvironmentalTempe, AZ
Figure 3-3 KPR System Flow Chart
of the rotary carousel. This, in turn, keeps energy costs down.
Table 3-4 shows data reported by Met-Pro for the KPR system for gases with inlet
concentrations <100 ppm. The KPR system has also been used to control gases with higher
inlet concentrations, but these data are not reported here. Tests 5 and 6 are the only ones for
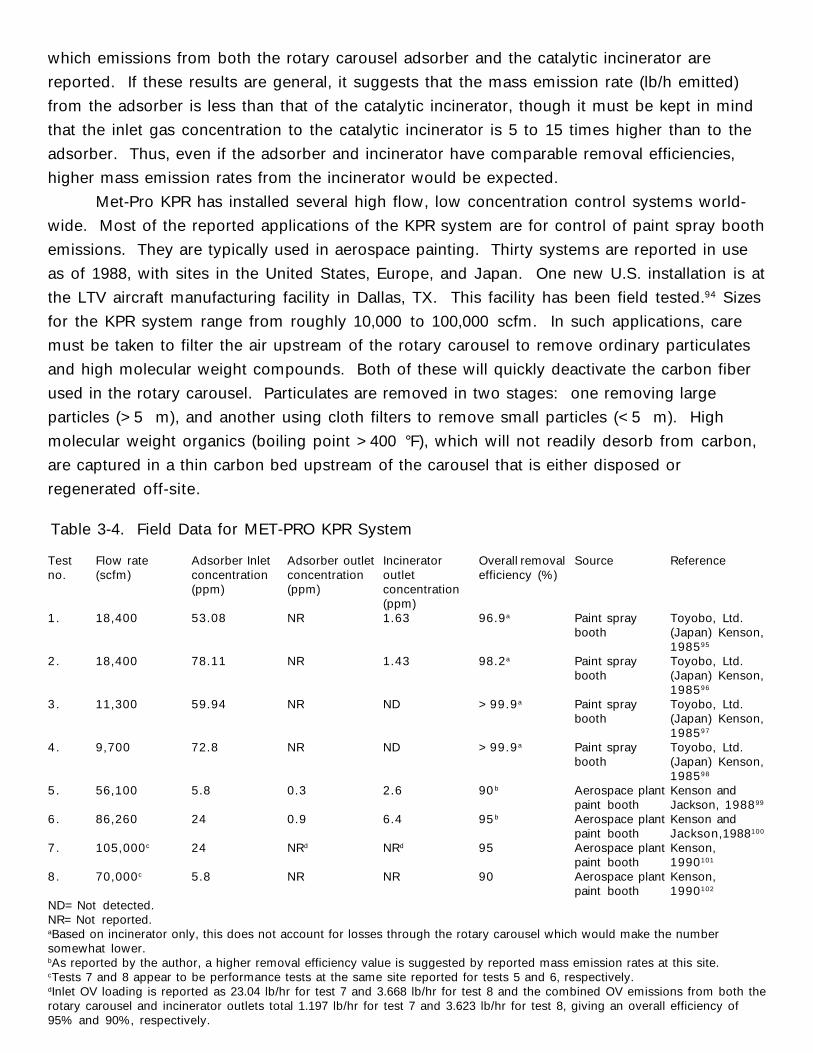
which emissions from both the rotary carousel adsorber and the catalytic incinerator are
reported. If these results are general, it suggests that the mass emission rate (lb/h emitted)
from the adsorber is less than that of the catalytic incinerator, though it must be kept in mind
that the inlet gas concentration to the catalytic incinerator is 5 to 15 times higher than to the
adsorber. Thus, even if the adsorber and incinerator have comparable removal efficiencies,
higher mass emission rates from the incinerator would be expected.
Met-Pro KPR has installed several high flow, low concentration control systems world-
wide. Most of the reported applications of the KPR system are for control of paint spray booth
emissions. They are typically used in aerospace painting. Thirty systems are reported in use
as of 1988, with sites in the United States, Europe, and Japan. One new U.S. installation is at
the LTV aircraft manufacturing facility in Dallas, TX. This facility has been field tested.94 Sizes
for the KPR system range from roughly 10,000 to 100,000 scfm. In such applications, care
must be taken to filter the air upstream of the rotary carousel to remove ordinary particulates
and high molecular weight compounds. Both of these will quickly deactivate the carbon fiber
used in the rotary carousel. Particulates are removed in two stages: one removing large
particles (>5 m), and another using cloth filters to remove small particles (<5 m). High
molecular weight organics (boiling point >400 °F), which will not readily desorb from carbon,
are captured in a thin carbon bed upstream of the carousel that is either disposed or
regenerated off-site.
Table 3-4. Field Data for MET-PRO KPR System
Test Flow rate Adsorber Inlet Adsorber outlet Incinerator Overall removal Source Referenceno. (scfm) concentration concentration outlet efficiency (%)
(ppm) (ppm) concentration(ppm)
1 . 18,400 53.08 NR 1.63 96.9a Paint spray Toyobo, Ltd.booth (Japan) Kenson,
198595
2 . 18,400 78.11 NR 1.43 98.2a Paint spray Toyobo, Ltd.booth (Japan) Kenson,
198596
3 . 11,300 59.94 NR ND >99.9 a Paint spray Toyobo, Ltd.booth (Japan) Kenson,
198597
4 . 9,700 72.8 NR ND >99.9 a Paint spray Toyobo, Ltd.booth (Japan) Kenson,
198598
5 . 56,100 5.8 0.3 2.6 90 b Aerospace plant Kenson andpaint booth Jackson, 198899
6 . 86,260 24 0.9 6.4 95 b Aerospace plant Kenson andpaint booth Jackson,1988100
7 . 105,000c 24 NRd NRd 95 Aerospace plant Kenson,paint booth 1990101
8 . 70,000c 5.8 NR NR 90 Aerospace plant Kenson,paint booth 1990102
ND= Not detected.NR= Not reported.aBased on incinerator only, this does not account for losses through the rotary carousel which would make the numbersomewhat lower.bAs reported by the author, a higher removal efficiency value is suggested by reported mass emission rates at this site.cTests 7 and 8 appear to be performance tests at the same site reported for tests 5 and 6, respectively.dInlet OV loading is reported as 23.04 lb/hr for test 7 and 3.668 lb/hr for test 8 and the combined OV emissions from both therotary carousel and incinerator outlets total 1.197 lb/hr for test 7 and 3.623 lb/hr for test 8, giving an overall efficiency of95% and 90%, respectively.
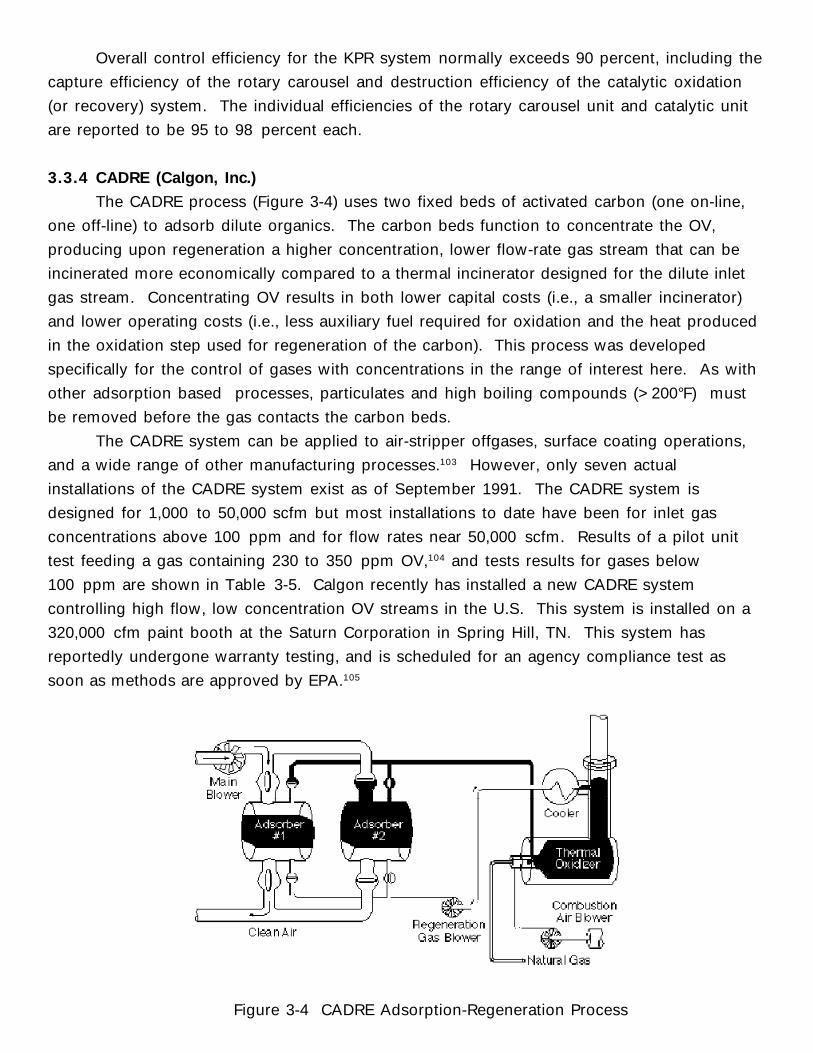
Overall control efficiency for the KPR system normally exceeds 90 percent, including the
capture efficiency of the rotary carousel and destruction efficiency of the catalytic oxidation
(or recovery) system. The individual efficiencies of the rotary carousel unit and catalytic unit
are reported to be 95 to 98 percent each.
3.3.4 CADRE (Calgon, Inc.)
The CADRE process (Figure 3-4) uses two fixed beds of activated carbon (one on-line,
one off-line) to adsorb dilute organics. The carbon beds function to concentrate the OV,
producing upon regeneration a higher concentration, lower flow-rate gas stream that can be
incinerated more economically compared to a thermal incinerator designed for the dilute inlet
gas stream. Concentrating OV results in both lower capital costs (i.e., a smaller incinerator)
and lower operating costs (i.e., less auxiliary fuel required for oxidation and the heat produced
in the oxidation step used for regeneration of the carbon). This process was developed
specifically for the control of gases with concentrations in the range of interest here. As with
other adsorption based processes, particulates and high boiling compounds (>200°F) must
be removed before the gas contacts the carbon beds.
The CADRE system can be applied to air-stripper offgases, surface coating operations,
and a wide range of other manufacturing processes.103 However, only seven actual
installations of the CADRE system exist as of September 1991. The CADRE system is
designed for 1,000 to 50,000 scfm but most installations to date have been for inlet gas
concentrations above 100 ppm and for flow rates near 50,000 scfm. Results of a pilot unit
test feeding a gas containing 230 to 350 ppm OV,104 and tests results for gases below
100 ppm are shown in Table 3-5. Calgon recently has installed a new CADRE system
controlling high flow, low concentration OV streams in the U.S. This system is installed on a
320,000 cfm paint booth at the Saturn Corporation in Spring Hill, TN. This system has
reportedly undergone warranty testing, and is scheduled for an agency compliance test as
soon as methods are approved by EPA.105
Figure 3-4 CADRE Adsorption-Regeneration Process
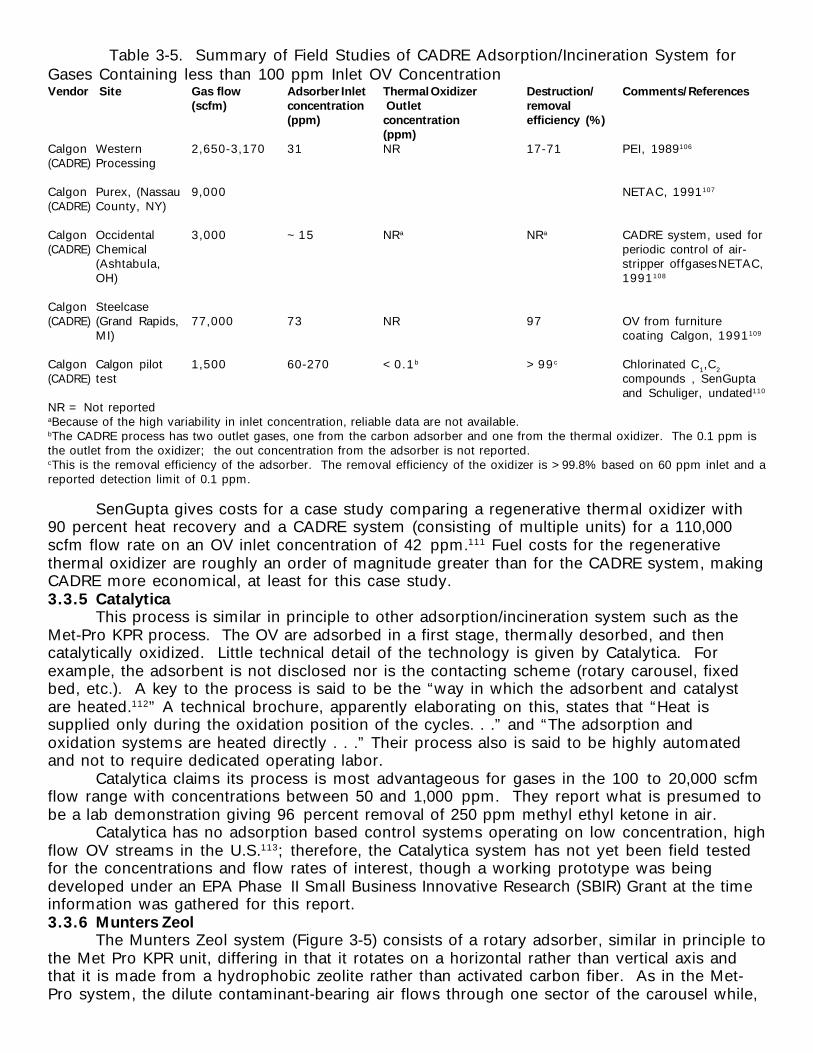
Table 3-5. Summary of Field Studies of CADRE Adsorption/Incineration System forGases Containing less than 100 ppm Inlet OV ConcentrationVendor Site Gas flow Adsorber Inlet Thermal Oxidizer Destruction/ Comments/References
(scfm) concentration Outlet removal(ppm) concentration efficiency (%)
(ppm)Calgon Western 2,650-3,170 31 NR 17-71 PEI, 1989106
(CADRE) Processing
Calgon Purex, (Nassau 9,000 NETAC, 1991107
(CADRE) County, NY)
Calgon Occidental 3,000 ~15 NRa NRa CADRE system, used for(CADRE) Chemical periodic control of air-
(Ashtabula, stripper offgasesNETAC,OH) 1991108
Calgon Steelcase(CADRE) (Grand Rapids, 77,000 73 NR 97 OV from furniture
MI) coating Calgon, 1991109
Calgon Calgon pilot 1,500 60-270 <0.1 b >99 c Chlorinated C1,C2
(CADRE) test compounds , SenGuptaand Schuliger, undated110
NR = Not reportedaBecause of the high variability in inlet concentration, reliable data are not available.bThe CADRE process has two outlet gases, one from the carbon adsorber and one from the thermal oxidizer. The 0.1 ppm isthe outlet from the oxidizer; the out concentration from the adsorber is not reported.cThis is the removal efficiency of the adsorber. The removal efficiency of the oxidizer is >99.8% based on 60 ppm inlet and areported detection limit of 0.1 ppm.
SenGupta gives costs for a case study comparing a regenerative thermal oxidizer with90 percent heat recovery and a CADRE system (consisting of multiple units) for a 110,000scfm flow rate on an OV inlet concentration of 42 ppm.111 Fuel costs for the regenerativethermal oxidizer are roughly an order of magnitude greater than for the CADRE system, makingCADRE more economical, at least for this case study.3.3.5 Catalytica
This process is similar in principle to other adsorption/incineration system such as theMet-Pro KPR process. The OV are adsorbed in a first stage, thermally desorbed, and thencatalytically oxidized. Little technical detail of the technology is given by Catalytica. Forexample, the adsorbent is not disclosed nor is the contacting scheme (rotary carousel, fixedbed, etc.). A key to the process is said to be the “way in which the adsorbent and catalystare heated.112” A technical brochure, apparently elaborating on this, states that “Heat issupplied only during the oxidation position of the cycles. . .” and “The adsorption andoxidation systems are heated directly . . .” Their process also is said to be highly automatedand not to require dedicated operating labor.
Catalytica claims its process is most advantageous for gases in the 100 to 20,000 scfmflow range with concentrations between 50 and 1,000 ppm. They report what is presumed tobe a lab demonstration giving 96 percent removal of 250 ppm methyl ethyl ketone in air.
Catalytica has no adsorption based control systems operating on low concentration, highflow OV streams in the U.S.113; therefore, the Catalytica system has not yet been field testedfor the concentrations and flow rates of interest, though a working prototype was beingdeveloped under an EPA Phase II Small Business Innovative Research (SBIR) Grant at the timeinformation was gathered for this report.3.3.6 Munters Zeol
The Munters Zeol system (Figure 3-5) consists of a rotary adsorber, similar in principle tothe Met Pro KPR unit, differing in that it rotates on a horizontal rather than vertical axis andthat it is made from a hydrophobic zeolite rather than activated carbon fiber. As in the Met-Pro system, the dilute contaminant-bearing air flows through one sector of the carousel while,
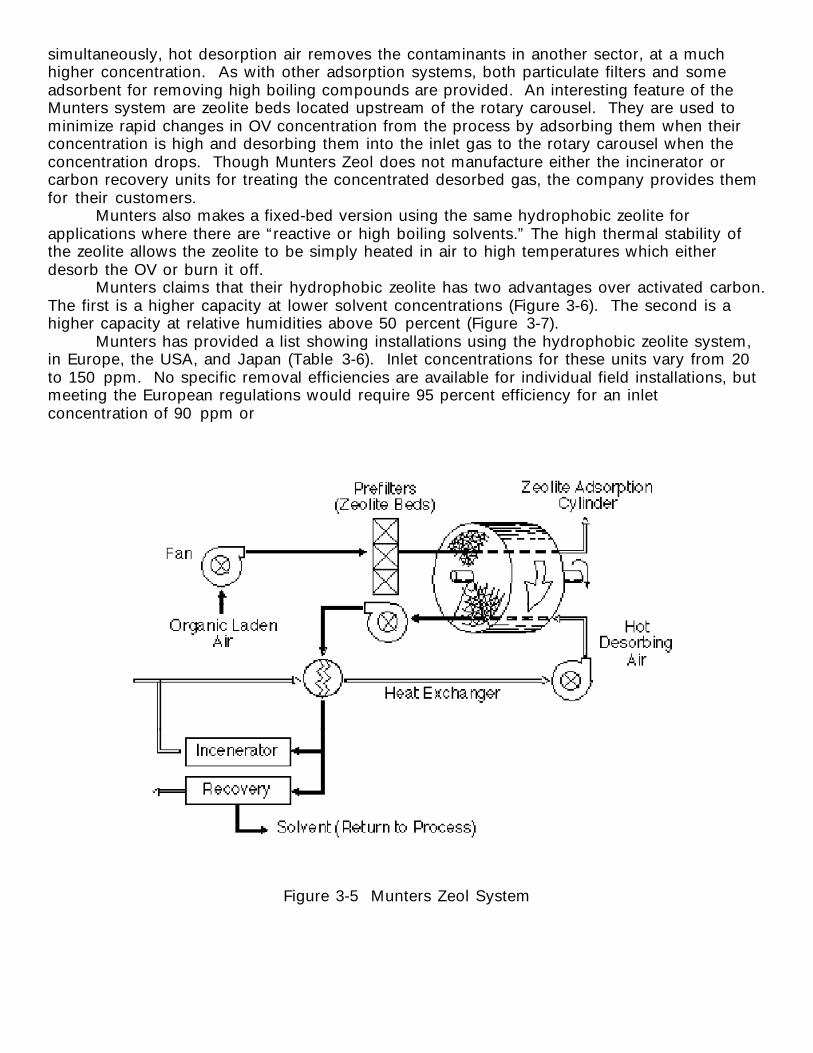
simultaneously, hot desorption air removes the contaminants in another sector, at a muchhigher concentration. As with other adsorption systems, both particulate filters and someadsorbent for removing high boiling compounds are provided. An interesting feature of theMunters system are zeolite beds located upstream of the rotary carousel. They are used tominimize rapid changes in OV concentration from the process by adsorbing them when theirconcentration is high and desorbing them into the inlet gas to the rotary carousel when theconcentration drops. Though Munters Zeol does not manufacture either the incinerator orcarbon recovery units for treating the concentrated desorbed gas, the company provides themfor their customers.
Munters also makes a fixed-bed version using the same hydrophobic zeolite forapplications where there are “reactive or high boiling solvents.” The high thermal stability ofthe zeolite allows the zeolite to be simply heated in air to high temperatures which eitherdesorb the OV or burn it off.
Munters claims that their hydrophobic zeolite has two advantages over activated carbon.The first is a higher capacity at lower solvent concentrations (Figure 3-6). The second is ahigher capacity at relative humidities above 50 percent (Figure 3-7).
Munters has provided a list showing installations using the hydrophobic zeolite system,in Europe, the USA, and Japan (Table 3-6). Inlet concentrations for these units vary from 20to 150 ppm. No specific removal efficiencies are available for individual field installations, butmeeting the European regulations would require 95 percent efficiency for an inletconcentration of 90 ppm or
Figure 3-5 Munters Zeol System
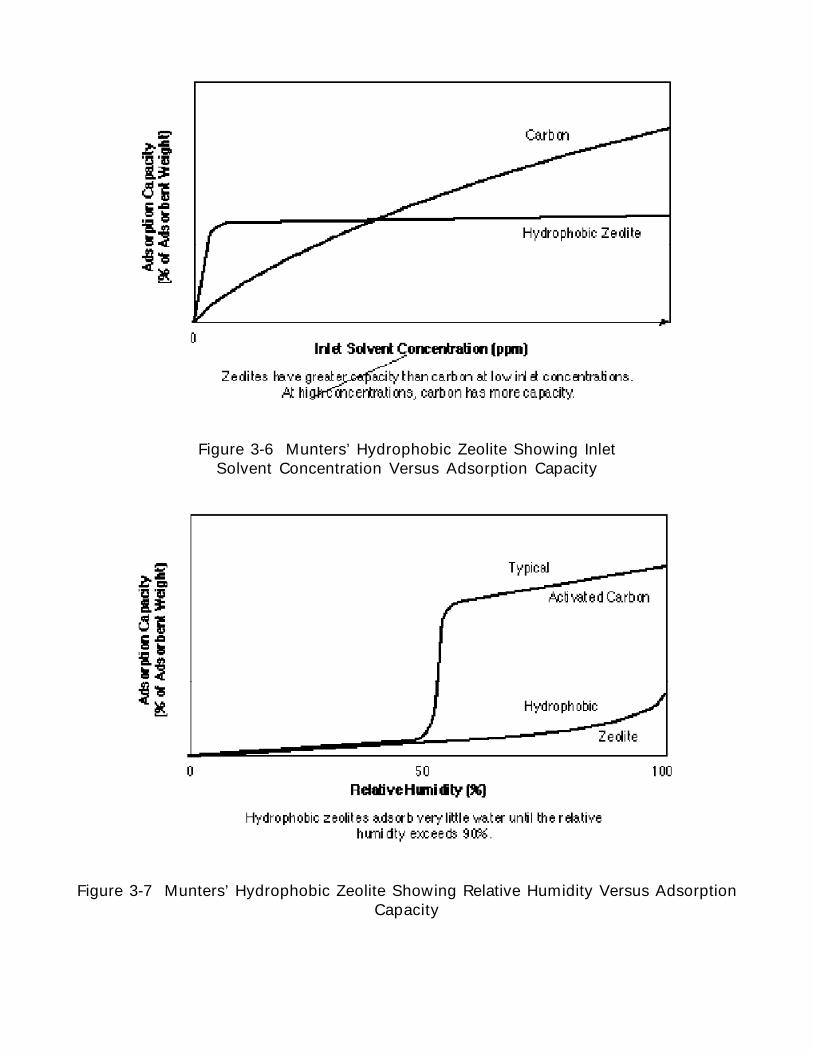
Figure 3-6 Munters’ Hydrophobic Zeolite Showing InletSolvent Concentration Versus Adsorption Capacity
Figure 3-7 Munters’ Hydrophobic Zeolite Showing Relative Humidity Versus AdsorptionCapacity
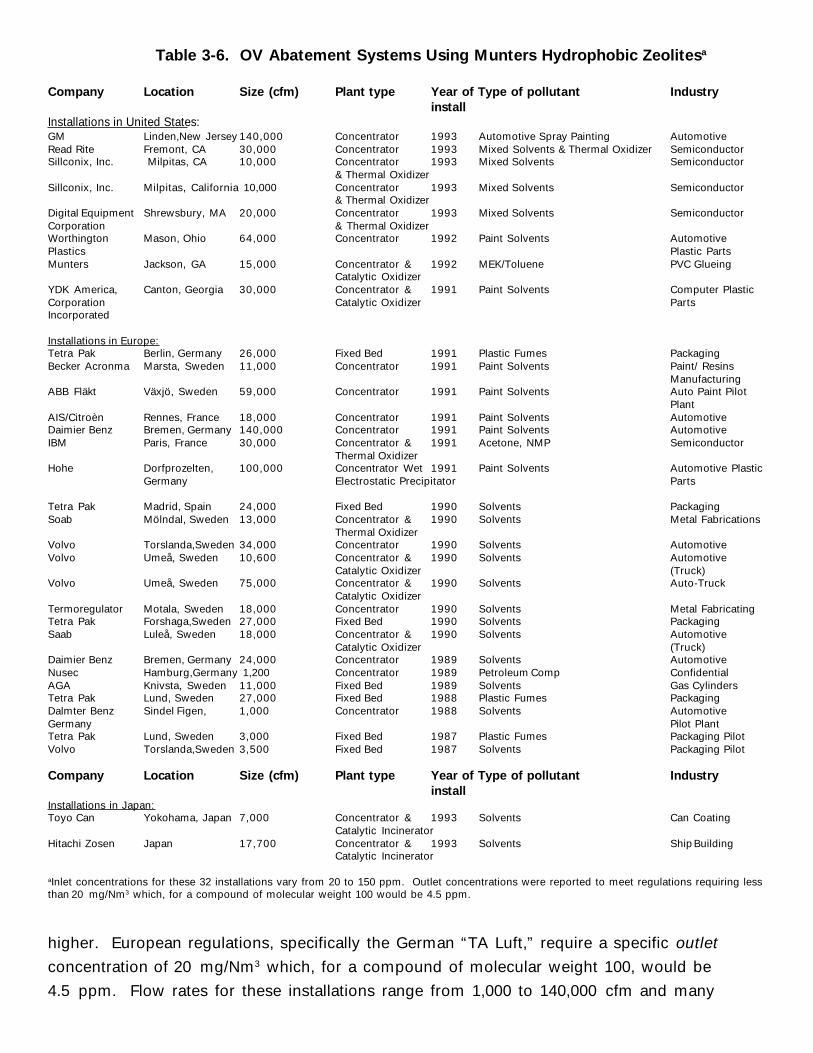
Table 3-6. OV Abatement Systems Using Munters Hydrophobic Zeolitesa
Company Location Size (cfm) Plant type Year of Type of pollutant Industryinstall
Installations in United States:GM Linden,New Jersey 140,000 Concentrator 1993 Automotive Spray Painting AutomotiveRead Rite Fremont, CA 30,000 Concentrator 1993 Mixed Solvents & Thermal Oxidizer SemiconductorSillconix, Inc. Milpitas, CA 10,000 Concentrator 1993 Mixed Solvents Semiconductor
& Thermal OxidizerSillconix, Inc. Milpitas, California 10,000 Concentrator 1993 Mixed Solvents Semiconductor
& Thermal OxidizerDigital Equipment Shrewsbury, MA 20,000 Concentrator 1993 Mixed Solvents SemiconductorCorporation & Thermal OxidizerWorthington Mason, Ohio 64,000 Concentrator 1992 Paint Solvents AutomotivePlastics Plastic PartsMunters Jackson, GA 15,000 Concentrator & 1992 MEK/Toluene PVC Glueing
Catalytic OxidizerYDK America, Canton, Georgia 30,000 Concentrator & 1991 Paint Solvents Computer PlasticCorporation Catalytic Oxidizer PartsIncorporated
Installations in Europe:Tetra Pak Berlin, Germany 26,000 Fixed Bed 1991 Plastic Fumes PackagingBecker Acronma Marsta, Sweden 11,000 Concentrator 1991 Paint Solvents Paint/ Resins
ManufacturingABB Fläkt Växjö, Sweden 59,000 Concentrator 1991 Paint Solvents Auto Paint Pilot
PlantAIS/Citroèn Rennes, France 18,000 Concentrator 1991 Paint Solvents AutomotiveDaimier Benz Bremen, Germany 140,000 Concentrator 1991 Paint Solvents AutomotiveIBM Paris, France 30,000 Concentrator & 1991 Acetone, NMP Semiconductor
Thermal OxidizerHohe Dorfprozelten, 100,000 Concentrator Wet 1991 Paint Solvents Automotive Plastic
Germany Electrostatic Precipitator Parts
Tetra Pak Madrid, Spain 24,000 Fixed Bed 1990 Solvents PackagingSoab Mölndal, Sweden 13,000 Concentrator & 1990 Solvents Metal Fabrications
Thermal OxidizerVolvo Torslanda,Sweden 34,000 Concentrator 1990 Solvents AutomotiveVolvo Umeå, Sweden 10,600 Concentrator & 1990 Solvents Automotive
Catalytic Oxidizer (Truck)Volvo Umeå, Sweden 75,000 Concentrator & 1990 Solvents Auto-Truck
Catalytic OxidizerTermoregulator Motala, Sweden 18,000 Concentrator 1990 Solvents Metal FabricatingTetra Pak Forshaga,Sweden 27,000 Fixed Bed 1990 Solvents PackagingSaab Luleå, Sweden 18,000 Concentrator & 1990 Solvents Automotive
Catalytic Oxidizer (Truck)Daimier Benz Bremen, Germany 24,000 Concentrator 1989 Solvents AutomotiveNusec Hamburg,Germany 1,200 Concentrator 1989 Petroleum Comp ConfidentialAGA Knivsta, Sweden 11,000 Fixed Bed 1989 Solvents Gas CylindersTetra Pak Lund, Sweden 27,000 Fixed Bed 1988 Plastic Fumes PackagingDalmter Benz Sindel Figen, 1,000 Concentrator 1988 Solvents AutomotiveGermany Pilot PlantTetra Pak Lund, Sweden 3,000 Fixed Bed 1987 Plastic Fumes Packaging PilotVolvo Torslanda,Sweden 3,500 Fixed Bed 1987 Solvents Packaging Pilot
Company Location Size (cfm) Plant type Year of Type of pollutant Industryinstall
Installations in Japan:Toyo Can Yokohama, Japan 7,000 Concentrator & 1993 Solvents Can Coating
Catalytic IncineratorHitachi Zosen Japan 17,700 Concentrator & 1993 Solvents Ship Building
Catalytic Incinerator
aInlet concentrations for these 32 installations vary from 20 to 150 ppm. Outlet concentrations were reported to meet regulations requiring lessthan 20 mg/Nm3 which, for a compound of molecular weight 100 would be 4.5 ppm.
higher. European regulations, specifically the German “TA Luft,” require a specific outlet
concentration of 20 mg/Nm3 which, for a compound of molecular weight 100, would be
4.5 ppm. Flow rates for these installations range from 1,000 to 140,000 cfm and many
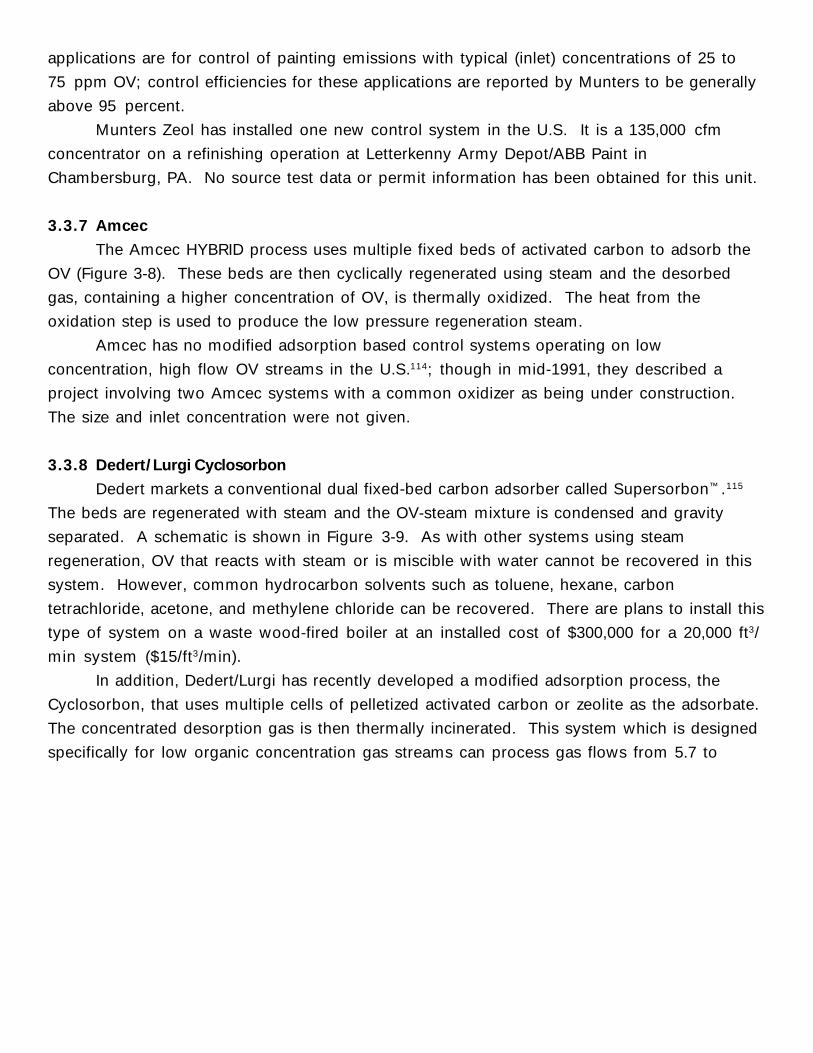
applications are for control of painting emissions with typical (inlet) concentrations of 25 to
75 ppm OV; control efficiencies for these applications are reported by Munters to be generally
above 95 percent.
Munters Zeol has installed one new control system in the U.S. It is a 135,000 cfm
concentrator on a refinishing operation at Letterkenny Army Depot/ABB Paint in
Chambersburg, PA. No source test data or permit information has been obtained for this unit.
3.3.7 Amcec
The Amcec HYBRID process uses multiple fixed beds of activated carbon to adsorb the
OV (Figure 3-8). These beds are then cyclically regenerated using steam and the desorbed
gas, containing a higher concentration of OV, is thermally oxidized. The heat from the
oxidation step is used to produce the low pressure regeneration steam.
Amcec has no modified adsorption based control systems operating on low
concentration, high flow OV streams in the U.S.114; though in mid-1991, they described a
project involving two Amcec systems with a common oxidizer as being under construction.
The size and inlet concentration were not given.
3.3.8 Dedert/Lurgi Cyclosorbon
Dedert markets a conventional dual fixed-bed carbon adsorber called Supersorbon™ .115
The beds are regenerated with steam and the OV-steam mixture is condensed and gravity
separated. A schematic is shown in Figure 3-9. As with other systems using steam
regeneration, OV that reacts with steam or is miscible with water cannot be recovered in this
system. However, common hydrocarbon solvents such as toluene, hexane, carbon
tetrachloride, acetone, and methylene chloride can be recovered. There are plans to install this
type of system on a waste wood-fired boiler at an installed cost of $300,000 for a 20,000 ft3/
min system ($15/ft3/min).
In addition, Dedert/Lurgi has recently developed a modified adsorption process, the
Cyclosorbon, that uses multiple cells of pelletized activated carbon or zeolite as the adsorbate.
The concentrated desorption gas is then thermally incinerated. This system which is designed
specifically for low organic concentration gas streams can process gas flows from 5.7 to
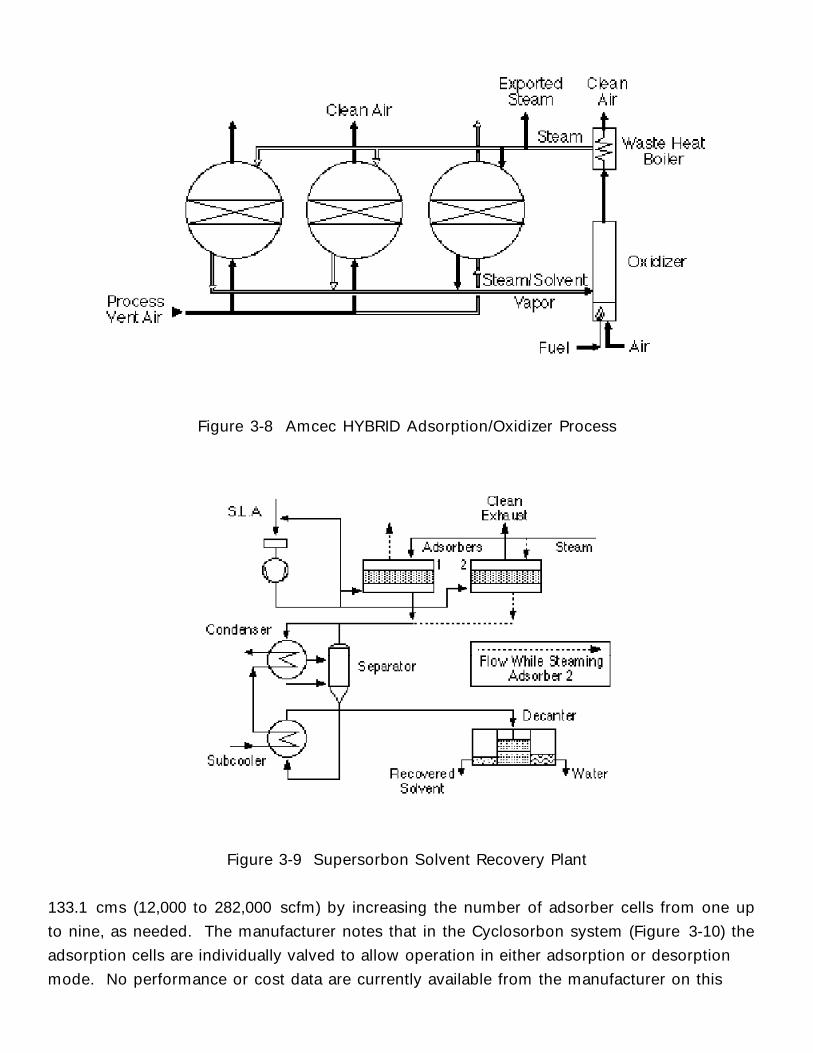
Figure 3-8 Amcec HYBRID Adsorption/Oxidizer Process
Figure 3-9 Supersorbon Solvent Recovery Plant
133.1 cms (12,000 to 282,000 scfm) by increasing the number of adsorber cells from one up
to nine, as needed. The manufacturer notes that in the Cyclosorbon system (Figure 3-10) the
adsorption cells are individually valved to allow operation in either adsorption or desorption
mode. No performance or cost data are currently available from the manufacturer on this
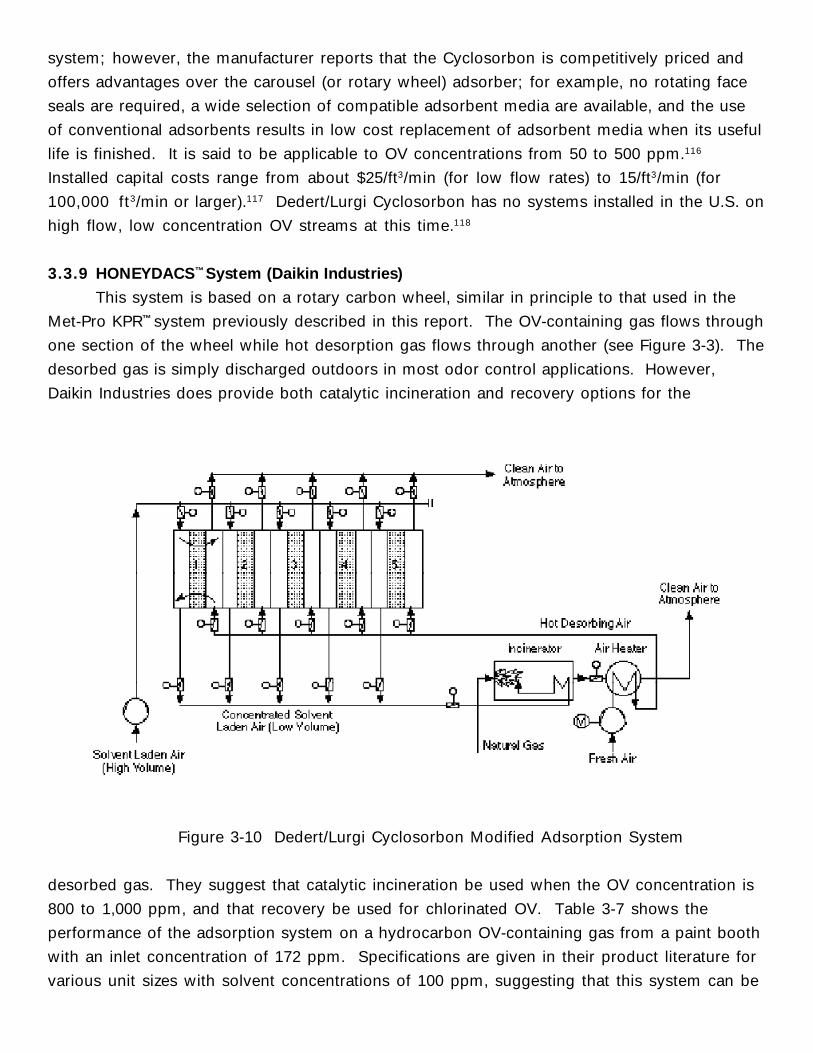
system; however, the manufacturer reports that the Cyclosorbon is competitively priced and
offers advantages over the carousel (or rotary wheel) adsorber; for example, no rotating face
seals are required, a wide selection of compatible adsorbent media are available, and the use
of conventional adsorbents results in low cost replacement of adsorbent media when its useful
life is finished. It is said to be applicable to OV concentrations from 50 to 500 ppm.116
Installed capital costs range from about $25/ft3/min (for low flow rates) to 15/ft3/min (for
100,000 ft3/min or larger).117 Dedert/Lurgi Cyclosorbon has no systems installed in the U.S. on
high flow, low concentration OV streams at this time.118
3.3.9 HONEYDACS™ System (Daikin Industries)
This system is based on a rotary carbon wheel, similar in principle to that used in the
Met-Pro KPR™ system previously described in this report. The OV-containing gas flows through
one section of the wheel while hot desorption gas flows through another (see Figure 3-3). The
desorbed gas is simply discharged outdoors in most odor control applications. However,
Daikin Industries does provide both catalytic incineration and recovery options for the
Figure 3-10 Dedert/Lurgi Cyclosorbon Modified Adsorption System
desorbed gas. They suggest that catalytic incineration be used when the OV concentration is
800 to 1,000 ppm, and that recovery be used for chlorinated OV. Table 3-7 shows the
performance of the adsorption system on a hydrocarbon OV-containing gas from a paint booth
with an inlet concentration of 172 ppm. Specifications are given in their product literature for
various unit sizes with solvent concentrations of 100 ppm, suggesting that this system can be
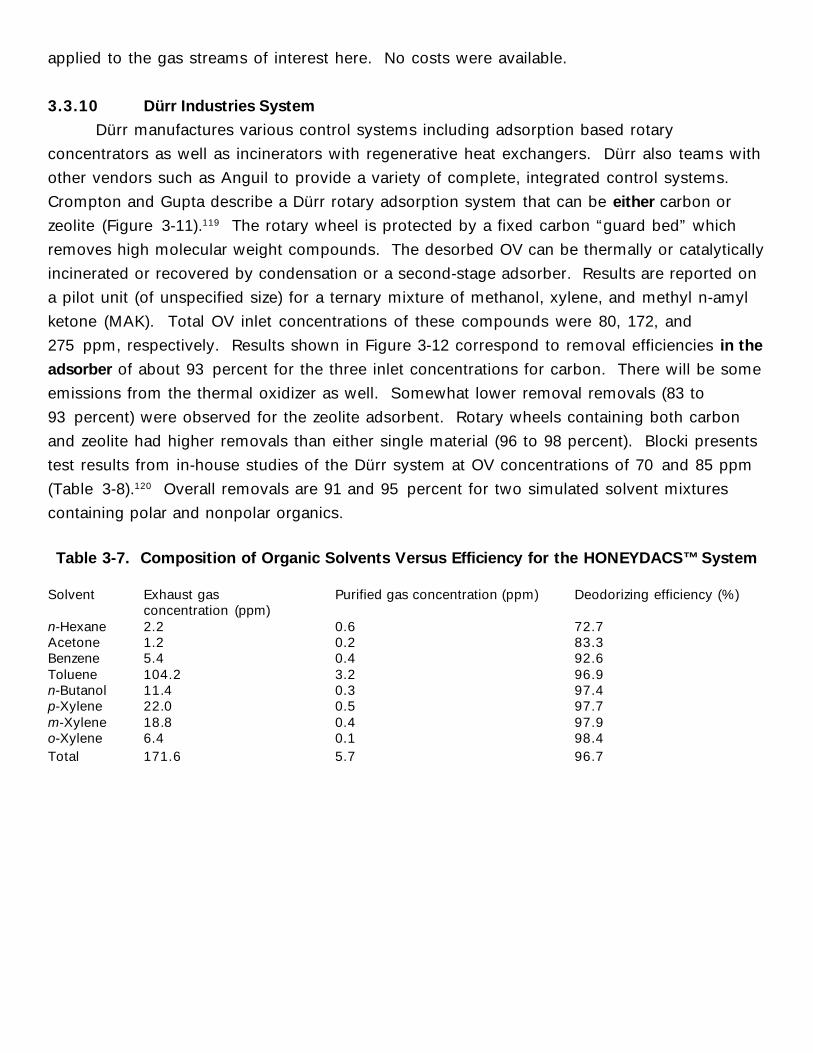
applied to the gas streams of interest here. No costs were available.
3.3.10 Dürr Industries System
Dürr manufactures various control systems including adsorption based rotary
concentrators as well as incinerators with regenerative heat exchangers. Dürr also teams with
other vendors such as Anguil to provide a variety of complete, integrated control systems.
Crompton and Gupta describe a Dürr rotary adsorption system that can be either carbon or
zeolite (Figure 3-11).119 The rotary wheel is protected by a fixed carbon “guard bed” which
removes high molecular weight compounds. The desorbed OV can be thermally or catalytically
incinerated or recovered by condensation or a second-stage adsorber. Results are reported on
a pilot unit (of unspecified size) for a ternary mixture of methanol, xylene, and methyl n-amyl
ketone (MAK). Total OV inlet concentrations of these compounds were 80, 172, and
275 ppm, respectively. Results shown in Figure 3-12 correspond to removal efficiencies in the
adsorber of about 93 percent for the three inlet concentrations for carbon. There will be some
emissions from the thermal oxidizer as well. Somewhat lower removal removals (83 to
93 percent) were observed for the zeolite adsorbent. Rotary wheels containing both carbon
and zeolite had higher removals than either single material (96 to 98 percent). Blocki presents
test results from in-house studies of the Dürr system at OV concentrations of 70 and 85 ppm
(Table 3-8).120 Overall removals are 91 and 95 percent for two simulated solvent mixtures
containing polar and nonpolar organics.
Table 3-7. Composition of Organic Solvents Versus Efficiency for the HONEYDACS™ System
Solvent Exhaust gas Purified gas concentration (ppm) Deodorizing efficiency (%)concentration (ppm)
n-Hexane 2.2 0.6 72.7Acetone 1.2 0.2 83.3Benzene 5.4 0.4 92.6Toluene 104.2 3.2 96.9n-Butanol 11.4 0.3 97.4p-Xylene 22.0 0.5 97.7m-Xylene 18.8 0.4 97.9o-Xylene 6.4 0.1 98.4Total 171.6 5.7 96.7
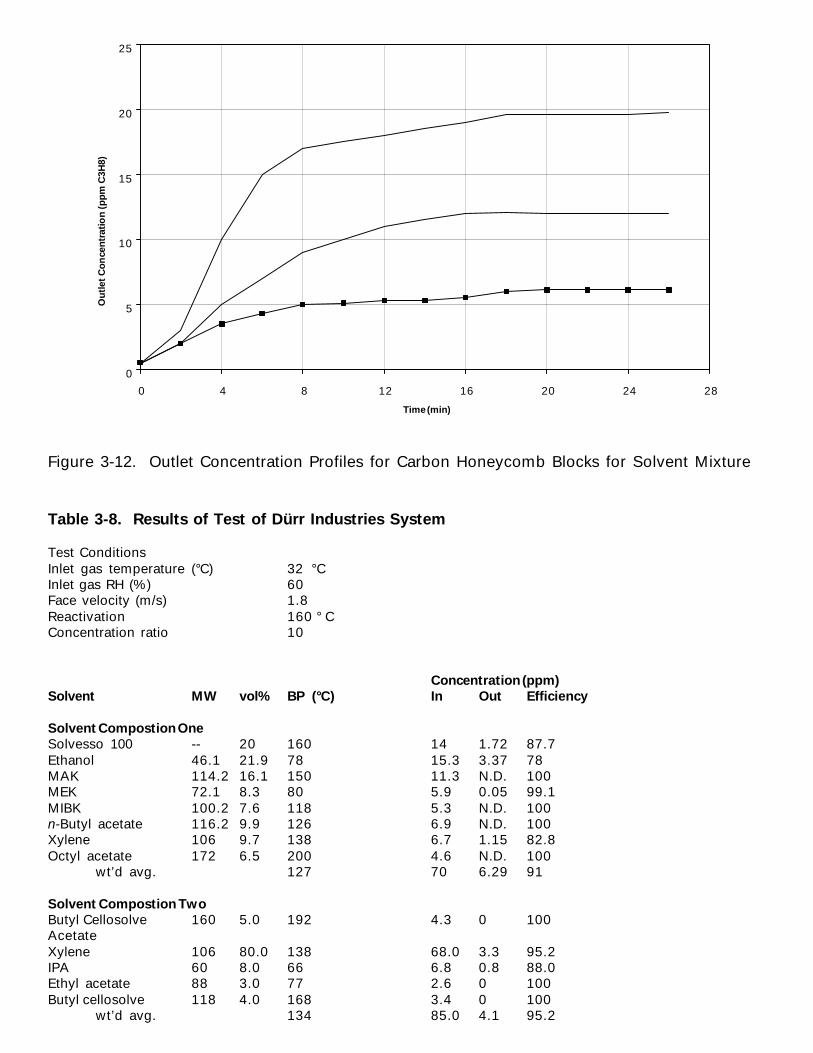
0
5
10
15
20
25
0 4 8 12 16 20 24 28
Time (min)
Ou
tlet
Co
nce
ntr
atio
n (
pp
m C
3H8)
Figure 3-12. Outlet Concentration Profiles for Carbon Honeycomb Blocks for Solvent Mixture
Table 3-8. Results of Test of Dürr Industries System
Test ConditionsInlet gas temperature (°C) 32 °CInlet gas RH (%) 60Face velocity (m/s) 1.8Reactivation 160 ° CConcentration ratio 10
Concentration (ppm)Solvent MW vol% BP (°C) In Out Efficiency
Solvent Compostion OneSolvesso 100 -- 20 160 14 1.72 87.7Ethanol 46.1 21.9 78 15.3 3.37 78MAK 114.2 16.1 150 11.3 N.D. 100MEK 72.1 8.3 80 5.9 0.05 99.1MIBK 100.2 7.6 118 5.3 N.D. 100n-Butyl acetate 116.2 9.9 126 6.9 N.D. 100Xylene 106 9.7 138 6.7 1.15 82.8Octyl acetate 172 6.5 200 4.6 N.D. 100
wt’d avg. 127 70 6.29 91
Solvent Compostion TwoButyl Cellosolve 160 5.0 192 4.3 0 100AcetateXylene 106 80.0 138 68.0 3.3 95.2IPA 60 8.0 66 6.8 0.8 88.0Ethyl acetate 88 3.0 77 2.6 0 100Butyl cellosolve 118 4.0 168 3.4 0 100
wt’d avg. 134 85.0 4.1 95.2
Figure 3-13 shows that, for the Dürr systems, catalytic and regenerative thermal
oxidation and concentration (by adsorption, followed by recovery or oxidation) are applicable
for the concentrations that are of interest here. This figure also characterizes
OV concentration of less than 100 ppm as typically being malodorous, not necessarily
hydrocarbons only. Dürr has seven control systems installed in the U.S. on high flow, low
concentration organic vapor streams.121 All use rotary zeolite or activated carbon adsorbers
followed by incinerators. Six are installed on automobile painting lines, and one is installed on
a semi-conductor facility.
Annual electricity and fuel costs are given (Table 3-9), but no allowance is made for low
OV concentrations. The costs given, however, show the clear advantage of an adsorption
concentrator. Table 3-10 presents a comparison of the Dürr system to a regenerative thermal
oxidizer and a carbon-based rotary adsorption system, showing the lower utility costs of the
latter two concentrators and a somewhat lower capital cost of the hydrophobic zeolite
concentrator.
3.3.10.1 Permit Conditions
Review of the draft permit (dated, July 18, 1994) issued by the Air Pollution Control
Bureau of the New Mexico Environment Department to the Intel Corporation does indicate that
permit conditions are placed on the three Dürr VOC control systems in use at this facility.122
Condition 1.c specifies allowable emission rates prior to control resulting from the Dürr thermal
oxidizer. Condition 3.a establishes operating requirements for the units, and notes an oxidizer
efficiency of 90%. Condition 3.c specifies that each thermal oxidizer unit shall achieve and
maintain a VOC reduction efficiency of at lest 90% on an hourly basis for all VOC’s except
methanol (60%). Various other conditions are specified in Section C of the permit; these deal
with requirements for the thermal oxidizer units relating to maintenance, restrictions on
halogenated compounds, fuel use, firing rate, and incinerator combustion temperature. No
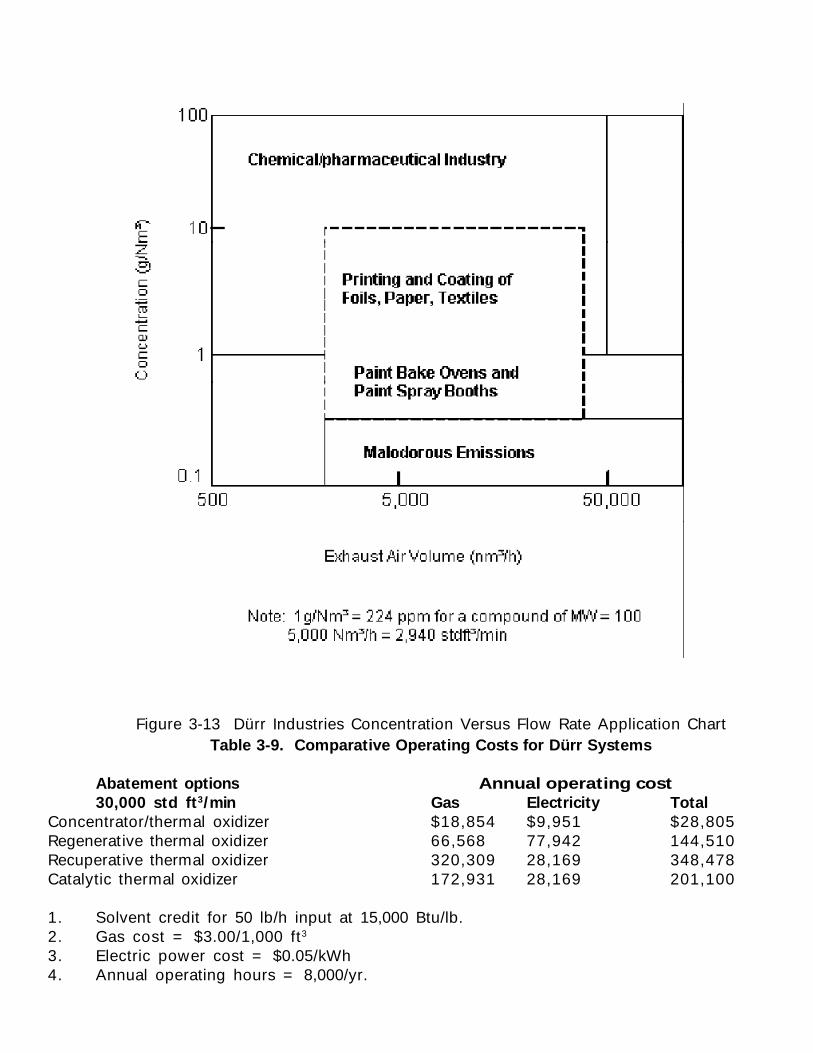
Figure 3-13 Dürr Industries Concentration Versus Flow Rate Application ChartTable 3-9. Comparative Operating Costs for Dürr Systems
Abatement options Annual operating cost30,000 std ft3/min Gas Electricity Total
Concentrator/thermal oxidizer $18,854 $9,951 $28,805Regenerative thermal oxidizer 66,568 77,942 144,510Recuperative thermal oxidizer 320,309 28,169 348,478Catalytic thermal oxidizer 172,931 28,169 201,100
1. Solvent credit for 50 lb/h input at 15,000 Btu/lb.2. Gas cost = $3.00/1,000 ft3
3. Electric power cost = $0.05/kWh4. Annual operating hours = 8,000/yr.
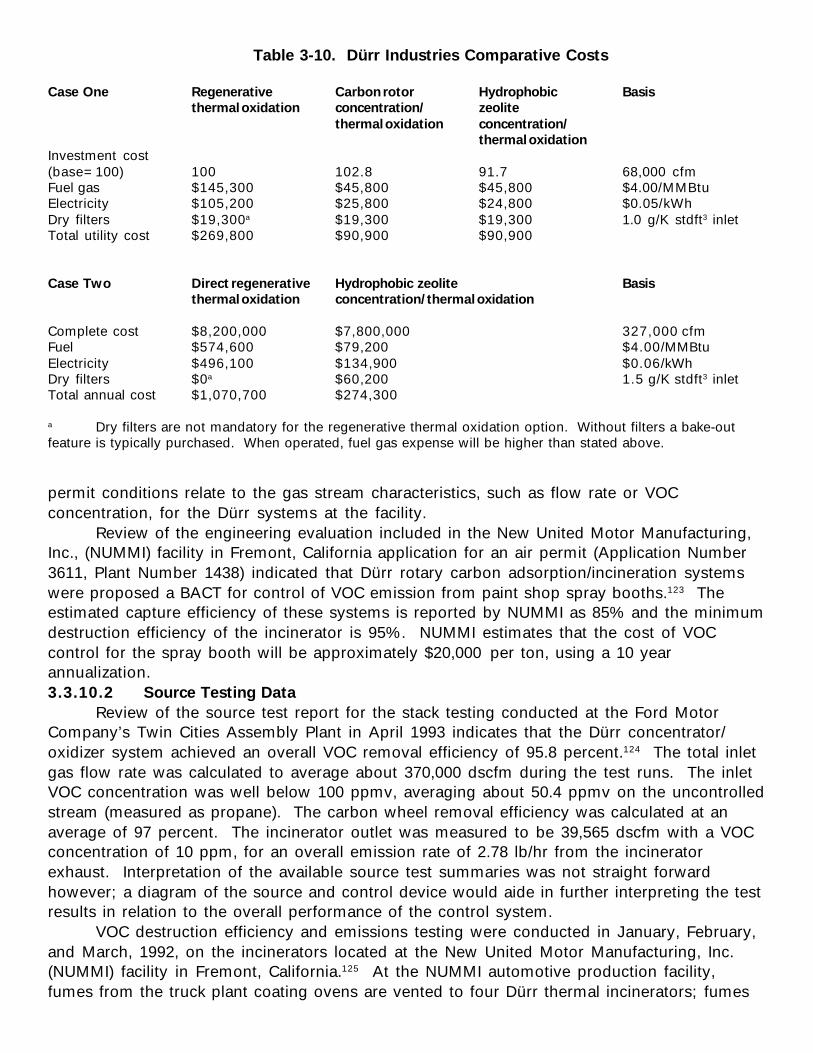
Table 3-10. Dürr Industries Comparative Costs
Case One Regenerative Carbon rotor Hydrophobic Basisthermal oxidation concentration/ zeolite
thermal oxidation concentration/thermal oxidation
Investment cost(base=100) 100 102.8 91.7 68,000 cfmFuel gas $145,300 $45,800 $45,800 $4.00/MMBtuElectricity $105,200 $25,800 $24,800 $0.05/kWhDry filters $19,300a $19,300 $19,300 1.0 g/K stdft3 inletTotal utility cost $269,800 $90,900 $90,900
Case Two Direct regenerative Hydrophobic zeolite Basisthermal oxidation concentration/thermal oxidation
Complete cost $8,200,000 $7,800,000 327,000 cfmFuel $574,600 $79,200 $4.00/MMBtuElectricity $496,100 $134,900 $0.06/kWhDry filters $0a $60,200 1.5 g/K stdft3 inletTotal annual cost $1,070,700 $274,300
a Dry filters are not mandatory for the regenerative thermal oxidation option. Without filters a bake-outfeature is typically purchased. When operated, fuel gas expense will be higher than stated above.
permit conditions relate to the gas stream characteristics, such as flow rate or VOCconcentration, for the Dürr systems at the facility.
Review of the engineering evaluation included in the New United Motor Manufacturing,Inc., (NUMMI) facility in Fremont, California application for an air permit (Application Number3611, Plant Number 1438) indicated that Dürr rotary carbon adsorption/incineration systemswere proposed a BACT for control of VOC emission from paint shop spray booths.123 Theestimated capture efficiency of these systems is reported by NUMMI as 85% and the minimumdestruction efficiency of the incinerator is 95%. NUMMI estimates that the cost of VOCcontrol for the spray booth will be approximately $20,000 per ton, using a 10 yearannualization.3.3.10.2 Source Testing Data
Review of the source test report for the stack testing conducted at the Ford MotorCompany’s Twin Cities Assembly Plant in April 1993 indicates that the Dürr concentrator/oxidizer system achieved an overall VOC removal efficiency of 95.8 percent.124 The total inletgas flow rate was calculated to average about 370,000 dscfm during the test runs. The inletVOC concentration was well below 100 ppmv, averaging about 50.4 ppmv on the uncontrolledstream (measured as propane). The carbon wheel removal efficiency was calculated at anaverage of 97 percent. The incinerator outlet was measured to be 39,565 dscfm with a VOCconcentration of 10 ppm, for an overall emission rate of 2.78 lb/hr from the incineratorexhaust. Interpretation of the available source test summaries was not straight forwardhowever; a diagram of the source and control device would aide in further interpreting the testresults in relation to the overall performance of the control system.
VOC destruction efficiency and emissions testing were conducted in January, February,and March, 1992, on the incinerators located at the New United Motor Manufacturing, Inc.(NUMMI) facility in Fremont, California.125 At the NUMMI automotive production facility,fumes from the truck plant coating ovens are vented to four Dürr thermal incinerators; fumes
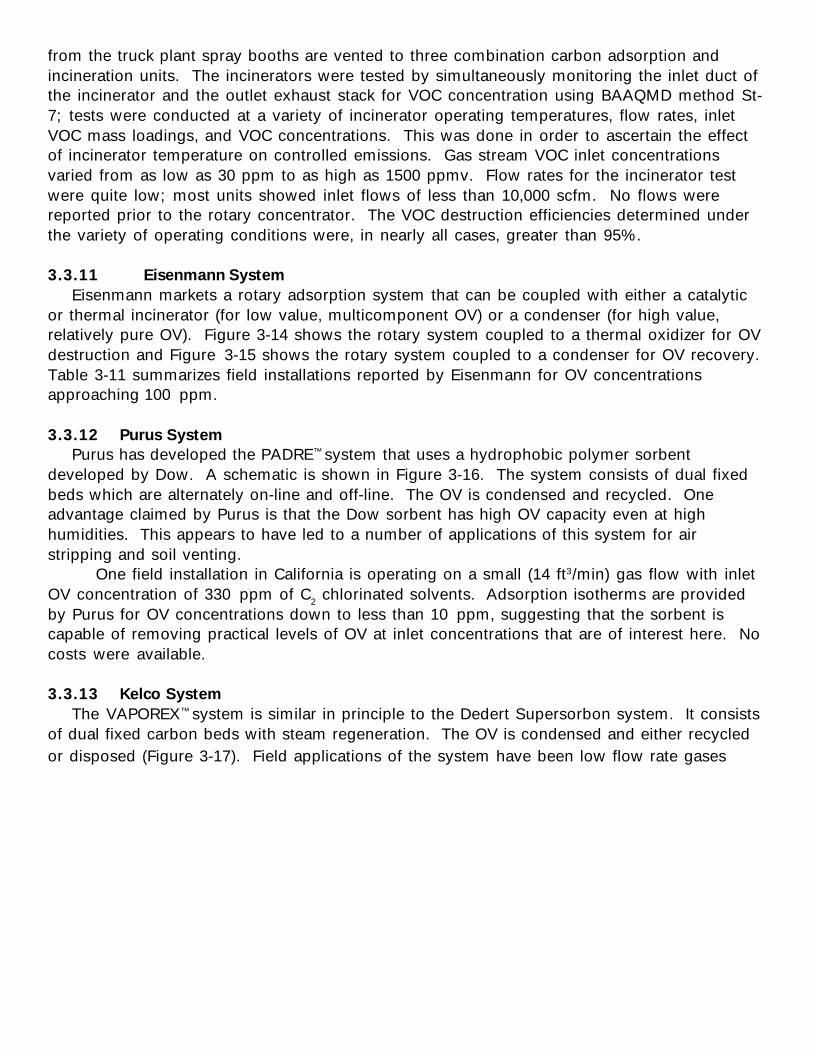
from the truck plant spray booths are vented to three combination carbon adsorption andincineration units. The incinerators were tested by simultaneously monitoring the inlet duct ofthe incinerator and the outlet exhaust stack for VOC concentration using BAAQMD method St-7; tests were conducted at a variety of incinerator operating temperatures, flow rates, inletVOC mass loadings, and VOC concentrations. This was done in order to ascertain the effectof incinerator temperature on controlled emissions. Gas stream VOC inlet concentrationsvaried from as low as 30 ppm to as high as 1500 ppmv. Flow rates for the incinerator testwere quite low; most units showed inlet flows of less than 10,000 scfm. No flows werereported prior to the rotary concentrator. The VOC destruction efficiencies determined underthe variety of operating conditions were, in nearly all cases, greater than 95%.
3.3.11 Eisenmann SystemEisenmann markets a rotary adsorption system that can be coupled with either a catalytic
or thermal incinerator (for low value, multicomponent OV) or a condenser (for high value,relatively pure OV). Figure 3-14 shows the rotary system coupled to a thermal oxidizer for OVdestruction and Figure 3-15 shows the rotary system coupled to a condenser for OV recovery.Table 3-11 summarizes field installations reported by Eisenmann for OV concentrationsapproaching 100 ppm.
3.3.12 Purus SystemPurus has developed the PADRE™ system that uses a hydrophobic polymer sorbent
developed by Dow. A schematic is shown in Figure 3-16. The system consists of dual fixedbeds which are alternately on-line and off-line. The OV is condensed and recycled. Oneadvantage claimed by Purus is that the Dow sorbent has high OV capacity even at highhumidities. This appears to have led to a number of applications of this system for airstripping and soil venting.
One field installation in California is operating on a small (14 ft3/min) gas flow with inletOV concentration of 330 ppm of C2 chlorinated solvents. Adsorption isotherms are providedby Purus for OV concentrations down to less than 10 ppm, suggesting that the sorbent iscapable of removing practical levels of OV at inlet concentrations that are of interest here. Nocosts were available.
3.3.13 Kelco SystemThe VAPOREX™ system is similar in principle to the Dedert Supersorbon system. It consists
of dual fixed carbon beds with steam regeneration. The OV is condensed and either recycledor disposed (Figure 3-17). Field applications of the system have been low flow rate gases
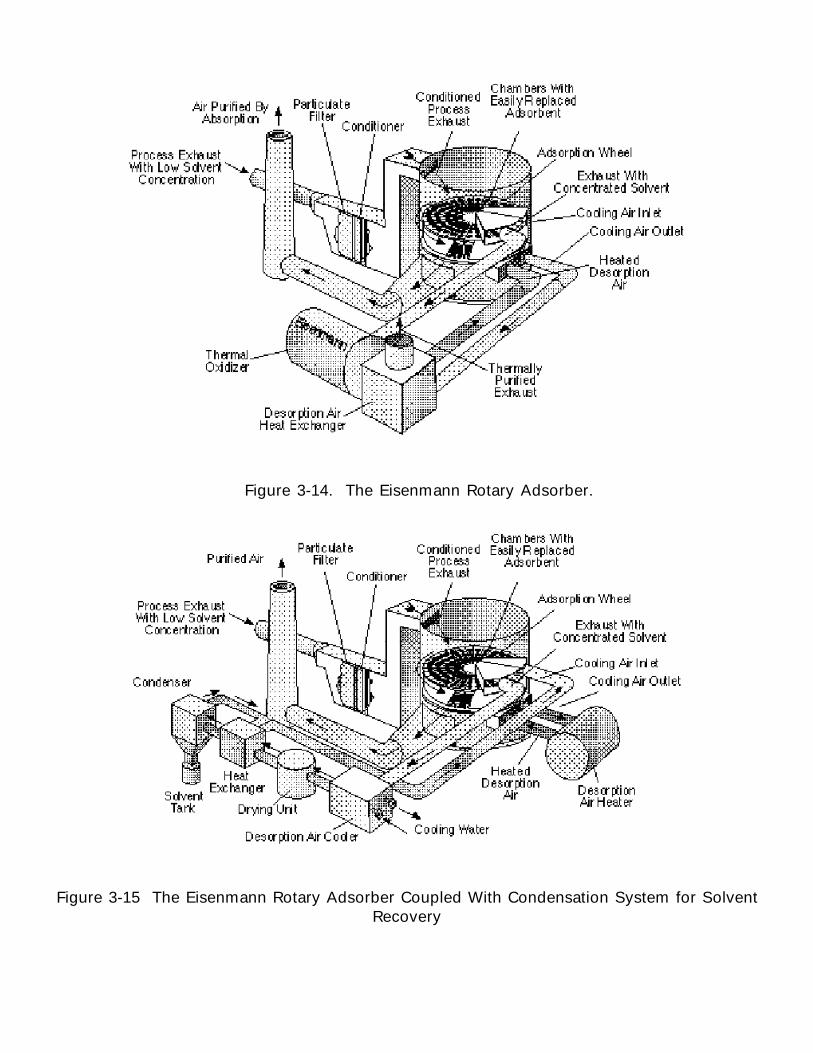
Figure 3-14. The Eisenmann Rotary Adsorber.
Figure 3-15 The Eisenmann Rotary Adsorber Coupled With Condensation System for SolventRecovery
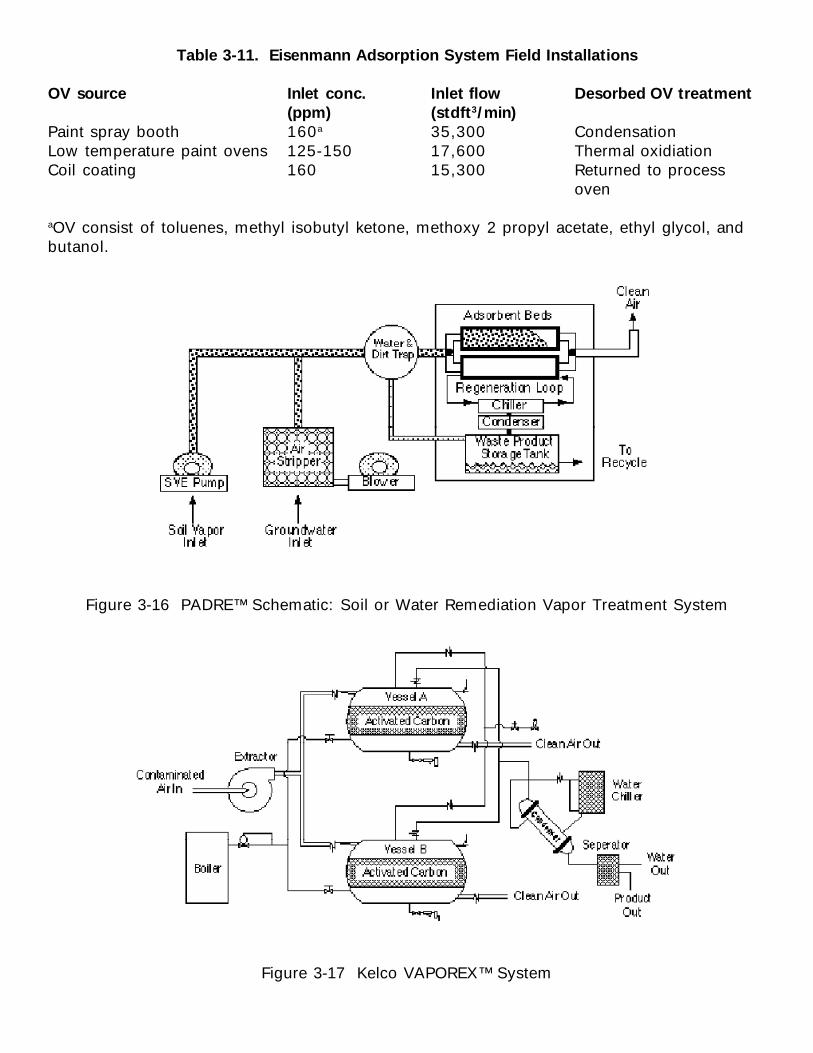
Table 3-11. Eisenmann Adsorption System Field Installations
OV source Inlet conc. Inlet flow Desorbed OV treatment(ppm) (stdft3/min)
Paint spray booth 160a 35,300 CondensationLow temperature paint ovens 125-150 17,600 Thermal oxidiationCoil coating 160 15,300 Returned to process
oven
aOV consist of toluenes, methyl isobutyl ketone, methoxy 2 propyl acetate, ethyl glycol, andbutanol.
Figure 3-16 PADRE™ Schematic: Soil or Water Remediation Vapor Treatment System
Figure 3-17 Kelco VAPOREX™ System
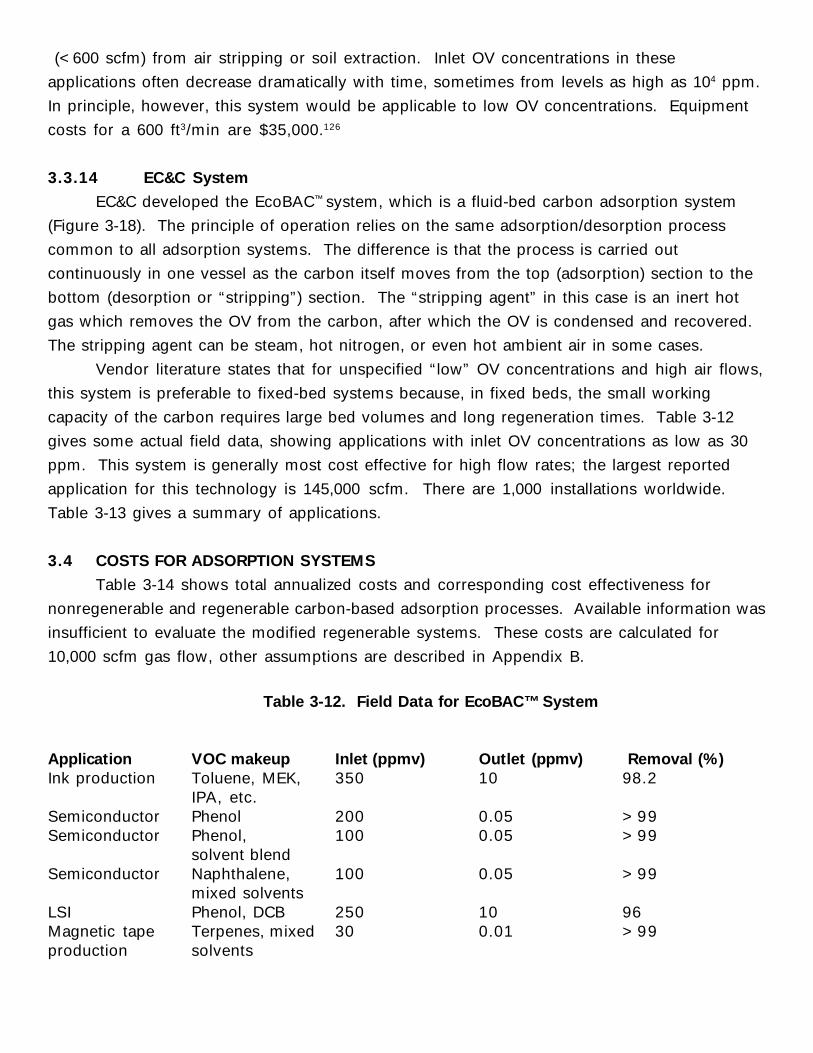
(<600 scfm) from air stripping or soil extraction. Inlet OV concentrations in these
applications often decrease dramatically with time, sometimes from levels as high as 104 ppm.
In principle, however, this system would be applicable to low OV concentrations. Equipment
costs for a 600 ft3/min are $35,000.126
3.3.14 EC&C System
EC&C developed the EcoBAC™ system, which is a fluid-bed carbon adsorption system
(Figure 3-18). The principle of operation relies on the same adsorption/desorption process
common to all adsorption systems. The difference is that the process is carried out
continuously in one vessel as the carbon itself moves from the top (adsorption) section to the
bottom (desorption or “stripping”) section. The “stripping agent” in this case is an inert hot
gas which removes the OV from the carbon, after which the OV is condensed and recovered.
The stripping agent can be steam, hot nitrogen, or even hot ambient air in some cases.
Vendor literature states that for unspecified “low” OV concentrations and high air flows,
this system is preferable to fixed-bed systems because, in fixed beds, the small working
capacity of the carbon requires large bed volumes and long regeneration times. Table 3-12
gives some actual field data, showing applications with inlet OV concentrations as low as 30
ppm. This system is generally most cost effective for high flow rates; the largest reported
application for this technology is 145,000 scfm. There are 1,000 installations worldwide.
Table 3-13 gives a summary of applications.
3.4 COSTS FOR ADSORPTION SYSTEMS
Table 3-14 shows total annualized costs and corresponding cost effectiveness for
nonregenerable and regenerable carbon-based adsorption processes. Available information was
insufficient to evaluate the modified regenerable systems. These costs are calculated for
10,000 scfm gas flow, other assumptions are described in Appendix B.
Table 3-12. Field Data for EcoBAC™ System
Application VOC makeup Inlet (ppmv) Outlet (ppmv) Removal (%)Ink production Toluene, MEK, 350 10 98.2
IPA, etc.Semiconductor Phenol 200 0.05 >99Semiconductor Phenol, 100 0.05 >99
solvent blendSemiconductor Naphthalene, 100 0.05 >99
mixed solventsLSI Phenol, DCB 250 10 96Magnetic tape Terpenes, mixed 30 0.01 >99production solvents
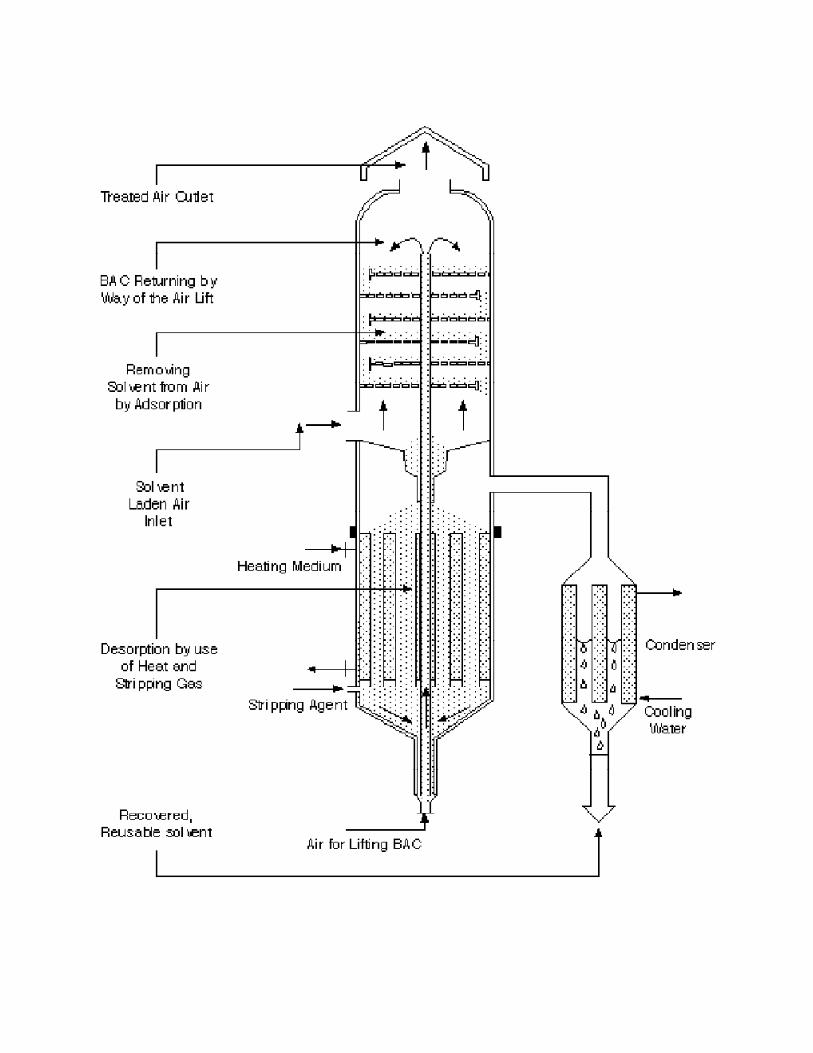
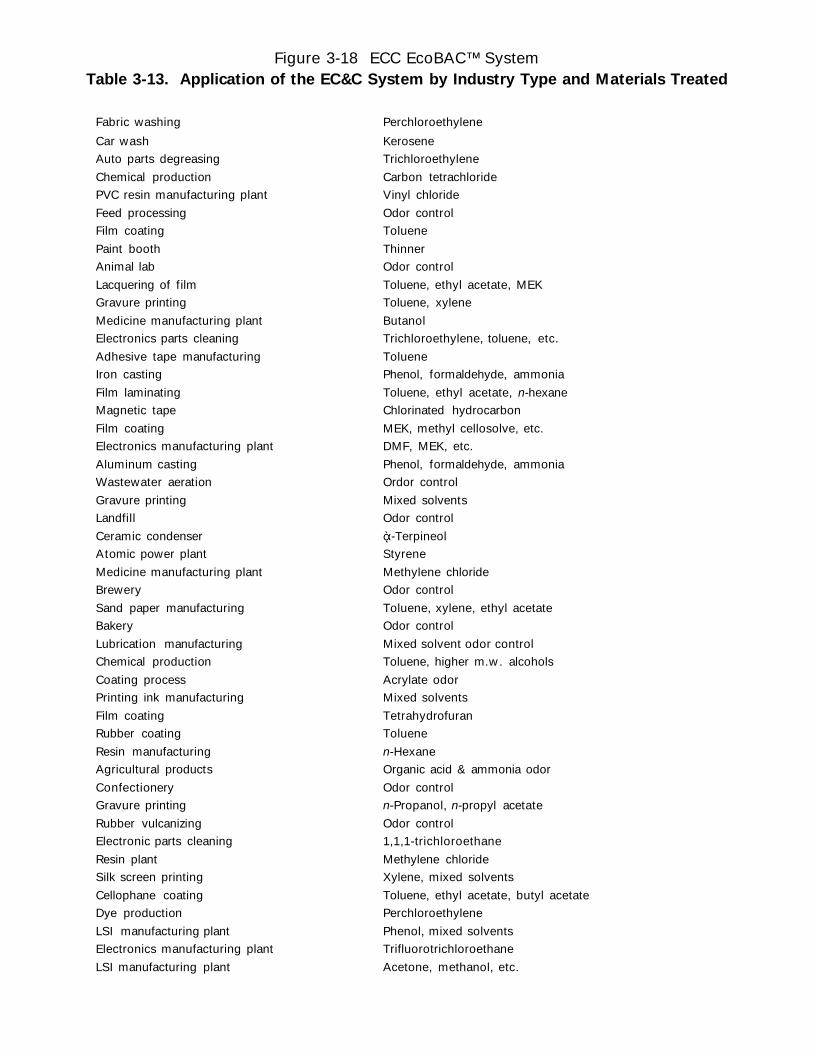
Figure 3-18 ECC EcoBAC™ SystemTable 3-13. Application of the EC&C System by Industry Type and Materials Treated
Fabric washing Perchloroethylene
Car wash KeroseneAuto parts degreasing Trichloroethylene
Chemical production Carbon tetrachloridePVC resin manufacturing plant Vinyl chloride
Feed processing Odor controlFilm coating Toluene
Paint booth ThinnerAnimal lab Odor control
Lacquering of film Toluene, ethyl acetate, MEKGravure printing Toluene, xylene
Medicine manufacturing plant ButanolElectronics parts cleaning Trichloroethylene, toluene, etc.
Adhesive tape manufacturing TolueneIron casting Phenol, formaldehyde, ammonia
Film laminating Toluene, ethyl acetate, n-hexaneMagnetic tape Chlorinated hydrocarbon
Film coating MEK, methyl cellosolve, etc.Electronics manufacturing plant DMF, MEK, etc.
Aluminum casting Phenol, formaldehyde, ammoniaWastewater aeration Ordor control
Gravure printing Mixed solventsLandfill Odor control
Ceramic condenser “-TerpineolAtomic power plant Styrene
Medicine manufacturing plant Methylene chlorideBrewery Odor control
Sand paper manufacturing Toluene, xylene, ethyl acetateBakery Odor control
Lubrication manufacturing Mixed solvent odor controlChemical production Toluene, higher m.w. alcohols
Coating process Acrylate odorPrinting ink manufacturing Mixed solvents
Film coating TetrahydrofuranRubber coating Toluene
Resin manufacturing n-HexaneAgricultural products Organic acid & ammonia odor
Confectionery Odor controlGravure printing n-Propanol, n-propyl acetate
Rubber vulcanizing Odor controlElectronic parts cleaning 1,1,1-trichloroethane
Resin plant Methylene chlorideSilk screen printing Xylene, mixed solvents
Cellophane coating Toluene, ethyl acetate, butyl acetateDye production Perchloroethylene
LSI manufacturing plant Phenol, mixed solventsElectronics manufacturing plant Trifluorotrichloroethane
LSI manufacturing plant Acetone, methanol, etc.
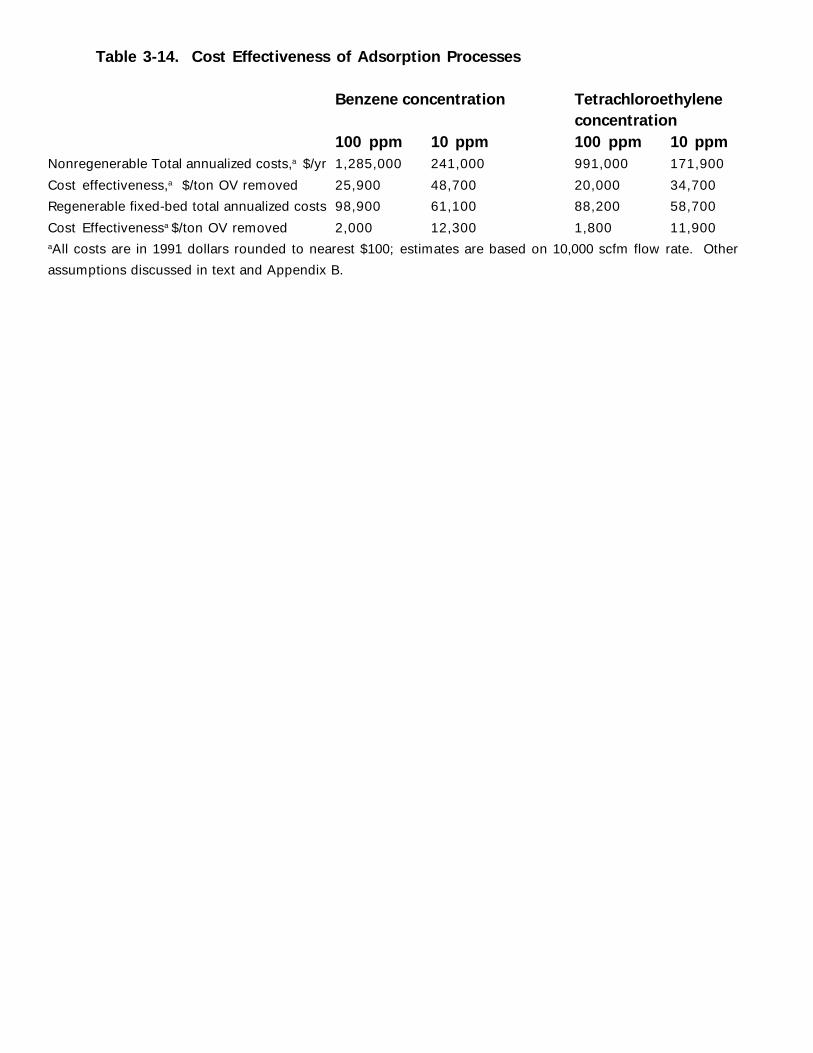
Table 3-14. Cost Effectiveness of Adsorption Processes
Benzene concentration Tetrachloroethyleneconcentration
100 ppm 10 ppm 100 ppm 10 ppmNonregenerable Total annualized costs,a $/yr 1,285,000 241,000 991,000 171,900
Cost effectiveness,a $/ton OV removed 25,900 48,700 20,000 34,700
Regenerable fixed-bed total annualized costs 98,900 61,100 88,200 58,700
Cost Effectivenessa $/ton OV removed 2,000 12,300 1,800 11,900aAll costs are in 1991 dollars rounded to nearest $100; estimates are based on 10,000 scfm flow rate. Other
assumptions discussed in text and Appendix B.
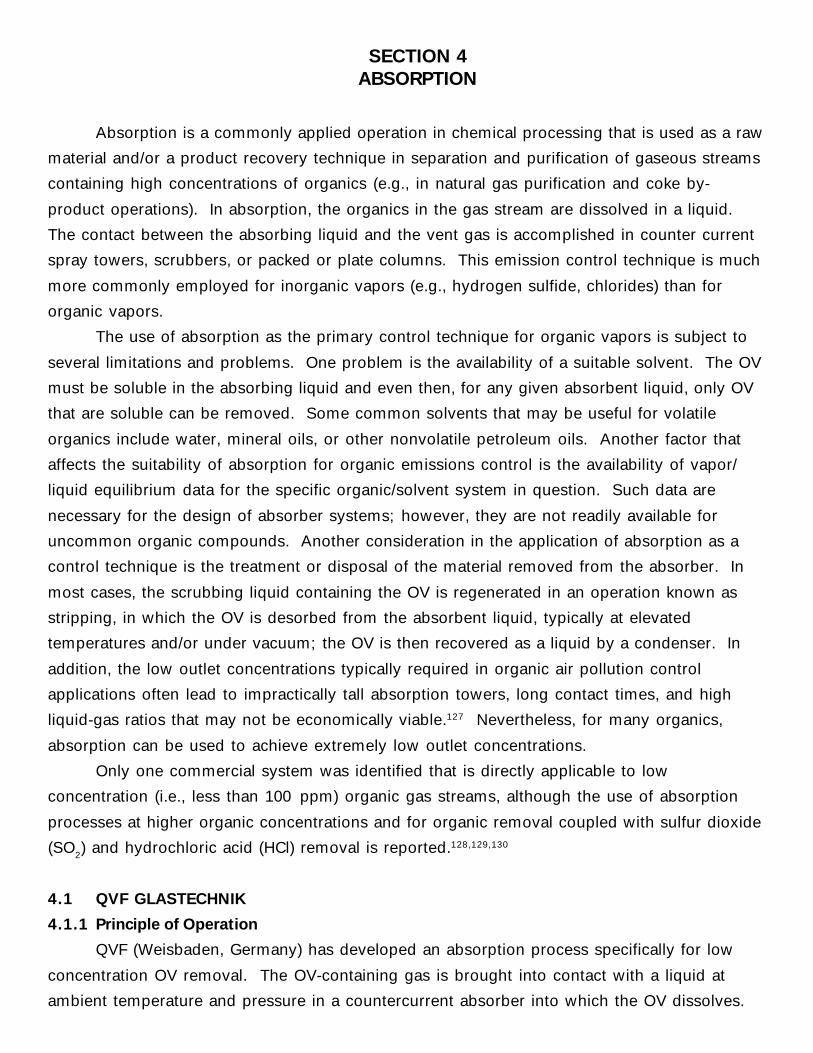
SECTION 4ABSORPTION
Absorption is a commonly applied operation in chemical processing that is used as a raw
material and/or a product recovery technique in separation and purification of gaseous streams
containing high concentrations of organics (e.g., in natural gas purification and coke by-
product operations). In absorption, the organics in the gas stream are dissolved in a liquid.
The contact between the absorbing liquid and the vent gas is accomplished in counter current
spray towers, scrubbers, or packed or plate columns. This emission control technique is much
more commonly employed for inorganic vapors (e.g., hydrogen sulfide, chlorides) than for
organic vapors.
The use of absorption as the primary control technique for organic vapors is subject to
several limitations and problems. One problem is the availability of a suitable solvent. The OV
must be soluble in the absorbing liquid and even then, for any given absorbent liquid, only OV
that are soluble can be removed. Some common solvents that may be useful for volatile
organics include water, mineral oils, or other nonvolatile petroleum oils. Another factor that
affects the suitability of absorption for organic emissions control is the availability of vapor/
liquid equilibrium data for the specific organic/solvent system in question. Such data are
necessary for the design of absorber systems; however, they are not readily available for
uncommon organic compounds. Another consideration in the application of absorption as a
control technique is the treatment or disposal of the material removed from the absorber. In
most cases, the scrubbing liquid containing the OV is regenerated in an operation known as
stripping, in which the OV is desorbed from the absorbent liquid, typically at elevated
temperatures and/or under vacuum; the OV is then recovered as a liquid by a condenser. In
addition, the low outlet concentrations typically required in organic air pollution control
applications often lead to impractically tall absorption towers, long contact times, and high
liquid-gas ratios that may not be economically viable.127 Nevertheless, for many organics,
absorption can be used to achieve extremely low outlet concentrations.
Only one commercial system was identified that is directly applicable to low
concentration (i.e., less than 100 ppm) organic gas streams, although the use of absorption
processes at higher organic concentrations and for organic removal coupled with sulfur dioxide
(SO2) and hydrochloric acid (HCl) removal is reported.128,129,130
4.1 QVF GLASTECHNIK
4.1.1 Principle of Operation
QVF (Weisbaden, Germany) has developed an absorption process specifically for low
concentration OV removal. The OV-containing gas is brought into contact with a liquid at
ambient temperature and pressure in a countercurrent absorber into which the OV dissolves.
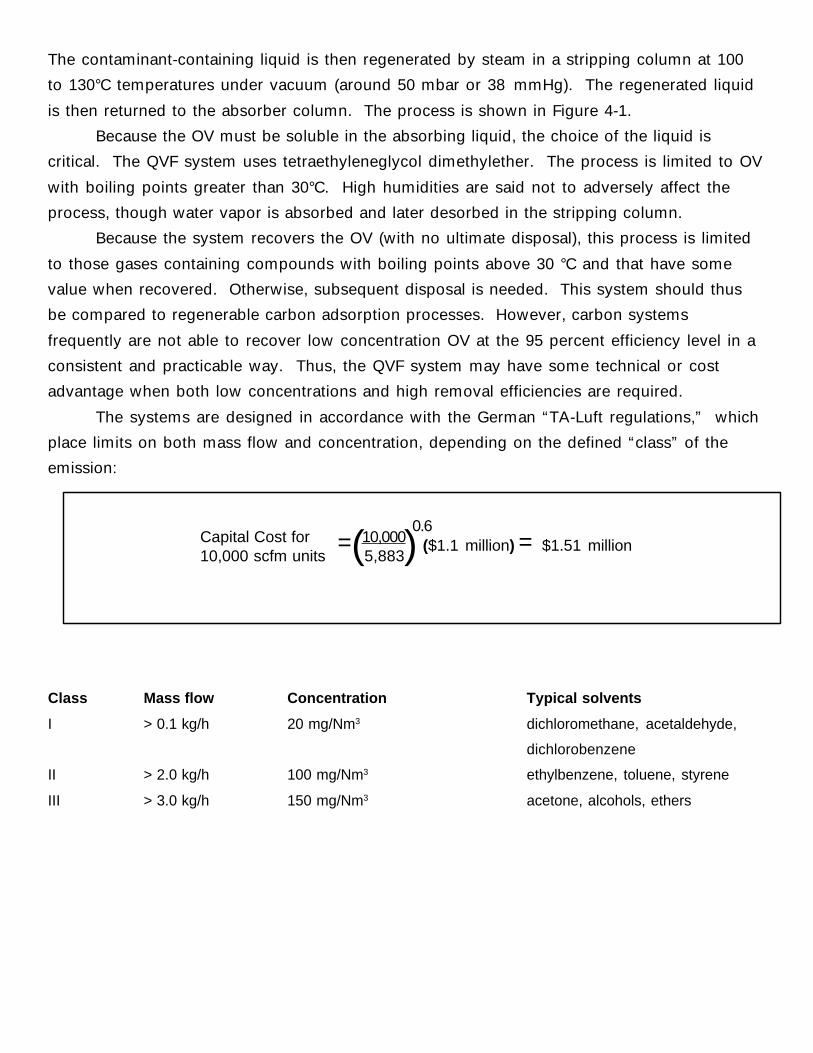
The contaminant-containing liquid is then regenerated by steam in a stripping column at 100
to 130°C temperatures under vacuum (around 50 mbar or 38 mmHg). The regenerated liquid
is then returned to the absorber column. The process is shown in Figure 4-1.
Because the OV must be soluble in the absorbing liquid, the choice of the liquid is
critical. The QVF system uses tetraethyleneglycol dimethylether. The process is limited to OV
with boiling points greater than 30°C. High humidities are said not to adversely affect the
process, though water vapor is absorbed and later desorbed in the stripping column.
Because the system recovers the OV (with no ultimate disposal), this process is limited
to those gases containing compounds with boiling points above 30 °C and that have some
value when recovered. Otherwise, subsequent disposal is needed. This system should thus
be compared to regenerable carbon adsorption processes. However, carbon systems
frequently are not able to recover low concentration OV at the 95 percent efficiency level in a
consistent and practicable way. Thus, the QVF system may have some technical or cost
advantage when both low concentrations and high removal efficiencies are required.
The systems are designed in accordance with the German “TA-Luft regulations,” which
place limits on both mass flow and concentration, depending on the defined “class” of the
emission:
Class Mass flow Concentration Typical solvents
I > 0.1 kg/h 20 mg/Nm3 dichloromethane, acetaldehyde,
dichlorobenzene
II > 2.0 kg/h 100 mg/Nm3 ethylbenzene, toluene, styrene
III > 3.0 kg/h 150 mg/Nm3 acetone, alcohols, ethers
Capital Cost for10,000 scfm units
10,0005,883
=( )0.6
($1.1 million) = $1.51 million
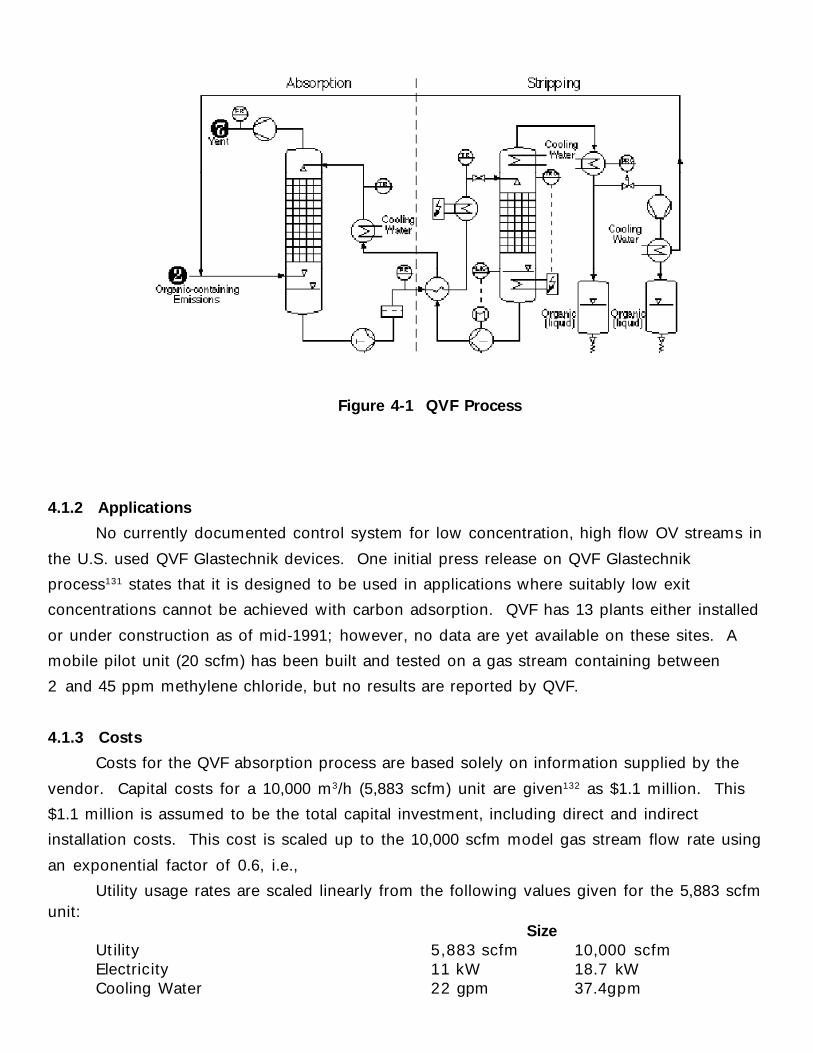
Figure 4-1 QVF Process
4.1.2 Applications
No currently documented control system for low concentration, high flow OV streams in
the U.S. used QVF Glastechnik devices. One initial press release on QVF Glastechnik
process131 states that it is designed to be used in applications where suitably low exit
concentrations cannot be achieved with carbon adsorption. QVF has 13 plants either installed
or under construction as of mid-1991; however, no data are yet available on these sites. A
mobile pilot unit (20 scfm) has been built and tested on a gas stream containing between
2 and 45 ppm methylene chloride, but no results are reported by QVF.
4.1.3 Costs
Costs for the QVF absorption process are based solely on information supplied by the
vendor. Capital costs for a 10,000 m3/h (5,883 scfm) unit are given132 as $1.1 million. This
$1.1 million is assumed to be the total capital investment, including direct and indirect
installation costs. This cost is scaled up to the 10,000 scfm model gas stream flow rate using
an exponential factor of 0.6, i.e.,
Utility usage rates are scaled linearly from the following values given for the 5,883 scfmunit:
SizeUtility 5,883 scfm 10,000 scfmElectricity 11 kW 18.7 kWCooling Water 22 gpm 37.4gpm
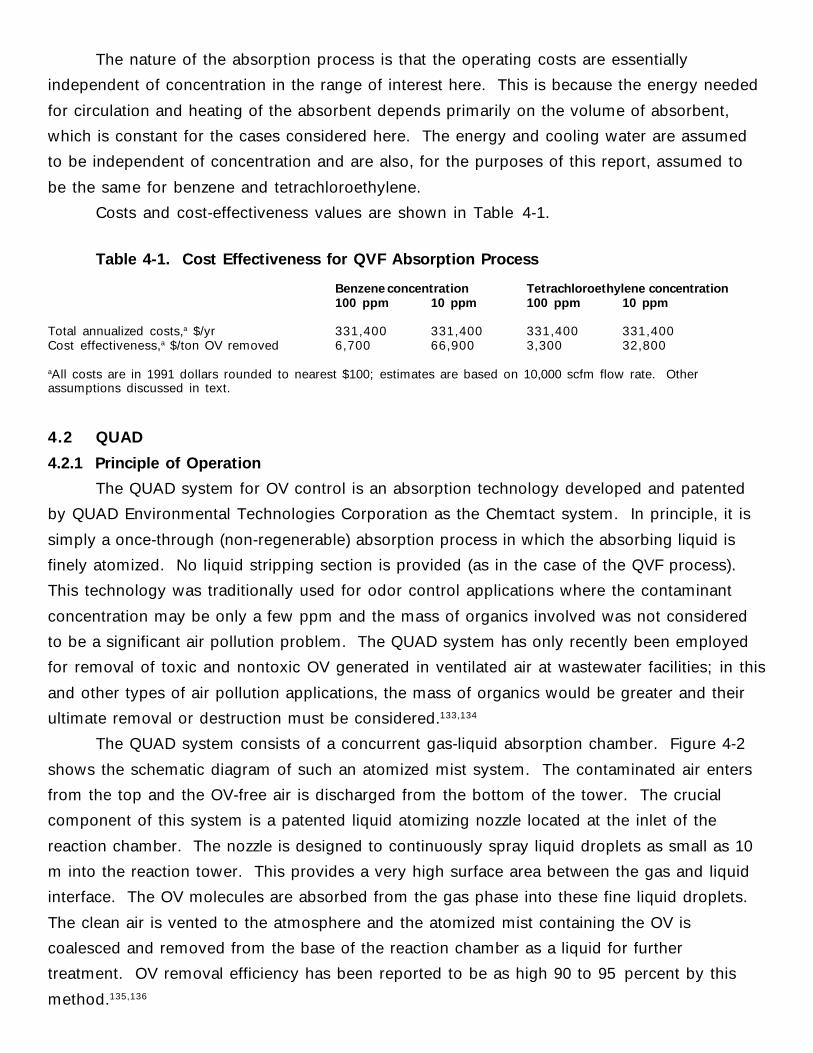
The nature of the absorption process is that the operating costs are essentially
independent of concentration in the range of interest here. This is because the energy needed
for circulation and heating of the absorbent depends primarily on the volume of absorbent,
which is constant for the cases considered here. The energy and cooling water are assumed
to be independent of concentration and are also, for the purposes of this report, assumed to
be the same for benzene and tetrachloroethylene.
Costs and cost-effectiveness values are shown in Table 4-1.
Table 4-1. Cost Effectiveness for QVF Absorption Process
Benzene concentration Tetrachloroethylene concentration100 ppm 10 ppm 100 ppm 10 ppm
Total annualized costs,a $/yr 331,400 331,400 331,400 331,400Cost effectiveness,a $/ton OV removed 6,700 66,900 3,300 32,800
aAll costs are in 1991 dollars rounded to nearest $100; estimates are based on 10,000 scfm flow rate. Otherassumptions discussed in text.
4.2 QUAD
4.2.1 Principle of Operation
The QUAD system for OV control is an absorption technology developed and patented
by QUAD Environmental Technologies Corporation as the Chemtact system. In principle, it is
simply a once-through (non-regenerable) absorption process in which the absorbing liquid is
finely atomized. No liquid stripping section is provided (as in the case of the QVF process).
This technology was traditionally used for odor control applications where the contaminant
concentration may be only a few ppm and the mass of organics involved was not considered
to be a significant air pollution problem. The QUAD system has only recently been employed
for removal of toxic and nontoxic OV generated in ventilated air at wastewater facilities; in this
and other types of air pollution applications, the mass of organics would be greater and their
ultimate removal or destruction must be considered.133,134
The QUAD system consists of a concurrent gas-liquid absorption chamber. Figure 4-2
shows the schematic diagram of such an atomized mist system. The contaminated air enters
from the top and the OV-free air is discharged from the bottom of the tower. The crucial
component of this system is a patented liquid atomizing nozzle located at the inlet of the
reaction chamber. The nozzle is designed to continuously spray liquid droplets as small as 10
m into the reaction tower. This provides a very high surface area between the gas and liquid
interface. The OV molecules are absorbed from the gas phase into these fine liquid droplets.
The clean air is vented to the atmosphere and the atomized mist containing the OV is
coalesced and removed from the base of the reaction chamber as a liquid for further
treatment. OV removal efficiency has been reported to be as high 90 to 95 percent by this
method.135,136
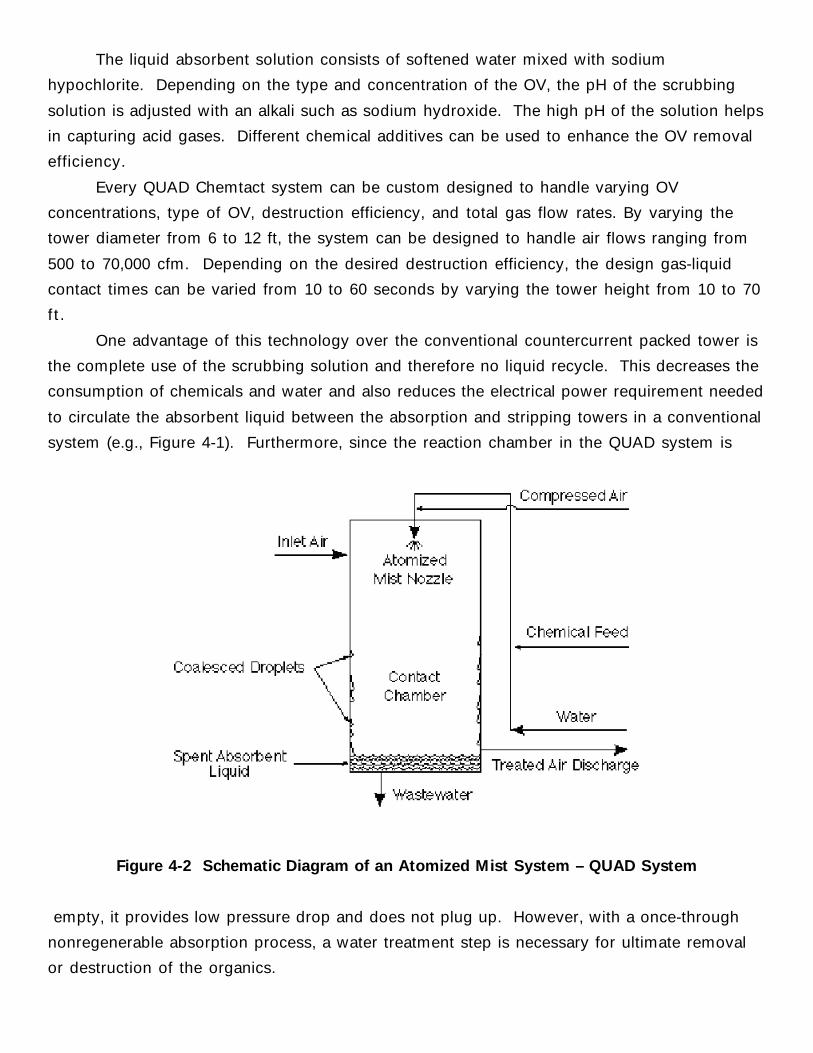
The liquid absorbent solution consists of softened water mixed with sodium
hypochlorite. Depending on the type and concentration of the OV, the pH of the scrubbing
solution is adjusted with an alkali such as sodium hydroxide. The high pH of the solution helps
in capturing acid gases. Different chemical additives can be used to enhance the OV removal
efficiency.
Every QUAD Chemtact system can be custom designed to handle varying OV
concentrations, type of OV, destruction efficiency, and total gas flow rates. By varying the
tower diameter from 6 to 12 ft, the system can be designed to handle air flows ranging from
500 to 70,000 cfm. Depending on the desired destruction efficiency, the design gas-liquid
contact times can be varied from 10 to 60 seconds by varying the tower height from 10 to 70
ft.
One advantage of this technology over the conventional countercurrent packed tower is
the complete use of the scrubbing solution and therefore no liquid recycle. This decreases the
consumption of chemicals and water and also reduces the electrical power requirement needed
to circulate the absorbent liquid between the absorption and stripping towers in a conventional
system (e.g., Figure 4-1). Furthermore, since the reaction chamber in the QUAD system is
Figure 4-2 Schematic Diagram of an Atomized Mist System – QUAD System
empty, it provides low pressure drop and does not plug up. However, with a once-through
nonregenerable absorption process, a water treatment step is necessary for ultimate removal
or destruction of the organics.
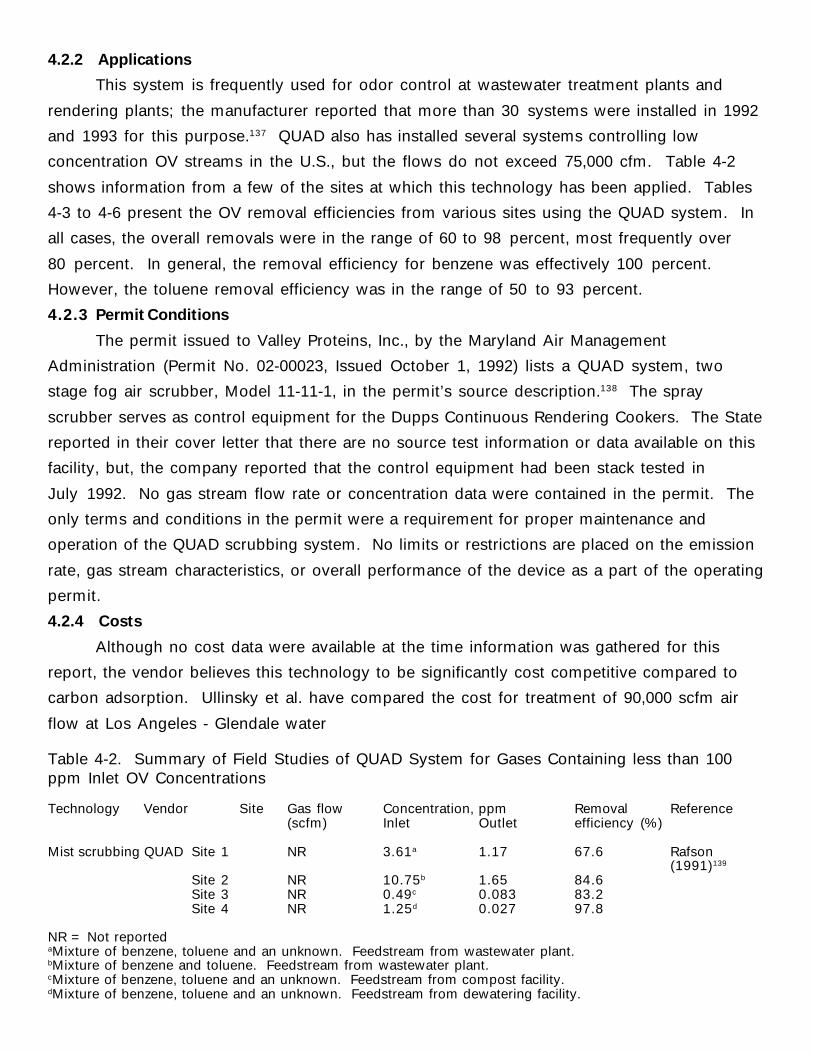
4.2.2 Applications
This system is frequently used for odor control at wastewater treatment plants and
rendering plants; the manufacturer reported that more than 30 systems were installed in 1992
and 1993 for this purpose.137 QUAD also has installed several systems controlling low
concentration OV streams in the U.S., but the flows do not exceed 75,000 cfm. Table 4-2
shows information from a few of the sites at which this technology has been applied. Tables
4-3 to 4-6 present the OV removal efficiencies from various sites using the QUAD system. In
all cases, the overall removals were in the range of 60 to 98 percent, most frequently over
80 percent. In general, the removal efficiency for benzene was effectively 100 percent.
However, the toluene removal efficiency was in the range of 50 to 93 percent.
4.2.3 Permit Conditions
The permit issued to Valley Proteins, Inc., by the Maryland Air Management
Administration (Permit No. 02-00023, Issued October 1, 1992) lists a QUAD system, two
stage fog air scrubber, Model 11-11-1, in the permit’s source description.138 The spray
scrubber serves as control equipment for the Dupps Continuous Rendering Cookers. The State
reported in their cover letter that there are no source test information or data available on this
facility, but, the company reported that the control equipment had been stack tested in
July 1992. No gas stream flow rate or concentration data were contained in the permit. The
only terms and conditions in the permit were a requirement for proper maintenance and
operation of the QUAD scrubbing system. No limits or restrictions are placed on the emission
rate, gas stream characteristics, or overall performance of the device as a part of the operating
permit.
4.2.4 Costs
Although no cost data were available at the time information was gathered for this
report, the vendor believes this technology to be significantly cost competitive compared to
carbon adsorption. Ullinsky et al. have compared the cost for treatment of 90,000 scfm air
flow at Los Angeles - Glendale water
Table 4-2. Summary of Field Studies of QUAD System for Gases Containing less than 100ppm Inlet OV Concentrations
Technology Vendor Site Gas flow Concentration, ppm Removal Reference(scfm) Inlet Outlet efficiency (%)
Mist scrubbing QUAD Site 1 NR 3.61a 1.17 67.6 Rafson(1991)139
Site 2 NR 10.75b 1.65 84.6Site 3 NR 0.49c 0.083 83.2Site 4 NR 1.25d 0.027 97.8
NR = Not reportedaMixture of benzene, toluene and an unknown. Feedstream from wastewater plant.bMixture of benzene and toluene. Feedstream from wastewater plant.cMixture of benzene, toluene and an unknown. Feedstream from compost facility.dMixture of benzene, toluene and an unknown. Feedstream from dewatering facility.
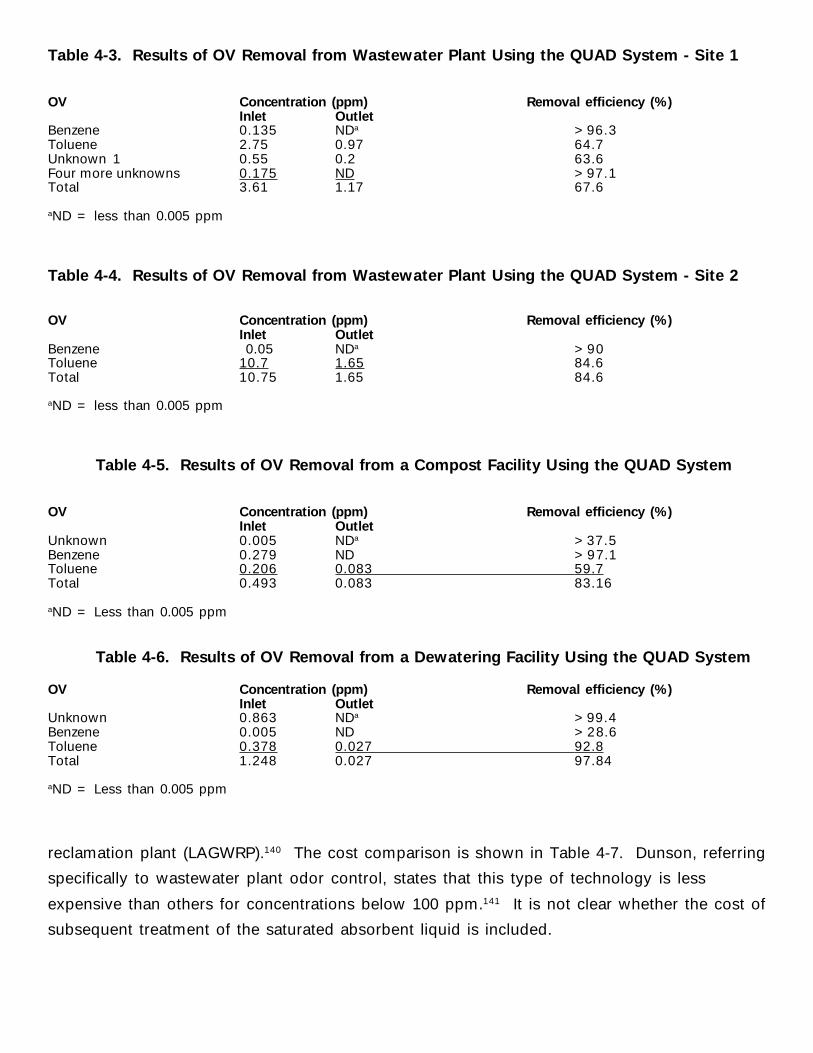
Table 4-3. Results of OV Removal from Wastewater Plant Using the QUAD System - Site 1
OV Concentration (ppm) Removal efficiency (%)Inlet Outlet
Benzene 0.135 NDa >96.3Toluene 2.75 0.97 64.7Unknown 1 0.55 0.2 63.6Four more unknowns 0.175 ND >97.1Total 3.61 1.17 67.6
aND = less than 0.005 ppm
Table 4-4. Results of OV Removal from Wastewater Plant Using the QUAD System - Site 2
OV Concentration (ppm) Removal efficiency (%)Inlet Outlet
Benzene 0.05 NDa >90Toluene 10.7 1.65 84.6Total 10.75 1.65 84.6
aND = less than 0.005 ppm
Table 4-5. Results of OV Removal from a Compost Facility Using the QUAD System
OV Concentration (ppm) Removal efficiency (%)Inlet Outlet
Unknown 0.005 NDa >37.5Benzene 0.279 ND >97.1Toluene 0.206 0.083 59.7Total 0.493 0.083 83.16
aND = Less than 0.005 ppm
Table 4-6. Results of OV Removal from a Dewatering Facility Using the QUAD System
OV Concentration (ppm) Removal efficiency (%)Inlet Outlet
Unknown 0.863 NDa >99.4Benzene 0.005 ND >28.6Toluene 0.378 0.027 92.8Total 1.248 0.027 97.84
aND = Less than 0.005 ppm
reclamation plant (LAGWRP).140 The cost comparison is shown in Table 4-7. Dunson, referring
specifically to wastewater plant odor control, states that this type of technology is less
expensive than others for concentrations below 100 ppm.141 It is not clear whether the cost of
subsequent treatment of the saturated absorbent liquid is included.
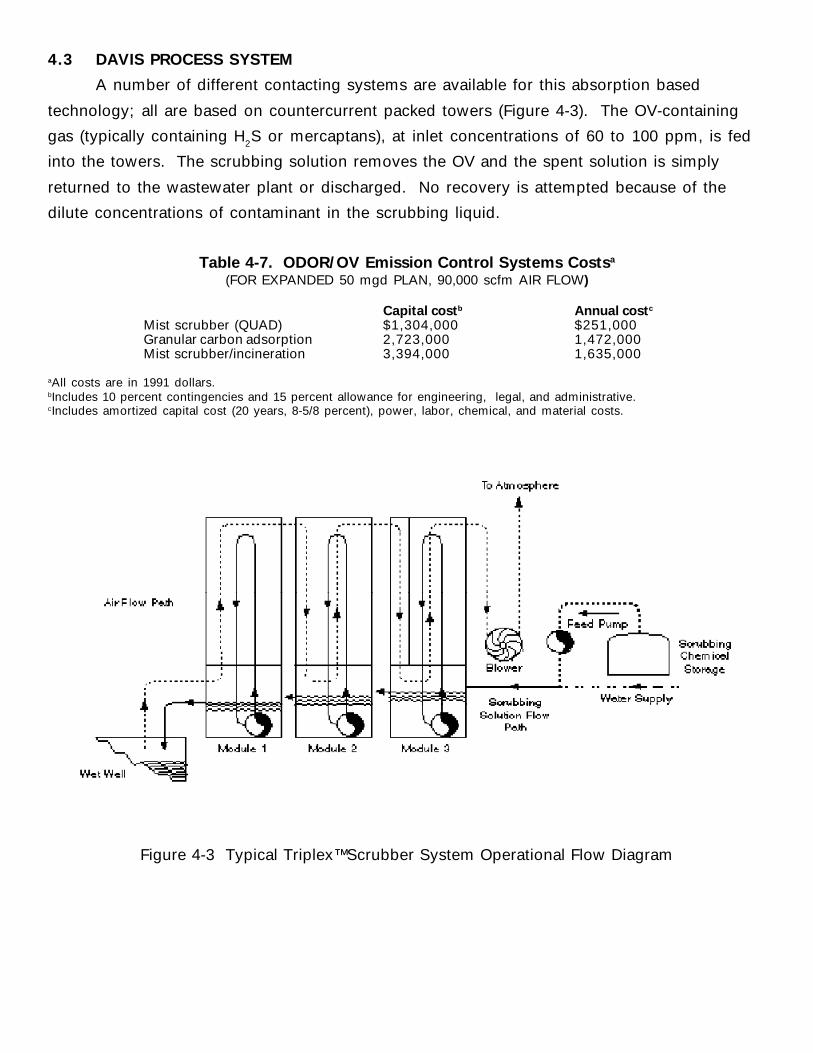
4.3 DAVIS PROCESS SYSTEM
A number of different contacting systems are available for this absorption based
technology; all are based on countercurrent packed towers (Figure 4-3). The OV-containing
gas (typically containing H2S or mercaptans), at inlet concentrations of 60 to 100 ppm, is fed
into the towers. The scrubbing solution removes the OV and the spent solution is simply
returned to the wastewater plant or discharged. No recovery is attempted because of the
dilute concentrations of contaminant in the scrubbing liquid.
Table 4-7. ODOR/OV Emission Control Systems Costsa
(FOR EXPANDED 50 mgd PLAN, 90,000 scfm AIR FLOW)
Capital costb Annual costc
Mist scrubber (QUAD) $1,304,000 $251,000Granular carbon adsorption 2,723,000 1,472,000Mist scrubber/incineration 3,394,000 1,635,000
aAll costs are in 1991 dollars.bIncludes 10 percent contingencies and 15 percent allowance for engineering, legal, and administrative.cIncludes amortized capital cost (20 years, 8-5/8 percent), power, labor, chemical, and material costs.
Figure 4-3 Typical Triplex™Scrubber System Operational Flow Diagram
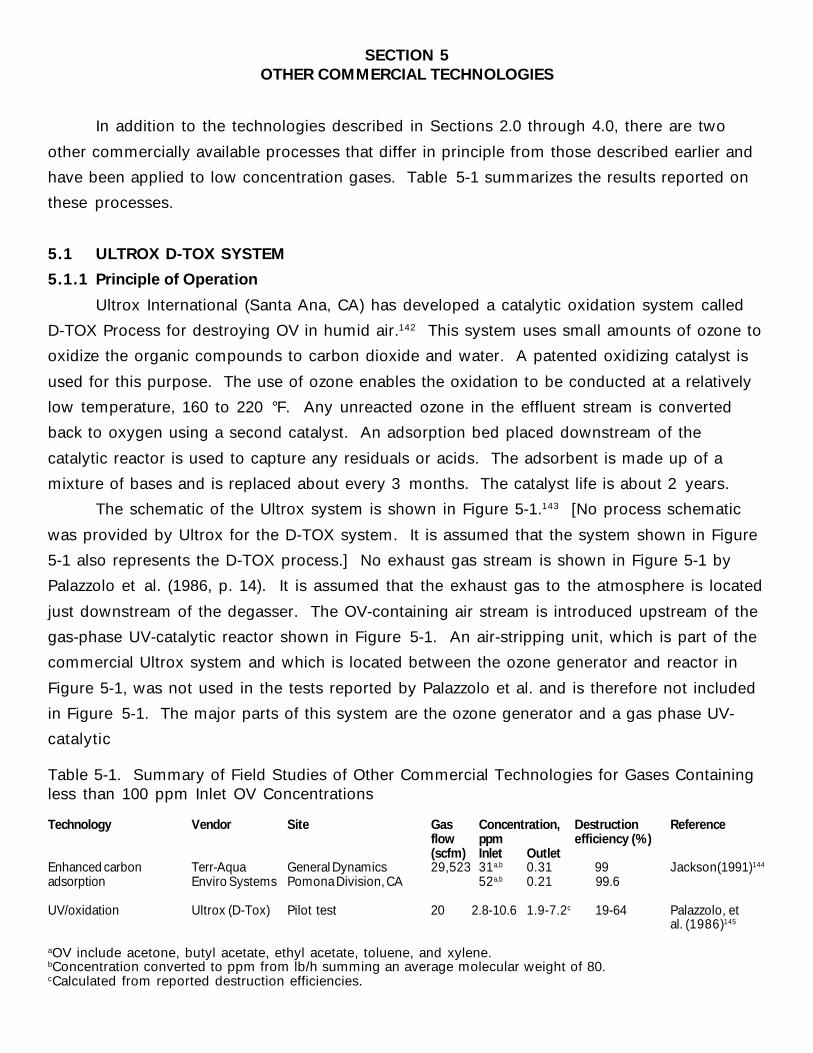
SECTION 5OTHER COMMERCIAL TECHNOLOGIES
In addition to the technologies described in Sections 2.0 through 4.0, there are two
other commercially available processes that differ in principle from those described earlier and
have been applied to low concentration gases. Table 5-1 summarizes the results reported on
these processes.
5.1 ULTROX D-TOX SYSTEM
5.1.1 Principle of Operation
Ultrox International (Santa Ana, CA) has developed a catalytic oxidation system called
D-TOX Process for destroying OV in humid air.142 This system uses small amounts of ozone to
oxidize the organic compounds to carbon dioxide and water. A patented oxidizing catalyst is
used for this purpose. The use of ozone enables the oxidation to be conducted at a relatively
low temperature, 160 to 220 °F. Any unreacted ozone in the effluent stream is converted
back to oxygen using a second catalyst. An adsorption bed placed downstream of the
catalytic reactor is used to capture any residuals or acids. The adsorbent is made up of a
mixture of bases and is replaced about every 3 months. The catalyst life is about 2 years.
The schematic of the Ultrox system is shown in Figure 5-1.143 [No process schematic
was provided by Ultrox for the D-TOX system. It is assumed that the system shown in Figure
5-1 also represents the D-TOX process.] No exhaust gas stream is shown in Figure 5-1 by
Palazzolo et al. (1986, p. 14). It is assumed that the exhaust gas to the atmosphere is located
just downstream of the degasser. The OV-containing air stream is introduced upstream of the
gas-phase UV-catalytic reactor shown in Figure 5-1. An air-stripping unit, which is part of the
commercial Ultrox system and which is located between the ozone generator and reactor in
Figure 5-1, was not used in the tests reported by Palazzolo et al. and is therefore not included
in Figure 5-1. The major parts of this system are the ozone generator and a gas phase UV-
catalytic
Table 5-1. Summary of Field Studies of Other Commercial Technologies for Gases Containingless than 100 ppm Inlet OV Concentrations
Technology Vendor Site Gas Concentration, Destruction Referenceflow ppm efficiency (%)(scfm) Inlet Outlet
Enhanced carbon Terr-Aqua General Dynamics 29,523 31a,b 0.31 99 Jackson(1991)144
adsorption Enviro Systems Pomona Division, CA 52a,b 0.21 99.6
UV/oxidation Ultrox (D-Tox) Pilot test 20 2.8-10.6 1.9-7.2c 19-64 Palazzolo, etal. (1986)145
aOV include acetone, butyl acetate, ethyl acetate, toluene, and xylene.bConcentration converted to ppm from lb/h summing an average molecular weight of 80.cCalculated from reported destruction efficiencies.
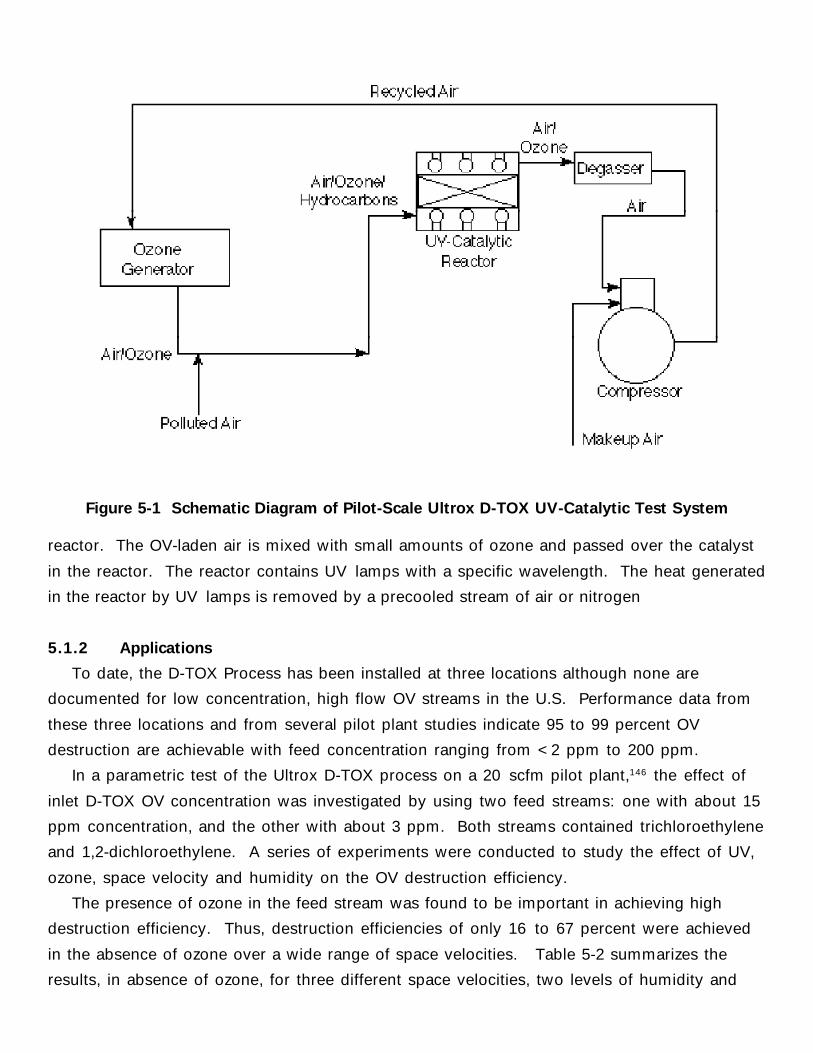
Figure 5-1 Schematic Diagram of Pilot-Scale Ultrox D-TOX UV-Catalytic Test System
reactor. The OV-laden air is mixed with small amounts of ozone and passed over the catalyst
in the reactor. The reactor contains UV lamps with a specific wavelength. The heat generated
in the reactor by UV lamps is removed by a precooled stream of air or nitrogen
5.1.2 Applications
To date, the D-TOX Process has been installed at three locations although none are
documented for low concentration, high flow OV streams in the U.S. Performance data from
these three locations and from several pilot plant studies indicate 95 to 99 percent OV
destruction are achievable with feed concentration ranging from <2 ppm to 200 ppm.
In a parametric test of the Ultrox D-TOX process on a 20 scfm pilot plant,146 the effect of
inlet D-TOX OV concentration was investigated by using two feed streams: one with about 15
ppm concentration, and the other with about 3 ppm. Both streams contained trichloroethylene
and 1,2-dichloroethylene. A series of experiments were conducted to study the effect of UV,
ozone, space velocity and humidity on the OV destruction efficiency.
The presence of ozone in the feed stream was found to be important in achieving high
destruction efficiency. Thus, destruction efficiencies of only 16 to 67 percent were achieved
in the absence of ozone over a wide range of space velocities. Table 5-2 summarizes the
results, in absence of ozone, for three different space velocities, two levels of humidity and
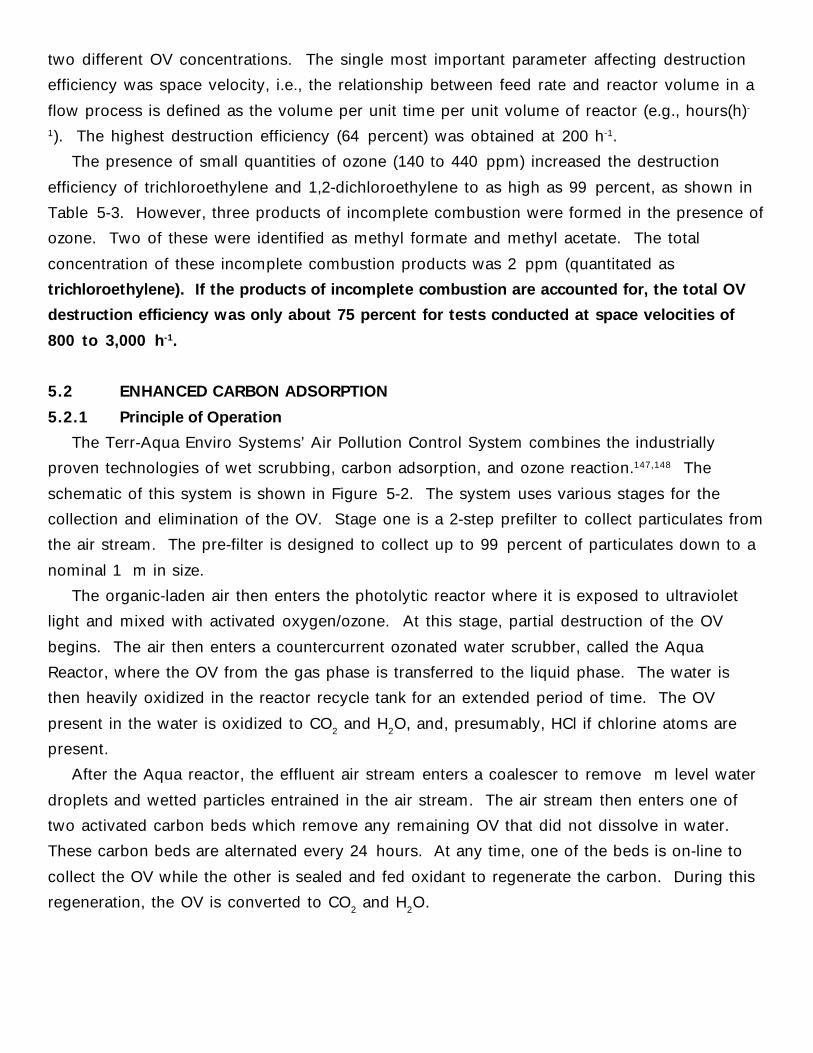
two different OV concentrations. The single most important parameter affecting destruction
efficiency was space velocity, i.e., the relationship between feed rate and reactor volume in a
flow process is defined as the volume per unit time per unit volume of reactor (e.g., hours(h)-
1). The highest destruction efficiency (64 percent) was obtained at 200 h-1.
The presence of small quantities of ozone (140 to 440 ppm) increased the destruction
efficiency of trichloroethylene and 1,2-dichloroethylene to as high as 99 percent, as shown in
Table 5-3. However, three products of incomplete combustion were formed in the presence of
ozone. Two of these were identified as methyl formate and methyl acetate. The total
concentration of these incomplete combustion products was 2 ppm (quantitated as
trichloroethylene). If the products of incomplete combustion are accounted for, the total OV
destruction efficiency was only about 75 percent for tests conducted at space velocities of
800 to 3,000 h-1.
5.2 ENHANCED CARBON ADSORPTION
5.2.1 Principle of Operation
The Terr-Aqua Enviro Systems’ Air Pollution Control System combines the industrially
proven technologies of wet scrubbing, carbon adsorption, and ozone reaction.147,148 The
schematic of this system is shown in Figure 5-2. The system uses various stages for the
collection and elimination of the OV. Stage one is a 2-step prefilter to collect particulates from
the air stream. The pre-filter is designed to collect up to 99 percent of particulates down to a
nominal 1 m in size.
The organic-laden air then enters the photolytic reactor where it is exposed to ultraviolet
light and mixed with activated oxygen/ozone. At this stage, partial destruction of the OV
begins. The air then enters a countercurrent ozonated water scrubber, called the Aqua
Reactor, where the OV from the gas phase is transferred to the liquid phase. The water is
then heavily oxidized in the reactor recycle tank for an extended period of time. The OV
present in the water is oxidized to CO2 and H2O, and, presumably, HCl if chlorine atoms are
present.
After the Aqua reactor, the effluent air stream enters a coalescer to remove m level water
droplets and wetted particles entrained in the air stream. The air stream then enters one of
two activated carbon beds which remove any remaining OV that did not dissolve in water.
These carbon beds are alternated every 24 hours. At any time, one of the beds is on-line to
collect the OV while the other is sealed and fed oxidant to regenerate the carbon. During this
regeneration, the OV is converted to CO2 and H2O.
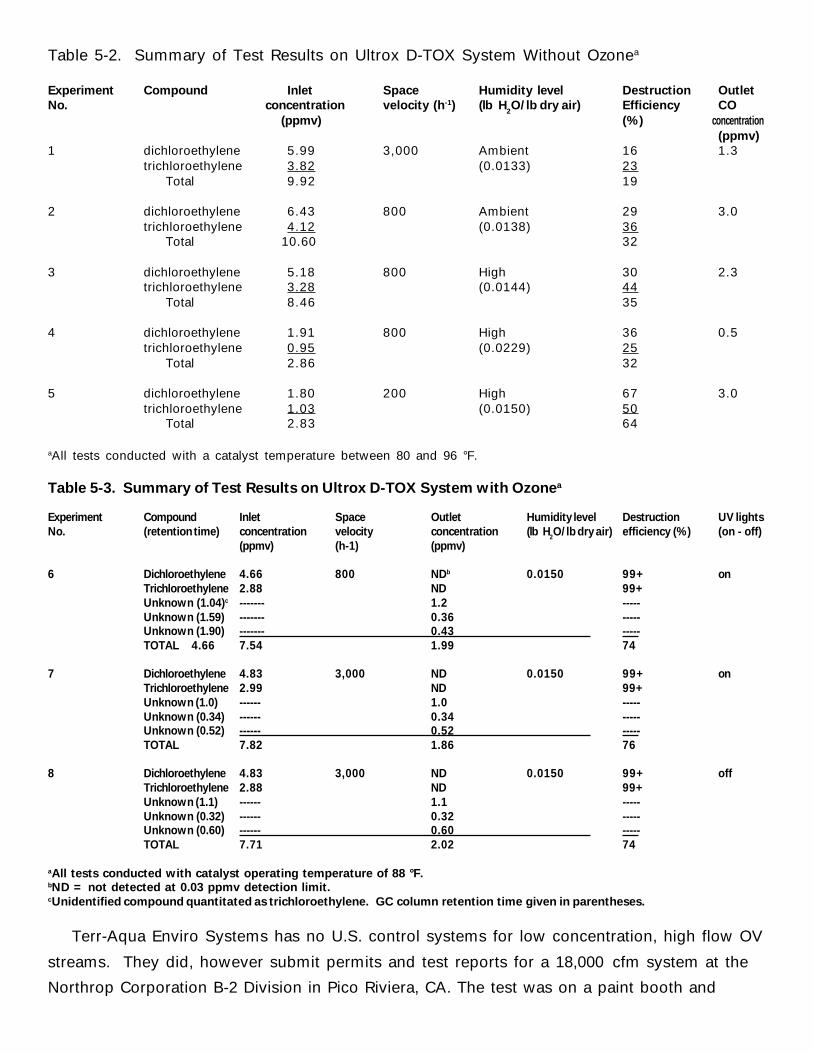
Table 5-2. Summary of Test Results on Ultrox D-TOX System Without Ozonea
Experiment Compound Inlet Space Humidity level Destruction OutletNo. concentration velocity (h-1) (lb H
2O/lb dry air) Efficiency CO
(ppmv) (%) concentration(ppmv)
1 dichloroethylene 5.99 3,000 Ambient 16 1.3trichloroethylene 3.82 (0.0133) 23 Total 9.92 19
2 dichloroethylene 6.43 800 Ambient 29 3.0trichloroethylene 4.12 (0.0138) 36 Total 10.60 32
3 dichloroethylene 5.18 800 High 30 2.3trichloroethylene 3.28 (0.0144) 44 Total 8.46 35
4 dichloroethylene 1.91 800 High 36 0.5trichloroethylene 0.95 (0.0229) 25 Total 2.86 32
5 dichloroethylene 1.80 200 High 67 3.0trichloroethylene 1.03 (0.0150) 50 Total 2.83 64
aAll tests conducted with a catalyst temperature between 80 and 96 °F.
Table 5-3. Summary of Test Results on Ultrox D-TOX System with Ozonea
Experiment Compound Inlet Space Outlet Humidity level Destruction UV lightsNo. (retention time) concentration velocity concentration (lb H2O/lb dry air) efficiency (%) (on - off)
(ppmv) (h-1) (ppmv)
6 Dichloroethylene 4.66 800 NDb 0.0150 99+ onTrichloroethylene 2.88 ND 99+Unknown (1.04)c ------- 1.2 -----Unknown (1.59) ------- 0.36 -----Unknown (1.90) ------- 0.43 -----TOTAL 4.66 7.54 1.99 74
7 Dichloroethylene 4.83 3,000 ND 0.0150 99+ onTrichloroethylene 2.99 ND 99+Unknown (1.0) ------ 1.0 -----Unknown (0.34) ------ 0.34 -----Unknown (0.52) ------ 0.52 -----TOTAL 7.82 1.86 76
8 Dichloroethylene 4.83 3,000 ND 0.0150 99+ offTrichloroethylene 2.88 ND 99+Unknown (1.1) ------ 1.1 -----Unknown (0.32) ------ 0.32 -----Unknown (0.60) ------ 0.60 -----TOTAL 7.71 2.02 74
aAll tests conducted with catalyst operating temperature of 88 °F.bND = not detected at 0.03 ppmv detection limit.cUnidentified compound quantitated as trichloroethylene. GC column retention time given in parentheses.
Terr-Aqua Enviro Systems has no U.S. control systems for low concentration, high flow OV
streams. They did, however submit permits and test reports for a 18,000 cfm system at the
Northrop Corporation B-2 Division in Pico Riviera, CA. The test was on a paint booth and
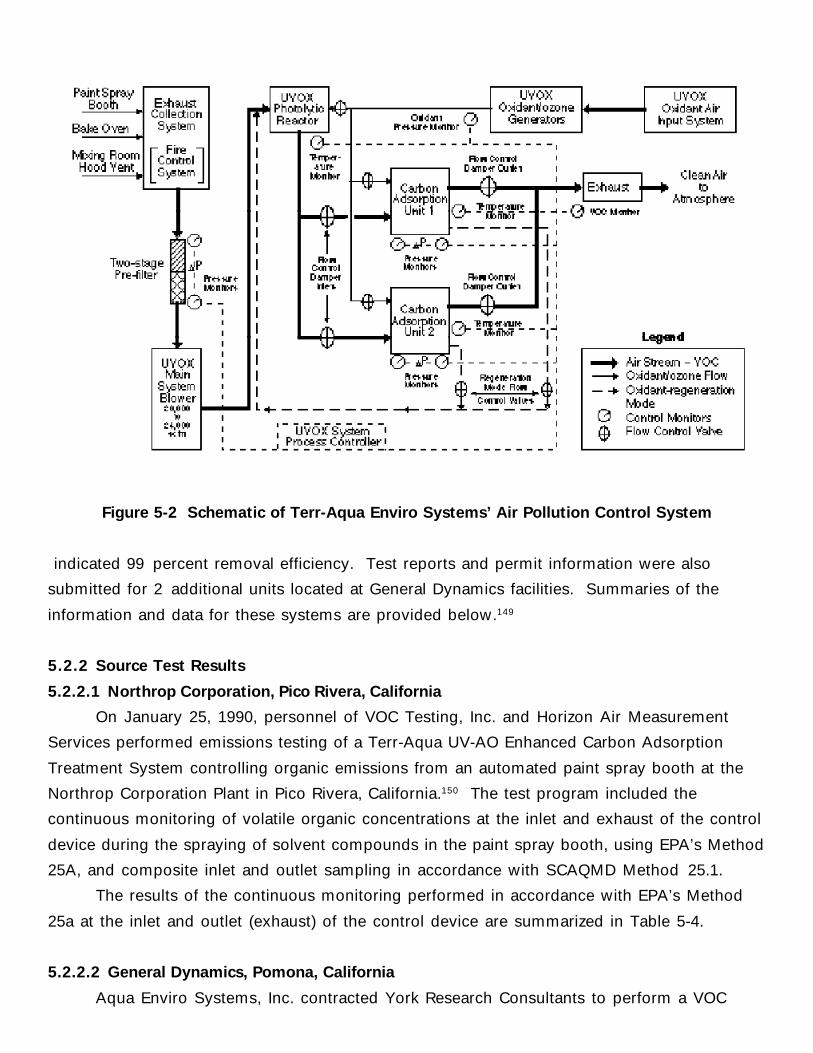
Figure 5-2 Schematic of Terr-Aqua Enviro Systems’ Air Pollution Control System
indicated 99 percent removal efficiency. Test reports and permit information were also
submitted for 2 additional units located at General Dynamics facilities. Summaries of the
information and data for these systems are provided below.149
5.2.2 Source Test Results
5.2.2.1 Northrop Corporation, Pico Rivera, California
On January 25, 1990, personnel of VOC Testing, Inc. and Horizon Air Measurement
Services performed emissions testing of a Terr-Aqua UV-AO Enhanced Carbon Adsorption
Treatment System controlling organic emissions from an automated paint spray booth at the
Northrop Corporation Plant in Pico Rivera, California.150 The test program included the
continuous monitoring of volatile organic concentrations at the inlet and exhaust of the control
device during the spraying of solvent compounds in the paint spray booth, using EPA’s Method
25A, and composite inlet and outlet sampling in accordance with SCAQMD Method 25.1.
The results of the continuous monitoring performed in accordance with EPA’s Method
25a at the inlet and outlet (exhaust) of the control device are summarized in Table 5-4.
5.2.2.2 General Dynamics, Pomona, California
Aqua Enviro Systems, Inc. contracted York Research Consultants to perform a VOC
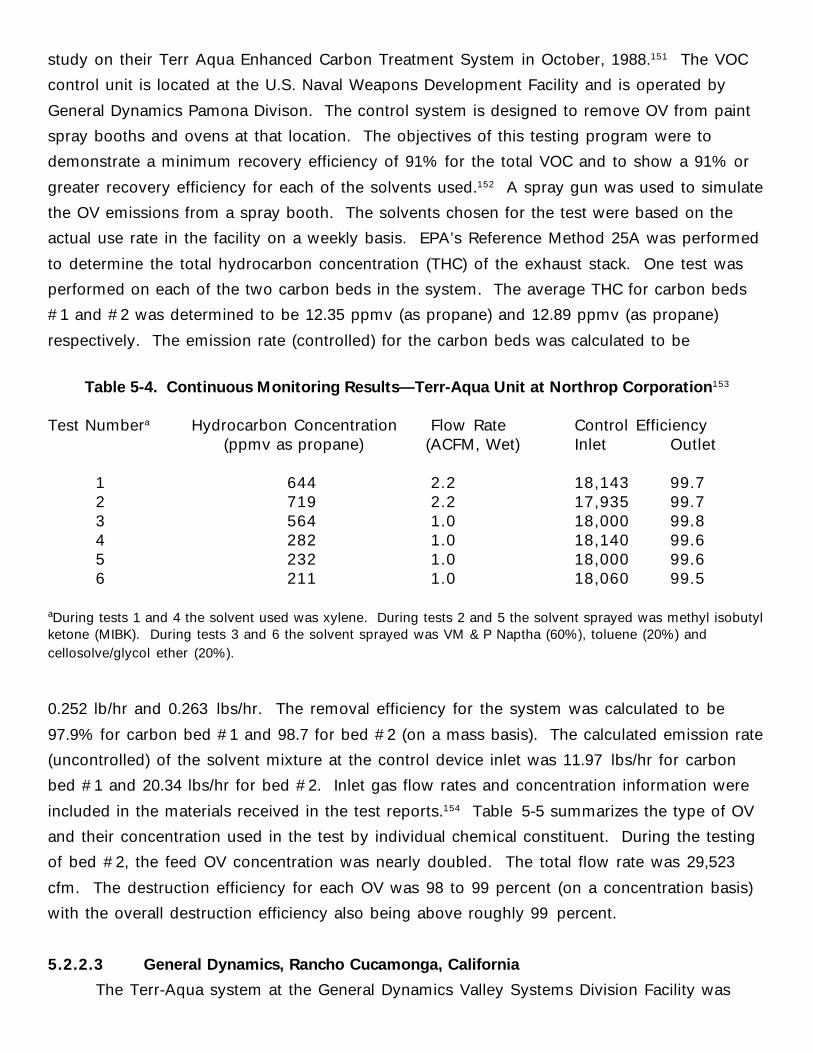
study on their Terr Aqua Enhanced Carbon Treatment System in October, 1988.151 The VOC
control unit is located at the U.S. Naval Weapons Development Facility and is operated by
General Dynamics Pamona Divison. The control system is designed to remove OV from paint
spray booths and ovens at that location. The objectives of this testing program were to
demonstrate a minimum recovery efficiency of 91% for the total VOC and to show a 91% or
greater recovery efficiency for each of the solvents used.152 A spray gun was used to simulate
the OV emissions from a spray booth. The solvents chosen for the test were based on the
actual use rate in the facility on a weekly basis. EPA’s Reference Method 25A was performed
to determine the total hydrocarbon concentration (THC) of the exhaust stack. One test was
performed on each of the two carbon beds in the system. The average THC for carbon beds
#1 and #2 was determined to be 12.35 ppmv (as propane) and 12.89 ppmv (as propane)
respectively. The emission rate (controlled) for the carbon beds was calculated to be
Table 5-4. Continuous Monitoring Results—Terr-Aqua Unit at Northrop Corporation153
Test Numbera Hydrocarbon Concentration Flow Rate Control Efficiency (ppmv as propane) (ACFM, Wet) Inlet Outlet
1 644 2.2 18,143 99.72 719 2.2 17,935 99.73 564 1.0 18,000 99.84 282 1.0 18,140 99.65 232 1.0 18,000 99.66 211 1.0 18,060 99.5
aDuring tests 1 and 4 the solvent used was xylene. During tests 2 and 5 the solvent sprayed was methyl isobutylketone (MIBK). During tests 3 and 6 the solvent sprayed was VM & P Naptha (60%), toluene (20%) andcellosolve/glycol ether (20%).
0.252 lb/hr and 0.263 lbs/hr. The removal efficiency for the system was calculated to be
97.9% for carbon bed #1 and 98.7 for bed #2 (on a mass basis). The calculated emission rate
(uncontrolled) of the solvent mixture at the control device inlet was 11.97 lbs/hr for carbon
bed #1 and 20.34 lbs/hr for bed #2. Inlet gas flow rates and concentration information were
included in the materials received in the test reports.154 Table 5-5 summarizes the type of OV
and their concentration used in the test by individual chemical constituent. During the testing
of bed #2, the feed OV concentration was nearly doubled. The total flow rate was 29,523
cfm. The destruction efficiency for each OV was 98 to 99 percent (on a concentration basis)
with the overall destruction efficiency also being above roughly 99 percent.
5.2.2.3 General Dynamics, Rancho Cucamonga, California
The Terr-Aqua system at the General Dynamics Valley Systems Division Facility was
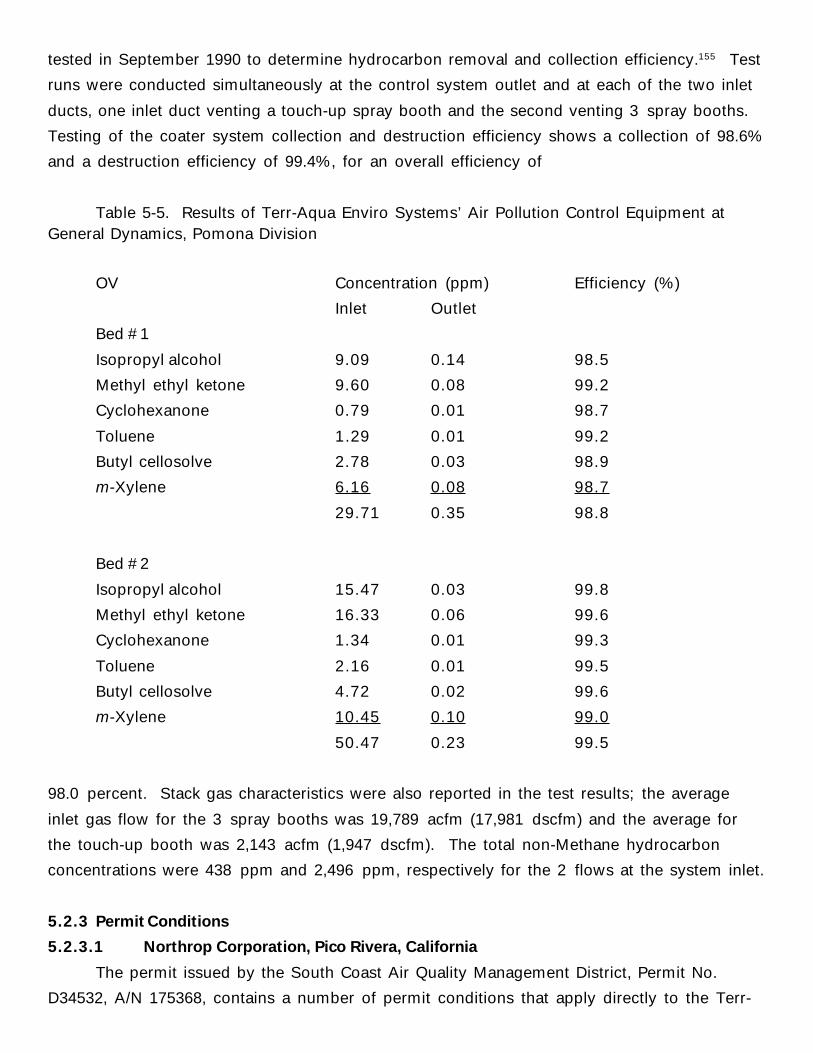
tested in September 1990 to determine hydrocarbon removal and collection efficiency.155 Test
runs were conducted simultaneously at the control system outlet and at each of the two inlet
ducts, one inlet duct venting a touch-up spray booth and the second venting 3 spray booths.
Testing of the coater system collection and destruction efficiency shows a collection of 98.6%
and a destruction efficiency of 99.4%, for an overall efficiency of
Table 5-5. Results of Terr-Aqua Enviro Systems’ Air Pollution Control Equipment atGeneral Dynamics, Pomona Division
OV Concentration (ppm) Efficiency (%)
Inlet Outlet
Bed #1
Isopropyl alcohol 9.09 0.14 98.5
Methyl ethyl ketone 9.60 0.08 99.2
Cyclohexanone 0.79 0.01 98.7
Toluene 1.29 0.01 99.2
Butyl cellosolve 2.78 0.03 98.9
m-Xylene 6.16 0.08 98.7
29.71 0.35 98.8
Bed #2
Isopropyl alcohol 15.47 0.03 99.8
Methyl ethyl ketone 16.33 0.06 99.6
Cyclohexanone 1.34 0.01 99.3
Toluene 2.16 0.01 99.5
Butyl cellosolve 4.72 0.02 99.6
m-Xylene 10.45 0.10 99.0
50.47 0.23 99.5
98.0 percent. Stack gas characteristics were also reported in the test results; the average
inlet gas flow for the 3 spray booths was 19,789 acfm (17,981 dscfm) and the average for
the touch-up booth was 2,143 acfm (1,947 dscfm). The total non-Methane hydrocarbon
concentrations were 438 ppm and 2,496 ppm, respectively for the 2 flows at the system inlet.
5.2.3 Permit Conditions
5.2.3.1 Northrop Corporation, Pico Rivera, California
The permit issued by the South Coast Air Quality Management District, Permit No.
D34532, A/N 175368, contains a number of permit conditions that apply directly to the Terr-
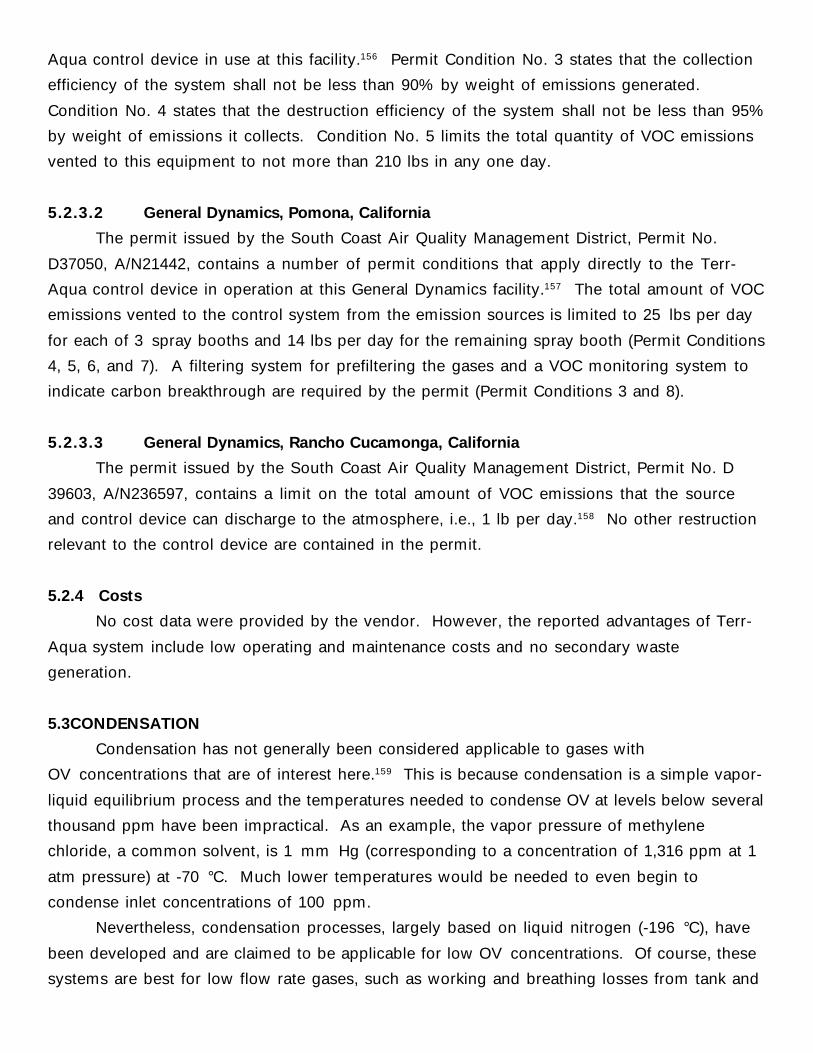
Aqua control device in use at this facility.156 Permit Condition No. 3 states that the collection
efficiency of the system shall not be less than 90% by weight of emissions generated.
Condition No. 4 states that the destruction efficiency of the system shall not be less than 95%
by weight of emissions it collects. Condition No. 5 limits the total quantity of VOC emissions
vented to this equipment to not more than 210 lbs in any one day.
5.2.3.2 General Dynamics, Pomona, California
The permit issued by the South Coast Air Quality Management District, Permit No.
D37050, A/N21442, contains a number of permit conditions that apply directly to the Terr-
Aqua control device in operation at this General Dynamics facility.157 The total amount of VOC
emissions vented to the control system from the emission sources is limited to 25 lbs per day
for each of 3 spray booths and 14 lbs per day for the remaining spray booth (Permit Conditions
4, 5, 6, and 7). A filtering system for prefiltering the gases and a VOC monitoring system to
indicate carbon breakthrough are required by the permit (Permit Conditions 3 and 8).
5.2.3.3 General Dynamics, Rancho Cucamonga, California
The permit issued by the South Coast Air Quality Management District, Permit No. D
39603, A/N236597, contains a limit on the total amount of VOC emissions that the source
and control device can discharge to the atmosphere, i.e., 1 lb per day.158 No other restruction
relevant to the control device are contained in the permit.
5.2.4 Costs
No cost data were provided by the vendor. However, the reported advantages of Terr-
Aqua system include low operating and maintenance costs and no secondary waste
generation.
5.3CONDENSATION
Condensation has not generally been considered applicable to gases with
OV concentrations that are of interest here.159 This is because condensation is a simple vapor-
liquid equilibrium process and the temperatures needed to condense OV at levels below several
thousand ppm have been impractical. As an example, the vapor pressure of methylene
chloride, a common solvent, is 1 mm Hg (corresponding to a concentration of 1,316 ppm at 1
atm pressure) at -70 °C. Much lower temperatures would be needed to even begin to
condense inlet concentrations of 100 ppm.
Nevertheless, condensation processes, largely based on liquid nitrogen (-196 °C), have
been developed and are claimed to be applicable for low OV concentrations. Of course, these
systems are best for low flow rate gases, such as working and breathing losses from tank and
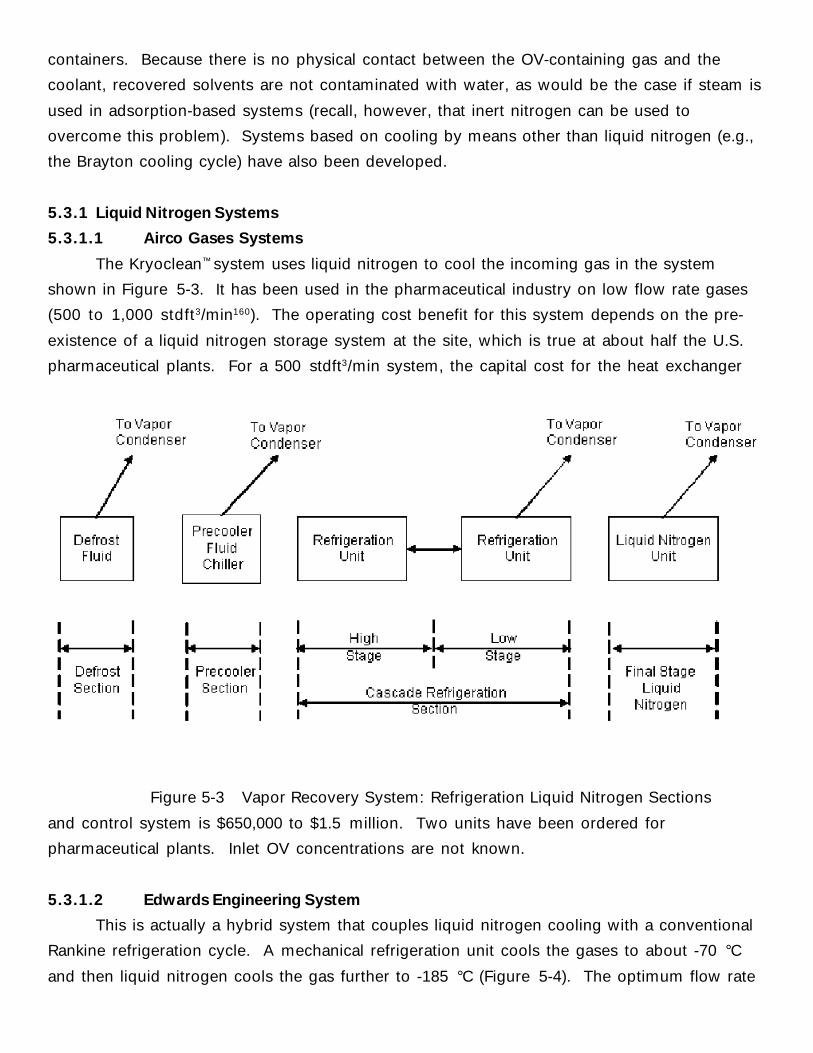
containers. Because there is no physical contact between the OV-containing gas and the
coolant, recovered solvents are not contaminated with water, as would be the case if steam is
used in adsorption-based systems (recall, however, that inert nitrogen can be used to
overcome this problem). Systems based on cooling by means other than liquid nitrogen (e.g.,
the Brayton cooling cycle) have also been developed.
5.3.1 Liquid Nitrogen Systems
5.3.1.1 Airco Gases Systems
The Kryoclean™ system uses liquid nitrogen to cool the incoming gas in the system
shown in Figure 5-3. It has been used in the pharmaceutical industry on low flow rate gases
(500 to 1,000 stdft3/min160). The operating cost benefit for this system depends on the pre-
existence of a liquid nitrogen storage system at the site, which is true at about half the U.S.
pharmaceutical plants. For a 500 stdft3/min system, the capital cost for the heat exchanger
Figure 5-3 Vapor Recovery System: Refrigeration Liquid Nitrogen Sections
and control system is $650,000 to $1.5 million. Two units have been ordered for
pharmaceutical plants. Inlet OV concentrations are not known.
5.3.1.2 Edwards Engineering System
This is actually a hybrid system that couples liquid nitrogen cooling with a conventional
Rankine refrigeration cycle. A mechanical refrigeration unit cools the gases to about -70 °C
and then liquid nitrogen cools the gas further to -185 °C (Figure 5-4). The optimum flow rate
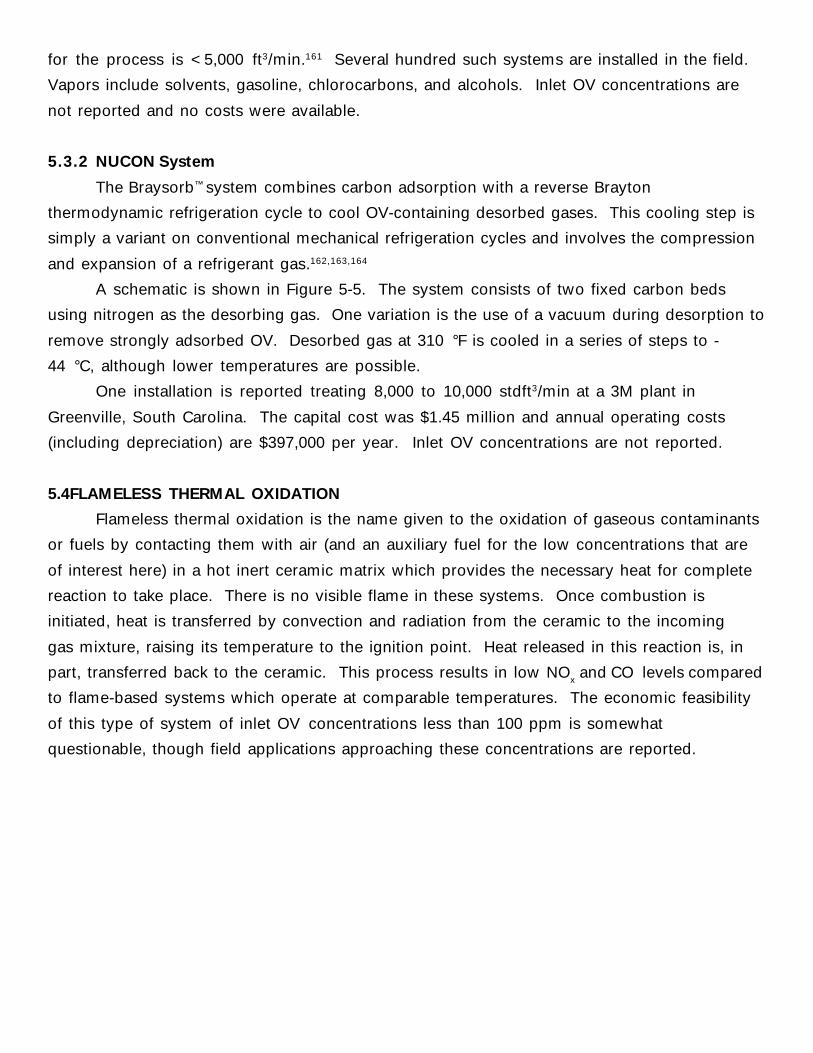
for the process is <5,000 ft3/min.161 Several hundred such systems are installed in the field.
Vapors include solvents, gasoline, chlorocarbons, and alcohols. Inlet OV concentrations are
not reported and no costs were available.
5.3.2 NUCON System
The Braysorb™ system combines carbon adsorption with a reverse Brayton
thermodynamic refrigeration cycle to cool OV-containing desorbed gases. This cooling step is
simply a variant on conventional mechanical refrigeration cycles and involves the compression
and expansion of a refrigerant gas.162,163,164
A schematic is shown in Figure 5-5. The system consists of two fixed carbon beds
using nitrogen as the desorbing gas. One variation is the use of a vacuum during desorption to
remove strongly adsorbed OV. Desorbed gas at 310 °F is cooled in a series of steps to -
44 °C, although lower temperatures are possible.
One installation is reported treating 8,000 to 10,000 stdft3/min at a 3M plant in
Greenville, South Carolina. The capital cost was $1.45 million and annual operating costs
(including depreciation) are $397,000 per year. Inlet OV concentrations are not reported.
5.4FLAMELESS THERMAL OXIDATION
Flameless thermal oxidation is the name given to the oxidation of gaseous contaminants
or fuels by contacting them with air (and an auxiliary fuel for the low concentrations that are
of interest here) in a hot inert ceramic matrix which provides the necessary heat for complete
reaction to take place. There is no visible flame in these systems. Once combustion is
initiated, heat is transferred by convection and radiation from the ceramic to the incoming
gas mixture, raising its temperature to the ignition point. Heat released in this reaction is, in
part, transferred back to the ceramic. This process results in low NOx and CO levels compared
to flame-based systems which operate at comparable temperatures. The economic feasibility
of this type of system of inlet OV concentrations less than 100 ppm is somewhat
questionable, though field applications approaching these concentrations are reported.
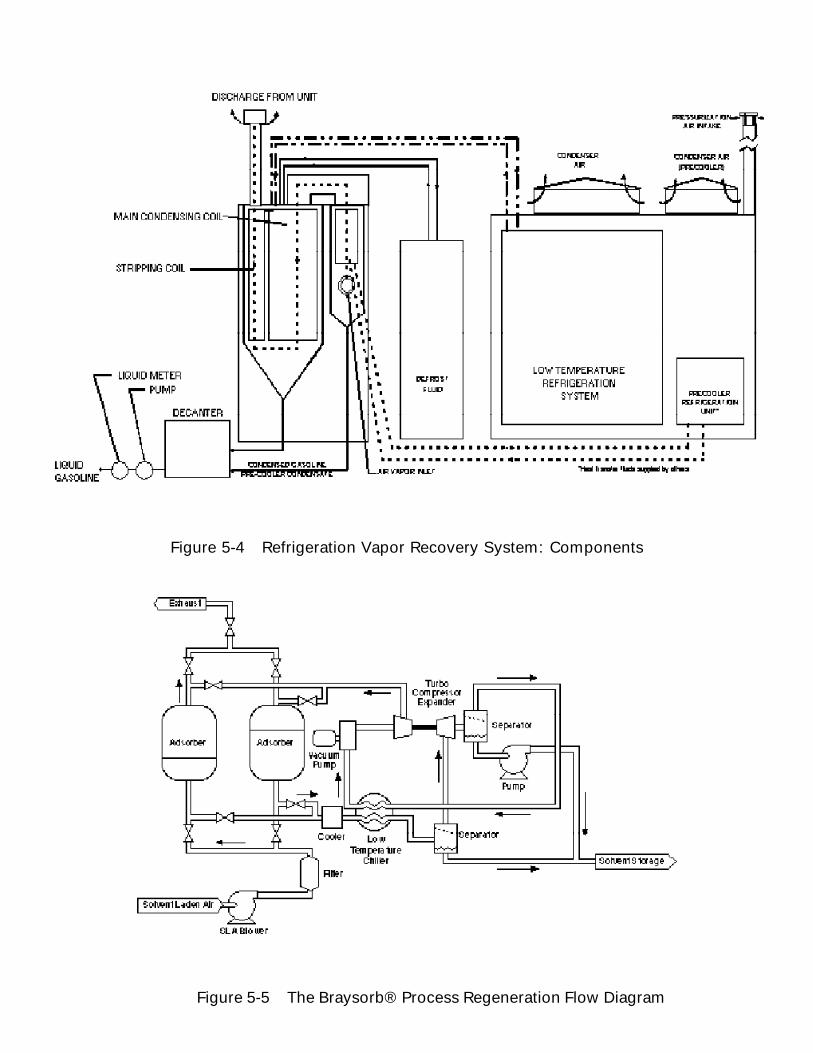
Figure 5-4 Refrigeration Vapor Recovery System: Components
Figure 5-5 The Braysorb® Process Regeneration Flow Diagram
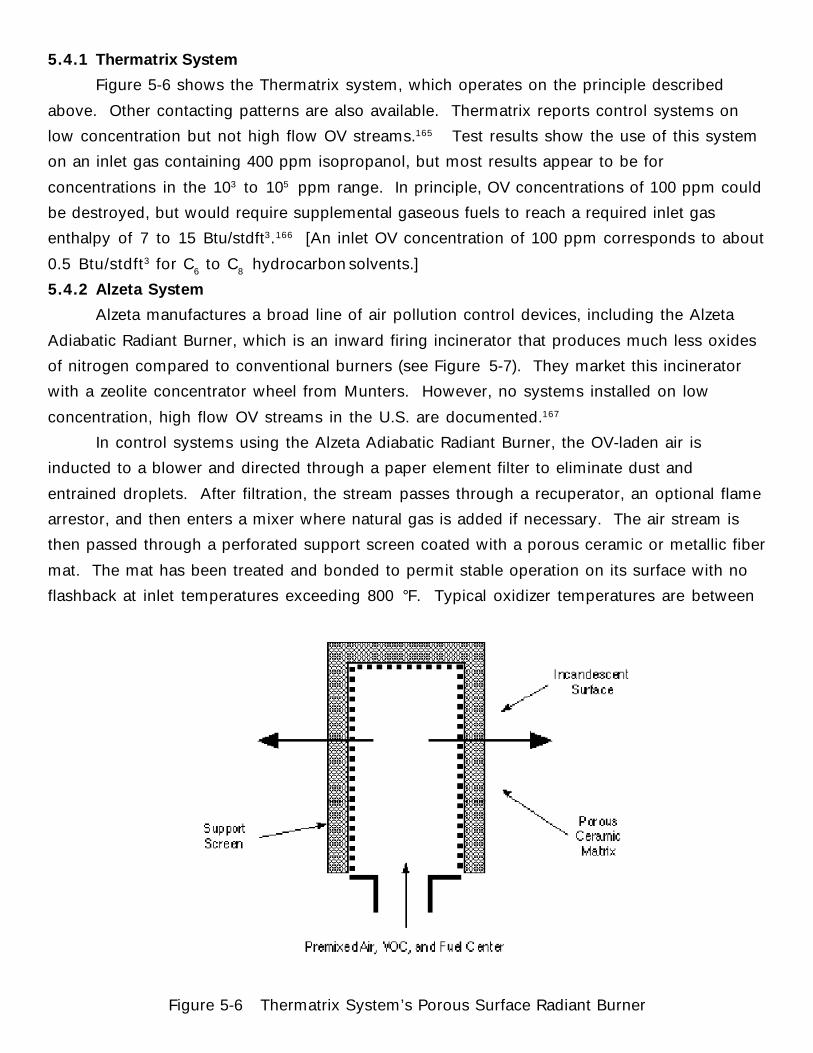
5.4.1 Thermatrix System
Figure 5-6 shows the Thermatrix system, which operates on the principle described
above. Other contacting patterns are also available. Thermatrix reports control systems on
low concentration but not high flow OV streams.165 Test results show the use of this system
on an inlet gas containing 400 ppm isopropanol, but most results appear to be for
concentrations in the 103 to 105 ppm range. In principle, OV concentrations of 100 ppm could
be destroyed, but would require supplemental gaseous fuels to reach a required inlet gas
enthalpy of 7 to 15 Btu/stdft3.166 [An inlet OV concentration of 100 ppm corresponds to about
0.5 Btu/stdft3 for C6 to C8 hydrocarbon solvents.]
5.4.2 Alzeta System
Alzeta manufactures a broad line of air pollution control devices, including the Alzeta
Adiabatic Radiant Burner, which is an inward firing incinerator that produces much less oxides
of nitrogen compared to conventional burners (see Figure 5-7). They market this incinerator
with a zeolite concentrator wheel from Munters. However, no systems installed on low
concentration, high flow OV streams in the U.S. are documented.167
In control systems using the Alzeta Adiabatic Radiant Burner, the OV-laden air is
inducted to a blower and directed through a paper element filter to eliminate dust and
entrained droplets. After filtration, the stream passes through a recuperator, an optional flame
arrestor, and then enters a mixer where natural gas is added if necessary. The air stream is
then passed through a perforated support screen coated with a porous ceramic or metallic fiber
mat. The mat has been treated and bonded to permit stable operation on its surface with no
flashback at inlet temperatures exceeding 800 °F. Typical oxidizer temperatures are between
Figure 5-6 Thermatrix System’s Porous Surface Radiant Burner
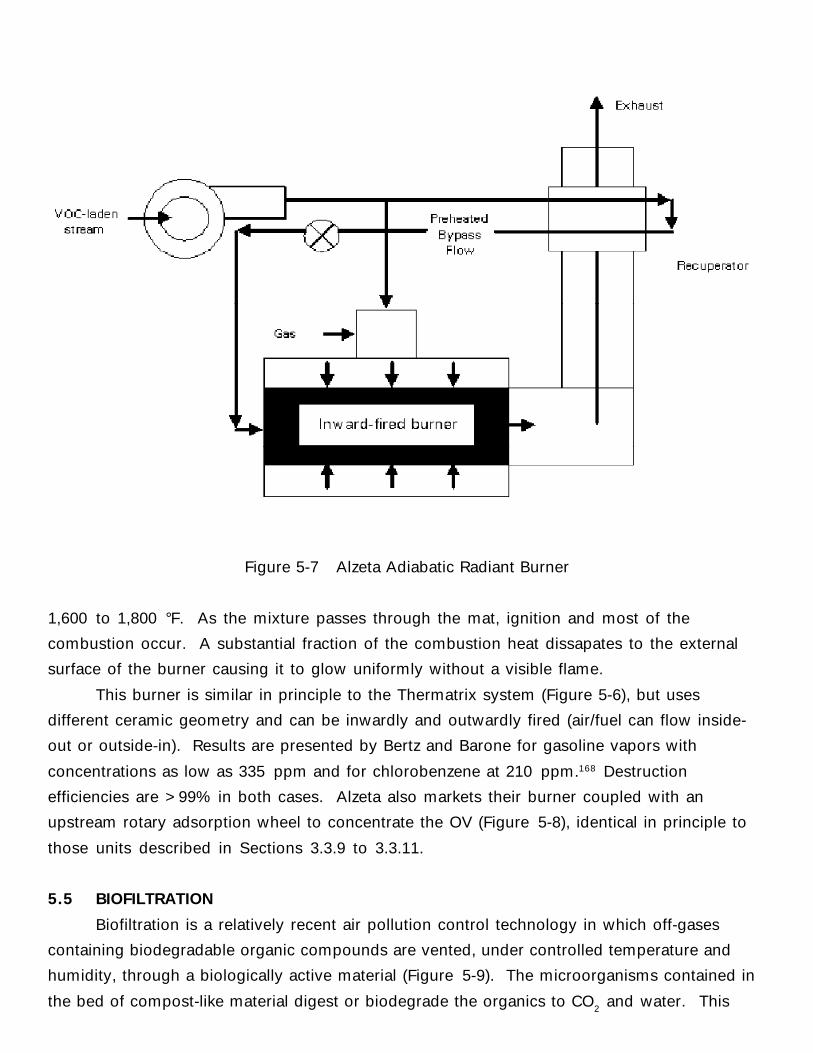
Figure 5-7 Alzeta Adiabatic Radiant Burner
1,600 to 1,800 °F. As the mixture passes through the mat, ignition and most of the
combustion occur. A substantial fraction of the combustion heat dissapates to the external
surface of the burner causing it to glow uniformly without a visible flame.
This burner is similar in principle to the Thermatrix system (Figure 5-6), but uses
different ceramic geometry and can be inwardly and outwardly fired (air/fuel can flow inside-
out or outside-in). Results are presented by Bertz and Barone for gasoline vapors with
concentrations as low as 335 ppm and for chlorobenzene at 210 ppm.168 Destruction
efficiencies are >99% in both cases. Alzeta also markets their burner coupled with an
upstream rotary adsorption wheel to concentrate the OV (Figure 5-8), identical in principle to
those units described in Sections 3.3.9 to 3.3.11.
5.5 BIOFILTRATION
Biofiltration is a relatively recent air pollution control technology in which off-gases
containing biodegradable organic compounds are vented, under controlled temperature and
humidity, through a biologically active material (Figure 5-9). The microorganisms contained in
the bed of compost-like material digest or biodegrade the organics to CO2 and water. This
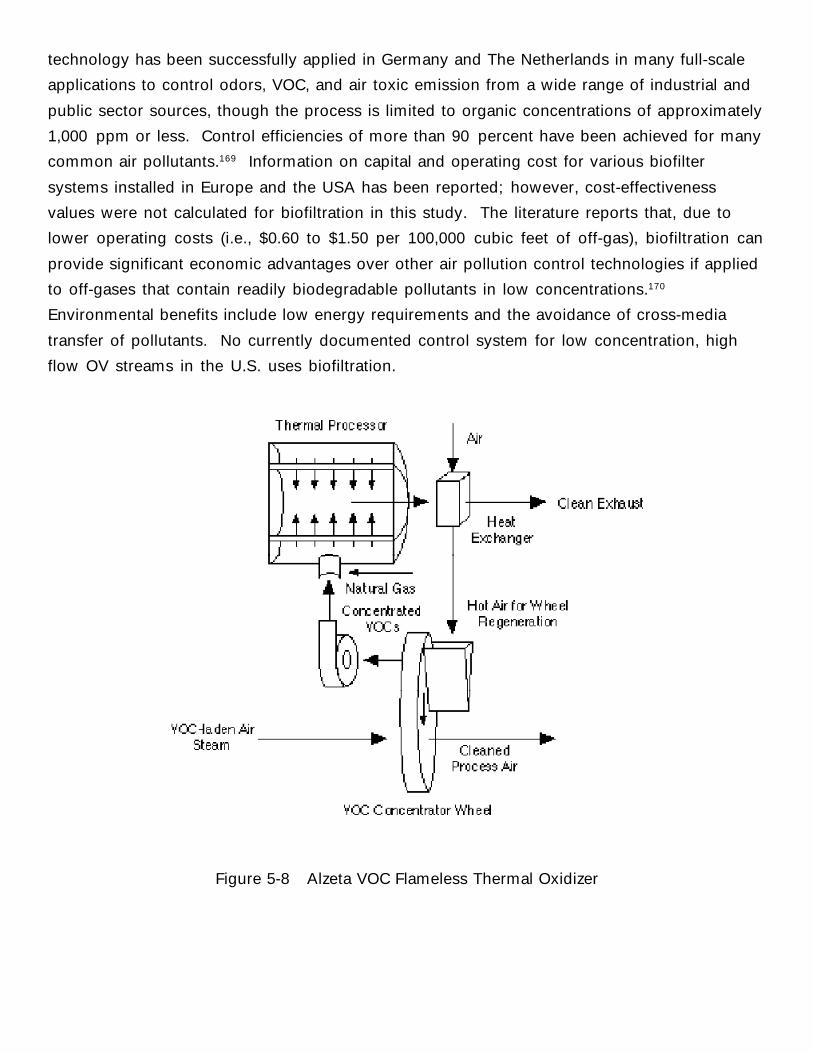
technology has been successfully applied in Germany and The Netherlands in many full-scale
applications to control odors, VOC, and air toxic emission from a wide range of industrial and
public sector sources, though the process is limited to organic concentrations of approximately
1,000 ppm or less. Control efficiencies of more than 90 percent have been achieved for many
common air pollutants.169 Information on capital and operating cost for various biofilter
systems installed in Europe and the USA has been reported; however, cost-effectiveness
values were not calculated for biofiltration in this study. The literature reports that, due to
lower operating costs (i.e., $0.60 to $1.50 per 100,000 cubic feet of off-gas), biofiltration can
provide significant economic advantages over other air pollution control technologies if applied
to off-gases that contain readily biodegradable pollutants in low concentrations.170
Environmental benefits include low energy requirements and the avoidance of cross-media
transfer of pollutants. No currently documented control system for low concentration, high
flow OV streams in the U.S. uses biofiltration.
Figure 5-8 Alzeta VOC Flameless Thermal Oxidizer
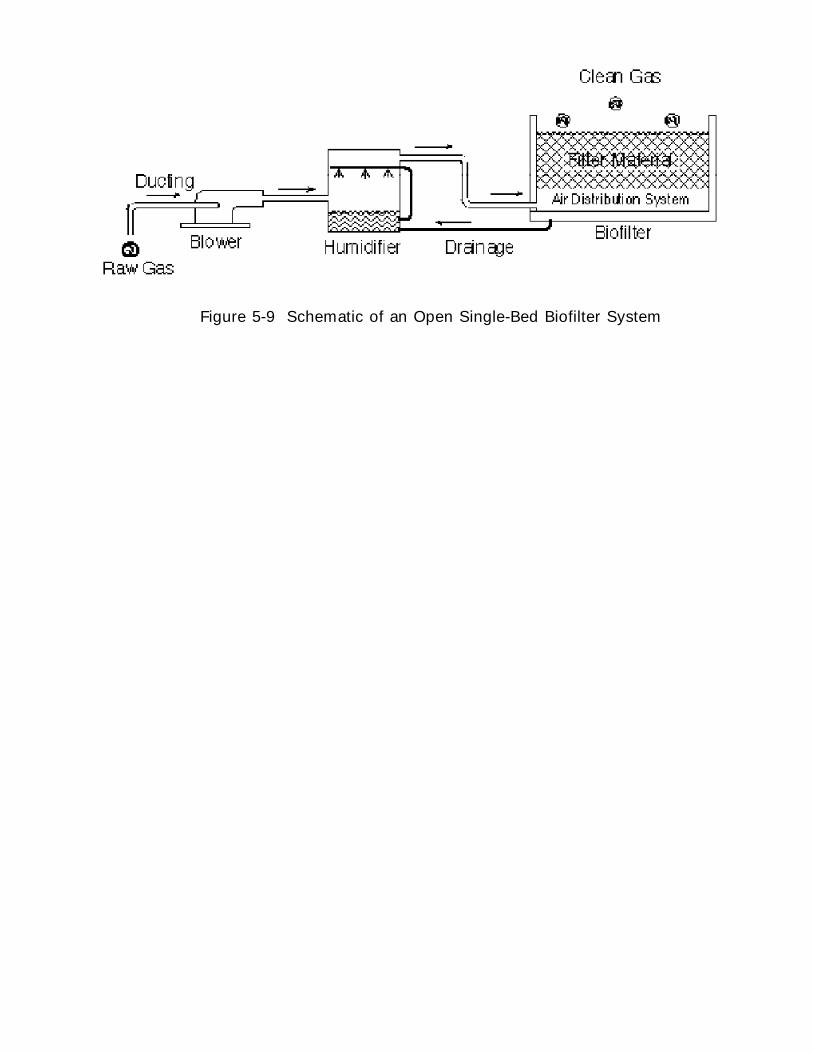
Figure 5-9 Schematic of an Open Single-Bed Biofilter System
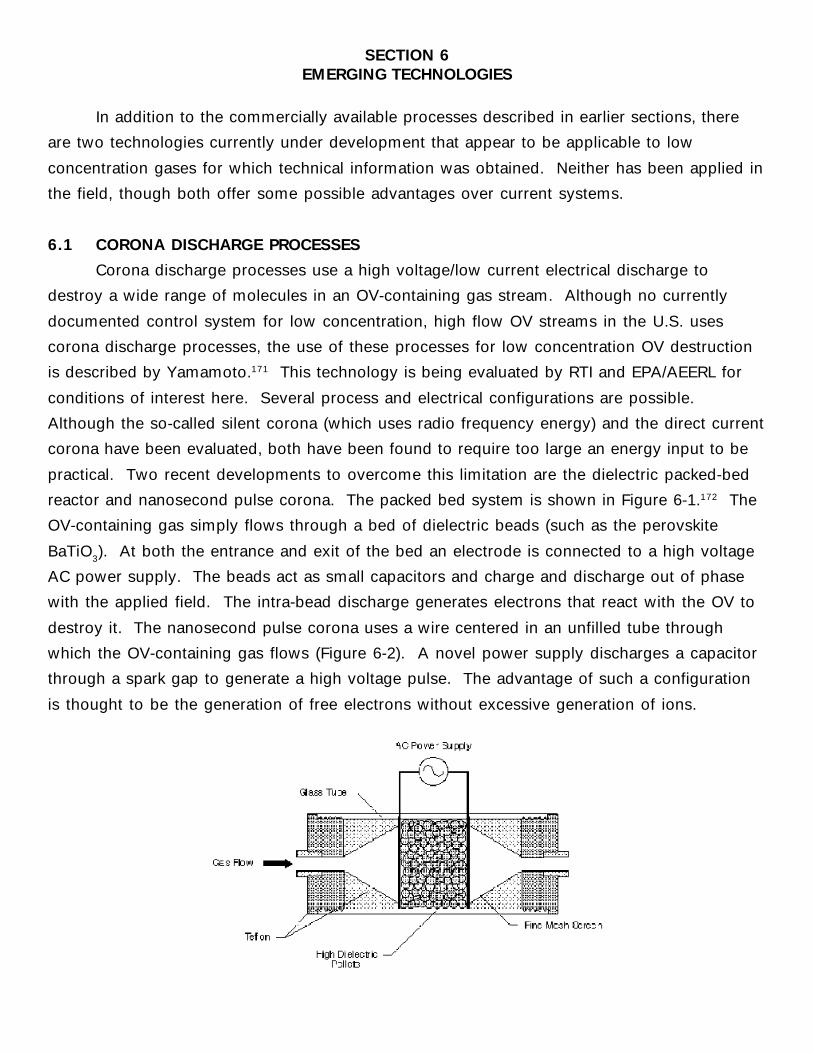
SECTION 6EMERGING TECHNOLOGIES
In addition to the commercially available processes described in earlier sections, there
are two technologies currently under development that appear to be applicable to low
concentration gases for which technical information was obtained. Neither has been applied in
the field, though both offer some possible advantages over current systems.
6.1 CORONA DISCHARGE PROCESSES
Corona discharge processes use a high voltage/low current electrical discharge to
destroy a wide range of molecules in an OV-containing gas stream. Although no currently
documented control system for low concentration, high flow OV streams in the U.S. uses
corona discharge processes, the use of these processes for low concentration OV destruction
is described by Yamamoto.171 This technology is being evaluated by RTI and EPA/AEERL for
conditions of interest here. Several process and electrical configurations are possible.
Although the so-called silent corona (which uses radio frequency energy) and the direct current
corona have been evaluated, both have been found to require too large an energy input to be
practical. Two recent developments to overcome this limitation are the dielectric packed-bed
reactor and nanosecond pulse corona. The packed bed system is shown in Figure 6-1.172 The
OV-containing gas simply flows through a bed of dielectric beads (such as the perovskite
BaTiO3). At both the entrance and exit of the bed an electrode is connected to a high voltage
AC power supply. The beads act as small capacitors and charge and discharge out of phase
with the applied field. The intra-bead discharge generates electrons that react with the OV to
destroy it. The nanosecond pulse corona uses a wire centered in an unfilled tube through
which the OV-containing gas flows (Figure 6-2). A novel power supply discharges a capacitor
through a spark gap to generate a high voltage pulse. The advantage of such a configuration
is thought to be the generation of free electrons without excessive generation of ions.
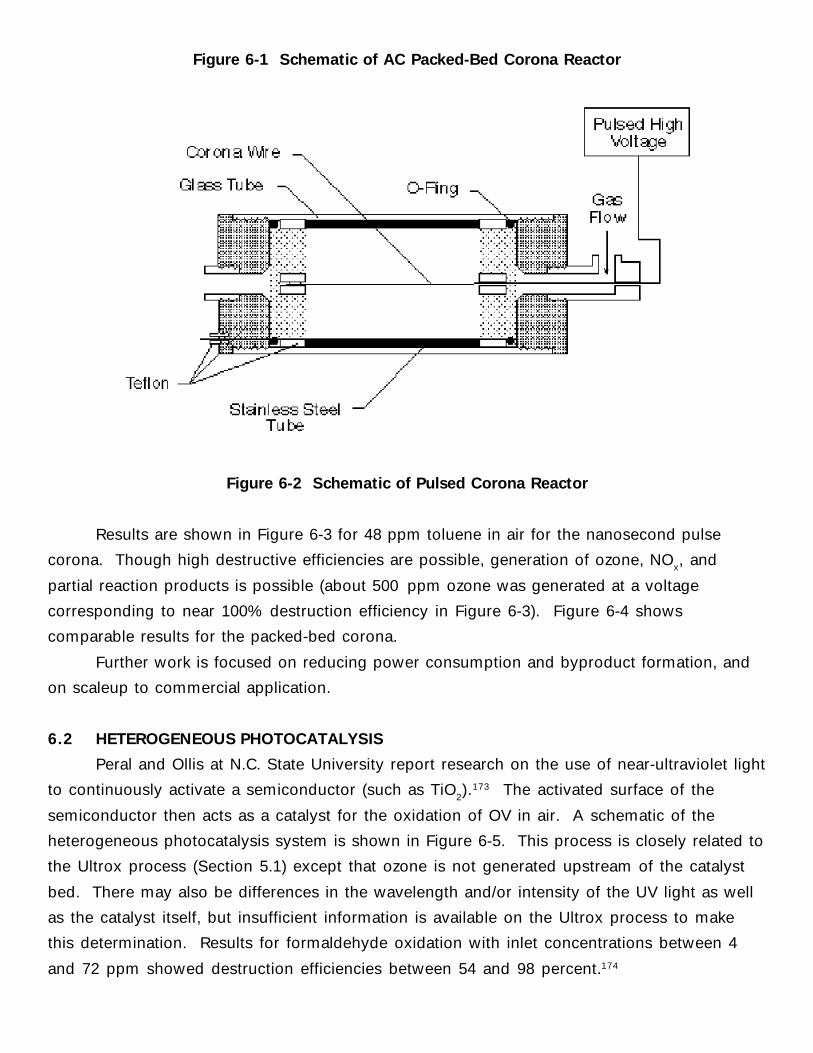
Figure 6-1 Schematic of AC Packed-Bed Corona Reactor
Figure 6-2 Schematic of Pulsed Corona Reactor
Results are shown in Figure 6-3 for 48 ppm toluene in air for the nanosecond pulse
corona. Though high destructive efficiencies are possible, generation of ozone, NOx, and
partial reaction products is possible (about 500 ppm ozone was generated at a voltage
corresponding to near 100% destruction efficiency in Figure 6-3). Figure 6-4 shows
comparable results for the packed-bed corona.
Further work is focused on reducing power consumption and byproduct formation, and
on scaleup to commercial application.
6.2 HETEROGENEOUS PHOTOCATALYSIS
Peral and Ollis at N.C. State University report research on the use of near-ultraviolet light
to continuously activate a semiconductor (such as TiO2).173 The activated surface of the
semiconductor then acts as a catalyst for the oxidation of OV in air. A schematic of the
heterogeneous photocatalysis system is shown in Figure 6-5. This process is closely related to
the Ultrox process (Section 5.1) except that ozone is not generated upstream of the catalyst
bed. There may also be differences in the wavelength and/or intensity of the UV light as well
as the catalyst itself, but insufficient information is available on the Ultrox process to make
this determination. Results for formaldehyde oxidation with inlet concentrations between 4
and 72 ppm showed destruction efficiencies between 54 and 98 percent.174
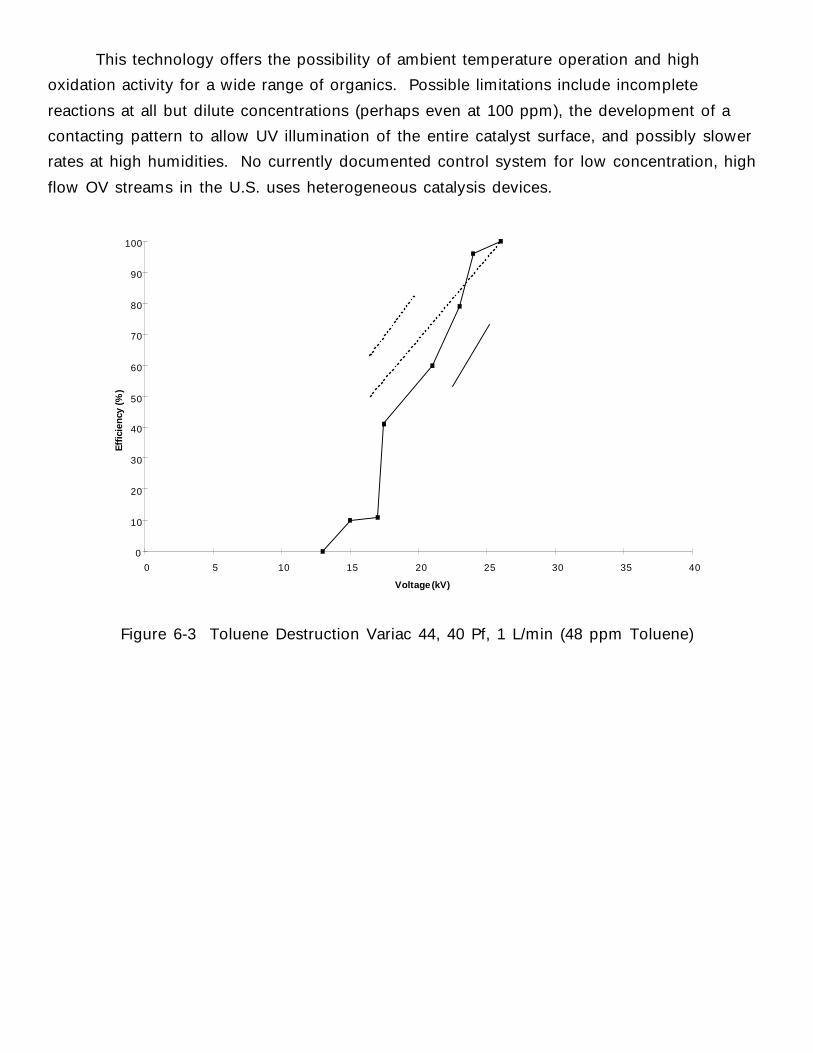
This technology offers the possibility of ambient temperature operation and high
oxidation activity for a wide range of organics. Possible limitations include incomplete
reactions at all but dilute concentrations (perhaps even at 100 ppm), the development of a
contacting pattern to allow UV illumination of the entire catalyst surface, and possibly slower
rates at high humidities. No currently documented control system for low concentration, high
flow OV streams in the U.S. uses heterogeneous catalysis devices.
0
10
20
30
40
50
60
70
80
90
100
0 5 10 15 20 25 30 35 40
Voltage (kV)
Eff
icie
ncy
(%)
Figure 6-3 Toluene Destruction Variac 44, 40 Pf, 1 L/min (48 ppm Toluene)
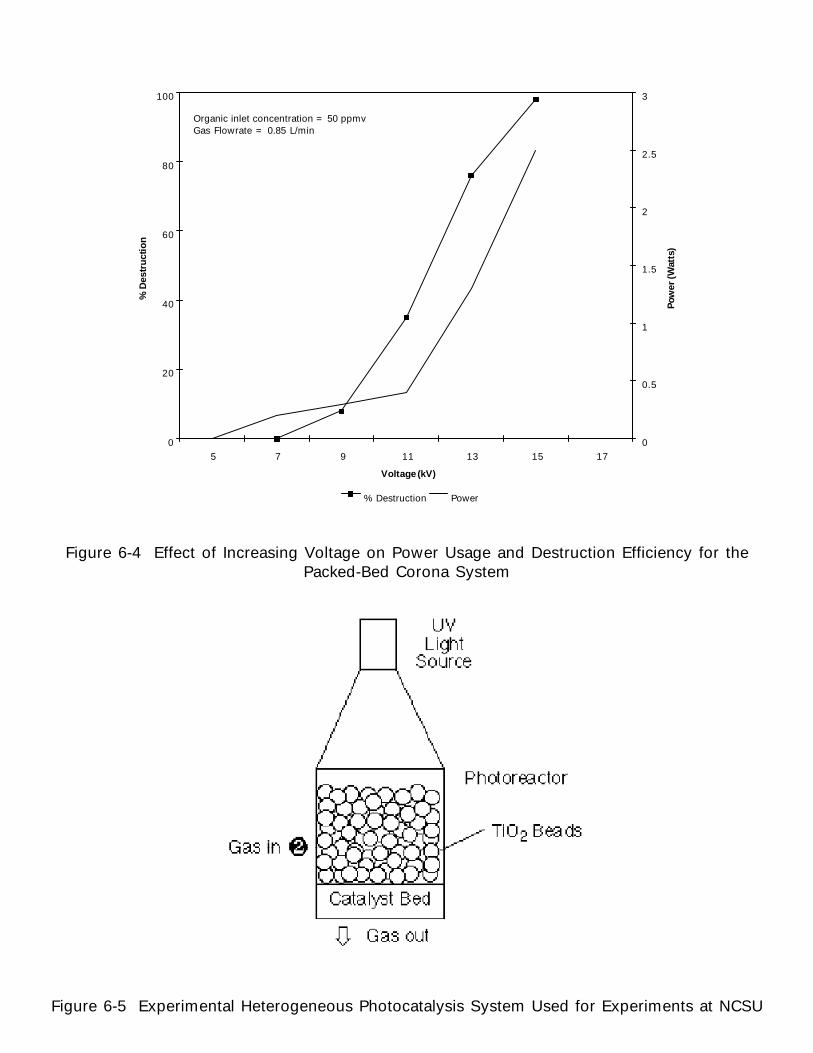
0
20
40
60
80
100
5 7 9 11 13 15 17
Voltage (kV)
% D
estr
uct
ion
0
0.5
1
1.5
2
2.5
3
Pow
er (
Wat
ts)
% Destruction Power
Organic inlet concentration = 50 ppmvGas Flowrate = 0.85 L/min
Figure 6-4 Effect of Increasing Voltage on Power Usage and Destruction Efficiency for thePacked-Bed Corona System
Figure 6-5 Experimental Heterogeneous Photocatalysis System Used for Experiments at NCSU
SECTION 7REFERENCES
1The term “organic vapors” (OV) is used in this report to characterize the broad range of
organic compounds that might be found as constituents in a gas stream that is vented,
exhausted, or otherwise emitted to the atmosphere. The term “OV” as used in this report
would generally include those organic constituent categories that are specifically defined and
carry a precise statutory or regulatory denotation (e.g., “volatile organic compounds” [VOC] as
defined in part 51 of Title 40 of the Code of Federal Regulations; “hazardous air pollutants”
[HAP] as identified in Title III, Section 112(b), of the Clean Air Act Amendments of 1990; or
“volatile organics” [VO] as measured by Method 25D, 59 FR 19402, April 22, 1994).2.Leson, G., and A.M. Winer,. J. Air Waste Mgt. Assoc., 41(8):1045-1054. 1991.3.U.S. EPA. “OAQPS Control Cost Manual,” Fourth Ed. U.S. EPA. Research Triangle Park, NC.
Publication No. 450/3-90-006. January 1990.4.Vatavuk, W. M. Chemical Engineering, Special Supplement: Environmental Engineering. June
1994. Page 17.5.Rodberg, J.A., J.F. Miller, G.E. Keller, and J.E. Woods. A novel Technique to Permanently Remove
Indoor Air Pollutants,” ASHRAE, Healthy Building, IAQ. 1991.6.Dombrowski, C. (Ed.), Air Techn News, (Silver Spring, MD). pp. 31-32. September 1991.7.Telecon. C. W. Sanford, Research Triangle Institute (RTI), and Dan Banks, John Zink
Company. April 12, 1994. Installed air pollution control devices.8.Renko, R.J., 1990, Chem Eng. Prog., 47-49, October.9.Spivey, J.J., 1990, “Catalytic Incineration of Gaseous Wastes,” in Thermal Process, H.M. Freeman(ed.), Technomic Publishing (Cincinnati, OH), p. 95-108.10.Palazzolo, M.A., C.L. Jamgochian, J.I. Steinmetz, and D.L. Lewis, 1986, “Destruction ofChlorinated Hydrocarbons by Catalytic Oxidation,” EPA Contract Report EPA 600/2-86-079.11.Hylton, T.D., 1990, “Interim Report on the Performance Evaluation of the TCE Catalytic OxidationUnit at Wurtsmith AFB,” for HQ AFESC, Tyndall AFB.12.See Reference 10.13.Ritts, D., C. Garretson, Ch. Hyde, J. Lorelli, and C.D. Wolbach, 1990, “Evaluation of InnovativeVolatile Organic Compound and Hazardous Air Pollutant control tecnologies for U.S. AF Paint SprayBooths,” Draft Final Report, EPA Contract No. 68-02-4285.14.Telecon. C. W. Sanford, RTI, and Gary Nagle, Wheelabrator. April 22, 1994. Incinerators.15.Cenci, Carole J., Permit Section, Air Qualtiy Division, Minnesota Pollution Control Agency, letterand attachments to Jeffrey Muffat, 3M Environmental Engineering and Pollution Contro. March 9,1993.16.See Reference 2.17.See Reference 9.18.See Reference 10.19.See Reference 12.
20.Fiedler, M.E., Anguil Environmental Systems, Inc., letter to C. W. Sanford, RTI, June 29, 1994.21.Telecon. C. W. Sanford, RTI, and Gene Anguil. June 27, 1994. Incinerators.22.Patterson, Steve, Monsanto Enviro-Chem, letter and attachments to C. W. Sanford, RTI.
June 7, 1994.23.Joseph Haggin. Catalytic Oxidation Process Cleans Volatile Organics From Exhaust.
Chemical & Engineering News. June 27, 1994. Page 42.24.Telecon. C. W. Sanford, RTI, and Paul Holland, CSM. April 12, 1994.25.Telecon. C. W. Sanford, RTI, and Robert Saxer, Amcec. April 12, 1994. Incinerators.26.Telecon. C. W. Sanford, RTI, and R. Moreno, Alzeta. May 5, 1994. Control devices.27.Telecon. C. W. Sanford, RTI, and Tom Sanden, Thermo Electron. April 14, 1994. Control
devices.28.Telecon. C. W. Sanford, RTI, and Sophia Block, Catalytica. April 14, 1994. Control
devices.29.See Reference 2.30The destruction/removal efficiency of 95 percent was selected to represent the lower end ofthe range of control efficiencies required for the control of organic vapors by EPA regulations.In many cases, EPA requires higher control efficiencies especially in those situations whereincineration is the technology serving as the basis of the standard. The incineration-basedtechnolgies discussed in this document have demonstrated control efficiencies of 98 percent orhigher and therefore are applicable when a higher performance standard (e.g., 98%) is requiredby regulation. Conducting the analysis at 95 percent as opposed to 98 percent also canimpact the cost-effectiveness calculation because in many cases the additional organicscontrol can be achieved at little or no cost. Cost-effectiveness values would therefore belower at this higher control efficiency.31.See Reference 2.32.See Reference 2, p. 3-52.33.See Reference 2, p. 3-48.34.Martin et al. 1993.35.Smith Engineering Brochure, Smith Engineering Systems, Ontario, CA, 1990.36.Telecon. C. W. Sanford, RTI, and E. Biedell, Smith Engineering Co. June 28, 1994.Incinerators.37.McIlwee, Roy, Smith Engineering Co., letter and attachments to C. W. Sanford, RTI, July 14, 1994.38.See Reference 33.39.See Reference 33.40.NETAC, 1991 (National Env. Tech. Appl. Corp., Pittsburgh, PA), Environmental Product Profiles,“Re-Therm Air Toxics/VOC Control System,” April.41.Pennington, R.L., 1991, Reeco (Morris Plains, NJ), letter to S.K. Agarwal, Research TriangleInstitute, November 4.42.See Reference 38.43.See Reference 39.44.Golson, Glen, Air Division, Alabama Department of Environmental Management, letter and
attachments to R. A. Zerbonia, RTI. September 6, 1994.45.Interpoll Laboratories, Report Number 9-2726, submitted to Louisiana Pacific Corporation,Hayward, Wisconsin. March 28, 1989.
46.Division of Qir Quality, Minnesota Pollution Control Agency, letter and attachments to C.W. Sanford, RTI. August 1994.47.Facsimile Transmission to C. W. Sanford, RTI, from Keith Jordan, Air Quality Division, LouisianaDepartment of Environmental Quality. July 19, 1994. Emission Test Results—Louisiana PacificCorporation.48.Air Quality Division, Louisiana Department of Enviornmental Quality, letter and attachments to R.A. Zerbonia, RTI. August 11, 1994.49.Crabtree, T.A., 1991, Smith Engineering Company, letter to RTI.50.See Reference 42.51.See Reference 45.52.See Reference 46.53.See Reference 47.54.See Reference 42.55.See Reference 42.56.See Reference 38.57.See Reference 39.58.Telecon. C. W. Sanford, RTI, and Jack Clark, Reeco. April 14, 1994. Incinerators.59.Precision Environmental, St. Paul Tape Emissions Monitoring Report, submitted to Gary Hipple,
3M/Environmental Engineering and Pollution Control. June 1993.60.See Reference 14.61.Carol Lee, M. K., Bay Area Quality Management District, letter and attachments to C. W. Sanford,
RTI.62.Somary, G., Eisenmann, Inc., 1993, (Crystal Lake, IL), letter to J.J. Spivey, Research Triangle
Institute, August 11, 3pp.63.See Reference 3.64.General Control Device Requirements, 40 Code of Federal Regulations §60.18 (1993).65.U.S. EPA, 1990, “Alternative Control Technology Document–Organic Waste Process Vents,” EPA-
450/3-91-007, Office of Air Quality Planning and Standards, Research Triangle Park, NC, December.66.See Reference 63.67.Spivey, J.J., Env. Prog., 7(1):31-40. February 1988.68.Kovach, J.L., 1979, In Separation Processes for Chemical Engineers, P.A. Schweitzer, ed.,
McGraw-Hill, p. 3-1.69.Ruthven, D.M., 1984, Principles of Adsorption and Adsorption Processes, ASHRAE, Health
Buildings, IAQ.70.U.S. EPA. Carbon Adsorption for Control of VOC Emissions: Theory and Full Scale SystemPerformance, Publication No. EPA-450/3-88-012, EPA Contract 68-02-4378, Work Assignment 20.June 1988.71.See Reference 68.72.U.S. EPA. Control Technologies for Hazardous Air Pollutants (Handbook). U.S. EPA, Office of
Research and Development, Cincinnati, OH. Publication No. EPA-625/6-91-014. June 1991.73.Saunders, G. Comparisons of Air Stripper Simulations and Field Performance Data. U.S. EPA,Office of Air Quality Planning and Standards, Research Triangle Park, NC. Publication No. EPA 450/11-90-002. March 1990.
74.Durham, J.B. Chemical Scrubbing for control of Air Emissions, presented at 1991 AIChE Summer
National Meeting, Pittsburgh, PA. August 1991.75.Murphy, A.J., Dr. C.B. Moyer, and J. Ayer. VOC Control Effectiveness. U.S. EPA, EPA Contract
No. 68-02-4285, Work Assignment 1/022. February 28, 1989.76.SenGupta, U., and W.G. Schuliger. Carbon Adsorption for Control of VOCs, presented at AWMA
meeting, Atlanta, GA. November 4-7, 1991.77.Stenzel, M.H., and R.J. Bourdeau. Granular Activated Carbon Adsorption with Air Stripping for
Groundwater Treatement. Calgon Carbon Corp., Pittsburgh, PA. Undated. 13 pp.78.Stenzel, M.H., and U. SenGupta. APCA J. 35(12):1304-1309. December 1985.79.Byers, W.D. Env. Proj.. 7(1):17-21. 1988.80.See Reference 74.81.See Reference 65.82.See Reference 77.83.PEI. Summary of Comparisons of Air Stripper Simulations and Field Performance Data. U.S. EPA,Office of Air Quality Planning and Standards, Research Triangle Park, NC, EPA/450-1-90-002,February 1990.84.Vancil, M.A., R.H. Howle, D.J. Herndon, and S.A. Shareet. Air Stripper Emissions and Controls.Final Report for U.S. EPA Contract 68-02-03816. May 8, 1987.85.Schuliger, W.G. Controlling Low Concentrations of Volatile Organic Compounds Using GranularActivated Carbon, presented at Bulk Pharmaceutical Chemicals Spring Meeting, Kalamazoo, MI.April 24-26, 1983.86.Urbanic, J.E., and W.d. Lovett. The Use of Activated Carbon for Control of Paint Bake OvenEmissions, presented at the 67th APCA meeting, June 1974.87.Lubozynski, F.T., R.A. Ashworth, and R.W. Coutant. In Proc. 5th Nat. Conf. On Haz. Wastes andHaz. Matls. Las Vagas, NV, Haz. Matl. Cont. Res. Inst. (Silver Spring, MD), April 19-21, 1988. pp.445-449.88.See Reference 76.89.Ayer, J., and C.D. Wolbach. Solvent Emissions Reduction Study and Newark AFB, Ohio. U.S. AirForce Report ESL-TR-89-27 (Tyndall AFB, FL). May 1990.90.See Reference 74.91.See Reference 74.92.See Reference 74.93.SenGupta, U. Granular Activated Carbon-Thermal Regeneration Process for Control of VOCEmissions from Surface Coating Operations, paper 88-84.4, presented at 81st Annual APCAMeeting, Dallas, TX. June 19-24, 1988.94.Telecon. C. W. Sanford, RTI, and Richard Kenson, Met-Pro KPR. April 12, 1994. Control
devices.95.Kenson, R.E. KPR Systems for VOC Emission Control from Paint Spray Booths, presented at 78thAPCA meeting, Detroit, MI. June 16-21, 1985.96.See Reference 93.97.See Reference 93.98.See Reference 93.99.Kenson, R.E., and J.F. Jackson. Paper FC88-566, Society of Manufacturing Engineers, Deerborn,MI. 1988.100.See Reference 97.
101.Kenson, R.E., and H. Fernback. Market Study of Paint Spray Booth Solvent Emission ControlSystem, paper FC90-631, presented at Finishing West ’90, Anaheim, CA, Society ManufacturingEngineers (Dearborn, MI). September 25-27, 1990.102.See Reference 99.103.See Reference 91.104.See Reference 91.105.Telecon. C. W. Sanford, RTI, and Ram Gupta, Calgon Corp., May 19, 1994. Control
devices.106.See Reference 81.107.NETAC (National Env. Tech. Appl. Corp., Pittsburgh, PA). Environmental Product Profiles—CADRE™ VOC Control Process. July 1991.108.See Reference 105.109.Calgon. Letter from C. Thomas Calgon, Inc. (Charlotte, NC) to J. Spivey, Research TriangleInstitute including Sales and Installation Report (May 1, 1990). 1991.110.SenGupta, U. And W.G. Schuliger. Carbon Adsorption Technology for the Control of Low LevelChlorinated Hydrocarbon Emissions. Calgon Corp., Pittsburgh, PA. Undated.111.See Reference 91.112.Chemical Engineering, March 1991, p. 25.113.Telecon. C. W. Sanford, RTI, and Sophia Block, Catalytica. April 14, 1994. Controldevices.114.See Reference 24.115.Air Tech News, January 1993, p.2.116.Ruhl, J. Dedert Corporation (Olympia Fields, IL). Letter and accompanying literature to J.J.
Spivey, Research Triangle Institute. August 11, 1993.117.See Reference 114.118.Telecon. C. W. Sanford, RTI, and John Ruhl, Dedert. April 15, 1994. Control devices.119.Crompton, D., and A. Gupta. Removal of Air toxicis: A Comparison of the AdsorptionCharacteristics of Activated Carbon and Zeolotes, paper 93-TP-31B.06, presented at 86th AnnualAWMA Meeting, Denver, CO. June 13-18, 1993.120.Blocki, S.W. Env. Prog. 12(3):226-260. August 1993.121.Telecon. C. W. Sanford, RTI, and Jason Valia, DURR. June 27, 1994. Incinerators.122.Blankenship, Bill, Air Pollution Control Bureau, New Mexico Environment Department, letter andattachments (draft Air Quality Permit No. 325-M-7), to Angela Boggs, Intel Corporation. July 18,1994.123.See Reference 59.124.Division of Air Quality, Minnesota Pollution Control Agency, letter and attachments to C.W. Sanford, RTI. August 1994.125.See Reference 59.126.Haas, J.E. Kelco Group, Inc. (Raynham, MA). Letter and Attachments to J.J. Spivey, Research
Triangle Institute. August 10, 1993.127.See Reference 70.128.NETAC (National Env. Tech. Appl. Corp., Pittsburgh, PA). Environmental Product Profiles–
Procedair. July 1991.
129.Armand, B.L., H.B. Uddholm, and P.T. Vikstrom. Ind Eng. Chem. Res. 29:436-439. 1990.130.Heisel, M.P., and A.E. Velloni. Gas Sep. Purif. 5:111-113. 1991.131.Chemical Engineering, March 1989, p. 17-19.132.Chemical Engineering, March 1989, p. 191.133.Rafson, H.J.. Removing VOC’s with a Mist Scrubber and Comparison to Alternate Technologies,
presented at AIChE Meeting, San Diego, CA. 1990.134.Rafson, H.J. QUAD Environmental Technologies Corporation. Letter to RTI. 1991.135.See Reference 131.136.See Reference 132.137.Rafson, Harold J., QUAD Technologies, Inc., Chicago, IL, letter and attachments to C.W. Sanford,
RTI, April 25, 1994.138.Daniel, Laramie, Maryland Department of Environment, letter and attachments to C. W. Sanford,RTI, August 12, 1994.139.See Reference 132.140.Ullinskey, J.D., D.M. Metts, and W.A. Ambrose. Air Toxics Considerations in Wastewater
Treatment Plant Design. Undated.141.Dunson, J.B. Chemical Scrubbing for Control of Air Emissions, presented at 1991 AIChE Summer
National Meeting, Pittsburgh, PA. August 1991.142.Ultrox Report. Description of the Ultrox® D-Tox™ Process. Ultrox, Inc., Santa Ana, CA. 1991.143.See Reference 9.144.Jackson, T.E. Terr-Aqua Enviro Systems, Inc., private communications. 1991.145.See Reference 9.146.See Reference 9.147.York Research Consultants. Report for South Coast Air Quality Management District Volatile
Organic Compound Compliance Test at General Dynamics, Pomona Division. 1988.148.See Reference 142.149.Shugarman, Lynn, Terr-Aqua Enviro Systems, Inc., letter and attachments to C.W. Sanford, RTI,
May 20, 1994.150.See Reference 147.151.See Reference 147.152.See Reference 145.153.See Reference 147.154.See Reference 145.155.See Reference 147.156.See Reference 147.157.See Reference 147.158.See Reference 147.159.See Reference 65.
160.Chemical Engineering. 27. April 1992.161.Air Tech News, September 1992. p. 122.162.Air Pollution Consultant, March/April 1993. p. 1.14-1.17.163.Jain, N. Brayton Cycle Solvent Recovery, presented at 85th Annual AWMA Meeting, Kansas City
MO. June 21-26, 1992.164.Air Tech News, January 1993. p. 1-2.165.Rick Martin, Thermatrix. Letter and attachments to C.W. Sanford, RTI. April 20, 1994.166.Woods, K.B., and U.T. Schofield. Control of Toxic Air Emissions with a Flameless ThermalOxidizer, paper 93-WP-94.06, presented at 86th Annual AWMA Meeting, Denver, CO. June 13-18,
1993.167.Telecon. C. W. Sanford, RTI, and R. Moreno, Alzeta. May 5, 1994. Control Devices.168.Bartz, D.F., and S.P. Barone. Ultra-High VOC Desturction with Low NO
x and CO in Adiabatic
Radiant Combustors, presented at HAZMACON ‘92, Long Beach, CA. March 30-April 2, 1992.169.See Reference 1.170.See Reference 1.171.Yamamoto, T., K. Ramanathen, M.K. Owen, D.S. Ensor, and J.J. Spivey. Corona Desturction andOther Technologies for VOC Control, report to U.S. EPA:AEERL, Cooperative Agreement
CR815169. November 1990.172.U.S. EPA. Corona Desturction Program Peer Review. U.S. EPA:AEERL. Septebmer 10, 1991.173.Peral, J., and D.F. Ollis. Photocatalysis for Emission and Air Quality Control, presented at 203rd
ACS National Meeting, San Francisco, CA. April 1992.174.See Reference 171.
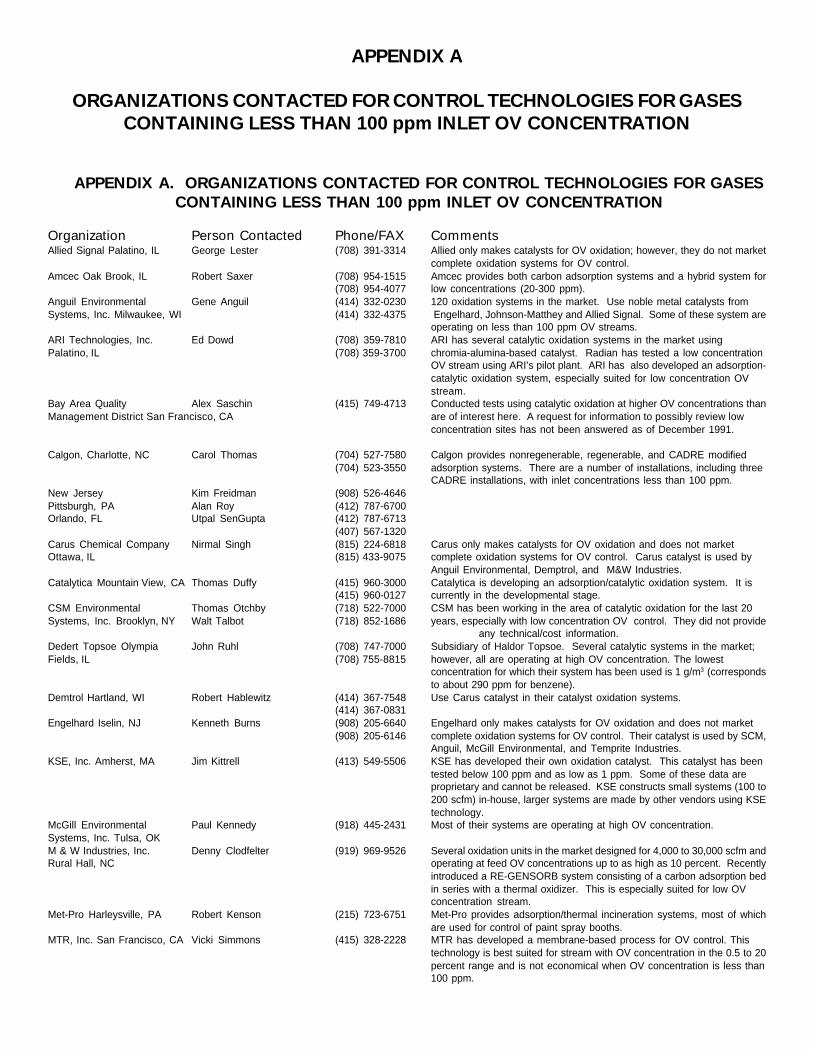
APPENDIX A
ORGANIZATIONS CONTACTED FOR CONTROL TECHNOLOGIES FOR GASESCONTAINING LESS THAN 100 ppm INLET OV CONCENTRATION
APPENDIX A. ORGANIZATIONS CONTACTED FOR CONTROL TECHNOLOGIES FOR GASESCONTAINING LESS THAN 100 ppm INLET OV CONCENTRATION
Organization Person Contacted Phone/FAX CommentsAllied Signal Palatino, IL George Lester (708) 391-3314 Allied only makes catalysts for OV oxidation; however, they do not market
complete oxidation systems for OV control.Amcec Oak Brook, IL Robert Saxer (708) 954-1515 Amcec provides both carbon adsorption systems and a hybrid system for
(708) 954-4077 low concentrations (20-300 ppm).Anguil Environmental Gene Anguil (414) 332-0230 120 oxidation systems in the market. Use noble metal catalysts fromSystems, Inc. Milwaukee, WI (414) 332-4375 Engelhard, Johnson-Matthey and Allied Signal. Some of these system are
operating on less than 100 ppm OV streams.ARI Technologies, Inc. Ed Dowd (708) 359-7810 ARI has several catalytic oxidation systems in the market usingPalatino, IL (708) 359-3700 chromia-alumina-based catalyst. Radian has tested a low concentration
OV stream using ARI’s pilot plant. ARI has also developed an adsorption-catalytic oxidation system, especially suited for low concentration OVstream.
Bay Area Quality Alex Saschin (415) 749-4713 Conducted tests using catalytic oxidation at higher OV concentrations thanManagement District San Francisco, CA are of interest here. A request for information to possibly review low
concentration sites has not been answered as of December 1991.
Calgon, Charlotte, NC Carol Thomas (704) 527-7580 Calgon provides nonregenerable, regenerable, and CADRE modified(704) 523-3550 adsorption systems. There are a number of installations, including three
CADRE installations, with inlet concentrations less than 100 ppm.New Jersey Kim Freidman (908) 526-4646Pittsburgh, PA Alan Roy (412) 787-6700Orlando, FL Utpal SenGupta (412) 787-6713
(407) 567-1320Carus Chemical Company Nirmal Singh (815) 224-6818 Carus only makes catalysts for OV oxidation and does not marketOttawa, IL (815) 433-9075 complete oxidation systems for OV control. Carus catalyst is used by
Anguil Environmental, Demptrol, and M&W Industries.Catalytica Mountain View, CA Thomas Duffy (415) 960-3000 Catalytica is developing an adsorption/catalytic oxidation system. It is
(415) 960-0127 currently in the developmental stage.CSM Environmental Thomas Otchby (718) 522-7000 CSM has been working in the area of catalytic oxidation for the last 20Systems, Inc. Brooklyn, NY Walt Talbot (718) 852-1686 years, especially with low concentration OV control. They did not provide
any technical/cost information.Dedert Topsoe Olympia John Ruhl (708) 747-7000 Subsidiary of Haldor Topsoe. Several catalytic systems in the market;Fields, IL (708) 755-8815 however, all are operating at high OV concentration. The lowest
concentration for which their system has been used is 1 g/m3 (correspondsto about 290 ppm for benzene).
Demtrol Hartland, WI Robert Hablewitz (414) 367-7548 Use Carus catalyst in their catalyst oxidation systems.(414) 367-0831
Engelhard Iselin, NJ Kenneth Burns (908) 205-6640 Engelhard only makes catalysts for OV oxidation and does not market(908) 205-6146 complete oxidation systems for OV control. Their catalyst is used by SCM,
Anguil, McGill Environmental, and Temprite Industries.KSE, Inc. Amherst, MA Jim Kittrell (413) 549-5506 KSE has developed their own oxidation catalyst. This catalyst has been
tested below 100 ppm and as low as 1 ppm. Some of these data areproprietary and cannot be released. KSE constructs small systems (100 to200 scfm) in-house, larger systems are made by other vendors using KSEtechnology.
McGill Environmental Paul Kennedy (918) 445-2431 Most of their systems are operating at high OV concentration.Systems, Inc. Tulsa, OKM & W Industries, Inc. Denny Clodfelter (919) 969-9526 Several oxidation units in the market designed for 4,000 to 30,000 scfm andRural Hall, NC operating at feed OV concentrations up to as high as 10 percent. Recently
introduced a RE-GENSORB system consisting of a carbon adsorption bedin series with a thermal oxidizer. This is especially suited for low OVconcentration stream.
Met-Pro Harleysville, PA Robert Kenson (215) 723-6751 Met-Pro provides adsorption/thermal incineration systems, most of whichare used for control of paint spray booths.
MTR, Inc. San Francisco, CA Vicki Simmons (415) 328-2228 MTR has developed a membrane-based process for OV control. Thistechnology is best suited for stream with OV concentration in the 0.5 to 20percent range and is not economical when OV concentration is less than100 ppm.
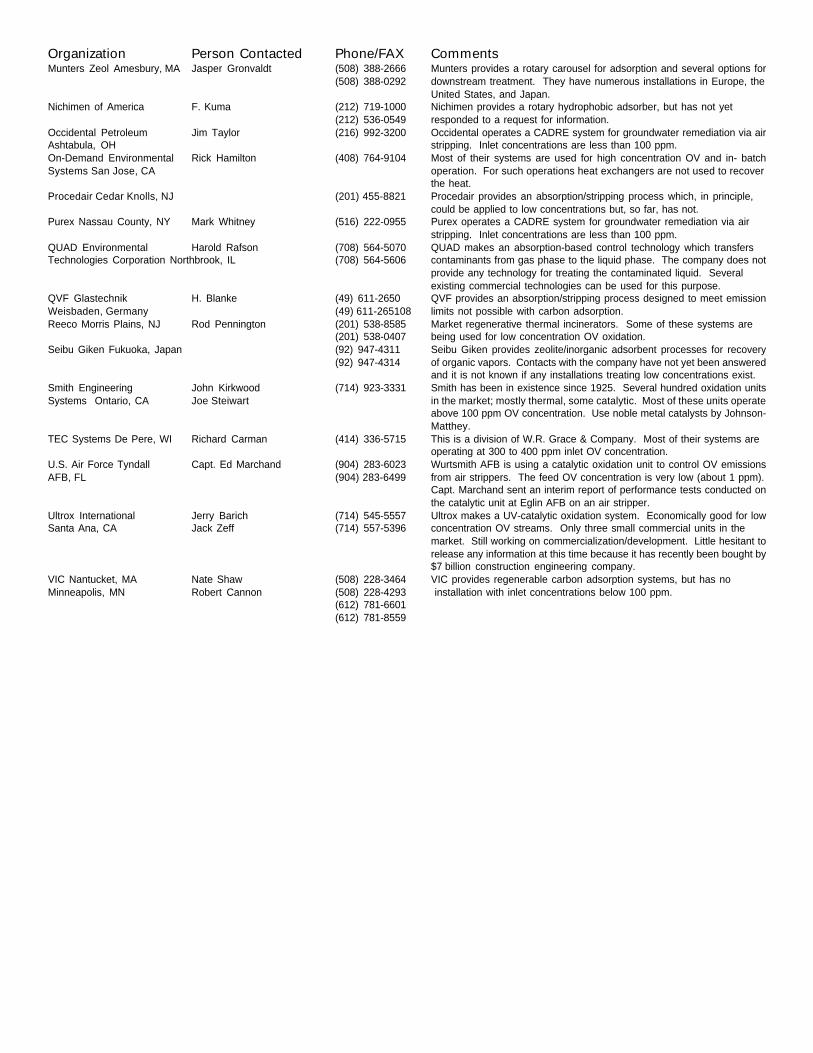
Organization Person Contacted Phone/FAX CommentsMunters Zeol Amesbury, MA Jasper Gronvaldt (508) 388-2666 Munters provides a rotary carousel for adsorption and several options for
(508) 388-0292 downstream treatment. They have numerous installations in Europe, theUnited States, and Japan.
Nichimen of America F. Kuma (212) 719-1000 Nichimen provides a rotary hydrophobic adsorber, but has not yet(212) 536-0549 responded to a request for information.
Occidental Petroleum Jim Taylor (216) 992-3200 Occidental operates a CADRE system for groundwater remediation via airAshtabula, OH stripping. Inlet concentrations are less than 100 ppm.On-Demand Environmental Rick Hamilton (408) 764-9104 Most of their systems are used for high concentration OV and in- batchSystems San Jose, CA operation. For such operations heat exchangers are not used to recover
the heat.Procedair Cedar Knolls, NJ (201) 455-8821 Procedair provides an absorption/stripping process which, in principle,
could be applied to low concentrations but, so far, has not.Purex Nassau County, NY Mark Whitney (516) 222-0955 Purex operates a CADRE system for groundwater remediation via air
stripping. Inlet concentrations are less than 100 ppm.QUAD Environmental Harold Rafson (708) 564-5070 QUAD makes an absorption-based control technology which transfersTechnologies Corporation Northbrook, IL (708) 564-5606 contaminants from gas phase to the liquid phase. The company does not
provide any technology for treating the contaminated liquid. Severalexisting commercial technologies can be used for this purpose.
QVF Glastechnik H. Blanke (49) 611-2650 QVF provides an absorption/stripping process designed to meet emissionWeisbaden, Germany (49) 611-265108 limits not possible with carbon adsorption.Reeco Morris Plains, NJ Rod Pennington (201) 538-8585 Market regenerative thermal incinerators. Some of these systems are
(201) 538-0407 being used for low concentration OV oxidation.Seibu Giken Fukuoka, Japan (92) 947-4311 Seibu Giken provides zeolite/inorganic adsorbent processes for recovery
(92) 947-4314 of organic vapors. Contacts with the company have not yet been answeredand it is not known if any installations treating low concentrations exist.
Smith Engineering John Kirkwood (714) 923-3331 Smith has been in existence since 1925. Several hundred oxidation unitsSystems Ontario, CA Joe Steiwart in the market; mostly thermal, some catalytic. Most of these units operate
above 100 ppm OV concentration. Use noble metal catalysts by Johnson-Matthey.
TEC Systems De Pere, WI Richard Carman (414) 336-5715 This is a division of W.R. Grace & Company. Most of their systems areoperating at 300 to 400 ppm inlet OV concentration.
U.S. Air Force Tyndall Capt. Ed Marchand (904) 283-6023 Wurtsmith AFB is using a catalytic oxidation unit to control OV emissionsAFB, FL (904) 283-6499 from air strippers. The feed OV concentration is very low (about 1 ppm).
Capt. Marchand sent an interim report of performance tests conducted onthe catalytic unit at Eglin AFB on an air stripper.
Ultrox International Jerry Barich (714) 545-5557 Ultrox makes a UV-catalytic oxidation system. Economically good for lowSanta Ana, CA Jack Zeff (714) 557-5396 concentration OV streams. Only three small commercial units in the
market. Still working on commercialization/development. Little hesitant torelease any information at this time because it has recently been bought by$7 billion construction engineering company.
VIC Nantucket, MA Nate Shaw (508) 228-3464 VIC provides regenerable carbon adsorption systems, but has noMinneapolis, MN Robert Cannon (508) 228-4293 installation with inlet concentrations below 100 ppm.
(612) 781-6601(612) 781-8559
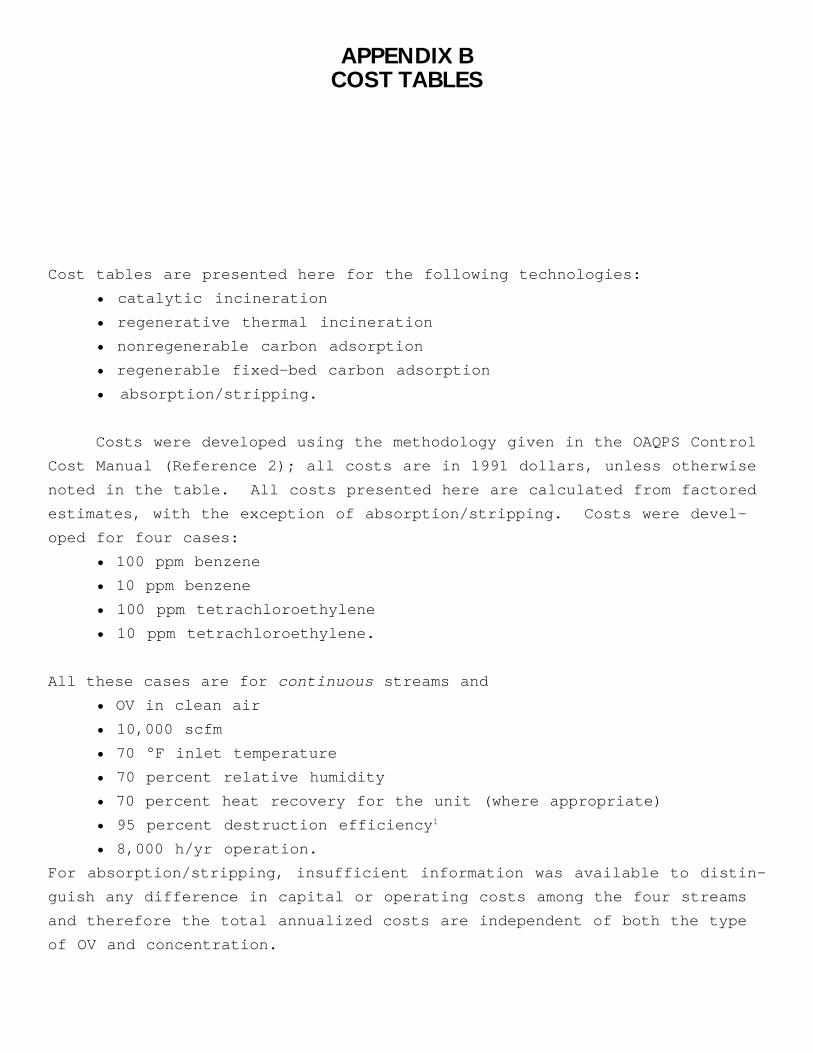
APPENDIX BCOST TABLES
Cost tables are presented here for the following technologies:
• catalytic incineration
• regenerative thermal incineration
• nonregenerable carbon adsorption
• regenerable fixed-bed carbon adsorption
• absorption/stripping.
Costs were developed using the methodology given in the OAQPS Control
Cost Manual (Reference 2); all costs are in 1991 dollars, unless otherwise
noted in the table. All costs presented here are calculated from factored
estimates, with the exception of absorption/stripping. Costs were devel-
oped for four cases:
• 100 ppm benzene
• 10 ppm benzene
• 100 ppm tetrachloroethylene
• 10 ppm tetrachloroethylene.
All these cases are for continuous streams and
• OV in clean air
• 10,000 scfm
• 70 °F inlet temperature
• 70 percent relative humidity
• 70 percent heat recovery for the unit (where appropriate)
• 95 percent destruction efficiency1
• 8,000 h/yr operation.
For absorption/stripping, insufficient information was available to distin-
guish any difference in capital or operating costs among the four streams
and therefore the total annualized costs are independent of both the type
of OV and concentration.
1 The destruction/removal efficiency of 95 percent was selected to rep-
resent the lower end of the range of control efficiencies required for the
control of organic vapors by EPA regulations. In many cases, EPA requires
higher control efficiencies especially in those situations where incinera-
tion is the technology serving as the basis of the standard. The incinera-
tion-based technolgies discussed in this document have demonstrated control
efficiencies of 98 percent or higher and therefore are applicable when a
higher performance standard (e.g., 98%) is required by regulation. Con-
ducting the analysis at 95 percent as opposed to 98 percent also can impact
the cost-effectiveness calculation because in many cases the additional
organics control can be achieved at little or no cost. Cost-effectiveness
values would therefore be lower at this higher control efficiency.
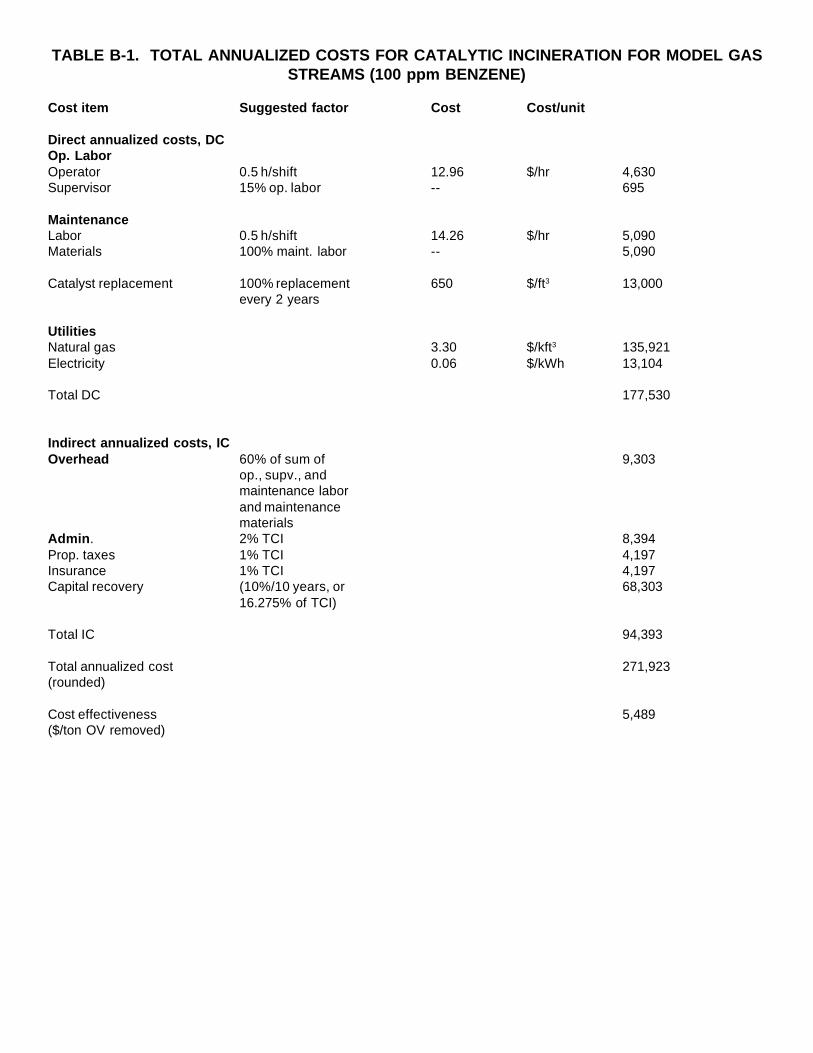
TABLE B-1. TOTAL ANNUALIZED COSTS FOR CATALYTIC INCINERATION FOR MODEL GASSTREAMS (100 ppm BENZENE)
Cost item Suggested factor Cost Cost/unit
Direct annualized costs, DCOp. LaborOperator 0.5 h/shift 12.96 $/hr 4,630Supervisor 15% op. labor -- 695
MaintenanceLabor 0.5 h/shift 14.26 $/hr 5,090Materials 100% maint. labor -- 5,090
Catalyst replacement 100% replacement 650 $/ft3 13,000every 2 years
UtilitiesNatural gas 3.30 $/kft3 135,921Electricity 0.06 $/kWh 13,104
Total DC 177,530
Indirect annualized costs, ICOverhead 60% of sum of 9,303
op., supv., andmaintenance laborand maintenancematerials
Admin. 2% TCI 8,394Prop. taxes 1% TCI 4,197Insurance 1% TCI 4,197Capital recovery (10%/10 years, or 68,303
16.275% of TCI)
Total IC 94,393
Total annualized cost 271,923(rounded)
Cost effectiveness 5,489($/ton OV removed)
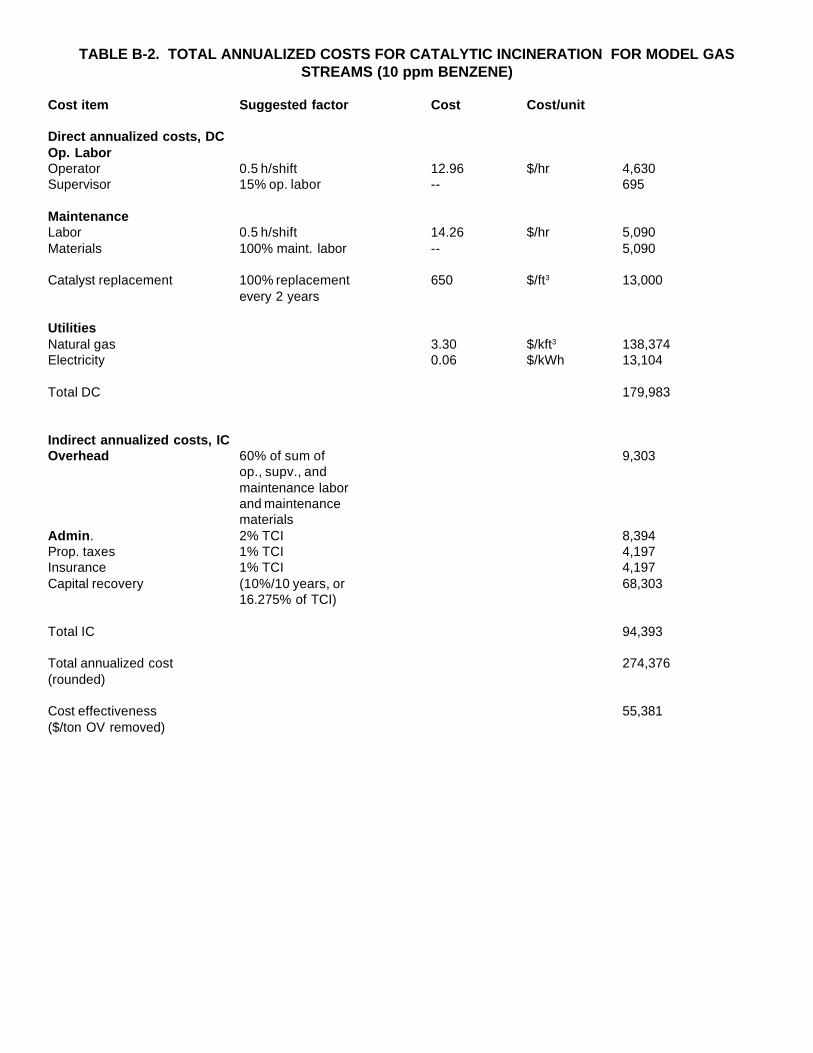
TABLE B-2. TOTAL ANNUALIZED COSTS FOR CATALYTIC INCINERATION FOR MODEL GASSTREAMS (10 ppm BENZENE)
Cost item Suggested factor Cost Cost/unit
Direct annualized costs, DCOp. LaborOperator 0.5 h/shift 12.96 $/hr 4,630Supervisor 15% op. labor -- 695
MaintenanceLabor 0.5 h/shift 14.26 $/hr 5,090Materials 100% maint. labor -- 5,090
Catalyst replacement 100% replacement 650 $/ft3 13,000every 2 years
UtilitiesNatural gas 3.30 $/kft3 138,374Electricity 0.06 $/kWh 13,104
Total DC 179,983
Indirect annualized costs, ICOverhead 60% of sum of 9,303
op., supv., andmaintenance laborand maintenancematerials
Admin. 2% TCI 8,394Prop. taxes 1% TCI 4,197Insurance 1% TCI 4,197Capital recovery (10%/10 years, or 68,303
16.275% of TCI)
Total IC 94,393
Total annualized cost 274,376(rounded)
Cost effectiveness 55,381($/ton OV removed)
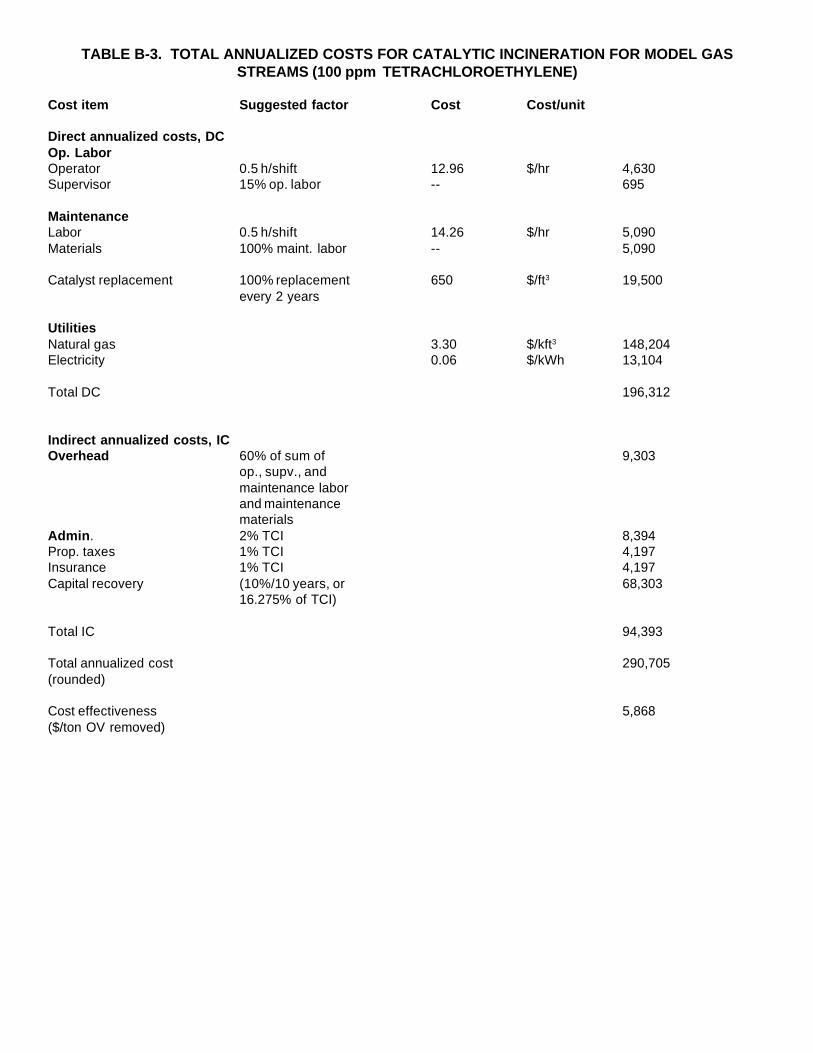
TABLE B-3. TOTAL ANNUALIZED COSTS FOR CATALYTIC INCINERATION FOR MODEL GASSTREAMS (100 ppm TETRACHLOROETHYLENE)
Cost item Suggested factor Cost Cost/unit
Direct annualized costs, DCOp. LaborOperator 0.5 h/shift 12.96 $/hr 4,630Supervisor 15% op. labor -- 695
MaintenanceLabor 0.5 h/shift 14.26 $/hr 5,090Materials 100% maint. labor -- 5,090
Catalyst replacement 100% replacement 650 $/ft3 19,500every 2 years
UtilitiesNatural gas 3.30 $/kft3 148,204Electricity 0.06 $/kWh 13,104
Total DC 196,312
Indirect annualized costs, ICOverhead 60% of sum of 9,303
op., supv., andmaintenance laborand maintenancematerials
Admin. 2% TCI 8,394Prop. taxes 1% TCI 4,197Insurance 1% TCI 4,197Capital recovery (10%/10 years, or 68,303
16.275% of TCI)
Total IC 94,393
Total annualized cost 290,705(rounded)
Cost effectiveness 5,868($/ton OV removed)
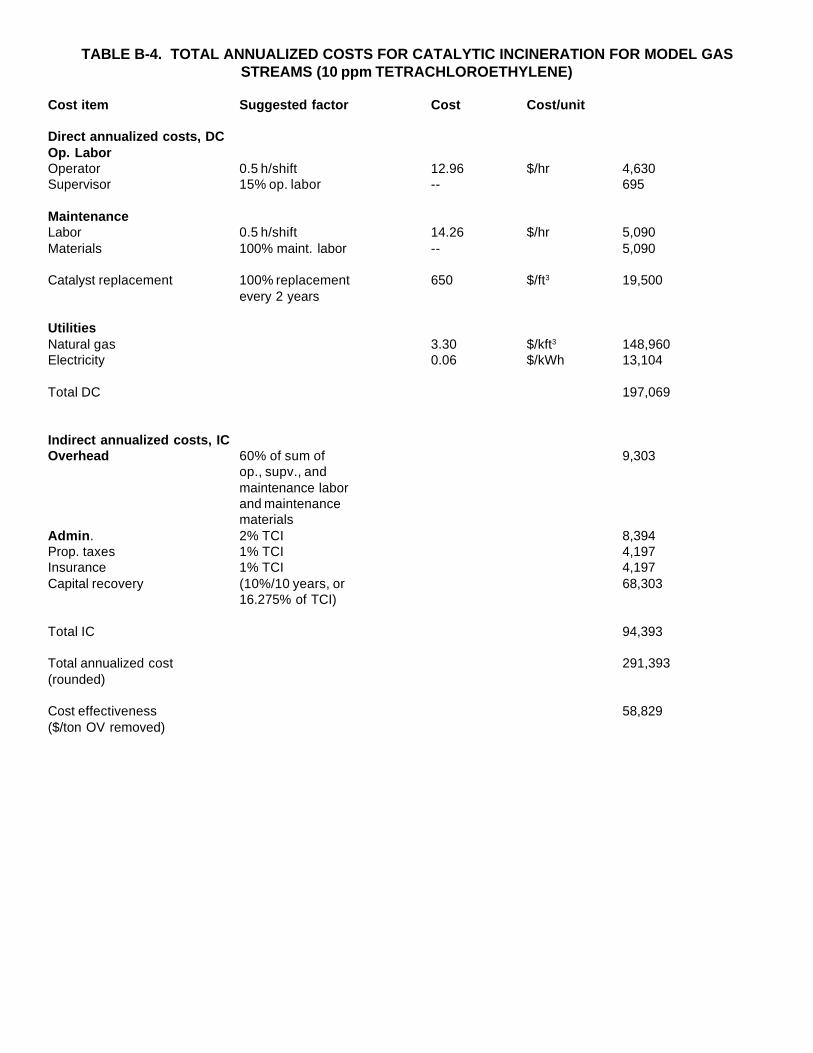
TABLE B-4. TOTAL ANNUALIZED COSTS FOR CATALYTIC INCINERATION FOR MODEL GASSTREAMS (10 ppm TETRACHLOROETHYLENE)
Cost item Suggested factor Cost Cost/unit
Direct annualized costs, DCOp. LaborOperator 0.5 h/shift 12.96 $/hr 4,630Supervisor 15% op. labor -- 695
MaintenanceLabor 0.5 h/shift 14.26 $/hr 5,090Materials 100% maint. labor -- 5,090
Catalyst replacement 100% replacement 650 $/ft3 19,500every 2 years
UtilitiesNatural gas 3.30 $/kft3 148,960Electricity 0.06 $/kWh 13,104
Total DC 197,069
Indirect annualized costs, ICOverhead 60% of sum of 9,303
op., supv., andmaintenance laborand maintenancematerials
Admin. 2% TCI 8,394Prop. taxes 1% TCI 4,197Insurance 1% TCI 4,197Capital recovery (10%/10 years, or 68,303
16.275% of TCI)
Total IC 94,393
Total annualized cost 291,393(rounded)
Cost effectiveness 58,829($/ton OV removed)

TABLE B-5. TOTAL ANNUALIZED COSTS FOR REGENERATIVE THERMAL INCINERATION FORMODEL GAS STREAMS (100 ppm BENZENE)a
Cost item Suggested factor Cost Cost/unit
Direct annualized costs, DCOp. LaborOperator 0.5 h/shift 12.96 $/h 4,630Supervisor 15% op. labor -- 695
MaintenanceLabor 0.5 h/shift 14.26 $/h 5,090Materials 100% maint. labor -- 5,090
UtilitiesFuelsb 6.0c $/h 48,000Electricityd 3.36c $/h 26,880
Total DC 90,385
Indirect annualized costs, ICOverhead 60% of sum of 9,303
op., supv., andmaintenance laborand maintenancematerials
Admin. 2% TCIe 8,020Prop. taxes 1% TCI 4,010Insurance 1% TCI 4,010Capital recovery (10%/10 years, or 65,263
16.275% of TCI)
Total IC 90,606
Total annualized cost 180,991(rounded)
Cost effectiveness 3,653($/ton OV removed)
a Thermal energy recovery is 95 percent for benzene.b Based on $4/106 Btu.c Fuel and electrical costs provided by vendor (Pennington, 1991) in units of $/h. Costs based
on 8,000 h/yr operation.d Based on $0.06/kWh.e TCI given by vendor (Pennington, 1991) as $401,000.
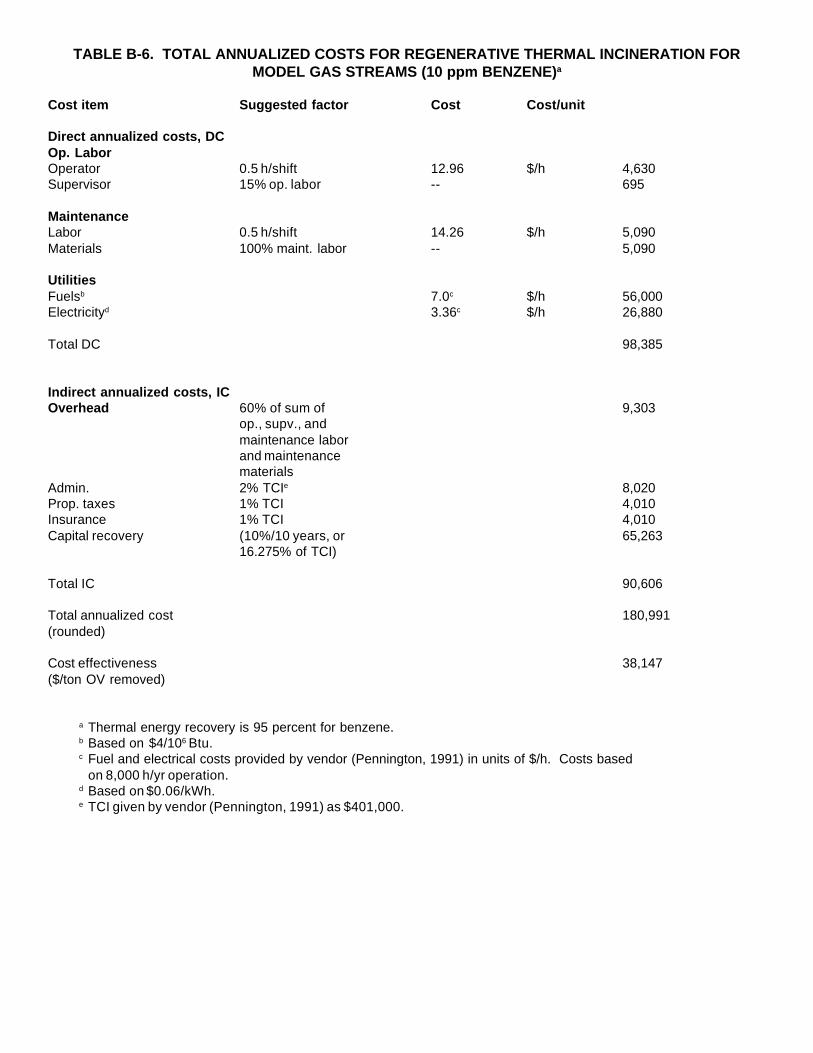
TABLE B-6. TOTAL ANNUALIZED COSTS FOR REGENERATIVE THERMAL INCINERATION FORMODEL GAS STREAMS (10 ppm BENZENE)a
Cost item Suggested factor Cost Cost/unit
Direct annualized costs, DCOp. LaborOperator 0.5 h/shift 12.96 $/h 4,630Supervisor 15% op. labor -- 695
MaintenanceLabor 0.5 h/shift 14.26 $/h 5,090Materials 100% maint. labor -- 5,090
UtilitiesFuelsb 7.0c $/h 56,000Electricityd 3.36c $/h 26,880
Total DC 98,385
Indirect annualized costs, ICOverhead 60% of sum of 9,303
op., supv., andmaintenance laborand maintenancematerials
Admin. 2% TCIe 8,020Prop. taxes 1% TCI 4,010Insurance 1% TCI 4,010Capital recovery (10%/10 years, or 65,263
16.275% of TCI)
Total IC 90,606
Total annualized cost 180,991(rounded)
Cost effectiveness 38,147($/ton OV removed)
a Thermal energy recovery is 95 percent for benzene.b Based on $4/106 Btu.c Fuel and electrical costs provided by vendor (Pennington, 1991) in units of $/h. Costs based
on 8,000 h/yr operation.d Based on $0.06/kWh.e TCI given by vendor (Pennington, 1991) as $401,000.
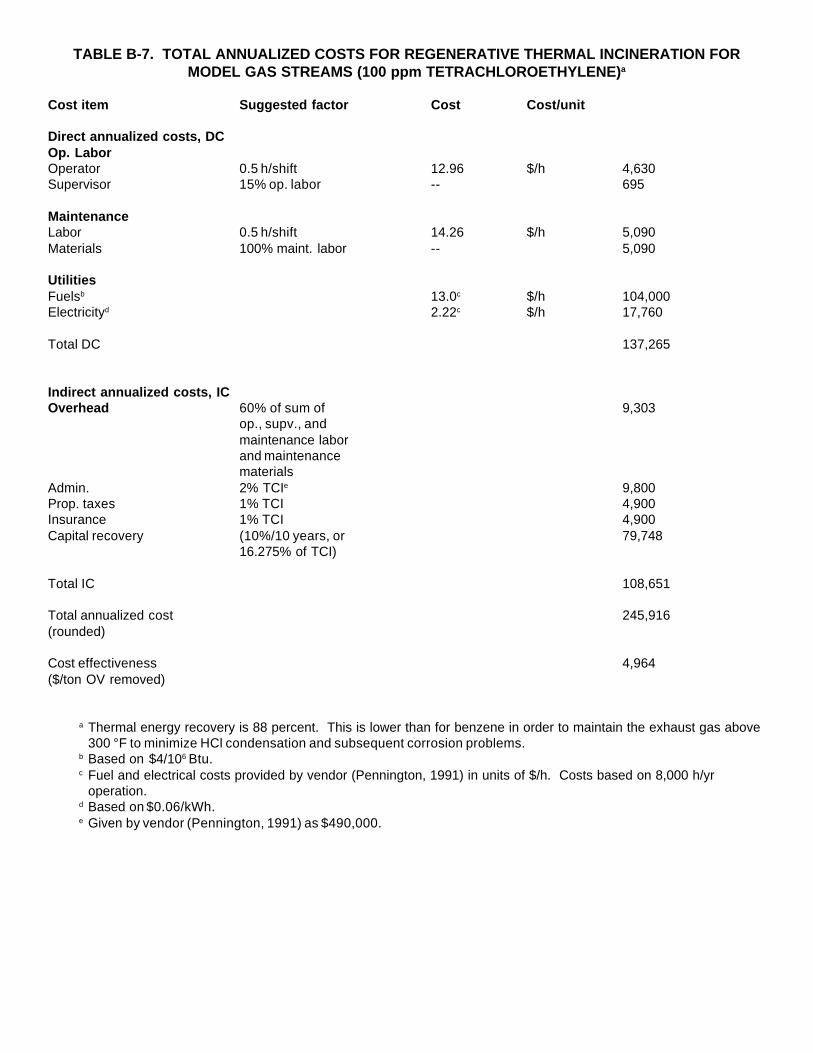
TABLE B-7. TOTAL ANNUALIZED COSTS FOR REGENERATIVE THERMAL INCINERATION FORMODEL GAS STREAMS (100 ppm TETRACHLOROETHYLENE)a
Cost item Suggested factor Cost Cost/unit
Direct annualized costs, DCOp. LaborOperator 0.5 h/shift 12.96 $/h 4,630Supervisor 15% op. labor -- 695
MaintenanceLabor 0.5 h/shift 14.26 $/h 5,090Materials 100% maint. labor -- 5,090
UtilitiesFuelsb 13.0c $/h 104,000Electricityd 2.22c $/h 17,760
Total DC 137,265
Indirect annualized costs, ICOverhead 60% of sum of 9,303
op., supv., andmaintenance laborand maintenancematerials
Admin. 2% TCIe 9,800Prop. taxes 1% TCI 4,900Insurance 1% TCI 4,900Capital recovery (10%/10 years, or 79,748
16.275% of TCI)
Total IC 108,651
Total annualized cost 245,916(rounded)
Cost effectiveness 4,964($/ton OV removed)
a Thermal energy recovery is 88 percent. This is lower than for benzene in order to maintain the exhaust gas above300 °F to minimize HCl condensation and subsequent corrosion problems.
b Based on $4/106 Btu.c Fuel and electrical costs provided by vendor (Pennington, 1991) in units of $/h. Costs based on 8,000 h/yr
operation.d Based on $0.06/kWh.e Given by vendor (Pennington, 1991) as $490,000.

TABLE B-8. TOTAL ANNUALIZED COSTS FOR REGENERATIVE THERMAL INCINERATION FORMODEL GAS STREAMS (10 ppm TETRACHLOROETHYLENE)a
Cost item Suggested factor Cost Cost/unit
Direct annualized costs, DCOp. LaborOperator 0.5 h/shift 12.96 $/h 4,630Supervisor 15% op. labor -- 695
MaintenanceLabor 0.5 h/shift 14.26 $/h 5,090Materials 100% maint. labor -- 5,090
UtilitiesFuelsb 6.0c $/h 110,400Electricityd 3.36c $/h 17,760
Total DC 143,665
Indirect annualized costs, ICOverhead 60% of sum of 9,303
op., supv., andmaintenance laborand maintenancematerials
Admin. 2% TCIe 9,800Prop. taxes 1% TCI 4,900Insurance 1% TCI 4,900Capital recovery (10%/10 years, or 79,748
16.275% of TCI)
Total IC 108,651
Total annualized cost 252,316(rounded)
Cost effectiveness 50,928($/ton OV removed)
a Thermal energy recovery is 88 percent. This is lower than for benzene in order to maintain the exhaust gas above300 °F to minimize HCl condensation and subsequent corrosion problems.
b Based on $4/106 Btu.c Fuel and electrical costs provided by vendor (Pennington, 1991) in units of $/h. Costs based on 8,000 h/yr
operation.d Based on $0.06/kWh.e Given by vendor (Pennington, 1991) as $490,000.
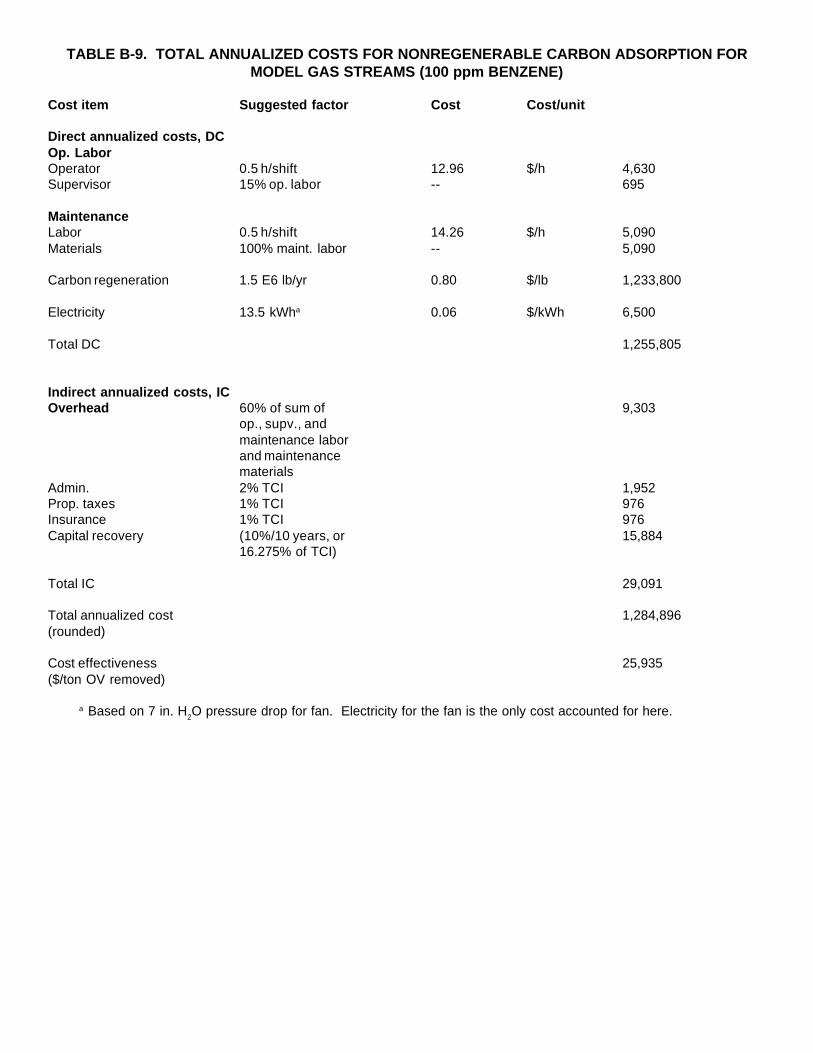
TABLE B-9. TOTAL ANNUALIZED COSTS FOR NONREGENERABLE CARBON ADSORPTION FORMODEL GAS STREAMS (100 ppm BENZENE)
Cost item Suggested factor Cost Cost/unit
Direct annualized costs, DCOp. LaborOperator 0.5 h/shift 12.96 $/h 4,630Supervisor 15% op. labor -- 695
MaintenanceLabor 0.5 h/shift 14.26 $/h 5,090Materials 100% maint. labor -- 5,090
Carbon regeneration 1.5 E6 lb/yr 0.80 $/lb 1,233,800
Electricity 13.5 kWha 0.06 $/kWh 6,500
Total DC 1,255,805
Indirect annualized costs, ICOverhead 60% of sum of 9,303
op., supv., andmaintenance laborand maintenancematerials
Admin. 2% TCI 1,952Prop. taxes 1% TCI 976Insurance 1% TCI 976Capital recovery (10%/10 years, or 15,884
16.275% of TCI)
Total IC 29,091
Total annualized cost 1,284,896(rounded)
Cost effectiveness 25,935($/ton OV removed)
a Based on 7 in. H2O pressure drop for fan. Electricity for the fan is the only cost accounted for here.
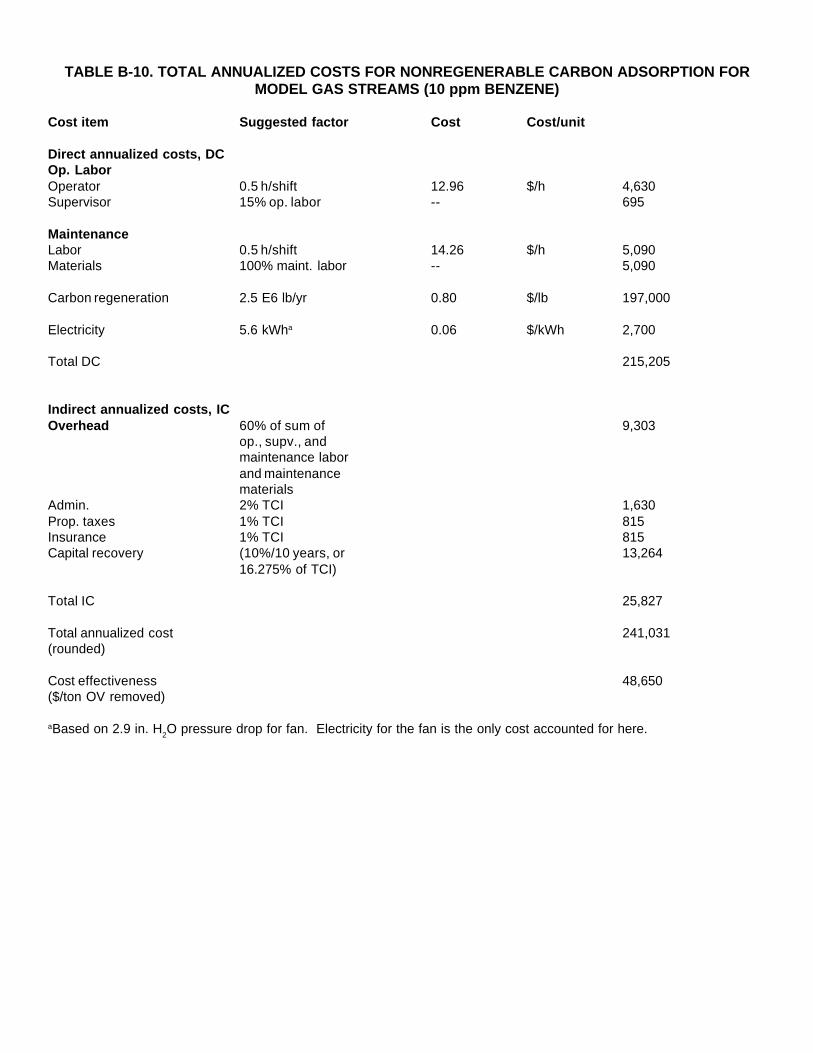
TABLE B-10. TOTAL ANNUALIZED COSTS FOR NONREGENERABLE CARBON ADSORPTION FORMODEL GAS STREAMS (10 ppm BENZENE)
Cost item Suggested factor Cost Cost/unit
Direct annualized costs, DCOp. LaborOperator 0.5 h/shift 12.96 $/h 4,630Supervisor 15% op. labor -- 695
MaintenanceLabor 0.5 h/shift 14.26 $/h 5,090Materials 100% maint. labor -- 5,090
Carbon regeneration 2.5 E6 lb/yr 0.80 $/lb 197,000
Electricity 5.6 kWha 0.06 $/kWh 2,700
Total DC 215,205
Indirect annualized costs, ICOverhead 60% of sum of 9,303
op., supv., andmaintenance laborand maintenancematerials
Admin. 2% TCI 1,630Prop. taxes 1% TCI 815Insurance 1% TCI 815Capital recovery (10%/10 years, or 13,264
16.275% of TCI)
Total IC 25,827
Total annualized cost 241,031(rounded)
Cost effectiveness 48,650($/ton OV removed)
aBased on 2.9 in. H2O pressure drop for fan. Electricity for the fan is the only cost accounted for here.

TABLE B-11. TOTAL ANNUALIZED COSTS FOR NONREGENERABLE CARBON ADSORPTION FORMODEL GAS STREAMS (100 ppm TETRACHLOROETHYLENE)
Cost item Suggested factor Cost Cost/unit
Direct annualized costs, DCOp. LaborOperator 0.5 h/shift 12.96 $/h 4,630Supervisor 15% op. labor -- 695
MaintenanceLabor 0.5 h/shift 14.26 $/h 5,090Materials 100% maint. labor -- 5,090
Carbon regeneration 1.2 E6 lb/yr 0.80 $/lb 942,000
Electricity 10.2 kWha 0.06 $/kWh 5,400
Total DC 962,905
Indirect annualized costs, ICOverhead 60% of sum of 9,303
op., supv., andmaintenance laborand maintenancematerials
Admin. 2% TCI 1,856Prop. taxes 1% TCI 928Insurance 1% TCI 928Capital recovery (10%/10 years, or 15,103
16.275% of TCI)
Total IC 28,118
Total annualized cost 991,022(rounded)
Cost effectiveness 20,003($/ton OV removed)
aBased on 5.8 in. H2O pressure drop for fan. Electricity for the fan is the only cost accounted for here.
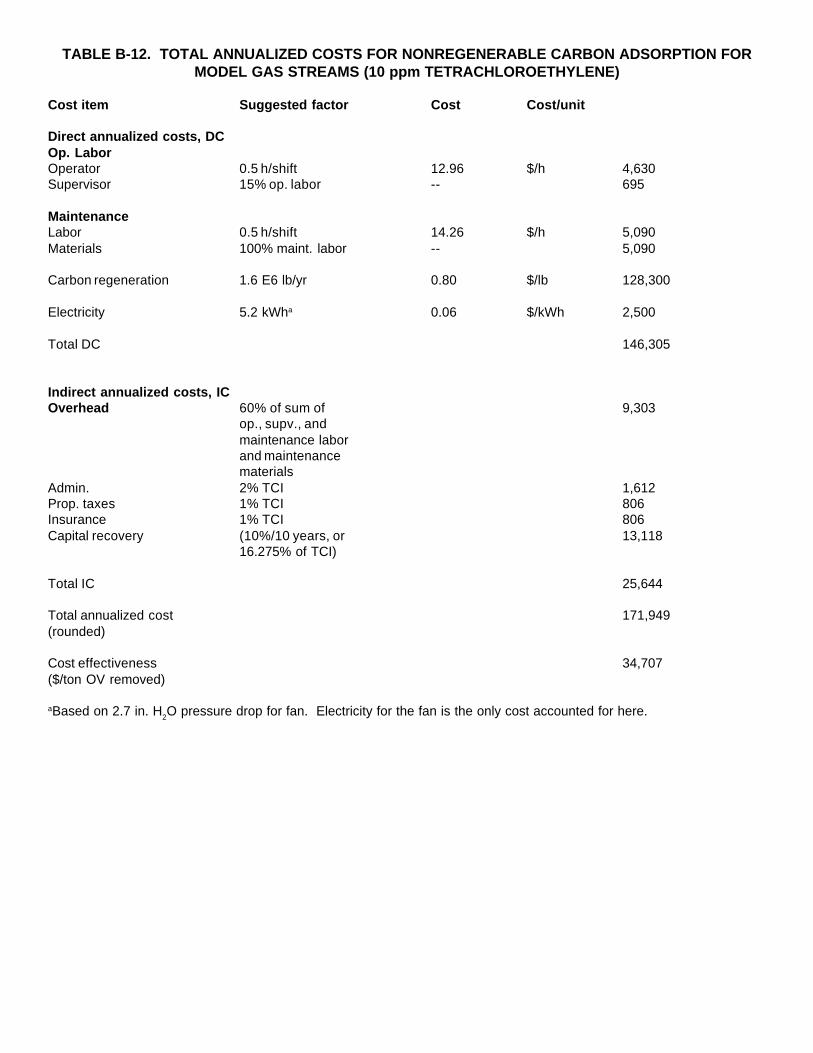
TABLE B-12. TOTAL ANNUALIZED COSTS FOR NONREGENERABLE CARBON ADSORPTION FORMODEL GAS STREAMS (10 ppm TETRACHLOROETHYLENE)
Cost item Suggested factor Cost Cost/unit
Direct annualized costs, DCOp. LaborOperator 0.5 h/shift 12.96 $/h 4,630Supervisor 15% op. labor -- 695
MaintenanceLabor 0.5 h/shift 14.26 $/h 5,090Materials 100% maint. labor -- 5,090
Carbon regeneration 1.6 E6 lb/yr 0.80 $/lb 128,300
Electricity 5.2 kWha 0.06 $/kWh 2,500
Total DC 146,305
Indirect annualized costs, ICOverhead 60% of sum of 9,303
op., supv., andmaintenance laborand maintenancematerials
Admin. 2% TCI 1,612Prop. taxes 1% TCI 806Insurance 1% TCI 806Capital recovery (10%/10 years, or 13,118
16.275% of TCI)
Total IC 25,644
Total annualized cost 171,949(rounded)
Cost effectiveness 34,707($/ton OV removed)
aBased on 2.7 in. H2O pressure drop for fan. Electricity for the fan is the only cost accounted for here.
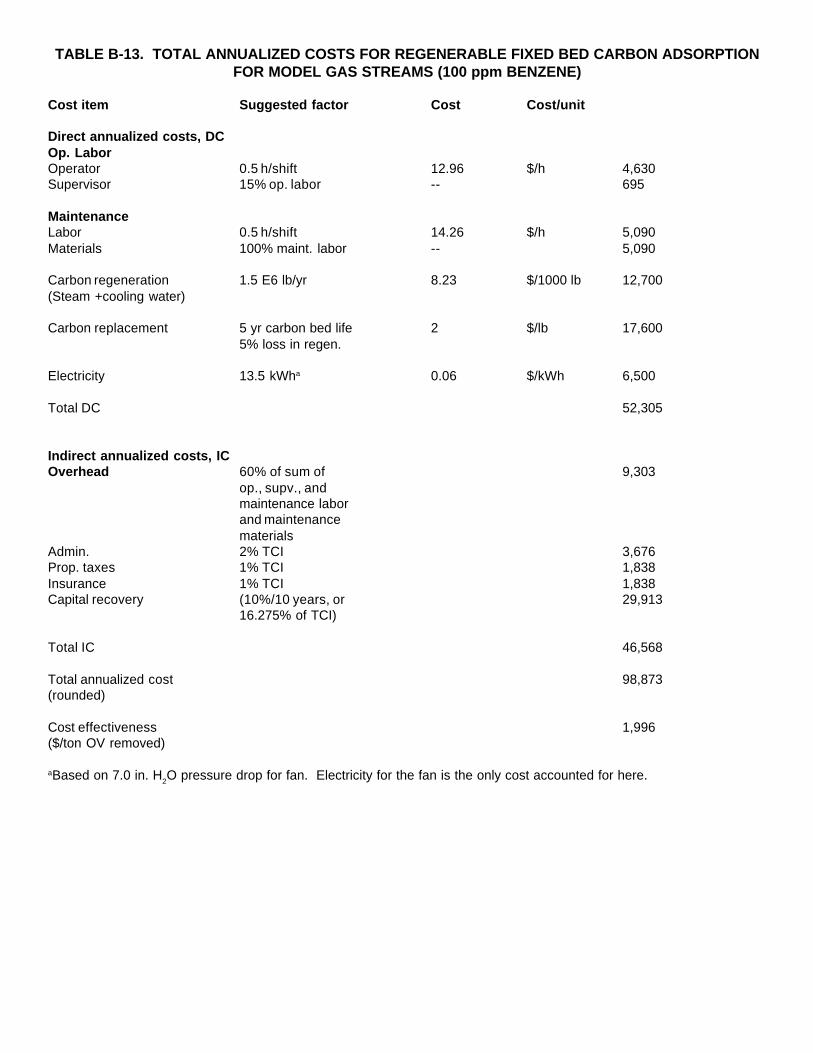
TABLE B-13. TOTAL ANNUALIZED COSTS FOR REGENERABLE FIXED BED CARBON ADSORPTIONFOR MODEL GAS STREAMS (100 ppm BENZENE)
Cost item Suggested factor Cost Cost/unit
Direct annualized costs, DCOp. LaborOperator 0.5 h/shift 12.96 $/h 4,630Supervisor 15% op. labor -- 695
MaintenanceLabor 0.5 h/shift 14.26 $/h 5,090Materials 100% maint. labor -- 5,090
Carbon regeneration 1.5 E6 lb/yr 8.23 $/1000 lb 12,700(Steam +cooling water)
Carbon replacement 5 yr carbon bed life 2 $/lb 17,6005% loss in regen.
Electricity 13.5 kWha 0.06 $/kWh 6,500
Total DC 52,305
Indirect annualized costs, ICOverhead 60% of sum of 9,303
op., supv., andmaintenance laborand maintenancematerials
Admin. 2% TCI 3,676Prop. taxes 1% TCI 1,838Insurance 1% TCI 1,838Capital recovery (10%/10 years, or 29,913
16.275% of TCI)
Total IC 46,568
Total annualized cost 98,873(rounded)
Cost effectiveness 1,996($/ton OV removed)
aBased on 7.0 in. H2O pressure drop for fan. Electricity for the fan is the only cost accounted for here.
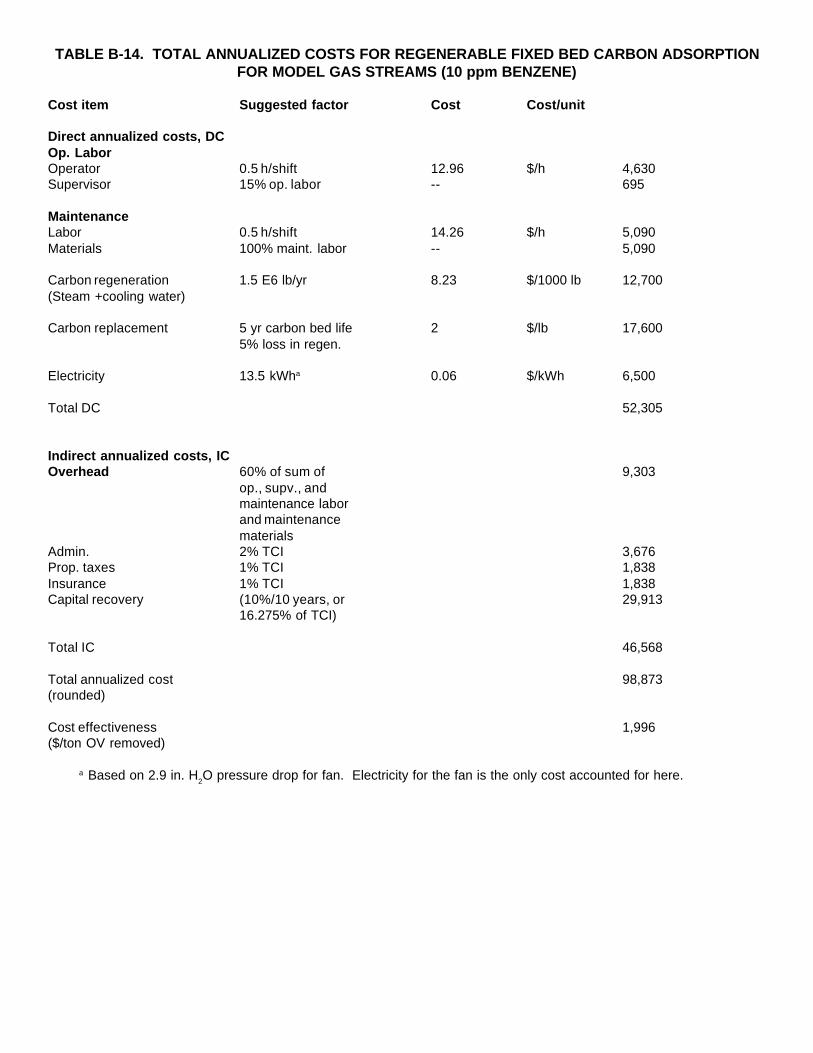
TABLE B-14. TOTAL ANNUALIZED COSTS FOR REGENERABLE FIXED BED CARBON ADSORPTIONFOR MODEL GAS STREAMS (10 ppm BENZENE)
Cost item Suggested factor Cost Cost/unit
Direct annualized costs, DCOp. LaborOperator 0.5 h/shift 12.96 $/h 4,630Supervisor 15% op. labor -- 695
MaintenanceLabor 0.5 h/shift 14.26 $/h 5,090Materials 100% maint. labor -- 5,090
Carbon regeneration 1.5 E6 lb/yr 8.23 $/1000 lb 12,700(Steam +cooling water)
Carbon replacement 5 yr carbon bed life 2 $/lb 17,6005% loss in regen.
Electricity 13.5 kWha 0.06 $/kWh 6,500
Total DC 52,305
Indirect annualized costs, ICOverhead 60% of sum of 9,303
op., supv., andmaintenance laborand maintenancematerials
Admin. 2% TCI 3,676Prop. taxes 1% TCI 1,838Insurance 1% TCI 1,838Capital recovery (10%/10 years, or 29,913
16.275% of TCI)
Total IC 46,568
Total annualized cost 98,873(rounded)
Cost effectiveness 1,996($/ton OV removed)
a Based on 2.9 in. H2O pressure drop for fan. Electricity for the fan is the only cost accounted for here.

TABLE B-15. TOTAL ANNUALIZED COSTS FOR REGENERABLE FIXED BED CARBON ADSORPTIONFOR MODEL GAS STREAMS (100 ppm TETRACHLOROETHYLENE)
Cost item Suggested factor Cost Cost/unit
Direct annualized costs, DCOp. LaborOperator 0.5 h/shift 12.96 $/h 4,630Supervisor 15% op. labor -- 695
MaintenanceLabor 0.5 h/shift 14.26 $/h 5,090Materials 100% maint. labor -- 5,090
Carbon regeneration 1.2 E6 lb/yr 8.23 $/1000 lb 9,700(Steam +cooling water)
Carbon replacement 5 yr carbon bed life 2 $/lb 13,5005% loss in regen.
Electricity 10.2 kWha 0.06 $/kWh 5,400
Total DC 44,105
Indirect annualized costs, ICOverhead 60% of sum of 9,303
op., supv., andmaintenance laborand maintenancematerials
Admin. 2% TCI 3,432Prop. taxes 1% TCI 1,716Insurance 1% TCI 1,716Capital recovery (10%/10 years, or 27,928
16.275% of TCI)
Total IC 44,095
Total annualized cost 88,199(rounded)
Cost effectiveness 1,780($/ton OV removed)
aBased on 5.8 in. H2O pressure drop for fan. Electricity for the fan is the only cost accounted for here.
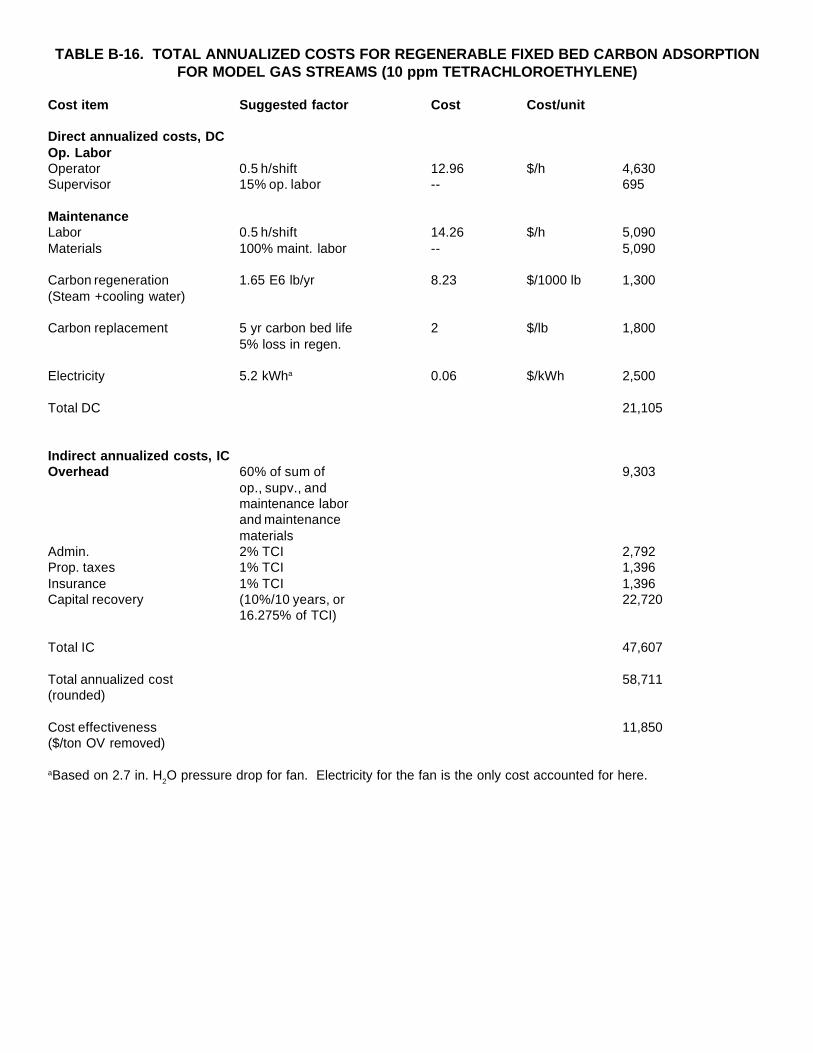
TABLE B-16. TOTAL ANNUALIZED COSTS FOR REGENERABLE FIXED BED CARBON ADSORPTIONFOR MODEL GAS STREAMS (10 ppm TETRACHLOROETHYLENE)
Cost item Suggested factor Cost Cost/unit
Direct annualized costs, DCOp. LaborOperator 0.5 h/shift 12.96 $/h 4,630Supervisor 15% op. labor -- 695
MaintenanceLabor 0.5 h/shift 14.26 $/h 5,090Materials 100% maint. labor -- 5,090
Carbon regeneration 1.65 E6 lb/yr 8.23 $/1000 lb 1,300(Steam +cooling water)
Carbon replacement 5 yr carbon bed life 2 $/lb 1,8005% loss in regen.
Electricity 5.2 kWha 0.06 $/kWh 2,500
Total DC 21,105
Indirect annualized costs, ICOverhead 60% of sum of 9,303
op., supv., andmaintenance laborand maintenancematerials
Admin. 2% TCI 2,792Prop. taxes 1% TCI 1,396Insurance 1% TCI 1,396Capital recovery (10%/10 years, or 22,720
16.275% of TCI)
Total IC 47,607
Total annualized cost 58,711(rounded)
Cost effectiveness 11,850($/ton OV removed)
aBased on 2.7 in. H2O pressure drop for fan. Electricity for the fan is the only cost accounted for here.
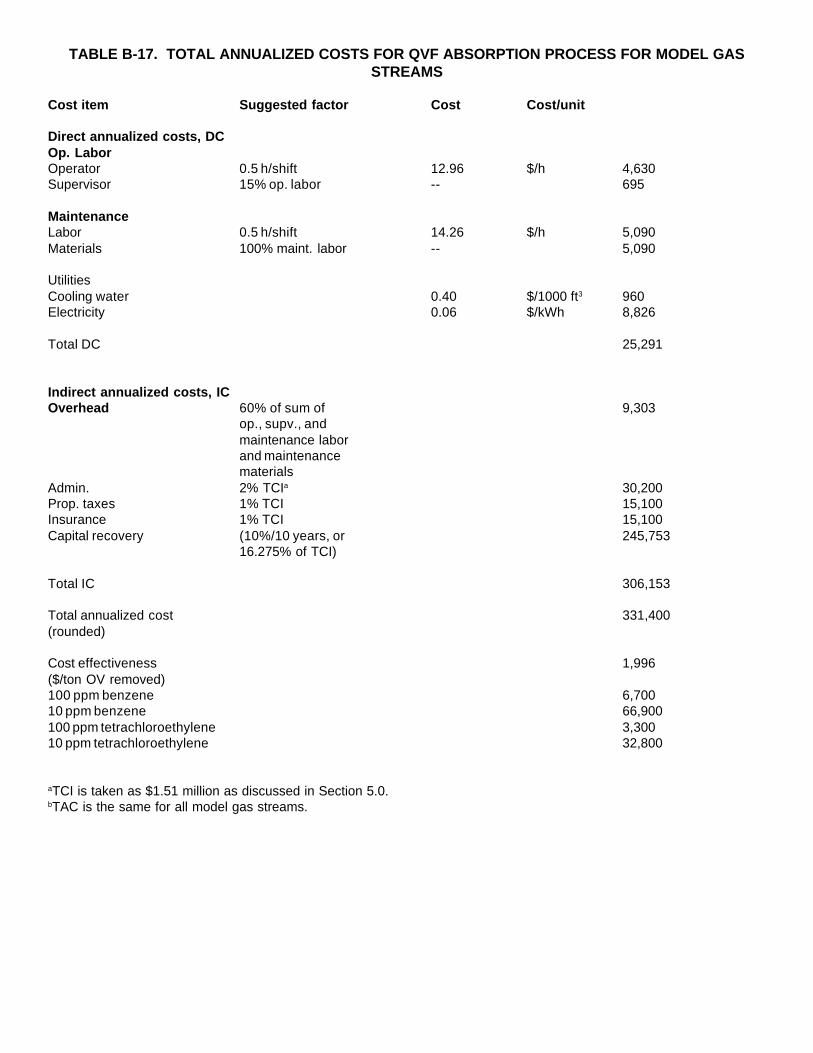
TABLE B-17. TOTAL ANNUALIZED COSTS FOR QVF ABSORPTION PROCESS FOR MODEL GASSTREAMS
Cost item Suggested factor Cost Cost/unit
Direct annualized costs, DCOp. LaborOperator 0.5 h/shift 12.96 $/h 4,630Supervisor 15% op. labor -- 695
MaintenanceLabor 0.5 h/shift 14.26 $/h 5,090Materials 100% maint. labor -- 5,090
UtilitiesCooling water 0.40 $/1000 ft3 960Electricity 0.06 $/kWh 8,826
Total DC 25,291
Indirect annualized costs, ICOverhead 60% of sum of 9,303
op., supv., andmaintenance laborand maintenancematerials
Admin. 2% TCIa 30,200Prop. taxes 1% TCI 15,100Insurance 1% TCI 15,100Capital recovery (10%/10 years, or 245,753
16.275% of TCI)
Total IC 306,153
Total annualized cost 331,400(rounded)
Cost effectiveness 1,996($/ton OV removed)100 ppm benzene 6,70010 ppm benzene 66,900100 ppm tetrachloroethylene 3,30010 ppm tetrachloroethylene 32,800
aTCI is taken as $1.51 million as discussed in Section 5.0.bTAC is the same for all model gas streams.
APPENDIX C
SUMMARY TABLE OF CONTROL DEVICES INSTALLED ON HIGH FLOW, LOWCONCENTRATION ORGANIC VAPOR STREAMS
Appendix C. Summary Table of Control Devices Installed on High Flow, Low Concentration Organic VaporStreams in the U.S.
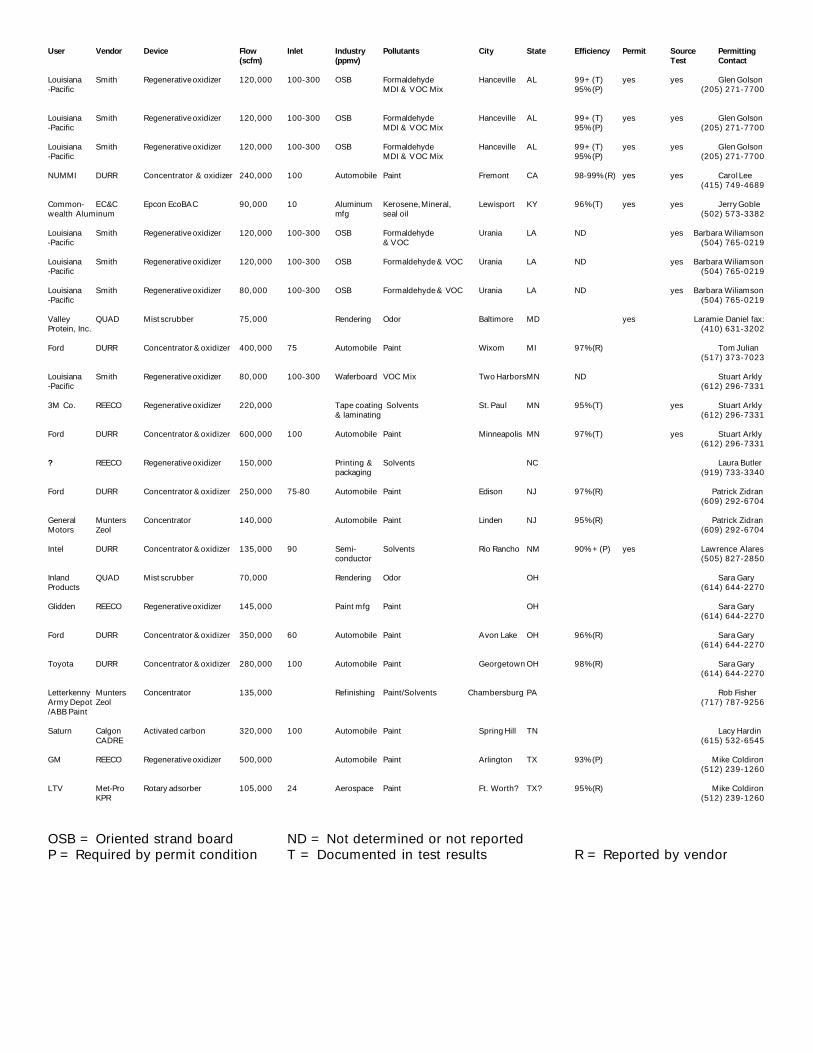
User Vendor Device Flow Inlet Industry Pollutants City State Efficiency Permit Source Permitting(scfm) (ppmv) Test Contact
Louisiana Smith Regenerative oxidizer 120,000 100-300 OSB Formaldehyde Hanceville AL 99+(T) yes yes Glen Golson-Pacific MDI & VOC Mix 95%(P) (205) 271-7700
Louisiana Smith Regenerative oxidizer 120,000 100-300 OSB Formaldehyde Hanceville AL 99+(T) yes yes Glen Golson-Pacific MDI & VOC Mix 95%(P) (205) 271-7700
Louisiana Smith Regenerative oxidizer 120,000 100-300 OSB Formaldehyde Hanceville AL 99+(T) yes yes Glen Golson-Pacific MDI & VOC Mix 95%(P) (205) 271-7700
NUMMI DURR Concentrator & oxidizer 240,000 100 Automobile Paint Fremont CA 98-99%(R) yes yes Carol Lee (415) 749-4689
Common- EC&C Epcon EcoBAC 90,000 10 Aluminum Kerosene, Mineral, Lewisport KY 96%(T) yes yes Jerry Goblewealth Aluminum mfg seal oil (502) 573-3382
Louisiana Smith Regenerative oxidizer 120,000 100-300 OSB Formaldehyde Urania LA ND yes Barbara Wiliamson-Pacific & VOC (504) 765-0219
Louisiana Smith Regenerative oxidizer 120,000 100-300 OSB Formaldehyde & VOC Urania LA ND yes Barbara Wiliamson-Pacific (504) 765-0219
Louisiana Smith Regenerative oxidizer 80,000 100-300 OSB Formaldehyde & VOC Urania LA ND yes Barbara Wiliamson-Pacific (504) 765-0219
Valley QUAD Mist scrubber 75,000 Rendering Odor Baltimore MD yes Laramie Daniel fax:Protein, Inc. (410) 631-3202
Ford DURR Concentrator & oxidizer 400,000 75 Automobile Paint Wixom MI 97%(R) Tom Julian (517) 373-7023
Louisiana Smith Regenerative oxidizer 80,000 100-300 Waferboard VOC Mix Two HarborsMN ND Stuart Arkly-Pacific (612) 296-7331
3M Co. REECO Regenerative oxidizer 220,000 Tape coating Solvents St. Paul MN 95%(T) yes Stuart Arkly& laminating (612) 296-7331
Ford DURR Concentrator & oxidizer 600,000 100 Automobile Paint Minneapolis MN 97%(T) yes Stuart Arkly (612) 296-7331
? REECO Regenerative oxidizer 150,000 Printing & Solvents NC Laura Butlerpackaging (919) 733-3340
Ford DURR Concentrator & oxidizer 250,000 75-80 Automobile Paint Edison NJ 97%(R) Patrick Zidran (609) 292-6704
General Munters Concentrator 140,000 Automobile Paint Linden NJ 95%(R) Patrick ZidranMotors Zeol (609) 292-6704
Intel DURR Concentrator & oxidizer 135,000 90 Semi- Solvents Rio Rancho NM 90%+(P) yes Lawrence Alaresconductor (505) 827-2850
Inland QUAD Mist scrubber 70,000 Rendering Odor OH Sara GaryProducts (614) 644-2270
Glidden REECO Regenerative oxidizer 145,000 Paint mfg Paint OH Sara Gary (614) 644-2270
Ford DURR Concentrator & oxidizer 350,000 60 Automobile Paint Avon Lake OH 96%(R) Sara Gary (614) 644-2270
Toyota DURR Concentrator & oxidizer 280,000 100 Automobile Paint Georgetown OH 98%(R) Sara Gary (614) 644-2270
Letterkenny Munters Concentrator 135,000 Refinishing Paint/Solvents Chambersburg PA Rob FisherArmy Depot Zeol (717) 787-9256/ABB Paint
Saturn Calgon Activated carbon 320,000 100 Automobile Paint Spring Hill TN Lacy HardinCADRE (615) 532-6545
GM REECO Regenerative oxidizer 500,000 Automobile Paint Arlington TX 93%(P) Mike Coldiron (512) 239-1260
LTV Met-Pro Rotary adsorber 105,000 24 Aerospace Paint Ft. Worth? TX? 95%(R) Mike ColdironKPR (512) 239-1260
OSB = Oriented strand board ND = Not determined or not reportedP = Required by permit condition T = Documented in test results R = Reported by vendor