Embed Size (px)
Citation preview

Seediscussions,stats,andauthorprofilesforthispublicationat:https://www.researchgate.net/publication/303325433
ModulationinPersistentOrganicPollutantConcentrationandProfilebyPreyAvailabilityandReproductiveStatusin...
ArticleinEnvironmentalScienceandTechnology·May2016
DOI:10.1021/acs.est.6b00825
CITATIONS
0
READS
101
8authors,including:
Someoftheauthorsofthispublicationarealsoworkingontheserelatedprojects:
Originanalysesofivoryseizures;preparingforCITESViewproject
JessicaILundin
UniversityofWashingtonSeattle
29PUBLICATIONS384CITATIONS
SEEPROFILE
GinaMYlitalo
NationalOceanicandAtmosphericAdministr…
101PUBLICATIONS1,753CITATIONS
SEEPROFILE
K.M.Parsons
NationalOceanicandAtmosphericAdministr…
35PUBLICATIONS1,238CITATIONS
SEEPROFILE
SamuelKWasser
UniversityofWashingtonSeattle
163PUBLICATIONS5,656CITATIONS
SEEPROFILE
AllcontentfollowingthispagewasuploadedbySamuelKWasseron25June2016.
Theuserhasrequestedenhancementofthedownloadedfile.Allin-textreferencesunderlinedinblueareaddedtotheoriginaldocumentandarelinkedtopublicationsonResearchGate,lettingyouaccessandreadthemimmediately.
Modulation in Persistent Organic Pollutant Concentration and Profileby Prey Availability and Reproductive Status in Southern ResidentKiller Whale Scat SamplesJessica I. Lundin,*,† Gina M. Ylitalo,‡ Rebecca K. Booth,† Bernadita Anulacion,‡
Jennifer A. Hempelmann,‡ Kim M. Parsons,‡,§ Deborah A. Giles,∥ Elizabeth A. Seely,†
M. Bradley Hanson,‡ Candice K. Emmons,‡ and Samuel K. Wasser†
†Center for Conservation Biology, Department of Biology, University of Washington, Seattle, Washington 98195, United States‡Northwest Fisheries Science Center, National Marine Fisheries Service, National Oceanic and Atmospheric Administration, Seattle,Washington 98112, United States§Alaska Fisheries Science Center, National Marine Fisheries Service, National Oceanic and Atmospheric Administration, Seattle,Washington 98115, United States∥Center for Whale Research, Friday Harbor, Washington 98250, United States
*S Supporting Information
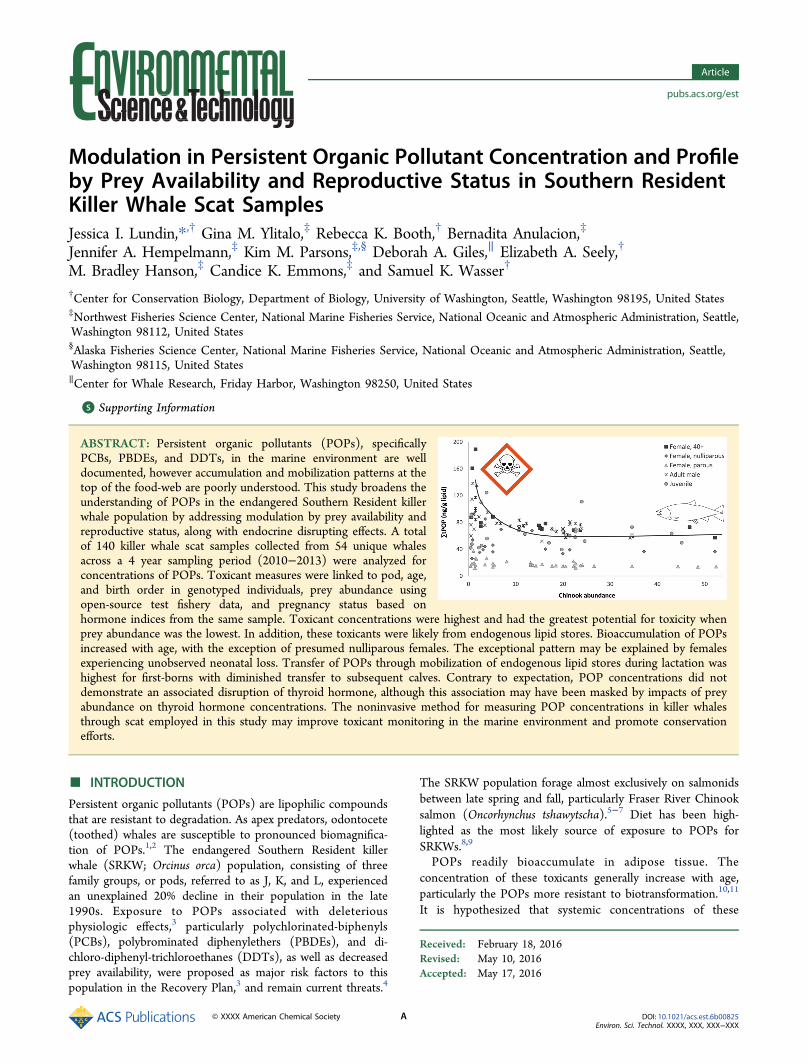
ABSTRACT: Persistent organic pollutants (POPs), specificallyPCBs, PBDEs, and DDTs, in the marine environment are welldocumented, however accumulation and mobilization patterns at thetop of the food-web are poorly understood. This study broadens theunderstanding of POPs in the endangered Southern Resident killerwhale population by addressing modulation by prey availability andreproductive status, along with endocrine disrupting effects. A totalof 140 killer whale scat samples collected from 54 unique whalesacross a 4 year sampling period (2010−2013) were analyzed forconcentrations of POPs. Toxicant measures were linked to pod, age,and birth order in genotyped individuals, prey abundance usingopen-source test fishery data, and pregnancy status based onhormone indices from the same sample. Toxicant concentrations were highest and had the greatest potential for toxicity whenprey abundance was the lowest. In addition, these toxicants were likely from endogenous lipid stores. Bioaccumulation of POPsincreased with age, with the exception of presumed nulliparous females. The exceptional pattern may be explained by femalesexperiencing unobserved neonatal loss. Transfer of POPs through mobilization of endogenous lipid stores during lactation washighest for first-borns with diminished transfer to subsequent calves. Contrary to expectation, POP concentrations did notdemonstrate an associated disruption of thyroid hormone, although this association may have been masked by impacts of preyabundance on thyroid hormone concentrations. The noninvasive method for measuring POP concentrations in killer whalesthrough scat employed in this study may improve toxicant monitoring in the marine environment and promote conservationefforts.
■ INTRODUCTION
Persistent organic pollutants (POPs) are lipophilic compoundsthat are resistant to degradation. As apex predators, odontocete(toothed) whales are susceptible to pronounced biomagnifica-tion of POPs.1,2 The endangered Southern Resident killerwhale (SRKW; Orcinus orca) population, consisting of threefamily groups, or pods, referred to as J, K, and L, experiencedan unexplained 20% decline in their population in the late1990s. Exposure to POPs associated with deleteriousphysiologic effects,3 particularly polychlorinated-biphenyls(PCBs), polybrominated diphenylethers (PBDEs), and di-chloro-diphenyl-trichloroethanes (DDTs), as well as decreasedprey availability, were proposed as major risk factors to thispopulation in the Recovery Plan,3 and remain current threats.4
The SRKW population forage almost exclusively on salmonidsbetween late spring and fall, particularly Fraser River Chinooksalmon (Oncorhynchus tshawytscha).5−7 Diet has been high-lighted as the most likely source of exposure to POPs forSRKWs.8,9
POPs readily bioaccumulate in adipose tissue. Theconcentration of these toxicants generally increase with age,particularly the POPs more resistant to biotransformation.10,11
It is hypothesized that systemic concentrations of these
Received: February 18, 2016Revised: May 10, 2016Accepted: May 17, 2016
Article
pubs.acs.org/est
© XXXX American Chemical Society A DOI: 10.1021/acs.est.6b00825Environ. Sci. Technol. XXXX, XXX, XXX−XXX
compounds, and associated bioavailability to target organs,increase when fat-metabolism occurs in response to decreasedprey availability.12 Lactating females also mobilize endogenousfree fatty acid and lipoprotein stores during milk production;2−4 kg of milk converts to 1 kg of calf mass gain,13
consequently transferring high-levels of toxicants to nursingyoung. Decreased POP loads have been reported in lactatingfemale killer whales,14 harp seals (Phoca groenlandica),15 grayseals (Halochoerus grypus),16−18 and polar bears (Ursusmaritimus).19
Blubber biopsy samples previously collected on the SRKWsindicate that PCB exposures in this population exceed a toxicitythreshold for marine mammals (17 000 ng/g lipid) extrapolatedfrom studies of immunologic and reproductive effects in seals,otters, and mink.14,20−22 POPs can disrupt endocrine systemsthrough interference with cellular messaging systems (i.e.,hormones) responsible for the regulation of developmentalprocesses, metabolism, immune function, and reproduction.23
Additionally, risk assessments of other cetacean populationssuggest that current levels of contamination may impairimmune24−28 and reproductive systems.29−34
The ability to test hypotheses relating to temporal trends inbioaccumulated toxins in this endangered SRKW populationhas been constrained by low sample acquisition of tissuebiopsies, or collections from necropsied animals. In this studywe capitalized on a novel sample collection approach tomonitor trends in toxicant concentrations across seasons andyears using killer whale fecal samples.35,36 Concentration andchemical profile of circulating toxicants were characterized byprey abundance, age-sex class, and reproductive class.Endocrine disruption from toxicant exposure was evaluatedusing hormone measures37,38 from the same scat samples.
■ MATERIALS AND METHODSSample Collection. A total of 263 SRKW scat samples
were collected May through October from 2010 to 2013.Samples were located by detection dogs trained to locateSRKW scat floating on the water’s surface.39−41 Samples werescooped off of the surface of the water, as previouslydescribed,35 and frozen at −20 °C until processed in the lab.Collections occurred from mid-May through mid-October,when the SRKWs appear with regularity in the areas around theSan Juan Islands and Puget Sound of Washington state,collectively referred to as the Salish Sea. The study periodaligned with peak run times for Fraser River Chinook salmon,the preferred seasonal prey of the SRKWs.7
Life History Data. Age, sex, family lineage, andreproductive status of whales genotyped in this study weredetermined using annual population census data collectedthrough photoidentification since 1976 by the Center forWhale Research.42 Age-sex class43−45 was defined as juveniles(either sex, < 10 years), adult males (≥10 years), reproductive-age females (≥10−<40 years),43,44 and postreproductivefemales (40+ years); age-sex class was also considered byparity (nulliparous and parous) in reproductive-age females.Reproductive status was defined in reproductive-age females asconfirmed pregnancy [“Preg (conf)”] (defined below), possiblepregnancy [“Preg (poss)”] (defined below), length of lactation(<1 and 1−2 years), and resting mature (neither pregnant norlactating). Length of lactation was defined as time followingestimated date of parturition.Laboratory Methods. Samples were thawed, homogen-
ized, and subsampled for both genotype analysis, to determine
individual identification,46 and toxicant analysis. Individualidentification was linked with the population census data todetermine age-sex class, family lineage, and reproductive status.
Hormone Measures. Samples were refrozen at −20 °C,freeze-dried, and 80 mg (dry fecal weight) was extracted in 15mL of 70% ethanol for hormone analyses using methodsdescribed previously.37,38,41 Fecal hormones measured include:glucocorticoid (GC), thyroid (total triiodothyronine, T3; andtotal thyroxine, T4), testosterone (T), progesterone (P4), andestrogen (E). Measures of GC, T3, and T4 concentrations inthe scat were used to evaluate nutritional stress.41 (SeeSupporting Information (SI) for details). Samples fromreproductive-age females with a P4 concentration above 2000ng/g dry fecal weight were considered to be from pregnantfemales.47 Pregnancies confirmed by subsequent observation ofa live birth [“Preg (conf)”] were distinguished from those thatfailed to produce a live calf [“Preg (poss)”] within the 18-month gestation period.43
Analysis of Persistent Organic Pollutants. Analyses ofPOPs in killer whale scat samples were performed using twodifferent protocols, one for high-mass36 and one for low-masssamples.35 (See SI for details.) All samples collected during afield season (39−80 samples per year) were processed as 80 mgpellets (dry fecal weight). Analysis of all samples for low-masstoxicant concentrations was cost prohibitive; as such, 126samples were selected based on a priori hypotheses to evaluateseasonal and annual changes in toxicant concentration, andvariation based on reproductive status. Sample extraction andpurification was performed using modified procedures fromEPA Methods 3630C and 1614.48−50 All sample extracts andstandards were analyzed using a gas chromatography coupledwith mass spectrometry (GC/MS) system operating in thenegative chemical ionization mode. Target analyte selection wasbased on pilot sample analyses performed on the high-masssamples (described below). Due to the small sample mass,fewer final target analytes were above the limit of detectioncompared to the high-mass samples. Final target analytesincluded 4 PCB congeners (PCBs 138, 153, 180, 187), 2 PBDEcongeners (PBDEs 47, 100), and p,p′-DDE (p,p′-dichloro-diphenyl-dichloroethylene; the predominant metabolite ofDDT).Fifty-six samples were large-enough to be subsampled and
processed as high-mass samples (2.0 g wet fecal weight). Theselarge samples were less common because much of the scatsample would sink prior to collection. These samples wereextracted, purified, and analyzed for POP concentrations usingprocedures modified from Sloan et al.36 Samples were analyzedusing a GC/MS system. Additional target analytes were abovethe limit of detection in the high-mass samples. In total, 40PCB congeners (PCBs 17, 18, 28, 31, 33, 44, 49, 52, 66, 70, 74,82, 87, 95, 99, 101, 105, 110, 118, 128, 138, 149, 151, 153, 156,158, 170, 171, 177, 180, 183, 187, 191, 194, 195, 199, 205, 206,208, and 209), 11 PBDE congeners (PBDEs 28, 47, 49, 66, 85,99, 100, 153, 154, 155, and 183), and six DDT compounds(o,p′-DDD, o,p′-DDE, o,p′-DDT, p,p′-DDD, p,p′-DDE, andp,p′-DDT) were analyzed. POP concentrations are reported aswet weight (ng/g), normalized by percent lipid (lipid adjusted,la). Linear associations of toxicant concentrations in the 39samples analyzed as both low-mass and high-mass samples weresignificant; the final analytic data set included toxicant measureson 157 samples. (See SI for details.)
Blubber Biopsy Samples. Blubber samples were collectedin the United States and Canada between May 2006 and
Environmental Science & Technology Article
DOI: 10.1021/acs.est.6b00825Environ. Sci. Technol. XXXX, XXX, XXX−XXX
B
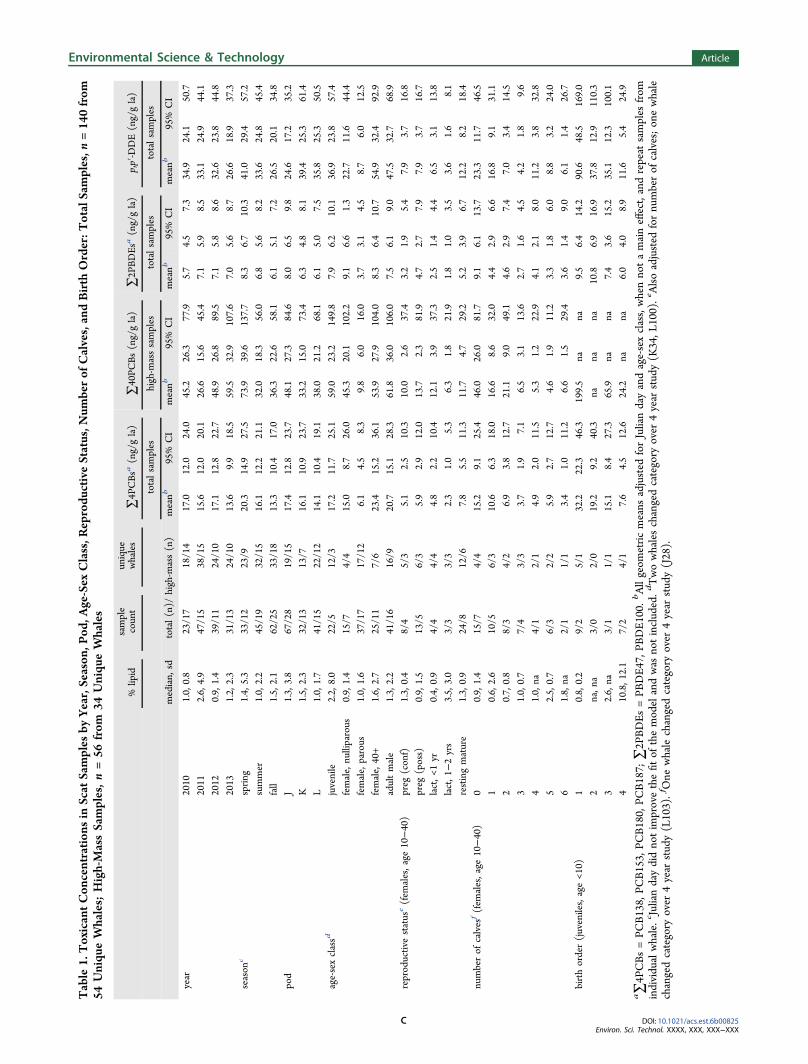
Table1.ToxicantCon
centration
sin
ScatSamples
byYear,Season
,Pod
,Age-Sex
Class,R
eprodu
ctiveStatus,N
umberof
Calves,andBirth
Order:T
otalSamples,n
=140from
54Uniqu
eWhales;High-MassSamples,n=56
from
34Uniqu
eWhales
%lipid
sample
count
unique
whales
∑4P
CBsa
(ng/gla)
∑40PC
Bs(ng/gla)
∑2P
BDEsa
(ng/gla)
p,p′-DDE(ng/gla)
totalsamples
high-m
asssamples
totalsamples
totalsamples
median,
sdtotal(n)/
high-m
ass(n)
meanb
95%
CI
meanb
95%
CI
meanb
95%
CI
meanb
95%
CI
year
2010
1.0,
0.8
23/17
18/14
17.0
12.0
24.0
45.2
26.3
77.9
5.7
4.5
7.3
34.9
24.1
50.7
2011
2.6,
4.9
47/15
38/15
15.6
12.0
20.1
26.6
15.6
45.4
7.1
5.9
8.5
33.1
24.9
44.1
2012
0.9,
1.4
39/11
24/10
17.1
12.8
22.7
48.9
26.8
89.5
7.1
5.8
8.6
32.6
23.8
44.8
2013
1.2,
2.3
31/13
24/10
13.6
9.9
18.5
59.5
32.9
107.6
7.0
5.6
8.7
26.6
18.9
37.3
seasonc
sprin
g1.4,
5.3
33/12
23/9
20.3
14.9
27.5
73.9
39.6
137.7
8.3
6.7
10.3
41.0
29.4
57.2
summer
1.0,
2.2
45/19
32/15
16.1
12.2
21.1
32.0
18.3
56.0
6.8
5.6
8.2
33.6
24.8
45.4
fall
1.5,
2.1
62/25
33/18
13.3
10.4
17.0
36.3
22.6
58.1
6.1
5.1
7.2
26.5
20.1
34.8
pod
J1.3,
3.8
67/28
19/15
17.4
12.8
23.7
48.1
27.3
84.6
8.0
6.5
9.8
24.6
17.2
35.2
K1.5,
2.3
32/13
13/7
16.1
10.9
23.7
33.2
15.0
73.4
6.3
4.8
8.1
39.4
25.3
61.4
L1.0,
1.7
41/15
22/12
14.1
10.4
19.1
38.0
21.2
68.1
6.1
5.0
7.5
35.8
25.3
50.5
age-sexclassd
juvenile
2.2,
8.0
22/5
12/3
17.2
11.7
25.1
59.0
23.2
149.8
7.9
6.2
10.1
36.9
23.8
57.4
female,nulliparous
0.9,
1.4
15/7
4/4
15.0
8.7
26.0
45.3
20.1
102.2
9.1
6.6
1.3
22.7
11.6
44.4
female,parous
1.0,
1.6
37/17
17/12
6.1
4.5
8.3
9.8
6.0
16.0
3.7
3.1
4.5
8.7
6.0
12.5
female,40+
1.6,
2.7
25/11
7/6
23.4
15.2
36.1
53.9
27.9
104.0
8.3
6.4
10.7
54.9
32.4
92.9
adultmale
1.3,
2.2
41/16
16/9
20.7
15.1
28.3
61.8
36.0
106.0
7.5
6.1
9.0
47.5
32.7
68.9
reproductivestatuse(fem
ales,age
10−40)
preg
(conf)
1.3,
0.4
8/4
5/3
5.1
2.5
10.3
10.0
2.6
37.4
3.2
1.9
5.4
7.9
3.7
16.8
preg
(poss)
0.9,
1.5
13/5
6/3
5.9
2.9
12.0
13.7
2.3
81.9
4.7
2.7
7.9
7.9
3.7
16.7
lact,<
1yr
0.4,
0.9
4/4
4/4
4.8
2.2
10.4
12.1
3.9
37.3
2.5
1.4
4.4
6.5
3.1
13.8
lact,1
−2yrs
3.5,
3.0
3/3
3/3
2.3
1.0
5.3
6.3
1.8
21.9
1.8
1.0
3.5
3.6
1.6
8.1
restingmature
1.3,
0.9
24/8
12/6
7.8
5.5
11.3
11.7
4.7
29.2
5.2
3.9
6.7
12.2
8.2
18.4
numberof
calvesf(fem
ales,age
10−40)
00.9,
1.4
15/7
4/4
15.2
9.1
25.4
46.0
26.0
81.7
9.1
6.1
13.7
23.3
11.7
46.5
10.6,
2.6
10/5
6/3
10.6
6.3
18.0
16.6
8.6
32.0
4.4
2.9
6.6
16.8
9.1
31.1
20.7,
0.8
8/3
4/2
6.9
3.8
12.7
21.1
9.0
49.1
4.6
2.9
7.4
7.0
3.4
14.5
31.0,
0.7
7/4
3/3
3.7
1.9
7.1
6.5
3.1
13.6
2.7
1.6
4.5
4.2
1.8
9.6
41.0,
na4/1
2/1
4.9
2.0
11.5
5.3
1.2
22.9
4.1
2.1
8.0
11.2
3.8
32.8
52.5,
0.7
6/3
2/2
5.9
2.7
12.7
4.6
1.9
11.2
3.3
1.8
6.0
8.8
3.2
24.0
61.8,
na2/1
1/1
3.4
1.0
11.2
6.6
1.5
29.4
3.6
1.4
9.0
6.1
1.4
26.7
birthorder(juveniles,age<1
0)1
0.8,
0.2
9/2
5/1
32.2
22.3
46.3
199.5
nana
9.5
6.4
14.2
90.6
48.5
169.0
2na,n
a3/0
2/0
19.2
9.2
40.3
nana
na10.8
6.9
16.9
37.8
12.9
110.3
32.6,
na3/1
1/1
15.1
8.4
27.3
65.9
nana
7.4
3.6
15.2
35.1
12.3
100.1
410.8,1
2.1
7/2
4/1
7.6
4.5
12.6
24.2
nana
6.0
4.0
8.9
11.6
5.4
24.9
a∑4P
CBs=PC
B138,PC
B153,PC
B180,PC
B187;
∑2P
BDEs
=PB
DE4
7,PB
DE1
00.bAllgeom
etric
means
adjusted
forJuliandayandage-sexclass,whennotamaineffect,andrepeat
samples
from
individualwhale.cJuliandaydidnotimprovethefitof
themodelandwas
notincluded.dTwowhaleschangedcategory
over
4year
study(K
34,L
100).eAlsoadjusted
fornumberof
calves;onewhale
changedcategory
over
4year
study(L103).fOne
whalechangedcategory
over
4year
study(J28).
Environmental Science & Technology Article
DOI: 10.1021/acs.est.6b00825Environ. Sci. Technol. XXXX, XXX, XXX−XXX
C
January 2013 using documented sampling techniques.51 Allsamples were analyzed for the same target analytes as the high-mass scat samples using similar techniques, described else-where.36 Blubber biopsy samples from SRKWs were matchedwith scat samples from the same individual, restricted to adultwhales that did not give birth between collection of blubber andfecal sample. The average period of time between blubber andscat sample collection was 3 years, 2 months (range: 1 monthto 7 years, 2 months).Statistical Analysis. Years of POP accumulation was
defined as age for juveniles, males, and nulliparous females.For parous females, POP accumulation was calculated as yearssince last calf minus 2 years for lactation. Toxicantconcentration was evaluated by number of calves inreproductive-age females. Analysis by birth order was restrictedto juvenile whales to ensure the measured concentrations weremore reflective of maternal burden offload than subsequentaccumulation through diet.31 Toxicant concentration andpotential endocrine disruption was evaluated using T3, T4,T3/T4, GC, P4, E, and T as the predictors. Models withreproductive hormones (P4, T, and E) were also stratified bysex. Toxicant measures from blubber and scat samples from thesame individual were compared by relative contribution ofindividual PCB and PBDE congeners.Albion test fishery data was used to estimate the number of
Chinook salmon returning to the Fraser River watershed(henceforth referred to as “FR Chinook”).52 The FR Chinooksalmon collectively consist of three runs: Spring run, before July15; Summer run, between July 15 and September 1; and Fallrun, after September 1.53 Catch data were smoothed using ageneral linear model to create a continuous predictor variableby year (SI Figure S1). The Albion test fishery is an estimated140 km from the west side of San Juan Island. To account forfish travel time between the whales’ primary feeding area, wherethe majority of our samples were collected, and the test fishery,fish run data were lagged by 12-days.41 (See SI for details.)The evaluation of toxicant concentration and prey abundance
was performed using FR Chinook as the main effects predictor.Toxicant measures were incorporated by class of compound,∑(cumulative)4PCBs, ∑40PCBs, ∑2PBDEs, and p,p′-DDE,and by total POPs (tPOPs; defined as the summation of theindividual classes). A subanalysis was conducted using PrincipalComponent Analysis (PCA) factors from congener- andmetabolite-specific data. Toxicant values were normalized as
percent per ∑40PCBs, ∑11PBDEs, or ∑6DDTs. All valueswere log-transformed to achieve normal distribution andentered into the PCA with varimax (orthogonal) rotation.Components needed to have an eigenvalue >1.0 to be retained.(See SI for details.) Covariates of interest included FRChinook, year of sample collection, season, pod, age-sex class,years of accumulation, birth order, fecal thyroid (T3, T4, andT3/T4 ratio) levels, and fecal GC levels. Four samples wereexcluded because they fell outside of the range of dates withassociated prey abundance data, after lagging. Three additionalsamples were excluded due to missing hormone (covariate)data. The final analytic data set contained 133 samples. Themain effects were tested for linearity, as well as interactions withthe retained covariates.All models used mixed effects multiple linear regression.
Whale identity was included as a random effect to account forrepeat sampling of individuals. Final model selections werebased on the smallest value of AICc (ΔAICc > 2). All statisticalanalyses were performed in SAS v9.3 (SAS Institute Inc., Cary,NC).
■ RESULTS∑4PCBs, ∑2PBDEs, and p,p′-DDE were measured in 157samples, with confirmed genetic identity on 140 samples from54 unique whales. Twenty-three of the samples used for thetoxicant analysis were collected in 2010, 47 in 2011, 39 in 2012,and 31 samples in 2013. Samples represented all three SRKWpods, with 35% of samples from unique members of J pod (19/54), 24% from K pod, and 40% from L pod (Table 1).Likewise, age-sex class was well represented with 22% ofsamples from unique juvenile whales (12/54), 39% fromreproductive-age females, 13% from postreproductive females,and 30% from adult males. There was no statistical difference in∑4PCBs, ∑40PCBs, ∑2PBDEs, or p,p′-DDE concentrationsbetween year or pod (Table 1). Samples were collected acrossseasons; season was not statistically different for any class oftoxicant compounds (Table 1). Lipid levels in scat increasedwith toxicant concentration (p < 0.05), indicating fat-solubletoxicants were excreted with the lipids. (See SI for details.)Eighteen individual whales had toxicant measures on both
high-mass scat samples and blubber biopsy samples. Previousanalyses demonstrated significant linear associations betweenmeasures of p,p′-DDE, ∑4PCBs, and ∑2PBDEs in blubberand scat samples matched by individual.35 In the present study,
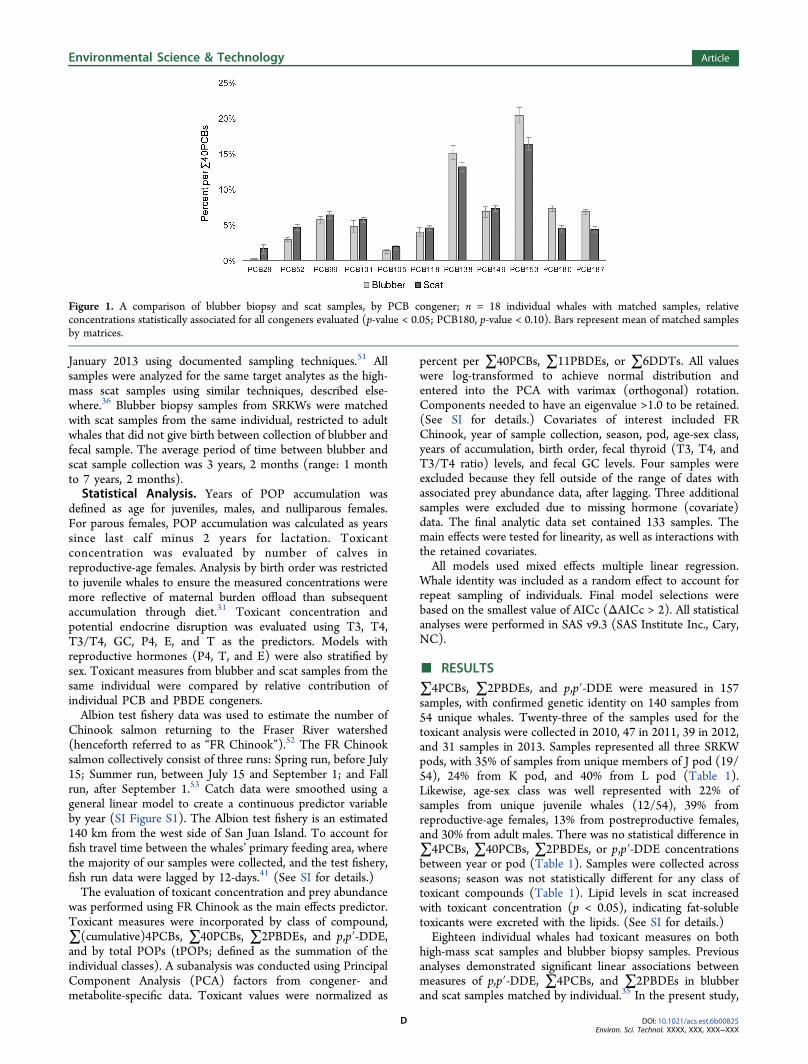
Figure 1. A comparison of blubber biopsy and scat samples, by PCB congener; n = 18 individual whales with matched samples, relativeconcentrations statistically associated for all congeners evaluated (p-value < 0.05; PCB180, p-value < 0.10). Bars represent mean of matched samplesby matrices.
Environmental Science & Technology Article
DOI: 10.1021/acs.est.6b00825Environ. Sci. Technol. XXXX, XXX, XXX−XXX
D
congener-specific analyses comparing relative concentrations inscat and blubber samples collected from the same whale
demonstrated significant linear associations (p-value < 0.05) forall PCBs evaluated, PCBs 28, 52, 99, 101, 105, 118, 138, 149,
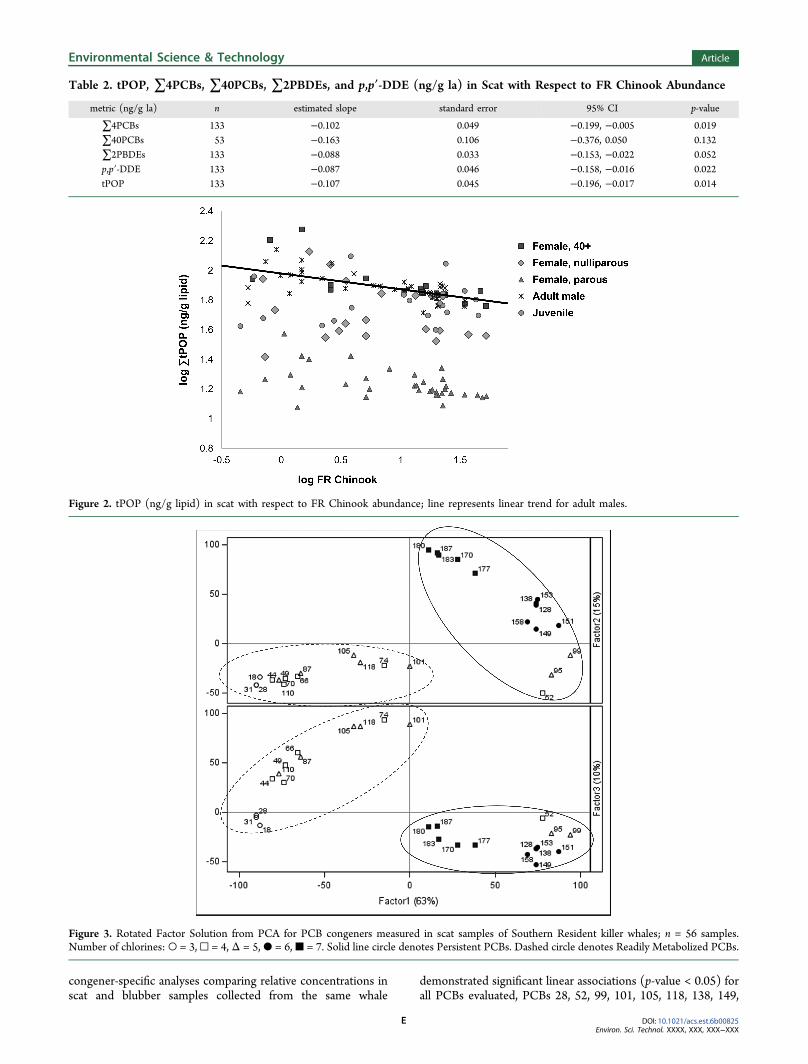
Table 2. tPOP, ∑4PCBs, ∑40PCBs, ∑2PBDEs, and p,p′-DDE (ng/g la) in Scat with Respect to FR Chinook Abundance
metric (ng/g la) n estimated slope standard error 95% CI p-value
∑4PCBs 133 −0.102 0.049 −0.199, −0.005 0.019∑40PCBs 53 −0.163 0.106 −0.376, 0.050 0.132∑2PBDEs 133 −0.088 0.033 −0.153, −0.022 0.052p,p′-DDE 133 −0.087 0.046 −0.158, −0.016 0.022tPOP 133 −0.107 0.045 −0.196, −0.017 0.014
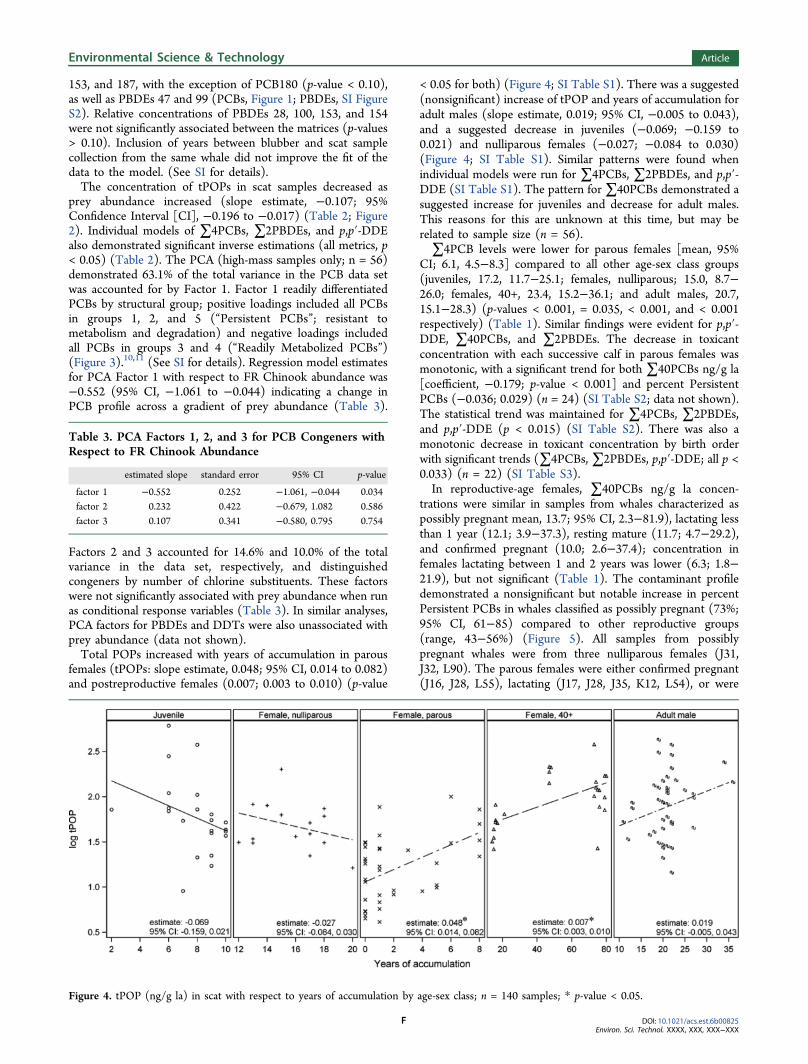
Figure 2. tPOP (ng/g lipid) in scat with respect to FR Chinook abundance; line represents linear trend for adult males.
Figure 3. Rotated Factor Solution from PCA for PCB congeners measured in scat samples of Southern Resident killer whales; n = 56 samples.Number of chlorines: ○ = 3, □ = 4, Δ = 5, ● = 6, ■ = 7. Solid line circle denotes Persistent PCBs. Dashed circle denotes Readily Metabolized PCBs.
Environmental Science & Technology Article
DOI: 10.1021/acs.est.6b00825Environ. Sci. Technol. XXXX, XXX, XXX−XXX
E
153, and 187, with the exception of PCB180 (p-value < 0.10),as well as PBDEs 47 and 99 (PCBs, Figure 1; PBDEs, SI FigureS2). Relative concentrations of PBDEs 28, 100, 153, and 154were not significantly associated between the matrices (p-values> 0.10). Inclusion of years between blubber and scat samplecollection from the same whale did not improve the fit of thedata to the model. (See SI for details).The concentration of tPOPs in scat samples decreased as
prey abundance increased (slope estimate, −0.107; 95%Confidence Interval [CI], −0.196 to −0.017) (Table 2; Figure2). Individual models of ∑4PCBs, ∑2PBDEs, and p,p′-DDEalso demonstrated significant inverse estimations (all metrics, p< 0.05) (Table 2). The PCA (high-mass samples only; n = 56)demonstrated 63.1% of the total variance in the PCB data setwas accounted for by Factor 1. Factor 1 readily differentiatedPCBs by structural group; positive loadings included all PCBsin groups 1, 2, and 5 (“Persistent PCBs”; resistant tometabolism and degradation) and negative loadings includedall PCBs in groups 3 and 4 (“Readily Metabolized PCBs”)(Figure 3).10,11 (See SI for details). Regression model estimatesfor PCA Factor 1 with respect to FR Chinook abundance was−0.552 (95% CI, −1.061 to −0.044) indicating a change inPCB profile across a gradient of prey abundance (Table 3).
Factors 2 and 3 accounted for 14.6% and 10.0% of the totalvariance in the data set, respectively, and distinguishedcongeners by number of chlorine substituents. These factorswere not significantly associated with prey abundance when runas conditional response variables (Table 3). In similar analyses,PCA factors for PBDEs and DDTs were also unassociated withprey abundance (data not shown).Total POPs increased with years of accumulation in parous
females (tPOPs: slope estimate, 0.048; 95% CI, 0.014 to 0.082)and postreproductive females (0.007; 0.003 to 0.010) (p-value
< 0.05 for both) (Figure 4; SI Table S1). There was a suggested(nonsignificant) increase of tPOP and years of accumulation foradult males (slope estimate, 0.019; 95% CI, −0.005 to 0.043),and a suggested decrease in juveniles (−0.069; −0.159 to0.021) and nulliparous females (−0.027; −0.084 to 0.030)(Figure 4; SI Table S1). Similar patterns were found whenindividual models were run for ∑4PCBs, ∑2PBDEs, and p,p′-DDE (SI Table S1). The pattern for∑40PCBs demonstrated asuggested increase for juveniles and decrease for adult males.This reasons for this are unknown at this time, but may berelated to sample size (n = 56).∑4PCB levels were lower for parous females [mean, 95%
CI; 6.1, 4.5−8.3] compared to all other age-sex class groups(juveniles, 17.2, 11.7−25.1; females, nulliparous; 15.0, 8.7−26.0; females, 40+, 23.4, 15.2−36.1; and adult males, 20.7,15.1−28.3) (p-values < 0.001, = 0.035, < 0.001, and < 0.001respectively) (Table 1). Similar findings were evident for p,p′-DDE, ∑40PCBs, and ∑2PBDEs. The decrease in toxicantconcentration with each successive calf in parous females wasmonotonic, with a significant trend for both ∑40PCBs ng/g la[coefficient, −0.179; p-value < 0.001] and percent PersistentPCBs (−0.036; 0.029) (n = 24) (SI Table S2; data not shown).The statistical trend was maintained for ∑4PCBs, ∑2PBDEs,and p,p′-DDE (p < 0.015) (SI Table S2). There was also amonotonic decrease in toxicant concentration by birth orderwith significant trends (∑4PCBs, ∑2PBDEs, p,p′-DDE; all p <0.033) (n = 22) (SI Table S3).In reproductive-age females, ∑40PCBs ng/g la concen-
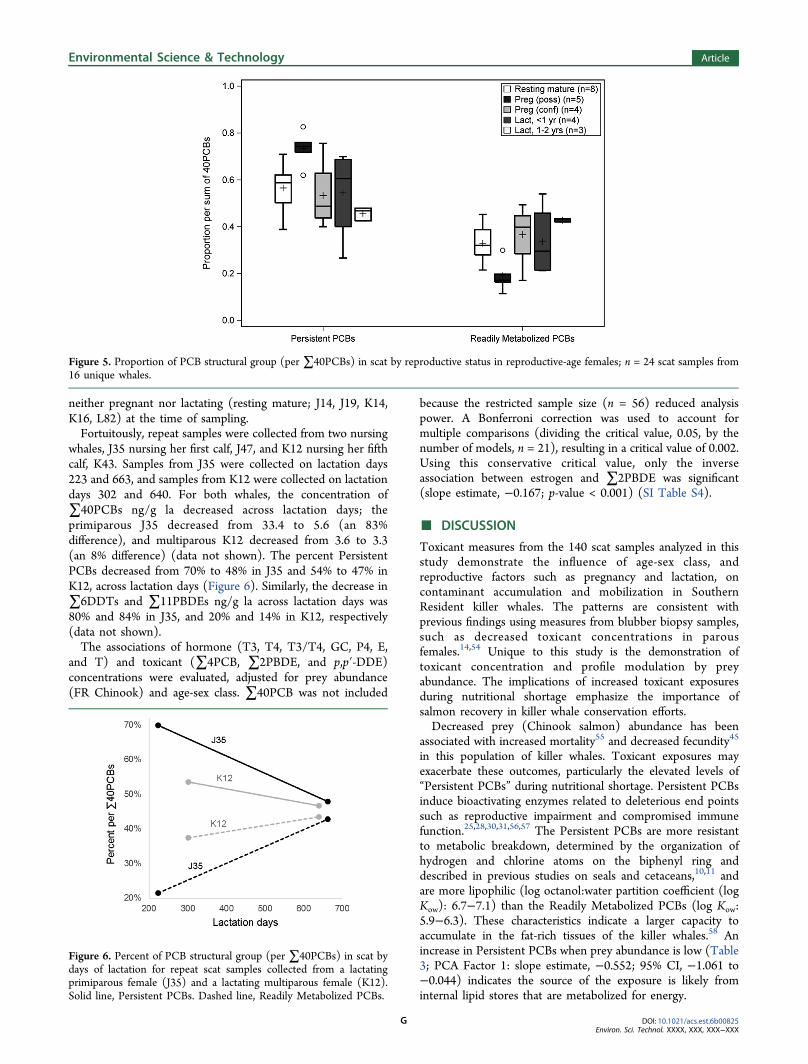
trations were similar in samples from whales characterized aspossibly pregnant mean, 13.7; 95% CI, 2.3−81.9), lactating lessthan 1 year (12.1; 3.9−37.3), resting mature (11.7; 4.7−29.2),and confirmed pregnant (10.0; 2.6−37.4); concentration infemales lactating between 1 and 2 years was lower (6.3; 1.8−21.9), but not significant (Table 1). The contaminant profiledemonstrated a nonsignificant but notable increase in percentPersistent PCBs in whales classified as possibly pregnant (73%;95% CI, 61−85) compared to other reproductive groups(range, 43−56%) (Figure 5). All samples from possiblypregnant whales were from three nulliparous females (J31,J32, L90). The parous females were either confirmed pregnant(J16, J28, L55), lactating (J17, J28, J35, K12, L54), or were
Table 3. PCA Factors 1, 2, and 3 for PCB Congeners withRespect to FR Chinook Abundance
estimated slope standard error 95% CI p-value
factor 1 −0.552 0.252 −1.061, −0.044 0.034factor 2 0.232 0.422 −0.679, 1.082 0.586factor 3 0.107 0.341 −0.580, 0.795 0.754
Figure 4. tPOP (ng/g la) in scat with respect to years of accumulation by age-sex class; n = 140 samples; * p-value < 0.05.
Environmental Science & Technology Article
DOI: 10.1021/acs.est.6b00825Environ. Sci. Technol. XXXX, XXX, XXX−XXX
F
neither pregnant nor lactating (resting mature; J14, J19, K14,K16, L82) at the time of sampling.Fortuitously, repeat samples were collected from two nursing
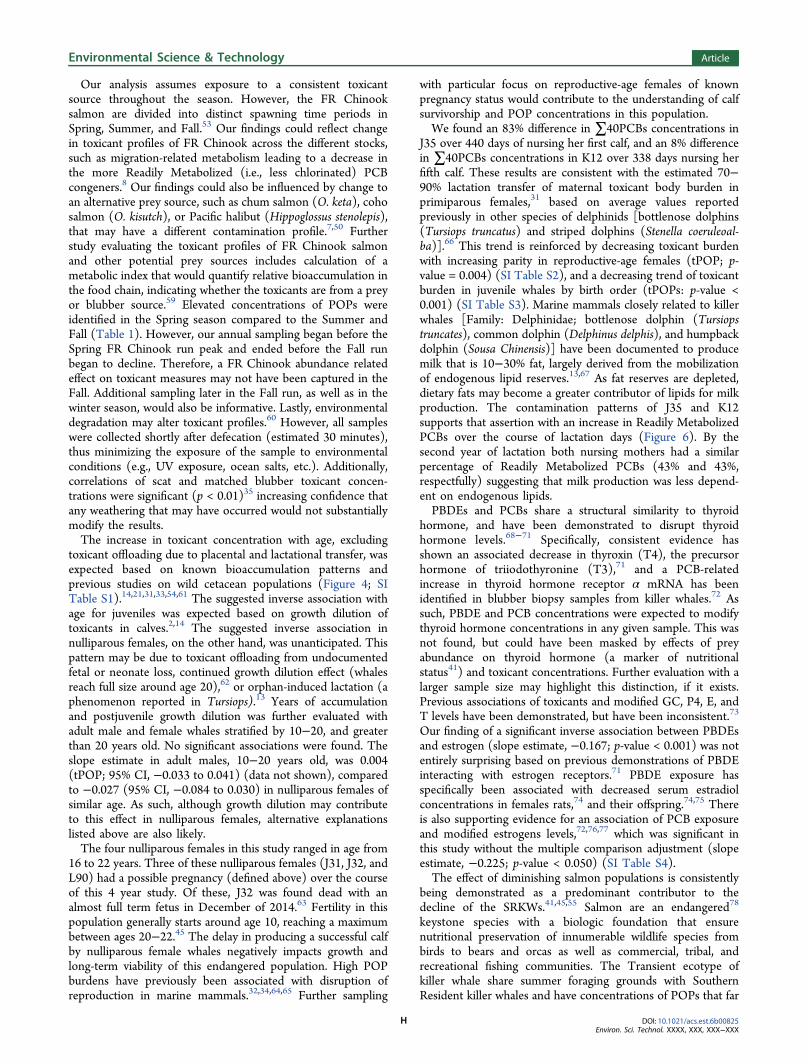
whales, J35 nursing her first calf, J47, and K12 nursing her fifthcalf, K43. Samples from J35 were collected on lactation days223 and 663, and samples from K12 were collected on lactationdays 302 and 640. For both whales, the concentration of∑40PCBs ng/g la decreased across lactation days; theprimiparous J35 decreased from 33.4 to 5.6 (an 83%difference), and multiparous K12 decreased from 3.6 to 3.3(an 8% difference) (data not shown). The percent PersistentPCBs decreased from 70% to 48% in J35 and 54% to 47% inK12, across lactation days (Figure 6). Similarly, the decrease in∑6DDTs and ∑11PBDEs ng/g la across lactation days was80% and 84% in J35, and 20% and 14% in K12, respectively(data not shown).The associations of hormone (T3, T4, T3/T4, GC, P4, E,
and T) and toxicant (∑4PCB, ∑2PBDE, and p,p′-DDE)concentrations were evaluated, adjusted for prey abundance(FR Chinook) and age-sex class. ∑40PCB was not included
because the restricted sample size (n = 56) reduced analysispower. A Bonferroni correction was used to account formultiple comparisons (dividing the critical value, 0.05, by thenumber of models, n = 21), resulting in a critical value of 0.002.Using this conservative critical value, only the inverseassociation between estrogen and ∑2PBDE was significant(slope estimate, −0.167; p-value < 0.001) (SI Table S4).
■ DISCUSSION
Toxicant measures from the 140 scat samples analyzed in thisstudy demonstrate the influence of age-sex class, andreproductive factors such as pregnancy and lactation, oncontaminant accumulation and mobilization in SouthernResident killer whales. The patterns are consistent withprevious findings using measures from blubber biopsy samples,such as decreased toxicant concentrations in parousfemales.14,54 Unique to this study is the demonstration oftoxicant concentration and profile modulation by preyabundance. The implications of increased toxicant exposuresduring nutritional shortage emphasize the importance ofsalmon recovery in killer whale conservation efforts.Decreased prey (Chinook salmon) abundance has been
associated with increased mortality55 and decreased fecundity45
in this population of killer whales. Toxicant exposures mayexacerbate these outcomes, particularly the elevated levels of“Persistent PCBs” during nutritional shortage. Persistent PCBsinduce bioactivating enzymes related to deleterious end pointssuch as reproductive impairment and compromised immunefunction.25,28,30,31,56,57 The Persistent PCBs are more resistantto metabolic breakdown, determined by the organization ofhydrogen and chlorine atoms on the biphenyl ring anddescribed in previous studies on seals and cetaceans,10,11 andare more lipophilic (log octanol:water partition coefficient (logKow): 6.7−7.1) than the Readily Metabolized PCBs (log Kow:5.9−6.3). These characteristics indicate a larger capacity toaccumulate in the fat-rich tissues of the killer whales.58 Anincrease in Persistent PCBs when prey abundance is low (Table3; PCA Factor 1: slope estimate, −0.552; 95% CI, −1.061 to−0.044) indicates the source of the exposure is likely frominternal lipid stores that are metabolized for energy.
Figure 5. Proportion of PCB structural group (per ∑40PCBs) in scat by reproductive status in reproductive-age females; n = 24 scat samples from16 unique whales.
Figure 6. Percent of PCB structural group (per ∑40PCBs) in scat bydays of lactation for repeat scat samples collected from a lactatingprimiparous female (J35) and a lactating multiparous female (K12).Solid line, Persistent PCBs. Dashed line, Readily Metabolized PCBs.
Environmental Science & Technology Article
DOI: 10.1021/acs.est.6b00825Environ. Sci. Technol. XXXX, XXX, XXX−XXX
G
Our analysis assumes exposure to a consistent toxicantsource throughout the season. However, the FR Chinooksalmon are divided into distinct spawning time periods inSpring, Summer, and Fall.53 Our findings could reflect changein toxicant profiles of FR Chinook across the different stocks,such as migration-related metabolism leading to a decrease inthe more Readily Metabolized (i.e., less chlorinated) PCBcongeners.8 Our findings could also be influenced by change toan alternative prey source, such as chum salmon (O. keta), cohosalmon (O. kisutch), or Pacific halibut (Hippoglossus stenolepis),that may have a different contamination profile.7,50 Furtherstudy evaluating the toxicant profiles of FR Chinook salmonand other potential prey sources includes calculation of ametabolic index that would quantify relative bioaccumulation inthe food chain, indicating whether the toxicants are from a preyor blubber source.59 Elevated concentrations of POPs wereidentified in the Spring season compared to the Summer andFall (Table 1). However, our annual sampling began before theSpring FR Chinook run peak and ended before the Fall runbegan to decline. Therefore, a FR Chinook abundance relatedeffect on toxicant measures may not have been captured in theFall. Additional sampling later in the Fall run, as well as in thewinter season, would also be informative. Lastly, environmentaldegradation may alter toxicant profiles.60 However, all sampleswere collected shortly after defecation (estimated 30 minutes),thus minimizing the exposure of the sample to environmentalconditions (e.g., UV exposure, ocean salts, etc.). Additionally,correlations of scat and matched blubber toxicant concen-trations were significant (p < 0.01)35 increasing confidence thatany weathering that may have occurred would not substantiallymodify the results.The increase in toxicant concentration with age, excluding
toxicant offloading due to placental and lactational transfer, wasexpected based on known bioaccumulation patterns andprevious studies on wild cetacean populations (Figure 4; SITable S1).14,21,31,33,54,61 The suggested inverse association withage for juveniles was expected based on growth dilution oftoxicants in calves.2,14 The suggested inverse association innulliparous females, on the other hand, was unanticipated. Thispattern may be due to toxicant offloading from undocumentedfetal or neonate loss, continued growth dilution effect (whalesreach full size around age 20),62 or orphan-induced lactation (aphenomenon reported in Tursiops).13 Years of accumulationand postjuvenile growth dilution was further evaluated withadult male and female whales stratified by 10−20, and greaterthan 20 years old. No significant associations were found. Theslope estimate in adult males, 10−20 years old, was 0.004(tPOP; 95% CI, −0.033 to 0.041) (data not shown), comparedto −0.027 (95% CI, −0.084 to 0.030) in nulliparous females ofsimilar age. As such, although growth dilution may contributeto this effect in nulliparous females, alternative explanationslisted above are also likely.The four nulliparous females in this study ranged in age from
16 to 22 years. Three of these nulliparous females (J31, J32, andL90) had a possible pregnancy (defined above) over the courseof this 4 year study. Of these, J32 was found dead with analmost full term fetus in December of 2014.63 Fertility in thispopulation generally starts around age 10, reaching a maximumbetween ages 20−22.45 The delay in producing a successful calfby nulliparous female whales negatively impacts growth andlong-term viability of this endangered population. High POPburdens have previously been associated with disruption ofreproduction in marine mammals.32,34,64,65 Further sampling
with particular focus on reproductive-age females of knownpregnancy status would contribute to the understanding of calfsurvivorship and POP concentrations in this population.We found an 83% difference in ∑40PCBs concentrations in
J35 over 440 days of nursing her first calf, and an 8% differencein ∑40PCBs concentrations in K12 over 338 days nursing herfifth calf. These results are consistent with the estimated 70−90% lactation transfer of maternal toxicant body burden inprimiparous females,31 based on average values reportedpreviously in other species of delphinids [bottlenose dolphins(Tursiops truncatus) and striped dolphins (Stenella coeruleoal-ba)].66 This trend is reinforced by decreasing toxicant burdenwith increasing parity in reproductive-age females (tPOP; p-value = 0.004) (SI Table S2), and a decreasing trend of toxicantburden in juvenile whales by birth order (tPOPs: p-value <0.001) (SI Table S3). Marine mammals closely related to killerwhales [Family: Delphinidae; bottlenose dolphin (Tursiopstruncates), common dolphin (Delphinus delphis), and humpbackdolphin (Sousa Chinensis)] have been documented to producemilk that is 10−30% fat, largely derived from the mobilizationof endogenous lipid reserves.13,67 As fat reserves are depleted,dietary fats may become a greater contributor of lipids for milkproduction. The contamination patterns of J35 and K12supports that assertion with an increase in Readily MetabolizedPCBs over the course of lactation days (Figure 6). By thesecond year of lactation both nursing mothers had a similarpercentage of Readily Metabolized PCBs (43% and 43%,respectfully) suggesting that milk production was less depend-ent on endogenous lipids.PBDEs and PCBs share a structural similarity to thyroid
hormone, and have been demonstrated to disrupt thyroidhormone levels.68−71 Specifically, consistent evidence hasshown an associated decrease in thyroxin (T4), the precursorhormone of triiodothyronine (T3),71 and a PCB-relatedincrease in thyroid hormone receptor α mRNA has beenidentified in blubber biopsy samples from killer whales.72 Assuch, PBDE and PCB concentrations were expected to modifythyroid hormone concentrations in any given sample. This wasnot found, but could have been masked by effects of preyabundance on thyroid hormone (a marker of nutritionalstatus41) and toxicant concentrations. Further evaluation with alarger sample size may highlight this distinction, if it exists.Previous associations of toxicants and modified GC, P4, E, andT levels have been demonstrated, but have been inconsistent.73
Our finding of a significant inverse association between PBDEsand estrogen (slope estimate, −0.167; p-value < 0.001) was notentirely surprising based on previous demonstrations of PBDEinteracting with estrogen receptors.71 PBDE exposure hasspecifically been associated with decreased serum estradiolconcentrations in females rats,74 and their offspring.74,75 Thereis also supporting evidence for an association of PCB exposureand modified estrogens levels,72,76,77 which was significant inthis study without the multiple comparison adjustment (slopeestimate, −0.225; p-value < 0.050) (SI Table S4).The effect of diminishing salmon populations is consistently
being demonstrated as a predominant contributor to thedecline of the SRKWs.41,45,55 Salmon are an endangered78
keystone species with a biologic foundation that ensurenutritional preservation of innumerable wildlife species frombirds to bears and orcas as well as commercial, tribal, andrecreational fishing communities. The Transient ecotype ofkiller whale share summer foraging grounds with SouthernResident killer whales and have concentrations of POPs that far
Environmental Science & Technology Article
DOI: 10.1021/acs.est.6b00825Environ. Sci. Technol. XXXX, XXX, XXX−XXX
H
exceed the concentrations of the SRKWs,21 yet their populationhas been steadily growing for at least four decades.79 Theconsistent prey base of pinnipeds, cetaceans, and seabirds6 haskept Transient killer whales from experiencing the physiologicconsequence of nutritional shortage. Further study comparingthese two populations may help elucidate how the interactionbetween prey shortage and exposure to lipophilic POPs impactsSRKW population recovery and survival.
■ ASSOCIATED CONTENT*S Supporting InformationThe Supporting Information is available free of charge on theACS Publications website at DOI: 10.1021/acs.est.6b00825.
Text includes additional details of fecal hormonemeasures, PCB structural groups, statistical comparisonof toxicant measures in scat and blubber biopsy samples,statistical analysis of lipid excretion, laboratory analysis oftoxicant concentration in scat, and data management.Figures include a comparison of scat and blubbertoxicant concentrations by PBDE congeners, andsmoothed FR Chinook data. Tables include years oftoxicant accumulation by age-sex class, toxicant concen-tration by number of calves (parous females), toxicantconcentration by birth order (juvenile whales), andtoxicant concentration evaluations with hormone indices(PDF)
■ AUTHOR INFORMATIONCorresponding Author*E-mail: [email protected] authors declare no competing financial interest.
■ ACKNOWLEDGMENTSResearch funding was provided by the Washington Sea Grant[pursuant to National Oceanic and Atmospheric Adminis-tration (NOAA), award no. NA10OAR417005], NOAA’sNorthwest Fisheries Science Center (NWFSC), CanadianConsulate General, Center for Conservation Biology, andNorthwest Science Association. This publication was developedunder STAR Fellowship Assistance Agreement no. 91735201awarded by the U.S. Environmental Protection Agency (EPA).It has not been formally reviewed by the EPA. The viewsexpressed in this publication are solely those of the authors, andthe EPA does not endorse any products or commercial servicesmentioned in this publication. Fecal and blubber biopsysamples from Southern Resident killer whales were collectedin United States waters under National Marine FisheriesService permits 10045 and 16163, respectively. Fecal sampleswere collected in Canadian waters under Marine MammalLicense numbers 2010-09 and 2012-08, as well as Species atRisk Act permits numbered 109 and 155. The use of selectinternal standards was provided by the University ofWashington Center for Ecogenetics and Environmental Health(P30ES007033). Special thanks to Conservation Canines, andto Kari Koski, Doug McCutchen, and Jim Rappold for drivingthe research vessel and contributing knowledge of the whalesfor successful sampling days. Thanks to Tara Wilson for helpingprocess samples and run hormone assays. Thank you to EricWard and Daniel Schindler for support in developing the FraserRiver Chinook metric for prey abundance. Thank you to RusselDills and Jacqui Ahmad for their support and expertise in trace
analytic methods, and to Dawn Noren for valuable feedback onwhale physiology. Much gratitude to field and lab assistants andvolunteers, and the killer whale community for continuedsupport helping to make our project a success.
■ REFERENCES(1) USEPA, United States Environmental Protection Agency. TheFoundation for Global Action on Persistent Organic Pollutants: A UnitedStates Perspective, 2002.(2) Hickie, B. E.; Ross, P. S.; Macdonald, R. W.; Ford, J. K. Killerwhales (Orcinus orca) face protracted health risks associated withlifetime exposure to PCBs. Environ. Sci. Technol. 2007, 41 (18), 6613−9.(3) National Marine Fisheries Service. Recovery Plan for SouthernResident Killer Whales (Orcinus orca); National Marine FisheriesService: Northwest Region, Seattle, WA. 2008.(4) NOAA Fisheries Killer Whale (Orcinus Orca). http://www.nmfs.noaa.gov/pr/species/mammals/whales/killer-whale.html (accessedFebruary 25, 2015).(5) Ford, J. K. B.; Ellis, G. M. Selective foraging by fish-eating killerwhales Orcinus orca in British Columbia. Mar. Ecol.: Prog. Ser. 2006,316, 185−199.(6) Ford, J. K. B.; Ellis, G. M.; Barrett-Lennard, L. G.; Morton, A. B.;Palm, R. S.; Balcomb, K. C., III Dietary specialization in two sympatricpopulations of killer whales (Orcinus orca) in coastal British Columbiaand adjacent waters. Can. J. Zool. 1998, 76 (8), 1456−1471.(7) Hanson, M. B.; Baird, R. W.; Ford, J. K. B.; Hempelmann, J. A.;Van Doornik, D. M.; Candy, J. R.; Emmons, C. K.; Schorr, G. S.;Gisborne, B.; Ayres, K. L.; Wasser, S. K.; Balcomb, K. C.; Balcomb-Bartok, K.; Sneva, J. G.; Ford, M. J. Species and stock identification ofprey consumed by endangered southern resident killer whales in theirsummer range. Endangered Species Research 2010, 11, 69−82.(8) Cullon, D. L.; Yunker, M. B.; Alleyne, C.; Dangerfield, N. J.;O’Neill, S.; Whiticar, M. J.; Ross, P. S. Persistent organic pollutants inchinook salmon (Oncorhynchus tshawytscha): implications forresident killer whales of British Columbia and adjacent waters.Environ. Toxicol. Chem. 2009, 28 (1), 148−61.(9) Alava, J. J.; Ross, P. S.; Lachmuth, C.; Ford, J. K.; Hickie, B. E.;Gobas, F. A. Habitat-based PCB environmental quality criteria for theprotection of endangered killer whales (Orcinus orca). Environ. Sci.Technol. 2012, 46 (22), 12655−63.(10) Boon, J. P.; Oostingh, I.; van der Meer, J.; Hillebrand, M. T. Amodel for the bioaccumulation of chlorobiphenyl congeners in marinemammals. Eur. J. Pharmacol., Environ. Toxicol. Pharmacol. Sect. 1994,270 (2−3), 237−51.(11) Wolkers, H.; Corkeron, P. J.; Van Parijs, S. M.; Simila, T.; VanBavel, B. Accumulation and transfer of contaminants in killer whales(Orcinus orca) from Norway: indications for contaminant metabolism.Environ. Toxicol. Chem. 2007, 26 (8), 1582−90.(12) Aguilar, A.; Borrell, A.; Pastor, T. Biological factors affectingvariability of persistent pollutant levels in cetaceans. J. Cetacean Res.Manage. 1999 (Special Issue 1), 83−116.(13) Oftedal, O. T. Lactation in whales and dolphins: evidence ofdivergence between baleen- and toothed-species. Journal of mammarygland biology and neoplasia 1997, 2 (3), 205−30.(14) Krahn, M. M.; Hanson, M. B.; Schorr, G. S.; Emmons, C. K.;Burrows, D. G.; Bolton, J. L.; Baird, R. W.; Ylitalo, G. M. Effects of age,sex and reproductive status on persistent organic pollutantconcentrations in ″Southern Resident″ killer whales. Mar. Pollut.Bull. 2009, 58 (10), 1522−9.(15) Wolkers, H.; Burkow, I. C.; Hammill, M. O.; Lydersen, C.;Witkamp, R. F. Transfer of polychlorinated biphenyls and chlorinatedpesticides from mother to pup in relation to cytochrome P450 enzymeactivities in harp seals (Phoca groenlandica) from the gulf of St.Lawrence, Canada. Environ. Toxicol. Chem. 2002, 21 (1), 94−101.(16) Addison, R. F.; Brodie, P. F. Transfer of organochlorine residuesfrom blubber through the circulatory system to milk in the lactating
Environmental Science & Technology Article
DOI: 10.1021/acs.est.6b00825Environ. Sci. Technol. XXXX, XXX, XXX−XXX
I
gray seal (Halichoerus grypus). Can. J. Fish. Aquat. Sci. 1987, 44, 782−786.(17) Debier, C.; Pomeroy, P. P.; Dupont, C.; Joiris, C.; Comblin, V.;Le Boulenge, E.; Larondelle, Y.; Thome, J. P. Quantitative dynamics ofPCB transfer from mother to pup during lactation in UK grey sealsHalichoerus grypus. Mar. Ecol.: Prog. Ser. 2003, 247, 237−248.(18) Pomeroy, P. P.; Green, N.; Hall, A. J.; Walton, M.; Jones, K. C.;Harwood, J. Congener-specific exposure of grey seal (Halichoerusgrypus) pups to chlorinated biphenyls during lactation. Can. J. Fish.Aquat. Sci. 1996, 53, 1526−1534.(19) Knott, K. K.; Boyd, D.; Ylitalo, G. M.; O’Hara, T. M. Lactationaltransfer of mercury and polychlorinated biphenyls in polar bears.Chemosphere 2012, 88 (4), 395−402.(20) Kannan, K.; Blankenship, A. L.; Jones, P. D.; Giesy, J. P. Toxicityreference values for the toxic effects of polychlorinated biphenyls toaquatic mammals. Hum. Ecol. Risk Assess. 2000, 6, 181−201.(21) Ross, P. S.; Ellis, G. M.; Ikonomou, M. G.; Barrett-Lennard, L.G.; Addison, R. F. High PCB concentrations in free-ranging pacifickiller whales, Orcinus orca: effects of age, sex and dietary preference.Mar. Pollut. Bull. 2000, 40 (6), 504−515.(22) Krahn, M. M.; Hanson, M. B.; Baird, R. W.; Boyer, R. H.;Burrows, D. G.; Emmons, C. K.; Ford, J. K. B.; Jones, L. L.; Noren, D.P.; Ross, P. S.; Schorr, G. S.; Collier, T. K. Persistent organic pollutantsand stable isotopes in biopsy samples (2004/2006) from southernresident killer whales. Mar. Pollut. Bull. 2007, 54 (12), 1903−11.(23) Kavlock, R. J.; Daston, G. P.; DeRosa, C.; Fenner-Crisp, P.;Gray, L. E.; Kaattari, S.; Lucier, G.; Luster, M.; Mac, M. J.; Maczka, C.Research needs for the risk assessment of health and environmentaleffects of endocrine disruptors: a report of the US EPA-sponsoredworkshop. Environ. Health Perspect. 1996, 104 (Suppl 4), 715.10.1289/ehp.96104s4715(24) de Swart, R. L.; Ross, P. S.; Vos, J. G.; Osterhaus, A. D. Impairedimmunity in harbour seals (Phoca vitulina) exposed to bioaccumulatedenvironmental contaminants: review of a long-term feeding study.Environ. Health Perspect 1996, 104 (Suppl 4), 823−8.(25) Jepson, P. D.; Bennett, P. M.; Deaville, R.; Allchin, C. R.; Baker,J. R.; Law, R. J. Relationships between polychlorinated biphenyls andhealth status in harbor porpoises (Phocoena phocoena) stranded inthe United Kingdom. Environ. Toxicol. Chem. 2005, 24 (1), 238−48.(26) Beland, P.; DeGuise, S. Toxic compounds and healthreproductive effects in St. Lawrence beluga whales. J. Great LakesRes. 1993, 19, 766−775.(27) Hall, A. J.; Hugunin, K.; Deaville, R.; Law, R. J.; Allchin, C. R.;Jepson, P. D. The risk of infection from polychlorinated biphenylexposure in the harbor porpoise (Phocoena phocoena): a case-controlapproach. Environ. Health Perspect. 2006, 114 (5), 704−711.(28) Lahvis, G. P.; Wells, R. S.; Kuehl, D. W.; Stewart, J. L.;Rhinehart, H. L.; Via, C. S. Decreased lymphocyte responses in free-ranging bottlenose dolphins (Tursiops truncatus) are associated withincreased concentrations of PCBs and DDT in peripheral blood.Environ. Health Perspect 1995, 103 (Suppl 4), 67−72.(29) Reijnders, P. J. Reproductive failure in common seals feeding onfish from polluted coastal waters. Nature 1986, 324 (6096), 456−457.(30) Pierce, G. J.; Santos, M. B.; Murphy, S.; Learmonth, J. A.; Zuur,A. F.; Rogan, E.; Bustamante, P.; Caurant, F.; Lahaye, V.; Ridoux, V.;Zegers, B. N.; Mets, A.; Addink, M.; Smeenk, C.; Jauniaux, T.; Law, R.J.; Dabin, W.; Lopez, A.; Alonso Farre, J. M.; Gonzalez, A. F.; Guerra,A.; García-Hartmann, M.; Reid, R. J.; Moffat, C. F.; Lockyer, C.; Boon,J. P. Bioaccumulation of persistent organic pollutants in femalecommon dolphins (Delphinus delphis) and harbour porpoises(Phocoena phocoena) from western European seas: geographicaltrends, causal factors and effects on reproduction and mortality.Environ. Pollut. 2008, 153 (2), 401−415.(31) Wells, R. S.; Tornero, V.; Borrell, A.; Aguilar, A.; Rowles, T. K.;Rhinehart, H. L.; Hofmann, S.; Jarman, W. M.; Hohn, A. A.; Sweeney,J. C. Integrating life-history and reproductive success data to examinepotential relationships with organochlorine compounds for bottlenosedolphins (Tursiops truncatus) in Sarasota Bay, Florida. Sci. TotalEnviron. 2005, 349 (1−3), 106−19.
(32) Schwacke, L. H.; Voit, E. O.; Hansen, L. J.; Wells, R. S.;Mitchum, G. B.; Hohn, A. A.; Fair, P. A. Probabilistic risk assessmentof reproductive effects of polychlorinated biphenyls on bottlenosedolphins (Tursiops truncatus) from the southeast United States coast.Environ. Toxicol. Chem. 2002, 21 (12), 2752−2764.(33) Hall, A. J.; McConnell, B. J.; Rowles, T. K.; Aguilar, A.; Borrell,A.; Schwacke, L.; Reijnders, P. J.; Wells, R. S. Individual-based modelframework to assess population consequences of polychlorinatedbiphenyl exposure in bottlenose dolphins. Environ. Health Perspect2006, 114 (Suppl 1), 60−4.(34) Murphy, S.; Barber, J. L.; Learmonth, J. A.; Read, F. L.; Deaville,R.; Perkins, M. W.; Brownlow, A.; Davison, N.; Penrose, R.; Pierce, G.J.; Law, R. J.; Jepson, P. D. Reproductive Failure in UK HarbourPorpoises Phocoena phocoena: Legacy of Pollutant Exposure? PLoSOne 2015, 10 (7), e0131085.(35) Lundin, J. I.; Dills, R.; Ylitalo, G. M.; Ahmad, J.; Hempelmann, J.A.; Parsons, K. M.; Wasser, S. K. Persistent organic pollutantdetermination in killer whale scat samples: optimization andvalidiation of the method, and application to real samples. Arch.Environ. Contam. Toxicol. 2016, 70 (1), 9−19.(36) Sloan, C. A.; Anulacion, B. F.; Baugh, K. A.; Bolton, J. L.; Boyd,D.; Boyer, R. H.; Burrows, D. G.; Herman, D. P.; Pearce, R. W.;Ylitalo, G. M. Northwest Fisheries Science Center’s Analyses of Tissue,Sediment, And Water Samples for Organic Contaminants by GasChromatography/ Mass Spectrometry and Analyses of Tissue for LipidClasses by Thin Layer Chromatography/Flame Ionization Detection. InU.S. Department of Commerce, 2014.(37) Wasser, S. K.; Azkarate, J. C.; Booth, R. K.; Hayward, L.; Hunt,K.; Ayres, K.; Vynne, C.; Gobush, K.; Canales-Espinosa, D.;Rodriguez-Luna, E. Non-invasive measurement of thyroid hormonein feces of a diverse array of avian and mammalian species. Gen. Comp.Endocrinol. 2010, 168 (1), 1−7.(38) Wasser, S. K.; Hunt, K. E.; Brown, J. L.; Cooper, K.; Crockett,C. M.; Bechert, U.; Millspaugh, J. J.; Larson, S.; Monfort, S. L. Ageneralized fecal glucocorticoid assay for use in a diverse array ofnondomestic mammalian and avian species. Gen. Comp. Endocrinol.2000, 120 (3), 260−75.(39) Wasser, S. K.; Davenport, B.; Ramage, E. R.; Hunt, K. E.; Parker,M.; Clarke, C.; Stenhouse, G. Scat detection dogs in wildlife researchand management: Applications to grizzly and black bears in theYellowhead Ecosystem, Alberta, Canada. Can. J. Zool. 2004, 82, 475−492.(40) Rolland, R. M.; Hamilton, P. K.; Kraus, S. D.; Davenport, B.;Gillett, R. M.; Wasser, S. K. Faecal sampling using detection dogs tostudy reproduction and health in north Atlantic right whales(Eubalaena glacialis). J. Cetacean Res. Manage. 2006, 8 (2), 121−125.(41) Ayres, K. L.; Booth, R. K.; Hempelmann, J. A.; Koski, K. L.;Emmons, C. K.; Baird, R. W.; Balcomb-Bartok, K.; Hanson, M. B.;Ford, M. J.; Wasser, S. K. Distinguishing the impacts of inadequateprey and vessel traffic on an endangered killer whale (Orcinus orca)population. PLoS One 2012, 7 (6), e36842.(42) Center for Whale Research. Official Orca Survey. Naturalist’sFamily Tree Guide to Orca Whales of the Southern ResidentCommunity. 2013 Fall Edition. http://www.whaleresearch.com/orca_ID_pods.html (accessed December 8, 2015).(43) Robeck, T. R.; Steinman, K. J.; Gearhart, S.; Reidarson, T. R.;McBain, J. F.; Monfort, S. L. Reproductive physiology and develop-ment of artificial insemination technology in killer whales (Orcinusorca). Biol. Reprod. 2004, 71 (2), 650−60.(44) Center for Whale Research. About killer whales, http://www.whaleresearch.com/#!about-orcas/c1qa8.(45) Ward, E. J.; Holmes, E. E.; Balcomb, K. C. Quantifying theeffects of prey abundance on killer whale reproduction. J. Appl. Ecol.2009, 46, 632−640.(46) Ford, M. J.; Hanson, M. B.; Hempelmann, J. A.; Ayres, K. L.;Emmons, C. K.; Schorr, G. S.; Baird, R. W.; Balcomb, K. C.; Wasser, S.K.; Parsons, K. M.; Balcomb-Bartok, K. Inferred Paternity and MaleReproductive Success in a Killer Whale (Orcinus orca) Population. J.Hered. 2011, 102 (5), 537−53.
Environmental Science & Technology Article
DOI: 10.1021/acs.est.6b00825Environ. Sci. Technol. XXXX, XXX, XXX−XXX
J
(47) Wasser, S. K.; Lundin, J. I.; Ayres, K. A.; Seely, E.; Giles, D.;Hempelmann, J.; Parsons, K. M.; Booth, R. K. Population growth islimited by nutritional impacts on pregnancy success in endangeredSouthern Resident Killer Whales (Orcinus orca). General andComparative Endocrinology in review.(48) Environmental Protection Agency. Method 1614. BrominatedDiphenyl Ethers in Water Soil, Sediment and Tissue by HRGC/HRMS,EPA-821-R-07-005. 2007.(49) Environmental Protection Agency. Method 3630C. Silica GelCleanup, 1996.(50) Ford, M. J.; Hempelmann, J.; Hanson, M. B.; Ayres, K. L.; Baird,R. W.; Emmons, C. K.; Lundin, J. I.; Schorr, G. S.; Wasser, S. K.; Park,L. K. Estimation of a Killer Whale (Orcinus orca) Population’s DietUsing Sequencing Analysis of DNA from Feces. PLoS One 2016, 11(1), e0144956.(51) Barrett-Lennard, L. G. Population Structure and Mating Patternsof Killer Whales as Revealed by DNA Analysis, Ph.D. Thesis, Universityof British Columbia: Vancouver, BC, 2000.(52) Government of Canada, Fisheries and Oceans Canada, AlbionChinook Daily Catch Per Unit Effort, Fraser River at Albion, BC,2014. http://www.pac.dfo-mpo.gc.ca/fm-gp/fraser/docs/commercial/albionchinook-quinnat-eng.html.(53) DFO, Fraser River Chinook Salmon. Department of Fisheriesand Oceans (DFO): Canada, Stock Status Report D6-11. 1999.(54) Ylitalo, G. M.; Matkin, C. O.; Buzitis, J.; Krahn, M. M.; Jones, L.L.; Rowles, T.; Stein, J. E. Influence of life-history parameters onorganochlorine concentrations in free-ranging killer whales (Orcinusorca) from Prince William Sound, AK. Sci. Total Environ. 2001, 281(1−3), 183−203.(55) Ford, J. K.; Ellis, G. M.; Olesiuk, P. F.; Balcomb, K. C. Linkingkiller whale survival and prey abundance: food limitation in the oceans’apex predator? Biol. Lett. 2010, 6 (1), 139−142.(56) McFarland, V. A.; Clarke, J. U. Environmental occurrence,abundance, and potential toxicity of polychlorinated biphenylcongeners: considerations for a congener-specific analysis. Environ.Health Perspect 1989, 81, 225−39.(57) Kannan, K.; Tanabe, S.; Borrell, A.; Aguilar, A.; Focardi, S.;Tatsukawa, R. Isomer-specific analysis and toxic evaluation ofpolychlorinated biphenyls in striped dolphins affected by an epizooticin the western Mediterranean sea. Arch. Environ. Contam. Toxicol.1993, 25 (2), 227−33.(58) Erickson, M. D. Analytical Chemistry of PCBs, 2nd ed.; LewisPublishers: Boca Raton, FL, 1997.(59) Wolkers, H.; van Bavel, B.; Derocher, A. E.; Wiig, O.; Kovacs, K.M.; Lydersen, C.; Lindstrom, G. Congener-specific accumulation andfood chain transfer of polybrominated diphenyl ethers in two arcticfood chains. Environ. Sci. Technol. 2004, 38 (6), 1667−74.(60) Urbaniak, M. Polychlorinated biphenyls: sources, distributionand transformation in the environment-a literature review. Acta Toxicol2007, 15 (2), 83−93.(61) Yordy, J. E.; Wells, R. S.; Balmer, B. C.; Schwacke, L. H.;Rowles, T. K.; Kucklick, J. R. Life history as a source of variation forpersistent organic pollutant (POP) patterns in a community ofcommon bottlenose dolphins (Tursiops truncatus) resident toSarasota Bay, FL. Sci. Total Environ. 2010, 408 (9), 2163−72.(62) Fearnbach, H.; Durban, J. W.; Ellifrit, D. K.; Balcomb, K. C., IIISize and long-term growth trends of endangered fish-eating killerwhales. Endangered Species Research 2011, 13, 173−180.(63) DFO Fisheries and Oceans Canada, Necropsy Results: SouthernResident Killer Whale J32. http://www.pac.dfo-mpo.gc.ca/fm-gp/species-especes/mammals-mammiferes/srkw-eprs-j32-eng.html.(64) Reddy, M. L.; Reif, J. S.; Bachand, A.; Ridgway, S. H.Opportunities for using Navy marine mammals to explore associationsbetween organochlorine contaminants and unfavorable effects onreproduction. Sci. Total Environ. 2001, 274 (1−3), 171−82.(65) Murphy, S.; Gonzalez, A. F.; Guerra, A. Assessing the effect ofpersistent organic pollutants on reproductive activity in commondolphins and harbour porpoises. Journal of the Northwest AtlanticFisheries Organization 2010, 42, 153−173.
(66) Mongillo, T. M.; Holmes, E. E.; Noren, D. P.; VanBlaricom, G.R.; Punt, A. E.; O’Neill, S. M.; Ylitalo, G. M.; Hanson, M. B.; Ross, P.S. Predicted polybrominated diphenyl ether (PBDE) and polychlori-nated biphenyl (PCB) accumulation in southern resident killer whales.Mar. Ecol.: Prog. Ser. 2012, 453, 263−277.(67) West, K. L.; Oftedal, O. T.; Carpenter, J. R.; Krames, B. J.;Campbell, M.; Sweeney, J. C. Effect of lactation stage and concurrentpregnancy on milk composition in the bottlenose dolphin. J. Zool.2007, 273 (2), 148−160.(68) Hallgren, S.; Sinjari, T.; Hakansson, H.; Darnerud, P. O. Effectsof polybrominated diphenyl ethers (PBDEs) and polychlorinatedbiphenyls (PCBs) on thyroid hormone and vitamin A levels in rats andmice. Arch. Toxicol. 2001, 75 (4), 200−8.(69) Hallgren, S.; Darnerud, P. O. Polybrominated diphenyl ethers(PBDEs), polychlorinated biphenyls (PCBs) and chlorinated paraffins(CPs) in rats-testing interactions and mechanisms for thyroidhormone effects. Toxicology 2002, 177 (2−3), 227−43.(70) Brouwer, A.; Morse, D. C.; Lans, M. C.; Schuur, A. G.; Murk, A.J.; Klasson-Wehler, E.; Bergman, A.; Visser, T. J. Interactions ofpersistent environmental organohalogens with the thyroid hormonesystem: mechanisms and possible consequences for animal and humanhealth. Toxicol. Ind. Health 1998, 14 (1−2), 59−84.(71) Costa, L. G.; Giordano, G.; Tagliaferri, S.; Caglieri, A.; Mutti, A.Polybrominated diphenyl ether (PBDE) flame retardants: environ-mental contamination, human body burden and potential adversehealth effects. Acta Biomed 2008, 79 (3), 172−83.(72) Buckman, A. H.; Veldhoen, N.; Ellis, G.; Ford, J. K.; Helbing, C.C.; Ross, P. S. PCB-associated changes in mRNA expression in killerwhales (Orcinus orca) from the NE Pacific Ocean. Environ. Sci.Technol. 2011, 45 (23), 10194−202.(73) Tyler, C. R.; Jobling, S.; Sumpter, J. P. Endocrine disruption inwildlife: a critical review of the evidence. Crit. Rev. Toxicol. 1998, 28(4), 319−61.(74) Lilienthal, H.; Hack, A.; Roth-Harer, A.; Grande, S. W.;Talsness, C. E. Effects of developmental exposure to 2,2, 4,4, 5-pentabromodiphenyl ether (PBDE-99) on sex steroids, sexualdevelopment, and sexually dimorphic behavior in rats. Environ. HealthPerspect 2006, 114 (2), 194−201.(75) Talsness, C. E.; Kuriyama, S. N.; Sterner-Kock, A.; Schnitker, P.;Grande, S. W.; Shakibaei, M.; Andrade, A.; Grote, K.; Chahoud, I. Inutero and lactational exposures to low doses of polybrominateddiphenyl ether-47 alter the reproductive system and thyroid gland offemale rat offspring. Environ. Health Perspect 2008, 116 (3), 308−14.(76) Kraugerud, M.; Zimmer, K. E.; Dahl, E.; Berg, V.; Olsaker, I.;Farstad, W.; Ropstad, E.; Verhaegen, S. Three structurally differentpolychlorinated biphenyl congeners (Pcb 118, 153, and 126) affecthormone production and gene expression in the human H295R invitro model. J. Toxicol. Environ. Health, Part A 2010, 73 (16), 1122−32.(77) Haave, M.; Ropstad, E.; Derocher, A. E.; Lie, E.; Dahl, E.; Wiig,O.; Skaare, J. U.; Jenssen, B. M. Polychlorinated biphenyls andreproductive hormones in female polar bears at Svalbard. Environ.Health Perspect 2002, 111 (4), 431−6.(78) National Marine Fisheries Service, Endangered and ThreatenedMarine Species under NMFS’ Jurisdiction, 2015 http://www.nmfs.noaa.gov/pr/species/esa/listed.htm#fish.(79) Allen, B. M.; Angliss, R. P., Alaska Marine Mammal StockAssessments. Killer Whale (Orcinus orca): West Coast TransientStock. NOAA-TM-AFSC-277. 2013.
Environmental Science & Technology Article
DOI: 10.1021/acs.est.6b00825Environ. Sci. Technol. XXXX, XXX, XXX−XXX
K
View publication statsView publication stats