Embed Size (px)
Citation preview

Running head: Surprise in Decision Making
SURPRISE IN DECISION MAKING UNDER UNCERTAINTY
Eduard Brandstätter
University of Linz, Austria
Anton Kühberger
University of Salzburg, Austria
Friedrich Schneider
University of Linz, Austria

8. Jänner 1999; D:\surprise.doc2
Surprise in Decision Making Under Uncertainty
Eduard Brandstätter*
University of Linz, Austria
Anton Kühberger**
University of Salzburg, Austria
Friedrich Schneider***
University of Linz, Austria
Abstract
In four experiments we investigate over- and underweighting of probabilities in decisions under
risk. To account for this phenomenon we propose a view of the probability weighting function
as a composite of cognitive and emotional processes and suggest that there is no single
weighting function but two separate weighting functions for each process. Data obtained from
a rating as well as three choice experiments, using both between and within subjects designs,
generally support the proposed view. Given this broader perspective, cognitive "biases" or
"errors" may turn out as highly intelligent solutions to maximize utility.
* Dr. Eduard Brandstätter, Dept. of Social and Economic Psychology, University of Linz, A-4040 Linz,
Austria. Phone: 0043-732-2468-578, Fax: 0043-732-2468-9315. E-mail: [email protected]
** Dr.Anton Kühberger, Dept. of Psychology, University of Salzburg, A-5020 Salzburg, Austria. Phone:0043-662-8044-5112, Fax: 0043-662-8044-5126. E-mail: [email protected]
*** Professor of Economics, Dr. Friedrich Schneider, Dept. of Economics, University of Linz, A-4040Linz, Austria. Phone: 0043-732-2468-210, Fax: 0043-732-2468-209.E-mail: [email protected]
8. Jänner 1999; D:\surprise.doc3
Contents
SURPRISE IN DECISION MAKING UNDER UNCERTAINTY 4
Emotions in Decision Making 5
Insuff iciency of the Standard Interpretation of the Probability Weighting Function 6
An Additional Source of Utility: Surprise 7
Two Sources of Utility: Cognitive and Emotional Utility 8
The Interaction of the Cognitive and Emotional Utility 9
Relations to Other Models 11
Overview over our Experiments 11
EXPERIMENT 1 12
Method 12
Results and Discussion 12
EXPERIMENTS 2-4 13
Method 13
Results and Discussion 14
GENERAL DISCUSSION 20
Are violations of subjective expected utility theory irrational? 21
REFERENCES 23

8. Jänner 1999; D:\surprise.doc4
Surprise in Decision Making under Uncertainty
People quite often make decisions without knowing exactly the outcomes of their
choices. Whether a person plans to begin college or whether a firm decides to introduce new
products, the final outcomes of these choices are barely known in advance. Such decision
situations are typically evaluated by two basic features of the possible outcomes: the
attractiveness of the outcomes (i. e. expected profit or gain) and their likelihood of occurrence.
As a formal approach expected utility (EU) theory emerged as a guiding framework of
how to make rational decisions. According to EU-theory, a rational decision maker will
maximize his or her utility by choosing the option with the highest overall utility, which is
calculated by U = p * u (x) + (1 – p) * u (0) for a prospect to win $x with probability p and
nothing otherwise. That is, the utility of each outcome x is weighted by its probability of
occurrence.
Despite its astonishing simplicity and elegance further research has established systematic
deviations from EU-theory (e.g. Kahneman & Tversky, 1979; Kahneman, Slovic, & Tversky
1982). One of these deviations is that people do not weight probabilities linearly but tend to
overweight small and underweight large probabilities. This leads to an inverse S-shaped
probability weighting function that is first concave and then convex.
Formally, such deviations are best captured by prospect theory (Kahneman & Tversky,
1979; Pommerehne, Schneider, & Zweifel, 1982; Tversky & Kahneman, 1992), which replaces
the objective probabilities p by decision weights W (p) such that U = W (p) * v (x) for a
prospect to win $x with probability p and nothing otherwise.
For probability there are two natural reference points–certainty and impossibility–that
correspond to the endpoints of the scale. The overweighting of small and underweighting of
large probabilities thus implies diminishing sensitivity; i.e., increasing the probability of winning
a prize by a probability of .1 has more impact when it changes the probability of winning from
.9 to 1.0, or from 0 to .1, than when it changes the probability from, say, .3 to .4 or from .6 to
.7. This gives rise to a weighting function that is concave near impossibility and convex near
certainty. Such a function overweights small probabilities and underweights moderate and high
probabilities (Tversky & Fox, 1995, p. 270; see also Allais, 1953; Camerer & Ho, 1994;
Hogarth & Einhorn, 1990; Wu & Gonzalez, 1996).
Thus, based on a large amount of empirical data, the form of the probability weighting
function is widely agreed upon and this weighting of probabilities serves as a well established
model for decisions under risk. However, the psychological causes for over- and
8. Jänner 1999; D:\surprise.doc5
underweighting have only barely been addressed so far. The present article is an attempt to fill
this gap by suggesting a view of the probability weighting function as a compromise between
cognitive and emotional processes.
Emotions in Decision Making
Most theories of decision making focus on cognitive processes and are silent about the
role of emotions. Savage (1954) proposed anticipated regret as a determinant to influence
decisions, and later Bell (1982) and Loomes and Sudgen (1982) systematically incorporated
emotions into a theory of choice. Disappointment theory (Bell, 1985) incorporates anticipated
elation and disappointment to an uncertain outcome, depending on whether an uncertain
outcome has turned out positive or negative (see also Loomes & Sudgen, 1982; Mellers et al.,
1997; van Dijk & van der Pligt, 1997). Regret theory assumes comparisons between choices
and captures anticipated regret and rejoicing when one learns that a different choice would
have produced a better or worse outcome, respectively. Importantly, however, both
disappointment and regret theory state that decision makers unscrupulously anticipate all
possible outcomes of the decision task and therefore have to face a high cognitive work load;
accordingly, decision makers are supposed to anticipate all possible gains, non-gains, losses,
and non-losses.
However, there are important reasons that limit the generality of the view of decision
makers as extensive problem solvers who anticipate all possible decision outcomes. Firstly,
Simon's (1955) satisficing principle asserts that people only have limited problem solving
capacities and often do not have the time, motivation, or ability to imagine all possible decision
outcomes in advance. More specifically, decision makers generally are not looking for the best
or optimal, but for a satisfying solution of a decision task. If so, decision makers may try to
simplify a complex decision task by anticipating only a small part of all possible outcomes.
Additionally, the social psychology literature strongly emphasizes the view of persons as
"cognitive misers" (see Fiske & Taylor, 1991), thereby suggesting that people try to minimize
cognitive effort whenever possible. Secondly, and in line with this reasoning, prospect theory
(Kahneman & Tversky, 1979)–which is based on adaptation level theory (Helson, 1964)–
asserts that people are especially sensitive to environmental changes. That is, persons adapt to
the status quo which serves as a neutral reference point and then evaluate changes from this
neutral reference point. If so, decision makers may more easily anticipate gains and losses than

8. Jänner 1999; D:\surprise.doc6
non-gains and non-losses, because the latter do not constitute changes from their neutral
reference point. Taken together, the view of people as "cognitive misers" together with their
more pronounced sensitivity to changes than to non-changes offers the intriguing hypothesis
that decision makers would be able to simplify the decision task by just anticipating gains or
losses but neglecting non-gains or non-losses. The outline of this paper rests on this
assumption.
In the following sections we investigate the psychological causes for over- and
underweighting by assuming limited problem solving capacities. Specifically, we investigate
typical gain non-gain gambles, where people can win for instance $160 with probability p = .3
and nothing otherwise. Importantly, because of limited problem solving capacities and a more
pronounced sensitivity to changes (gains) than to non-changes (non-gains) we assume just
anticipated surprise for possible gains–but not anticipated disappointment for possible non-
gains–as a cause for the shape of the probability weighting function. That is, in contrast to
disappointment theory we hypothesize that decision makers just anticipate possible gains but
do not anticipate non-gains. Therefore, we propose anticipated surprise (elation) alone,
without anticipated disappointment as a cause for the curvature of the probability weighting
function. Previous research (e.g. Josephs, Larrick, Steele, & Nisbett, 1997; Larrick & Boles,
1995; Ritov, 1996; Zeelenberg & Beattie, 1996; Zeelenberg & Beattie, 1997) has found that
decision makers only anticipate regret when they know in advance that they will get to hear the
outcome of the non-chosen alternative. Because this is not the case in our experiments below,
the proposed theory herein stands closer to disappointment than to regret theory. We start our
analyses by pointing to the insufficiency of the standard interpretation of the probability
weighting function.
Insufficiency of the Standard Interpretation of the Probability
Weighting Function
As stated above, the standard interpretation of the probability weighting function states
that changes near the endpoints of the probability scale have stronger impacts than changes
spaced away from these endpoints. Findings that are explained by such differential weighting
are usually referred to as impossibility- and certainty effect (Allais, 1953; Allais & Hagen,
1979; Kahneman & Tversky, 1979). However, the certainty and impossibility effect per se are
not enough to explain over- and underweighting, because constant under- or constant
8. Jänner 1999; D:\surprise.doc7
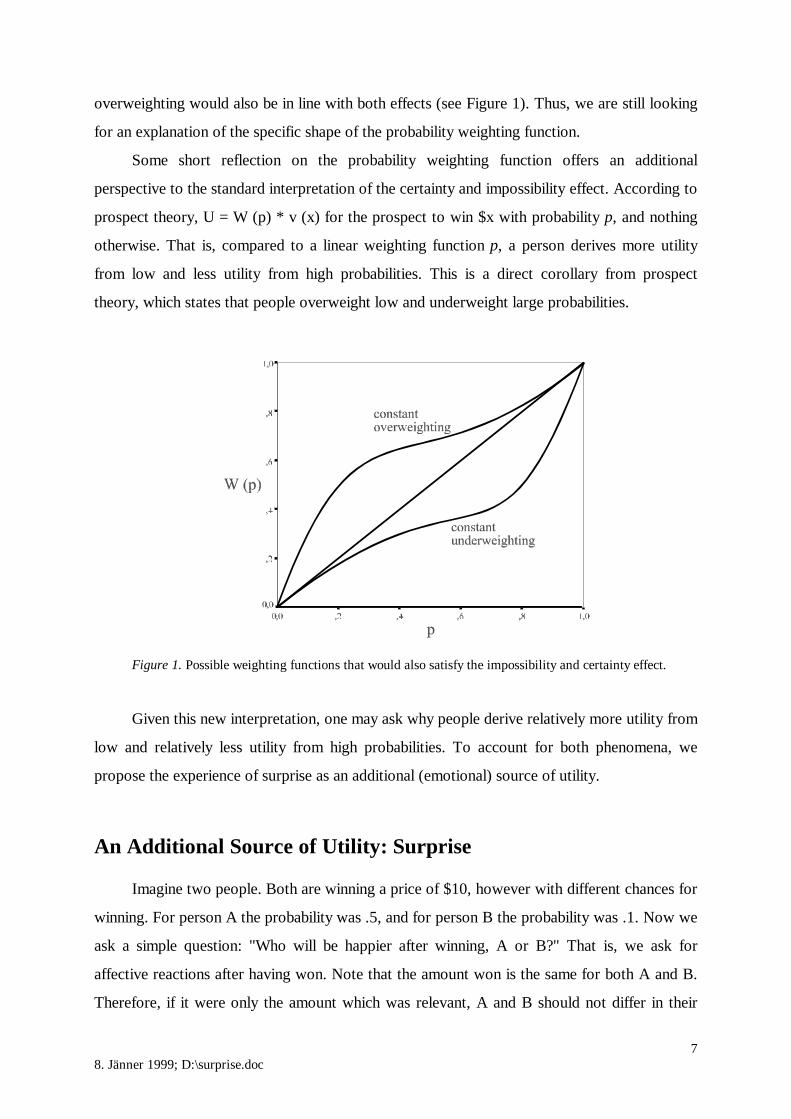
overweighting would also be in line with both effects (see Figure 1). Thus, we are still looking
for an explanation of the specific shape of the probability weighting function.
Some short reflection on the probability weighting function offers an additional
perspective to the standard interpretation of the certainty and impossibility effect. According to
prospect theory, U = W (p) * v (x) for the prospect to win $x with probability p, and nothing
otherwise. That is, compared to a linear weighting function p, a person derives more utility
from low and less utility from high probabilities. This is a direct corollary from prospect
theory, which states that people overweight low and underweight large probabilities.
Figure 1. Possible weighting functions that would also satisfy the impossibility and certainty effect.
Given this new interpretation, one may ask why people derive relatively more utility from
low and relatively less utility from high probabilities. To account for both phenomena, we
propose the experience of surprise as an additional (emotional) source of utility.
An Additional Source of Utility: Surprise
Imagine two people. Both are winning a price of $10, however with different chances for
winning. For person A the probability was .5, and for person B the probability was .1. Now we
ask a simple question: "Who will be happier after winning, A or B?" That is, we ask for
affective reactions after having won. Note that the amount won is the same for both A and B.
Therefore, if it were only the amount which was relevant, A and B should not differ in their

8. Jänner 1999; D:\surprise.doc8
evaluations of their happiness after having won the price. If so, an experiment, should end up
with a 50:50 split.
We suggest, however, that A and B differ in their experienced utility and hypothesize
that after winning B is happier than A, despite the fact that B had lower odds than A. Hints are
given by daily experience. For example, to increase the joy of a birthday or Christmas present
people often do not tell the other what he or she will receive. Or, unexpected deaths cause
more and longer pain for the bereaved than expected ones (Bowlby, 1969). More generally,
surprising events exert a stronger emotional impact on persons than expected ones.
Two Sources of Utility: Cognitive and Emotional Utility
As stated, the probability weighting function W (p) as well as the above example points
to a second source of utility to influence decisions under risk. Accordingly, we suggest two
different sources of utility: a cognitive utility (Uc) and an emotional utility (Ue), where Uc
refers to the usual expected utility derived from the rational choice model (Uc = p * v (x)).
Psychologically, Uc captures the long-term utility of possession, whereas Ue captures the short
term utility of winning–a distinction similar to the duality of "Having" versus "Being". To
calculate Uc and Ue algebraically, we propose the following equations:
Uc = p * v (x) (1)
Ue = We (p) * v (x) (2)
with
Uc Cognitive Utility (expected utility from rational choice model)
Ue Emotional Utility derived from surprise
p Objective probability
We (p) Weighting function for emotional utility
v (x) Value function on $x
To specify the weighting function We (p) for the emotional utility, Figure 2 is helpful.
Some assumptions can be inferred from the two lines. Important assumptions are that the
weighting function for the emotional utility We (i) is convex and (ii) runs counter to the
objective probability p.
Support for a convex, nonlinearly decreasing weighting function for the emotional utility
(utility derived from surprise) comes from habituation experiments, in which expected events
cause increasingly less intensive responses (Staddon & Higa, 1996).

8. Jänner 1999; D:\surprise.doc9
Figure 2. Predicted weighting functions We (p) and p for emotional and cognitive utility, respectively.
The distinction between two separate systems has long been recognized by philosophers,
poets, and scientists. Within recent psychology Morling and Epstein (1997) clearly stated the
idea: "A rational system operates according to people's understanding of conventional rules of
logic and evidence, and is often concerned with long-term consequences. It is conscious,
deliberate, analytical, predominantly verbal, and relatively affect-free. An experiential system
uses heuristics rather than logical rules, is intimately associated with affect, and is concerned
primarily with short-term, immediate consequences and concrete experience. It is
preconscious, automatic, intuitive, associationistic, and predominately nonverbal. The two
systems are conceptually separate but interact" (p. 1269; see also Epstein, 1994).
Having characterized the main features of the emotional weighting function We, the
question of how the cognitive and emotional utility interact to influence overall utility is still
open. The next section addresses this issue.
The Interaction of the Cognitive and Emotional Utility
As mentioned, we do not only have to be explicit on the two different sources of utility,
we must also be explicit on the interaction of these two different kinds of utility. For this
purpose we suggest overall utility as the weighted sum of cognitive utility Uc and emotional
utility Ue. That is
U = wc * Uc + we * Ue (3)
with
Uc Cognitive utility, derived from expected utility model
8. Jänner 1999; D:\surprise.doc10
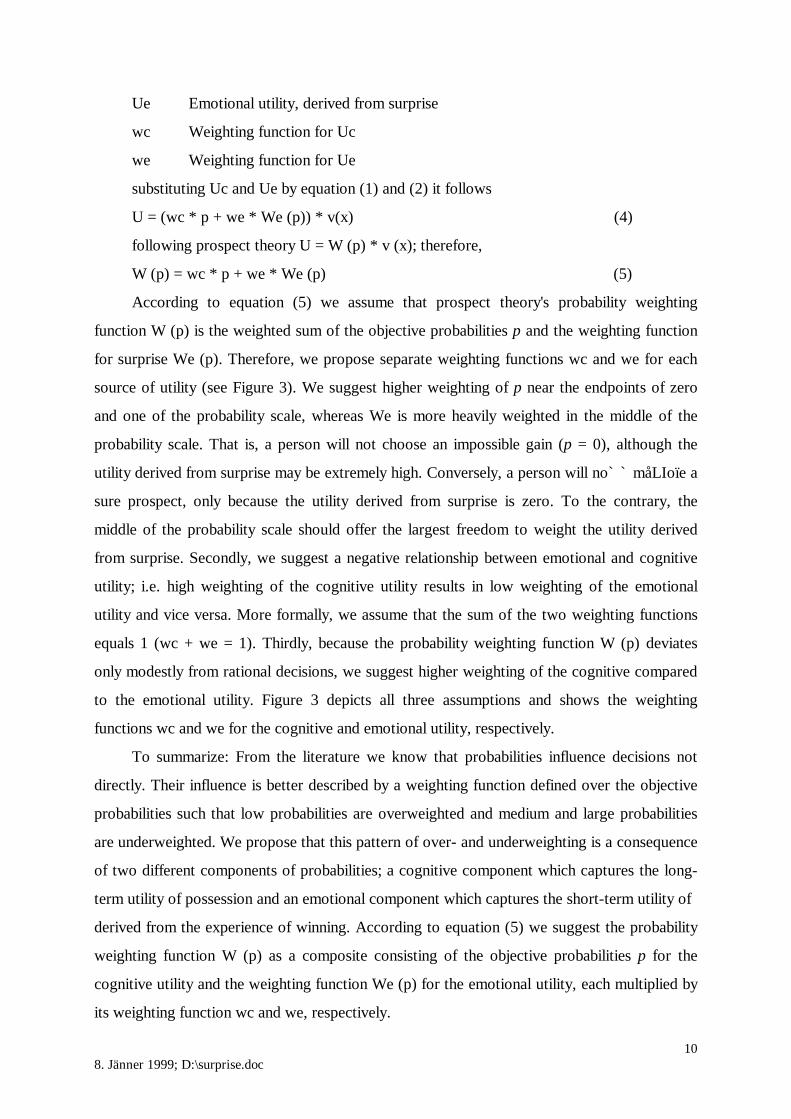
Ue Emotional utility, derived from surprise
wc Weighting function for Uc
we Weighting function for Ue
substituting Uc and Ue by equation (1) and (2) it follows
U = (wc * p + we * We (p)) * v(x) (4)
following prospect theory U = W (p) * v (x); therefore,
W (p) = wc * p + we * We (p) (5)
According to equation (5) we assume that prospect theory's probability weighting
function W (p) is the weighted sum of the objective probabilities p and the weighting function
for surprise We (p). Therefore, we propose separate weighting functions wc and we for each
source of utility (see Figure 3). We suggest higher weighting of p near the endpoints of zero
and one of the probability scale, whereas We is more heavily weighted in the middle of the
probability scale. That is, a person will not choose an impossible gain (p = 0), although the
utility derived from surprise may be extremely high. Conversely, a person will no` ` måLIoïe a
sure prospect, only because the utility derived from surprise is zero. To the contrary, the
middle of the probability scale should offer the largest freedom to weight the utility derived
from surprise. Secondly, we suggest a negative relationship between emotional and cognitive
utility; i.e. high weighting of the cognitive utility results in low weighting of the emotional
utility and vice versa. More formally, we assume that the sum of the two weighting functions
equals 1 (wc + we = 1). Thirdly, because the probability weighting function W (p) deviates
only modestly from rational decisions, we suggest higher weighting of the cognitive compared
to the emotional utility. Figure 3 depicts all three assumptions and shows the weighting
functions wc and we for the cognitive and emotional utility, respectively.
To summarize: From the literature we know that probabilities influence decisions not
directly. Their influence is better described by a weighting function defined over the objective
probabilities such that low probabilities are overweighted and medium and large probabilities
are underweighted. We propose that this pattern of over- and underweighting is a consequence
of two different components of probabilities; a cognitive component which captures the long-
term utility of possession and an emotional component which captures the short-term utility of
derived from the experience of winning. According to equation (5) we suggest the probability
weighting function W (p) as a composite consisting of the objective probabilities p for the
cognitive utility and the weighting function We (p) for the emotional utility, each multiplied by
its weighting function wc and we, respectively.

8. Jänner 1999; D:\surprise.doc11
Figure 3. Predicted weighting functions wc and we for the cognitive and emotional utility, respectively.
Relations to Other Models
Compared to disappointment theory (Bell, 1982, 1985) some fundamental differences
exist: Firstly, disappointment theory assumes that decision makers anticipate both elation for
gains and disappointment for non-gains, whereas our model assumes that decision makers
simplify the decision task by just anticipating gains but ignoring non-gains. Following prospect
theory they are more prone to anticipate changes than non-changes from a neutral reference
point. Secondly, our model assumes a compromise between cognitive and emotional processes,
a notion which is absent in disappointment theory. Psychologically we assume that cognitive
and emotional processes exclude each other: Higher weighting of surprise leads to lower
weighting of cognitive calculations and vice versa.
Overview over our Experiments
To test our theoretical hypotheses we conducted four experiments. Experiment 1 is a
rating experiment; and experiments 2, 3, and 4 are based on choices. In experiment 1 we do the
groundwork and measure the utility derived from expected and unexpected gains. The
experiments 2-4 (i) try to replicate the overall probability weighting function W (p) and (ii) to
investigate the weighting function for surprise We (p). This is done to estimate the

8. Jänner 1999; D:\surprise.doc12
unmeasurable weighting functions wc and we, since when we know W (p) and We (p) it is
possible to calculate wc and we algebraically to see whether their shapes are in line with the
model (see figure 3).
Experiment 1
Experiment 1 was done to estimate the emotional utility resulting from gambles.
Participants simply had to indicate how happy they would be with a specified win.
Method
Twenty-one participants from an introductory Psychology class at the University of
Salzburg volunteered to participate in study 1 (15 females, 6 males, AM = 21.4 years, SD =
4.1). Participants were asked to imagine having participated in a lottery and having won. Then
they were presented with a series of gambles described by the probability of winning and the
amount won. We varied 9 probability levels (.01, .05, .1, .3, .5, .7, .9, .95, .99) and 3 different
winning amounts ($4, $40, $120). By completely crossing probabilities and amounts, we ended
up with 27 different gambles. Participants had to evaluate each gamble on a scale from 0
(would not at all be happy) up to 6 (would be really happy). To control for order effects, four
different orders of gambles were produced.
Results and Discussion
The results are shown in Figure 4. We averaged over the 3 amounts of money and
found that the emerging picture was very similar to the one we expected. These findings show
a convex utility function with higher levels of happiness for lower probabilities. That is, small
probabilities cause disproportionally more happiness than high probabilities.
Ue thus has the expected shape. We suggest that the emotional component can be best
understood as a psychophysical function of surprise, dependent on the levels of probabilities. It
is important to distinguish this psychophysical function for the emotional component from a
psychophysical function that captures subjective estimates of probabilities, which people derive
from real world events. That is, the subjective estimate of a probability and the emotional
reaction to this estimate are two different processes. To control for the former, in all
experiments herein subjects receive prefabricated, stated probabilities.

8. Jänner 1999; D:\surprise.doc13
Figure 4. Medians for experienced joy about winning money, plotted as a function of probability.
Experiments 2-4
Each of these experiments consisted of two sessions. Session 1 always explored the
probability weighting function W (p), session 2 always explored the weighting function We (p)
for the emotional utility Ue. Experiment 2 used a between, and the experiments 3 and 4 were
within subjects designs. In experiments 3 and 4 the order of the sessions was reversed.
Method
Participants. Participants were students from the University of Linz. The participants in
the second experiment were 31 students (15 males, 16 females, AM = 23.3 years, SD = 4.4) for
session 1, and 26 students (11 males, 15 females, AM = 24.8 years, SD = 4.5) for session 2.
The participants in the third experiment were 50 students (31 males, 19 females, AM = 24.0
years, SD = 4.0). The participants in the fourth experiment were 32 students (25 males, 7
females, AM = 23.5 years, SD = 4.4).
Procedure. All experiments were run using a computer. For session 1 we employed the
same procedure used by Tversky and Fox (1995).1 Therein subjects made choices between a
descending series of sure payments and an uncertain prospect. For instance, a person had a
choice between an uncertain prospect to win $160 with probability .3 ( and nothing otherwise)

8. Jänner 1999; D:\surprise.doc14
or a sure payment of $50. The prize for the prospect always was $160 and subjects determined
their certainty equivalent (CE) for each of 19 different probabilities. The probabilities for the
19 prospects varied between .05 and .95, in multiples of .05. In session 1 the sure payments
were always less than $160.
Session 2 presented a different cover story. Subjects had to imagine two people who got
a present. Person A got a coupon which promised a sure payment, while person B got a lottery
ticket. For instance, person A got a coupon worth $170, person B got a lottery ticket which
offered to win $160 with p = .05. After a week, person A exchanges the coupon and receives
the expected $170, whereas person B joins the draw and actually wins $160. Subjects then had
to decide "Who is spontaneously happier?" As in session 1 the probabilities for the 19 lottery
tickets varied between .05 and .95, in multiples of .05. To avoid ceiling effects, the coupon
values were presented in ascending order, evenly spaced between $161 and $480. Note,
contrary to session 1, in session 2 the sure payments are always greater than the lottery amount
(i. e. greater than $160). This is important since it shows that in a rational sense such a
question does not make sense: Who will be spontaneously happier, the one who gets more for
sure or the one who gets less with some probability p < 1? Clearly, this is a question not aimed
at a cognitive but at an emotional answer.
Results and Discussion
According to prospect theory the utility for a prospect to win $x with probability p and
nothing otherwise is U = W (p) * v (x). Because subjects stated their certainty equivalents
(CE) for each prospect, it follows that v (CE) = W (p) * v (x) and W (p) = v (CE) / v (x). To
estimate the subjective value of the certainty equivalent (CE) and the prize (x), we used a
power function with an exponent of 0.88, which emerged empirically as a median estimate for
subjective value (Tversky & Kahneman, 1992). We comment more on this issue in the general
discussion section.
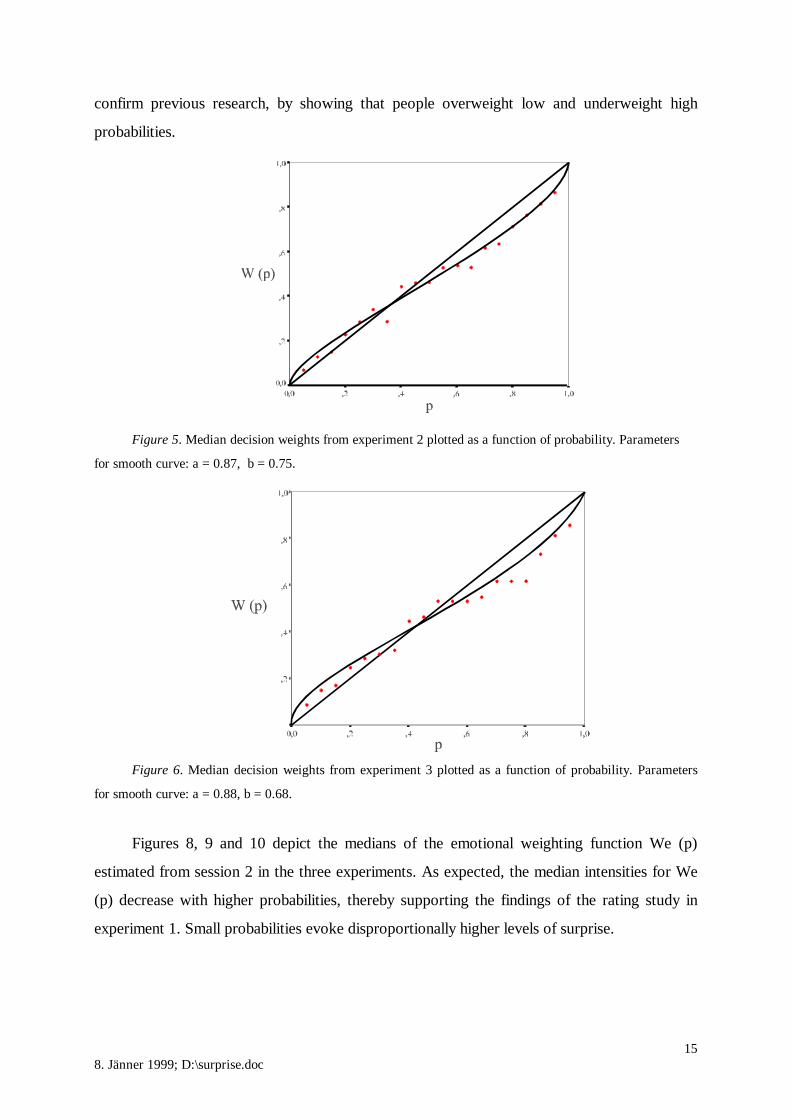
Figures 5, 6, and 7 show the median decision weights W (p) together with the probability
weighting functions for the three experiments 2-4. The smooth curves in these figures were
obtained by fitting the parametric form: W (p) = a * pb / (a * pb + (1-p)b) (see Lattimore, Baker
& Witte, 1992; Tversky & Fox, 1995). The fit for another two-parameter function, W (p) = pa
/ (pa + (1 – p)a)b, Wu and Gonzales (1996), is similar with a = .79, b = 1.5 for experiment 2, a =
0.72, b = 1.35 for experiment 3, and a = 0.79, b = 0.95 for experiment 4. The findings clearly
8. Jänner 1999; D:\surprise.doc15
confirm previous research, by showing that people overweight low and underweight high
probabilities.
Figure 5. Median decision weights from experiment 2 plotted as a function of probability. Parameters
for smooth curve: a = 0.87, b = 0.75.
Figure 6. Median decision weights from experiment 3 plotted as a function of probability. Parameters
for smooth curve: a = 0.88, b = 0.68.
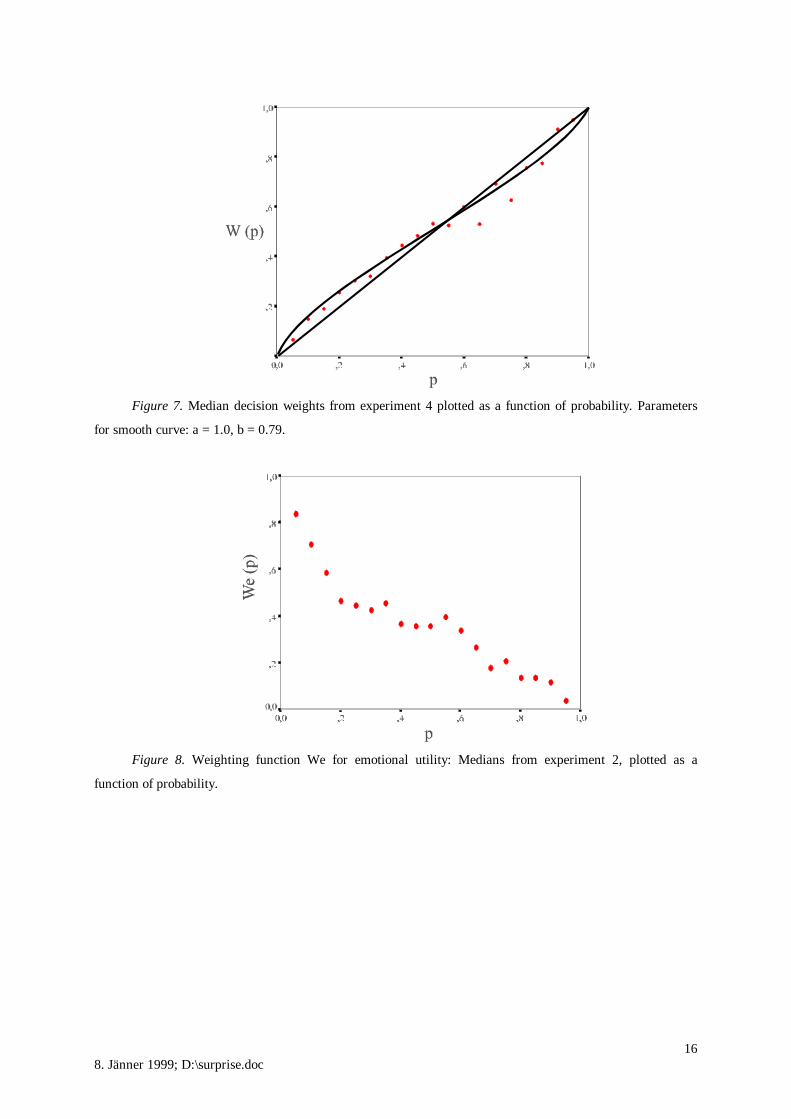
Figures 8, 9 and 10 depict the medians of the emotional weighting function We (p)
estimated from session 2 in the three experiments. As expected, the median intensities for We
(p) decrease with higher probabilities, thereby supporting the findings of the rating study in
experiment 1. Small probabilities evoke disproportionally higher levels of surprise.
8. Jänner 1999; D:\surprise.doc16
Figure 7. Median decision weights from experiment 4 plotted as a function of probability. Parameters
for smooth curve: a = 1.0, b = 0.79.
Figure 8. Weighting function We for emotional utility: Medians from experiment 2, plotted as a
function of probability.
8. Jänner 1999; D:\surprise.doc17
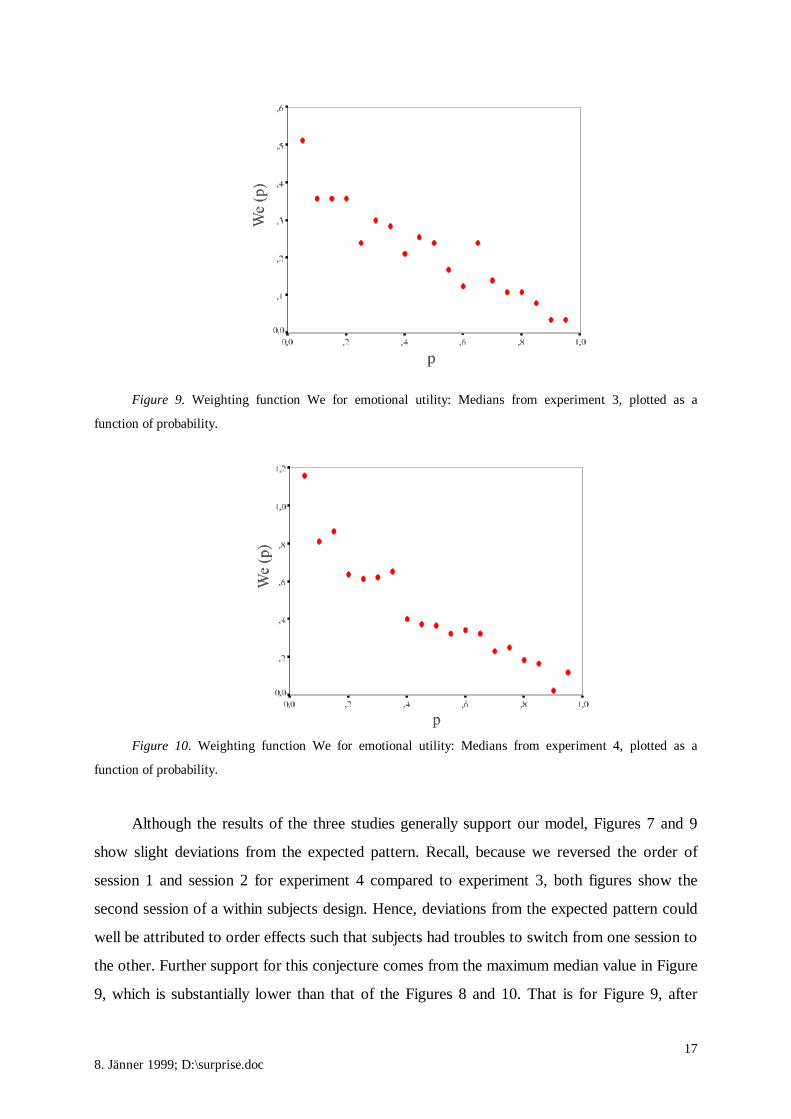
Figure 9. Weighting function We for emotional utility: Medians from experiment 3, plotted as a
function of probability.
Figure 10. Weighting function We for emotional utility: Medians from experiment 4, plotted as a
function of probability.
Although the results of the three studies generally support our model, Figures 7 and 9
show slight deviations from the expected pattern. Recall, because we reversed the order of
session 1 and session 2 for experiment 4 compared to experiment 3, both figures show the
second session of a within subjects design. Hence, deviations from the expected pattern could
well be attributed to order effects such that subjects had troubles to switch from one session to
the other. Further support for this conjecture comes from the maximum median value in Figure
9, which is substantially lower than that of the Figures 8 and 10. That is for Figure 9, after

8. Jänner 1999; D:\surprise.doc18
having judged on a mainly cognitive basis in session 1, subjects might had difficulties to base
their choices on purely emotional grounds, as required in session 2. Conversely, in Figure 7
subjects might had difficulties to switch from emotionally to cognitively based choices.
However, despite these possible order effects, the data are generally well in line with the
predictions.
Finally, the weighting functions wc and we for the objective probabilities p and the
weighting function We for the emotional utility, respectively, may provide further support to
the proposed model. We predicted functions similar to those depicted in Figure 3. To estimate
the beta-weights for wc and we empirically we used the nonlinear regression:
W (p) = wc * p + (1 – wc) * We (p) (6)
W (p) ... Probability weighting function; medians obtained from session 1
p ... Objective probabilities
We (p) ... Weighting function for emotional utility; medians obtained from
session 2
wc ... (ßo + ß1 * p + ß2 * p2), weighting function for p
(1 – wc) ... we; weighting function for We
Following Figure 3, for wc and we quadratic functions seem sufficient. The amounts of
explained variance (R2) for experiment 2, 3 and 4 are .99, .97, and .98, respectively2. Figures
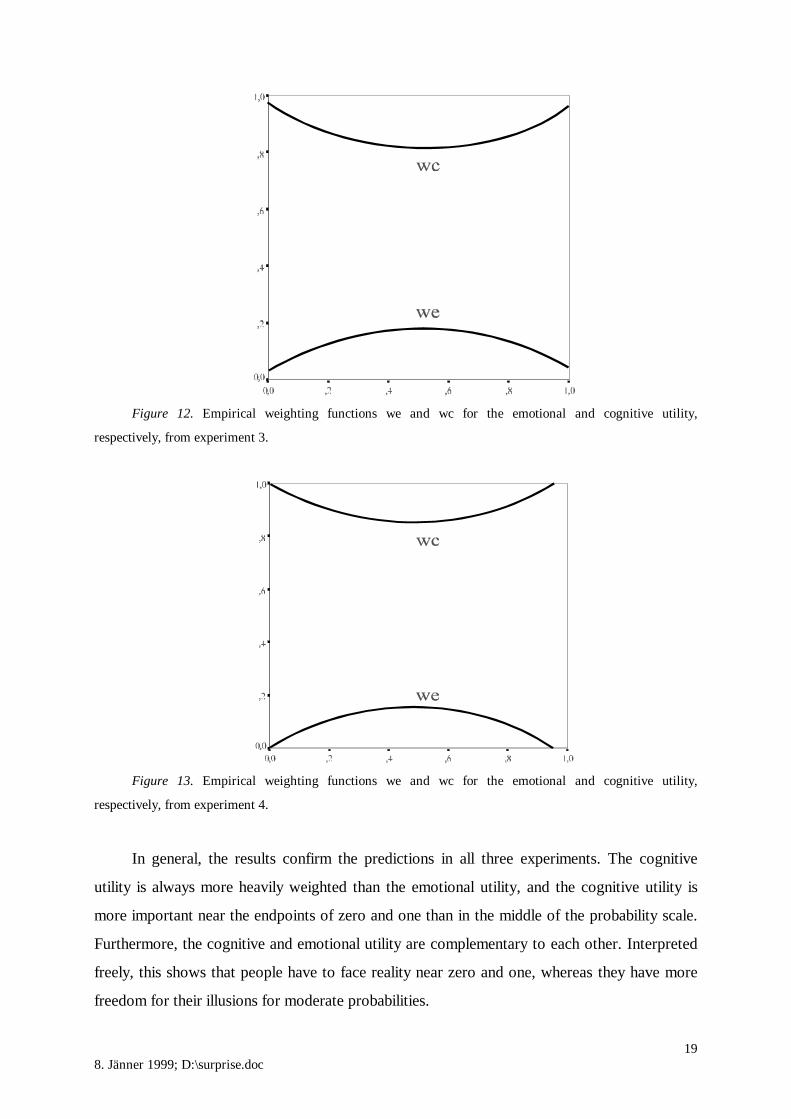
11 to 13 depict the empirical weighting functions for all three experiments.
Figure 11. Empirical weighting functions we and wc for the emotional and cognitive utility,
respectively, from experiment 2.
8. Jänner 1999; D:\surprise.doc19
Figure 12. Empirical weighting functions we and wc for the emotional and cognitive utility,
respectively, from experiment 3.
Figure 13. Empirical weighting functions we and wc for the emotional and cognitive utility,
respectively, from experiment 4.
In general, the results confirm the predictions in all three experiments. The cognitive
utility is always more heavily weighted than the emotional utility, and the cognitive utility is
more important near the endpoints of zero and one than in the middle of the probability scale.
Furthermore, the cognitive and emotional utility are complementary to each other. Interpreted
freely, this shows that people have to face reality near zero and one, whereas they have more
freedom for their illusions for moderate probabilities.

8. Jänner 1999; D:\surprise.doc20
General Discussion
We proposed a psychological model to account for over- and underweighting of
probabilities in decisions under risk. Seen as a whole, data of four experiments corroborate the
notion of the probability weighting function as a composite of cognitive and emotional
processes, each weighted by a different function. Therefore, the present article elaborates on
previous research in several respects: Firstly, over- and underweighting of probabilities is
distinguished from impossibility and certainty effects, as shown in Figure 1, because the
certainty and impossibility effect alone do not suffice to explain over- and underweighting of
probabilities. Secondly, we suggest a psychophysical function for surprise as a cause to
influence utility. Thirdly, the model contains a detailed formal conceptualization of the
interplay between cognitive and emotional processes. Both a relatively simple paper-and-pencil
rating experiment as well as three more sophisticated computer-based choice experiments for
measuring the weighting functions W (p) and We (p) arrive at the same conclusion–a
convergence that corroborates the validity of method and findings.
One may object that the empirical shape of the probability weighting function W (p) is
crucially dependent on the shape of the value function, for which we used a power function
with an exponent of .88. As mentioned, this exponent emerged as an empirical estimate for the
value function (Tversky & Kahneman, 1992). However, for two reasons we do not think that
the specific shape of the value function imposes a high impact on the empirical estimation of
the probability weighting function W (p): Firstly, when we used a linear value function the
shape of the probability weighting function was very similar to the shape we obtained when we
used a power function with an exponent of .88–this finding in line with that of Tversky and
Kahneman (1992). Secondly, and even more important, Wu and Gonzalez (1996) developed a
method that enables the estimation of the probability weighting function W (p) without any
assumptions about the value function. Again, their results support the inverted S-shape of the
probability weighting function. Interestingly, they obtained an averaged exponent b for the
probability smooth curve of .68, which comes close to our averaged exponent b of .74.
Moreover, the averaged linear parameters a for the probability smooth curves are .84 and .91,
for their and our experiments, respectively. In sum, although some variations in the parameters
occurred, the specific exponent used for the value function does not seem to influence crucially
the basic shape of the probability weighting function (see also Wu & Gonzales, 1996 for
further details).

8. Jänner 1999; D:\surprise.doc21
Are violations of subjective expected utility theory irrational?
We argued that unexpected events–i. e. events with a low probability of occurrence–
elicit more intense emotions than expected ones. As a consequence, repeated exposure to the
same stimulus leads to habituation of the organism to this stimulus; organisms thus show
increasingly less intense physiological responses.
Given surprise as a ubiquitous phenomenon, the question arises whether deviations from
a linear probability function constitute "cognitive errors" and "irrationalities", as the "heuristics
and bias approach" has argued (see Kahneman, Slovic, & Tversky, 1982 for a review), or
whether these deviations may even be rational.
Rationality is usually defined as the way of thinking that best helps people to achieve
their goals, as Baron (1997) put it: "If it should turn out that following the rules of formal logic
leads to eternal happiness, then it is 'rational thinking' to follow the laws of logic (assuming that
we all want eternal happiness). If it should turn out, on the other hand, that carefully violating
the laws of logic at every turn leads to eternal happiness, then it is these violations that we shall
call 'rational'" (p. 29). Hence, it follows that a rational decision maker could maximize utility by
finding some compromise between the two different sources of utility–the short term utility
derived from winning and the long term utility derived from possession.
We suggest that short-term effects directly depend on the emotional utility, as we have
called it. That is, in the short run low probabilities cause more utility than large probabilities, as
the probability weighting function suggests. Hence, both overweighting of small and
underweighting of large probabilities would be rational.
However, even in the long run overweighting of small probabilities can be rational, as the
following perspective suggests. Elster and Loewenstein (1992), referring to Bentham,
notice:"... much of the pleasure and pain we experience in daily life arises not from direct
experience–that is, 'consumption'–but from contemplation of our own past or future..." (p.
213f). In this sense people could derive pleasure by remembering the past joyful event of
winning.
The mimic of surprise, especially characterized by high eye brows, is one of six basic
emotions that was correctly identified by all investigated cultures of the world (Ekman,
Sorenson, & Friesen, 1969), thus supporting surprise as a fundamental, universal, and
biologically transmitted emotion. Given these considerations one may ask for the specific

8. Jänner 1999; D:\surprise.doc22
purpose of this very general principle. We think that surprise indicates a discrepancy between a
mental model and a state of the world. Because correct mental models are crucial for
surviving, surprise may be the first step that motivates persons to adapt their inadequate mental
models to outside conditions.
In sum, instead of interpreting deviations from a linear probability scale as "biases" or
even "cognitive errors", an analysis, which considers two different sources of utility, arrives at
the conclusion that nonlinearity in the weighting of probabilities may be a consequence of an
intelligent compromise between two different sources of utility: the cognitive and the
emotional.

8. Jänner 1999; D:\surprise.doc23
References
Allais, A.M. (1953). Le comportement de l'homme rationel devant le risque, critique des
postulates et axiomes de l'ecole americaine. Econometrica, 21, 503-546.
Allais, M. & Hagen, J. (Eds.). (1979). Expected Utility Hypotheses and the Allais Paradox.
Dordrecht: Reidel.
Baron, J. (1997). Thinking and Deciding. Cambridge. Cambridge University Press.
Battalio, R. C., Kagel, J. H., & MacDonald, D. N. (1985). Animals' choices over uncertain
outcomes: some initial experimental results. American Economic Review, 75, 597-613.
Bell, D. E. (1982). Regret in decisions under uncertainty. Operations Research, 80, 961-981.
Bell, D. E. (1985). Regret in decision making under uncertainty. Operations Research, 30,
961-981.
Bowbly, J. (1969). Attachment and loss. New York: Basic Books.
Camerer, C. F. & Ho, T. H. (1994). Violations of the betweenness axiom and nonlinearity in
probability. Journal of Risk and Uncertainty, 8, 167-196.
Ekman, P., Sorenson, E. R., & Friesen, W. V. (1969). Pancultural elements of facial displays in
emotion. Science, 764, 86-88.
Elster, J. & Loewenstein, G. (1992). Utility from memory and anticipation. In G. Loewenstein
& J. Elster (Ed.), Choice over Time. New York: Russell Sage Foundation.
Epstein, S. (1994). Integration of the congnitive and the psychodynamic unconscious.
American Psychologist, 49, 709-724.
Fiske, S. T. & Taylor, S. E. (1991). Social cognition. New York: McGraw Hill
Helson, H. (1964). Adaptation level theory. New York: Harper & Row.
Hogarth, R.M. & Einhorn, H.J. (1990). Venture theory: A model of decision weights.
Management Science, 36, 780-803.
Josephs, R. A., Larrick, R. P., Steele, C. M, & Nisbett, R. E. (1992). Protecting the self from
negative consequences of risky decisions. Journal of Personality and Social Psychology,
62, 26-37.
Kahneman, D., Slovic, P. & Tversky, A: (1982). Judgment under Uncertainty: Heuristics and
Biases. New York: Cambridge University Press.
Kahneman, D., & Tversky, A. (1979). Prospect theory: An analysis of decision under risk.
Econometrica, 47, 263-291.
Kahneman, D., & Tversky, A. (1984). Choices, values, and frames. American Psychologist,
39, 341-350.
8. Jänner 1999; D:\surprise.doc24
Larrick, R. P. & Boles, T. L. (1995). Avoiding regret in decisions with feedback: A
negotiation example. Organizational Behavior and Human Decision Processes, 63, 87-
97.
Lattimore, P. M., Baker, J. R., & Witte, A. D. (1992). The influence of probability on risky
choice. Journal of Economic Behavior and Organization, 17, 377-400.
Loomes, G. & Sudgen, R. (1982). Regret thoory: An alternative theory of rational choice
under uncertainty. The Economic Journal, 92, 805-824.
Mellers, B. A., Schwartz, A., Ho, K., & Ritov, I. (1997). Decision affect theory. Emotional
reactions to the outcomes of risky options. Psychological Science, 8, 423-429.
Morling, B. & Epstein, S. (1997). Compromises produced by the dialectic between self-
verification and self-enhancement. Journal of Personality and Social Psychology, 73,
1268-1283.
Pommerehne, W. W., Schneider, F. & Zweifel, P. (1982). Economic theory of choice and the
preference reversal phenomenon. A reexamination. American Economic Review, 72,
576-584.
Ritov, I. (1996). Probability of regret: Anticipation of uncertainty resolution in choice.
Organizational Behavior and Human Decision Processes, 66, 228-236.
Savage, L. J. (1954). The foundations of statistics. New York: Wiley.
Simon, H. A. (1955). A behavioral model of rational choice. Quarterly Journal of Economics,
69, 99-118.
Solomon, R. L. (1980). The opponent-process theory of aquired motivation. The costs of
pleasure and the benfits of pain. American Psychologist, 35, 691-712.
Staddon, J. E. R. & Higa, J. J. (1996). Multiple time scales in simple habituation.
Psychological Review, 103, 720-733.
Thaler, R. H. (1980). Toward a positve theory of consumer choice. Journal of Economic
Behavior and Organization, 1, 39-60.
Tversky, A. & Kahneman, D. (1992). Advances in prospect theory: Cumulative representation
of uncertainty. Journal of Risk and Uncertainty, 5, 297-323.
Tversky, A. & Fox, C. R. (1995). Weighing risk and uncertainty. Psychological Review, 102,
269-283.
Van Dijk, W. & Von der Pligt, J. (1997). The impact of probability and magnitude of outcome
on disappointment and elation. Organizational Behavior and Human Decision
Processes, 69, 277-284.

8. Jänner 1999; D:\surprise.doc25
Weinstein, N. D. (1980). Unrealistic optimism about future live events. Journal of Personality
and Social Psychology, 39, 806-820.
Wu, G. & Gonzalez, R. (1996). Curvature of the probability weighting function. Management
Science, 42, 1676-1690.
Zeelenberg, M. & Beattie, J. (1996). Consequences of regret aversion: Effects of expected
feedback on risky decision making. Organizational Behavior and Human Decision
Processes, 65, 148-158.
Zeelenberg, M. & Beattie, J. (1997). Consequences of regret aversion 2: Additional evidence
for effects of feedback on decision making. Organizational Behavior and Human
Decision Processes, 72, 63-78.

8. Jänner 1999; D:\surprise.doc26
Footnotes
1 See there for a detailed description of session 1.
2 Estimating two different quadratic weighting functions wc and we, by adding three
additional parameters ß3, ß4, and ß5 for we, did not increase model fit. The beta weights β0, β1,
β2 for wc are 1.03, -0.89, 0.83 for experiment 2, respectively; 0.96, -0.55, 0.53 for experiment
3, and 1.0, -0.61, 0.63 for experiment 4, respectively.