Embed Size (px)
Citation preview

ManagementDecision MakingManagementDecision Making
Supplement – Supplement – Break Even AnalysisBreak Even Analysis
Break-Even AnalysisBreak-Even Analysis
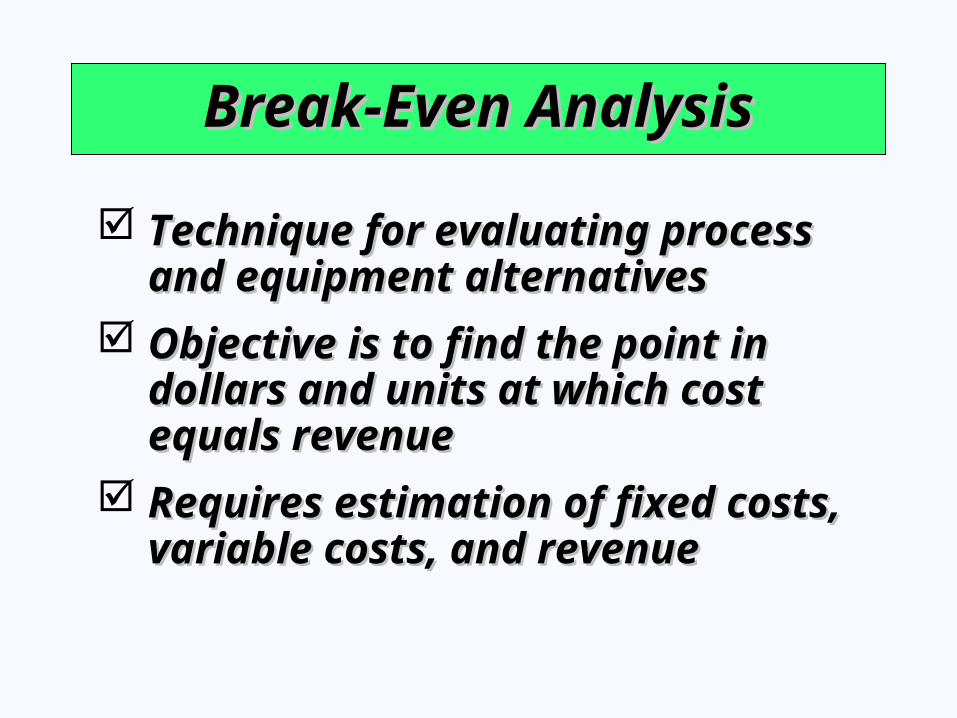
Technique for evaluating process Technique for evaluating process and equipment alternativesand equipment alternatives
Objective is to find the point in Objective is to find the point in dollars and units at which cost dollars and units at which cost equals revenueequals revenue
Requires estimation of fixed costs, Requires estimation of fixed costs, variable costs, and revenuevariable costs, and revenue
Break-Even AnalysisBreak-Even Analysis
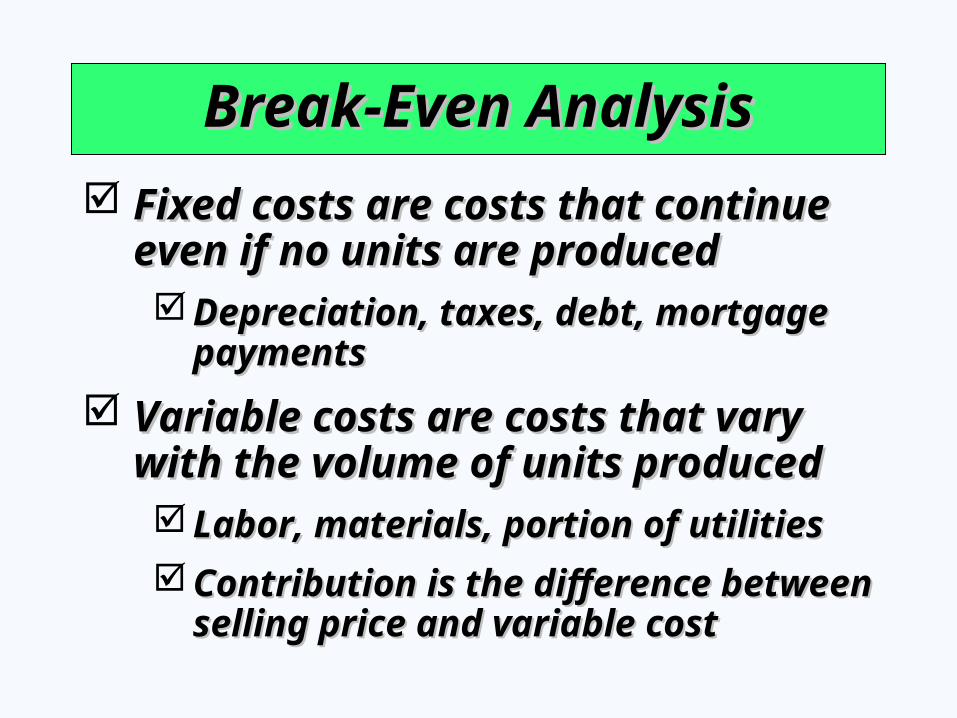
Fixed costs are costs that continue Fixed costs are costs that continue even if no units are producedeven if no units are produced Depreciation, taxes, debt, mortgage Depreciation, taxes, debt, mortgage
paymentspayments
Variable costs are costs that vary Variable costs are costs that vary with the volume of units producedwith the volume of units produced Labor, materials, portion of utilitiesLabor, materials, portion of utilities
Contribution is the difference between Contribution is the difference between selling price and variable costselling price and variable cost
Break-Even AnalysisBreak-Even Analysis
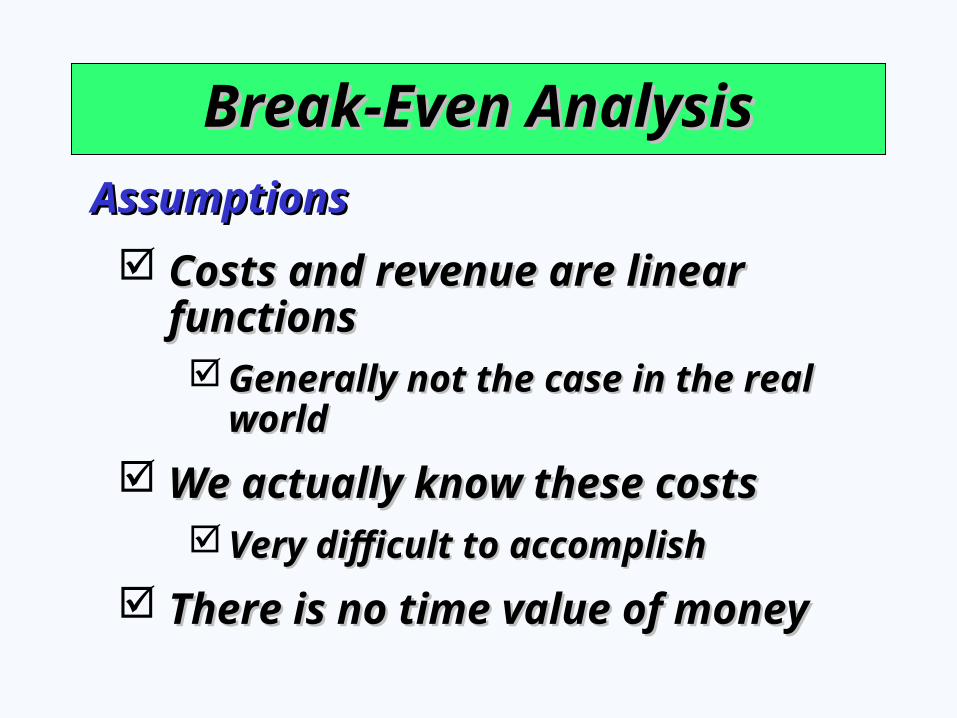
Costs and revenue are linear Costs and revenue are linear functionsfunctions Generally not the case in the real Generally not the case in the real
worldworld
We actually know these costsWe actually know these costs Very difficult to accomplishVery difficult to accomplish
There is no time value of moneyThere is no time value of money
AssumptionsAssumptions
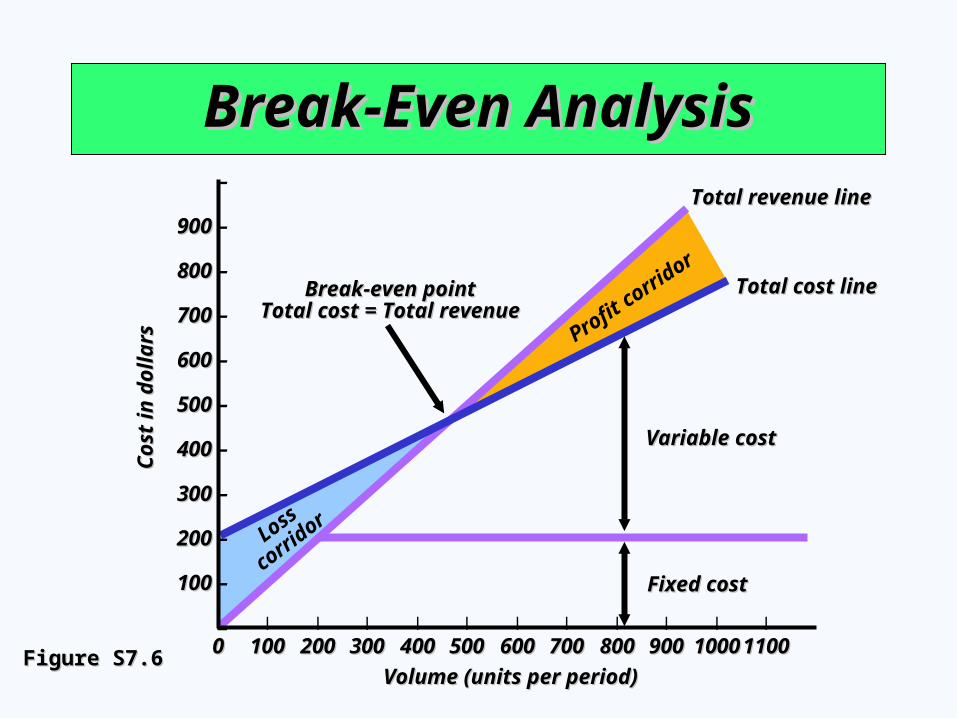
Profit corri
dor
Loss
corridor
Break-Even AnalysisBreak-Even AnalysisTotal revenue lineTotal revenue line
Total cost lineTotal cost line
Variable costVariable cost
Fixed costFixed cost
Break-even pointBreak-even pointTotal cost = Total revenueTotal cost = Total revenue
–
900 900 –
800 800 –
700 700 –
600 600 –
500 500 –
400 400 –
300 300 –
200 200 –
100 100 –
–| | | | | | | | | | | |
00 100100 200200 300300 400400 500500 600600 700700 800800 900900 1000100011001100
Co
st in
do
llars
Co
st in
do
llars
Volume (units per period)Volume (units per period)Figure S7.6Figure S7.6
Break-Even AnalysisBreak-Even Analysis
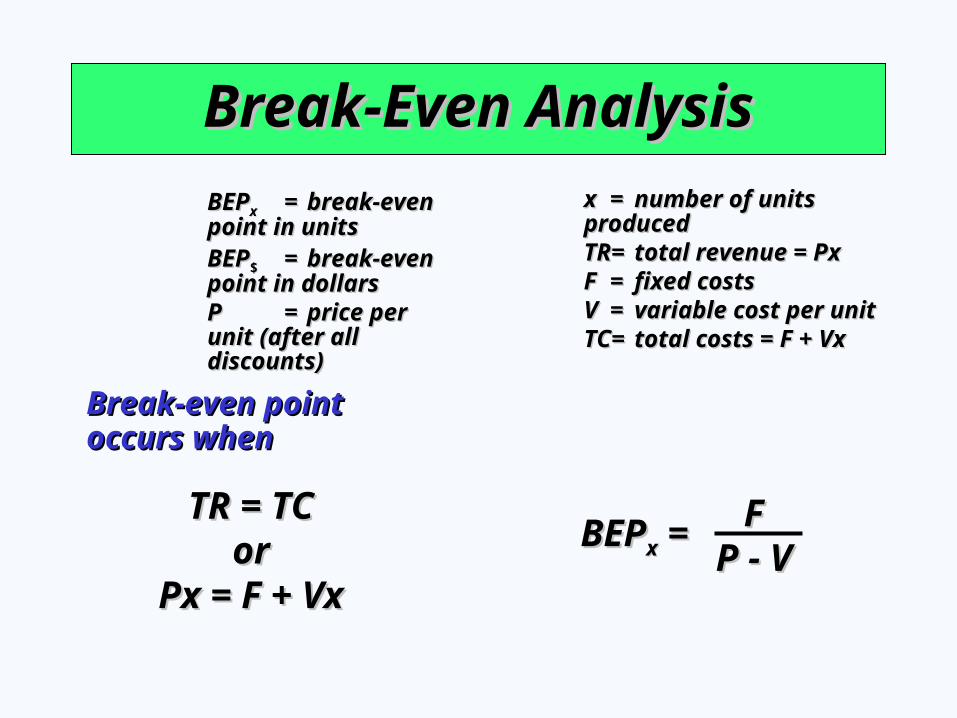
BEPBEPxx == break-even break-even point in unitspoint in unitsBEPBEP$$ == break-even break-even point in dollarspoint in dollarsPP == price per price per unit (after all unit (after all discounts)discounts)
xx == number of units number of units producedproducedTRTR== total revenue = Pxtotal revenue = PxFF == fixed costsfixed costsVV == variable cost per unitvariable cost per unitTCTC== total costs = F + Vxtotal costs = F + Vx
TR = TCTR = TCoror
Px = F + VxPx = F + Vx
Break-even point Break-even point occurs whenoccurs when
BEPBEPxx = =FF
P - VP - V
Break-Even AnalysisBreak-Even Analysis
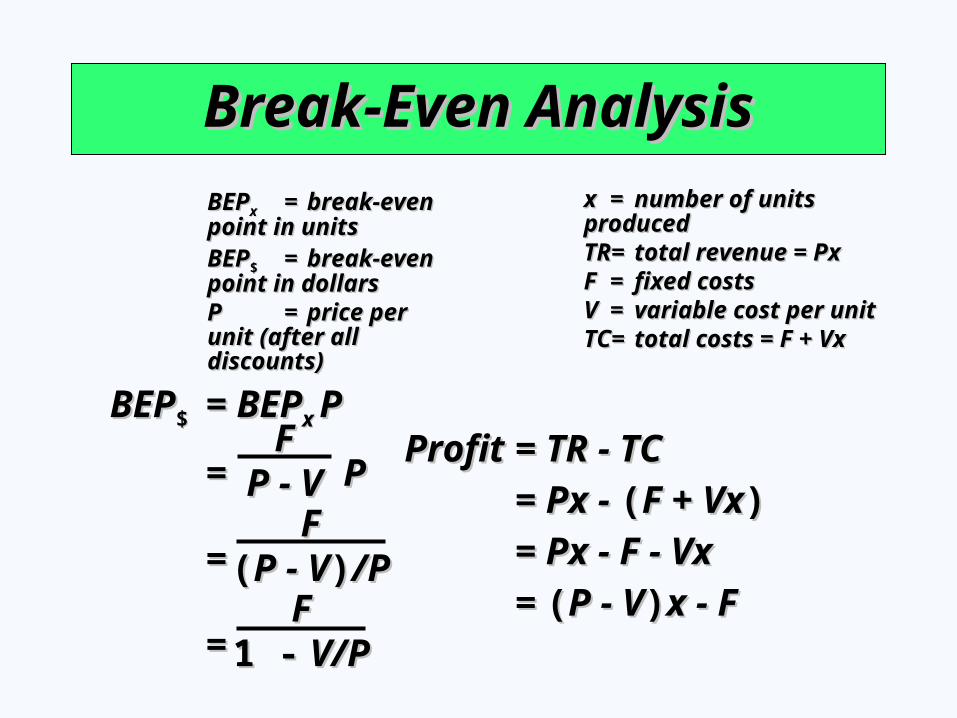
BEPBEPxx == break-even break-even point in unitspoint in unitsBEPBEP$$ == break-even break-even point in dollarspoint in dollarsPP == price per price per unit (after all unit (after all discounts)discounts)
xx == number of units number of units producedproducedTRTR== total revenue = Pxtotal revenue = PxFF == fixed costsfixed costsVV == variable cost per unitvariable cost per unitTCTC== total costs = F + Vxtotal costs = F + Vx
BEPBEP$$ = BEP= BEPx x PP
= P= P
==
= =
FF((P - VP - V))/P/P
FFP - VP - V
FF1 -1 - V/P V/P
ProfitProfit = TR - TC= TR - TC
= Px - = Px - ((F + VxF + Vx))
= Px - F - Vx= Px - F - Vx
= = ((P - VP - V))x - Fx - F
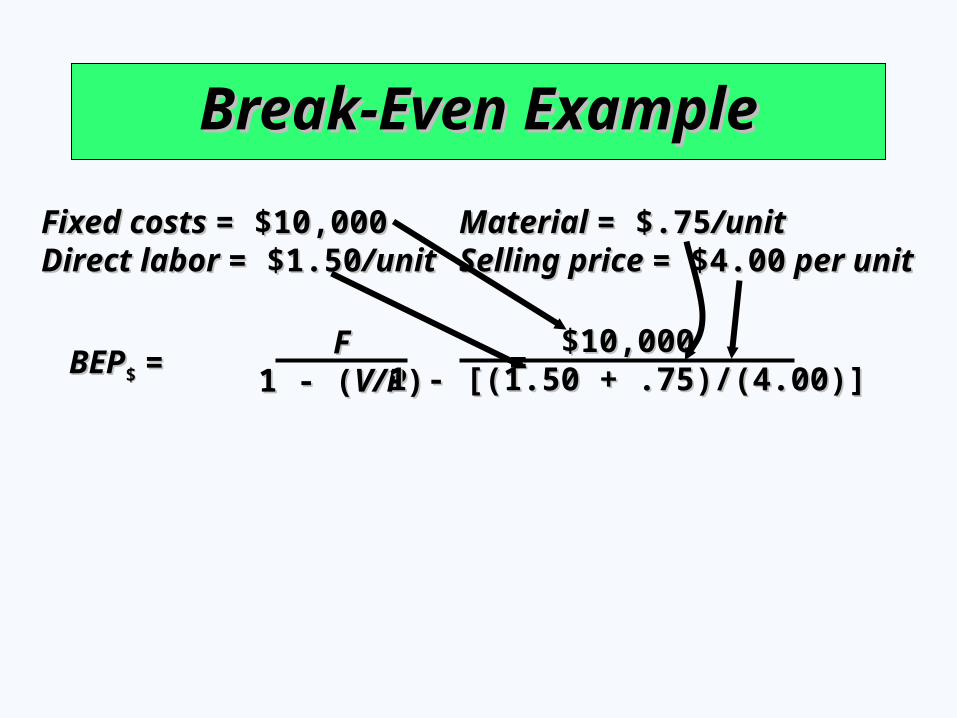
Break-Even ExampleBreak-Even Example
Fixed costs Fixed costs = $10,000= $10,000 Material Material = $.75= $.75/unit/unitDirect labor Direct labor = $1.50= $1.50/unit/unit Selling price Selling price = $4.00= $4.00 per unit per unit
BEPBEP$$ = == =FF
1 - (1 - (V/PV/P))$10,000$10,000
1 - [(1.50 + .75)/(4.00)]1 - [(1.50 + .75)/(4.00)]
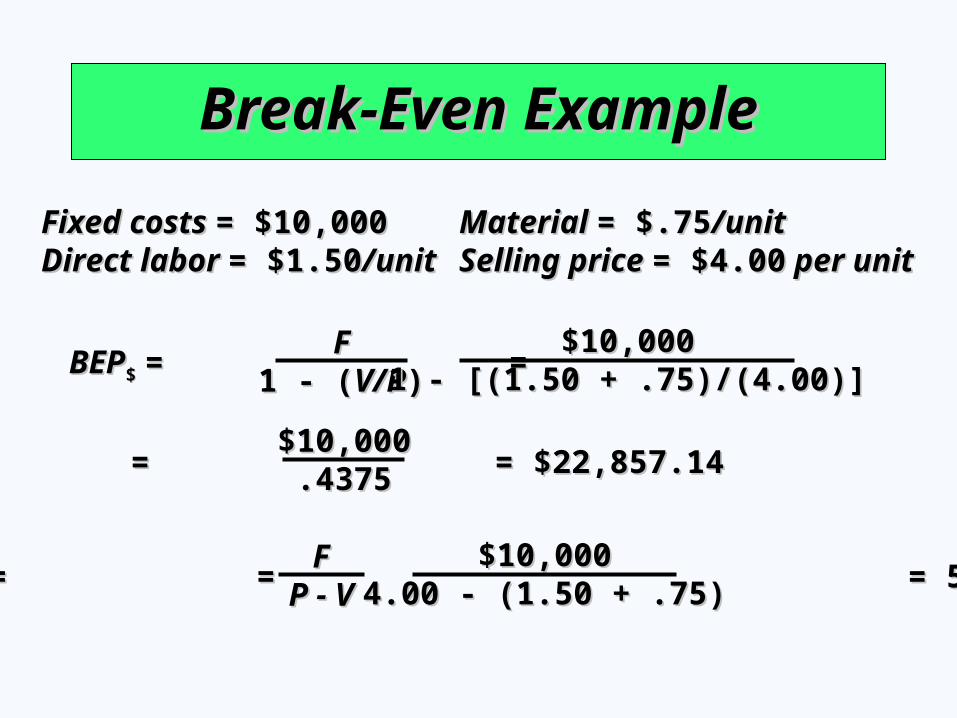
= = $22,857.14= = $22,857.14$10,000$10,000
.4375.4375
BEPBEPxx = = = 5,714= = = 5,714FF
P - VP - V$10,000$10,000
4.00 - (1.50 + .75)4.00 - (1.50 + .75)
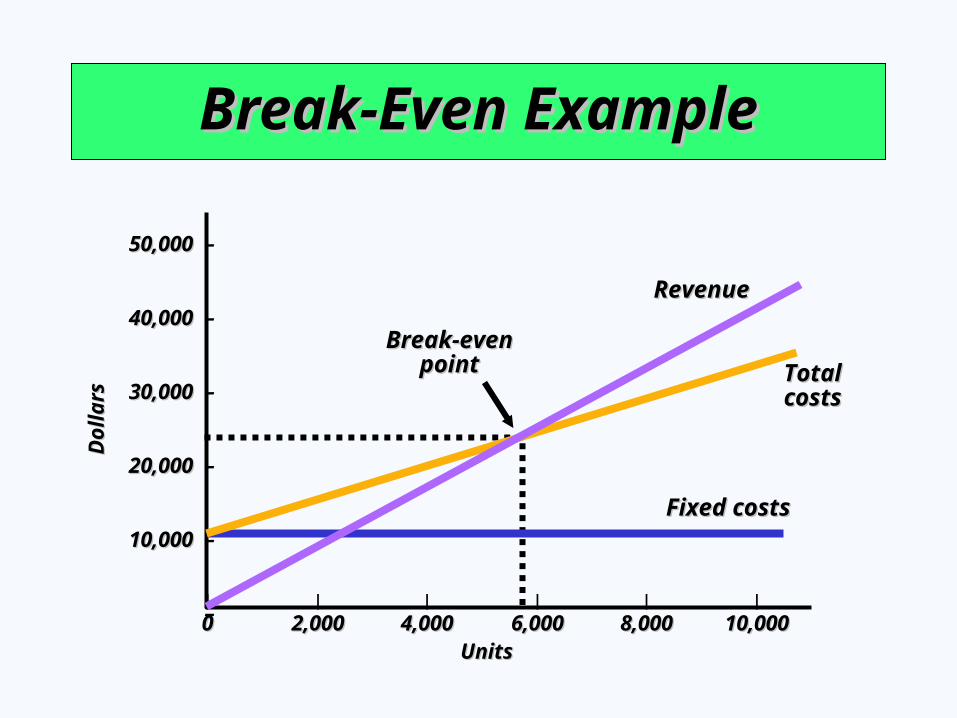
Break-Even ExampleBreak-Even Example
50,000 50,000 –
40,000 40,000 –
30,000 30,000 –
20,000 20,000 –
10,000 10,000 –
–| | | | | |
00 2,0002,000 4,0004,000 6,0006,000 8,0008,000 10,00010,000
Do
llars
Do
llars
UnitsUnits
Fixed costsFixed costs
Total Total costscosts
RevenueRevenue
Break-even Break-even pointpoint
Break-Even ExampleBreak-Even Example
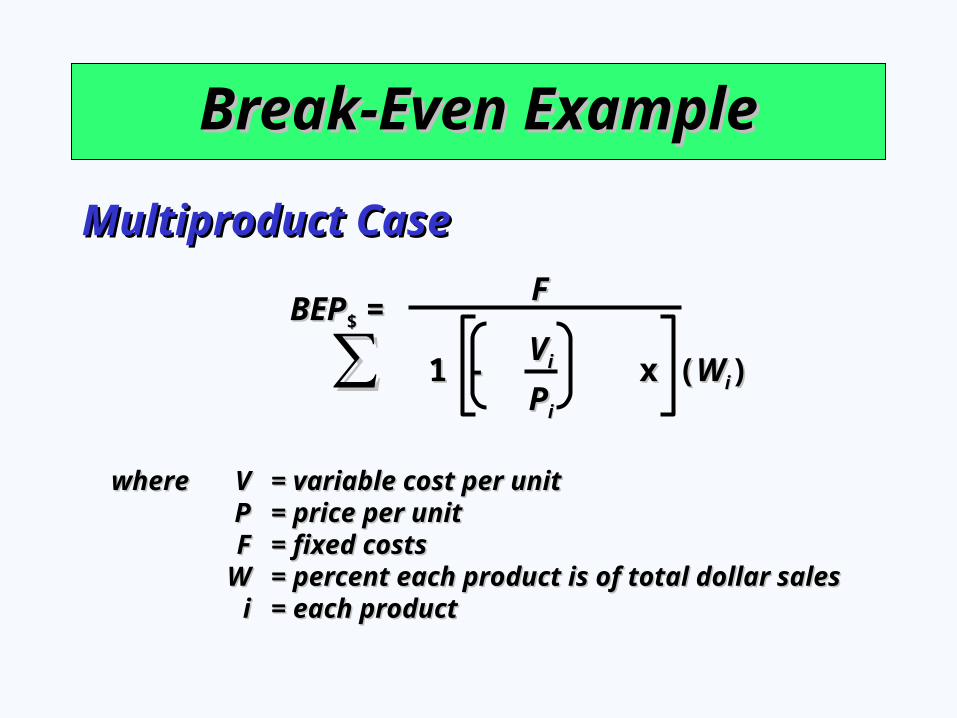
BEPBEP$$ ==FF
∑∑ 1 - x (1 - x (WWii))VVii
PPii
Multiproduct CaseMultiproduct Case
wherewhere VV = variable cost per unit= variable cost per unitPP = price per unit= price per unitFF = fixed costs= fixed costs
WW = percent each product is of total dollar sales= percent each product is of total dollar salesii = each product= each product
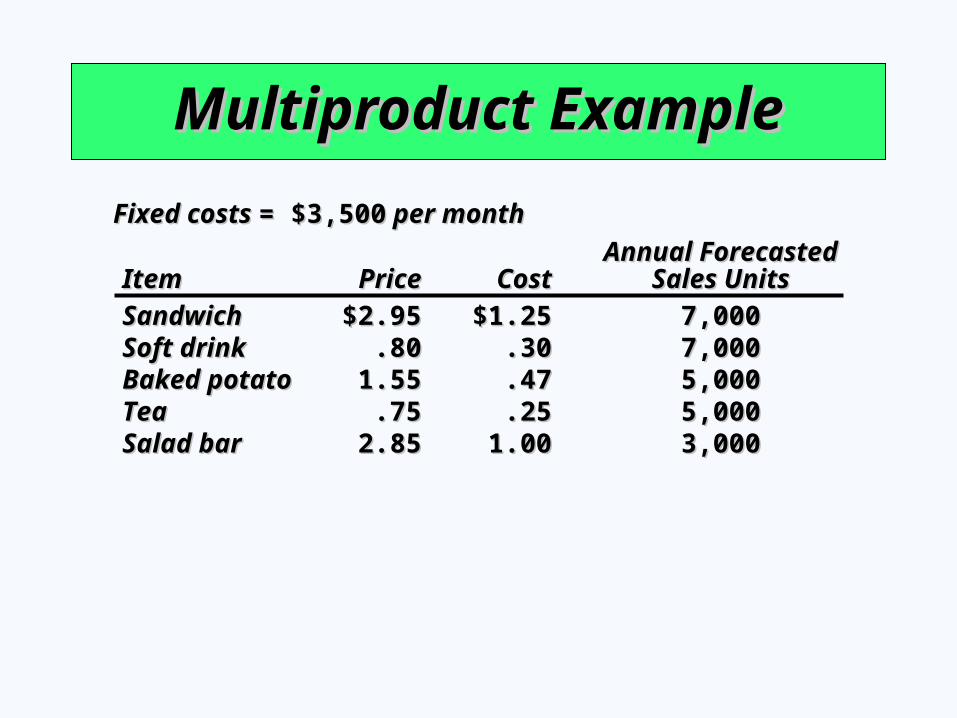
Multiproduct ExampleMultiproduct Example
Annual ForecastedAnnual ForecastedItemItem PricePrice CostCost Sales UnitsSales Units
SandwichSandwich $2.95$2.95 $1.25$1.25 7,0007,000Soft drinkSoft drink .80.80 .30.30 7,0007,000Baked potatoBaked potato 1.551.55 .47.47 5,0005,000TeaTea .75.75 .25.25 5,0005,000Salad barSalad bar 2.852.85 1.001.00 3,0003,000
Fixed costs Fixed costs = $3,500= $3,500 per month per month
Multiproduct ExampleMultiproduct Example
Annual ForecastedAnnual ForecastedItemItem PricePrice CostCost Sales UnitsSales Units
SandwichSandwich $2.95$2.95 $1.25$1.25 7,0007,000Soft drinkSoft drink .80.80 .30.30 7,0007,000Baked potatoBaked potato 1.551.55 .47.47 5,0005,000TeaTea .75.75 .25.25 5,0005,000Salad barSalad bar 2.852.85 1.001.00 3,0003,000
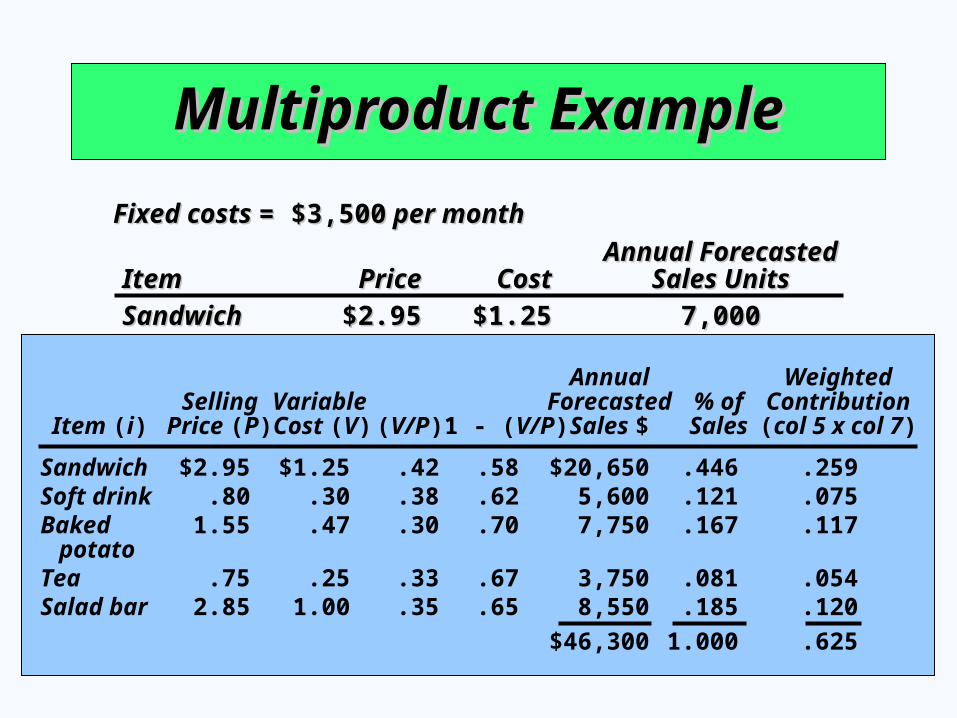
Sandwich $2.95 $1.25 .42 .58 $20,650 .446 .259Soft drink .80 .30 .38 .62 5,600 .121 .075Baked 1.55 .47 .30 .70 7,750 .167 .117 potatoTea .75 .25 .33 .67 3,750 .081 .054Salad bar 2.85 1.00 .35 .65 8,550 .185 .120
$46,300 1.000 .625
Annual WeightedSelling Variable Forecasted % of Contribution
Item (i) Price (P) Cost (V) (V/P) 1 - (V/P) Sales $ Sales (col 5 x col 7)
Fixed costs Fixed costs = $3,500= $3,500 per month per month
Multiproduct ExampleMultiproduct Example
Annual ForecastedAnnual ForecastedItemItem PricePrice CostCost Sales UnitsSales Units
SandwichSandwich $2.95$2.95 $1.25$1.25 7,0007,000Soft drinkSoft drink .80.80 .30.30 7,0007,000Baked potatoBaked potato 1.551.55 .47.47 5,0005,000TeaTea .75.75 .25.25 5,0005,000Salad barSalad bar 2.852.85 1.001.00 3,0003,000
Fixed costs Fixed costs = $3,500= $3,500 per month per month
Sandwich $2.95 $1.25 .42 .58 $20,650 .446 .259Soft drink .80 .30 .38 .62 5,600 .121 .075Baked 1.55 .47 .30 .70 7,750 .167 .117 potatoTea .75 .25 .33 .67 3,750 .081 .054Salad bar 2.85 1.00 .35 .65 8,550 .185 .120
$46,300 1.000 .625
Annual WeightedSelling Variable Forecasted % of Contribution
Item (i) Price (P) Cost (V) (V/P) 1 - (V/P) Sales $ Sales (col 5 x col 7)
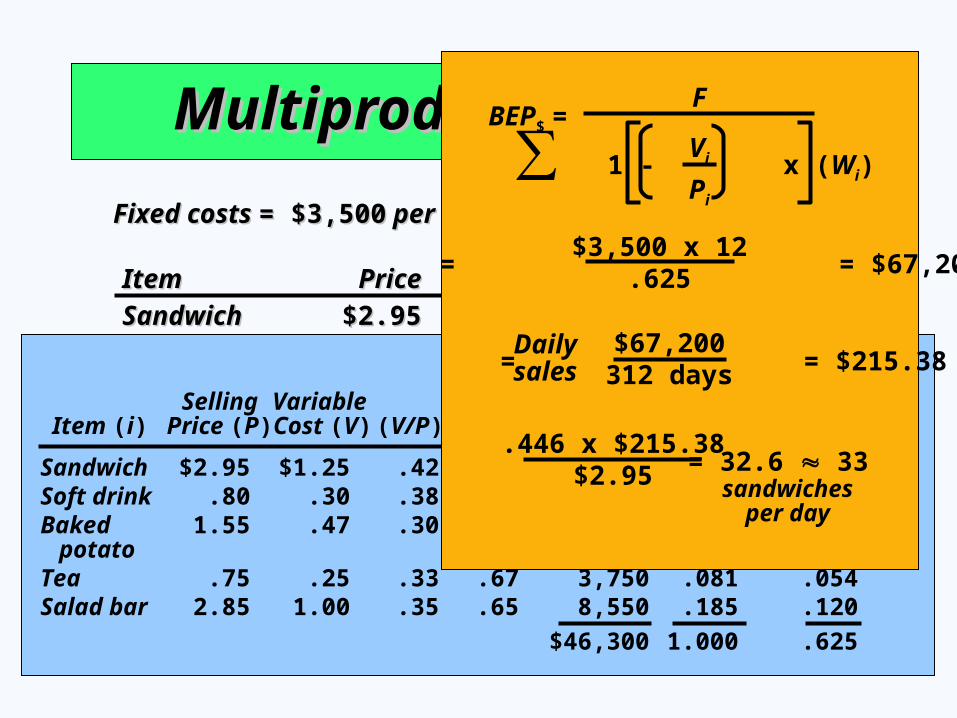
BEP$ =F
∑ 1 - x (Wi)Vi
Pi
= = $67,200$3,500 x 12
.625
Daily sales = = $215.38
$67,200312 days
.446 x $215.38$2.95 = 32.6 33
sandwichesper day