Embed Size (px)
Citation preview

Alaska and Hawaiinot to scale Surgeons per 100,000 Population
(# of Counties)
40.0 or More (679)25.0 to 39.9 (523)10.0 to 24.9 (683)
6.0 to 9.9 (228)4.7 to 5.9 (69)0.1 to 4.6 (84)
No Surgeons (841)
Surgeons per 100,000 Population2006
Source: AMA Physician Masterfile, 2006. Data include non-federal, non-resident, clinically active physicians less than 80 years old reporting a primary specialty classified by the ACS HPRI as surgery.Produced By: American College of Surgeons Health Policy Research Institute, Cecil G. Sheps Center for Health Services Research, University of North Carolina at Chapel Hill.
revised 10/12/12
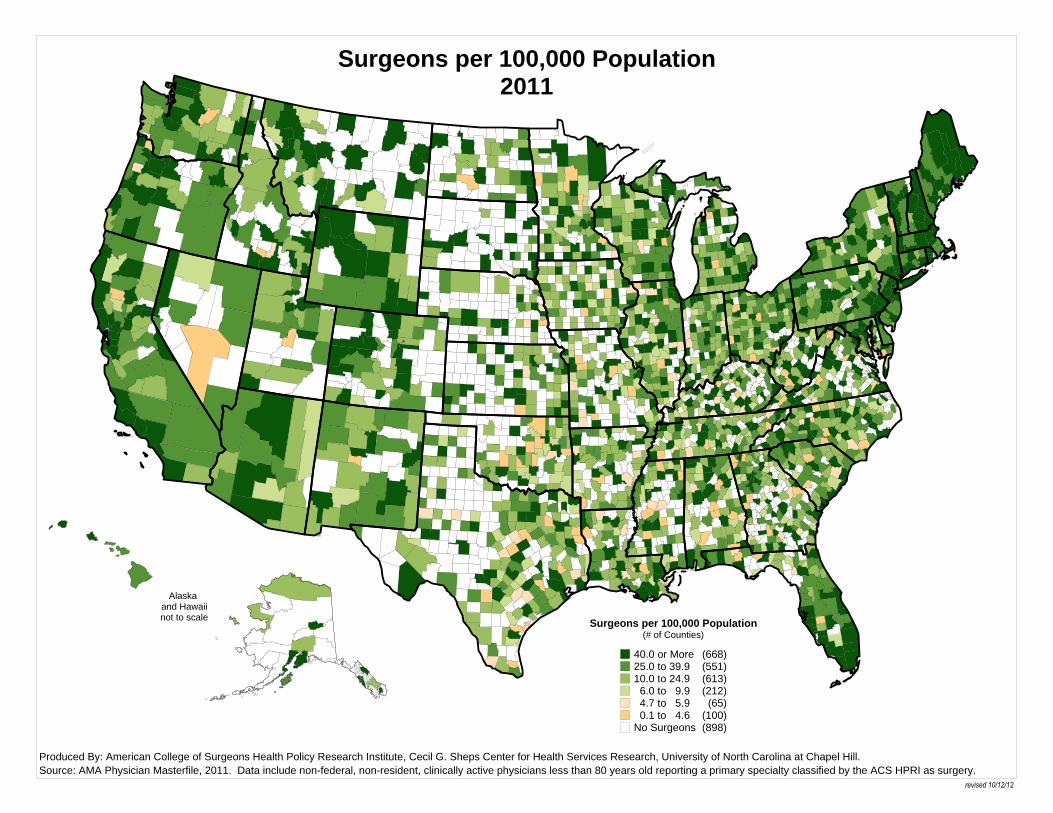
Alaska and Hawaiinot to scale Surgeons per 100,000 Population
(# of Counties)
40.0 or More (668)25.0 to 39.9 (551)10.0 to 24.9 (613)
6.0 to 9.9 (212)4.7 to 5.9 (65)0.1 to 4.6 (100)
No Surgeons (898)
Surgeons per 100,000 Population2011
Source: AMA Physician Masterfile, 2011. Data include non-federal, non-resident, clinically active physicians less than 80 years old reporting a primary specialty classified by the ACS HPRI as surgery.Produced By: American College of Surgeons Health Policy Research Institute, Cecil G. Sheps Center for Health Services Research, University of North Carolina at Chapel Hill.
revised 10/12/12

Alaska and Hawaiinot to scale % Change in Surgeons per 100,000 Pop
(# of Counties)
Gained 100.0% or More (90)Gained 50.0% to 99.9% (129)Gained 10.0% to 49.9% (383)Gained 0.1% to 9.9% (419)No Change (1)Decline in Number of Surgeons per Pop (1051)None in 2006, At Least One in 2011 (136)Lost All Surgeons (193)None Either Year (705)
Percent Change in Surgeonsper 100,000 Population, 2006-2011
Source: AMA Physician Masterfile, 2006-2011. Data include non-federal, non-resident, clinically activephysicians less than 80 years old reporting a primary specialty classified by ACS HPRI as surgery.
Produced By: American College of Surgeons Health Policy Research Institute, Cecil G.Sheps Center for Health Services Research, University of North Carolina at Chapel Hill.
revised 10/12/12
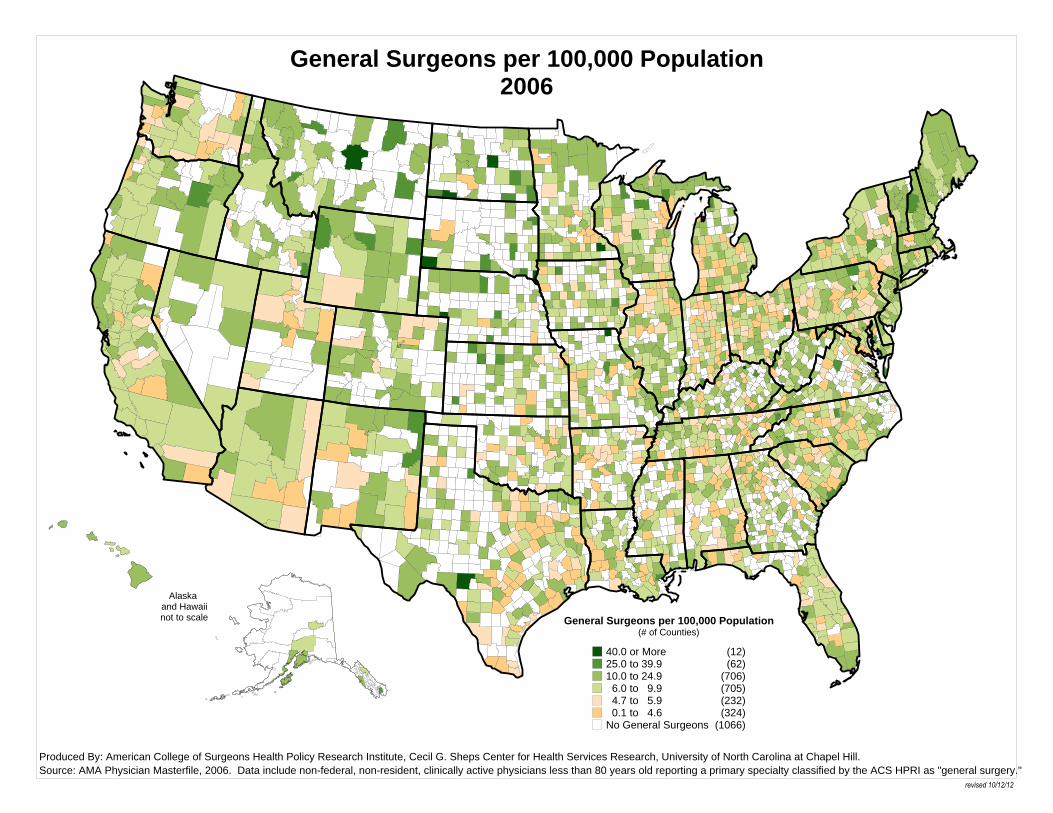
Alaska and Hawaiinot to scale General Surgeons per 100,000 Population
(# of Counties)
40.0 or More (12)25.0 to 39.9 (62)10.0 to 24.9 (706)
6.0 to 9.9 (705)4.7 to 5.9 (232)0.1 to 4.6 (324)
No General Surgeons (1066)
General Surgeons per 100,000 Population2006
Source: AMA Physician Masterfile, 2006. Data include non-federal, non-resident, clinically active physicians less than 80 years old reporting a primary specialty classified by the ACS HPRI as "general surgery."Produced By: American College of Surgeons Health Policy Research Institute, Cecil G. Sheps Center for Health Services Research, University of North Carolina at Chapel Hill.
revised 10/12/12
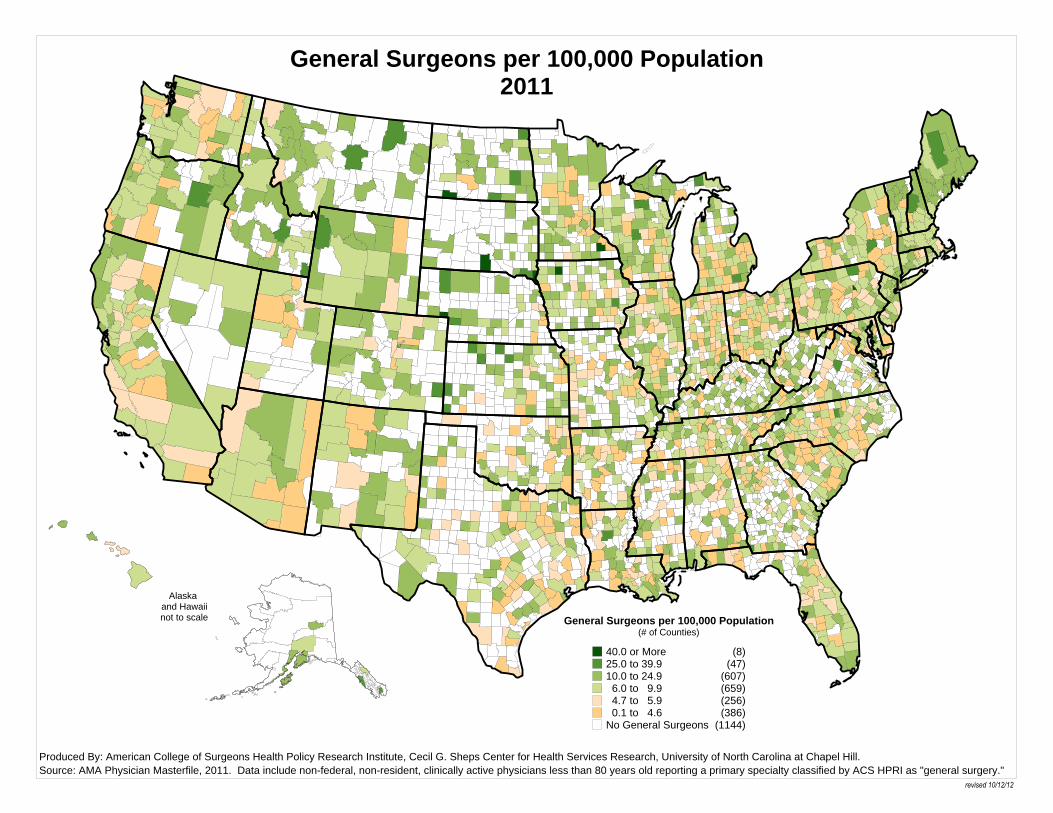
Alaska and Hawaiinot to scale General Surgeons per 100,000 Population
(# of Counties)
40.0 or More (8)25.0 to 39.9 (47)10.0 to 24.9 (607)
6.0 to 9.9 (659)4.7 to 5.9 (256)0.1 to 4.6 (386)
No General Surgeons (1144)
General Surgeons per 100,000 Population2011
Source: AMA Physician Masterfile, 2011. Data include non-federal, non-resident, clinically active physicians less than 80 years old reporting a primary specialty classified by ACS HPRI as "general surgery."Produced By: American College of Surgeons Health Policy Research Institute, Cecil G. Sheps Center for Health Services Research, University of North Carolina at Chapel Hill.
revised 10/12/12
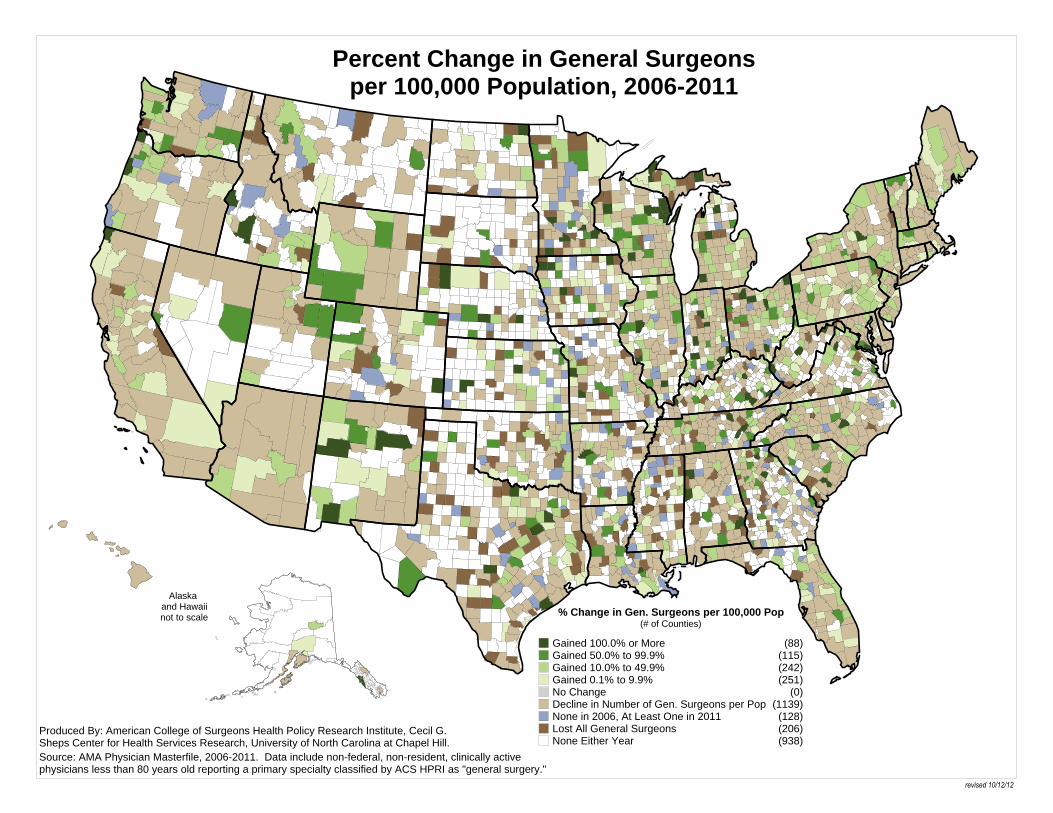
Alaska and Hawaiinot to scale % Change in Gen. Surgeons per 100,000 Pop
(# of Counties)
Gained 100.0% or More (88)Gained 50.0% to 99.9% (115)Gained 10.0% to 49.9% (242)Gained 0.1% to 9.9% (251)No Change (0)Decline in Number of Gen. Surgeons per Pop (1139)None in 2006, At Least One in 2011 (128)Lost All General Surgeons (206)None Either Year (938)
Percent Change in General Surgeonsper 100,000 Population, 2006-2011
Source: AMA Physician Masterfile, 2006-2011. Data include non-federal, non-resident, clinically activephysicians less than 80 years old reporting a primary specialty classified by ACS HPRI as "general surgery."
Produced By: American College of Surgeons Health Policy Research Institute, Cecil G.Sheps Center for Health Services Research, University of North Carolina at Chapel Hill.
revised 10/12/12