Embed Size (px)
Citation preview

Louisiana State UniversityLSU Digital Commons
LSU Master's Theses Graduate School
2010
Surfactant-induced flow behavior effects in gascondensate reservoirsBikash Deep. SaikiaLouisiana State University and Agricultural and Mechanical College, [email protected]
Follow this and additional works at: https://digitalcommons.lsu.edu/gradschool_theses
Part of the Petroleum Engineering Commons
This Thesis is brought to you for free and open access by the Graduate School at LSU Digital Commons. It has been accepted for inclusion in LSUMaster's Theses by an authorized graduate school editor of LSU Digital Commons. For more information, please contact [email protected].
Recommended CitationSaikia, Bikash Deep., "Surfactant-induced flow behavior effects in gas condensate reservoirs" (2010). LSU Master's Theses. 3101.https://digitalcommons.lsu.edu/gradschool_theses/3101

SURFACTANT-INDUCED FLOW BEHAVIOR EFFECTS IN GAS CONDENSATE RESERVOIRS
A Thesis
Submitted to the Graduate Faculty of the
Louisiana State University and Agricultural and Mechanical College
in partial fulfillment of the requirements for the degree of
Master of Science in Petroleum Engineering
in
The Department of Petroleum Engineering
By Bikash Deep Saikia
B.E. (Chem.), NIT Karnataka, India, 2000 December, 2010

ii
DEDICATION
This work is dedicated to all my teachers, my family and my friends…

iii
ACKNOWLEDGEMENTS
I take this opportunity to extend my heartfelt thanks to my advisor Dr. Dandina Rao for
accepting me to be his student and for his able guidance, continued encouragement and for the
much needed funds for the project. I also extend my thanks to Dr. Stephen Sears and Dr. Mileva
Radonjic for their kind acceptance to serve as members on the examination committee.
I would like to thank my entire faculty members for the knowledge that they imparted and for
their constant encouragement and constructive feedback.
I would like to thank our administrative and technical staff for their ready and cheerful help all
along the way. I also thank Mr. Victor Ramirez of CAMD for his technical assistance. A special
note of thanks to Mr. Fenelon Nunes for the laboratory assistance.
I also thank all my friends for their friendship and support. My heartfelt thanks to my family for
their unconditional love and support.

iv
TABLE OF CONTENTS
DEDICATION ................................................................................................................................ ii
ACKNOWLEDGEMENTS ........................................................................................................... iii
LIST OF TABLES ......................................................................................................................... vi
LIST OF FIGURES ...................................................................................................................... vii
NOMENCLATURE ...................................................................................................................... ix
ABSTRACT .................................................................................................................................... x
CHAPTER 1: INTRODUCTION ................................................................................................... 1 1.1 Background ........................................................................................................................... 1 1.2 Objective ............................................................................................................................... 5 1.3 Methodology ......................................................................................................................... 7
CHAPTER 2: LITERATURE REVIEW ........................................................................................ 8 2.1 Deliverability Reduction in Gas Condensate Reservoirs ...................................................... 8 2.2 Relative Permeability Studies ............................................................................................. 10 2.3 Treatment of Condensate Blockage .................................................................................... 16 2.4 Phase Behavior Studies ....................................................................................................... 18 2.5 Surfactants ........................................................................................................................... 23
CHAPTER 3: EXPERIMENTAL APPARATUS AND PROCEDURE ...................................... 30 3.1 Experimental Apparatus ...................................................................................................... 30 3.2 Experimental Procedure ...................................................................................................... 32
3.2.1 Core Preparation ........................................................................................................... 32 3.2.2 Saturation of the Core ................................................................................................... 33 3.2.3 Establishing Irreducible Water Saturation (Swi) ........................................................... 33 3.2.4 Artificial Retrograde Gas Condensate Mixture Preparation ........................................ 33 3.2.5 Core Flood Procedure of Gas Mixture ......................................................................... 38 3.2.6 Subsequent Retrograde Gas Floods .............................................................................. 39
CHAPTER 4: RESULTS AND DISCUSSION ............................................................................ 40 4.1 Saturation with Brine without Surfactant (i.e. 0 ppm Surfactant Concentration) ............... 41 4.2 Saturation with Brine Containing 1000 ppm Surfactant Concentration ............................. 44 4.3 Saturation with Brine Containing 2000 ppm Surfactant Concentration ............................. 46 4.4 Saturation with Brine Containing 5000 ppm Surfactant Concentration ............................. 47 4.5 Comparative Analysis of Pressure Drops ............................................................................ 49 4.6 Economic Impact Evaluation .............................................................................................. 53

v
CHAPTER 5: CONCLUSIONS AND RECOMMENDATIONS ................................................ 56 5.1 Summary and Conclusions .................................................................................................. 56 5.2 Recommendations for Future Work .................................................................................... 57
REFERENCES ............................................................................................................................. 58
VITA ............................................................................................................................................. 63

vi
LIST OF TABLES
Table 3.1 Artificial condensate compositions ............................................................................... 34
Table 3.2 Artificial condensate composition ................................................................................ 36
Table 4.1 Different cases considered in experimentation ............................................................. 40
Table 4.2 Core properties for a typical core ................................................................................. 41
Table 4.3 Summary of important results ....................................................................................... 52
Table 4.4 Typical gas composition for the well ............................................................................ 53
Table 4.5 Typical Parameters for the well .................................................................................... 54
Table 4.6 Gas flow rate for various cases ..................................................................................... 54

vii
LIST OF FIGURES
FIGURE 1.1 PROJECTION OF GLOBAL NATURAL GAS DEMAND UPTO 2035......................................... 1
FIGURE 1.2 PHASE ENVELOPE OF TYPICAL GAS CONDENSATE MIXTURE ........................................... 3
FIGURE 1.3 FLOW REGIONS FOR A RADIAL WELL PRODUCING FROM A GAS COND. RESERVOIR ......... 4
FIGURE 1.4 SCHEMATIC DEPICTION OF THE SPREADING COEFFICIENT .............................................. 6
FIGURE 1.5 OIL-WATER-GAS DISTRIBUTIONS IN O/G/W/R SYSTEMS .............................................. 6
FIGURE 3.1 SCHEMATIC OF THE EXPERIMENTAL APPARATUS ......................................................... 30
FIGURE 3.2 PICTURE OF THE EXPERIMENTAL APPARATUS .............................................................. 32
FIGURE 3.3 PT PHASE DIAGRAM FOR THE COMPOSITION 85%C1, 5%NC4, 10%NC7-MIXTURE 1 .. 35
FIGURE 3.4 PT PHASE DIAGRAM FOR THE COMPOSITION 85%C1, 4%NC4, 11%NC7-MIXTURE 2 .. 35
FIGURE 3.5 PT PHASE DIAGRAM FOR THE COMPOSITION 85%C1, 3%NC4, 12%NC7-MIXTURE 3 .. 36
FIGURE 3.6 PT PHASE DIAGRAM FOR THE RETROGRADE GAS.......................................................... 37
FIGURE 3.7 LIQUID DROP OUT CURVE CALCULATED USING PR EOS AT 730F ................................. 37
FIGURE 4.1 PRESSURE DROP ABOVE AND BELOW DEW POINT FOR BRINE WITHOUT SURFACTANT ... 42
FIGURE 4.2 RELATIVE PERMEABILITY ABOVE DEW POINT PRESSURE .............................................. 43
FIGURE 4.3 RELATIVE PERMEABILITY BELOW DEW POINT – BRINE WITHOUT SURFACTANT ............ 43
FIGURE 4.4 PRESSURE DROP COMPARISON BETWEEN 1000 PPM & BRINE WITHOUT SURFACTANT .. 44
FIGURE 4.5 RELATIVE PERMEABILITY BELOW DEW POINT – 1000 PPM SURFACTANT CASE ............ 45
FIGURE 4.6 RELATIVE PERMEABILITY BELOW DEW POINT – 2000 PPM SURFACTANT CASE ............ 45
FIGURE 4.7 PRESSURE DROP COMPARISON BETWEEN 2000 PPM & BRINE WITHOUT SURFACTANT .. 46
FIGURE 4.8 PRESSURE DROP COMPARISON BETWEEN 5000 PPM & BRINE WITHOUT SURFACTANT .. 47
FIGURE 4.9 RELATIVE PERMEABILITY BELOW DEW POINT – 5000 PPM SURFACTANT CASE ............ 48
FIGURE 4.10 PRESSURE DROP COMPARISON BETWEEN 5000 PPM AND 2000 PPM SURFACTANT ...... 48
FIGURE 4.11 PRESSURE DROP COMPARISON FOR ALL FOUR CASES ................................................. 49
FIGURE 4.12 EFFECT OF SURFACTANT CONCENTRATION ON ΔP AT VARIOUS FLOW RATES ............. 50

viii
FIGURE 4.13 EFFECT OF SURFACTANT CONCENTRATION ON DIMENSIONLESS ΔP (DLPD) ............. 51
FIGURE 4.14 INCREMENTAL REVENUE PER YEAR VS WELL BOTTOM HOLE PRESSURE ..................... 55

ix
NOMENCLATURE
rw = Radius of wellbore
Swi = Irreducible water saturation
So = Spreading coefficient
O = Oil
W = Water
G = Gas
R = Rock
M = Electropositive element
X = Halide
krg = Gas relative permeability
kro = Oil relative permeability
krc = Condensate relative permeability
Nc = Capillary Number
σog = Free energy of oil-gas interface or oil-gas interfacial tension
σow = Free energy of oil-water interface or oil-water interfacial tension
σwg = Free energy of water-gas interface or water-gas interfacial tension

x
ABSTRACT
Natural gas, which accounts for a quarter of world’s energy, has been a major energy source
because of its abundance and less impact on environment. With explorations at higher depth,
pressure and temperature, the share of gas condensate reservoirs to global gas production is
increasing. A unique production challenge associated with these reservoirs is the condensate
blockage problem, which is the buildup of condensate liquid saturation around wellbore as a
result of drawdown below dew point pressure. Mitigation of this problem requires in depth
understanding of the multiphase flow of liquid and gas. Surfactants are well known in the
literature for affecting such multiphase flow characteristics in reservoirs. They affect the flow
behavior primarily by wettability alteration as well as spreading coefficient modification. In this
study, multiphase flow characteristics of gas condensates, with and without surfactants were
observed by running corefloods representing actual reservoir retrograde condensation
phenomena. A commercial anionic surfactant, Alfoterra® 123-4S, was successfully shown to
facilitate condensate removal with relative permeability enhancement of over 17 percent at a
surfactant concentration of 2000 ppm, which was also the optimum concentration under the
flowing conditions. The efficacy of surfactant was observed to be a non-linear function of its
concentration and this is attributed mainly to the pleateauing effect above the critical micellar
concentration (CMC) values.

1
CHAPTER 1: INTRODUCTION
1.1 Background
Natural gas is fast becoming a key energy source and its demand has been rising steadily in the
last few decades. At present, natural gas provides around a quarter of the total energy and is
rapidly catching up with oil as a primary energy source.
From 1973 to 2007, the contribution of oil to the world’s energy supply dropped from 46.1 % to
34.0 %, with the increasing use of natural gas accounting for that decline. Total natural gas
consumption is projected to increase by 44% from 108 trillion cubic feet (tcf) in 2007 to 156
trillion cubic feet (tcf) in 2035 as per International Energy Outlook (IEO) 2010 report published
by US Energy Information Administration (US EIA). Figure 1.1 shows the projection of natural
gas consumption till 2035.
Figure 1.1 Projection of global natural gas demand upto 2035 (Courtesy: U.S. Energy Information Administration/International Energy Outlook 2010)
The popularity of natural gas as an energy source is because of its abundant reserves, less impact
on environment (as it’s the cleanest amongst fossil fuels due to complete burning) and multiple
Quadrillion BTU

2
applications across different sectors. This increased usage of natural gas worldwide is leading to
more long term sales contracts between producers and consumers for various critical applications
and that require accurate forecasting of production performance from these reservoirs. However,
unlike dry gas reservoir engineering computations for gas condensate systems present some
unique challenges and most prominent is the condensate blockage or condensate banking
problem. This phenomenon called condensate banking is the buildup of condensate liquid
saturation around wellbore as a result of drawdown below the dew point pressure. As a result of
this build up, gas flow to the wellbore gets severely restricted eventually leading to the well
getting ceased. Afidick et al. (1994) and Barnum et al. (1995) have reported field cases in which
productivity declined by a factor of two to four as result of condensate blockage. Unfortunately,
some of the world’s huge gas fields are gas condensate reservoirs like Arun gas field in
Indonesia, Shtokmanovskoye in Russia, Karachaganak field in Kazakhstan and Cupiagua field in
Columbia. The importance of gas condensate fields is on the rise due to increased share of gas
produced from these fields amongst global gas production. Gas condensate fields are more
frequently encountered as explorations are taking place at higher depths and higher temperatures
and pressures. Thus understanding the physics of gas condensate buildup, its remediation and the
multiphase flow of gas and liquid is increasingly becoming all the more important.
A typical gas condensate reservoir might exist as a single phase gas at the point of discovery
when the reservoir pressure is above the dew point pressure. As the production continues from
the reservoir, the pressure declines isothermally. When the bottom hole flowing pressure of the
well goes below the dew point pressure, condensation starts occurring. The term retrograde
condensation has been used to describe this anomalous behavior of condensation from gas phase
with isothermal decrease in pressure. Figure 1.2 illustrates this process of retrograde
condensation along the isothermal reservoir depletion line. At point A in the figure, the

3
retrograde gas mixture exists as a single phase gas. On isothermal depletion along the depletion
line shown A-B, the two phase region is encountered below the dew point line. The quality or
isovol lines, depicted by hashed lines in the figure, give the volume by volume ratio of liquid in
the mixture as it undergoes retrograde condensation. As the pressure depletes, more and more
condensates form and liquid volume increases, however, on further decrease of pressure,
revaporization occurs. This can be seen from the isovol lines intersecting the depletion line twice
inside the phase envelope. Though this revaporization would supposedly counter the condensate
blockage but this would occur very late in the life of a reservoir.
Figure 1.2 Phase envelope of typical gas condensate mixture (Courtesy: http://www.glossary.oilfield.slb.com)
This condensate accumulation starts around the wellbore and gradually propagates radially into
the reservoir. Fevang et al. (Figure 1.3) showed that three regions (in a typical process) are
Reservoir Temperature
A
B

4
created around the wellbore. A near well region I where both gas and condensate flow, an
intermediate region II where condensate builds up but is unable to flow as it is below the critical
saturation, outer region III that contains only single phase gas.
Figure 1.3 Flow regions for a radial well producing from a gas cond. reservoir (Courtesy: Fevang et al. -1995)
As the reservoir pressure falls below the dew point pressure, the region II extends well into the
reservoir. Region I also extends by extending into region II. Thus the curve shifts to the right
with time. This condensate banking around wellbore results in restricted flow of gas into the well
Dew Point Pressure
Decreasing Pressure

5
bore and thus gas productivity declines. For a given producing condition, one or two regions may
exist.
Various methods have been proposed in the literature for remediation of this condensate banking
problem. Prominent among them are managing the drawdown pressure to keep the well bottom
hole pressure above the dew point pressure, methanol injection, gas recycling, hydraulic
fracturing etc. These methods have been applied with limited success as their results are
temporary24.
Altering the wettability of the region to intermediate wet by use of surfactants is seen as a
permanent solution to this problem. It is believed that such wettability alteration will reduce the
liquid saturation near the wellbore but field tests with reservoir fluids have been scarce to
quantify such effects. Some have also worked on the spreading coefficient modification in
relation to critical condensate saturation but as in the case of wettability alteration, the
quantification of the effect of such treatments with reservoir fluids has been sparse.
1.2 Objective
The spreading coefficient is used to describe fluid-fluid interactions. It signifies the imbalance of
the fluid interfacial/surface tensions at water-oil, oil-gas and water-gas interfaces. The spreading
coefficient can be either positive or negative. For the water-oil-gas system, the oil spreading
coefficient So can be defined as below:
ogowwgoS σσσ −−=
Where, σwg is the water-gas interfacial tension, σow is the water-oil interfacial tension, and σog is
the oil-gas interfacial tension. The defining equation of the oil spreading coefficient is also
displayed in Figure 1.4.
‐‐‐‐‐‐‐‐‐‐‐‐‐‐‐Equation 1

6
Figure 1.4 Schematic depiction of the spreading coefficient (Courtesy: Rao et al. -2007)
If the spreading coefficient is positive (So >0), it denotes that one of the tensions is larger than
the sum of the other two and results in the total spreading of that fluid over the others, forming a
continuous fluid layer; if it is negative (So <=0), non-spreading occurs and will lead to fluid
lenses with a definite contact angle against the other two fluids.
Wettability states of reservoir rocks, water-wet or oil-wet, also lead to difference in spreading
behavior. Figure 1.6 illustrates the distribution of water, oil and gas in the reservoir rock for two
wettability states.
Figure 1.5 Oil-Water-Gas distributions in O/G/W/R systems
(Courtesy: Rao et al. -2007)
In case of water-wet rock surface, So >0 leads to oil spreading between gas and water while So
<0 leads to oil lenses floating on the gas-water interface. On the other hand, if it is oil-wet, So >0
leads to oil isolating gas and water by spreading between them and So <0 leads to the flow of gas
σwo
σog
σwg Water
GasOil
ogowwgoS σσσ −−=

7
and water phases as discreet globules entrained in the oil phase. In case of intermediate wet
behavior, thin continuous oil film is likely form along the entire length of flow channel
facilitating its flow.
The objective in this study is to understand this flow behavior effects caused by surfactants in
relation to retrograde condensate reservoir that exhibit condensate blockage problem. The flow
behavior effects are characterized by conducting core flood experiments with and without
surfactants. In situ retrograde condensation is effected in the core flood experiments by designing
and building in house the core flood apparatus.
1.3 Methodology
Core flood experiments were conducted with and without surfactants to quantify the effect of
surfactants in the flow behavior of gas condensates. This involved designing an experimental
setup to create the in situ retrograde phenomenon that takes place in gas condensate reservoirs
producing at bottom hole conditions below dew point pressure. A retrograde gas mixture
composition that would undergo the condensation process in the experimental conditions was
also generated using CMG-WinProp. Surfactants were administered during the saturation phase
of the core and its effect was observed on the flow behavior of gas condensates. Series of
experiments with increasing concentration of surfactants was carried out.

8
CHAPTER 2: LITERATURE REVIEW
This project is on surfactant induced flow behavior effects in case of gas condensate reservoirs.
The literature on this area have been thoroughly investigated and reported in following
categories.
2.1 Deliverability Reduction in Gas Condensate Reservoirs
Gas condensate reservoirs are a special class of their own as they produce both gas and
condensate in sizable quantities. Gas condensate reservoirs contain only single phase gas at the
point of discovery when the initial reservoir pressure is above the dew point pressure of the gas.
However, as the production continues the reservoir pressure declines and goes below the dew
point pressure. This results in condensation of the heavier components from the gas stream and is
termed as retrograde condensation. For this retrograde condensation to happen, the temperature
of the gas has to be between the critical temperature and the cricondentherm. This well known
retrograde condensation leads to severe deliverability loss in a gas condensate well. The
phenomenon of retrograde condensation is seen when the flowing bottom hole pressure of the
well falls below the dew point pressure with the reservoir pressure still above it. This causes the
buildup of liquid condensate ring around the wellbore and leads to severe loss in gas phase
relative permeability. This phenomenon has been known in the industry as “condensate banking”
and is known to decrease the well productivity severely. A glaring example of condensate
banking effects is in Arun field in Indonesia. Here a maximum liquid dropout of 1.1% by volume
led to productivity decline as high as 50%, as reported by Afidick et al. (1994)
Flow regions: As discussed by Fevang and Whitson (1996), gas condensate flow and
saturation distribution in gas condensate reservoirs can be conceptually classified into three
regions (as shown in Figure 1.4):
• Region 1: A near-well region where both gas and oil flow.

9
• Region 2: A two phase condensate buildup region where only gas is flowing.
• Region 3: A region containing only single phase gas.
For a given producing condition, one, two or all three regions may exist. These three regions
define pseudosteady state flow conditions, meaning that they represent steady state conditions at
a given time but that these steady state conditions change gradually during depletion.
Region 1: A near-well region where the gas and oil flow is in steady state. This region has
pressure below the dew point pressure and the condensate saturation is high, at or above the
critical saturation, which makes both gas as well as condensate phases mobile. The flowing
composition within region 1 is constant throughout.
Region 2: This is the intermediate region where the pressure is slightly below dew point
pressure and the condensate buildup starts. Saturation remains very low but increases in time,
however, the condensate saturation is below the critical saturation and hence condensate flow
does not occur. Here the gas flows at reduced flow rate.
Region 3: Beyond region (2) there is an outer region where pressures are above the initial
dew point pressure and no condensate saturation is found here. This region has single phase
gas only which forms the sole mobile phase.
Danesh et al. (1988) carried out micro model and core studies of the flow of gas condensates and
the phenomena of retrograde condensation. Through micro model studies they observed that the
initial formation of condensate in reservoir pores below dew point is a film wise process
maintaining hydraulic continuity throughout the pores. The occurrence of condensate film flow
and the low value of interfacial tension below dew point in retrograde condensation region lower
the significance of capillarity relative to gravitational and viscous effects. He also observed that
the minimum condensate saturation for the downward flow of condensate may be quite low
especially in high permeability rocks.

10
Cvetkovic et al. (1990) carried out rich gas condensates reservoirs (specific gravity >0.75)
production studies. Their conclusion from simulation studies was that gas condensate can
significantly affect the relative permeability to gas. However one of their claim that condensate
problem is not significant for lean gas is not commensurate with the productivity loss field
example from Arun field in Indonesia, which has maximum liquid dropout of only 1.1% while
experiencing a 50% drop in gas productivity with an average reservoir pressure of 7100 psia and
temperature of 3520F, reported by Afidick et al. (1994).
Barnum et al. (1995) has presented a case history of a well producing retrograde gas that ceased
production below dew point pressure. Two case studies have also been presented which exhibit
productivity index reduction due to condensation ranging from 20% to 50%. The field data
analyzed suggested gas recoveries below 50% are limited to reservoirs below 1000 mD-ft.
Novosad (1996) carried out simulation studies and found that a near well liquid bank, far in
excess of that given by fluid retrograde curve, forms within hours of bottom hole flowing
pressure falling below the saturation pressure. This is the case for lean as well as rich fluids
regardless of reservoir permeability.
2.2 Relative Permeability Studies
Relative permeability is a measure of the relative conductivity of a phase through a porous
medium in the presence of other fluids and or phases. It is defined as the ratio of the effective
permeability to the absolute permeability of the porous media. Relative permeability is a very
important parameter in understanding relative ease of fluid flow through the porous media when
multiple phases are competing to flow simultaneously.
There are two broad ways, viz., steady state and unsteady state methods19, in which the relative
permeability of a porous medium to fluid phases can be determined. The steady state method for
a two phase fluid system basically involves injecting two phases at a certain volumetric ratio

11
until stabilization of both the pressure drop across the core and the effluent volumetric ratios.
The saturations of the two fluids in the core are then determined, typically, by weighing the core
or by performing mass balance calculation for each phase. Individual relative permeability data
are calculated from the direct application of Darcy’s law. Even though the calculation of relative
permeabilities is rather simple, the entire process can be time consuming, as the time required for
achieving a steady state may be inordinate. Additionally, if mass balance is used for the
determination of saturations, the procedure involves repeated removing and mounting of the core
samples after every step that can lead to fluid loss and damage to the core during the disassembly
and reassembly process causing errors in the measure saturations and resulting relative
permeabilities.
The unsteady state method is primarily based on the interpretation of an immiscible displacement
process. For a two-phase system: basically a core that is either in the preserved state or restored
state after cleaning and aging, at the saturation conditions that exist in the reservoir, is flooded
with one of the displacing phases. Typically, the flood phase is gas (for gas-oil relative
permeability) or water (for oil-water relative permeability) since in the reservoir one or the other
of these phases displaces the oil. For the determination of relative permeability data from the
unsteady method, two different methods can be used for the calculation of water saturation: the
alternate method and the Johnson-Bossler-Neumann method also known as the JBN method.
Buckley and Leverett developed in 1955 the equations governing the displacement of one fluid
by another in a porous medium. They assumed linear, incompressible flow and negligible
capillary forces. Ten years later, Welge presented a method based on Buckeley Leverett theory to
calculate the saturations and the ratio of relative permeabilities of the displacing phase and
displaced phase.

12
Asar et al. (1988) conducted coreflood experiments using methane-propane mixtures to
understand the effect of interfacial tension on gas-oil relative permeabilities. The experiments
were conducted near the saturation pressures to get interfacial tensions over a range. They
concluded that the relative permeability curves approach straight line curves when the fluids
approach miscible conditions, marked by IFT values approaching zero. They observed steeper
decrease in oil relative permeability compared to gas relative permeability as the IFT values
increased. They also noted that the approach of miscibility conditions led to lower residual
saturations for oil and gas phases.
Munkerud (1989) showed that relative permeability curves to the gas condensate model system
in a depletion process are similar to curves of ordinary gas oil systems, and that gravitational
segregation of condensate is pronounced even at liquid saturation below the critical saturation for
flow. He concluded through dynamic displacement experiments of retrograde liquid that the
relative permeability to gas showed strong dependence on interfacial tension between the two
phases.
Haniff et al.(1990) conducted experiments with two component methane-propane gas condensate
system and has found that there exists a critical value of interfacial tension (0.05 mN m-1) below
which capillary forces are negligible and the fluid distribution is such that the liquid spreads
along the pore walls and gas occupies the centre of the pores. He says in conditions of negligible
capillary forces “free surface” of liquid is transported across “surface of seepage thereby
maintaining hydraulic continuity and this is what leads to high recovery of liquid.
Fevang et al. (1996) has identified three regions of flow in gas condensate wells with BHFP
lower than the dew point pressure, namely, Region I with constant flowing composition (GOR)
where both gas and liquid flow simultaneously and this region causes the most of the
deliverability losses, Region II with condensate accumulation but no condensate flow, Region III
13
with gas as single phase only. He states that the primary relative permeability relationship
affecting well deliverability is krg as a function of krg/kro and that saturations do not enter the
calculations.
Blom et al. (1997) measured a series of two phase relative permeabilities at the near-critical
conditions by means of displacement method using methanol/n-hexane system. They have
concluded that relative permeability curves at near critical conditions are strongly dependant on
interfacial tension and flow rate. They observed a clear trend from immiscible to miscible
relative permeability curves with decreasing interfacial tension and increasing flow rate.
Henderson et al. (1998) has conducted steady state relative permeability tests using gas
condensate fluids and have shown that the relative permeability was rate sensitive. The relative
permeabilities of both phases increased as the velocity increased. They observed that at higher
IFT values gas and condensate relative permeabilities were reduced; however the rate effect was
still evident especially for the gas phase and this effect was independent of core effects. They
have attributed the relative permeability rate effect to the process of condensation in conjunction
with the flow characteristics of gas condensate fluids, which leads to the redistribution of fluids
as flow rate increases, with a minimum change in saturation.
Sumnu-Dindoruk et al. (1998) have taken field automation data such as production rate and
recoveries available from field to estimate gas relative permeability as an alternative to
laboratory measured relative permeability data. The relative permeabilities they calculated were
well within the input curves. The data used by them for the relative permeability estimation were
gas and condensate surface production rates, gas in place (GIP), initial pressure (Pi), Connate
water saturation (Swc) and PVT properties.
Whitson et al. (1999) conducted relative permeability measurements and based on steady state
measurements of several gas condensate systems concluded that the key relation defining steady

14
state flow in gas condensate wells is krg as a function of krg/kro. They have found that the effect of
hysteresis is minimal in the fundamental permeability relation krg =f (krg/kro). They have found
that the effect of capillary number on gas oil relative permeability can result in a significant
improvement in gas relative permeability and thus minimizing the negative impact of condensate
blockage.
Mott et al. (1999) used pseudo steady technique for the first time to measure gas condensate
relative permeabilities krg as a function of krg/kro and capillary number. They too reported a
significant increase in relative permeability with velocity. They used depletion technique to
measure gas relative permeability at low flow rates and found that at those rates there was no rate
dependency but they evidenced increased relative permeability with lower IFT.
Chen et al. (1999) carried out core flood experiments on gas condensate flow behavior for two
North Sea gas condensate reservoirs with the objective of measuring the effects of rock and fluid
characteristics on critical condensate saturation as well as gas relative permeability. They used
recombined North Sea gas condensate reservoir fluids from separator oil and synthetic gas for
their experiments. The cores used were composite cores of approximately 29” length made from
2- 3” long core plugs. Their results showed that critical condensate saturation and relative
permeability are sensitive to both flow rate and interfacial tension. Their condensate relative
permeability (krc) results exhibited an unusual convex curvature when plotted against condensate
saturation. They attributed this unusual behavior of reduction in condensate relative permeability
(krc) with increasing condensate saturation to a strong inverse relationship between krc and IFT.
Al-Anazi et al. (2002) conducted steady state two phase core flood experiments in Berea
sandstone and Texas Cream limestone to quantify the loss in relative permeability caused by
condensate accumulation. They have shown that such relative permeability losses can occur in
high permeability reservoirs as well, contrary to the popular notion that condensate blocking
15
around wells in high permeability reservoirs is not significant. Gas relative permeability
reductions of 91% to 95% were seen in 2-5 mD limestone cores and 95% to 98% in 246-378 mD
sandstone cores. They also observed a more severe reduction in gas relative permeability during
two phase flow for higher water saturations than at lower water saturations at a pressure of 1200
psia and temperature of 1450F.
Al-Honi et al. (2004) conducted core flood experiments on gas condensate flow behavior for a
Libyan gas condensate behavior. The results of the test on the reduction in gas permeability due
to retrograde condensate accumulation demonstrated that, in general, the effective permeability
to gas decreased significantly at pressure below the dew point pressure due to condensate
trapping effect in all the core stacks (composite) that were investigated. They noticed that
permeability continued to drop at very low pressures even though theoretically condensate was
to revaporize. The recoveries of the liquid condensate during the vaporization by dry gas
injection at pressures below the dew point pressure were very high. The recovery ranged from
66% to 70% for the high permeability core stack and 86% to 98% for the lower permeability
core stack. They found this recovery to be less than 100% though in theory it is possible to get all
condensate revaporized into the methane gas stream. This discrepancy was attributed to
macroscopic sweep efficiency and mass transfer limitations within the rock matrix.
Ayyalasomayajula et al. (2005) used pseudo steady laboratory core flood experiments with
synthetic fluids coupled with fine scale compositional simulation and showed that condensate
banking is the cause of 60% to 80% loss in well productivity observed in the field. Their
laboratory measured relative permeability showed increasing trend with increase in capillary
number and with increasing values of the krg/kro ratio. However, their data did not show any
trend with the rock quality. They were able to fit their data with the currently available relative
permeability models but were not able to fit the entire range of their data.

16
Bang et al. (2006) made measurements of gas and oil relative permeabilities at high capillary
numbers corresponding to the near well region of high rate gas condensate wells. Gas and oil
relative permeabilities showed strong dependence on capillary numbers at high capillary number
for both sandstones and limestones. They used UT relative permeability to fit their data and
found that the model was able to fit their data over a wide range of capillary numbers, krg/kro
ratio, rock type, fluids, temperatures, permeability and initial water saturation using just one set
of parameters for all the data.
App et al. (2009) measured gas condensate relative permeability for a rich gas/condensate
reservoir using a live, single phase reservoir fluid. They performed two phase flow tests across a
range of pressures and flow rates to simulate reservoir conditions from initial production through
depletion. They also performed a single phase multi-rate experiment to assess inertial or non
Darcy effect. They observed a dramatic increase in both gas and condensate relative
permeabilities with increasing capillary number. They also observed that the measured
condensate relative permeabilities were greater than gas relative permeabilities for rich
gas/condensate fluids at high capillary (Nc) numbers. The measured gas relative permeabilities
were low compared with most gas/condensate systems, which they attributed to the richness of
the fluid samples.
2.3 Treatment of Condensate Blockage
Du et al. (2000) Conducted experiments with gas condensate to evaluate the efficacy of methanol
in restoring gas relative permeability upon retrograde condensation. The methanol was found to
increase the gas relative permeability by a factor of 1.2 to 2.5 depending on the initial water
saturation. They have cited miscible displacement of condensate and water by methanol for this
improvement. They further stated that condensate buildup may not occur as long methanol is in
the pore spaces or even when buildup occurs, the effective permeability would still be higher

17
because of absence of water in the pore spaces. Beneficial effects of methanol are more
pronounced at higher water saturations.
Al-Anazi et al. (2003) conducted field test for methanol treatment on Hatter’s pond field in
Alabama, which showed retrograde condensation behavior. They reported gas and condensate
productivity increase by a factor of 2 for the first four months and 50% thereafter. The increases
in gas and condensate production rates were sustained over at least 4 month period.
Liu et al. (2006) used a relatively cheap chemical WA12, which was also stable at a temperature
of 170o C and salinity of 70000 ppm to alter the wettability of a low permeability rock from
water wittedness to gas wittedness. They observed increase in gas phase relative permeabilities at
residual water saturation by about two times as well as the recoveries and productivities. The
reported decrease of residual water saturation by gas flooding was from 42.38% to 26.77%.
Garzon et al. (2006) carried out laboratory coreflood tests with carbonate cores as well as field
trial with inhibited diesel to evaluate its effectiveness in removing condensate banking. They
obtained improved results in gas relative permeabilities with inhibited diesel in both cases. At
60% MS concentration (vol. /vol.) with diesel they obtained maximum improvement in gas
productivity.
Fahes et al. (2007) carried out experimental investigation to test the effectiveness and durability
of treatment at high temperatures using various treatment chemicals and the effect of wettability
alteration on liquid mobility and gas productivity. They were successfully able to alter the
wettability from liquid wetting to intermediate gas wetting as demonstrated by contact angle and
imbibition tests using chemicals. They observed increased liquid mobility as well as gas
productivity due to wettability alteration. The absorption of new chemicals onto the rock surface
did not decrease the absolute permeability of rock.

18
Liu et al. (2008) carried out pilot study to demonstrate the improvement in gas productivity as a
result of wettability alteration based on experimental studies. They applied a fluorocarbon
surfactant, meant to alter the wettability to gas wetness, to a gas condensate field in Dongpu field
and found significant increase in gas productivity though the increase in gas production did not
sustain long, which they attributed to low permeability and high viscosity of the liquid
condensate.
Bang et al. (2008) carried out core flood experiments using both outcrop sandstone and reservoir
rocks to measure the effect of liquid blocking on gas relative permeability as well as developed a
chemical treatment to reduce the damage caused by blocking by altering the wettability of water
wet sandstone to neutral wet. They used a non-ionic polymeric fluorinated surfactant delivered in
2-butoxyethanol/ethanol and PG/IPA mixtures. They confirmed the wettability alteration after
the chemical treatment by measuring the USBM wettability index of the treated reservoir cores
and notice significant surfactant adsorption of rock surface. They observed improvement in gas
relative permeability by a factor of two in their experiments.
2.4 Phase Behavior Studies
Production from a petroleum reservoir including a retrograde gas reservoir leads to continuous
changes in its state which includes composition, pressure, temperature, quantity, properties etc.
that can be grouped under the umbrella of phase behavior. Phase behavior has a direct impact
again on production and thus it is a cyclical effect. Phase behavior studies have become an
important part of any production process. Following is the compilation of studies carried out by
various authors on phase behavior of retrograde gas reservoir fluids.
Sigmund et al. (1973) carried out a study on the effect of porous media on phase behavior. They
observed that in the packing of the smallest bead size (30-40 US mesh), measured dew point and
bubble point are the same as those measured in the absence of any porous media. They also

19
calculated the effect of curvature on phase behavior for various packings and saturations over a
range of interfacial tensions. The effect was found to be insignificant except at very high surface
curvatures, which were unlikely to exist in reservoirs containing connate water. The saturations
obtained for the assumed differential vaporization process using previously measured volumetric
and phase equilibrium data fell within saturations calculated from observed capillary structures
with the assumption that all the capillary structures had equal curvature and those calculated with
the assumption that they had equal volume.
Whitson (1984) have proposed a new method for calculating critical properties and acentric
factor of petroleum fractions to be used as input to a cubic EOS. This method forces the EOS to
match the measured values of boiling point and molar volume by adjusting critical pressure and
critical temperature. Acentric factor is calculated from a correlation, which is independent of
EOS & accounts for oil type using the Watson characterization factor, using boiling point and
molar volume. The method was tested using PR equation of state and was claimed to match
saturation data and saturation density exactly without using binary interaction coefficients.
Ahmed (1988) reviewed eight equations of state (EOS) models and compared their ability to
predict the volumetric and phase equilibria of gas condensate systems. The EOS models that he
compared were: (1) Peng Robinson (1976), (2) Soave Redlich Kwong (1976), (3) Schimidt-
Wenzel (1980), (4) Usdin-McAuliff (1976), (5) Heyen (1981), (6) Patel-Teja (1981) (7) Kubic
(1983), and (8) Adachi-Lu (1984). For his data source he used ten condensate-hydrocarbon
systems with experimental PVT measurement. He concluded that Schimidt-Wenzel equation
exhibited a superior predictive capability for volumetric properties of condensate systems. The
Peng-Robinson was found by him to accurately represent the phase equilibrium behavior of
condensate systems. For gas compressibility factor predictions, Schimidt-Wenzel and Patel-Teja
both were both found to give reliable estimates by him.

20
Wang et al. (1989) summarized the experiences and developments in the use of EOS’s for
compositional reservoir simulator studies. They have highlighted on the importance of sampling,
laboratory PVT experiments, number of pseudo components and tuning and gave the guidelines
on getting them right.
Sarkar et al. (1991) modified Zudkevitch and Joffe method of determining parameters of an EOS
and applied that to Patel-Teja (PT) EOS (1981). The modified PT EOS was validated against
experimental data of gas condensate systems and compared with other leading EOS by him. His
method uses binary data to determine the temperature dependency of supercritical compounds,
which he states to be more suitable for gas-condensate systems as major constituents in them are
at their super critical states. He has concluded that Modified Patel-Teja (MPT) EOS has
improved ability to predict dew point and the retrograde condensate volume and is a superior
EOS even though it doesn’t use the binary interaction parameters for hydrocarbon systems.
Kokal et al. (2000) presented an experimental phase behavior data for a typical Saudi Arab gas
condensate three phase (water/condensate/gas) system with an aim to quantify the effect of water
on gas condensate fluid properties. Their results indicated appreciable amount of methane and
carbon dioxide partitioning from gas condensate phase to the water phase, making the aqueous
phase acidic. They also observed mass transfer of water into the condensate phase resulting in a
decrease in gas/condensate ratio. They observed slight decrease in dew point pressure with
increasing water/condensate ratio.
Elsharkawy et al. (2000) presented a new method, based on 1200 compositions of gas
condensates collected worldwide, for calculating the gas compressibility factor of gas
condensates at any temperature and pressure. They have presented a new simplistic mixing rule
in case of known composition and specific gravity based correlation otherwise for the calculation
of the compressibility factor. Their study evaluated eight methods for characterizing the plus

21
fraction, three mixing rules and six methods for computation of gas compressibility factor
totaling one hundred and forty four methods of calculation of the compressibility factor of gas
condensates. They have found that Lin-Chao correlation; SBV mixing rule as modified by Sutton
and Dranchuk-Abou-Kassem resulted in the lowest errors and standard deviation with the flip
side that they under estimated the compressibility factor. They claim that their new mixing rule
in conjunction with Dranchuk-Abou-Kassem correlation have overall accuracy of at least 98%.
Ayyalasomayajula et al.(2002) carried out phase behavior study of hydrocarbon-water systems in
presence of methanol (methanol well treatments), which is a common remedy for gas condensate
well blockage, and modeled the data using both PR and SAFT equations of state. They have
found SAFT to be more accurate than its counterpart PR EOS in predicting the data and this they
attributed to SAFT’s explicit accounting of association bonding among polar molecules. They
have found that methanol-water and methanol-hydrocarbon binary interaction coefficients to
play a very important role in phase behavior modeling of these mixtures using both EOS.
Lindeloff et al. (2002) presented work describing the calculation of pressure-temperature
diagram of hydrocarbon-water mixture with polar interactions of aqueous compounds. They
stated that their automatic calculation algorithm can generate complete three phase boundaries
with a hydrocarbon liquid and an aqueous liquid including two phase and multiphase critical
points. Their model calculation indicated that mixture of petroleum fluids may exhibit complex
behavior including multiple three phase regions. This complexity in turn emphasized the need for
thermodynamic models, which could account for hydrocarbon-water interactions.
Arcia et al. (2004) developed a new method to estimate saturation pressure based on dynamic
gradient derivative obtained from in situ wellbore measurement of flowing pressure versus depth
with field examples from east Venezuela. A dispersion of less than 1% was obtained by them
between laboratory derived saturation pressure and the dynamic gradient results. They claim to

22
have successfully applied this method to validate laboratory PVT analysis and for EOS modeling
of condensate systems. Though their method could be used for black oil, volatile oil as well as
gas condensates, it could however be used only for cases where reservoir and bottom hole
flowing pressure are above the saturation pressure.
Pedersen et al. (2004) presents phase equilibrium data for the mutual solubility of brine and a gas
condensate mixture at temperatures ranging from 350C to 2000C and pressures of 700 bar and
1000 bar. Their phase compositions were compared with compositions of the same gas
condensate with pure water measured at the same conditions. They modeled their experimental
data with SRK and PR EOS with Huron and Vidal mixing rule. They observed that the dissolved
salts reduced the gas solubility in water. They also observed that the water content in
hydrocarbon gas in equilibrium with a water phase containing salts can be quite significant at
high pressures and temperatures and is only slightly affected by a salt content of around 3.5
mole%.
Bang et al. (2006) carried out constant composition expansion experiments to measure the phase
behavior of hydrocarbons-water-methanol mixtures upto a temperature of 3000F. They also
measured the effect of temperature, pressure and water and methanol concentration on the phase
behavior. Peng Robinson Equation of state along with Peneloux volume correction and van-der-
Waals as well as Huron-Vidal mixing rules gave successful validation of the data generated
using the hydrocarbon-water-ethanol mixtures. They tuned binary interaction parameters to fit
the data and found that the binary interaction parameters showed a linear trend with temperature.
They observed that the addition of methanol increased the liquid volume fraction and the dew
point pressure and addition of water though resulted in the formation of a third phase but the
ratio of hydrocarbon liquid volume to vapor phase volume and dew point pressure changed very
little. Addition of methanol to hydrocarbon-water mixtures resulted in reduction of dew point

23
pressure and significant increase of aqueous phase volume but on the other hand addition of Iso
propanol increased the hydrocarbon liquid phase volume fraction rather than aqueous phase
volume fraction.
Thomas et al. (2006) have reviewed and proposed techniques for sampling and characterization
for minimizing the errors involved in these steps. They have concluded that multi-rate sampling
is the best method to use in sampling fluids since the liquid yield changes as the function of rate.
They stressed of the need to have prior information of the condensate-gas ratio as a function of
the flow rate and the samples used in recombination should correspond to the highest liquid-yield
sample set. Bottom hole sampling was advised to address any concerns of liquid-solid
separation. The importance of path-dependence was shown to be significant when creating
equilibrium phases below saturation pressure for use in quantifying phase interference. The
differences in API gravity of liquids in solution were quantified to be as much as 10 degrees with
MW differences over 110 Daltons.
2.5 Surfactants
Surfactants, short for surface active agents, are polar, amphiphilic molecules (presence of both
hydrophilic head group as well as hydrophobic tail groups) that are classified on the basis of the
charge of the hydrophilic group present in them. The four categories38 are:
I. Anionic: Hydrophilic group carries a negative charge such as carboxyl (RCOO- M+),
sulfonates (RSO-3 M+), or sulfate (ROSO-
3 M+).
II. Cationic: Hydrophilic group carries a positive charge such as quaternary ammonium
halides (R4N+X-).
III. Nonionic: Hydrophilic group carries no charge but derives its water solubility from
highly polar groups such as polyoxyethylene group such as (-OCH2 CH2O-), sugars or
similar groups.

24
IV. Amphoteric (or Zwitterionic) : wherein molecule carries a positive and negative charge
on the principal chain as opposed to counter ion (M+ or X-) such as sulfobetaines
(RN+(CH3)2 CH32 CH32 SO3-).
Surfactants are known to act on the interfaces between immiscible oil/water/gas phases as well as
their interfaces with rock surfaces. They tend to decrease their interfacial tensions between the
phases by aggregating at the interfaces while orienting their hydrophilic head groups and
hydrophobic tail groups perpendicular to the interfaces and thereby bonding the phases together.
Trogus et al. (1977) carried out surfactant adsorption studies with a class of polyoxyethylenated
nonylphenols surfactants. They concluded that relative adsorption levels for non-ionic and
anionic surfactants could be modeled using a second order reversible rate expression that
reduced to a Langmuir type adsorption isotherm at equilibrium. They found that the adsorption
levels for the non-ionics and anionics to be of comparable magnitude. Adsorption increased
sharply as the concentration increased and leveled off to a nearly constant value at the critical
micelle concentration for both the anionics and the non-anionics. They noted that the level of
adsorption decreased with increased molecular weight for the non-ionics, which was opposite to
what was seen with the anionics. When adsorption was based on unit surface area, the plateau
values were independent of adsorbent and type of experiment for the non-ionic surfactants. The
adsorption of the non-ionic surfactants was ascribed to hydrogen bonding mechanism with the
terminal OH group interacting with appropriate sites.
Asar et al. (1988) carried out coreflood studies with methane/propane system to determine the
effect of IFTs on gas/oil relative permeabilities. IFT was varied from 0.03 to 0.82 dynes/cm by
changing the pressure or the composition of the experiment near the critical region of the
methane/propane system at a constant temperature of 70oF. They observed that the curves of
individual relative permeabilities (krg and kro) vs. gas saturation tend to straighten and approach

25
the 45o line as IFT approached zero. Relative permeability to oil decreased more rapidly
compared with the relative permeability to gas as IFT was increased. They also observed that the
residual gas and oil saturations were higher with higher IFTs. The gas saturation at which
individual relative permeability curves intersected was higher as the IFT decreased indicating a
decrease in the oil-wet character of the system. Saturation hysteresis was not observed to be
significant at intermediate IFTs in this case. They have further opined that the relative gas and oil
permeabilities for gas condensate reservoirs corresponded to a normal gas/oil system except at
conditions close to critical. They also concluded that at low IFTs near the critical point, liquid
could flow at low liquid saturations in condensate reservoir.
Kwok et al. (1993) conducted an experimental study to examine the propagation with adsorption
of an anionic surfactant in un-fired Berea sandstone cores. They also studied the effects of
sodium chloride concentration, pH, flow rate, surfactant concentration and the presence of a
liquid crystal phase on the rate of surfactant propagation. They concluded that at low surfactant
concentrations, the effect of sodium chloride concentration on surfactant concentration and
propagation was significant with increased surfactant adsorption as the sodium chloride
concentration increased. By increasing the pH of the surfactant slug, the surfactant loss was
reduced by 30%. They also observed that, at a given sodium chloride concentration and
surfactant concentration, the surfactant loss decreased as injection flow rate increased. They
observed the formation of a liquid crystal phase at high surfactant concentration and a narrow
range of sodium chloride concentration. This phase resulted in a higher apparent viscosity,
increased pressure drop and significant surfactant retention in the core attributed to the formation
of viscous fingers at the tail of the surfactant slug.
Mannhardt et al. (1994) carried out adsorption studies on representatives of four classes of
surfactants suitable for foam flooding on Berea sandstone at different conditions of temperature

26
and salinity. Anionic surfactants AOS 1416 and IOS 1518 did not absorb from low salinity
(0.5% NaCl) brine. Adsorption of both surfactants increased with increasing brine salinity and
divalent ion content. Experiments with anionic surfactant LXS 810 showed that ion exchange of
clays and surfactant micelles could cause precipitation in the porous media, even when the
surfactant was completely soluble in the injected brine. The amphoteric surfactant Stepanflo 60
was the most soluble of the tested surfactants and adsorbed much more strongly on sandstone
than the anionic surfactants. Within the anionic surfactants they observed increasing adsorption
with decreasing surfactant solubility.
Tang et al. (2002) carried out relative permeability studies on Berea and Chalk cores before and
after alteration of wettability from strong liquid wetting to intermediate gas wetting for gas/oil
and gas/water fluids using polymers FC-722 & FC-759. They used n-decane as the oil phase,
0.2% (wt) NaCl brine as the water phase and air as the gas phase for their experimentation. They
observed significant liquid phase mobility as a consequence of intermediate gas wettability.
Hirasaki et al. (2004) worked on the surface chemistry of oil recovery from fractured oil-wet
carbonate formations. They observed that calcite, which is normally positively charged at neutral
pH, could be made negatively charged through the presence of NaHCO3/Na2CO3 in the brine.
The wettability of the crude-oil/brine on a calcite plate was a function of aging time. After 24
hours, the plate was oil-wet regardless of whether the aging in crude oil was at room temperature
or at 80oC. The degree of wettability alteration with alkaline surfactant system that they observed
ranged from preferentially water to intermediate wet and was a function of the prior aging
temperature in crude oil. They demonstrated oil recovery from oil-wet dolomite cores by
spontaneous imbibition with an alkaline anionic surfactant solution.
Seethepalli et al. (2004) investigated the interactions of dilute alkaline anionic surfactant
solutions with crude oil on carbonate mineral surfaces. They conducted wettability, phase

27
behavior, interfacial tension as well as adsorption experiments. They observed that the anionic
surfactants (SS-6656, Alfoterra-35,36,37,38) could change the wettability of the calcite surfaces
to intermediate water wet condition as well as or better than the cationic surfactant ( DTAB with
a west Texas crude oil in presence of Na2CO3 ). The anionic surfactants were also observed to
lower the IFT with a west Texas crude oil to very low values. They observed that the adsorption
of sulfonate surfactants was reduced significantly by addition of Na2CO3.
Fahes et al. (2007) conducted core flood studies on sandstone cores of high and low permeability
range upon wettability alteration to intermediate gas wetting at a high temperature of 140oC.
They have concluded that wettability could be permanently altered from liquid-wetting to
intermediate gas-wetting at high reservoir temperature of 140oC. Wettability alteration had a
substantial affect on increasing liquid mobility as well as gas productivity at reservoir conditions.
They did not find the effect of wettability alteration on the absolute permeability of the system.
Panga et al. (2007) tested 41 chemicals using contact angle and imbibition test to select
appropriate chemicals for flow tests to analyze its effect on removing water and condensate
blockage permanently. The chemicals were observed to have altered the wettability of the cores
studied and have recommended chemical A5 for water block prevention when diluted in brine.
They however found that the same chemical when dissolved in organic solvents like methanol
and IPA and injected at high temperature gave poor cleanup, which they suspected may be
because of the precipitation formed at the injection surface. This precipitation was not observed
when the same system was used at low temperature.
Xu et al. (2008) conducted experimental measurements of IFT and contact angle at high pressure
and high temperatures to determine the effect of surfactants on oil/water interfacial tension and
wettability in crude-oil/brine/rock systems at reservoir conditions. Drop shape analysis (DSA)
and Dual drop dual crystal (DDDC) techniques were used for measurement of IFT and contact

28
angle respectively on live oil as well as stock tank oil at reservoir conditions. They observed a
dynamic IFT behavior between crude oil and brine, which they ascribed to the presence of polar
components such as asphaltenes in the crude oil or added surfactants and adapted a four-stage
model to describe the process. They observed that all concentrations of anionic surfactant
(ethoxy sulfate) altered the wettability of strongly oil-wet stock-tank-oil/brine/dolomite system to
a less oil-wet state. The anionic surfactant was also observed to alter the wettability of initially
weakly water-wet live-oil/brine/dolomite system to a strongly oil-wet state. In case of non-ionic
surfactant (ethoxy alcohol) they did not see any significant influence on the strongly oil-wet
stock-tank-oil/brine/dolomite system, however, the same surfactant altered the wettability from
water wet to intermediate wet in case of live-oil/brine/dolomite system.
Kumar et al. (2008) studied the mechanisms of wettability alteration by crude oil components
and surfactants. Contact angles were measured on mineral plates treated with crude oils, crude
oil components and surfactants and those mineral surfaces were also studied with atomic force
microscopy. They concluded that the wettability was controlled by the adsorption of asphaltenic
components as the force of adhesion for minerals aged with just the asphaltene was similar to
that of the whole oil. Both anionic and cationic surfactants were found to help imbibe water into
initially oil wet capillaries. Among the surfactants studied by them, the imbibition was the fastest
with Alf-38 and slowest in case of DTAB. Force of adhesion and contact angle measurements by
them showed greater wettability alteration potential by the anionic surfactants compared to the
cationic ones studied by them. However, the water imbibition rate did not increased
monotonically with the increase in the surfactant concentration.
Zheng et al. (2010) measured both the spreading coefficient and wettability to characterize the
influence of anionic and nonionic surfactant on interfacial behavior. The contact angles were
measured using Dual Drop Dual Crystal (DDDC) technique interfacial tensions were measured

29
using Drop Shape Analysis (DSA) and Capillary rise technique. The experiments were
performed at ambient conditions by using stock tank condensate sample, methane, synthetic
reservoir brine and quartz substrate and test indicated their system to be strongly oil wet with an
advancing contact angle of 152o. Though they obtained positive spreading coefficient for
condensate/brine system with or without surfactant, it decreased after surfactant application
showing oil recovery still enhanced from surfactant usage in their strongly oil-wet system. They
reported wettability alteration from strongly oil wet to intermediate oil wet using anionic
surfactant, however, not alteration was noticed with nonionic surfactant.

30
CHAPTER 3: EXPERIMENTAL APPARATUS AND PROCEDURE
3.1 Experimental Apparatus
Figure 3.1 Schematic of the experimental apparatus
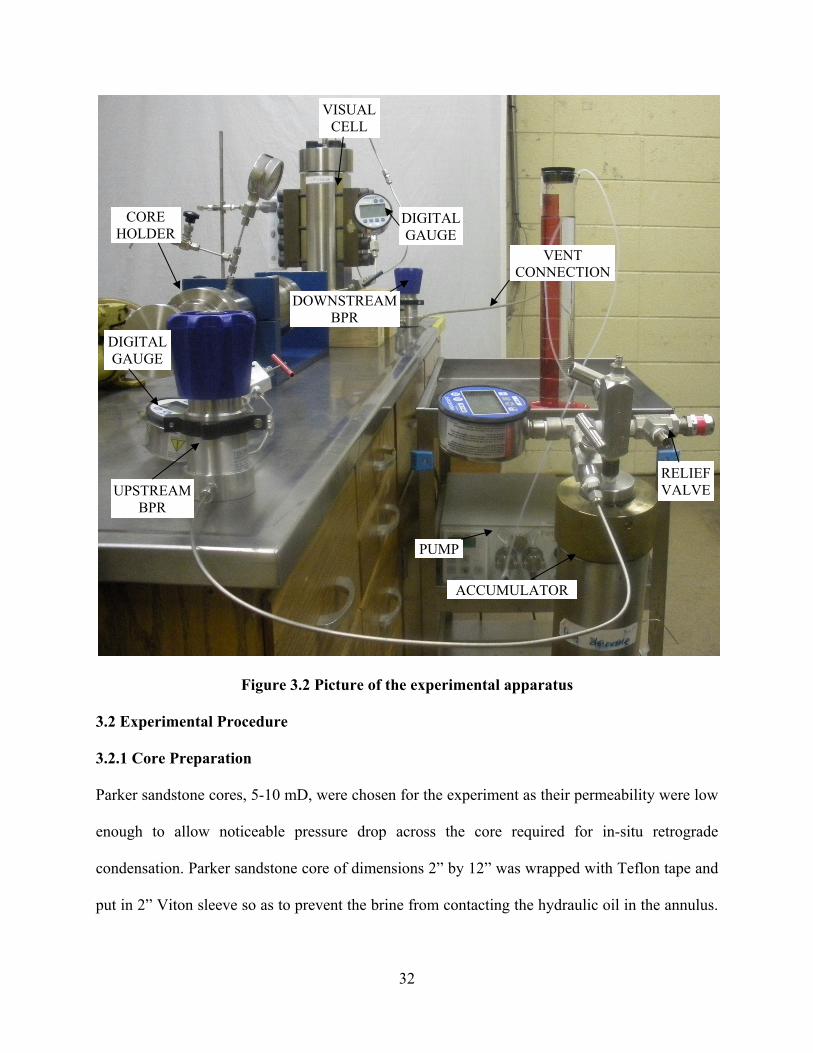
Figure 3.1 shows the schematic of the experimental apparatus. The photograph of the same is
shown in figure 3.2. This apparatus has been designed and built in house by procuring the
components listed in the section below from their respective vendors. The apparatus is capable of
withstanding reservoir conditions of temperatures (250°F) and pressure (5000 psi). The design of
the apparatus aimed to effect retrograde condensation within the core system by the process of
dynamic flashing. This has been achieved by means of two back pressure regulators (BPR)
connected at the upstream and downstream ends of the core with the upstream BPR set above
and the downstream BPR set below the dew point pressure of the gas mixture. A relief valve was
incorporated along with the other valves assembly in the accumulator for it to operate safely
under the prevailing high pressure conditions. The relief valve was set at 4400 psia so as to
VC
To Vent
Atm. pr.
BPR
Pr. Ga.
TV
Legends: WP=Water Pump HP=Hand Pump TV=Transfer Vessel BPR=Back Pressure Regulator
VC= Visual Cell WR=Water Reservoir Pr.Ga. = Pressure Gauge
Retrograde gas mixture
WR
W P
Water
Pr. Ga.
Drain
HP
BPR BPR
CORE
E
Pr. Ga.
Pr. Ga.
BPR
Pr. Ga.
TV
Legends: WP=Water Pump HP=Hand Pump TV=Transfer Vessel BPR=Back Pressure Regulator
VC= Visual Cell
WR=Water Reservoir Pr.Ga. = Pressure Gauge
Retrograde gas mixture
WR
W P
Water
Pr. Ga.
Drain
HP
BPR BPR
CORE
E
Pr. Ga.
Pr. Ga.
To Vent

31
protect the accumulator, which is rated at 5000 psia. A vent connection system was also put in
place to take the highly inflammable hydrocarbon gases out of the laboratory. A visual cell was
also connected in line to be able to observe the condensate being carried over by the gas. Highly
precise digital test gauges were used with the system. The components of the apparatus are as
listed below:
A. Core holder: A Core Holder from M/s Phoenix instruments, rated for 5000 psi model LSU-
HAS-2x12-5k-02.
B. Back pressure regulator: Back pressure regulators from M/s Tescom rated for 0-6000 psi,
model 26-1700 series.
C. Liquid pumps: A constant rate water pump with flow accuracy of 0.001 uL from GMI Inc.,
rated for 12 ml/min at 6000 psi, model Lab Alliance Series 1500 and a high flow rate high
pressure liquid pump from Maxpro Technologies, rated for 12470 psi, model PP 72 SHL
were used.
D. Gas hand pump: A piston screw hand pump from M/s Ruska rated for 10000 psi.
E. Flow meter: An industrial gas mass flow meter from M/s Brook’s instruments, rated 0-5000
sccm & 4500 psi, model 5860i.
F. Accumulators: High temperature and high pressure accumulators (transfer vessels) from
M/s Temco rated for 5000 psi, models CFR-50-200-HC-T-350, CFR-50-200-SS-350.
G. Digital pressure gauges: Digital pressure gauges from Ashcroft rated for 0-5000 psi and 0-
7000 psi, model 2089.
H. Visual cell: High temperature and high pressure visual cell rated for 6000 psi and 4000F.
I. Relief Valve: High pressure relief valves from Swagelok set and locked at 4400 psia using
metal clip.
32
Figure 3.2 Picture of the experimental apparatus
3.2 Experimental Procedure
3.2.1 Core Preparation
Parker sandstone cores, 5-10 mD, were chosen for the experiment as their permeability were low
enough to allow noticeable pressure drop across the core required for in-situ retrograde
condensation. Parker sandstone core of dimensions 2” by 12” was wrapped with Teflon tape and
put in 2” Viton sleeve so as to prevent the brine from contacting the hydraulic oil in the annulus.
CORE HOLDER
PUMP
UPSTREAM BPR
DOWNSTREAM BPR
VENT CONNECTION
ACCUMULATOR
VISUAL CELL
RELIEF VALVE
DIGITAL GAUGE
DIGITAL GAUGE

33
This wrapped core was placed inside the core holder taking care not to damage the “O” rings in
the core holder body.
3.2.2 Saturation of the Core
The core was saturated by pumping brine at a very low flow rate, 30 ml/hr, into the vacuumed
core and the pressures at both the ends of the core were noted. The level in the measuring
cylinder (pump reservoir) was also noted with time. The point at which the pressures at both
ends of the core equalized indicated the pore volume of the core. Brine was pumped into the
saturated core at three different flow rates of 120ml/hr, 240ml/hr and 480ml/hr and the
corresponding stabilized pressures were noted to calculate the absolute permeability of the core.
The core was then kept saturated at 1000 PSI for 48 hrs.
3.2.3 Establishing Irreducible Water Saturation (Swi)
The core system was placed vertically and methane gas was injected at a very low flow rate, 20
ml/hr, with the brine displaced from bottom until no more brine came out. The volume of brine
drained was noted. This enabled the calculation of irreducible water saturation in the core.
3.2.4 Artificial Retrograde Gas Condensate Mixture Preparation
A proper retrograde gas is vital to the success of the experiment. Because of understandable
difficulties in the procurement of retrograde gas samples from the field, an effort was made in
this study to get a suitable retrograde gas mixture by artificially combining the respective
constituents in an appropriate proportion. In order to avoid the purchase of a big and expensive
oven, the mixture needed to have the retrograde region of sufficient liquid dropout at the ambient
temperature. CMG-developed PVT software WinProp was used to identify the right composition
of the gas mixture that exhibited the retrograde condensation behavior at ambient temperature
and reasonable dew point pressure. The Peng-Robinson EOS within the WinProp software was
used for phase envelope calculation. While trying to formulate the mixture composition, two

34
points were kept in mind: (1) First the phase envelope must have a retrograde region. (2) Critical
point should be as far down as possible of the phase envelope so that the retrograde condensation
occurs at ambient temperature. It was noted that the larger differences in the molecular sizes of
the components caused very large critical pressures. Pure normal alkanes from methane to
decane were considered for the purpose. Various combinations of the components from methane
to decane were considered with different compositions and their respective phase envelopes
generated using CMG WinProp. To illustrate the procedure followed while preparing the
composition Table 3.1 shows the three compositions of methane, n-butane and n-heptane.
Keeping methane composition fixed at 85%, the mole percentage of n-Butane and n-Heptane
were varied and the phase envelopes generated are shown in Figures 3.3 to 3.5. It can be seen
from the phase envelopes that, as the mole percentage of the heavier component, heptane,
increased the critical temperature increased from 55 to 95oF and the phase envelope also
widened. It is seen from these phase envelopes that just by varying the composition of one single
component by a unit mole percentage can drastically change the entire phase properties of the
mixture. Hence, utmost care is called for both the design and preparation of the recombinant
retrograde gas mixture.
Table 3.1 Artificial condensate compositions
Gas Mixture Component Mole Percentage (%) Mole Percentage (%)
Mole Percentage (%)
1 Methane 85 85 85
2 n-Butane 5 4 3
3 n-Heptane 10 11 12

35
Figure 3.3 PT phase diagram for the composition 85%C1, 5%nC4, 10%nC7-Mixture 1
Figure 3.4 PT phase diagram for the composition 85%C1, 4%nC4, 11%nC7-Mixture 2
0
500
1000
1500
2000
2500
3000
3500
-50 0 50 100 150 200 250 300
Pres
sure
(psi
a)
Temperature (deg F)
Ambient Temp.
2-Phase boundary Critical10.0 Liquid volume % 20.0 Liquid volume %30.0 Liquid volume % 40.0 Liquid volume %50.000 Liquid volume %
0
500
1000
1500
2000
2500
3000
3500
4000
-50 0 50 100 150 200 250 300 350
Pres
sure
(psi
a)
Temperature (deg F)
Ambient Temp.
2-Phase boundary Critical 10.0 Liquid volume %
20.0 Liquid volume % 30.0 Liquid volume % 40.0 Liquid volume %
50.0 Liquid volume %

36
Figure 3.5 PT phase diagram for the composition 85%C1, 3%nC4, 12%nC7-Mixture 3
Table 3.2 lists the composition of the final retrograde gas mixture. The PT phase diagram for the
retrograde gas mixture is given in Figure 3.6. The critical temperature obtained using this
composition was ~ 53 oF and the cricondentherm was at 2800F. Hence this mixture exhibited
retrograde condensate behavior at ambient temperature as required for the planned
experimentation. The retrograde region was through the ambient temperature. Figure 3.7 gives
the liquid drop out curve for the mixture calculated using Peng Robinson EOS.
Table 3.2 Artificial condensate composition
Sl. No. Component Mole Percentage (%)
1 Methane 85
2 n-Butane 6
3 n-Heptane 9
0
500
1000
1500
2000
2500
3000
3500
4000
-100 -50 0 50 100 150 200 250 300 350 400
Pres
sure
(psi
a)
Temperature (deg F)
Ambient Temp.
2-Phase boundary Critical 10.0 Liquid volume %
20.0 Liquid volume % 30.0 Liquid volume % 40.0 Liquid volume %
50.0 Liquid volume %

37
Figure 3.6 PT phase diagram for the retrograde gas
Figure 3.7 Liquid drop out curve calculated using PR EOS at 730F
0
500
1000
1500
2000
2500
3000
3500
-50 0 50 100 150 200 250 300
Pres
sure
(psi
a)
Temperature (deg F)2-Phase boundary Critical 10.000 % liquid
20.000 % liquid 30.000 % liquid 40.000 % liquid
50.000 % liquid
Ambient temperature
0.0
5.0
10.0
15.0
20.0
25.0
30.0
35.0
40.0
1000 1500 2000 2500 3000 3500 4000
Liqu
id D
ropo
ut, V
/Vt %
Pressure (psia)
Liq. Vol.
Pd = 3450 psi

38
For the preparation of artificial condensate gas, high purity methane (99.99 %) and normal
Butane (99.999%) were obtained from Airgas Co. and high purity normal Heptane (>99.95%)
was obtained from Fisher Scientific. The mixture was prepared on volume (mole) basis in an
accumulator rated for 7000 psi. The three components were separately transferred to the
accumulator in metered quantity by first transferring to a piston screw hand pump from Ruska
rated for 10000 psi. This was done so as to have finer control in administering the required
amount of the particular component into the accumulator as the hand pump was accurate to
100th of an ml. It was taken care to clean the hand pump and the connecting tubing and valves
thoroughly with acetone and then subsequent vacuuming before the next component was added.
Utmost care was taken to double check the fittings for any possible leakage. After the transfer of
all the components the accumulator was rocked to mix all the components. The pressure of the
accumulator was then raised to above dew point pressure and kept for 12-15 hours for the single
phase mixture to equilibrate. The accumulator was again rocked before starting the core flood
experiments.
3.2.5 Core Flood Procedure of Gas Mixture
Prepared retrograde gas was flooded through the core both above and below the dew point
pressure. For the retrograde gas flood above the dew point pressure, the upstream (of the core)
back pressure regulator (BPR) was set at 3700 psi and the downstream BPR was set at 3500 psi.
The mixture was pumped at three different flow rates (120ml/hr, 240ml/hr, and 480 ml/hr) and
the pressure drops across the core were noted.
For the retrograde gas flood below the dew point, the downstream BPR setting was changed to
3100 psi keeping the upstream BPR setting unchanged. Again the mixture was pumped at the
same three different flow rates and the pressure drops noted. At this downstream pressure the
retrograde mixture flashes downstream of the upstream BPR and the mixture becomes a two

39
phase fluid. This dynamic flashing technique mimicked the actual reservoir phenomena of
retrograde condensation.
3.2.6 Subsequent Retrograde Gas Floods
For subsequent retrograde floods, steps 3.2.1 – 3.2.5 were repeated with the exception that
saturation was carried out with brine containing different concentrations of surfactant. Different
surfactant concentrations used were 1000 ppm, 2000ppm and 5000 ppm. Surfactant used was an
anionic surfactant Alfoterra® 123-4S, provided by M/s Sasol surfactants. Alfoterra® 123-4S
belongs to class of surfactants known as alkyl propoxy sulfates and has 12-13 number of
hydrophobe carbon and 4 moles of propoxy unit. Its mono branched alkyl hydrophobe allows for
greater interaction with the oil phase while maintaining good solubility. This surfactant has been
found to develop intermediate wettability in the core from a concentration as low as 500 ppm
from DDDC measurements by Zheng et.al (2010). The spreading coefficient was also found to
be positive with this surfactant.

40
CHAPTER 4: RESULTS AND DISCUSSION
Sections 4.1 through 4.4 discuss different cases given in Table 4.1. For all the cases listed in
Table 4.1, coreflood of the gas condensate mixture was run both above and below the dew point
pressure for the retrograde gas mixture. Figures 4.1 through 4.5 show the pressure drop versus
time for the three flow rates 120ml/hr, 240ml/hr and 480ml/hr that were used in the
experimentation. Also shown in these figures is the upstream pressure of the core system
observed during the experiment. It is noticed that the pressure drop is the lowest for the above
dew point pressure runs. This is because of the fact that the mixture is a single phase gas and no
retrograde condensation takes place since the pressure is above the dew point pressure. There is
slight undulation in the pressure response and this may be because of the formation and breakage
of ice crystals due to Joule Thompson cooling effect as the gas mixture passes across the back
pressure regulator. The relative permeability value for the gas in the above dew point pressure
case is the highest, being 0.359. Figure 4.2 gives the relative permeability chart for this case.
Table 4.2 lists the initial core properties for a typical core. The permeability of the gas is severely
impaired by the presence of high irreducible water saturation (47.12%) in the tight Parker
Sandstone core (5-10 mD).
Table 4.1 Different cases considered in experimentation
Sl. No. Cases Description
1 Case I Saturation with Brine without Surfactant
2 Case II Saturation with Brine containing 1000 ppm Surfactant
3 Case III Saturation with Brine containing 2000 ppm Surfactant
4 Case IV Saturation with Brine containing 5000 ppm Surfactant

41
Table 4.2 Core properties for a typical core
Sl. No. Item Description/Value
1 Core Parker sandstone
2 Dimensions of the core 2” diameter X 12” length
3 Bulk volume of the core 617.78 ml
4 Pore volume of the core 104 ml
5 Porosity 16.83%
6 Irreducible water saturation 47.12%
7 Absolute permeability of the core 8.64 mD
4.1 Saturation with Brine without Surfactant (i.e. 0 ppm Surfactant Concentration)
Figure 4.1 shows the comparison of pressure drops above and below the dew point pressure for
the case of brine without surfactant. Upstream pressure for the core system is also shown in the
figure. It can be seen that pressure drop for the below dew point case is fairly higher than that of
above dew point case, demonstrating the flow impediment caused by the liquid condensate
dropout in the core due to retrograde condensation. This test clearly demonstrates the occurrence
of in situ retrograde condensation and the restricted flow for the gas condensate mixture. As can
be seen from the graph, there is continued rise in pressure drop with a low slope even at the same
flow rate. This is because of the fact that more and more amount of condensates are being
formed as the retrograde gas mixture undergoes condensation below dew point and this
condensate tends to accumulate in the core system leading to rising trend in pressure drop. Figure
4.2 gives the relative permeability calculation chart for the single phase gas flow at pressure
above the dew point pressure. The relative permeability value got for the single phase gas flow
above dew point was 0.359.

42
Figure 4.1 Pressure drop above and below dew point for brine without surfactant
The gas relative permeability value for this case of brine without surfactant is calculated to be
0.210. Figure 4.3 gives the relative permeability calculation chart for this case of brine without
surfactant. It is noticed that there is a reduction in relative permeability of over 40 percent from
the above dew point case, wherein the relative permeability was 0.359. This relative permeability
reduction leads to severe productivity loss observed with gas condensate wells. An example
economic analysis is given at the end of this chapter incorporating these values of relative
permeability reduction. The economic analysis clearly underscores the loss in revenue to the
petroleum industry as a result of this problem of condensate banking. The following sections
show the improvement to the relative permeability brought about by surfactant.
3050
3060
3070
3080
3090
3100
3110
3120
3130
3140
3150
0
2
4
6
8
10
12
14
16
18
20
0 20 40 60 80 100 120 140 160
Ups
trea
m P
ress
ure,
psi
Pres
sure
dro
p, p
si
Time, minutes
Above Dew Point - BrineBelow Dew Point-Brineupstream pressure
120ml/hr
240ml/hr
480ml/hr

43
Figure 4.2 Relative permeability above dew point pressure
Figure 4.3 Relative permeability below dew point – brine without surfactant
R² = 0.8873
0
2
4
6
8
10
12
0 100 200 300 400 500 600
Pressure drop, psi
Rate, cc/hr
Gas condensate flood above Dew Point
krg = 0.359
R² = 0.8498
0
2
4
6
8
10
12
14
16
18
20
0 100 200 300 400 500 600
Pressure drop, psi
Rate, cc/hr
Gas condensate flood below DP ‐ brine
krg= 0.210

4.2 Satur
Figure 4.
the 1000
with resp
substanti
which is
not able
surfactan
Figu
1
1
1
1
1
2
Pressure drop, psi
ration with
.4 shows the
0 ppm surfac
pect to pre
ial. The gas
still 38 perc
to significa
nt case.
re 4.4 Press
0
2
4
6
8
10
12
14
16
18
20
0 2
AboBeloBeloupst
1
Brine Cont
e comparison
ctant case w
essure drops
relative perm
cent lower t
antly alter t
sure drop co
20 40
ve Dew Point ‐ow Dew Point‐1ow Dew Point‐0tream pressure
20ml/hr
taining 1000
n of pressur
with that of b
s from the
meability in
than the abo
the flow be
omparison b
60
Tim
‐ 1000 ppm sur1000 ppm surf0 ppm Surfactae
44
0 ppm Surfa
re drops abov
brine withou
brine witho
this 1000 p
ve the dew
ehavior of t
between 100
80 10
me, minutes
rfactantfactantant
240ml/hr
actant Conc
ve and below
ut surfactant
out surfacta
ppm surfacta
point case. T
the gas mix
00 ppm & b
00 120
480ml/h
centration
w the dew p
case. There
ant case but
ant case is 0
Thus 1000 p
xture than th
brine withou
140
hr
point pressur
e is improve
t it is not
.221 (figure
ppm surfacta
he brine wi
ut surfactan
3050
3060
3070
3080
3090
3100
3110
3120
3130
3140
3150
160
Upstream
Pressure
psi
re for
ement
quite
4.5),
ant is
ithout
nt
Upstream Pressure, psi

45
Figure 4.5 Relative permeability below dew Point – 1000 ppm surfactant case
Figure 4.6 Relative permeability below dew Point – 2000 ppm surfactant case
R² = 0.9038
0
2
4
6
8
10
12
14
16
18
20
0 100 200 300 400 500 600
Pressure drop, psi
Rate, cc/hr
Gas condensate flood below DP ‐ 1000 ppm Surfc.
krg = 0.221
R² = 0.956
0
2
4
6
8
10
12
14
16
18
0 100 200 300 400 500 600
Pressure drop, psi
Rate, cc/hr
Gas condensate flood below DP ‐ 2000 ppm Surfc.
krg = 0.246

4.3 Satur
Figure 4.
ppm surf
the prese
flow rate
for the b
permeabi
surfactan
Figu
1
1
1
1
1
2
Pressure drop, psi
ration with
.6 shows the
factant case w
ence of surfa
e of 480 ml/h
brine witho
ility of 17.2
nt case.
re 4.7 Press
0
2
4
6
8
10
12
14
16
18
20
0 2
Abo
Bel
Bel
ups
Brine Cont
e comparison
with that of
factant is obs
hr. The gas r
out surfactan
2% is obtain
sure drop co
20 40
ove Dew Point
ow Dew Point
ow Dew Point
stream pressur
120ml/hr
taining 2000
n of pressure
the Brine w
served even
relative perm
nt case. In
ned for the
omparison b
60
Tim
t ‐ 2000 ppm su
‐ 2000 ppm su
‐ 0 ppm Surfa
re
2
46
0 ppm Surfa
e drops abov
without surfac
n though the
meability red
other word
2000 ppm
between 200
80 10
me, minutes
urfactant
urfactant
ctant
240ml/hr
actant Conc
ve and below
ctant. Here,
effect seem
duction is onl
ds, substanti
surfactant
00 ppm & b
00 120
480ml/h
centration
w the dew p
a relatively
ms to taper o
ly 31.4% co
ial improve
case over th
brine withou
140
hr
oint for the
stronger effe
off at the hi
mpared to 4
ment in rel
he brine wi
ut surfactan
3050
3060
3070
3080
3090
3100
3110
3120
3130
3140
3150
160
Pressure
psi
2000
fect to
ghest
41.5%
lative
ithout
nt
Pressure, psi

4.4 Satur
Figure 4.
the 5000
respectiv
pressure
the flow
compared
is also sli
Figu
1
1
1
1
1
2
Pressure drop, psi
ration with
.8 and 4.10
ppm surfac
vely. There
drop respon
rate of 480
d to 31.4% f
ightly higher
re 4.8 Press
0
2
4
6
8
10
12
14
16
18
20
0 2
Ab
Be
Be
up
Brine Cont
show the co
tant case wi
is no signif
nse for flow
0ml/hr. The
for the 2000
r at 18.6% c
sure drop co
20 40
ove Dew Point
low Dew Point
low Dew Point
stream pressu
120ml/hr
taining 5000
omparison o
ith that of br
ficant impro
rates of 120
gas relative
0 ppm surfac
ompared to
omparison b
60
Tim
t ‐ 5000 ppm s
t ‐ 5000 ppm su
t ‐ 0 ppm surfa
re
47
0 ppm Surfa
f pressure d
rine without
ovement ove
0ml/hr and 2
permeabilit
ctant case. T
17.2% for th
between 500
80 10
me, minutes
urfactant
urfactant
ctant
240ml/hr
actant Conc
drops above
surfactant a
er the 2000
240 ml/hr bu
ty reduction
The improvem
he 2000 ppm
00 ppm & b
00 120
480ml/
centration
and below t
and 2000 ppm
ppm surfac
ut there is ta
is marginal
ment in rela
m surfactant c
brine withou
140
/hr
the dew poin
m surfactant
ctant case in
angible effec
lly low at 3
ative permeab
case.
ut surfactan
3050
3060
3070
3080
3090
3100
3110
3120
3130
3140
3150
160
Upstream
Pressure
psi
nt for
t case
n the
ct for
0.6%
bility
nt
Upstream Pressure, psi

F
Figu
1
1
1
1
1
2
Pressure drop, psi
Figure 4.9 R
ure 4.10 Pre
0
2
4
6
8
10
12
14
16
18
0
Pressure drop, psi
0
2
4
6
8
10
12
14
16
18
20
0 2
AbovBeloBeloupst
Relative perm
essure drop
2
krg = 0.249
20 40
ve Dew Point ‐ow Dew Point ‐ow Dew Point ‐tream pressure
120ml/hr
meability be
comparison
4
R
Gas conden
60
Tim
‐ 5000 ppm sur5000 ppm sur2000 ppm sur
e
48
elow dew Po
n between 5
R
6
Rate, cc/hr
nsate flood bel
80 10
me, minutes
rfactantrfactantrfactant
240ml/hr
oint – 5000 p
000 ppm an
R² = 0.9431
8
low DP ‐ 5000
00 120
480ml/
ppm surfac
nd 2000 ppm
10
ppm Surfc.
140
/hr
ctant case
m surfactan
0
3050
3060
3070
3080
3090
3100
3110
3120
3130
3140
3150
160
Upstream
Pressure
psi
nt
Upstream Pressure, psi

49
4.5 Comparative Analysis of Pressure Drops
Figure 4.11 shows the comparison of pressure drops for all the four cases put together. The
closeness in the placement between graphs for 2000 ppm and 5000 ppm surfactant cases implies
that there is not significant incremental effect with higher surfactant concentration above a
surfactant concentration of 2000 ppm. This proximity between the 2000 ppm and 5000 ppm
surfactant concentrations is pronounced till the flow rate of 240 ml/hr, showing its optimum
range of flow conditions for this surfactant concentration.
Figure 4.11 Pressure drop comparison for all four cases
The pressure drops are also plotted with respect to flow rate at different surfactant concentrations
in Figure 4.12. There is visible decrease in pressure drop with respect to concentration at the
various flow rates considered. There is maximum reduction in pressure drop for the 5000 ppm
0
2
4
6
8
10
12
14
16
18
20
0 20 40 60 80 100 120 140 160
Pressure drop, psi
Time, minutes
Above Dew Point ‐ BrineBelow Dew Point‐BrineBelow Dew Point ‐ 1000 ppm surfactantBelow Dew Point ‐ 2000 ppm surfactantBelow Dew Point ‐ 5000 ppm surfactant
120ml/hr
240ml/hr
480ml/hr

50
surfactant case, depicted by its bottom most position on the graph. This plot thus illustrates the
effectiveness of the surfactant in reducing pressure drop, thereby improving relative permeability
of the retrograde gas at all flow rates.
Figure 4.12 Effect of surfactant concentration on ΔP at various flow rates
Figure 4.13 shows the effect of surfactants on dimensional pressure drop. The percentage
decrease in dimensional pressure drop is 6.1%, 14.7% and 16.6 % for the concentrations of 1000
ppm, 2000 ppm and 5000 ppm respectively, considering only the flow rate of 120ml/hr. Both
2000 ppm and 5000 ppm surfactant concentrations are able to affect considerable reduction in
the dimensional pressure drop. Nevertheless, the incremental reduction in dimensional pressure
drop for the 5000 ppm surfactant case over 2000 ppm surfactant concentration is not significant,
hence 2000 ppm serves as the optimum concentration among others. In terms of economics,
0
2
4
6
8
10
12
14
16
18
0 100 200 300 400 500 600
Pressure drop, psi
flow rate, cc/hr
Brine1000 ppm surfactant2000 ppm surfactant5000 ppm surfactant

2000 ppm
chemical
F
The mar
concentra
micellar
only of
Langmui
hydropho
concentra
orientatio
Dim
ension
less Pressure Drop, DLPD
(ΔPbdp/Δ
Padp)
m surfactant
ls.
Figure 4.13
rginal increm
ation may be
concentratio
monomers
ir type. At l
obic tail gr
ation gradua
ons with re
1.1
1.2
1.3
1.4
1.5
1.6
1.7
1.8
1.9
2
0
(ΔPbdp/Δ
Padp)
6
t is a better
Effect of su
ment in the
e explained
on is the thre
and the sur
low concent
roup is alig
ally this align
espect to th
20
Brine
1000 ppm s
2000 ppm s
5000 ppm s
120ml/h
6.1%
14
choice ove
urfactant co
efficacy of
by the conce
eshold conc
rface is und
trations, the
gned with t
nment chang
he surface
40 60
surfactant
surfactant
surfactant
hr
4.7%
51
er 5000 ppm
oncentration
the surfacta
ept of critica
entration be
der saturate
orientation
the surface
ges and surf
causing we
0 80
Time, minu
240m
16.6%
m surfactant
n on dimens
ant despite
al micellar c
elow which t
ed. Adsorpti
of surfactan
. With the
factant molec
ettability alt
100
utes
ml/hr
as surfactan
sionless ΔP
a significan
oncentration
the surfactan
ion on rock
nt molecule
increase in
cules tend to
teration9. A
120
480ml/hr
nts are expe
(DLPD)
nt increase in
n (CMC). Cr
nts are comp
k surface al
e is such tha
n the surfa
o take orthog
bove CMC
140 16
nsive
n the
ritical
posed
lso is
at the
actant
gonal
, the
60

52
surfactants have the tendency to aggregate or form conglomerates called micelles and from here
on the monomer concentration remains relatively constant with increasing surfactant
concentration as the surface saturation has been reached. Table 4.3 gives the summary of the
important results obtained from the experiments.
Table 4.3 Summary of important results
Sl.
No. Parameter Value
1 Dry gas relative permeability above dew point at Swi 0.359
2 Gas relative permeability below dew point for the brine (base) case 0.210
3 Gas relative permeability below dew point for the 1000 ppm surfactant case 0.221
4 Gas relative permeability below dew point for the 2000 ppm surfactant case 0.246
5 Gas relative permeability below dew point for the 5000 ppm surfactant case 0.249
6 Gas relative permeability reduction for brine without surfactant 41.5%
7 Gas relative permeability reduction for the 1000 ppm surfactant case 38.5%
8 Gas relative permeability reduction for the 2000 ppm surfactant case 31.4%
9 Gas relative permeability reduction for the 5000 ppm surfactant case 30.6%
10 Improvement in gas rel. permeability of 1000 ppm surfactant over base case 5.2%
11 Improvement in gas rel. permeability of 2000 ppm surfactant over base case 17.2%
12 Improvement in gas rel. permeability of 5000 ppm surfactant over base case 18.6%
A rising trend in the pressure drop has been observed in the below-dew-point runs at all flow
rates considered. This increasing trend in the pressure drop appears to be due to the increased
liquid dropout occurring with time as the mixture undergoes retrograde condensation at pressures
below the dew point. This is further substantiated by the absence of such a pressure drop increase

53
in the case of above-dew-point runs. The presence of surfactants does help in mitigating this
increased dropout, as can be seen from Figure 4.12 where the pressure drop decreases with
increasing surfactant concentration, but is not able to nullify it completely.
Alfoterra class of anionic surfactants that was used in our experiments was also reported to be a
better agent at wettability alteration on calcite surfaces to intermediate wet compared to cationic
surfactant by Seethepalli et al.44.
It has also been observed through these flow experiments that higher concentration of surfactant
is required than those expected from wettability and IFT measurements (Zheng et al. 54) as a
result of inherent inefficiencies in the delivery and retention of the surfactant.
4.6 Economic Impact Evaluation
To evaluate the economic impact of the enhancement in relative permeability on a representative
well producing retrograde gas, a typical gas composition have been assumed for the gas mixture
as given in Table 4.4. Some typical parameters have also been assumed for the well as given in
Table 4.5.
The rate equation has been solved using pseudo pressure integral method for various cases.
Steady state solution of the diffusivity equation is used. The standard conditions assumed are
Psc=14.7 psia and Tsc=600F. An example calculation for “No blockage case” has been illustrated
below.
Table 4.4 Typical gas composition for the well
Component Mole %
CH4 97.75
CO2 2
N2 0.25

54
Table 4.5 Typical Parameters for the well
Parameter Value Units
k (Permeability) 10 mD
h ( Pay thickness) 100 ft
T (Temperature) 300 0F
re (External radius) 1000 ft
rw (Wellbore radius) 0.25 ft
Pr avg. (Average reservoir pressure) 7000 psia
krg (No blockage) 0.359 -
krg (Before treatment) 0.21 -
krg (After treatment) 0.246 -
Natural Gas Price (Average) 4 $/Mscf
Qg , Mscf /day (Gas flow rate with No blockage):
[Qg, Mscf/day]No blockage = α2 X (kkrgh/T)No blockage X {Pp (Pr avg.) - Pp (Pwf)}/ln (re/rw)
= 0.0007032 X 1.19667 X {2073365523-1660219694}/8.29404964
= 46,084.08 Mscf/day
The gas flow rates obtained for the various cases are given in the Table 4.6.
Table 4.6 Gas flow rate for various cases
Cases Gas flow Rate, Mscf/day
No blockage 46,084.08
Blockage (Before treatment) 26,957.26
Blockage (After treatment) 31,578.50
So, Incremental gas production on treatment is = (31,578.50 – 26,957.26) Mscf/day

55
= 4,621.24 Mscf/day
Incremental revenue per day = 4,621.24 Mscf/day X $4/Mscf
= $18,484.98/day
Incremental revenue per year = $18,484.98/day X 365 days
= $6,747,016.92/year
The above calculations for incremental revenue have been made for a single well bottom hole
pressure of 6000 psi. However, well bottom hole pressure can take any values based on operating
requirements. Figure 4.14 shows the incremental revenue per year with respect to well bottom
hole pressures upto absolute open flow pressure.
Figure 4.14 Incremental revenue per year Vs well bottom hole pressure
$0
$5,000,000
$10,000,000
$15,000,000
$20,000,000
$25,000,000
$30,000,000
$35,000,000
$40,000,000
Increm
ental reven
ue per year, $
Pwf (Well bottom hole pressure), psi
Incremental revenue per year Vs Well bottom hole pressure

56
CHAPTER 5: CONCLUSIONS AND RECOMMENDATIONS
5.1 Summary and Conclusions
Core flood experiments incorporating in-situ retrograde condensation were carried out to
quantify the effect of surfactants on the flow behavior of gas condensates. Two types of
mechanisms by which surfactants impact the flow behavior of the gas condensates: spreading
coefficient modification and wettability alteration. These mechanisms act simultaneously to
affect the primary task of condensate blockage remediation. Series of experiments with
increasing concentration of surfactants were conducted both above and below the dew point and
the salient results obtained have been summarized below.
• A retrograde gas mixture was designed capable of undergoing retrograde condensation at
ambient temperature.
• An experimental apparatus was built in house with the capability of creating in-situ
retrograde condensation.
• Successful condensate removal was observed with anionic surfactant Alfoterra® 123-4S,
provided by Sasol Surfactants, when condensate dropped out from the retrograde gas
mixture with the lowering of pressure below the dew point pressure. A surfactant
concentration of 2000 ppm appeared to be the optimum under the flowing conditions for
the removal of condensates.
• The effect of the surfactant was observed to be a non linear function of its concentration.
This is attributed in part mainly to the plateauing effect in their efficacy above the critical
micellar concentration (CMC) values and to a lesser extent on the suitability of the
particular wettability state of the rock surface to the flow conditions and also to
mechanisms of surfactant adsorption and retention.
57
5.2 Recommendations for Future Work
• Mode of delivery of surfactants in a field scale setting need to be devised so as to
maximize their benefits with minimum of wastage.
• Physics of surfactant retention at fluid/fluid and rock/fluid interfaces need to be better
understood vis-à-vis different rock types and reservoir conditions through wettability,
micro-model, spectroscopy studies etc. so as to be able to screen the right type of
surfactant to suit specific rock types and conditions for enhancing their performance.
• Longer tests need to be conducted with a wide range of flowing conditions to determine
the effect of the durability of surfactant treatment and its applicability.
• Pilot scale studies of the treatment need to be conducted for assessing its application on
field scale.
• Effect of surfactants on flow behavior of gas condensates in limestone reservoir rocks
need to be characterized.
• The temperature and salinity effects on flow behavior induced by surfactant needs be
studied.

58
REFERENCES
1. Afidick, D., Kaczorowski, N.J. and Bette, S.: “Production Performance of Retrograde Gas Reservoir”: A Case Study of the Arun Field”, Paper SPE 28749 Presented at the 1994 SPE Asia Pacific Oil and Gas Conference, Melbourne, Australia.
2. Ahmed, T.H.: “Comparative Study of Eight Equations of State for Predicting Hydrocarbon Volumetric Phase Behavior”, February 1988, SPE Reservoir Engineering.
3. Al-Anazi, H.A., Pope, G.A. and Sharma, M.M. and Metcalfe R.S.: “Laboratory Measurements of Condensate Blocking and Treatment for Both Low and High Permeability Rocks”, Paper SPE 77546 Presented at 2002 SPE Annual Technical Conference and Exhibition, San Antonio, Texas.
4. Al-Anazi, H.A., Walker, J.G., Pope, G.A., Sharma, M.M. and Hackney D.F.: “A Successful Methanol Treatment in a Gas-Condensate Reservoir: Field Application”, Paper SPE 80901 Presented at 2003 SPE Production and Operations Symposium, Oklahoma City, Oklahoma.
5. Al-Honi, M. and Zekri, A.Y.: “Determination of Recovery and Relative Permeability for Gas Condensate Reservoirs”, Paper SPE 88797 Presented at 2004 Abu-Dhabi International Exhibition and Conference, Abu-Dhabi, UAE.
6. App, J.F. and Burger, J.E.: “Experimental Determination of Relative Permeabilities for a Rich Gas/Condensate System Using Live Fluid”, April 2009, SPE Reservoir Engineering.
7. Arcia, E.M., Rodriquez, F. and Madail, W.: “Estimation of Saturation Pressure Through Wellbore Measurements”, Paper SPE 90186 Presented at 2004 SPE Annual Technical Conference and Exhibition, Houston, Texas.
8. Asar, H. and Handy, L.L.: “Influence of Interfacial Tension on Gas/Oil Relative Permeability in a Gas-Condensate System”, February 1988, SPE Reservoir Engineering.
9. Ayirala, S.: “Surfactant Induced Relative Permeability Modifications for Oil Recovery Enhancement”, 2002 Master’s Thesis, LSU.
10. Ayyalasomayajula, P., Sharma, R., Walker, J.G., Sharma, M.M. and Pope, G.A.: “Phase Behavior Modeling of Hydrocarbon-Methanol-Water Mixtures by Peng-Robinson and SAFT Equation of State”, Paper SPE 77770 Presented at 2002 SPE Annual Technical Conference and Exhibition, San Antonio, Texas.
11. Ayyalasomayajula, P., Silpngarmlers, N. and Kamath, J.: “Well Deliverability Predictions for a Low-Permeability Gas/Condensate Reservoir”, Paper SPE 95529 Presented at 2005 SPE Annual Technical Conference and Exhibition, Dallas, Texas.
12. Bang, V., Pope, G.A., Sharma, M.M., Baran, J.R. and Ahmadi, M.: “A New Solution to Restore Productivity of Gas Wells with Condensate and Water Blocks”, Paper SPE

59
116711 Presented at 2008 SPE Annual Technical Conference and Exhibition, Denver, Colorado.
13. Bang, V., Pope, G.A. and Sharma, M.M.: “Phase Behavior Study of Hydrocarbon / Water / Methanol Mixtures at Reservoir Conditions”, Paper SPE 102100 Presented at 2006 SPE Annual Technical Conference and Exhibition, San Antonio, Texas.
14. Bang, V., Kumar, V., Ayyalasomayajula, P.S., Pope, G.A. and Sharma, M.M.: “Relative Permeability of Gas Condensate Fluids: A General Correlation”, Paper SPE 102741 Presented at 2006 SPE Annual Technical Conference and Exhibition, San Antonio, Texas.
15. Barnum, R.S., Brinkman, F.P., Richardson, T.W. and Spillette A.G.: “Gas condensate Reservoir Behavior: Productivity and Recovery Reduction due to Condensation”, Paper SPE 30767 Presented at 1995 SPE Annual Technical Conference and Exhibition, Dallas, Texas.
16. Blom, S.M.P., Hagoort, J. and Soetekouw, D.P.N.: “Relative Permeability at Near Critical Conditions”, Paper SPE 38935 Presented at 1997 SPE Annual Technical Conference and Exhibition, San Antonio, Texas.
17. Chen, H.L., Wilson, S.D. and Monger-McClure, T.G.: “Determination of Relative Permeability and Recovery for North Sea Gas-Condensate Reservoirs”, August 1999, SPE Reservoir Engineering.
18. Cvetkovic, B., Economides, M.J., Mining U.L., Omrcen, B. and Longaric, B.: “Production from Heavy Gas Condensate Reservoirs”, Paper SPE 20968 Presented at 1990 European Petroleum Conference, Hague, Netherlands.
19. Dandekar, A.Y.: “Petroleum Reservoir Rock and Fluid Properties” 2006, Taylor & Francis Group.
20. Danesh, A., Henderson, G.D., Krinis, D. and Peden, J.M.: “Experimental Investigation of Retrograde Condensation in Porous Media at Reservoir Conditions”, Paper SPE 18316 Presented at 1988 SPE Annual Technical Conference and Exhibition, Houston, Texas.
21. Du, L., Walker, J.G., Pope, G.A., Sharma, M.M. and Wang, P.: “Use of Solvents to Improve the Productivity of Gas Condensate Wells”, Paper SPE 62935 Presented at 2000 SPE Annual Technical Conference and Exhibition, Dallas, Texas.
22. Elsharkawy, A.M., Hashem, Y.S.K.S. and Alikhan, A.A.: “Compressibility Factor for Gas Condensates”, Paper SPE 59702 Presented at 2000 SPE Permian Basin Oil and Gas Recovery Conference, Midland, Texas.
23. Fahes, M. and Firoozabadi, A.: “Wettability alteration to Intermediate Gas-Wetting in Gas-Condensate Reservoirs at High Temperatures”, December 2007, SPE Journal.

60
24. Fan, L., Harris, B.W., Jamaluddin, A., Kamath, J., Mott, R., Pope, G.A., Shandrygin, A., Whitson., C.H.: “Understanding Gas-Condensate Reservoirs”, Winter 2005/2006, Schlumberger Oil Field Review.
25. Fevang, O. and Whitson, C.H.: “Modeling Gas Condensate Well Deliverability”, November 1996, SPE Reservoir Engineering.
26. Garzon, F.O., Al-Anazi, H.A., Leal, J.A. and Al-Faifi, M.G.: “Laboratory and Field Trial Results of Condensate Banking Removal in Retrograde Gas Reservoirs: Case History”, Paper SPE 102558 Presented at 2006 SPE Annual Technical Conference and Exhibition, San Antonio, Texas.
27. Haniff, M.S. and Ali, J.K.: “Relative Permeability and Low Tension Fluid Flow in Gas Condensate Systems”, Paper SPE 20917 Presented at 1990 Europec, Hague, Netherlands.
28. Henderson, G.D., Tehrani, D.H., Al-Shaidi, S. and Peden, J.M.: “Measurement and Correlation of Gas Condensate Relative Permeability by the Steady-State Method”, April 1998, SPE Reservoir Engineering.
29. Hirasaki, G. and Zhang, D.L.: “Surface Chemistry of Oil Recovery from Fractured, Oil-Wet, Carbonate Formations”, June 2004, SPE Journal.
30. Kokal, S., Al-Dokhi, M., and Sayegh, S.: “Phase Behavior of Gas Condensate/Water System”, Paper SPE 62931 Presented at 2000 SPE Annual Technical Conference and Exhibition, Dallas, Texas.
31. Kumar, K., Dao, E.K. and Mohanty, K.K.: “Atomic Force Microscopy Study of Wettability Alteration by Surfactants”, June 2008, SPE Journal.
32. Kwok, W., Nasr-El-Din, H.A. and Hayes, R.E.: “Propagation of an Anionic Surfactant in Radial Sandstone Cores”, June 1993, Volume 32, No. 6, JCPT.
33. Lindeloff, N. and Michelsen, M.L.: “Phase Envelope Calculations for Hydrocarbon-Water Mixtures”, Paper SPE 77575 Presented at 2002 SPE Annual Technical Conference and Exhibition, San Antonio, Texas.
34. Liu, Y., Zheng, H., Huang, G., Li, G. and Li, K. “Production enhancement in Gas-Condensate Reservoirs by Altering Wettability to Gas-Wetness: Field Application”, Paper SPE 112750 Presented at 2008 SPE/DOE Symposium on Improved Oil Recovery, Tulsa, Oklahoma.
35. Liu, Y., Zheng, H., Huang, G., Li, G. and Li, K. “Improving Productivity in Gas/Condensate Reservoirs by Wettability Alteration to Gas Wetness”, Paper SPE 99739 Presented at 2006 SPE/DOE Symposium on Improved Oil Recovery, Tulsa, Oklahoma.
36. Mannhardt, K., Novosad, J.J. and Jha, K.N.: “Adsorption of Foam-forming Surfactants in Berea Sandstone”, February 1994, Volume 33, No. 2, JCPT.

61
37. Mott, R., Cable, A. and Spearing, M.: “A New Method of Measuring Relative Permeabilities for Calculating Gas-Condensate Well Deliverability”, Paper SPE 56484 Presented at 1999 SPE Annual Technical Conference and Exhibition, Houston, Texas.
38. Munkerud, P.K.: “Measurement of Relative Permeability and Flow Properties of a Gas Condensate System during Pressure Depletion and Pressure Maintenance”, Paper SPE 19071 Presented at 1989 SPE Gas Technology Symposium, Dallas, Texas.
39. Myers, D.: “Surfaces, Interfaces, and Colloids”, 1999, John Wiley & Sons.
40. Novosad, Z.: “Composition and Phase Changes in Testing and Producing Retrograde Gas Wells”, November 1996, SPE Reservoir Engineering.
41. Panga, M.K.R., Ismail, J., Cheneviere, P. and Samuel, M.: “Preventive Treatment for Enhancing Water Removal From Gas Condensate Reservoirs by Wettability Alteration”, Paper SPE 105367 Presented at 2007 SPE Middle East Oil & Gas Show and Conference, Bahrain, Kingdom of Bahrain.
42. Pedersen, K.S. and Milter, J.: “Phase Equilibrium Between Gas Condensate and Brine at HT/HP Conditions”, Paper SPE 90309 Presented at 2004 SPE Annual Technical Conference and Exhibition, Houston, Texas.
43. Sarkar, R., Danesh, A.S. and Todd, A.C.: “Phase Behavior Modeling of Gas Condensate Fluids Using an Equation of State”, Paper SPE 22714 Presented at 1991 SPE Annual Technical Conference and Exhibition, Dallas, Texas.
44. Seethepalli, A., Adibhatla, B. and Mohanty, K.K.: “Physicochemical Interactions During Surfactant Flooding of Fractured Carbonate Reservoirs”, December 2004, SPE Journal.
45. Sigmund, P.M., Dranchuk, P.M., Morrow, N.R. and Purvis, R.A.: “Retrograde Condensation in Porous Media”, April 1973, SPE Journal.
46. Sumnu-Dindoruk, M.D. and Jones, J.R.: “Determination of Gas-Condensate Relative Permeabilities from Field Production Data”, Paper SPE 49267 Presented at 1998 SPE Annual Technical Conference and Exhibition, New Orleans, Louisiana.
47. Tang, G. and Firoozabadi, A.: “Relative Permeability Modification in Gas/Liquid Systems through Wettability Alteration to Intermediate Gas Wetting”, December 2002, SPE Reservoir Evaluation &Engineering.
48. Thomas, F.B., Andersen, G. and Bennion, D.B.: “Gas Condensate Reservoir Performance: Part I – Fluid Characterization”, Paper PS 2006-100 Presented at 2006 Canadian International Petroleum Conference, Calgary, Canada.
49. Trogus, F.J., Sophany, T., Schechter, R.S. and Wade, W.H.: “Static and Dynamic Adsorption of Anionic and Nonionic Surfactants”, October 1977 SPE Journal.

62
50. Wang, P. and Pope, G.A.: “Proper Use of Equations of State for Compositional Reservoir Simulation”, July 2001, SPE Distinguished Author Series.
51. Whitson, C.H. “Critical Properties Estimation from an Equation of State”, Paper SPE/DOE 12634 Presented at 1984 SPE/DOE Symposium on Enhanced Oil Recovery, Tulsa, Oklahoma.
52. Whitson, C.H., Fevang, O. and Saevareid, A.: “Gas Condensate Relative Permeability for Well Calculations”, Paper SPE 56476 Presented at 1999 SPE Annual Technical Conference and Exhibition, Houston, Texas.
53. Xu, W., Ayirala, S. and Rao, D.N.: “Measurement of Surfactant-Induced Interfacial Interactions at Reservoir Conditions”, February 2008, SPE Reservoir Evaluation & Engineering.
54. Zheng, Y. and Rao, D.N.: “Surfactant-Induced Spreading and Wettability effects in Condensate Reservoirs”, Paper SPE 129668 Presented at 2010 SPE Improved Oil Recovery Symposium, Tulsa, Oklahoma.

63
VITA
Bikash Deep Saikia was born in Sibsagar, a small oil town in eastern India, to Mr. B.C. Saikia
and Mrs. M. Saikia. After completing his high school studies from Sainik School Goalpara,
Assam, he joined National Institute of Technology Karnataka and obtained his bachelor’s degree
in chemical engineering in 2000. He then joined Oil and Natural Gas Corporation Limited, India
as a Graduate Trainee engineer and served in various capacities till 2008. In fall of 2008 he
joined the Graduate School of Louisiana State University, Baton Rouge, U.S.A, in Petroleum
Engineering Department. The degree of Master of Science in Petroleum Engineering will be
conferred in December 2010.


![Original Article Amelioration of meconium-induced acute ...inflammation, alveolar exudation, surfactant dysfunction, airway hyperreactivity, and other conditions [2, 3]. Meconium can](https://img.pdfslide.us/doc/110x75/601f8d151da783327f1ffce1/original-article-amelioration-of-meconium-induced-acute-inflammation-alveolar.jpg)


![A Surfactant-Induced Functional Modulation of a Global Virulence … · 2016. 5. 7. · ment by[γ-32P]ATP,DNA ligation,competentE.colicellpreparation, DNA transformation, estimation](https://img.pdfslide.us/doc/110x75/60d2af2bf60f56201c374ac9/a-surfactant-induced-functional-modulation-of-a-global-virulence-2016-5-7-ment.jpg)