Embed Size (px)
Citation preview

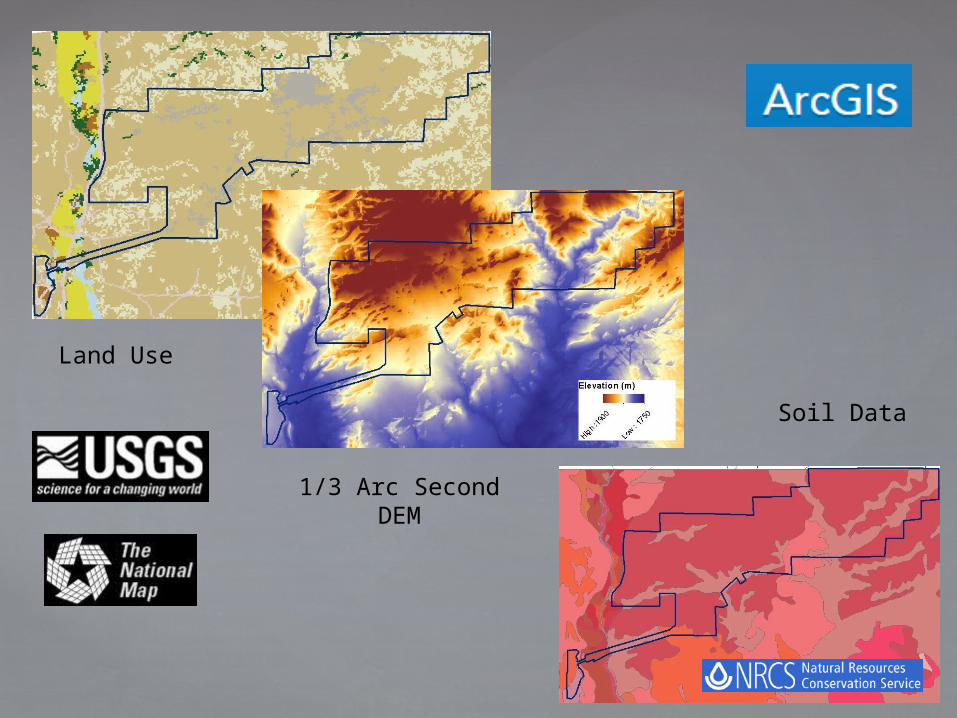
Surface Water Transport and Groundwater Infiltration
Comparing Characteristics of Post Reclamation Channels with Preexisting Channels
Presented by: Kirsty BramlettJune 5, 2013
Research Conducted by: Dr. John StormontDr. Mark StoneKirsty Bramlett

Surface Water
Conveyance and
Groundwater Infiltration

La Plata Reclaimed Mine
• Open Pit Coal Mine ~ 20 years• Geomorphic Land Reclamation initiated in
2003• 560 Hectares Fully Reclaimed by 2009

Tension Infiltrometer
• In-situ soil hydraulic properties• Estimate Hydraulic Conductivity in the
field• Remove the effect of preferential
pathways
3 Infiltration Locations in Reclaimed Channel
2 Infiltration Testing Locations in Native Channel

Single-Disc Radius with Multiple Tensions
Tension Settings (h)-10 cm tension-5 cm tension
Steady State Infiltration Rate (Q(h))• 350 seconds in Reclaimed Channel
@ -5 cm• 2,450 seconds in Native Channel @ -
10 cm𝑄 (h1 )=𝜋𝑟2[1+ 4
𝜋𝑟 𝛼 ]𝐾 𝑠𝑎𝑡 exp (𝛼h1)
𝑄 (h2 )=𝜋𝑟2 [1+ 4𝜋𝑟 𝛼 ]𝐾 𝑠𝑎𝑡 exp(𝛼 h2)
10-cm Radius Porous Membrane Disc (r)
𝛼=𝑙𝑛¿¿
Test
1
Test
2
Test
3
h2= -10 cm h2= -10 cm h2= -8.34 cm
Q(h2)
= 0.2006
cm3/
sec
Q(h2)
= 0.1306
cm3/
sec
Q(h2)
= 0.4355
cm3/
sec
h1= -5 cm h1= -5 cm h1= -5 cm
Q(h1)
= 0.4122
cm3/
sec
Q(h1)
= 0.1882
cm3/
sec
Q(h1)
= 0.5210
cm3/
sec
α 0.1440 cm-1 α 0.0730 cm-1 α 0.0537 cm-1
Ksat =
1.43E-
03 cm/sec Ksat =
3.14E-
04 cm/sec Ksat =
6.43E-
04 cm/sec
Reclaimed Channel Hydraulic Conductivity Results
(average = 7.96E-04 cm/sec)
Test
1
Test
2
h2= -10 cm h2= -10 cm
Q(h2)
= 0.1011
cm3/
sec
Q(h2)
= 0.0498
cm3/
sec
h1= -5 cm h1= -5 cm
Q(h1)
= 0.2380
cm3/
sec
Q(h1)
= 0.1166
cm3/
sec
α 0.1712 cm-1 α 0.1704 cm-1
Ksat =
1.02E-
03 cm/sec Ksat =
4.98E-
04 cm/sec
Native Channel Hydraulic Conductivity Results
(average = 7.60E-04 cm/sec)
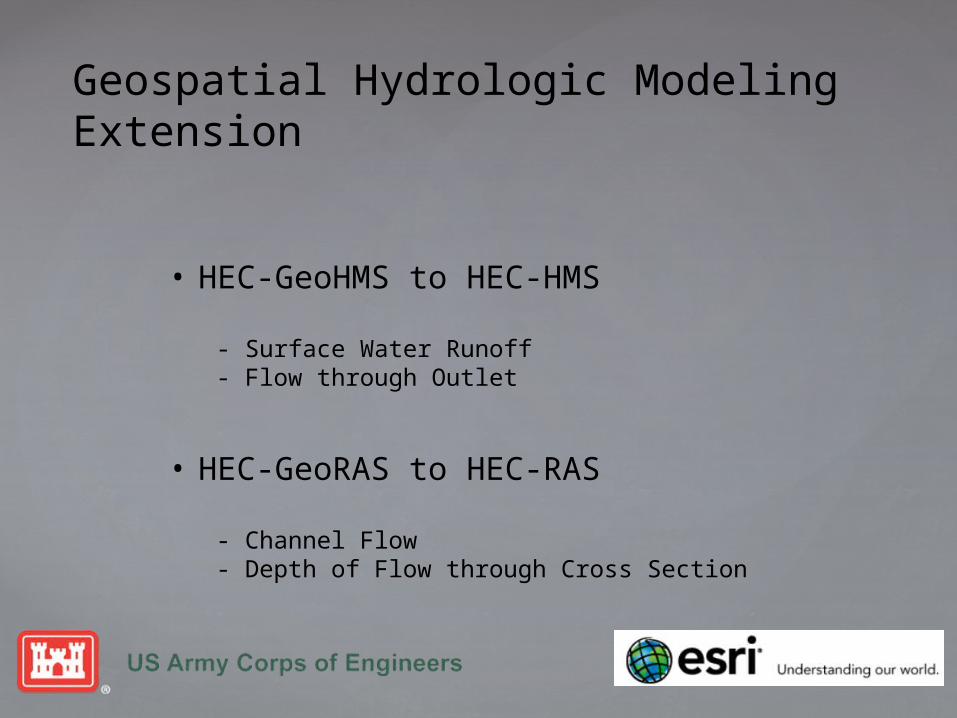
Geospatial Hydrologic Modeling Extension
• HEC-GeoHMS to HEC-HMS
- Surface Water Runoff - Flow through Outlet
• HEC-GeoRAS to HEC-RAS
- Channel Flow- Depth of Flow through Cross Section
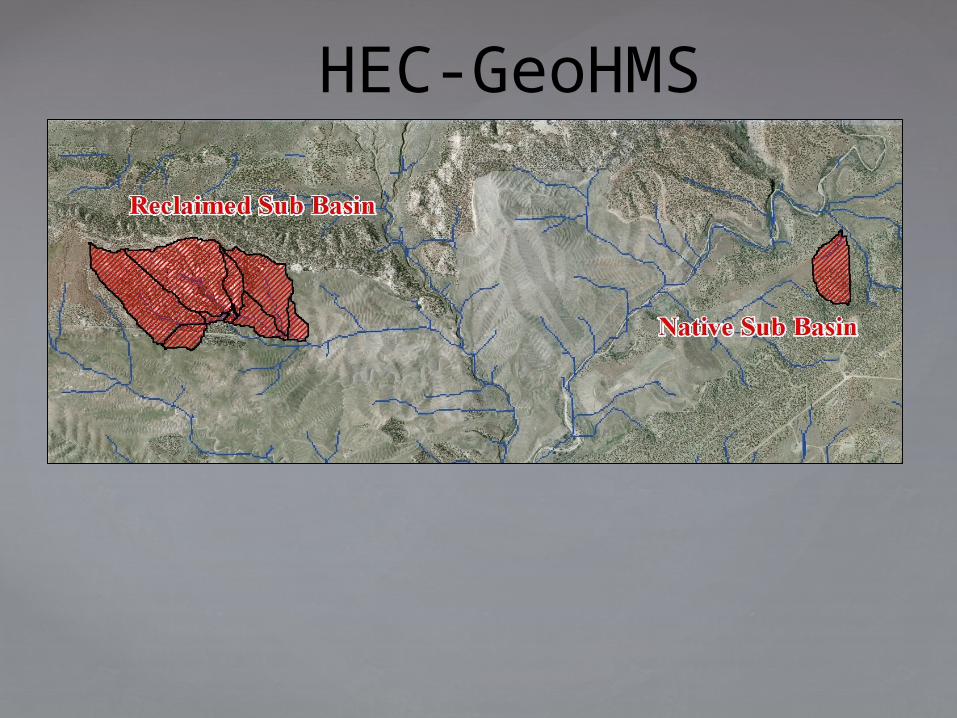
HEC-GeoHMS

• Area = 60 Hectacres• Longest Flow Path = 1,500 m.• Average Basin Slope = 10 %• Curve Number = 87• Land Use = Forest &
Agricultural• Soil Type D = FA (NM618)
Reclaimed Watershed

Native Watershed
• Area = 8 Hectacres• Longest Flow Path = 625 m.• Average Basin Slope = 9.5 %• Curve Number = 83• Land Use = Agricultural• Soil Type D = FA (NM618) and
BT

HEC-HMS
26 cm Precipitation in 2010
Loss Method: SCS Curve NumberTransform Method: SCS Unit
HydrographRouting Method: Kinematic Wave
2 minute increments

Flow through Outlet in Reclaimed Channel
J an Mar May J ul Sep Nov
2010
Flo
w (
cfs
)
0
10
20
30
40
50
60
70
80
Sink "Outlet1" Results for Run "2010"
Run:2010 Element:OUTLET1 Result:Outflow Run:2010 Element:R50 Result:Outflow Run:2010 Element:W100 Result:Outflow
Max Flow on July 23, 2010 2.2 m3/sec

Flow through Outlet in Native Channel
J an Mar May J ul Sep Nov
2010
Flo
w (cm
s)
0.00
0.05
0.10
0.15
0.20
0.25
0.30
Sink "Outlet1" Results for Run "2010"
Run:2010 Element:OUTLET1 Result:OutflowRun:2010 Element:W20 Result:Outflow
Max Flow on July 23, 2010 0.3 m3/sec

HEC-GeoRASManning’s n = 0.025
TIN Created from 1.5 meterTopographic Lines

HEC-RASReclaimed Channel
Cross Section @ 36 m from DS
Channel Slope 0.02
Steady Flow profiles w/ Mixed
Flow
US Boundary = Critical Depth
DS Boundary = Normal Depth
0 20 40 60 80 100 120 1406016
6018
6020
6022
6024
6026
6028
LPM Reclaimed RAS Plan: Plan 01 6/3/2013
Station (m)
Ele
vatio
n (
m)
Legend
EG PF 1
Crit PF 1
WS PF 1
Ground
Bank Sta
.025 .025
0 200 400 600 800 10006015
6020
6025
6030
6035
6040
LPM Reclaimed RAS Plan: Plan 01 6/3/2013
Main Channel Distance (m)
Ele
vatio
n (
m)
Legend
EG PF 1
Crit PF 1
WS PF 1
Ground
La Plata Reclaimed

HEC-RASNative Channel
0 20 40 60 80 100 120 140 160 1805956
5957
5958
5959
5960
5961
5962
5963
LPM Native RAS P lan: July25 5/17/2013
Main Channel Distance (ft)
Ele
vatio
n (
ft)
Legend
EG PF 1
Crit PF 1
WS PF 1
Ground
La Plata Native
0 10 20 30 40 505956
5958
5960
5962
5964
5966
5968
5970
LPM Native RAS Plan: July25 5/17/2013
Station (ft)
Ele
vation
(ft)
Legend
EG PF 1
Crit PF 1
WS PF 1
Ground
Bank Sta
.025
Cross Section @ 12 m from DSChannel Slope 0.03
Steady Flow profiles w/ Mixed
Flow
US Boundary = Critical Depth
DS Boundary = Normal Depth
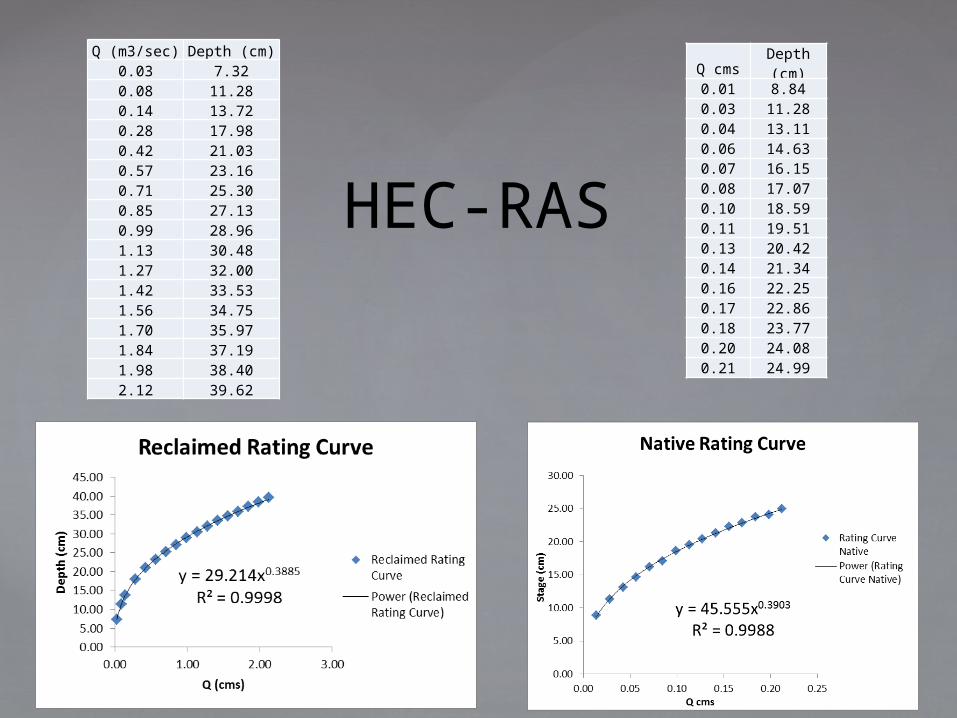
HEC-RAS
Q (m3/sec) Depth (cm)0.03 7.320.08 11.280.14 13.720.28 17.980.42 21.030.57 23.160.71 25.300.85 27.130.99 28.961.13 30.481.27 32.001.42 33.531.56 34.751.70 35.971.84 37.191.98 38.402.12 39.62
Q cmsDepth (cm)
0.01 8.840.03 11.280.04 13.110.06 14.630.07 16.150.08 17.070.10 18.590.11 19.510.13 20.420.14 21.340.16 22.250.17 22.860.18 23.770.20 24.080.21 24.99

Hydrus 2D/3D , Version 2.x
Groundwater Modeling
• Average Monthly Pan Evaporation
• Linearly interpolated water content from surface to bottom
boundary
(5% to 25%)
• van Genuchten parameters based on saturated hydraulic
conductivity values

Hydrus 2D Cross Section
Channel Cross Section during Evaporation

Thank You