Embed Size (px)
Citation preview
UNITED STATES DEPARTMENT OF THE INTERIORHAROLD L. ICKES, Secretary
GEOLOGICAL SURVEY W. C. MBNDBNHALL, Director
Water-Supply Paper 815
SURFACE WATER SUPPLY of HAWAII; ;,
JULY 1, 1935, to JUNE 3$, $933^~ <S) ^ ~ pj ^.
o NATHAN C. GROVER, Chief HydraiSc fngi
MAX H. CARSON, District Engine^ p.* CD
Prepared in cooperation with tlfi £L TERRITORY OF HAWAIlS r*
e P O"
« H- pn-o co o in
3
> 01
UNITED STATES
GOVERNMENT PRINTING' OFFICE
WASHINGTON: 1938
For sale by the Superintendent of Documents, Washington, D. C. - - - Price 25 cents (paper cover)

CONTENTS
PageScope of work..................................................................... 1Definition of terms............................................................... 1Explanation of data............................................................... 1Accuracy of field data and competed results....................................... 2Publications...................................................................... 3Records of discharge collected by agencies other than the Geological Survey....... 3Cooperation....................................................................... 5Division of work.................................................................. 6Gaging-station records............................................................ 7
Island of Kauai................................................................. 7Waimea River below Kekaha Ditch intake, near Waimea........................... 7Kawaikoi Stream near Waimea................................................... 8Kokee Ditch near Waimea....................................................... 9Walahulu Stream near Waimea................................................... 10Kekaha Ditch at camp 1, near Waimea........................................... 11Hanapepe River at Koula, near Eleele.......................................... 12Hanapepe Ditch below Intake, near Eleele...................................... 13Hanapepe Ditch at Koula, near Eleele.......................................... 14South Fork of Wailua River near Llhue......................................... 15North Fork of Wailua River at elevation 650 feet, near Lihue.................. 16Hanalel Tunnel outlet near Lihue.............................................. 17North Wailua Ditch near Lihue................................................. 18Kanaha Ditch near Llhue....................................................... 19East Branch of North Fork of Wailua River near Lihue.......................... 20Kapahi Ditch near Kealia...................................................... 21Anatoola River near Kealia..................................................... 22Anahola Ditch above Kaneha Reservoir, near Kealia............................. 23Ka Lokp Ditch near Kllauea.................................................... 24Puu Ka Ele Ditch near Kilauea................................................. 25Kalihiwai Ditch near Kllauea.................................................. 26Hanalei River at elevation 625 feet, near Hanalei............................. 27Hanakapiai Stream near Hanalei................................................ 28Hanakoa Stream near Hanalei................................................... 29Kalalau Stream near Hanalei................................................... 30Miscellaneous discharge measurements.......................................... 31
Island of Oahu.................................................................. 32Right Branch of North Fork of Kaukonahua Stream near Wahiawa.................. 32Left Branch of North Fork of Kaukonahua Stream near Wahiawa................... 33Puhawai Stream at Lualualei, near Waianae..................................... 34Pearl Harbor Springs at Puukapu, near Pearl City.............................. 35Pearl Harbor Springs at Loko Kukona, near Pearl City.......................... 36Pearl Harbor Springs at Kaluaoopu, near Pearl City............................ 3*7Pearl Harbor Springs at Walau, near Pearl City................................ 38Pearl Harbor Springs at Kalauao, near Aiea.................................... 39Moanalua Stream near Honolulu................................................. 40Kalihi Stream near Honolulu................................................... 41Nuuanu Stream below reservoir 2 wasteway, near Honolulu....................... 42West Branch of Manoa Stream near Honolulu..................................... 43East Branch of Manoa Stream near Honolulu..................................... 44East Manoa Ditch near Honolulu................................................ 45Pukele Stream near Honolulu................................................... 46Walomao Stream above Pukele Stream, near Honolulu............................. 47Kahaluu Stream near Heela..................................................... 48Waihee Stream near Heeia...................................................... 49Miscellaneous discharge measurements.......................................... 50
Island of Maul.................................................................. 51Honokahau Stream'near Honokahau............................................... 51Honokawai Ditch near Lahalna.................................................. 52Olowalu Ditch near Olowalu.................................................... 53Oheo Stream below diversion dam near Kipahulu................................. 54Right Branch of Kahalawe Stream near Kipahulu................................. 55Makapipi Stream near Nahiku................................................... 56West Makapipi Spring near Nahiku.............................................. 57Hanawl Stream near Nahiku..................................................... 58Hanawl Stream below Government Road, near Nahiku.............................. 59Kapaula Stream near Nahiku.................................................... 61Kapaula Stream below Government Road, near Nahiku............................. 62Koolau Ditch at Nahiku weir, near Nahiku...................................... 63Waiaaka Stream near Nahiku.................................................... 64Paakea Stream near Nahiku..................................................... 65Waiohue Stream near Nahiku.................................................... 66West Kopillula Stream near Keanae............................................. 67East Wailuaiki Stream near Keanae............................................. 68West Wailuaiki Stream near Keanae............................................. 69Wailuanui Stream near Keanae.................................................. 70East Wailuanui Stream near Keanae............................................. 71West Wailuanui Stream near Keanae............................................. 72Taro patch feeder ditch at Keanae............................................. 73Koolau Ditch near Keanae...................................................... 74Honomanu Stream near Keanae................................................... 75Haipuaena Stream near Huelo................................................... 76Spreckels Ditch at Haipuaena weir, near Huelo................................. 77Koolau Ditch at Haipuaena, near Huelo......................................... 78Puohokamoa Stream near Huelo.................................................. 79
III
Gaging-station records Continued.Island of Maui--Continued. PageManuel Luis Ditch at Puohokamoa Gulch, near Huelo............................. 80Spreckels Ditch at Wahinepee, near .Huelo...................................... 81Waikamoi Stream above Wailoa Ditch, near Huelo................................ 82Alo' Stream near Huelo......................................................... 83Kaaiea Stream near Huelo...................................................... 84Oopuola Stream near Huelo..................................................... 85Nailiillhaele Stream near Huelo............................................... 86Kailua Stream near Huelo...................................................... 87Hoolawaliilii Stream near Huelo............................................... 88Hoolawanui Stream near Huelo.................................................. 89Honopou Stream near Huelo..................................................... 90Honopou Stream at Lowrie Ditch siphon, near Huelo............................. 91Honopou Stream above Haiku Ditch, near Huelo.................................. 92Honopou Stream below Haiku Ditch, near Huelo.................................. 93Wailoa Ditch at Honopou, near Huelo........................................... 94New Hamakua Di tch at Honopou, near Huelo...................................... 95Lowrie Ditch at Honopou Gulch, near Huelo..................................... 96Haiku Ditch at Kapalalaea Gulch, near Huelo................................... 97
Island of Hawaii................................................................ 98Waiakea Stream at middle flume house, near Mountain View...................... 98Wailuku River at Pukamaui, near Hilo.......................................... 99Wailuku River above Hllo Boarding School Ditch intake, near Hilo.............. 100Hilo Boarding School Ditch at Intake, near Hllo............................... 101Kapehu Stream at Piihonua, near Hilo.......................................... 102Awini Ditch at East Honokaneiki Gulch, near Niulii............................ 103East Honokaneiki intake to Awini Ditch at East Honokaneiki Gulch, near Niulii. 104Kohala Ditch at Pololu, near Niulii........................................... 105Kehena Ditch near Kohala...................................................... 106
Index............................................................................. 107
SURFACE WATER SUPPLY OF HAWAII, JULY 1, 1935, to JUNE 30, 1936
SCOPE OF WORK
This volume contains results of measurements of the flow of streams and ditches In
the Territory of Hawaii during the year ending June 30, 1936. Since the beginning of
stream-gaging work in Hawaii in 1910 records of flow of streams and ditches have been ob
tained at about 480 stations for periods ranging from a few months to 26 years. In
addition hundreds of miscellaneous measurements have been made, and rather extensive1 2studies of ground water have been made in Kau, Hawaii,x and on the Islands of Oahu,
Mau i ,Molokai, and Lanai.
In this volume are given the records of daily flow that were obtained at stations that
were operated during the year ending June 30, 1936, and the results of miscellaneous
measurements of stream flow made during that year. The results of ground-water studies
will be published in bulletins of the Territorial Division of Hydrography. See
"Publications", on page 3 for a record of surface water-supply papers pertaining to
Hawaii.
DWINITION OF TERMS
The units in which stream-flow data are presented in this report are defined as
follows:
"Second-feet" is an abbreviation for "cubic feet a second." A second-foot is the
rate of discharge of water flowing in a channel having a cross-sectional area of 1
square foot and an average velocity of 1 foot a second.
An "acre-foot" is equivalent to 43,560 cubic feet and is the quantity required to
cover an acre to the depth of 1 foot. The term is commonly used in connection with
storage for irrigation.
In the Territory of Escna.il the unit most commonly used in measuring water is the
"million gallons." This is used with two meanings (1) to indicate a rate of flow and
(2) to express an actual quantity of mter. In the former sense "million gallons a day"
is Inferred, 1,000,000 gallons being taken as the unit of quantity and 24 hours as the
unit of time. With this meaning the term is generally used in connection with pumping
and irrigation. In the latter sense "million gallons" as an absolute quantity is used
in the measurement of storage capacities of reservoirs.
The following convenient approximate relations exist between second-feet, million
gallons a day, and acre-feet: 1 second-foot flowing 24 hours equals about 2 acre-feet;
1,000,000 gallons equals about 3 acre-feet or about 1.55 second-feet.
EXPLANATION OF DATA
The base data collected at gaging stations consist of records of stage, measurements
of discharge, and general information used to supplement the gage heights and discharge
measurements in determining the daily discharge. The records of stage are obtained from
water-stage recorders that give continuous records of the fluctuations. Measurements of
discharge are made with a current meter by the general methods outlined In standard text
books on the measurement of river discharge. Rating tables giving the discharge for any
1 Stearns, H. T., and Clark, W. 0., Geology and water resources of the Kau District, Hawaii: U. S. Geol. Survey Water-Supply Paper 616, 1930.
2 Stearns, H. T., and Vaksvik, K. N., Geology and ground-water resources of Oahu, Hawaii: T. H. Division of Hydrography Bull. 1, 1935. Stearns, N. D., Annotated bibliography and index of geology and water supply of Oahu, Hawaii: T. H. Division of Hydrography Bull. 3.
2 ACCURACY OF FIELD DATA AND COMPUTED RESULTS
stage are prepared from the discharge measurements. The application of the daily gage
heights to these rating tables gives the discharge from which the daily, monthly, and
yearly discharges are determined. Occasionally discharge is determined from a weir or a
rating flume, using standard formulas, and for a few stations the high-water discharge
has been determined by the use of models.
The data presented in this report comprise, for each gaging station, a description of
the station, a table showing the daily discharge of the stream, and a table of monthly
and yearly discharge and run-off. Skeleton rating tables are published except for ditch,
stations. All rates of flow are expressed as million gallons a day.
The description of the station gives location, drainage area, records available, dis
charge corresponding to maximum and minimum recorded stages, average discharge if there
has been more than 10 years of record, and, under "Remarks", notes on accuracy of the
records, diversions that decrease the flow at the gage, and artificial regulation.
The table of daily discharge gives, in general, the discharge corresponding to the
mean daily gage heights. But when, owing to sudden or rapid diurnal fluctuation, the
discharge obtained from the rating table by appDying the mean daily gage height would not
be within 5 percent of the true mean, the mean has been obtained by averaging discharges
for intervals during the day or by use of the discharge integrator.
In the table of monthly discharge the column headed "Maximum" gives the flow for the
day when the total discharge was greatest. This does not correspond to the rate of flow
at the crest of the flood. The maximum rate of flow is given in the station description
under the heading "Extremes", and the corresponding stage is always taken from the water-
stage recorder graph unless otherwise noted. Likewise, in the column headed "Minimum''
the quantity given is the flow for the day when the total discharge was least. The
columns headed "Mean" give the average flow in million gallons a day and cubic feet a
second during the month. The "Total run-off in million gallons" is the sum of the daily
flows, and the "Total run-off in acre-feet" is computed from the total monthly discharges
in million gallons a day.
ACCURACY OF FIELD DATA AND COMPUTED RESULTS
The accuracy of stream-flow data depends primarily (1) on the permanency of the stage-
discharge relation, and (2) on the accuracy of observation of stage, measurements of
flow, and interpretation of records.
A general statement under "Remarks" gives the accuracy of records, the terms "excel
lent", "good", "fair", or "poor" indicating that the record Is probably accurate within
5, 10, 15, and 20 percent, respectively.
It should be borne in mind that the observations in each succeeding year may be ex
pected to throw new light on data previously published.
Computations are carried to not more than three significant figures, except that month
ly and yearly total run-off (million gallons and acre-feet) above 10,000 are carried to
four significant figures.
RECORDS OF DISCHARGE COLLECTED BY AGENCIES OTHER THAN THE GEOLOGICAL SURVEY 3
PUBLICATIONS
The following table gives by years the numbers of the papers on the surface-water
supply of Hawaii published from 1903 to 1936, and, used In conjunction with the follow
ing list of stations maintained, provides a convenient index for finding the data for
any station. The data for any particular station will be found In the reports covering
the years during which that station was maintained, unless, owing to undeveloped rating
curves, publication has been postponed. Occasionally data are revised and republlshed
In later papers. Miscellaneous discharge measurements made during any year at points
other than regular gaging stations are Included In the data published for that year.
Numbers of water-supply papers containing data on the surface-water supply ofHawaii, 1903-36
Year
1912t
1 Q1 ̂ 1 R
1915-16.........
1917-181918-19.........
Number
*77
336 Zrw
145465
515
Year
1Q1Q Oft
1920 211921-22............
1923 241924-25. ...........
nope 07
1927-28............
Number
516CfZC
555
615635655675
Year
1928-29.........1929-30.........1930-31. ........1931-32.........1932-33.........1933-34. ........1934-35. ........1935-36.........
Number
695710725740755770795815
*Water resources of Molokal, by Waldemar Llndgren.tCalendar years; reports subsequent to Water-supply Paper 373 cover the year
beginning July 1 and ending June 30.
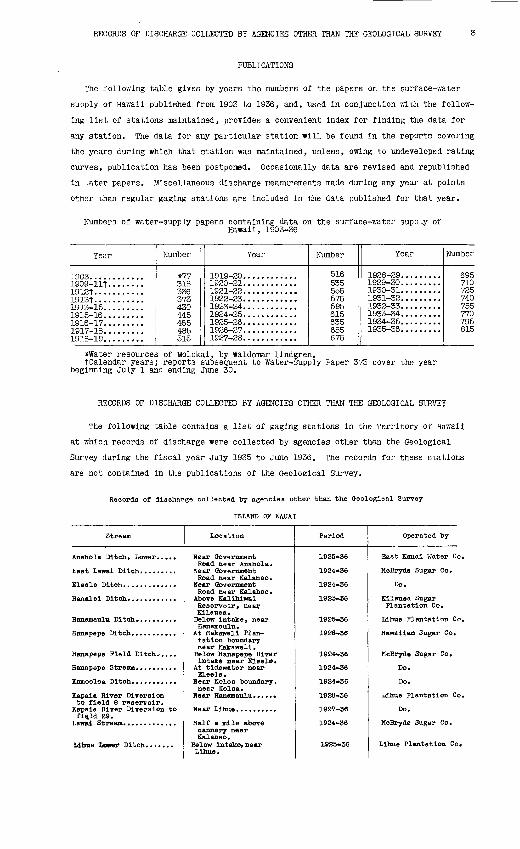
RECORDS OF DISCHARGE COLLECTED BY AGENCIES OTHER THAN THE GEOLOGICAL SURVEY
The following table contains a list of gaging stations in the Territory of Hawaii
at which records of discharge were collected by agencies other than the Geological
Survey during the fiscal year July 1935 to June 1936. The records for these stations
are not contained In the publications of the Geological Survey.
Records of discharge collected by agencies other than the Geological Survey
ISLAND OF KAUAI
Stream
Anahola Ditch, Lower.....
Hanapepe Field Ditch.....
Kapala River Diversion to field 6 reservoir.
fie,ld 29.
Location
Near Government Road near Anahola.
Road near Kalaheo.
Road near Kalaheo.
Reservoir, near Kllauea.
Hanamaulu.
tatlon boundary near Makawell. Below Hanapeps River Intake near Eleele.
KLee-le .
near Koloa. Near Hanamaulu.....*
cannery near Kalaheo.
Llhue.
Period
1925--36
1924-36
1928-36
1925*36
Operated by
Bast Kauai Water Co
Plantation Co.
McBryde Sugar Co.
Lihue Plantation Co
Llhue Plantation Co.
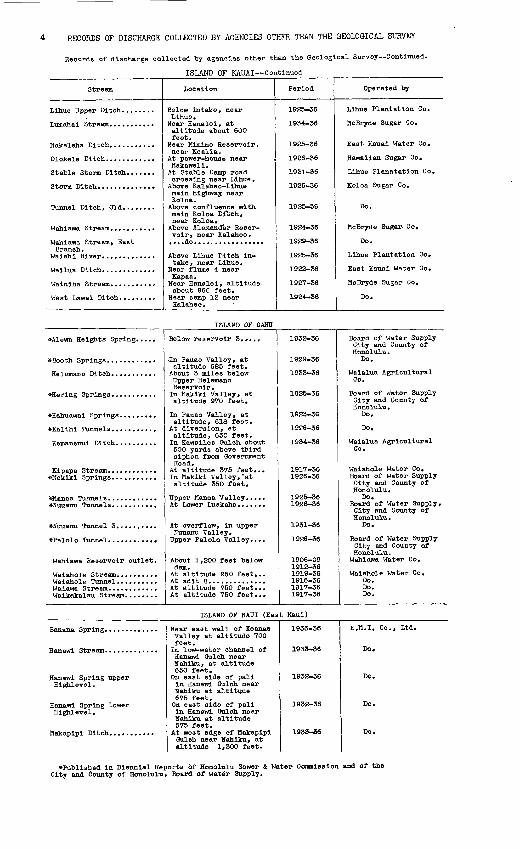
RECORDS OF DISCHARGE COLLECTED BY AGENCIES OTHER THAN THE GEOLOGICAL SURVEY
Records of discharge collected by agencies other than the Geological Survey Continued.
ISLAND OF KAUAI--cont i
Stream
Branch.
Location
Lihue.
altitude about 600 feet.
near Kealia.
Makawell.
crossing near Lihue.
main highway, near Koloa.
main Koloa Ditch, near Koloa.
volr, near Kalaheo.
take, near Lihue.
Kapaa.
about 96C feet.
Kalaheo.
Period
1925-36
1926-56
1931-36
1926-36
1925-36
1924-36
1929-36
1925-36
1922-36
1927-36
1924-36
Operated by
Lihue Plantation Co.
East Kauai Water Co.
Hawaiian Sugar Co.
Lihue Planatation Co.
Koloa Sugar Co.
Do.
McHryde Sugar- Co.
Do.
Lihue Plantation Co.
East Kauai Water Co.
McHryde Sugar Co.
Do.
ISLAND OP OAHO
*Alewa Heights Spring.....
*flanoa Tunnels ............
*Palolo Tunnel. ...........
Wahiawa Reservoir outlet.
Below reservoir 3,*...
altitude 685 feet.
Upper Helemano Reservoir.
altitude 970 feet.
altitude, 618 feet.
altitude, 650 feet.
500 yards above third siphon fjroin Government Road.
altitude 350 feet.
Upper Kanoa Valley. ....
Ituuanu Valley. Upper Palolo Valley. . . .
About 1,200 feet below dan.
1932-36
1929-36
1933-36
1925-36
1925-36
1926-36
1934-36
1917-361926-36
1925-36 1926-36
1931-36
1926-36
1906-09 1912-36 1919-361916-361917-361917-36
Board of Water Supply City and County of Honolulu.
Do.
Walalua AgriculturalCo.
Board of Water SupplyCity and County of Honolulu.
Do,
Do.
Waialua AgriculturalCo.
Walahole W&ter Co.Board of Water SupplyCity and County of Honolulu.
Do. Board of Water Supply,City and County of Honolulu .
Do.
Board of Water Supply City and County of Honolulu. Wahiawa Water Co.
Walafcole Water Co.Do.Do.Do.
ISLAND OP MAUI (East Maui)
Hanawl Spring upper Hlghlevel.
Hanawi Spring lower Highlevel.
Valley at altitude 700 feet.
Hanawi Gulch near Hahlku, at altitude 650 feet.
On east side of pall In Hanawi Gulch near Nahiku at altitude 675 feet.
On east side of pali in Hanawi Gulch near Hahiku at altitude 575 feet.
Gulch near Nahiku, at altitude 1,300 feet.
1935-36
1933-36
1932-36
1932-36
1933-36
E.n.I. Co., Ltd.
Do.
Do.
Do.
Do.
Published in Biennial Reports of Honolulu Sewer & Water Coamlsslon and of the City and County of Honolulu, Board of Water Supply.
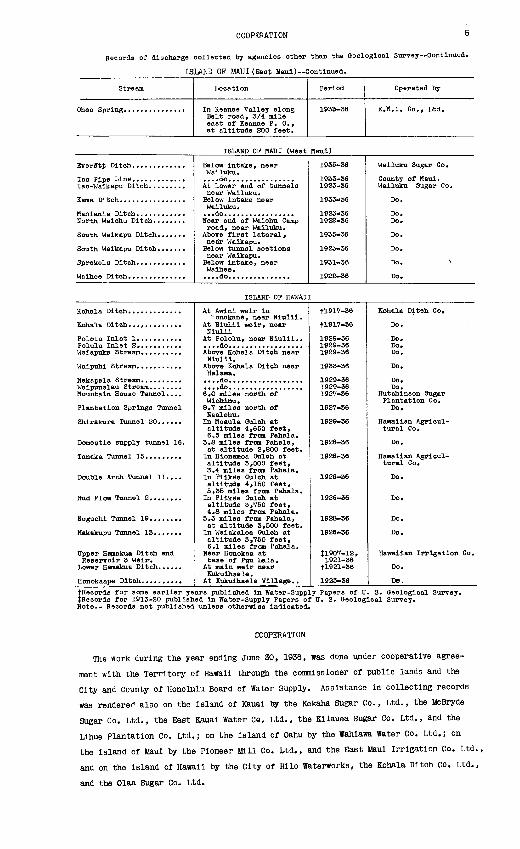
COOPERATION
Records of discharge collected by agencies other than the Geological Survey Continued.
ISLAND OF MAUI (East Maul) Continued.
Stream Location
Belt road, 3/4 mile east of Keanae F. 0,, at altitude 200 feet.
Period Operated by
ISLAND OF MAUI (Meat Haul)
South Waikapu Ditch. ......
Waihee Ditch. .............
Wailuku.
near Wailuku.
Wailuku.
road, near Wailuku. Above first lateral, near Waikapu.
near Waikapu.
Waihee. ....do. ..............
1935-36
1923-36
1935-36
1922-36
Do.
Do.
ISLAND OF HAWAII
Mountain House Tunnel ....
Plantation Springs Tunnel
Shirakura Tunnel 20......
Domestic supply tunnel 16.
Double Arch Tunnel 11....
Upper Hamakua Ditch and Reservoir 3 Weir.
Lower Hamakua Ditch......
Honokane, near Niulil.
Nlulii
Niulil.
Halawa.
6.0 miles north of Wiohlnu. 8.7 miles north of Naalehu. In Hoaula Gulch at altitude 4,650 feet, 6.5 miles from Pahala.
3.8 miles from Pahala, at altitude 2,800 feet.
altitude 3,000 feet, 3.4 miles from Pahala. In Piikea Ouleh at altitude 4,150 feet, 5.35 miles from Pahala.
altitude 3,750 feet, 4.8 miles from Pahala.
at altitude 3,5OO feet.
altitude 3,760 feet, 6.1 miles from Pahala.
Near Honokaa at base or Puu Lala.
At main weir near Kukulhaele .
At Xukulhaele Village..
1927-36
1927-36
1929-36
1926-36
1926-36
$1907-12, 1921-36 fl921-36
1923-36
Hutchinson Sugar Plantation Co.
Do.
Hawaiian Agricul tural Co.
Do.
tural Co.
Do.
Hawaiian Irrigation Co.
Do.
DO.
tRecords for some earlier yei {Records for 1913-20 publish! Note.- Records not published
irs published in Water-Supply Papers of U. S. Qeological Survey. id in Water-supply Papers of U. S. Qeological Survey, unless otherwise Indicated.
COOPERATION
The work during the year ending June 30, 1936, was done under cooperative agree
ment with the Territory of Hawaii through the commissioner of public lands and the
City and County of Honolulu Board of Water Supply. Assistance In collecting records
was rendered also on the Island of Kaual by the Kekaha Sugar Co., Ltd., the UcBryde
Sugar Co. Ltd., the East Kaual Water Co. Ltd., the Kllauea Sugar Co. Ltd., and the
Llhue Plantation Co. Ltd.; on the Island of Oahu by the Wahlawa Water Co. Ltd.; on
the Island of Maul by the Pioneer Mill Co. Ltd., and the East Maul Irrigation Co. Ltd.
and on the Island of Hawaii by the City of Hllo Waterworks, the Kohala Ditch Co. Ltd.,
and the Olaa Sugar Co. Ltd.
6 DIVISION OF WORK
Acknowledgment of records collected by individuals or corporations is made in
connection with the description of each station for which such records were furnished.
DIVISION OF WORK
The data were collected and prepared for publication under the direction of
M. H. Carson, district engineer, Honolulu, Hawaii.
GAGING-STATION RECORDS
ISLAND OF KAUAI
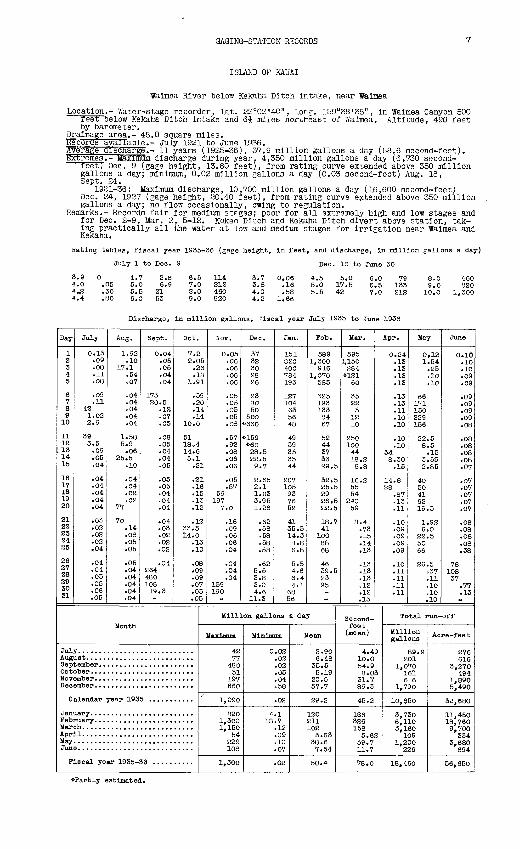
Walmea River below Kekaha Ditch Intake, near Walroea
Location.- Water-stage recorder, lat. 22°02'40", long-. 159°38'35", In Walmea Canyon 500 reet Delow Kekaha Ditch Intake and 6$ miles northeast of Walmea. Altitude, 490 feet by barometer.
Drainage area.- 45.0 square miles.Records available.- July 1921 to June 1936.Average discharge.- 11 years (1925-36), 37.9 million gallons a day (58.6 second-feet).Extremes.- Maximum discharge during year ? 4,350 million gallons a day (6,730 second-
reet; Dec. 9 (gage height, 13.80 feet), from rating curve extended above 350 million gallons a day; minimum, 0.02 million gallons a day (0.03 second-foot) Aug. 18, Sept. 24.
1921-36: Maximum discharge, 10,700 million gallons a day (16,600 second-feet) Dec. 24, 1927 (gage height, 20.40 feet), from rating curve extended above 350 million gallons a. day; no flow occasionally, owing to regulation.
Remarks.- Records fair for medium stages; poor for all extremely high and low stages and for Dec. 2-9, Mar. 2, 5-12. Kokee Ditch and Kekaha Ditch divert above station, tak ing practically all the water at low and medium stages for Irrigation near Walmea and Kekaha.
Rating tables, fiscal year 1935-36 (gage height, in feet, and discharge, in million gallons a day)
3.94.0 4.2 4.4
July 1 to Dec.
4.7.05 5.0 .30 5.5 .80 6.0
Dec. 10 to June 30
6.5 1147.0 212S.O 4609.0 820
3.7 0.06 4.53.8 .16 5.04.0 .58 5.54.2 1.66
5.017.542
79 8.0 460133 9.0 820212 10.0 1,300
Discharge, In million gallons, fiscal year July 1935 to June 1936
Day
1 2 3 4 5
6 7 8 9
10
11 12 13 14 15
16 17 IS 19 20
21 22 23 24 25
26 27 28 29 30 31
July
0.13 .09 .08 .11 .08
.09
.11 42 1.02 2.9
39 3.5 .09 .05 .04
.04
.04
.04
.04
.04
.03
.02
.02
.02
.04
.04
.04
.05
.05
.06
.05
Aug.
1.92 .10
17.1 .54 .07
.04
.04
.04
.04
.04
1.58 5.9 .06
25.5 .10
.04
.04
.02
.02 77
70 .14 .08 .05 .05
.05
.04
.04
.04
.04
.04
Sept.
0.04 .05 .05 .04 .04
173 20.5
.12
.07
.05
.08
.05
.04
.04
.05
.05
.05
.04
.04
.04
.04
.03
.02
.02
.02
.04 264 480 108 19.3
Oct.
7.2 2.05 .26 .18
1.91
.59
.20
.14
.14 10.0
51 18.4 14.6 5.1 .21
.21
.16
.15
.13
.12
.12 33.5 14.0
.13
.10
.08
.09
.09
.07
.05
.05
Month
Jul Augi Sep Oct Hoy Dec
C
Jan Feb Mar Apr May Jun
F
alendar year 193
.seal year 1935-
Nov.
0.05 .06 .06 .06 .06
.05
.05
.05
.05
.08
.57
.92
.08
.06
.06
.05
.87 59
197 7.0
.16
.09
.06
.06
.04
.04
.04
.04 159 190
Dec.
37 32 30 28 26
23 80 50
500 #660
*159 *60 28.5 22.5 9.7
2.65 2.1 1.03 3.951.26
.62
.58
.58
.58
.58
.62 5.5 3.8 3.0 4.6
11.3
Jan.
151 820 400784 193
127 104 63 56 48
49 39 35 35 44
207 105 93 76 52
41 35.5 14.3 8.8 6.8
5.54.6 6.4 4.1
68 56
Feb.
589 1,300
916 1,070
585
325 193 133 84 67
52 44 37 33 29.5
32.5 25.5 29 26.5 22.5
18.7 41
100 88 68
46 39.5 23 95
Million gallons a day
Maximum
42 77
480 51
197 660
1,090
820 1,300 1,150
54 229 108
1,300
Minimum
0.02 .02 .02 .05 .04 .58
.02
4.1 18.7
.12
.09
.10
.07
.02
Mean
2.90 6.48
35.5 5.19
20.5 57.7
29.2
120 211 102
3.63 38.6 7.54
50.4
Mar.
595 1,150 284
#121 60
35 22 15 12 10
250 10044 18.2 8.8
16.2 55 54
240 59
8.4 .73 .15 .14 .13
.13
.13
.13
.12
.12
.13
Apr.
0.24 .13 .13 .13 .13
.13
.13
.11
.10
.10
.10
.10 54 8.30 .15
14.8 28
.37
.13
.11
.10
.09
.09
.09
.09
.10
.11
.11
.11
.11
Second- feet (mean)
4.49 10. 0 54.9 8.03 31.7 89.3
45.2
186 326 158
5.62 59.7 11.7
78.0
May
0,12 1.54 .25 .10 .10
66 171 150 229 156
22.5 8.5 .15
3.55 2.85
40 50 41 62 19.5
6.0 22.5 50 66
26.5 .37 .11 .10 .10 .10
June
0.10 .10 .10 .09 .09
.09
.09
.09
.09
.08
.08
.08
.08
.08
.07
.07
.07
.07
.07
.07
.08
.08
.08
.08
.38
78 108 37
.77
.13
Total run-off
Million gallons
89.9 201
1,070 161 616
1,790
10,650
3,730 6,110 3,160
109 1,200
226
18,460
Acre-feet
276 616
3,270 494
1,890 5,490
32,680
11,450 18,760 9,700 334
3,680 694
56,650
^Partly estimated.
ISLAND OF KAUAI
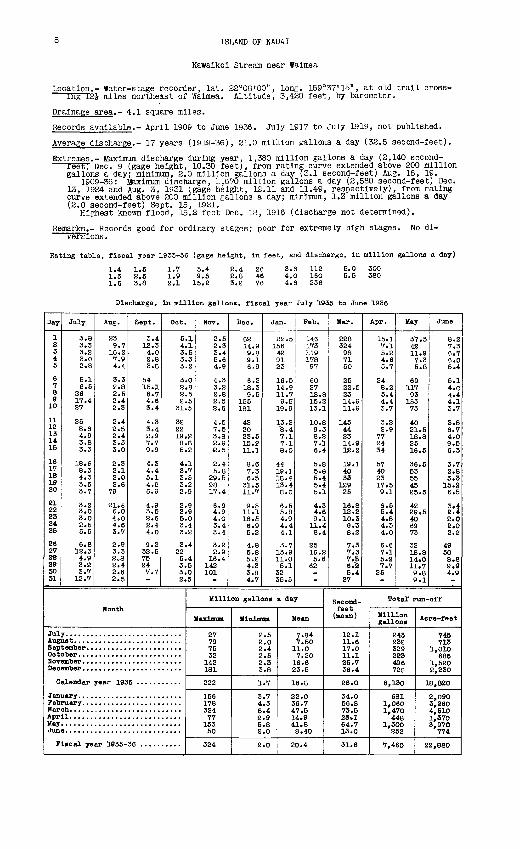
Kawaikoi Stream near Waimea
Location.- Water-stage recorder, lat. 22°08'00", long. 159 Q37'15", at old trail cross- ing 124 miles northeast of Waimea. Altitude, 3,420 feet, by barometer.
Drainage area.- 4.1 square miles.
Records available.- April 1909 to June 1936. July 1917 to July 1919, not published.
Average discharge.- 17 years (1919-36), 21.0 million gallons a day (32.5 second-feet).
Extremes.- Maximum discharge during year, 1,380 million gallons a day (2,140 second- feet) Dec. 9 (gage height, 10.30 feet), from rating curve extended above 200 million
gallons a day; minimum, 2.0 million gallons a day (3.1 second-feet) Aug. 18, 19.1909-36: Maximum discharge, 1,670 million gallons a day (2,580 second-feet) Dec.
13, 1924 and Aug. 3, 1931 (gage height, 12.11 and 11.49, respectively), from rating curve extended above 200 million gallons a day; minimum, 1.3 million gallons a day (2.0 second-feet) Sept. 15, 1921.
Highest known flood, 15.2 feet Dec. 18, 1916 (discharge not determined).
Remarks.- Records good for ordinary stages; poor for extremely high stages. versions.
No di
Rating table, fiscal year 1935-36 (gage height, In feet, and discharge, In million gallons a day)
1.41.51.6
1.5 2.5 3.8
1.7 1.9 2.1
5.49.5
15.2
2.4 2.8 3.2
3.6 4.0 4.6
112160236
5.0 5.5
300380
Discharge, In million gallons, fiscal year July 1935 to June 1936
Day
1 2 3 4 5
6 7 8 9
10
11 12 13 14 15
16 17 18 19 20
31 22 33 24 25
36 27 28 39 SO SI
July
3.8 3.3 3.2 3.0 2.8
5.1 6.5
26 17.4 27
25 8.6 4.9 3.8 3.3
18.6 8.3 4.3 3.5 3.7
3.2 3.0 3.0 2.5 5.5
6.8 12.3 4.9 3.2 3.7
12.7
Aug.
23 9.7
16.2 7.9 4.4
3.3 2.8 2.5 2.4 2.3
2.4 2.5 2.4 3.3 3.0
2.3 2.1 2.0 2.6
79
21.6 6.0 4.0 4.6 3.7
2.9 3.3 2.8 2.4 2.6 2.5
Sept.
3.4 12.3 4.0 2.8 3.8
54 15.1 6.7 4.6 3.4
4.3 3.4 2.9 7.7 9.9
4.3 4.4 5.1 4.2 6.9
4.9 3.5 2.6 2.4 4.0
9.2 32.5 75 247.7
Oct.
5.1 4.1 3.5 3.3 3.2
3.0 2.8 2.5 2.5
31.5
32 22 19.2 8.8 5.2
4.1 3.7 3.5 3.2 2.9
2.9 2.9 5.0 3.4 3.2
3.4 22 5.4 3.5 3.0 2.5
Month
Jul Augi Sep Dot NOT Dec
0
Jan Pet Mat- Apr May utin
p
alendar year 193
11...........................
Iscal year 1935-
NOT.
2.5 2.3 3.4 5.6 4.9
4.3 3«2 2.8 2.5 2.6
4.5 7.5 3.8 2.9e.52.4 5.8
29.5 9817.4
6.9 4.9 4.0 3.4 3.4
3.2 2.9
16.4 142 101
Dec.
62 14.9 9.8 9.1 6.9
6.2 18.3 9.5
155 181
42 20 23.5 15.2 11.3
8.6 7.3 .5
31.5 11.7
9.5 11.1 16.5 6.9 5.2
4.8 5.8 5.2 4.3 3.8 4.7
Jan.
22.5 156
42 91 23
16.5 14.9 11.7 9.6
19.9
13.2 '8.4 7.1 7.1 8.0
44 19.118.4 13.4 8.0
6.5 5.8 4.9 4.4 4.1
3.7 13.9 11.0 5.1
32 35.5
Feb.
146 173 119 178
97
60 27 18.8 15.2 13.1
10.8 9.3 8.2 7.1 6.4
5.8 5.6 5.4 5.4 5.1
4.3 4.6 9.1
11.4 8.4
25 16.2 5.6
62
Million gallons a day
Maximum
27 79 75 32
142 181
222
156 178 324 77
153 50
324
Minimum
2.5 2.0 2.4 2.5 2.5 3.8
1.7
3.7 4.3 5.4 2.9 5.8 2.0
2.0
Mean
7.84 7.50
11.0 7.20
16.6 23.5
16.8
22.0 36.7 47.5 14.9 41.8 8.40
20.4
Mar.
228 324
98 71 50
25 22.5 23 14.9 11.9
145 44 23 14.9 12.2
19.1 40 33
129 25
16.6 12.2 10.3 9.3 8.2
7.3 7.3 7.5 6.3 5.4
37
Apr.
15.1 7.1 5.2 4.6 5.7
24 8.2 5.4 4.4 3.7
3.2 2.9
77 24 34
57 40 23 17.5 9.1
6.5 5.4 4.8 4.3 4.0
6.6 7.1 5.3 7.7
25
Second- feet
(mean)
12.1 11.6 17.0 11.1 25.7 36.4
26.0
34.0 56.8 73.5 23.1 64.7 13.0
31.6
May
37.5 42 11.9 7.3 5.8
69 117
93 153
73
40 21.5 18.8 25 16.5
36.5 53 55 45 25.5
42 29.5 40 69 73
32 18.8 14.0 11.7 9.8 9.1
June
8.2 7.3 6.7 6.0 5.4
5.1 4.6 4.4 4.1 3.7
3.8 6.7 4.0 9.5 6.3
3.7 2.8 3.3
15.2 6.5
3.4 2.4 2.0 2.0 2.2
49 50 8.8 9.9 4.9
Total' run-off
Million gallons
243 232 339 233 496 726
6,130
681 1,060 1,470
448 1,300
252
7,460
Acre-feet
745VIS
1,010 685
1,520 2,230
18,820
2,090 3,360 4,510 1,370 3.970
774
22,880
ISLAND OF KA.UAI 9
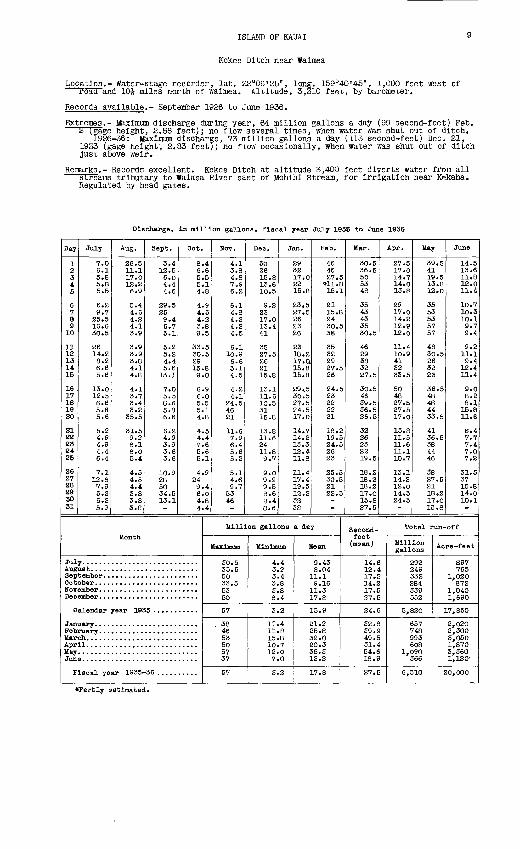
Kokee Ditch near Walmea
Location.- Water-stage recorder, lat. 22°06'25", long. 159°40'45", 1,000 feet west of roaa and 10J miles north of Walmea. Altitude, 3,310 feet, by barometer.
Records available.- September 1926 to June 1936.
Extremes.- Maximum discharge during year, 64 million gallons a day (99 second-feet) Feb. 2~Tgage height, 2.58 feet); no flow several times, when water was shut out of ditch.
1926-36: Maximum discharge, 73 million gallons a day (113 second-feet) Dec. 21, 1933 (gage height, 2.83 feet); no flow occasionally, when water was shut out of ditch Just above weir.
Remarks.- Records excellent. Kokee Ditch at altitude 3,400 feet diverts water from all streams tributary to Walmea River east of Mohihl Stream, for Irrigation near Kekaha. Regulated by head gates.
Discharge, In million gallc fiscal year July 193B to June 1936
Day
1 2 3 4 5
6 7a9 10
11 12 13 14 15
16 17 18 19 20
21 22 23 24 25
26 27 28 29 30 31
July
7.0 . 6.1 5.8 5.8 5.5
6.2 9.7
25.5 16.6 30.5
26 14.2 8.2 6.6 5.6
13.0 12.5 6.6 5.6 5.6
5.2 4.9 4.9 4.4 6.4
7.1 12.6 7.9 5.2 5.2 5.9
Aug.
26.5 11.1 17.0 12.26.9
5.4 4.6 4.2 4.1 3.9
3 .9 3.9 3.8 4.1 4.8
4.13.7 3.4 3.2 35.5
31.5 9.2 6.1 6.0 5.4
4.5 4.5 4.4 3.8 3.8 3.8
Sept.
3.4 12.5 6.0 4.4 4.6
29.5 25 9.4 6.75.1
5.2 5.24.4 5.6
13.1
7.05.5 8.6 5.8 6.6
6.2 4.9 3.9 3.6 3.6
10.9 28 50 34.5 13.1
Oct.
8.4 6.6 5.5 5.14.8
4.9 4.5 4.2 3.8 9.5
33.5 30.5 29 15.8 9.0
6.9 6.0 5.5 5.1 4.8
4.5 4.4 7.6 5.6 5.1
4.9 24 9.4 6.0 4.8 4.4
Month
Jul Augi Sep Oct HOT Dec
C
Jan Feb Mar Apr May Jun
F
alendar year 19;
.seal year 1935- 36 ..........
No-7.
4.1 3.8 4.8 7.9 6.2
6.1 4.8 4.2 4.2 4.5
6.1 10.9 6-6 5.1 4.5
4.2 4.1
24.5 46 21
11.6 7.9 6.4 5.6 5.2
5.1 4.6 9.7
53 46
Dec.
50 26 15.8 13.6 10.5
9.2 23 17.0 13.4 41
35 27.5 26 21 15.8
13.1 11.6 10.5 31 15.8
13.8 11.6 24 11.8 9.7
9.0 9.9 9.5 8.6 8.4 8.6
Jan.
29 32 17.0 22 15.8
23.5 27.5 26 23 26
23 18.2 17. a 15.8 15.8
29,5 30.5 27.5 24.5 17.0
14.7 14.2 13.3 12.4 11.8
11.4 17.4 19.5 12.2 32 38
Feb.
46 46 27.5
*11.8 15.1
21 15.8 24 30.5 38
35 32 29 27.5 26
24.5 23 22 22 21
18.2 19.5 24.5 26 23
25.5 30.5 21 22.5
Million gallons a day
Maximum
30.5 35.5 50 33.5 53 50
57
. 38 46 53 50 57 37
57
Minimum
4.4 3.2 3.4 3.8 3.8 8.4
3.2
11.4 11.8 15.8 10.7 12.0 7.0
3.2
Mean
9.43 8.04
11.1 9.16
11.3 17.8
15.9
21.2 25.8 32.0 20.3 35.3 12.2
17.8
Mar.
30.536.5 50 53 48
35 43 43 35 30.5
46 29 38 32 27.5
30.5 46 39.5 36.5 26.5
32 26 23 22 19.5
18.2 18.2 18.2 17.0 15.8 27.5
Apr.
27.5 17.0 14.7 14.0 13.8
29 17.0 14.2 12.9 12.0
11.4 10.9 41 32 33.5
50 48 27.5 27.5 17.0
13.8 11.5 11.6 11.1 10.7
13.1 14.2 12.014.5 24.5
Second- feet (mean)
14.6 12.4 17.2 14.2 17.5 27.5
24.6
32.8 39.9 49.5 31.4 54.6 18.9
27.5
May
39.5 41 19.5 13.8 12.0
35 53 53 57 57
48 30.5 26 32 23
36.5 48 48 44 33.5
41 36.5 38 44 46
38 27.5 21 18.2 17.0 15.8
June
14.5 13.6 11.8 12.0 11.4
10.7 10.3 10.1 9.7 9.4
9.2 11.1 9.4 12.4 11.4
9.0 8.2 8.1
15.8 11.6
S.4 7.7 7.4 7.0 7.2
31.537 15.8 14.0 10.1
Total run-off
gallons
292 249 332 284 339 552
5,820
657 748 993 608
1,090 366
6,510
Acre -feet
S97 765
1,020 872
1,040 1,690
17,850
2,020 2,300 3,050 1,870 3,360 1,120'
20,000
Partly estimated.
10 ISLAM) OF KAUAI
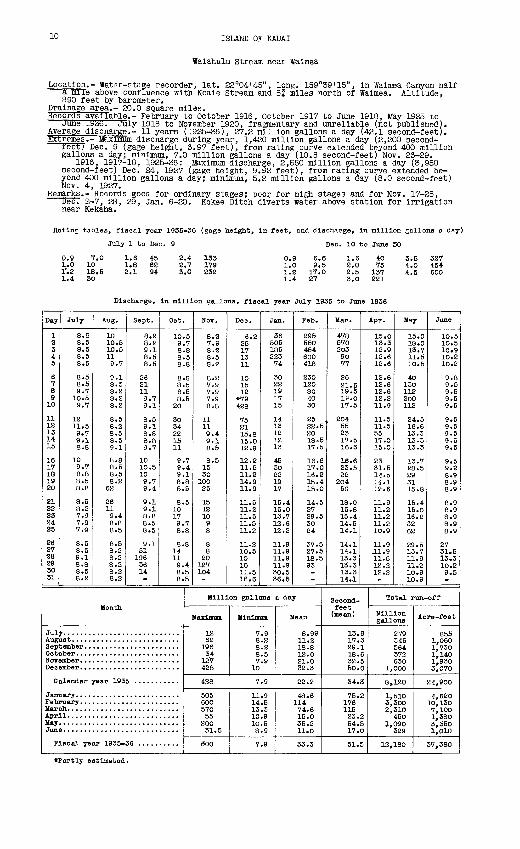
Walahulu Stream near Waimea
Location.- Wat*r-stage recorder, lat. 22°04'45", long. 159°39'15", In Waimea Canyon hair a mile above confluence with Koaie Stream and 8f miles north or Waimea. Altitude, 890 reet by barometer.
Drainage area.- 20.0 square miles.Records available.- February to October 1916, October 1917 to June 1918, Ifey 1925 to
June lass.July 1918 to November 1920, fragmentary and unreliable (not published).Average discharge.- 11 years (1925-36), 27.2 million gallons a day (42.1 second-feet).Extremes.- Maximum discharge during year, 1,420 million gallons a day (2,200 second-
reet; Dec. 9 (gage height, 6.97 reet), from rating curve extended beyond 400 million gallons a day; minimum, 7.0 million gallons a day (10.8 second-feet) Nov. 26-29.
1916, 1917-18, 1925-36: Maximum discharge, 2,550 million gallons a day (3,950 second-feet) Dec. 24, 1927 (gage height, 9.92 feet), from rating curve extended be yond 400 million gallons a day; minimum, 5.2 million gallons a day (8.0 second-feet) Nov. 4, 1927.
Remarks.- Records good for ordinary stages; poor for high stages and for Nov. 17-28, Dec. 2-7, 28, 29, Jan. 6-20. Kokee Ditch diverts water above station for irrigation near Kekaha.
Rating tables, fiscal year 1935-36 (gage height, In feet, and discharge, In million gallons a day)
July 1 to Dec. 9 Dec. 10 to June 30
0.9 7.01.0 101'.2 18.51.4 30
1.6 451.8 622.1 94
2,4 1332.7 1793.0 232
0.9 6.61.0 9.51.2 17.01.4 27
1.6 402.0 752.5 1373.0 221
3.5 3274.0 4544.5 600
Discharge, In million gallons, fiscal year July 1935 to June 1936
Day
1 2 3 4 5
6 7 8 9
10
11 12 13 14 15
16 17 18 19 20
21 22 23 24 25
26 27 28 29 30 31
July
8.0 8.5 8.5 8.5 8.5
8.5 8.5 9.7
10.5 9.7
12 11.5 9.7 9.1 8.8
10 9.7 8.8 8.5 8.8
8.5 8.2 7.9 7.9 7.9
8.5 8.5 9.1 8.8 8.5 8.2
Aug.
10 10.5 10.5 11 9.7
9.1 8.5 8.2 8.2 8.2
8.5 8.2 8.5 8.5 9.1
8.8 8.5 8.5 8.2
62
26 11 9.4 8.8 8.5
8.5 8.2 8.2 8.2 8.2 8.2
Sept.
8.2 8.2 9.1 8.5 8.5
26 21 11 9.7 9.1
8.5 9.1 8.8 8.8 9.7
10 10.5 10 9.7 9.4
9.1 9.1 8.8 8.5 8.5
9.1 51
196 36 14
Oct.
10.5 9.7 8.8 8.5 8.8
8.S 8.5 8.5 8.5
20
30 34 22 15 11
9.7 9.4 9.1 8.8 8.5
8.5 10 17 9.7 8.8
8.8 14 11 9.4 8.5 8.5
Month
Jul Augi Sep Oct NOT Dec
C
Jam Feb] Mar Apr, May Jun
P
ilendar year 193
.seal year 1935-
Nor.
8.2 7.9 8.2 8.5 S.2
8.2 7.9 7.9 7.9 8.8
11 11 9.4 9.1 8.5
8.5 15 30
100 25
15 12 10 98
8 8
20 127 104
Dec.
6.2 25 17 13 11
10 15 12
«79 428
75 21 15.8 15.0 12.9
12.2 11.5 11.2 14.9 11.9
11.5 11.211.5 11.5 11.2
11.2 10.5 10 10 11.5 16.6
Jan.
36 505 185 223 74
30 22 19 17 15
14 131212 13
45 30 22 19 17
15.4 15.0 13.7 12.6 12.2
11.9 11.9 11.9 11.9 30.5 36.5
Feb.
295 550 454 600 418
230 120 80 40 30
25 22.5 20 18.5 17.5
16.6 17.0 16.2 15.4 15.0
14.5 27 29.5 30 24
37.5 27.5 18.5 93
Million gallons a day
Maximum
12 62
196 34 12V 428
428
505 600 570 55
200 31.5
eoo
Minimum
7.9 8.2 8.2 8.5 7.9
10
7.9
11.9 14.5 13.3 10.9 10.5 8.9
7.9
Mean
8.99 11.2 18.8 12.0 21.0 32.3
22.2
48.6 114 74.6 15.0 35.2 11.0
33.3
Mar.
478 570 203 90 77
26 21.5 19.519.0 17.5
204 55 23 17.5 16.6
16.6 23.5 22 204 50
18.0 15.8 15.4 14.5 14.1
14.1 14.1 13.3 13.3 13.3 14J.
Apr.
15.0 13.3 12.9 12.6 12.6
12.6 12.6 12.6 12.2 11.9
11.5 11.5 55 17.0 15.0
23 31.5 14.5 14.1 12.6
11.9 11.2 11.2 11.2 10.9
11.9 J.1.9 11.5 12.2 12.2
Second- feet
(mean)
13.9 17.3 29.1 18.6 32.5 50.0
34.3
75.2 176 115 23.2 54.5 17.0
51.5
May
15.0 18.0 13.7 11.5 10.5
40 130 112 200 112
24.5 16.6 13.3 13.3 13.3
13.7 28.5 29 31 15.8
15.4 15.0 16.2 32 62
29.5 13.7 11.9 11.2 10.9 10.9
June
10.5 10.5 10.9 10.2 10.2
9.8 9.5 9.5 9.5 9.5
9.5 9.5 9.5 9.5 9.5
9.5 9.2 8.9 8.9 8.9
8.9 8.9 8.9 8.9 8.9
27 31.6 13.3 10.2 9.5
Total run-off
Million gallons
279 346 564 372 630
1,000
8,120
1,510 3,300 2,310
450 1,090
329
12,180
Acre-fee t
855 1,060 1,730 1,140 1,930 3,070
24,900
4,620 10,130 7,100 1,380 3,350 1,010
37,380
Partly estimated.
ISLAND OF KAUAI 11
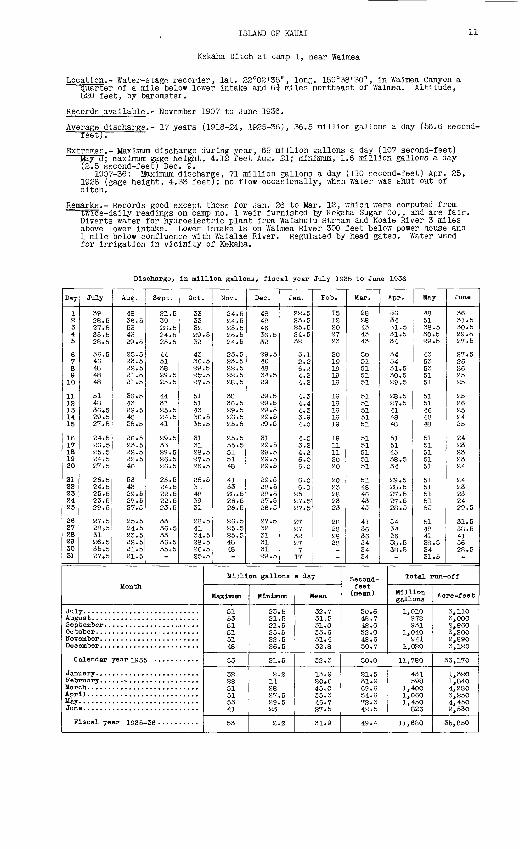
Kekaha Ditch at camp 1, near Waimea
Location.- Water-stage recorder, lat. 22°02'35", long. 159°38'30", in Waimea Canyon a quarter of a mile below lower intake and 6i miles northeast of Waimea. Altitude, 520 feet, by barometer.
Records available.- November 1907 to June 1936.
Average discharge.- 17 years (1918-24, 1925-36), 36.5 million gallons a day (56.6 second- feet;.
Extremes.- Maximum discharge during year, 69 million gallons a day (107 second-feet) May 8; maximum gage height, 4.12 feet Aug. 21; minimum, 1.6 million gallons a day
(2.5 second-feet) Dec. 9.1907-36: Maximum discharge, 71 million gallons a day (110 second-feet) Apr. 25,
1928 (gage height, 4.33 feet); no flow occasionally, when water was shut out ofditch.
Remarks.- Records good except those for Jan. 26 to Mar. 12, which were computed from twice-daily readings on camp no. 1 weir furnished by Kekaha Sugar Co., and are fair. Diverts water for hydroelectric plant from Walahulu Stream and Koale River 3 miles above lower intake. Lower intake is on Waimea River 300 feet below power house and 1 mile below confluence with Waialae River. Regulated by head gates. Water used for Irrigation in vicinity of Kekaha.
Discharge, In million gallons, fiscal year July 1935 to June 1936
Day
12 3 4 5
6 7 8 9
10
11 12 13 14 15
16 17 18 19 20
21 22 23 24 25
26 27 28 29 30 31
July
39 28.5 27.5 35.5 28.5
36.5 46 48 48 48
51 48 36.5 29.5 27.5
24.5 26.5 K5.5 24.5 27.5
26.5 24.5 25.5 23.5 29.5
27.5 28.5 31 26.5 35.5 27.5
Aug.
48 36.5 53 43 29.5
25.5 23.5 22.521.5 21.5
36.5 43 29.5 48 35.5
26.5 23.5 22.5 22.546
53 43 29.5 27.5 27.5
25.5 24.5 23.5 22.5 21.5 21.5
Sept.
81.5 39 88.5 24.5 25.5
44 51 38 29.5 25.5
44 51 25.5 24.5 41
29.5 33 29.5 26.5 26.5
25.5 24.5 22.5 22.5 23.5
33 36.5 33 36.5 35.5
Oct.
33 33 32 29.5 32
43 36.5 29.5 2&.5 27.5
51 51 43 36.5 35.5
31 31 28.5 27.5 26.5
25.531 48 39 31
28.5 41 34.5 28.5 26.5 25.5
Month
Jul Augi Sep Oct Nov Dee
C
Jan Feb Mar AprMay Jun
F
alendar year 193^
Lscal year 1935-
Nov.
24.5 24.5 25.5 25.5 24.5
23.5 23.5 22.5 22.5 28.5
38 36.5 29.5 26.5 25.5
25.5 35.5 51 5148
41 33 28.5 26.5 26.5
26.5 25.5 25.548 48
Dec.
48 48 46 36.5 32
29.5 46 48 34.5 29
29.5 29.5 29.5 29.5 29 .5
31 29.5 29.5 29.5 29.5
29.5 28.5 28.5 27.5 26.5
27.5 32 31 31 31 29.5
Jan.
22.5 23.5 25.524.5 32
3.1 2.2 6.2 4.2 4.2
4.3 4.4 4.3 3.9 4.0
4.0 3.2 4.2 6.0 6.0
6.0 6.0
25 27.5 27.5
27 27 32 27 17 17
Feb.
15 12 2027 23
20 19 19 19 19
19 19 19 19 19
19 11 11 20 20
20 23 28 23 23
2828 28 28
Million gallons a day
Maximum
51 53 51 51 51 48
53
32 28 51 51 53 41
53
Minimum Mean
23.5 32.7 21.5 31.5 21.5 31.0 25.5 33.6 22.5 31.4 26.5 32.8
21.5 32.3
2,2 13.9 I'l 20.6 28 45.0 27.5 35.3 29.5 46.7 23 27.5
8.2 31.9
Mar.
28 28 43 43 43
50 51 51 51 51
51 51 51 51 51
51 51 51 51 51
5148 46 43 43
41 36 3634 34 34
Apr.
36 34 31.5 31.534
34 34 31.5 30.5 29.5
28.5 27.5 41 48 48
51 51 43 38.5 34
29.5 28.5 27.5 27.5 28.5
34 34 36 38.5 38.5,
Second- feet
(mean)
50.6 48.7 48.0 52.0 48.6 50.7
50.0
81.5 31.9 69.6 54.6 72.3 42.5
49.4
May
48 51 38.5 30.5 29.5
43 53 53 5151
51 51 4648 48
51 51 51 5151
51 51 51 5153
51 48 41 38.5 34 31.5
June
36 31.5 30.5 29.5 27.5
27.5 26 26 25 25
25 26 25 24 25
24 23 23 23 24
24 23 23 24 29.5
31.538.5 41 36 28.5
Total run-off
Million gallons
1,010 978 931
1,040 941
1,020
11,780
431 598
1,400 1,060 1,450
826
11,680
Acre -feet
3,110 3,000 8,860 3,200 8,890 3,120
36 , 170
1,320 1,840 4,280 3,250 4,450 8,530
36,850
12 ISLAND OF KAUAI
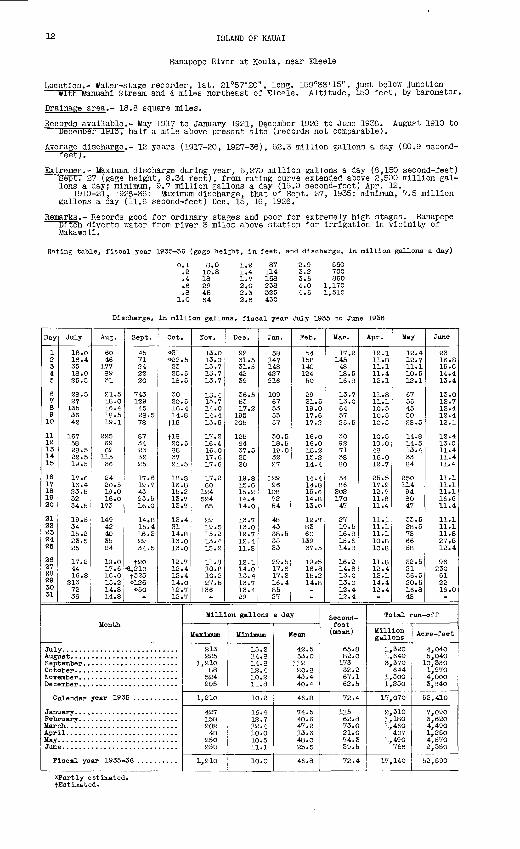
Hanapepe River at Koula, near Eleele
Location.- Water-stage recorder, lat. 21°57'20", long. 159°33'15", just below Junction with Manuahl Stream and 4 miles northeast of Eleele. Altitude, 150 feet, by barometer.
Drainage area.- 18.8 square miles.
Records available.- May 1917 to January 1921, December 1926 to June 1936. AugUPt 1910 to December I9ie, half a mile above present site (records not comparable).
Average discharge.- 12 years (1917-20, 1927-36), 52.3 million gallons a day (80.9 second- feetj.
Extremes.- Maximum discharge during year, 5,270 million gallons a day (8,150 second-feet) Sept. 27 (gage height, 8.34 feet), from rating curve extended above 2,500 million gal lons a day; minimum, 9.7 million gallons a day (15.0 second-feet) Apr. 12.
1910-21, 1926-36: Maximum discharge, that of Sept. 27, 1935; minimum, 7.5 million gallons a day (11.6 second-feet) Dec. 15, 16, 1926.
Remarks.- Records good for ordinary stages and poor for extremely high stages. Hanapepe Hitch diverts water from river 3 miles above station for Irrigation In vicinity of Makawell.
Hating table, fiscal year 1935-36 (gage height, in feet, and discharge, in million gallons a day)
0.1 .2.4
8.010.818294564
1.2 1.4 1.7 2.0 2.3 2.6
87114168238325430
2.9 3)2 3.5 4.0 4.5
560700860
1,1701,510
Discharge, in million gallons, fiscal year July 1935 to June 1936
Day
1 2 3 4 5
6 7 8 9
10
11 12 13 14 15
16 17 18 19 20
21 22 23 24 25
26 27 28 29 30 31
July
18.0 16.4 35 18.0 25.5
28.5 27 135 36 42
167 58 28.5 22.519.5
17.6 16.4 23.5 32 34.5
19.5 34 15.2 23.5 25
17.2 44 16.8
213 72 36
Aug.
60 46
177 89 31
21.5 18.0 16.4 18.5 19.1
225 69 62115 36
24 20.5 19.0 16.0
173
149 42 40 35 24
19.0 17.6 16.0 15.2 14.8 14.8
Sept.
45 71 24 22 20
743 129 45 28.5 78
87 34 23 32 25
17.6 19.7 43 23.5 16.0
14.8 15.4 16.2 29 34.5
t20 H,210 t325 ---126 #50
Oct.
*31 *22.5 23 25.5 18.5
30 20.5 16.4 14.8
tie
tie20.5 88 37 21.5
18.8 16.8 15.2 13.7 13.7
13,4 31 14.8 13.0 13.0
12.7 12.4 12.4 14.0 12.7 12.7
Month
Jul Augi Sep Oct NOT Dec
C
Jan Feb Mar Apr May Jun
P
alendar year 192 5 ...........
Lscal year 1935-
Nov.
13.0 13.0 13.7 13.7 13.7
13.4 13.7 14.0 14.4 15.6
17.2 16.4 16.0 17.6 17.6
17.2 60 124 524 65
29 19.5 15.2 13.4 15.2
11.8 10.8 10.2 27.5
136
Dec.
92 31.531.5 42 39
36.5 53 17.2
195 205
125 64 37.5 25 20
19.8 15.6 15.2 14.4 14.0
13.7 13.0 12.7 12.4 11.8
12.1 14.0 13.4 13.7 13.4 29
Jan.
58 147 148 427 216
109 67 53 53 57
30.5 18.5 19.0 32 27
129 96
108 72 54
48 43 38.5 33 33
29.5 17.6 17.2 16.4 85 27
Feb.
CA 158 140 124 50
29 21.519.0 17.6 17.2
16.0 16.0 15.2 15.2 14.4
14.4 14.8 15.6 14.8 13.0
12.7 83 60
139 37.5
19 .-5 16.8 15.2 14.8
Million gallons a day
Maximum
213 225
1,210 88
524 205
1,210
427 158 202 48
250 230
1,210
Minimum
15.2 14.8 14.8 12.4 10.2 11.8
10.2
16.4 12.7 12.4 10-0 10.5 11.1
10.0
Mean
42.5 53.0
112 20.8 43.4 40.4
46.8
74.5 40.6 47.2 13.6 48.0 25.5
46.8
Mar.
17.2 145 48 18.5 16.8
13.7 13.0 64 57 25.5
30 9271 38 80
54 86
202 170 47
27 19.5 16.8 15.6 14.8
16.2 14.8 13.0 13.0 12.4 12.4
Apr.
12.1 11.8 11.1 11.4 12.1
11.8 11.1 10.5 10.5 10.5
10.5 10.0 48 16.0 12.7
25.5 17.2 12.7 11.8 11.4
11.1 11.1 11.1 10.8 10.8
11.8 12.4 12.1 14.4 12.4
Second- feet (mean)
65.8 82.0
173 32.2 67.1 62.5
72.4
115 62.8 73.0 21.0 74.3 39.5
72.4
May
12.4 12.7 11.1 10.5 12.1
67 55 45 50 28.5
14.8 14.5 13.4 33 84
250114 94 80 47
33.5 28.5 78 6658
32.5 21 36.5 20.5 16.8 48
June
23 16.8 15.6 14. 13.
13. 12. 12. 12. 12.
12.13. 11. 11. 11.
11. 11. 11. 16. 11.
11.1 11.1 11.8 27.5 12.4
96 230 61 22 16.0
Total run-off
Million gallons
1,320 1,640 3,370
644 1,300 1,250
17,070
2,3101,180 1,460
407 1,490
766
17,140
Acre-feet
4,040 5,040 10,330 1,970 4,000 3,840
52, 410
7,090 3,620 4,490 1,250 4,570 2,350
52,590
s-Partly estimated. fEstimated.
ISLAND OF KAUA1 13
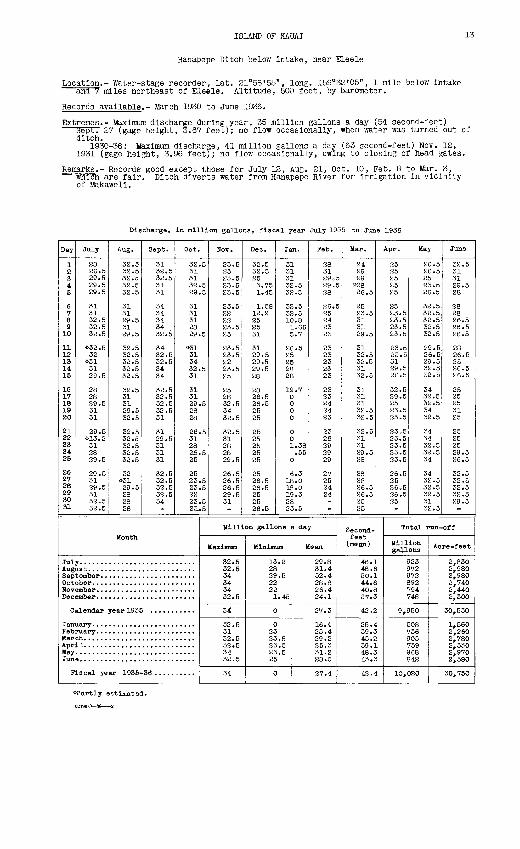
Hanapepe Ditch below intake, near Eleele
Location.- Water-stage recorder, lat. 21°58'55", long. 159°32'05", 1 mile below Intake and 7 miles northeast of Eleele. Altitude, 500 feet, by barometer.
Records available.- March 1930 to June 1936.
Extremes.- Maximum discharge during year, 35 million gallons a day (54 second-feet) Sept. 27 (gage height, 3.67 feet); no flow occasionally, when water was turned out of
ditch.1930-36: Maximum discharge, 41 million gallons a day (63 second-feet) Nov. 12,
1931 (gage height, 3.96 feet); no flow occasionally, owing to closing of head gates.
Remarks.- Records good except those for July 12, Aug. 21, Oct. 10, Feb. 8 to Mar. 3, wnich are fair. Ditch diverts water from Hanapepe River for Irrigation In vicinity of Makawell.
Discharge, In million gallons, fiscal year July 1935 to June 1936
Day
1 2 34 5
6 7 8 9 10
11 12 13 14 15
16 17 18 19 20
21 22 23 24 25
26 27 28 29 30 31
July
28 26.5 29.5 29.5 29.5
31 31 32.5 32.5 32.5
#32.5 32
#31 31 29.5
28 28 29.5 31 31
29.5 --13.2 31 28 29.5
29.5 31 29.5 31 32.5 32.5
Aug.
32.5 32.5 32.5 32.5 32.5
31 31 29.5 31 29.5
32.5 32.5 32.5 32.5 32.5
32.5 31 31 29.5 32.5
32.5 32.5 32.5 32.5 32.5
32 #31 29.5 28 28 28
Sept.
31 32.5 32.5 31 31
34 34 34 34 32.5
34 32.5 32.5 34 34
32.5 32.5 32.5 32.531
31 29.5 31 31 31
32.5 32.5 32.5 32.5 34
Oct.
32.5 31 31 32.5 29.5
31 31 31 28 29.5
#31 31 34 32.5 31
31 31 29.5 28 28
26.5 31 28 26.5 25
25 23.5 23.5 22 23.5 23.. 5
Month
Jul Aug- Sep Oct Nov Dec
C
Jan Feb Mar Apr May Jun
F
alendar year 193E
Iscal year 1935-
Nov.
23.5 25 23.5 23.5 23.5
23.5 22 22 23.5 25
23.5 23.5 22 23.5 25
25 28 32.5 34 32.5
32.5 31 28 28 29.5
26.5 26.5 26.5 29.5 31
Dec.
32.5 32.5 25 3.75 1.45
1.58 12.2 25 25 31
31 29.5 29.5 29.5 28
28 26.5 26.5 25 25
25 25 25 25 25
25 26.5 26.5 25 25 26.5
Jan.
31 31 31 32.5 32.5
32.5 32.5 10.8 1.66 5.7
26.5 25 25 28 28
19.7 0 0 0 0
0 0 1.38 .55
0
6.3 18.0 18.0 19.3 28 23.5
Feb.
28 31 29.5 29.5 28
26.5 25 24 23 23
23 23 23 23 23
23 23 24 24 23
23 26 29 29 29
27 25 24 24
Million gallons a day
Maximum
32.5 32.5 34 34 34 32.5
34
32.5 31 32.5 32.5 34 32.5
34
Mlnljnuin
13.2 28 29.5 22 22 1.45
0
023 23.5 23.5 23.5 25
0
Mean
29.8 31.4 32.4 28.8 26.4 24.1
27.3
16.4 25.4 29.2 25.3 31.2 28.0
27.4
Mar.
24 29 29 #28 26.5
25 23.5 31 31 29.5
31 32.5 32.5 31 32.5
31 31 31 32.5 32.5
32.5 31 31 29.5 S8
28 28 26.5 S6.5 25 S5
Apr.
25 25 25 25 25
25 23.5 23.5 23.5 23.5
23.525.5 31 29.5 26.5
32.5 29.5 25 23.5 23.5
23.5 23.5 23.5 23.5 23.5
26. .5 25 26.5 26.5 25
Second- feet (mean)
46.1 48.6 50.1 44.6 40.8 37.3
42.2
25.4 39.3 45.2 39.1 48.3 43.3
42.4
May
26.5 26.5 25 23.5 26.5
32.5 32.5 32.5 32.5 32.5
29.5 26.5 29.5 32.5 52.5
34 32.5 32.5 34 32.5
34 34 32.5 32.5 34
34 32.5 32.5 32.5 31 52.5
June
32.5 31 31 29.5 28
28 28 26.5 26.5 26.5
28 26.5 25 26.526.5
25 25 25 31 25
25 25 25 29.5 26.5
32.5 32.5 32.5 32.5 29.5
Total run-off
Million gallons
923 972 972 892 794 748
9,950
508 736 905 759 968 842
10,020
Acre -feet
2,830 2,980 2,980 2,740 2,440 2,300
30,530
1,560 2,260 2,780 2,330 2,970 2,580
30,750
^Partly estimated.
K-TWiO 38 2
14 ISLAND OF KA.UAI
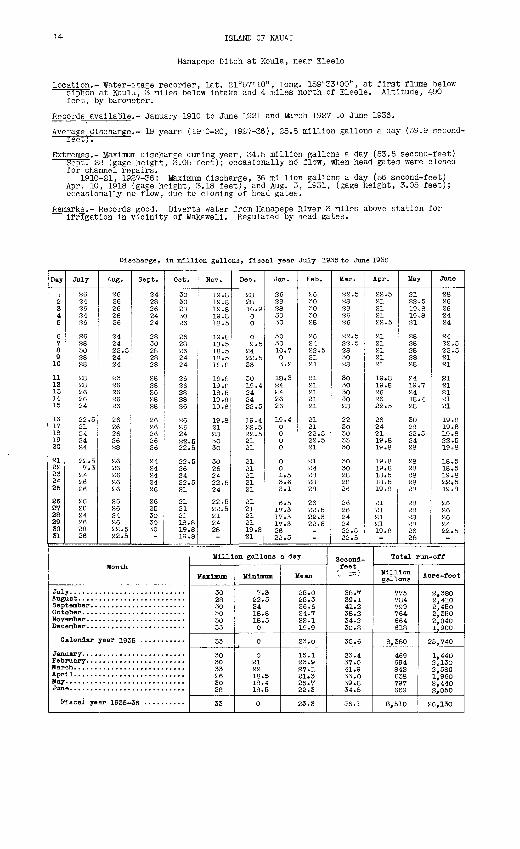
Hanapepe Ditch at Koula, near Eleele
Location.- Water-stage recorder, lat. 21"57'10", long. 159"33'00", at first flume below siphon at Koula, 3 miles below Intake and 4 miles north of Eleele. Altitude, 490
feet, by barometer.
Records available.- January 1910 to June 1921 and March 1927 to June 1936.
Average discharge.- 19 years (1910-20, 1927-36), 25.8 million gallons a day (39.9 second- feet).
Extremes.- Maximum discharge during year, 34.5 million gallons a day (53.5 second-feet) Sept. 28 (gage height, 3.05 feet); occasionally nd flow, when head gates were closed
for channel repairs.1910-21, 1927-36: Maximum discharge, 36 million gallons a day (56 second-feet)
Apr. 10, 1918 (gage height, 3.18 feet), and Aug. 3, 1931, (gage height, 3.05 feet); occasionally no flow, due to closing of head gates.
Remarks.- Records good. Diverts water from Hanapepe River 3 miles above station for irrigation In vicinity of Makawell. Regulated by head gates.
Discharge, in million gallo fiscal year July 1935 to June 1936
Day
1 2 3 4 5
6 7 8 9 10
11 1213 14 15
16 17 18 19 20
21 22 23 24 25
26 27 28 2930 31
July
26 24 26 24 26
2628 30 28 28
28 28 26 26 24
22.521 Z4 24 24
22.5 7.3
24 26 26
26 26 24 26 28 26
Aug.
26 26 26 26 26
24 24 22.5 24 24
23 26 26 26 26
26 26 26 26 28
26 26 26 26 26
26 26 24 26 22.5 22.5
Sept.
24 28 26 24 24
28 30 28 28 28
28 28 26 28 28
26 26 26 26 26
24 24 24 24 26
26 25 30 30 30
Oct.
30 30 28 30 26
2628 26 2424
26 26 28 28 26
26 26 24 22.6 22.5
22.5 26 24 22.521
21 21 21 18.8 19.6 19.8
Month
Jul Aug Sep Oct NOT Dec
C
Jan Fob Mar Apr May Jun
P
alendar year 193
iscal year 1935-
Nov.
19.8 19.8 19.8 19.8 18.5
19.8 18.5 18.5 18.5 1£.8
19.8 19.8 18.5 19.8 19.8
19.8 21 28 30 30
30 26 24 22.5 24
22.5 22.5 21 24 28
Dec.
28 28 16.9 0 0
0 9.5 24 22.5 33
3019.4 24 24 22.5
19.4 22.5 22.5 21 21
21 21 21 21 21
21 21 21 21 19.8 21
Jan.
2628 28 30 30
30 30 10.7 03.2
18,3 24 24 26 26
19.4 0 0 0 0
0 0 1.5 3.6 3.1
6.5 17.3 17.3 17.3 26 22.5
Feb.
26 30 30 30 28
26 24 22.5 21 21
21 21 21 21 21
21 21 22.5 22.5 21
21 24 28 28 28
26 22.5 22.5 22.5
Million gallons a day
Maxlxnim
3028 30 30 30 33
33
30 30 33 26 30 28
33
Minimum
7.3 22.5 24 18.8 18.5 0
0
0 21 22 18.5 18.4 18.5
0
Mean
25.0 25.3 26.6 24.7 22.1 19.9
23.0
15.1 23.9 27.1 21.3 25.7 22.3
23.3
Mar.
22.5 28 28 26 26
22.5 22.5 28 3028
30 30 30 3028
22 30 30 33 30
30 3028 28 26
26 26 24 24 22.5 22.5
Apr.
22.5 21 21 21 22.5
21 21 21 2121
19.8 19.8 26 26 22.5
26 24 21 19.8 19.8
19.8 19.8 18.5 18.5 19.8
21 21 21 21 19.8
Second- feet
38.7 39.1 41.2 38.2 34.2 30.8
35.6
23.4 37.0 41.9 33.0 39.8 34.5
36.1
May
21 22.5 19.8 19.8 21
28 28 28 28 28
24 19.7 24 18.4 28
30 28 22.5 24 28
28 28
28 28
28 28 28 28 26 28
June
28 26 26 24 24
24 22.5 22.5 21 21
21 21 21 21 21
19.8 19.8 19.8 22.5 19.8
18.5 18.5 19.8 22.5 19.8
26 26 26 24 22.5
Total run-off
Million gallons
775 784 799 V64 664 618
8,380
469 694 842 638 797 669
8,510
Acre -feet
2,380 2,410 2,450 2,350 2,040 1,900
25,740
1,440 2,130 2,580 1,960 2,440 2,050
26,130
ISLAND OF KAUAI 15
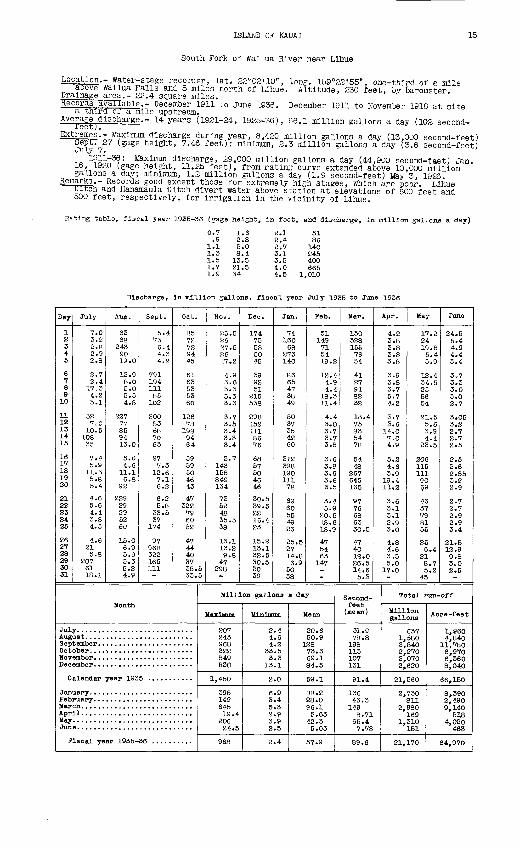
South Fork of Wallua River near Llhue
Location.- Water-stage recorder, lat* 22°02'10", long. 159°22'55", one-third of a mile aDove Wallua Falls and 5 miles north of Llhue. Altitude, 230 feet, by barometer. Drainage area.- 22.4 square miles. Kecoras available.- December 1911 to June 1936. December 1911 to November 1918 at site
a third of a mile upstream.Average discharge.- 14 years (1921-24, 1925-36), 66.1 million gallons a day (102 second-
Extremes.- Maximum discharge during year, 8,420 million gallons a day (13,000 second-feet)SeJTET 27 (gage height, 7.46 feet); minimum, 2.3 million gallons a day (3.6 second-feet)
.. i-^!-1-36,: Maximum discharge, 29,000 million gallons a day (44,900 second-fset) Jan. 16, 1920 (gage height, 11.25 feet), from rating curve extended above 10,000 million gallons a day; minimum, 1.2 million gallons a day (1.9 second-feet) May 3, 1926.
Remarks.- Records good except those for extremely high stages, which are poor. Llhue Ditch and Hanamaula Ditch divert water above station at elevations of 600 feet and 500 feet, respectively, for Irrigation In the vicinity of Llhue.
Rating table, fiscal year 1935-36 (gage height, in feet, and discharge, in million gallons a day)
1.1 1.3 1.5 1.7
1.62.85.08.413.521.5
2.1 2.4 2.7 3.1 3.5 4.0
140245400665
4.5 1,010
Discharge, In million gallons, fiscal year July 1935 to June 1936
Day
1 2 3 4 5
6 7 8 9 10
11 12 13 14 15
16 17 18 19 20
21 22 23 24 25
26 27 28 29 30 31
July
7.0 3.2 2.8 2.9 2.8
2.7 2.4
17.3 4.2 3.1
52 7.0 10.5
108 35
7.4 5.9
11.3 5.8 5.4
4.6 5.6 4.4 3.8 4.5
4.6 21 5.8
207 61 18.1
Aug.
63 68
243 90 19.0
12.9 8.0 5.0 5.3 4.8
22777 85 94 13.0
5.6 4.6
11.1 6.8
92
229 29 29 52 60
15.0 6.9 5.9 5.3 5.2 4.9
Sept.
5.4 73 6.4 4.3 4.2
791 194 111 85 102
200 83 68 70 63
27 7.3 12.6 7.1 6.2
6.2 5.8
33.5 37
174
97 968 322 165 111
Oct.
85 72 72 94 45
61 63 53 55 60
186 78 198 94 64
59 59 50 46 43
47 322 79 60 52
47 44
. 40 37 35.5 33.5
Month
Jul Aug Sep Oct Nov Dec
C
Jan Pet Mar Apr May Jun
P
alendar year 193
11...........................
Iscal year 1935-
Nov.
25.5 26 27.5 26 17.2
4 9 3 6 3 3 3 3 3 3
3 7 3 5 3 4 3 3 3 4
3.7 143 158 849 134
73 52 48 35.5 38
13.1 13.29.8
47 298
Dec.
174 75 58 50 45
39 92 51
215 538
298 152 111 86 76
68 57 50 46 46
30.5 39.5 22 16.4 23
15.2 13.1 32.5 30.5 30 39
Jan.
74 160 68
273 140
86 65 47 38 49
50 37 35 42 60
312398 190111 78
69 60 55 49 26
25.5 27 14.8 6.9
50 38
Pet.
51 149 71 54 19.2
12.44.9 4.4
18.3 11.4
4.4 3.8 3.7 3.7 3.8
3.6 3.8 3.6 3.6 3.5
3.4 5.9
20.5 18.6 18.9
47 54 63
147
Million gallons a day
Maximum
207 243 968 322 849 538
1,450
398 149 645 19.4
206 24.5
968
Minimum
2.4 4.6 4.2
33.5 3.3 13.1
2.0
6.9 3.4 5.3 2.9 3.9 2.5
2.4
Mean
20.6 50.9
128 73.3 69.1 84.5
59.1
88.2 28.0 96.1 5.63
42.3 5.03
57.9
Mar.
130 328 155 76 54
41 27 91 82 32
13.4 75 83 54 78
54 48
267 645 165
97 76 68 63 30.5
47 40 12.0 26.5 14.6 5.3
Apr.
4.2 3.8 3.8 3.8 3.8
3.9 3.8 3.7 5.7 4.2
3.7 3.6
14.0 7.0 4.9
5.24.6 3.9 19.4 11.2
3.6 3.1 3.1 2.9 3.0
4.8 4'. 6 3.5 5.0
17.0
Second- feet
(mean)
31.9 78.8
198 113 107 131
91.4
136 43.3
149 8.71 65.4 7.78
89.6
May
17.2 24 19.8 5.4 3.9
12.4 34.5 25 56 54
21.5 5.6 3.9 4.4
23.5
206 115 111 90 69
46 37 79 81 55
256.4
21 8.7 5.2
45
June
24.5 5.4 4.9 4.4 5.4
3.7 3.3 3.0 3.0 2.7
3.05 3.2 2.7 2.7 2.5
2.5 2.6 2.85 3.2 2.9
2.7 2.7 2.9 2.9 3.4
21.5 12.9 9.8 3.0 2.5
Total run-off
gallons *«"* '
637 1,960 1,580 4,840 3,840 11,780 2,270 6,970 2,070 6,360 2,620 8,040
21,560 66,150
2,730 8,390 811 2,490
2,980 9,140 169 518
1,310 4,020 151 463
21,170 64,970
16 ISLAND OF KAUAI
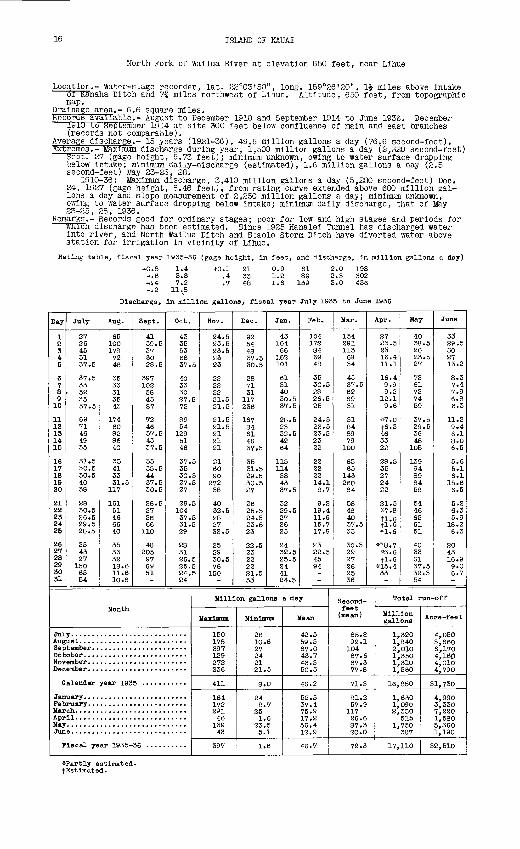
North Fork of Wailua River at elevation 650 feet, near Lihue
Location.- Water-stage recorder, lat. 22°03'50", long. 159°26'20", li miles above intake or Kanaha Ditch and 7f miles northwest of Lihue. Altitude, 650 feet, from topographic map.
Drainage area.- 6.6 square miles.Records available.- August to December 1910 and September 1914 to June 1936. December
1910 to September 1914 at site 300 feet below confluence of main and east branches (records not comparable).
Average discharge.- 15 years (1921-36), 49.5 million gallons a day (76.6 second-feet).Extremes.- Maximum discharge during year, 1,500 million gallons a day (2,320 second-feet)
Sept. 27 (gage height, 5.73 feet); minimum unknown, owing to water surface dropping below intake; minimum daily-discharge (estimated), 1.6 million gallons a day (2.5 second-feet) May 23-25, 28.
1910-36: Maximum discharge, 3,410 million gallons a day (5,280 second-feet) Dec. 24, 1927 (gage height, 8.45 feet), from rating curve extended above 600 million gal lons a day and slope measurement of 2,250 million gallons a day; minimum unknown, owing to water surface dropping below intake; minimum daily discharge, that of May 23-25, 28, 1936.
Remarks.- Records good for ordinary stages; poor for low and high stages and periods for wnicn discharge has been estimated. Since 1925 Hanalei Tunnel has discharged water Into river, and North Wailua Ditch and Stable Storm Ditch have diverted water above station for irrigation in vicinity of Lihue.
Rating table, fiscal year 1935-36 (gage height, In feet,
-0.8
nd discharge, in million gallons a day)
1.4 3.8 7.2
11.8
+0.1 .4
0.9 1.2 1.6
6189
139
2.0 2.5 3.0
198302436
Discharge, In million gallons, fiscal year July 1935 to June 1936
Day
1 2 3 4 5
6 7 8 9 10
11 1213 14 15
16 17 18 19 20
21 22 23 24 25
26 27 28 29 30 31
July
27 26 45 31 37.5
37.5 33 52 35 37.5
69 71 46 49 35
31.5 30.5 30.5 40 38
28 30.5 26.5 29.5 28.5
35 43 27
150 65 54
Aug.
65 100178 7248
35 33 31 35 43
174 60 82 86 40
35 41 33 31.5
117
161 51 46 66 40
35 33 32 18.6 11.6 10.6
Sept.
41 39.5 37 30 28.5
397 102 58 4387
7246 37.5 43 37.5
33 35.5 44 37.5 30.5
28.5 27 2S 66
110
48 205 97 69 51
Oct.
43 35 53 66 37.5
40 33 30 27.5 72
89 54 129 51 46
37.5 35 30.5 27.5 27
29.5 104 37.5 31.5 29
28 31 26.5 25.5 24.5 24
Month
Jul Aug Sep Oct HOT Dec
C
Jan Pet Mar Apr May Jun
F
alendar year 193
e. ...........................
Iscal year 1935-
Nov.
24.5 23.5 23.5 23 23
22 22 22 21.5 21.5
21.5 21.5 21 21 21
21 60 90
272 58
40 32.5 28 27 32.5
25 29 30.5 78 150
Dec.
92 54 48 37.5 30.5
28 71 31
117 236
167 84 61 46 37.5
35 31.5 29.5 30.5 27
26 25.5 24.5 23.5 23
22.5 23 22 22 21.5 33
Jan.
43 164 66
162 101
61 5140 30.5 37.5
28.5 25 32.5 42 64
115 114 58 43 37.5
32 29.5 27 26 25
24 32.5 25.5 24 41 24.5
Feb.
104 172 84 69 48
35 30.5 28 26.5 25
24.5 23.5 23.5 23 22
22 22 22 14.1 8.7
9.2 19.4 11.6 15.7 17.9
23 22.5 45 94
Million gallons a day
Maximum
150 178 397 129 272 236
411
164 172 291 46
139 43
397
Minimum Mean
26 42.5 10.6 59.5 27 67.0 24 43.7 21 43.5 21.5 50.3
8.0 46.2
24 52.5 8.7 37.4
25 75.9 1.6 17.2
23,5 56.4 5.1 12.9
1.6 46.7
Mar.
154 291 113 69 54
43 37.5 62 69 51
51 84 89 79
100
65 65
143 26084
58 48 40 37.5 33
30.5 29 27 26 25 36
Apr.
27 23.5 23 16.4 11.1
16.4 9.9 9.2
12.1 9.6
*7.0 t6.3 46 33 22
28.5 35 27 24 22
21.5 *7.8tl.6 tl.6 fl.6
*18.7 *3.6 tl.6
*15.4 33
Second- feet (mean)
65.8 92.1 104 67.6 67.3 77.8
71.5
81.2 57.9
117 26.6 87.3 20.0
72.3
May
40 38.5 26 23.5 27
72 61 72 74 59
37.5 29.5 36 48
105
139 94 89 84 58
54 46 65 61 51
40 33 61 37.5 32.5 54
June
33 29.5 30 27 13.2
8.3 7.4 7.9 6.8 6.3
11.29.4 6.1 8.0 6.5
5.6 5.1 6.1
15.6 6.5
5.2 6.3 5.9
18.2 6.3
2043 16.9 9.0 6.7
Total run-off
M1l"°n Acre-feet gallons
1,320 4,050 1,840 5,660 2,010 6,170 1,350 4,160 1,310 4,010 1,560 4,790
16,850 51,730
1,630 4,990 1,090 3,330 2,350 7,220
515 1,580 1,750 5,360
387 1,190
17,110 52,510
«Partly estimated. fEstimated.
ISLAND OF KAUAI 17
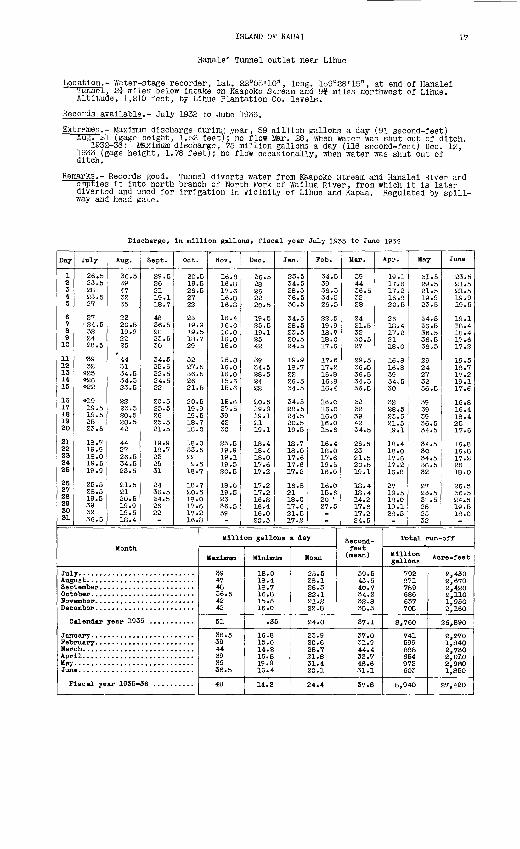
Hanalel Tunnel outlet near Lihue
Location.- Water-stage recorder, lat. 22°05'10", long. Ib9°28'15", at end of Hanalei Tunnel, 2i miles below intake on Kaapoko Stream and 9f miles northwest of Lihue. Altitude, 1,210 feet, by Lihue Plantation Co. levels.
Records available.- July 1932 to June 1936.
Extremes.- Maximum discharge during year, 59 million gallons a day (91 second-feet) Aug. 21 (gage height, 1.52 feet); no flow Mar. 28, when water was shut out of ditch.
1932-36: Maximum discharge, 75 million gallons a day (116 second-feet) Dec. 12, 1933 (gage height, 1.78 feet); no flow occasionally, when water was shut out of ditch.
Remarks.- Records good. Tunnel diverts water from Kaapoko Stream and Hanalei River and empties it into north branch of North Fork of Wailua River, from which it is later diverted and used for irrigation in vicinity of Lihue and Kapaa. Regulated by spill way and head gate.
Discharge, In million gallons, fiscal year July 1935 to June 1936
Day
1 2 3 4 5
6 7a9
10
11 12 13 14 15
16 17 18 19 20
21 22 23 24 25
26 27 28 29 30 31
July
26.5 23.5 28 23.5 27
27 24.5 32 24 28.5
39 32
#25 »26 *22
#19 19.5 19.5 25 23.5
18.7 19.9 18.0 19.5 19.9
25.5 28.5 19.5 39 32 36.5
Aug.
36.5 39 47 32 35
22 20.519.9 82 85
44 31 34.5 34.5 83.5
82 83.5 80.5 20.5 42
44 27 26.5 34.5 23.5
21.5 21 20.5 19.9 19.5 18.4
Sept.
29.5 26 21 19.1 18.7
48 36.5 28 23.5 30
34.5 25.5 22.5 24.5 22
20.5 25.5 26 25.5 21.5
19.9 18.7 23 25 31
24 36.5 34.5 26 22
Oct.
20.5 19.5 26.5 27 22
23 19.9 19.5 18.7 29
32 27.5 36.5 26 21.5
20.5 19 »9 19.5 18.7 18.0
18.0 33.5 22 19.5 18.7
18.7 20.5 18.0 17.6 17.2 16.8
Month
Jul Aug Sep Oet Hov Dec
C
Jan Peb Mar Apr May Jun
P
alendar year 1935 ...........
Iscal year 1935-
Nov.
16.8 16.8 17.6 16.8 16.8
16.4 16.0 16.0 16.0 16.0
16.0 16.0 16.0 15.615.6
15.6 27.5 39 42 30
23.5 19.9 19.1 19.5 20.5
18.0 19.5 23 36.5 39
Dec.
36.5 28 26 22 20.5
19.5 25.5 19.1 25 42
39 34.5 88.5 84 82
80.5 19.9 19.1 81 19.1
18.4 18.4 18.0 17.6 17.2
17.2 17.2 16.8 16.4 16.0 20.5
Jan.
23.5 34.5 28.5 36.5 36.5
34.5 28.5 23.5 20.5 24.5
19.9 18.7 22 26.5 34.5
34.5 28.5 24.5 20.5 19.5
18.7 18.0 17.6 17.6 17.2
16.8 21 18.0 17.6 21.5 17.2
Feb.
34.5 39 36.5 34.5 26.5
22.5 19.9 18.7 18.0 17.6
17.6 17.2 16.8 16.8 16.4
16.0 16.0 16.0 16.0 15.6
16.4 18.0 17.6 19.5 16.0
16.0 15,6 20 l 27.5
Million gallons a day
Maximum
39 47 48 36.5 42 42
51
36.5 39 44 39 39 36.5
48
Minimum
18.0 18.4 18.7 16.8 15.6 16.0
.35
16.8 15.6 14.2 16.8 19.9 16.4
14.2
Mean
25.5 28.1 26.3 22.1 21.2 22.8
24.0
23.9 20.6 28.7 21.8 31.4 20.1
24.4
Mar.
39 44 36.5 32 28
24 21.5 32 30.5 27
29.5 36 .S 36.5 34.5 36.5
32 32 39 42 34.5
26.5 23 21.5 20.5 19.1
18.4 18.4 14.2 17.6 17.2 24.5
Apr.
19.1 17.6 17.2 16.8 20.5
26 18.4 17.2 21 18.0
16.8 16.8 39 34.5 30
3228.5 83.5 21.5 19.1
18.4 18.0 17.6 17.2 16.8
27 19.5 18.0 19.1 88.5
Second- feet (mean)
39.5 43.5 40.7 34.2 32.8 35.3
37.1
37.0 31.9 44.4 33.7 48.6 31.1
37.8
May
31.5 29.5 21.5 19.9 23.5
34.5 36.5 36.5 36.5 36.5
29 24 27 32 36.5
39 39 39 36.5 34.5
34.5 30 34.5 36.5 32
27 23.5 31.5 25 23 32
June
23.5 21.5 21.5 19.9 19.5
19.1 18.4 18.4 17 »6 17.2
19.5 18.7 17.2 19.1 17.6
16.8 16.4 18.4 25 17.6
16.8 16.8 17.2 26 18.0
26.5 36.5 24.5 19.5 18.0
Total run-off
Million gallons
792 871 789 686 637 705
8,760
741 599 888 654 972 603
8,940
Acre-feet
2,430 2,670 2,420 2,110 1,950 2,160
26,890
2,270 1,840 2,730 2,010 2,980 1,850
27,420
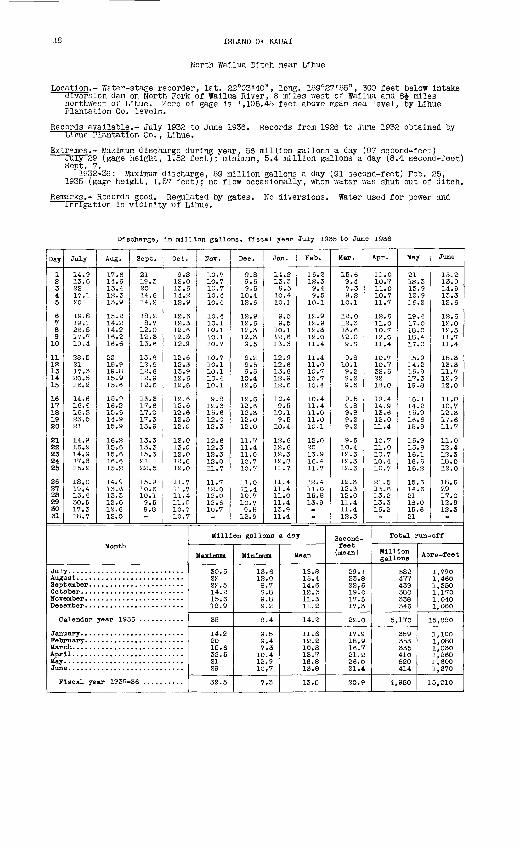
18 ISLAND OF KAUAI
North Wallua Ditch near Lihue
Location.- Water-stage recorder, lat. 22°03'40", long. 159°27'55", 300 feet below intake diversion dam on North Fork of Wailua River, 8 miles west of Wailua and 8J- miles northwest of Llhue. Zero of gage is 1,105.45 feet above mean sea level, by Lihue Plantation Co. levels.
Records available.- July 1932 to June 1936. Lihue Plantation Co. , Lihue.
Records from 1926 to June 1932 obtained by
Extremes.- Maximum discharge during year, 56 million gallons a day (87 second-feet)July 29 (gage height, 1.52 feet); minimum, 5.4 million gallons a day (8.4 second-feet) Sept. 7.
1932-36: Maximum discharge, 59 million gallons a day (91 second-feet) Feb. 25, 1935 (gage height, 1.57 feet); no flow occasionally, when water was shut out of ditch.
Remarks.- Records good. Regulated by gates. No diversions. irrigation in vicinity 'of Lihue.
Water used for power and
Discharge, In million gallons, fiscal year July 1935 to June 1936
Day
1 2 3 4 5
6 7 8 9 10
11 12 13 14 15
1617 18 19 20
21 22 23 24 25
26 27 28 29 30 31
July
14.9 13.6 22 17.1 20
19.8 19.1 26.5 17.7 19.4
28.5 21 17.3 20.5 16.2
14.6 16.5 16.2 23.5 21
14.9 16.9 14.9 17.6 15.2
18.0 19.4 13.6 30.5 17.3 18.7
Aug.
17.6 14.6 13.4 12.3 13.9
15.2 14.214.2 16.2 16.5
22 18.9 19.8 15.915.6
15.9 16.2 15.6 14.9 15.9
16.2 15.6 15.6 16.6 15.2
14.9 13.6 13.3 12.6 12.6 12.0
Sept.
21 19.3 20 14.6 14.2
18.2 8.7
12.0 12.3 13.6
13.6 12.9 12.6 12.9 12.6
13.3 17.6 17.0 17.3 13.9
13.3 13.3 15.3 21 22.5
15.9 10.6 10.1 9.5 9.8
Oct.
9.8 12.0 13.6 14.2 12.9
12.6 12.3 12.6 12.3 12.9
12.6 12.3 13.9 12.6 12.6
12.6 12.6 12.6 12.3 12.0
12.0 13.0 12.0 12.6 12.0
11.7 11.7 11.4 11.0 10.7 10.7
Month
Jul Aug Sep Oet Nov Dee
C
Jan Feb Mar Apr May Jun
P
alendar year 19C
e. ...........................
iscal year 1935-
Nov.
10.7 10.7 10.7 10. 10.
10. 10. 10. 10. 10.
10. 10. 10.10. 10.
9 . 3 12. 15. 12. 12.
12. 12. 12. 12.11.
11. 12. 12. 12. 10.7
Dec.
9.8 9.5 9.510.4 12.6
12.9 12.6 12.3 12.3 9.5
9.2 9.5 9.5
10.4 12.6
12.6 12.6 12.3 12.0 12.0
11.7 11.4 11.0 10.7 10.7
11.0 11.4 10.7 10.7 9.5
12.9
Jan.
14.2 13.3 9.5
10.4 10.1
9.5 9.5
10.1 12.6 13.3
12.9 12.6 13.6 12 . 9 12.6
10.4 9.5
10.1 9.5 10.4
12.6 12.6 12.3 12.0 11.7
11.4 11.4 11.0 11.4 13.9 11.4
Pel).
15.2 12.3 9.4 9.5
10.1
12.9 12.9 12.3 12.0 11.4
11.4 11.0 10.7 10.7 10.4
10.4 11.4 11.0 11.0 10.1
12.0 20 13.9 16.411.7
12.4 11.0 15.8 13.9
Million gallons a day
Maximum
30.5 22 22.5 14.2 15.6 12.9
35
14.2 20 15.6 32.5 21 29
32.5
Minimum
13.6 12.0 8.7 9.8 9.8 9.2
8.4
9.5 9.4 7.3
10.4 12,9 10,7
7.3
Mean
18.8 15.4 14.6 12.3 11.3 11.2
14.2
11.6 12.2 10.8 13.7 16.8 13.8
13.5
Mar.
15.6 9.4 7.3 9.2
10.1
12.0 12.3 13.6 12.0 9.S
9.8 10.1 9.2 9.2 9.5
9.5 9.8 9.8 9.2 9.2
9.5 10.4 12.3 12.3 12.3
12.3 12.3 12.011.4 11.4 12.3
Apr.
11.0 10.7 11.0 10.7 11.7
12.6 11.0 10.7 12.6 11.4
10.7 10.7 32.5 2218.0
19.4 14.9 13.6 12.011.4
10.7 11.0 10.7 10.4 10.7
21.5 13.5 13.2 13.3 16.2
Second- feet (mean)
29.1 23.8 22.6 19 lo 17.5 17.3
22.0
17.9 16.9 16.7 21.2 26.0 21.4
20.9
May
21 IS. 3 13.9 12 9 16.2
19.4 17.0 18.0 18.4 17.0
15.9 14.2 15.9 17.3 19.8
16.1 14.2 15.9 16.6 15.9
15.9 15.9 16.1 16.6 16.2
15.6 14.6 21 1S.O 15.6 21
June
15.2 13.9 14.9 13.3 12.6
12.6 12.0 12.3 11.7 11.4
15.3 13.3 11.7 12.9 12.0
11.0 10.7 12.3 17.6 11.7
11.0 12.4 12.3 18.0 12.0
18.6 29 17.0 12.9 12.3
Total run-off
Million gallons
582 477 439 380 338 346
5,170
359 353 335 410 520 414
4,950
Acre-feet
1,790 1,460 1,350 1,170 1,040 1,060
15,880
1,100 1,080 1,030 1,260 1,600 1,270
15,210
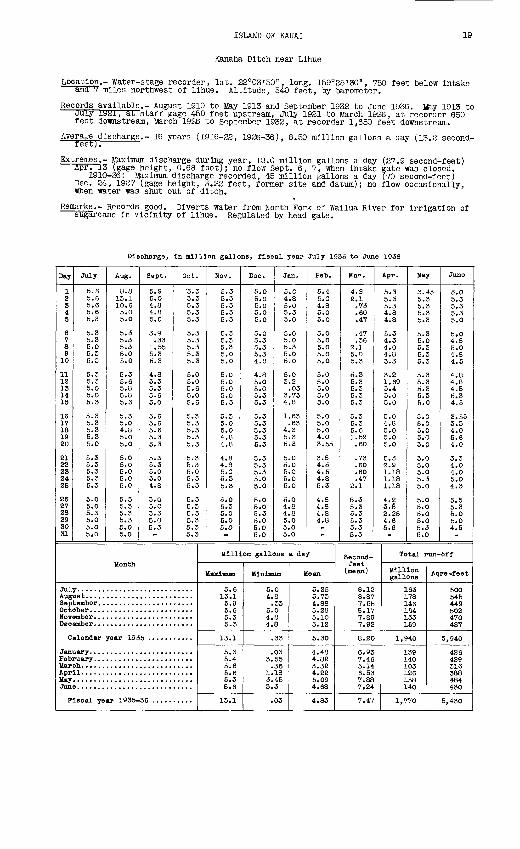
ISLAND OF KAUAI 19
Kanaha Ditch near Lihue
Location.- Water-stage recorder, lat. 22°03'50", long. 159°25'30", 750 feet below intake ana 7 miles northwest of Lihue. Altitude, 540 feet, by barometer.
Records available.- August 1910 to May 1913 and September 1932 to June 1936. May 1913 to duly iasjl, at staff gage 450 feet upstream, July 1921 to March 1926, at recorder 650 feet downstream, March 1926 to September 1932, at recorder 1,650 feet downstream.
Average d 1 scharge.- 16 years (1916-22, 1926-36), 8.50 million gallons a day (13.2 second- reetj.
Extremes.- Maximum discharge during year, 18.0 million gallons a day (27.9 second-feet) Apr. 13 (gage height, 0.68 foot); no flow Sept. 6, 7, when intake gate was closed.
1910-36: Maximum discharge recorded, 45 million gallons a day (70 second-feet) Dec. 84, 1927 (gage height, 3.22 feet, former site and datum); no flow occasionally, when water was shut out of ditch.
Remarks.- Records good. Diverts water from North Fork of Wallua River for irrigation of sugarcane in vicinity of Lihue. Regulated by head gate.
Discharge, In million gallons, fiscal year July 1935 to June 1936
Day
1 2 3 4 5
6 7 8 910
11 12 13 14 15
16 17 18 19 20
21 22 23 24 25
26 27 28 29 30 31
July
5.6 5.6 5.6 5.6 5.3
5.3 5.3 5.0 5.3 5.3
5.3 5.3 5.0 5.0 5.3
5.3 5.3 5.3 5.3 5.0
5.3 5.3 5.3 5.3 5.3
5.0 5.0 5.3 5.0 5.0 5.0
Aug.
8.8 13.1 10.6 5.0 5.0
5.3 5.3 5.3 5.0 5.0
5.3 5.6 5.8 5.8 5.3
5.3 5.0 4.8 5.0 5.0
5.0 5.0 5.0 5.0 5.0
5.3 5.3 5.3 5.3 5.0 5.0
Sept.
5.9 5.0 4.8 4.8 5.0
3.9 .33
1.55 5.3 5.3
4.8 5.3 5.3 5.6 5.0
5.6 5.6 5.6 5.3 5.3
5.3 5.3 5.0 5.0 4.8
5.0 5.0 5.3 5.0 5.3
Oct.
'5.3 5.3 5.3 5.3 5.3
5.3 5.3 5.3 5.3 5.3
5.0 5.0 5.6 5.0 5.6
5.3 5.3 5.3 5.3 5.3
5.3 5.3 5.0 5.3 5.3
5.3 5.3 5.3 5.3 5.3 5.3
Month
Jul Augi Sep Oct HOT Dec
C
Jan Peb Mar Apr May Jun
P
alendar year 193
Iscal year 1935-
Nov.
5.3 5.3 5.3 5.3 5.3
5.3 5.3 5.3 5.0 5.0
5.0 5.0 5.0 5.0 5.3
5.3 5.0 5.04.8 4.8
4.8 4.8 5.0 5.3 5.3
5.0 5.3 5.0 5.0 5.0
Dec.
5.0 5.0 5.0 5.0 5.0
5.0 5.3 5.3 5.3 4.8
4.8 5.0 5.0 5.3 5.3
5.3 5.3 5.3 5.3 5.3
5.3 5.3 5.3 5.0 5.0
5.0 5.0 5.3 5.0 5.0 5.0
Jan.
5.0 4.8 5.0 5.3 5.0
5.0 5.0 5.3 5.0 5.0
5.03.2 .03
3.75 4.8
1.63 .63
4.3 5.3 5.3
5.0 5.0 5.0 5.0 5.0
5.0 4.8 4.8 5.0 5.0 5.0
Peb.
5.4 5.0 4.8 5.0 5.0
5.0 5.0 5.0 5.0 5.0
5.0 5.0 5.0 5.0 9.0
5.0 5.0 5.0 4.0 3.55
3.8 4.5 4.5 4.8 5.3
4.8 4.8 4.8 4.8
Million gallons a day
Maximum
5.6 13.1 5.9 5.6 5.3 5.3
13.1
5.3 5,4 5.6 5.6 5.3 5.6
13.1
Minimum
5.0 4.8 .33
5.0 4.8 4.8
.33
.03 3.55 .36
1.18 3.45 3.3
.03
Mean
5.25 5.73 4.88 5.28 5.10 5.12
5.30
4.48 4.82 3.32 4.22 5.09 4.68
4.83
Mar.
4.8 2.1 .73 .60 .47
.47
.36 2.1 5.0 5.3
5.3 5.3 5.3 5.3 5.3
5.3 5.3 5.6 1.52 .60
.73
.60
.60
.47 2.1
5.3 5.3 5.3 5.3 5.3 5.3
Apr.
5.3 5.3 5.3 4.8 4.8
5.3 4.3 4.0 4.8 5.3
3.2 1.69 5.4 5.0 5.0
5.0 4.8 5.0 5.0 5.0
5.3 2.9 1.18 1.18 1.18
4.8 3.8 2.25 4.6 5.6
Second- feet
(mean)
8.12 8.87 7.55 8.17 7.89 7.92
8.20
6.93 7.46 5.14 6.53 7.88 7.24
7.47
May
3.45 5.3 5.3 5.3 5.3
5.3 5.0 5.3 5.3 5.3
5.3 5.3 5.3 5.3 5.0
5.0 5.0 5.0 5.0 5.0
5.0 5.0 5.0 5.3 5.0
5.0 5.0 5.0 5.0 5.3 5.0
June
5.0 5.3 5.3 5.3 5.0
5.0 4.8 5.0 4.8 4.5
4.8 4.8 4.5 5.3 4.5
3.55 3.3 4.0 5.6 4.0
3.3 4.0 4.0 5.0 4.3
5.5 5.3 5.0 5.0 4.5
Total run-off
S££ A 163 500178 545 146 449 164 502 153 470 159 487
1,940 5,940
139 426 140 429 103 316 126 388 158 484 140 450
1,770 5,430
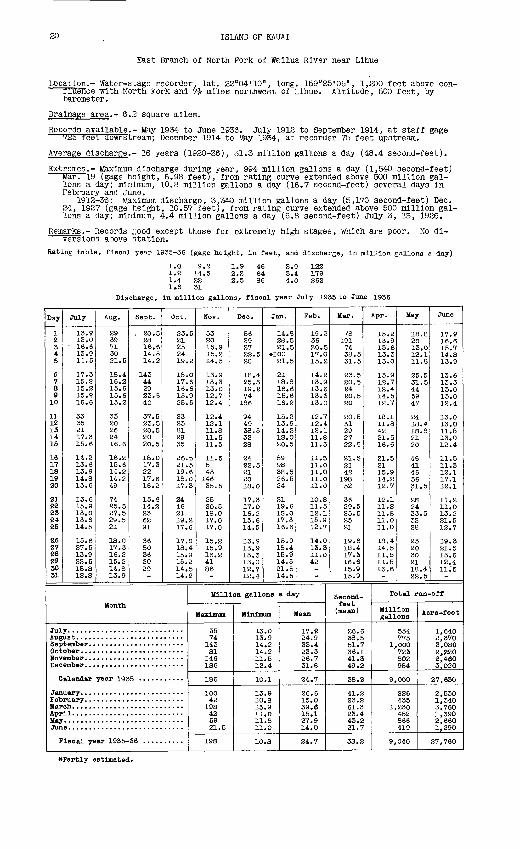
20 ISLAND OF KAUAI
East Branch of North Fork of Wailua River near Lihue
Location.- Water-stage recorder, lat. 22°04'10", long. 159°25'05", 1,200 feet above con- riuence with North Fork and 7J- miles northwest of Lihue. Altitude, 500 feet, by barometer.
Drainage area.- 6.2 square miles.
Records available.- May 1934 to June 1936. July 1912 to September 1914, at staff gage 7Bb feet downstream; Dec-ember 1914 to May 1934, at recorder 75 feet upstream.
Average discharge.- 16 years (1920-36), 31.3 million gallons a day (48.4 second-feet).
Extremes.- Maximum discharge during year, 994 million gallons a day (1,540 second-feet) Mar. 19 (gage height, 6.98 feet), from rating curve extended above 500 million gal lons a day; minimum, 10.8 million gallons a day (16.7 second-feet) several days in February and June.
1912-36: Maximum discharge, 3.340 million gallons a day (5,170 second-feet) Dec. 24, 1927 (gage height, 10.57 feet), from rating curve extended above 500 million gal lons a day; minimum, 4.4 million gallons a day (6.8 second-feet) July 3, 13, 1926.
Remarks.- Records good except those for extremely high stages, which are poor. No di versions above station.
Rating table, fiscal year 1935-36 (gage height, In feet, and discharge, In million gallons a day)
1.0 1.2 1.4 1.6
9.214.522
1.9 2.2 2.5
2.9 3.4 4.0
122179262
Discharge, In million gallons, fiscal year July 1935 to June 1936
Day
1 2 3 4 5
6 7 8 9
10
11 12 13 14 15
16 17 18 19 20
21 22 23 24 25
2.6 27 28 29 30 31
July
13.9 13.0
' 16.6 13.9 14.5
17.3 15.2 15.2 15.9 16.6
33 35 21 17.3 15.6
14. 2 13.5 13.9 14.8 15.6
13.6 15.9 13.0 13.6 14.5
15.6 27.5 13.9 22.5 18. S 1S.S
Aug.
29 39 71 30 21.5
18.4 16.2 15.6 15.6 15.2
33 20 26 2416.6
16.2 15.6 14.2 14.2 49
74 25.5 27.5 29.5 21
1S.O 17.3 16.2 15.2 14.8 13.9
Sept.
, 20.5 28 16.6 14.5 14.2
143 44 29 23.5 40
37.5 23.5 20.5 20 20.5
18.0 17.3 22 17.6 16.2
15.6 14.2 23 62 91
36 80 36 30 29
Oct.
23.5 21 25 24 19.2
18.0 17.6 16.6 15.9 25.5
23 23 81 29 35
26.5 21.5 19.6 18.0 17.3
24 46 21 19.2 17.6
17.0 18.4 15.9 15.2 14.5 14.2
Month
Jul Aug Sep Oct Mov Dec
C
Jan Feb Hal- Apr May Jun
F
alendar year 1935 ...........
e. ...........................
Iscal year 1935-
Hov.
53 20 15.9 15.2 14.5
13.9 13.3 13.0 12.7 12.4
12.4 12.1 11.8 11.5 11.5
11.5 51 43
146 35.5
25 20.5 18.0 17.0 17.0
15.2 15.9 16.2 41 86
Dec.
56 29 27 22.5 20
18.4 25.5 19.2 74
186
94 49 38.5 32 28
24 22.5 21 20 18.0
17.3 17.0 16.2 15.6 14.5
13.9 13.9 13.3 13.0 12.7 12.4
Jan.
14.8 28.5 21.5
*100 21.5
21 18.8 16.6 15.6 16.2
15.2 13.9 14.2 13.0 20.5
89 93 38.5 26.5 24
21 19.6 13.0 17.3 16.6
15.9 18.4 15.9 14.5 21.5 14.5
Feb.
19.2 36 20.5 17.0 15.2
14.2 13.9 13.6 13.3 13.0
12.7 12.4 12.1 11.8 11.5
11.5 11.0 11.0 11.0 11.0
10.8 11.5 12.1 15.9 12.7
14.0 13.3 11.0 42
Million gallons a day
Maximum
35 74
143 31 146 136
186
100 42
193 42 59 21.5
193
Minimum Mean
13.0 17.2 13.9 24.9 14.2 33.4 14.2 23.3 11.5 26.7 12.4 31.8
10.1 24^7
13.9 26.6 10.8 15.0 15.9 39.6 11.0 15.1 11.8 27.9 11.0 14.0
10.3 24.7
Mar.
78 191 74 38.5 31.5
23.5 20.5 24 20.5 20
20.5 31 29 27 22.5
21.5 21 42
198 52
36 29.5 25.5 25 21
19.6 18.4 17.3 16.6 15.9 15.9
Apr.
15.2 13.9 13.6 13.3 13.0
13.9 12.7 12.4 14.5 IS. 7
12.1 11.8 42 21.5 16.6
21.5 21 15.9 14.2 12.7
12.1 11.3 11,5 11.0 11.0
18.4 14,5 11.8 11.5 13.6
Second- feet (mean)
26.6 38.5 51.7 36.1 41.3 49.2
38.2
41.2 23.2 61.3 23.4 43.2 21.7
33.2
May
18.8 20 13.0 12.1 11.8
25.5 31.5 4459 47
2418.4 13.8 21 20
46 41 46 36 31.5
23 24 33.5 3228
23 20 30 21 18.4 22.5
June
17.9 16.6 15.7 14.3 13.9
13.6 13.3 13.0 13.0 12.4
13.0 13.0 11.8 13.0 12.4
11.5 11.3 12.1 17.1 12.1
11.2 11.0 13.2 21,5 12.7
19.3 21.5 13.6 12.4 11 .'5
Total run-off
Million gallons
534 773
1,000 723 802 984
9,000
326 435
1,230 452 866 419
9,040
Acre -feet
1,640 2,370 3,030 2,220 2,460 3,020
27,630
2,530 1,340 3,760 1,390 2,660 1,290
27,760
*Partly estimated.
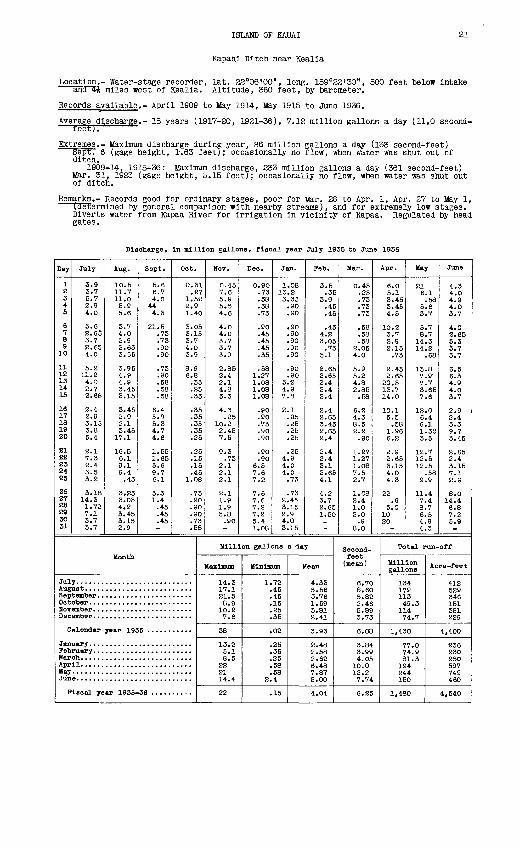
ISLAND OF KAUAI 21
Kapahi Ditch near Kealia
Location.- Water-stage recorder, lat. 22°06'00", long. 159°22'30't , 500 feet below intake ana 44 miles west of Kealia. Altitude, 360 feet, by barometer.
Records available.- April 1909 to May 1914, May 1915 to June 1936.
Average discharge.- 18 years (1917-20, 1921-36), 7.12 million gallons a day (11.0 second- reetj.
Extremes.- Maximum discharge during year, 86 million gallons a day (133 second-feet) sept. 6 (gage height, 1.63 feet); occasionally no flow, when water was shut out of ditch.
1909-14, 1915-36: Maximum discharge, 233 million gallons a day (361 second-feet) Mar. 31, 1923 (gage height, 3.15 feetj; occasionally no flow, when water was shut out of ditch.
Remarks.- Records good for ordinary stages, poor for Mar. 28 to Apr. 1, Apr. 27 to May 1, (determined by general comparison with nearby streams), and for extremely low stages. Diverts water from Kapaa River for irrigation in vicinity of Kapaa. Regulated by head gates.
Discharge, In million gallons, fiscal year July 1935 to June 1936
Day
1 2 3 4 5
6 7 8 9
10
11 12 13 14 15
16 17 18 19 20
21 22 23 24 25
26 27 28 29 30 31
July
3.9 3.75.7 2.9 4.0
5.6 2.66 3.7 2.65 4.0
5.2 11.2 4.0 2.7 2.65
2.4 2.9 3.15 3.8 5.4
2.1 7.3 2.4 3.5 3.2
3.15 14.3 1.78 7.1 3.7 3.7
Aug.
10.5 11.7 11.0 5.9 5.6
3.7 4.0 2.9 2.65 3.55
3.95 4.9 4.9 3.45 3.15
3.45 2.9 2.1 3.45
17.1
16.5 6.1 9.19.4
.45
3.25 3.05 4.2 3.45 3.15 2.9
Sept.
5.6 6.7 4.0
44 4.3
21.5 .73 .73 .90 .90
.73
.90
.58
.58
.58
6.4 5.9 5.3 4.7 4.6
1.55 1.65 5.6 9.7 6.1
5.3 1.4
.45
.45
.45
Oct.
0.31 .27
1.52 2.9 1.40
3.05 3.15 3.7 4.0 3.9
8.9 6.8
.35
.25
.35
.35
.35
.35
.35
.25
.25
.15
.15
.45 1.08
.73
.90
.90
.90
.73
.58
Month
Jul Aug Sep Oct HOY Dec
C
Jan Fob Mar Apr May Jun
P
alendar year 19;
iscal Tear 1935-
Nov.
0.45 7.6 5.9 5.5 4.6
4.0 4.0 3.7 3.7 3.9
2.852.4 2.1 4.8 5.3
4.3 .25
10.2 2.45 7.5
9.3 .73
2.1 2.1 2.1
2.1 1.9 1.9 5.8
.90
Dec.
0.90 .73 .58 .58 .73
.90
.45
.45
.45
.35
.58 1.27 1.08 1.08 1.08
.90
.90
.73
.90
.90
.90
.906.5 7.6 7.2
7.6 7.6 7.2 7.2 5.4 1.08
Jan.
1.08 13.2 3.35
.90
.90
.90
.90
.90
.90
.90
.90
.90 5.2 4.9 7.8
2.1 .35 .25 .25 .25
.25 4.9 4.0 4.0
.73
.73 2.45 3,15 2.9 4.0 3.15
Feb.
3.5 .35
3.9 .45 .45
.45 4.2 3.05
.73 5.1
2.65 2.65 2.4 2.4 2.4
2.4 2.65 3.45 2.65 2.4
2.4 2.4 3.1 2.65 4.1
4.2 3.7 2.65 1.50
Million gallons a day
MaxljBU&i
14.3 17.1 21.5 8.9
10.2 7.6
38
13.25.1 8.5
22 21 14.4
22
Minimum
1.72 .45 .45 .15 .25 .35
.02
.25
.35
.25
.58
.58 2.4
.15
Mean
4.33 5.56 3.76 1.59 3.81 2.41
3.93
2.48 2.58 2.62 6.48 7.87 5.00
4.04
Mar.
0.45 .25 .73 .73 .73
.58
.58
.58 2.05 4.0
5.9 5.2 4.8 2.85
.58
G.Z 4.3 8.5 2.2
.90
1.27 1.27 1.08 7.5 2.7
1.08 2.4 1.0 2.0
.9 8.0
Apr.
6.05.1 3.45 3.45 4.5
10.2 3.7 2.9 2.15
.73
2.45 2.65
20.5 13.7 14.0
10.1 5.5
.58 1.96 6.2
2.9 2.65 3.15 4.0 4.3
22 .6
5.0 10 20
Second- feet
(mean)
6.70 8.60 5.82 2.46 5.89 3.73
6.08
3.84 3.99 4.05
10.0 12.2 7.74
6.25
May
216.1 .58
5.6 3.7
5.7 8.7
14.3 14.2
.68
15.8 7.9' 7.7 3.65 7.6
12.0 6.4 6.1 1.32 3.5
12.7 12.5 12.5
.58 9.9
11.4 7.4 8.7 6.5 4.9 4.3
June
4.3 4.0 4.9 4.0 3.7
4.0 2.65 5.33,7 3.7
6.5 6.3 4.9 4.0 3.7
2.9 2.4 5.3 9.7 3.45
2.65 2.4 3.15 7.1 2.9
8.0 14.4 6.8 7.2 5.9
Total run-off
Million gallons
134 172 113 49.3
114 74.7
1,430
77.0 74.9 81.3
194 244 150
1,480
Acre-feet
412 529 340 151 351 229
4,400
236 230 250597 749 460
4,540
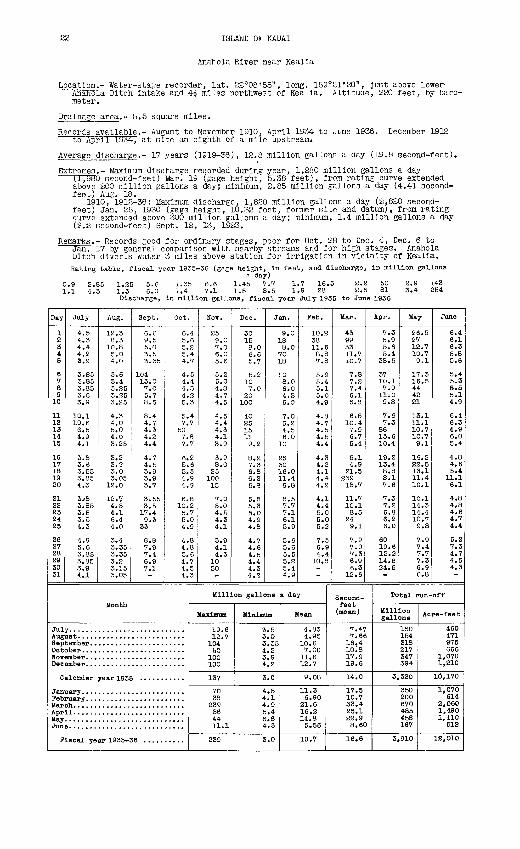
22 ISLAND OF KAUAI
Anahola River near Kealia
Location.- Water-stage recorder, lat. 22°08'55", long. 159°21'20", Just above Lower- Anahola Ditch Intake and 4| miles northwest of Kealia. Altitude, 220 feet, by baro meter.
Drainage area.- 5.5 square miles.
Records available.- August to November 1910, April 1934 to June 1936. December 1912 to April 1934, at site an eighth of a mile upstream.
Average discharge.- 17 years (1919-36), 12.8 million gallons a day (19.8 second-feet).
Extremes.- Maximum discharge recorded during year, 1,280 million gallons a. day(1,980 second-feet) Mar. 19 (gage height, 5.38 feet), from rating curve extended above 200 million gallons a day; minimum, 2.85 million gallons a day (4.41 second- feet) Aug. 18.
1910, 1912-36: Maximum discharge, 1,820 million gallons a day (2.820 second- feet) Jan. 25, 1930 (gage height, 10.32 feet, former site and datum), from rating curve extended above 300 million gallons a day; minimum, 1.4 million gallons a day (2.2 second-feet) Sept. 12, 13, 1923.
Remarks.- Records good for ordinary stages, poor for Oct. 28 to Dec. 4, Dec. 6 to Jan. 17 by general comparison with nearby streams and for high stages. Anahola Ditch diverts water 3 miles above station for Irrigation In vicinity of Kealia.Rating table, fiscal year 1935-36 (gage height, in feet, and discharge, in million gallons
a day) 0.9 2.85 1.25 5.6 1.35 6.6 1.45 7.7 1.7 16.5 2.2 50 2.9 143 1.1 4.3 1.3 6.0 1.4 7.1 1.5 8.5 1.9 28 2.5 81 3.4 254
Discharge, in million gallons, fiscal year July 1935 to June 1936
Day
1 2 3 4 5
6 7 8 9
10
11 12 13 14 15
16 17 18 19 20
21 22 23 24 25
26 27 28 29 30 31
July
4.5 4.3 4.4 4.2 3.9
3.85 3.85 3.85 3.6 3.9
10.1 19.6 6.5 4.9 4.1
3.8 3.6 3.55 3.85 4.3
3/8 3.85 3.5 3.5 4.3
4.9 5.6 3.85 3.85 3.9 4.1
Aug.
12.3 8.fi
10.8 5.0 4.0
3.6 3.4 3.25 3.25 3.25
4.3 4.0 5.0 4.0 3.25
3.2 3.9 3.0 3.05
12.0
12.7 4.5 4.1 6.4 4.0
3.4 3.35 3.35
3.15 3.05
Sept.
6.6 9.5 5.0 3.5 3.35
104 13.0 7.0 5.78.5
8.4 4.7 4.3 4.2 4.4
4.7 4.5 3.9 3.9 3.7
3.55 3.5
17.4 9.3
33
8.8 7.9 7.4 6.9 7.1
Oct.
6.4 5.6 5.2 5.4 4.7
4.5 4.4 4.5 4.2 5.3
5.4 7.7
50 7.8 7.7
6.2 5.6 5.3 4.9 4.9
6.8 10.2 5.7 5.0 4.9
4.8 4.8 5.6 4.7 4.5 4.3
Month
Jul Augi Sap Oct HOT Dec
C
Jan Feb Mar Apr May Jun
F
alendar year 193!
iscal year 1935-,
Nov.
25 9.0 7.0 6.0 5.6
5.2 5.0 4.8 4.7 4.5
4.5 4.4 4.3 4.1 3.9
3.9 8.0
25 100 15
7.0 5.0 4.5 4.3 4.1
3.9 4.1 4.3
10 50
Dec.
30 15 8.0 6.6 5.7
5.2 10 7.0
20 100
40 25 15 11 9.2
8.2 7.3 6.8 6.2 5.8
5.5 5.35.0 4.9 4.8
4.7 4.6 4.5 4.4 4.3 4.2
Jan.
9.0 18 8.0 70 18
10 8.0 6.0 4.5 6.0
7.0 5.2 4.5 6.0
10
25 30 16.0 11.4 9.8
8.5 7.7 7.1 6.1 5.9
5.6 5.6 5.5 5.2 5.4 4.9
Million gallons
Maximum
19.6 12.7 104 50
100 100
137
70 38
239 86 44 11.1
239
Minimum
3.5 3.0 3.35 4.2 3.9 4.2
3.0
4.5 4.1 4.9 5.4 6.8 4.3
3.0
Feb.
10.2 38 11.6 8.8 7.8
5.9 5.4 5.1 5.0 4.9
4.8 4.7 4.5 4.5 4.4
4.34.2 4.1 4.44.2
4.1 4.4 5.0 5.0 5.2
7.5 6.9 4.4
10.8
a day
Mean
4.83 4.95 10.6 7.00
11.6 12.7
9.08
11.3 6.90
21.6 16.2 14.8 5.56
10.7
Mar.
43 99 33 11.7 10.7
7.8 7.2 7.4 6.1 5.8
6.8 10.4 7.9 6.7 5.4
5.1 4.9
21.5 239 18.7
11.7 10.1 8.5
24 9.1
7.9 7.9 7.3 6.9 6.3
12.6
Second- feet (mean)
7.47 7.66
16.4 10.8 17.9 19.6
14.0
17.5 10.7 33.4 25.1 22.9 8.60
16.6
Apr.
7.3 5.9 5.6 5.4
38.5
37 10.1 7.9
11.0 9.8
7.6 7.3
86 13.6 10.4
19.2 13.4 8.8 8.1 7.6
7.3 7.2 6.8 6.2 6.0
60 19.6 12.2 14.6 24.5
May
26.5 27 12.7 10.7 9.1
17.3 16.5 44 42 21
13.1 11.1 10.7 10.7 9.1
16.2 22.5 13.1 11.4 10.1
10.1 14.3 14.4 10.7 9.8
7.9 7.4 7.7 7.3 6.9 6.8
June
6.4 6.1 6.3 5.8 5.6
5.4 5.3 5.5 5.1 4.9
6.4 6.3 4.9 6.0 5.4
4.8 4.6 5.4
11.1 6.1
4.8 4.8 4.6 4.7 4.4
5.2 7.3 4.7 4.5 4.3
Total run-off
Million gallons
150 154 318 217 347 394
3,320
350 200 670 485 453 167
3,910
Acre-feet
460 471 975 666
1,070 1,210
10,170
1,070 614
2,060 1,490 1,410
512
12,010
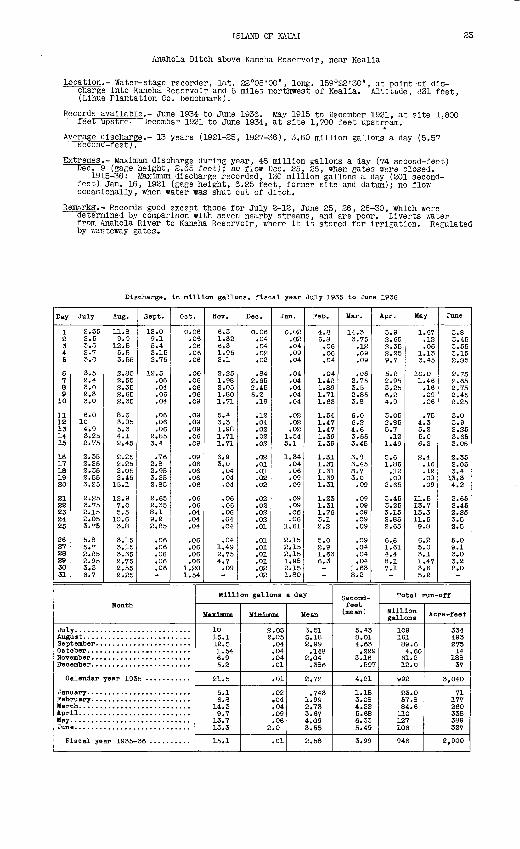
ISLAND OF KAUAI
Anahola Ditch above Kaneha Reservoir, near Kealia
Location.- Water-stage recorder, lat. 22°08'00", long. 159°22'30" charge into Kaneha Reservoir and 5 miles northwest of Kealia. (Lihue Plantation Co. benchmark).
, at point -of dis- Altitude, 831 feet,
Records available.- June 1934 to June 1936. May 1915 to December 1921, at site 1,800 reet upstre. " December 1921 to June 1934, at site 1,700 feet upstream.
Average discharge.- 13 years (1921-25, 1927-36), 3.E second-feet;.
million gallons a day (5.57
Extremes.- Maximum discharge during year, 48 million gallons a day (74 second-feet) Dec. 9 (gage height, 2.65 feet); no flow Dec. 25, 26, when gates were closed.
1915-36: Maximum discharge recorded, 130 million gallons a day (201 second- feet) Jan. 16, 1921 (gage height, 6.25 feet, former site and datum); no flow occasionally, when water was shut out of ditch.
Remarks'.- Records good except those for July 2-12, June 25, 26, 28-30, which were determined by comparison with seven nearby streams, and are poor. Diverts water from Anahola River to Kaneha Reservoir, where it is stored for irrigation. Regulated by wasteway gates.
Discnarge, in million gallons, fiscal year July 1935 to June 1936
Day
1 2 3 4 5
6 7 8 9
10
11 12 1314 15
16 17 18 19 20
21 22 23 24 25
26 27 28 29 30 31
July
2.55 2.5 3.5 2.7 3.0
3.5 2.4 3.0 2.3 3.0
6.0 10 4.9 3.25 2.75
2.35 2.25 2.35 2.55 3.25
2.25 3.75 £.15 2.05 3.75
5.8 5.7 2.25 2.95 3.3 6.7
Aug.
11.8 9.0
12.5 5.5 3.55
2.85 2.55 2.35 2.65 2.35
8.6 3.95 5.3 4.1 2.45
2.25 2.25 2.05 2.45
15.1
12.9 7.0 5.5
10.6 3.8
3.15 3.15 3.35 2.75 2.55 2.25
Sept.
12.0 9.1 5.4 3.15 2.75
12.5 .06 .04 .06 .04
.06
.06
.06 2.85 3.4
.76
2^95 3.25 2.85
2.65 2.35 8.1 9.2 2.85
.06
.06
.06
.06
.06
Oct.
0.06 .06 .06 .06 .06
.06
.06
.06
.06
.09
.09
.09
.09
.06
.09
.09
.06
.06
.06
.06
.06
.06
.04
.04
.04
.06
.06
.06
.06 1.20 1.54
Month
JulATlglSep Oet Hov Dec
C
Jan Fet> Mar Apr May Jun
F
alendar year 193
iseal year 1935-
HOT.
6.3 1.32 6.3 1.95 2.1
2.25 1.98 2.05 1.80 1.71
5.4 3.3 1.98 1.71 1.71
6.9 3.0 .04 .04 .04
.06
.06
.06
.04
.04
.04 1.49 2.75 4.7
.09
Dec.
0.06 .04 .04 .02 .02
.84 2.65 2.45 5.2
.19
.12
.04
.02
.02
.02
.02
.01
.01
.02
.02
.02
.02
.02
.02
.01
.01
.01
.01
.01
.02
.02
Jan.
0.02 .02 .04 .09 .04
.04
.04
.04
.04
.04
.02
.02
.02 1.54 5.1
1.34 .04 .06 .09 .09
.09
.09
.06
.06 1.61
2.15 2.15 2.15 1.98 2.15 1.80
Feb.
4.8 6.8
.06
.06
.04
.04 1.42 1.88 1.71 1.63
1.54 1.47 1.47 1.39 1.39
1.31 1.31 1.31 1.39 1.31
1.23 1.31 1.76 3.1 2.2
5.0 2.9 1.63 6.3
Million gallons a day
Maximum
10 15.1 12.5 1.54 6.9 5.2
21.5
5.1 6.8
14.3 9.7
13.7 13.3
15.1
Mi.nlffium
2.05 2.05
.04
.04
.04
.01
.01
.02 ,04 .04 .09 .06
2.0
.01
Mean
3.51 5.18 2.99
.148 2.04
.386
S.72
.743 1.99 2.73 3.67 4.09 3.55
2.58
Mar.
14.3 3.75
.12
.09
.09
.06 2.75 3.5 2.85 3.8
6.0 6.2 4.6 3.55 3.45
3.8 3.45 S.7 3.0
.09
.09
.09
.09
.09
.09
.09
.04
.04
.04 1.63 8.2
Apr.
3.9 2.65 2.35 2.25 9.7
5.2 2.95 3.25 6.2 4.9
3.05 2.35 5.7
.12 1.49
5.6 1.86
.12
.09 2.65
3.45 3.25 3.15 2.85 2.65
6.6 1.61 4.4 8.1 7.1
Second- feet
(mean)
5.43 8.01 4.63
.229 3.16
.597
4.21
1.15 3.08 4.22 5.58 6.33 5.49
3.99
May
1.57 .12 .06
1.13 3.45
10.0 1.46
.16
.09
.06
.75 4.3 5.2 5.0 6.2
2.4 .15 .12 .09 .09
11.5 13.7 13.3 11.5 9.8
6.2 5.0 3.1 1.47 3.6 5.2
June
3.8 3.45 3.55 3.15 2.85
2.75 2.65 2.75 2.45 2.25
3.0 3.9 2.25 3.65 3.05
2.352.05 3.4
13.3 4.2
2.65 2.45 2.25 3.5 2.5
6.0 9.1 3.0 3.2 2.0
Total run-off
Million gallons
109 161 89.6 4.60
61.2 12.0
992
23.0 57.8 84.6
110 127 106
946
Acre-feet
334 493 275 14
188 37
3,040
71 177 260 338 389 327
2,900
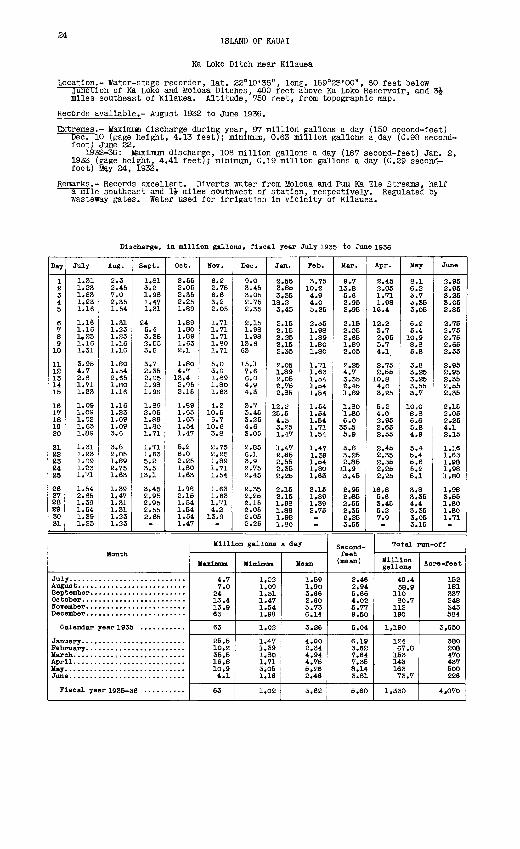
24ISLAND OF KAUAI
Ka Loko Ditch near Kllauea
Location.- Water-stage recorder, lat. 22°10'35", long. 159°23'00", 60 feet below junction of Ka Loko and Moloaa Ditches, 400 feet above Ka Loko Reservoir, and 3£ miles southeast of Kllauea. Altitude, 750 feet, from topographic map.
Records available.- August 1932 to June 1936.
Extremes.- Maximum discharge during year, 97 million gallons a day (150 second-feet) Dec. 10 (gage height, 4.13 feet); minimum, 0.63 million gallons a day (0.98 second- foot) June 22.
1932-36: Maximum discharge, 108 million gallons a day (167 second-feet) Jan. 2, 1933 (gage height, 4.41 feet); minimum, 0.19 million gallons a day (0.29 second- foot) May 24, 1933.
Remarks.- Records excellent. Diverts water from Moloaa and Puu Ka Ele Streams, half aTTnTle southeast and 1£ miles southwest of station, respectively. Regulated by wasteway gates. Water used for Irrigation In vicinity of Kllauea.
Discharge, in million gallons, fiscal year July 1935 to June 1936
Day
I 2 3 4 5
6 7 8 9
10
11 12 13 14 15
16 17 18 19 20
21 22 23 24 25
26 2V 28 29 30 31
July
.1.31 1.23 1.23 1.23 1.16
1.16 1.16 1,23 1.16 1.31
3.96 4.7 2.6 1.71 1.23
1.09 1.09 1.02 1.63 1.89
1.31 1.23 1.09 1.23 1.71
1.54 2.65 1.39 1.54 1.39 1.23
Aug.
2.3 2.45 7.0 2.35 1.54
1.31 1.23 1.23 1.16 1.16
1.80 1.54 2.65 1.80 1.16
1.16 1.23 1.09 1.09 3.6
3.8 2.05 1.89 2.75 1.63
1.39 1.47 1.31 1.31 1.23 1.23
Sept.
1.81 3.2 1.98 1.47 1.31
24 5.4 3.35 2.55 3.5
3.7 2.35 2.05 1.98 1.9S
1.89 2.05 1.89 1.80 1.71
1.71 1.63 5.2 3.5
13.1
3.45 2.95 2.95 2.55 2.65
Oct.
2.55 2.05 2.35 2.25 1.89
1.89 1.80 1.89 1.63 2.1
1.80 4.7 13.4 2.95 2.15
1.89 1.53 1.63 1.54 1.47
5.2 6.0 2.25 1.80 1.63
1.98 2.15 1.54 1.54 1.54 1.47
Month
Jul Augi 8ep Oct HOT Dec
C
Jan Fob Hap Apr May Jun
F
alendar year 193£
Lacal year 1935-;
Nov.
6.2 2.75 6.6 3.2 2.05
1.71 1.71 1.71 1.80 1.71
5.03.0 1.89 1.80 1.63
4.2 10.5 6.7
10.6 3.8
2.75 2.25 1.89 1.71 1.54
1.63 1.63 1.71 4.2 13.9
Dec.
9.0 3.45 3. OS 2.75 2.35
2.15 1.98 1.98
13.6 63
15.1 7.6 6.0 4.9 4.3
3.7 3.45 3.25 4.6 3.05
2.85 6.1 3.9 2.75 2.45
2.35 2.25 2.15 2.05 2.05 2.25
Jan.
2.55 3.85 3.35 18.2 3.45
2.15 2.15 2.25 2.15 2.35
2.05 1.89 2.05 2.75 2.85
12.2 25.5 4.5 3.25 1.47
1.47 2.65 2.55 2.35 2.25
2.15 2.15 1.98 1.89 1.98 1.80
Feb.
3.75 10.2 4.9 4.0 5.25
2.55 1.98 1.89 1.80 1.80
1.71 1.63 1.54 1.54 1.54
1.54 1.54 1.54 1.71 1.54
1.47 1.39 1.54 1.80 1.63
2.15 1.89 1.39 2.75
Million gallons a day
Haxljnm
4.7 7.0
24 13.4 13.9 65
63
25.5 10.2 35.5 16.8 10.9 4.1
63
Hlnljnum
1,02 1.09 1.51 1.47 1.54 1.98
1.02
1.47 1.39 1.80 1.71 3.05 1.16
1.02
Mean
1.59 1.90 3.66 2.60 5.73 6.14
3. 86
4.00 2.34 4.94 4.75 5.26 2.46
3.62
Mar.
9.7 13.8 5.6 2.95 2,95
2.15 2.05 2.65 1.89 2.05
2.25 4.7 3.35 2.45 1.89
1.80 '1.80 6.0
35.5 5.9
5.8 3.25 2.85
11.9 3.45
2.95 2.85 2,55 2.35 2.25 3.55
Second- feet (mean)
2.46 2.94 5.66 4.02 5.77 9,50
5.04
6.19 3.62 7.64 7.35 8.14 3.81
5.60
Apr.
2.45 2.05 1.71 1.98
16.4
12.2 3.7 2.95 3.7 4.1_
2.75 2.55
10.8 4.0 3.25
5.2 4.0 2.95 2.65 2.55
2.45 2.35 2.35 2.25 2.25
16.8 5.6 3,45 5.2 7.9
May
8.1 6.2 5.7 A.Z5 3.05
6.2 5.4 10.9 8.8 5.8
3.8 5.25 3.25 3.55 3.7
10,0 8.8 6.6 5.8 4.9
5.4 b.4 5,6 5.2 5,1
3.8 3.35 4.4 3.35 3.05 3.15
June
2.95 2.95 3.25 3.05 2.35
2.75 2.75 2.75 2.65 2.55
2.95 2.95 2.55 2.55 2.35
2.15 2.05 2,25 4.1 2.15
1.16 1.63 1.98 1.98 1.80
1.98 3.55 1.80 1.80 1.71
Total run-off
Million gallons
49.4 58.9
110 80.7
112 190
1,190
124 67.8 153 143 163 73.7
1,330
Acre-feet
152 181 337 248 543 584
3,650
380 208 470 437 500 226
4,070
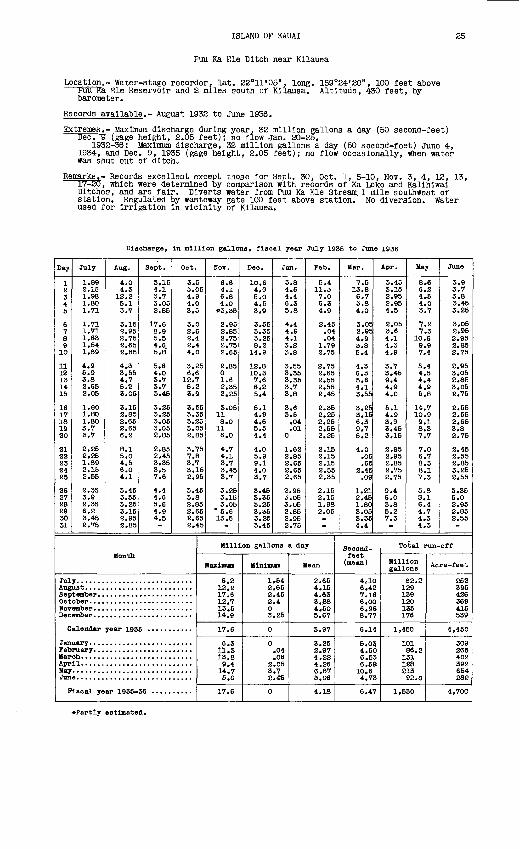
ISLAND OF KAUAI 25
Puu Ka Ele Ditch near Kllauea
Location.- Water-stage recorder, lat. 22°11'05", long. 159°24'20", 100 feet above Puu Ka Sle Reservoir and 2 miles south of Kllauea. Altitude, 430 feet, by barometer.
Records available.- August 1932 to June 1936.
Extremes.- Maximum discharge during year, 32 million gallons a day (50 second-feet) Dec.~9 (gage height, 2.05 feet); no flow Jan. 20-25.
1932-36: Maximum discharge, 32 million gallons a day (50 second-feet) June 4, 1934, and Dec. 9, 1935 (gage height, 2.05 feet); no flow occasionally, when water was shut out of ditch.
Remarks.- Records excellent except those for Sept. 30, Oct. 1, 5-10, Nov. 3, 4, 12, 13, 17-20, which were determined by comparison with records of Ka Loko and Kallhlwai Ditches, and are fair. Diverts water from Puu Ka Ele Stream. 1 mile southwest of station. Regulated by wasteway gate 100 feet above station. No diversion. Water used for Irrigation In vicinity of Kllauea.
Discharge, In million gallons, fiscal year July 1935 to June 1936
Day
1 2 3 4 5
6 7 8 9 10
11 12 13 14 15
16 17 18 19 20
21 22 23 24 25
26 27 28 29 30 31
July
1.89 2.15 1.98 1.80 1.71
1.71 1.71 1.63 1.54 1.89
4.9 5,9 3.8 2.65 2.05
i.eo1.80 1.80 3.7 3.7
2.26 2.25 1.89 2.18 2.55
2.35 3.9 2.35 6.2 3.45 2.75
Aug.
4.0 4.3
12.2 5.1 3.7
3.15 2.95 2.75 2.65 2.65
4.3 3.55 4.7 5.2 3.05
3.15 2.85 2.65 2.65 6.2
8.1 5.0 4.5 6.0 4.1
3.45 3.55 3.25 3.15 2.95 2.85
Sept.
3.15 4.1 3.7 3.05 2.85
17.6 8.9 5.5 4.6 5.8°
5.6 4.0 3.7 3.7 3.45
3.25 3.25 3.05 3.05 2.85
2.85 2.45 3.35 3.5 7.6
4.4 4.6 5.6 4.9 4.5
Oct.
3.5 3.05 4.9 4.0 3.5
3.0 2,6 2.4 2.4 4.0
3.25 6.6
12.7 5.2 3.9
3.55 3.35 3.25 3.05 2.85
3.75 7.8 3.7 3.15 2.95
3.45 3.8 2.85 2.65 2.65 2.45
Month
Jul Aug Sep Oct HOT Dec
C
Jan Fefc Mar Apr May Jun
P
alendar year 193
Iscal year 1935-
Nov.
6.6 4.1 6.8 4.0 *3,35
2.95 2.85 2.75 2.75 2.65
2.85 0 1.6 2.35 2.25
3.05 11 8.0 11 6.0
4.7 4.1 3.7 3.45 3.7
3.25 3.15 3. Ob
* 5.6 13.5
Dec.
10.6 4.9 5.0 4.5 3.9
3.55 3.35 3.25 8.2
14.9
12.8 10.3 7.6 6.2 5,4
5.1 4.9 4.6 5.5 4.4
4.0 5.9 9.1 4.0 3.7
3.45 3.35 5.25 3,35 3.25 3.45
Jan.
3.8 4.6 4.4 6.3 5.8
4.4 4.9 4.1 3.S 3.8
3.55 3.35 3.35 3.7 3.8
3.6 3.5 .04 .01
0
1.62 2.85 2.65 2.65 2.65
2.95 3.05 3.05 2.85 2.95 2.75
Feb.
5.4 11.3 7.0 6.3 4.9
2.45 .04 .04
1.79 2.75
2.75 2.65 2.55 2.55 2.45
2.35 2.25 2.25 2.55 2.25
2.15 2.15 2.15 2.55 2.35
2.15 2.15 1.98 2.05
Million gallons a day
Maximum
6.2 12.2 17.6 12.7 13.5 14.9
17.6
6.3 11.3 13.8 9.4 14.7 5.0
17.6
Minimum
1,54 2.65 2.45 2.4 0 3.25
0
0 .04 .06
2.05 3.7 2.46
0
Mean
2.65 4.15 4.63 3.08 4.50 5.67
3.97
3.25 2.97 4.22 4.26 6.87 3.06
4.18
Mar.
7.5 13,8 6.7 3.8 4,0
3.05 2.95 4.9 3.8 5,4
4.3 6.3 5.6 4.1 3,55
3.25 3.15 6,3 9.7 5.2
4.0 ,06 .65
2.45 .09
1.21 2.45 1.80 3.05 3.35 4.4
Apr.
3.45 3.15 2.95 2.95 4.5
2.05 3.6 4.1 4.3 4.9
3.7 3.45 9.4 4.9 4,0
5.1 4.9 3.9 3.45 3.15
2.95 2.95 2.85 2.75 2.75
9.4 6.0 3.8 5.2 7.3
Second- feet (mean)
4,10 6.42 7.16 6.00 6.96 8.77
6.14
5.03 4.60 6.53 6.59 10.6 4.73
6.47
May
8.6 6.2 4,5 4.0 3.7
7.2 7.3
10.6 9.9 7.4
5.4 4.5 4.44.9 5.8
14.7 10.9 9.1 8.3 7,7
7.0 6.7 8.3 8.1 7.3
5.8 5.1 6.4 4.7 4.3 4.3
June
3.9 3.7 3.8 3.45 3.25
3,05 2,&5 2.95 2.85 2.75
2.95 3.05 2.85 3.05 2.75
2.55 2.55 2.65 3.8 2.75
2.45 2.55 2.85 3.25 2.55
3.35 5.0 2.95 2.85 2.55
Total run-off
Million gallons
62.8 129 139 120 135 176
1,450
101 86.2
131 128 213 92.0
1,530
Acre -feet
252 395 426 369 415 539
4,450
309 265 402 392 654 282
4,700
Partly estimated.
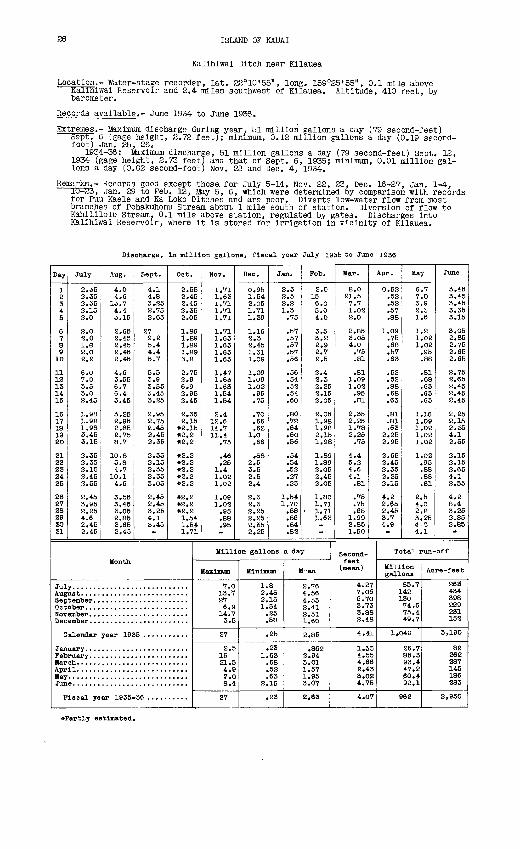
26 ISLAND OF KAUAI
Kalihiwai Ditch near Kilauea
Location.- Water-stage recorder, lat. 22°10 1 55", long. 159°25'55", 0.1 mile above Kallhlwal Reservoir and 2.4 miles southwest of Kilauea. Altitude, 410 feet, by barometer.
Records available.- June 1934 to June 1936.
Extremes.- Maximum discharge during year, 51 million gallons a day (79 second-feet) Sept. 6 (gage height, 2.72 feet): minimum. 0.12 million gallons a day (0.19 second- foot) Jan. 25, 26.
1934-36: Ifeximum discharge, 51 million gallons a day (79 second-feet) Sept. 12, 1934 (gage height, 2.73 feet! and that of Sept. 6, 1935; minimum, 0.01 million gal lons a day (0.02 second-foot) Nov. 28 and Dec. 4, 1934.
Remarks.- Records good except those, for July 5-14, Nov. 22, 23, Dec. 16-27, Jan. 1-4, 10-^3, Jan. 29 to Feb. 12, May 5, 6, which were determined by comparison with records for Puu Kaele and Ka Loko Ditches and are poor. Diverts low-water flow from most branches of Pohakuhonu Stream aterat 1 mile south of station. Diversion of flow to Kahilllolo Stream, 0.1 mile above station, regulated by gates. Discharges Into Kallhlwal Reservoir, where It Is stored for Irrigation In vicinity of Kilauea.
Discharge, In million gallons, fiscal year July 1936 to June 1936
Day
1 2 3 4 5
6 7 8 9
10
11 12 13 14 15
16 17 18 19 20
21 22 23 24 25
26 27 28 29 30 31
July
2.55 2.35 2.55 2.15 2.0
2.0 2.0i.e2.0 2.2
6.0 7.0 3.5 3.0 2.45
1.98 1.98 1.98 3.45 3.15
2.35 2.35 2.15 2.45 2.55
2.45 3.95 2.25 4.6 2.46 2.45
Aug.
4.0 4.6
li.7 4.4 3.15
2.65 2.45 2.45 2.45 2.45
4.6 3.55 6.7 6.4 3.45
3.25 2.95 2.85 2.75 8.7
10.8 5.8 4.7
10.1 4.6
3.55 3.45 3.05 2.85 2.65 2.45
Sept.
4.1 4.8 3.25 2.75 2.65
27 9.2 5.4 4.45.7
5.5 3.9 3.55 3.45 3.25
2.95 2.75 2.45 2.45 2.35
2.35 2.15 2.35 2.35 3.05
2.45 2.45 3.25 4.1 5.45
Oct.
2.55 2,45 2.45 2.35 2.05
1.89 1 89 l!s9 1.89 3.8
2.75 2.9 6,9 2.95 2.45
2.352.15
*2.16 *2.2 *2.2
*2.2 *2.2 *2.2 *2.2 *2.2
»2.2 *2.2 *2.2 1.54 1.54 1.71
Month
Jul Aug Sep Oct HOT Dec
C
Jan Fob MarApr May Jun
P
ember. .......................
alendar year 19!
Isoal year 1935'
Nov.
1.71 1.63 1.71 1.71 1.71
1.71 1.63 1.63 1.63 1.63
1.47 1.63 1.63 1.54 1.54
2.4 12.6 14.7 11.4
.75
.46
.25 1.4 1.021.02
1.09 1.02 .95 .88 .95
Dec.
0.95 1.54 2.05 1.71 1.39
1.16 2.3 2.45 1.31 1.09
1.09 1.09 1.02 .95.75
.70
.66
.62 1.0 .66
.58 2.5 3.5 2.5 2.4
2.3 2.3 2.25 2.25 2.35 2.25
Jan.
2.3 2.5 2.2 1.3.75
.57
.57
.57
.57 ,56
.56
.54
.52
.54
.60
.80
.72
.64
.60
.56
.54
.54
.52
.27
.23
1.54 1.70 .88 .86 .84 .82
Million gallons
Maximum
7.0 13.7 27 6.9
14.7 3.5
27
2.5 15 21.5 4.9 7.0 8.4
27
Minimum
1.8 2.45 2.15 1.54 .25 .58
.25
.23 1.63 .68 .52 .63
2.15
.23
Feb.
2.0 15 6.0 5.0 4.0
3,5 3.2 2.9 2.7 2.5
2.4 2.3 2.25 2.15 2.05
2.05 1.98 1.98 2.15 1.98
1.89 1.89 2.05 2.45 2.05
1.80 1.71
- 1.71 1.63
a day
M-an
2.76 4.56 4.532.41 2.51 1.60
2,85
.862 2.94 3.01 1.57 1.95 3.07
2,63
Mar.
8.0 21.5 7.7 1.02 2.0
2.85 3.05 4.0 .75 .81
.81 1.09 1.02 .95.31
2.55 2.251.78 2.25.75
4.4 5.2 4.6 4.1 .81
.75
.75
.68 1.99 2.85 1.50
Apr.
0.52 .52 .52 .57 .88
1.09 .75 .68 .57 .63
.52
.52
.88
.68
.63
.81
.81
.63 2.25 2.95
2.65 2.45 2.35 2.25 2.15
4.2 2.65 2.45 3.7 4.9
Second- feet (mean)
4.27 7.06 6.70 3.73 3.88 2.48
4.41
1.33 4.55 4.66 2.43 5.02 4.75
4.07
May
6.7 7.0 3.9 2.5 1.6
1.2 1.02 1.02 .95 .88
.81
.68
.63
.63
.63
1.16 1.09 1.02 1.02 1.02
1.02 .95 .88 .88 .81
2.5 4.0 2.8 3.25 4-0 4.1
June
3.45 3.45 3.45 3.35 3.15
3.05 2.85 2.75 2.65 2.65
2.75 2.65 2.45 2.45 2.45
2.25 2.15 2,35 4.1 2.55
2.15 2.15 2.654.1 2,55
4.2 8.4 3.25 2.85 2.85
Total run-off
Million gallons
85.7 142 130 74.6 75.4 49.7
1,040
26.7 85.3 93.4 47.2 60.4 92.1
962
Acre-feet
263 434 398 229 231 152
3,190
82 262 287 145 186 283
2,950
*Partly estimated.
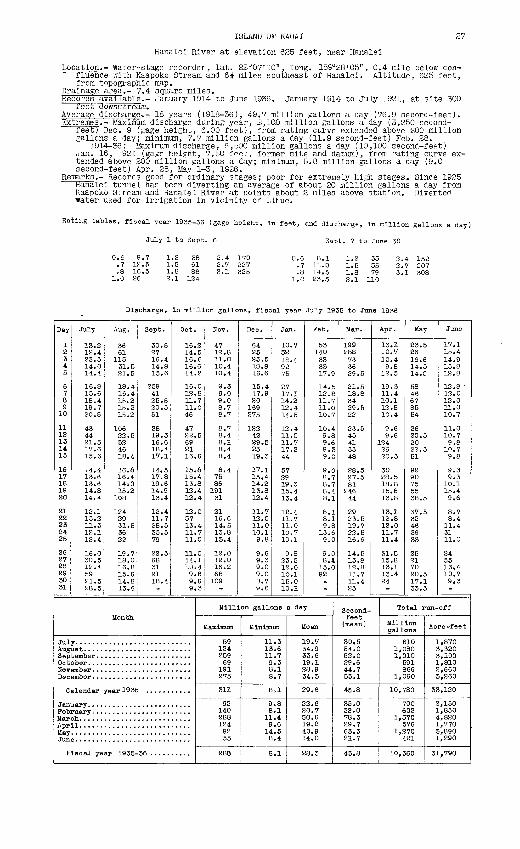
ISLAND OF KAUAI 27
Hanalei River at elevation 625 feet, near Hanalei
Location.- Water-stage recorder, lat. 22°07'10", long. 15S°28'05", 0.4 mile below con- fluence with Kaapoko Stream and 6J miles southeast of Hanalei. Altitude, 625 feet, from topographic map.
Drainage area.- 7.4 square miles.Records available.- January 1914 to June 1936. January 1914 to July 1921, at site 300
feet downstream.Average discharge-.- 18 years (1918-36), 49.7 million gallons a day (76.9 second-feet)."Extremes.- Maximum discharge during year, 2,10.0 million gallons a day (3,250 second-
feet) Dec. 9 (gage height, 6.00 feet), from rating curve extended above 200 million gallons a day; minimum, 7.7 million gallons a day (11.9 second-feet) Feb. 28.
1914-36: Maximum discharge, 6,500 million gallons a day (10,100 second-feet) Jan. 16, 1921 (gage height, 7.50 feet, former site and datum), from rating curve ex tended above 200 million gallons a day; minimum, 5.8 million gallons a day (9.0 second-feet) Apr. 28, May 1-3, 1926.
Remarks.- Records good for ordinary stages; poor for extremely high stages. Since 1925 Hanalei tunnel has been diverting an average of about 20 million gallons a day from Kaapoko Stream and Hanalei River at points about 2 miles above station. Diverted water used for irrigation in vicinity of Lihue.
Rating tables, fiscal year 1935-36 (gage height, in feet, and discharge, in million gallons a day)
July 1 to Sept. 6 Sept. 7 to June 30
0.6 9.7 1.2.7 12.5 1.5.8 16.5 1.8
1.0 26 2.1
2.4 1702.7 2273.1 325
0.6 8.1 1.2 35.7 11.0 1.5 55.8 14.5 1.8 79
l.C 23.5 2.1 110
2.4 1522.7 2073.1 308
Discharge, in million gallc fiscal year July 1935 to June 1936
Day
1 2 3 4 5
6 7 8 9 10
11 12 13 14 15
16 17 18 19 20
21 22 2324 25
26 27 28 29 30 31
July
2.3.212.4 23.5 14.0 14.4
16.8 15.6 18.4 19.7 20.5
43 44 21.5 17.6 15.6
14.4 13.6 13.6 14.8 14.4
12.1 13.2 11.3 12.1 12.4
16.0 30.5 12.4 59 21.5 28.5
Aug.
36 61
11531.5 21.5
18.4 16.4 15.2 15.215.2
106 22.5 32 46 18.4
16.8 16.4 14iO 15.2
108
124 29 31.5 36 22
19.7 18.0 16.8 15.6 14.8 13.5
Sept.
30.5 27 16.4 14.8 15.6
259 41 25.5 20.5 51
28 19.3 16.6 18.4 17.1
14.5 17.8 19.6 14.9 13.4
12.4 11.7 28.5 35.5 79
22.5 68 31 21 18.4
Oct.
16.2 14.5 16.6 16.6 14.2
16.0 12.811.7 11.0 46
47 22.5 69 21 16.6
15.8 15.4 13.8 12.4 12.4
12.0 57 13.4 11.7 11.0
11.0 14.1 10.4 9.8 9.6 9.3
Month
Jul Aug- Sep Oct Nov Dec
C
Jan Pet Mar Apr May Jun
P
alendar year 193E
iscal year 1935-
NOT.
47 12.8 11.0 10.4 10.4
9.3 9.0 9.0 8.7 8.7
8.7 8.4 8.1 8.4 8.4
8.4 75 86 191 31
21 16.6 14.5 13.8 13.4
12.0 12.0 16.2 68 109
Dec.
64 2523.5 18.8 16.6
15.4 17.9 20
169 275
122 42 29.5 23 19.3
17.1 15.4 14.2 13.8 12.4
11.7 12.0 11.0 10.1 9.8
9.6 9.3 9.0 9.0 8.7 9.6
Jan.
10.7 5218.4 92 75
2717.1 14.2 12.4 14.5
12.4 11.0 11.7 17.2 44
57 29 19.3 15.4 13.4
12.4 11.7 11.0 10.7 10.1
9.8 23.5 12.0 10.1 15.0 10.1
Feb.
53140 33 33 17.9
14.5 12.8 11.7 11.0 10.7
10.4 9.8 9.6 9.3 9.0
9.0 8.7 8.7 8.4 8.1
8.1 8.1 9.813.6 9.0
9.0 8.4 15.0 92
Million gallons a day
Maximum
59 124 259 69
191 275
311
92 140 288 124 92 55
288
Minimum
11.3 13.6 11.7 9.3 8.1 8.7
8.1
9.8 8.1 11.4 9.6 14.5 8.4
8.1
Mean
19.7 34.9 33.6 19.1 28.9 34.3
29.6
22.6 20.7 50.6 19.2 40.9 14.0
28.3
Mar.
199 288 73 36 29.5
21.5 18.8 34 29.5 22
23.5 45 41 33 48
28.5 27.5 81
246 44
2923.5 19.7 22.5 16.6
14.5 13.8 12.8 11.7 11.4 25
Apr.
13.1 10.7 10.4 9.8
12.5
19.3 11.4 10.1 12.8 10.4
9.6 9.6
124 2620.5
30 28.5 18.8 15.813.8
13.1 12.8 12.0 11.7 11.4
31.5 15.8 13.1 13.4 24
Second- feet
(mean)
30.5 54.0 52.0 29.6 44.7 53.1
45.8
35.0 32.0 78.3 29.7 63.3 21.7
43.8
May
23.5 26 16.6 14.514.5
58 46 67 85 54
26 20.5 20 22.5 51
92 90 75 55 38.5
37.5 32 46 36 33
25 21 70 20.5 17.1 33.5
June
17.1 15.4 14.9 13.8 12.8
12.8 ' 12.0 12.0 11.0 10.7
11.0 10.7 9.8 10.7 9.8
9.3 9.3
10.1 15.4 9.6
8.7 8.4 11.4 3111.0
24 55 13.4 10.7 9.3
Total run-off
Million gallons
610 1,080 1,010
591 866
1,060
10,780
700 602
1,570 576
1,270 421
10,360
Acre-feet
1,870 3,320 3,100 1,810 2,660 3,260
33,120
2,150 1,850 4,820 1,770 3,890 1,290
31,790
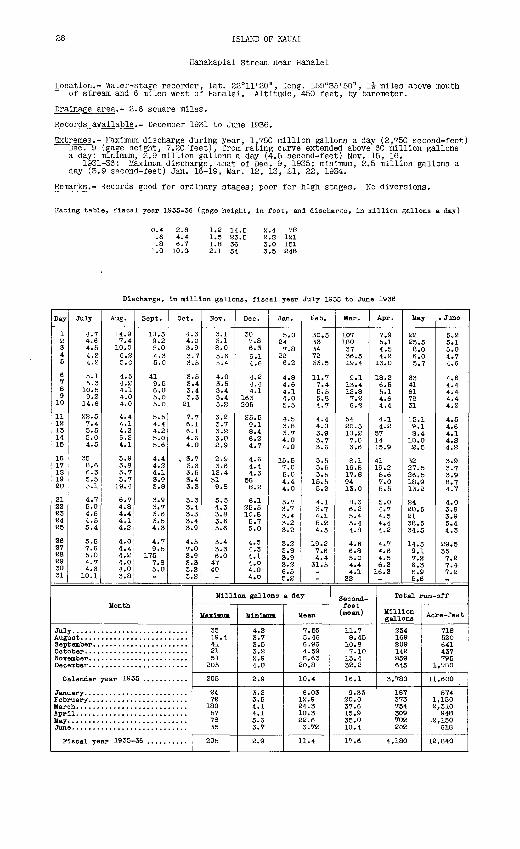
28 ISLAND OF KAUAI
Hanakapiai stream near Hanalei
Location.- Water-stage recorder, lat. 22°11'20", long. 159"35'50", 1J- miles above mouth of stream and 6 miles west of Hanalei. Altitude, 450 feet, by barometer.
Drainage area.- 2.6 square miles.
Records available.- December 1931 to June 1936.
Extremes.- Maximum discharge during year, 1,780 million gallons a day (2,750 second-feet) "Dec. 9 (gage height, 7.20 "feet), from rating curve extended above 60 million gallons a day: minimum, 2.9 million gallons a day (4.5 second-feet) Nov. 15, 16.
1931-36: Maximum discharge, -that of Dec. 9, 1935; minimum, 2.5 million gallons a day (3.9 second-feet) Jan. 16-19, Mar. 12, 13, 21, 22, 1934.
Remarks.- Records good for ordinary stages; poor for high stages. No diversions.
Rating table, fiscal year 1935-36 (gage height, in feet, and discharge, in million gallons a day)
0.4 2.8.6 4.4.8 6.7
1.0 10.O
1.2 14.51.5 23.51.8 362.1 54
2.4 782.5 1213.0 1513.5 248
Discharge, in million gallons, fiscal year July 1935 to June 1936
Day
1 2 3 4 5
6 7 S 9 10
11 12 13 14 15
16 17 IS 19 20
21 22 23 24 25
26 27 28 29 30 31
July
4.7 4.6 4.5 4.2 4.2
5.1 5.3
10.5 9.2 14.6
22.5 7.4 5.5 5.0 4.5
35 8.6 6.3 5.5 3.1
4.7 5.0 4.5 4.5 5.4
5.5 7.6 5.0 4.7 4.6
10.1
Aug.
14.9 7.4
10.0 6.2 5.0
4.5 4.2 4.1 4.04.0
4.4 4.1 4.2 5.2 4.1
3.9 3.8 3.7 3.7
19.4
6.7 4.8 4.4 4.1 4.2
4.0 4.4 4.2 4.0 4.0 3.8
Sept.
10.3 9.2 5.0 4.3 5.0
41 9.5 6.0 5.0 5.0
5.5 4.4 4.2 5.0 5.6
4.4 4.2 4.1 3.9 3.8
3.9 3.7 3.6 3.5 4.3
4.7 9.5
175 7.8 5.0
Oct.
4.3 4.0 3.9 3.7 3.5
3.5 3.4 3.4 3.3
21
7.7 6.1 6.1 4.6 4.0
, 3.7 3.6 3.5 3.4 3.3
3.3 3.4 3.3 3.4 3.9
4.5 7.0 3.9 3.3 3.2 3.2
Month
Jul Augi Sep Oct Nov Dec
C
Jam Peb Mar Apr May Jun
P
alendar year 1935 ...........
Lscal year 1935-36 ..........
Nov.
3.1 3.1 8.05.6 5.4
4.0 3.5 3.4 3.4 3.2
3.2 3.7 3.2 3.0 2.9
2.9 3.6
12.4 51 9.8
5.5 4.3 3.8 3.6 3.6
3.4 3.3 6.0
47 40
Dec.
30 7.8 6.3 6.1 4.6
4.2 4.4 4.1
163 205
25.5 9.1 8.4 6.2 4.7
4.6 4.4 4.3
56 8.2
6.1 25.5 10.8 5.7 5.0
4.5 4.3 4.1 4.0 4.0 4.0
Jan.
5.0 24 7.8
22 6.2
4.8 4.6 4.1 4.0 5.5
4.5 3.8 3.7 4.0 4.0
15.5 7.0 5.0 4.4 4.0
3.7 3.7 3.4 3.2 3.2
3.2 3.3 3.9 3.2 6.5 5.2
Feb.
30.5 33 34 72 33.5
11.7 7.4 5.5 5.3 4.7
4.4 4.0 3.9 3.7 3.6
3.5 3.5 3.5
15.5 5.2
4.1 3.7 4.1 5.2 4.5
19.2 7.6 4.4
31.5
Million gallons a day
Maxljmm
35 19.4 41 21 51
205
205
24 72
180 57 78 35
205
Minimum
4.2 3.7 3.5 3.2 2.9 4.0
2.9
3.2 3.5 4.1 4.1 5.6 3.7
2.9
Mean
7.55 5.46 6.96 4.59 S.63 20.8
10.4
6.03 12.9 24.3 10.3 22.6 6.72
11.4
Mar.
107 180 37 36.5 19.4
9.113.4 12.8 7.2 6.2
54 20.5 10.2 7.0 6.6
8.1 16.5 17.8 94 13.0
8.6 6.2 5.4 5.4 4.3
4.6 6.8 5.0 4.4 4.1
22
Apr.
7.9 5.1 4.5 4.2
13.0
18.2 6.5 5.1 4.6 4.4
4.1 4.2
57 14 15.9
41 19.2 8.6 7.0 5.5
5.0 4.7 4.5 4.4 4.2
4.7 4.6 4.5 6.2
16.2
Second- feet (mean)
11.7 8.45
10.8 7.10
13.4 32.2
16.1
9.33 20.0 37.6 15.9 35.0 10.4
17.6
May
22 25.5 8.0 6.0 5.7
63 41 61 78 31
15.1 9.1 8.4
10.0 12.5
32 27.5 26.5 18.9 13.2
24 20.5 21 38.5 34.5
14.5 9.1 7.2 6.3 5.9 5.6
. June
5.25.1 5.0 4.7 4.6
4.6 4.4 4.4 4.4 4.2
4.5 4.6 4.1 4.S4.2
3.93.7 3.9 8.7 4.7
4.0 3.9 3.9 5.4 4.3
29.5 35 7.2 7.4 7.2
Total run-off
Million gallons
254 169 209 142 359 645
3,780
187 373 754 309 702 202
4,180
Acre-feet
718 520 641 437 795
1,980
11,600
574 1,150 2,310 948
.2,150 618
12,840
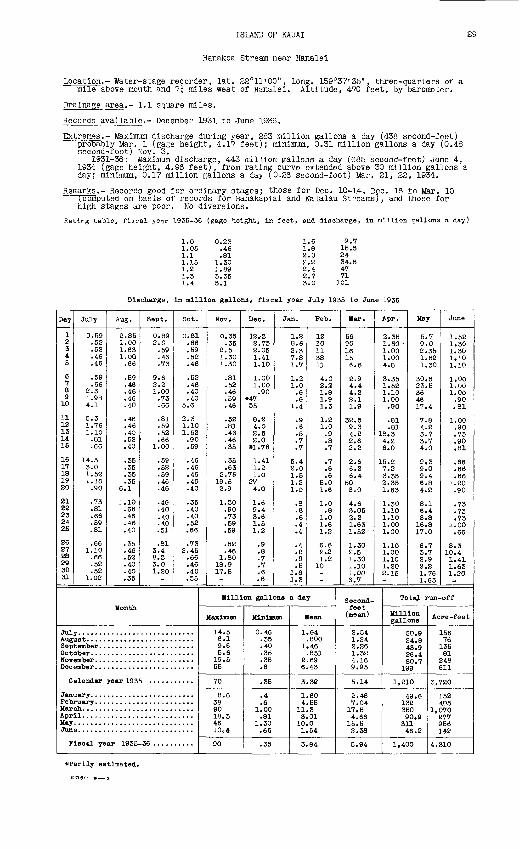
ISLAND OF KAUAI 29
Hanakoa Stream near Hanalei
Location.- Water-stage recorder, lat. 22°11'00", long. 159°37'35", three-quarters of a mile above mouth and 7J- miles west of Hanalei. Altitude, 470 feet, by barometer.
Drainage area.- 1.1 square miles.
Records available.- December 1931 to June 1936.
Extremes.- Maximum discharge during year, 283 million gallons a day (438 second-feet) probably Mar. 1 (gage height, 4.17 feet); minimum, 0.31 million gallons a day (0.48 second-foot) Nov. 3.
1931-36: Maximum discharge, 443 million gallons a day (685 second-feet) June 4, 1934 (gage height, 4.96 feet), from rating curve extended above 30 million gallons a day; minimum, 0.17 million gallons a day (0.26 second-foot) Mar. 21, 22, 1934.
Remarks.- Records good for ordinary stages; those for Dec. 10-14, Dec. ifi ±o Mar. 10 tcomputed on basis of records for Hanakapiai and Kalalau Streams), and those for high stages are poor. No diversions.
Ratirg table, fiscal year 1935-36 (gage height, In feet, and discharge, in million gallons a. day)
1.0 0.23 1.6 9.7 1.05 .46 1.8 15.5 1.1 .81 2.0 24 1.15 1.30 2.2 34.5 1.2 1.89 2.4 47 1.3 3.35 2.7 71 1.4 5.1 3.0 301
Discharge, In million gallons, fiscal year July 1935 to June 1936
Day
1 2 34 5
6 7a9
10
1112 1314 15
16 17 18 19 20
21 22 23 24 25
26 27 28 29 30 31
July
0.59
'.52 .46 .46
.59
.66 2.31.98 4.1
5.3 1.76 1.10 .81 .66
14.5 3.0 1.52 1.10 .90
.73
.81
.66
.59
.81
.66 1.10 .66 .52 .52
1.02
Aug.
2.85 1.00 1.63 1.00 .66
.59
.46
.46
.46
.40
.46
.46
.40
.52
.40
.35
.35
.35
.35 6.1
1.10 .66 .46 .46.40
.35
.46
.52
.40
.40
.35
Sept.
0.89 2.0 .59 .46 .73
9.6 2.21.00 .73 .66
.81
.59
.52
.66 1.00
.59
.52
.59
.46
.46
.46
.40
.40
.40
.51
.81 3.4 8.3 3.0 1.20
Oct.
0.81 .66 .59 .52 .46
.52
.46
.40
.40 5.6
2.3 1.10 1.52 .90 .59
.46
.46
.46
.40
.40
.35
.40
.40
.52
.66
.73 '2.45
.66
.46
.40
.35
Month
Jul Aug Sep Oct HOT Dec
C
Jan Feb Mar Apr May Jun
F
alendar year 193
iscal year 1935-
Nov.
0.35 .35
2.5 1.30 1.30
.81
.52
.46
.59
.46
.52
.81
.46
.46
.35
.35
.63 2.75
19.5 2.9
1.30 .90 .73 .59 .59
.52
.46 1.80
18.9 17.5
Dec.
12 ..3 2.75 2.05 1.41 1.10
1.00 1.00 .90
*47 55
8.2 4.0 2.5 2.0
*1.76
1.41 1.2 1.0
27 4.0
1.6 9.4 3.6 1.5 1.2
.9
.8
.7
.7
.6
.6
Jan.
1.2 8.6 2.3 7.8 1.7
1.2 1.0 .6 .6
1.4
.9
.6
.5
.7
.7
5.4 13.0 1.5 1.2 1.0
.8
.8
.6
.4
.4
.4
.8
.9
.5 1.8 1.3
Feb.
12 1011 38 11
4.0 2.2 1.8 1.9 1.3
1.2 1.0 .9 .8 .7
.7
.6
.6 5.0 1.6
1.0 .8
1.0 1.6 1.2
6.6 2.21.2
10
Million gallons a day
Maxlmm
14.5 6.1 9.6 5.6
19.5 55
70
8.6 38 90 18.3 46 10,4
90
Minimum Mean
0.46 1.64 .35 .800 .40 1.46 .35 .851 .35 2.69 .6 6.43
.35 3.32
.4 1.60
.6 4.55 1.00 11.3 .81 3.01
1.30 10.0 .66 1.54
.35 3.84
Mar.
56 9016 15 6.6
2.9 4.4 4.2 2.1 1.9
32.5 9.3 4.2 2.6 2.2
2.6 6.2 6.4
50 8.0
4.6 3.05 2.2 1.63 1.52
1.30 2.5 1.30 ^.10 1.00 6.7
Second- feet (mean)
Apr.
2.35 1.30 1.00 1.00 4.8
3.35 1.52 1.10 1.00 .90
.81
.81 18.3 4.2 6.0
15.2 7.2 3.35 2.35 1.63
.30
.10
.10
.00
.00
.10
.00 1.10 1.20 2.15
May
5. 9. 2. 1. 1.
30. 23. 36 46 17.
7. 4. 3. 3.4.
9. 9. 9. 6.4.
8. 6. 8.
16.17.
6. 3. 2. 2.1. 1.
7 0 35 52 30
5 5
4
8 2 7 7 0
3 04 8 2
1 4 8 8 0
7 7 9 2 76 63
June
1.52 1.30 1.30 1.10 1.10
1.00 1.00 1.00 .90 .81
1.00 .90 .73 .90 .81
.66
.66
.661.20 .90
.73
.73
.73 1.00 .66
8.3 10.4 1.41 1.63 1.20
TotaJ. run-off
Million gallons
2.54 50.9 1.24 24.8 2.26 43.9 1.32 26.4 4.16 80.7 9.95 199
5.14 1,210
2.48 49.6 7.04 132
17.5 350 4.66 90.8
15.5 311 2.38 46.2
5.94 1,400
Acre-feet
156 76 135 81
248 611
3,720
152 405
1,070 277 956 142
4,310
^Partly estimated.
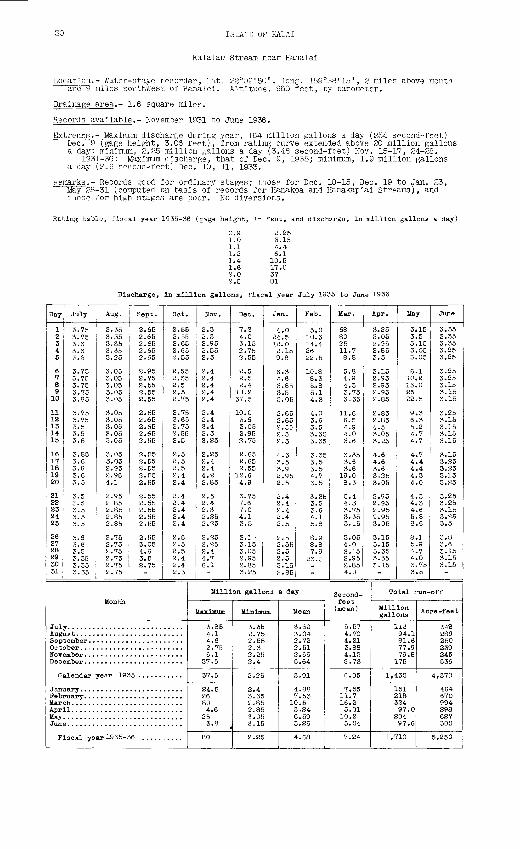
30 ISLAl'D OF KAUAI
Kalalau Stream near Hanalei
Location.- Water-stage recorder, lat. 22°09'50", long. 159°38'15", 2 miles above mouth and~T5 ralles southwest of Hanalei. Altitude, 960 feet, by barometer.
Drainage area.- 1.6 square miles.
Records available.- November 1931 to June 1936.
Extremes.- Maximum discharge during year, 164 million gallons a day (254 second-feet) Dec. 9 (gage height, 3.06 feet), from rating curve extended above 20 million gallons a day; minimum, 2.25 million gallons a day (3.48 second-feet) Nov. 15-17, 24-28.
1931-36: Maximum discharge, that of Dec. 9, 1935; minimum, 1.9 million gallons a day (2.9 second-feet) Dec. 10, 11, 1933.
Remarks.- Records good for ordinary stages; those for Dec. 10-15, Dec. 19 to Jan. 23, May 28-31 (computed on basis of records for Hanakoa and Hanakapiai Streams), and those for high stages are poor. No diversions.
Rating table, fiscal year 1035-36 (gage height, in feet, and discharge million gallc day)
0.9 2.25 1.0 3.15 1.1 4.4 1.2 6.1 3.4 10.5 1.6 IV. 0 2.0 37 2.5 81
Discharge, In million gallons, fiscal year July 1935 to June 1936
Day
1 2 3 4 5
6 7 8 9
10
11 12 13 14 15
16 17 18 19 20
21 22 83 24 25
26 27 28 2930 31
July
3.75 3.75 3.6 3.6
3.75 3.75 3.Y5 3.Y5 3.85
3.75 3.75 3.5 3.5 3.5
3.85 3.6 3.6 3.63.5
3.5
sis3.5 3.5
3.6 3.6 3.5 3.35 3.35 3.35
Aug.
3.35 3.35 3.35 3.35 3.25
3.05 3.05 3.05 3.05 3.05
3.05 3.05 3.05 3.05 3.05
3.05 3.05 2.95 2.95 4.1
2.95 2 85 2.85 2.85 2.85
2.75 2.75 2.75 2.75 2.75 2.75
Sept.
2.65 2.65 2.652.65 2.65
2.95 2.75 2.55 2.55 2.55
2.55 2.65 2.65 2.55 2.55
3.55 2.55 2.55 2.F5 2.55
2.55 2.55 2.55 2.55 2.55
2.55 3.05 4.6 3.5 2.75
Oct.
2.552.55 2.65 2.65 2.55
2.55 2.55 2.5 2.5 2. 75
2.75 2.65 2.75 2.55 2.5
2.5 2.5 2.5 2.4 2.4
2.4 2.4 2.4 2.42.4
2.52.5 2.5 2.4 2.4 2.3
Month
Jul Augl Sep Oct HOT Dec
C
Jan Pet> Mar Apr May Jun
F
ilendar year 192
Lscal year 1935-?
Hov.
2.3 2.3 2.95 2.55 2.5
2.4 2.4 2.4 2.4 2.4
2.4 2.4 2.4 2.3 2.25
2.25 2.4 2.4 4.2 2.&5
2.5
2.3 2.25 2. 25
2.25 2.25 2.4 4.7 6.1
Dec.
7.2 4.0 3.15 2.75 2.55
2.5 2.5 2.4 13.2 37.5
10.0 3.6 3.05 2.95 2.75
2.65 2.65 2.55
12.6 4.9
3.75 7.6 7.0 4.1 3.5
3.: 3.15 3.05 2.95 2.85 3.25
Jan.
4.0 24.5 12.0 2.15 9.8
6.3 4.6 3.85 3.5 3.05
2.65 2.652.55 2.5 ?.5
4.3 3.5 3.9 2.95 2.5
2.4 2.42.4 2.4 2.5
2.5 2.55 2.5 2.5 3.15 2.85
Feb.
5.0 10.3 14.4 2622.5
10.3 8.3 5.. 8 5.1 4.3
4.0 3.6 3.5 3.35 3.35
3.35 3.5 3.5 4.7 3.5
3.35 3.5 3.64.1 5.3
8.9 8.8 7.9
23.5
Million gallons a day
Maximum
3.854.1 4.6 2.75 6.1
37.5
37.5
24.5 26 80 4.6
25 3.8
80
Minimum Mean
3.35 3.60 2.75 3.04 2.55 2.72 2.3 2.51 2.25 2.66 2.4 5.64
2.25 3.91
2.4 4.88 3.35 7.53 2.85 10.5 2.85 3.24 3.05 6.59 3.15 3,26
2.25 4.68
Mar.
68 80 25 11.7 8.8
5.8 4.9 4.3 3.75 3.35
11.6 6.5 4.9 4.0 3.6
3.35 3.5 3.6
19.0 8.3
5.4 4.3 3.75 3.35 3.15
3.054.0 3.15 2.95 2.85 4.0
Second- feet (mean)
Apr.
3.25 3.05 2.95 2.85 3.5
3.15 2.95 2.95 2.95 2.85
2 .85 2.854.5 3.05 3.25
4.6 4.6 3.6 3.25 3.05
2.95 2.95 2.95 2.95 3.05
3.15 3.15 3.35 3.35 3.15
May
3 3
33
6 10 15 25 22
9 65 4 4
4 4 4 4 4
4 4 4 5 8
8 5 1 4 3 3
15 5 15 05 05
1 2 0
5
3 3 27 7
7 4 4 3 0
3 3 6 8 6
} 9 7 0 75 5
June
3.35 3.35 3.35 3.25 3.25
3.25 3.253.15 3.153.15
3.25 3.15 3.35 3.15 3.15
3.15 3.25 3.25 3.15 3.25
3.25 3.25 3.15 3.25 3.5
3.8 3.6 3.15 3.15 3.15
Total run-off
Million gallons
5.57 112 4.70 94.1 4.21 81.6 3.88 77.9 4.12 79.8 8.73 175
6.05 1,430
7.55 151 11.7 218 16.2 324 5.01 97.0
10.2 204 5.04 97.6
7.24 1,710
Acre-feet
342 289 250 239 245 536
4,370
464 670 994 298 627 300
5,250
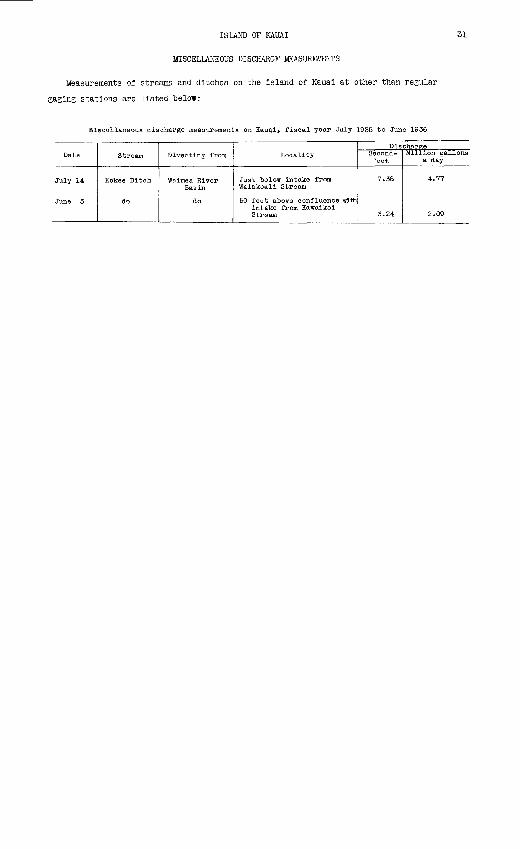
ISLAM) OF KAUAI
MISCELLANEOUS DISCHARGE MEASUREMENTS
Measurements of streams and ditches on the island of Kauai at other than regular
gaging stations are listed below:
Miscellaneous discharge measurements on Kauai, fiscal year July 1935 to June 1936
31
Date
Julj 14
June 5
Stream
Kokee Ditch.
do
Diverting from
Waimea River Basin
do
Locality
Just below intake from Waiakoali Stream
50 feet above confluence with intake from Kawaikoi
DischargeSecond- feet
7.38
5.24
Million gallons a day
4.77
2.09
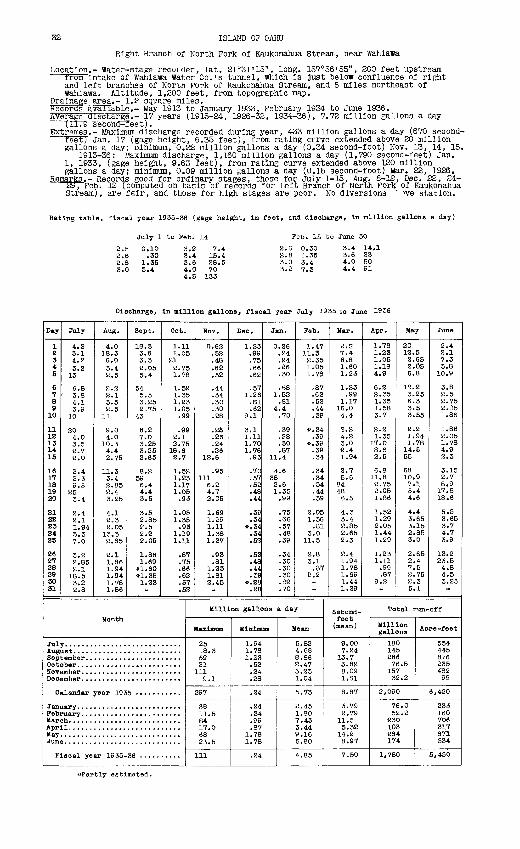
32 ISLAND OF OAHU
Right Branch of North Fork of Kaukonahua Stream, near Wahiawa
Location.- Water-stage recoider, lat. 21°31'15", long. 157°56'55", 200 feet upstream from Intake of Wahiawa Water Co.'s tunnel, which Is Just below confluence of right and left branches of North Fork of Kaukonahua Stream, and 8 miles northeast of Wahiawa. Altitude, 1,200 feet, from topographic map.
Drainage area.- 1.2 square miles.Records' available.- May 1913 to January 1933, February 1954 to June 1936.Average discharge.- 17 years (1915-24, 1926-32, 1934-36), 7.72 million gallons a day
(11.9 secona-reet).Extremes.- Maximum discharge recorded during year, 433 million gallons a day (670 second-
feet; Jan. 17 (gage height, 6.35 feet), from rating curve extended above 20 million gallons a day; minimum, 0.22 million gallons a day (0.34 second-foot) Nov. 13, 14, 15.
1913-36: Maximum discharge, 1,160 million gallons a day (1,790 second-feet) Jan. 1, 1933, (gage height, 9.63 feet), from rating curve extended above 120 million gallons a day; minimum, 0.09 million gallons a day (0.15 second-foot) Mar. 22, 1926.
Remarks.- Records good for ordinary stages, those for. July 1-15, Aug. 8-12, Dec. 22, 24- 297"Feb. 12 (computed on basis of records for Left Branch of North Fork of Kaukonahua Stream), are fair, and those for high stages are poor. No diversions " we station.
Rating tattle, fiscal year 1935-36 (gage height, In feet, and discharge, In nllllon gallons a dey)
2.52.6 2.8 3.0
July 1 to Feb. 14
0.10.30
1.353.4
3.2 3.4 3.6 4.0 4.5
7.415.428.570133
Feb. 15 to June 30
2.6 2.8 3.0 3.2
0.301.353.47.3
3.4 3.6 4.0 4.4
14.1235091
Discharge, In million gallons, fiscal year July 1935 to June 1936
Day
1 2 3 4 5
67a9
10
1112 13 14 15
16 17 18 19 20
21 22 23 24 25
26 27 28 29 30 31
July
4.2 3.1 4.P 3.2
13
6.8 ' 3.8
4.1 3.9
10
20 4.0 3.5 2.7 2.0
2.4 2.3 9.5
25 3.4
2.4 2.1 1.94 3.3 7.0
3.2 2.85 2.1 18.5 3.2 2.8
Aug.
4.0 38.3 6,0 3.4 2.5
2.2 2.1 3.5 2.5
11
9.0 4.0
10.3 4.4 2.75
11.3 3.4 2.85 2.4 3.25
4.1 2.3 2.05
13.3 2.65
2.1 1.86 1.94 1.94 1.78 1.86
Sept.
18.3 3.6 3.3 2.05 5.4
54 5.5 3.25 2.75
43
6.2 7.0 3.25 3.25 2.65
8.2 59 6.4 4.4 3.5
3.5 2.85 ?.5 2.2 2.05
1.86 1.69 «.60 s-1.35 1.23
Oct.
1.11 1.05
21 2.751.78
1.52 1.35 1.23 1.05 .99
.992.1 2.75 18.6 2.7
1.52 1.23 1.17 1.05 .93
1.05 1.35 ,93
1.19 1.11
.87
.75
.66
.62
.57
.52
Month
Jul Augi Sep Oct NOT Dec
C
Jan Feb Mar Apr May Jun
F
y. ........................... list..........................
alendar year 193
Iscal year 1935-
Nov.
0.62 .52 .48 .62 .52
.44
.34
.30
.30
.28
.28
.26
.24
.26 12.6
.95111
6.2 4.7 2.05
1.69 1.29 1.11 1.38 1.27
.93
.81 1.23 1.31 2.45
Dec.
1.23 .99 .75 .66 .62
.57 1.26 .81 .62
9.1
3.1 1.11 1.70 1.76 .93
.70
.57
.52
.48
.44
.39
.34 ».34 .34 .52
.5S
.48
.44
.39 ».28 .2£
Jan.
0.26 .24 .24 .26 .30
.88 1.52 .81
4.4 .70
.39
.S3
.30
.8711.4
4.6 38 2.6 1.35 .99
.75
.66
.57
.48
.39
.34
.30
.30
.30
.82
.70
Feb.
1.47 11.3 2.35 1.05 1.73
.87
.62
.52
.44
.39
».34 .39
».39 .39 .34
.34
.34
.34
.44
.39
2.05 1.36 .31
3.0 11.5
3.1 .37
2.2
Million gallons a day
Maxlnuni
2518.3 59 21 111 9.1
297
38 11.5 84 17.0 68 23.5
111
Minimum
1.94 1.78 1.23 .52 .24 .28
.24
.24
.34
.99
.87 1.78 1.78
.24
Mean
5.82 4.68 8.86 2.47 5.23 1.04
5.73
2.45 1.80 7.43 3.44 9.16 5.80
4.85
Mar.
2.S 7.4 6.8 1.60 1.23
1.23 .99
1.17 16.0 4.4
9.2 4.2 3.0 2.4 1.94
2.7 5.6
84 48 5.5
4.3 3.4 2.85 2.65 2.3
2.4 1.94 1.78 1.69 1.44 1.29
Apr.
1.78 1.23 1.05 1.18 4.9
6.2 2.351.35 1.58 3.7
2.2 1.35
17.0 8.6 2.5
6.8 11.8 2.75 2.05 1.86
1.52 1.29 2.05 1.44 1.29
1.23 1.11 .99 .87
9.2
Second- feet '
(mean)
9.00 7.24 13.7 3.82 8.09 1.51
8.87
3.79 2.79
11.5 5.32
14.2 8.97
7.50
May
20 12.5 2.65 2.05 6.8
12.2 3.25 6.3 3.5 3.55
2.21.94 1.78
14.5 55
68 10.9 7.1 5.4. 4.6
4.4 3.65 3.15 2.85 3.0
2.65 2.4 7.5 2.75 2.3 5.1
June
2.4 2.1 7.3 3.8
10.9
3.8 2.5 2.752.05 1.86
1.86 2.05 1.78 4.9 2.3
3.15 2.7 6.9 17.5 18.6
5.5 3.65 3.7 4.7 3.9
13.2 23.5 4.8 4.5 3.25
Total run-off
Million gallons
180 145 266 76.5
157 32.2
2,090
76.0 52.2
230 103 284 174
1,780
554 445 816 235 482 99
6,420
233 160 706 317 871 534
5,450
Wartly estimated.
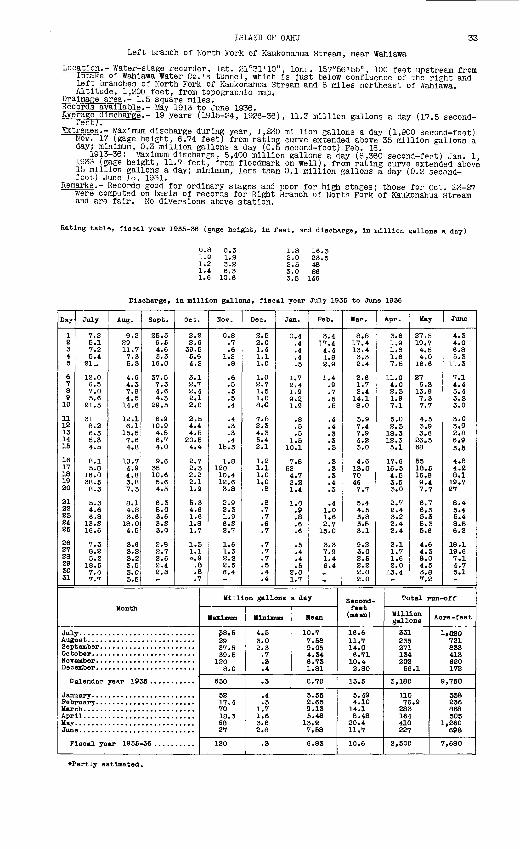
ISLAND OF OAHU
Left Branch of North Fork of Kaukonahua Stream, near Wahiawa
33
Location.- Water-stage recorder, lat. 21°31'10", lonp. 157°56'55", 100 feet upstream from intake of Wahiawa Water Co.'s tunnel, which Is Just below confluence of the right and left branches of North Fork of Kaukonahua Stream and 8 miles northeast of Wahiawa. Altitude, 1,200 feet, from topographic map.
Drainage_area.- 1.5 square miles.Hecbr3s available.- May 1913 to June 1936.Average discharge.- 19 years (1915-24, 1926-36), 11.3 million gallons a day (17.5 second-
feet).'Sxtremes.- Maximum discharge during year, 1,230 million gallons a day (1,900 second-feet)
Nov. 17 (gage height, 6.74 feet) from rating curve extended above 35 million gallons a day; minimum, 0.3 million gallons a day (0.5 second-foot) Feb. 18.
1913-36: Maximum discharge, 5,400 million gallons a day (8,360 second-feet) Jan. 1, 1933 (gage height, 11.7 feet, from floodmark on well), from rating curve extended above 15 million gallons a day; minimum, less than 0.1 million gallons a day (o.2 second- foot) June 15, 1931.
Remarks.- Records good for ordinary stages and poor for high stages; those for Oct. 23-27 were computed on basis of records for Right Branch of North Fork of Kaukonahua Stream and are fair. No diversions above station.
Rating table, fiscal year 1935-36 (gage height, In feet, and discharge, In million gallons a day)
0.8 0.3 1.8 16.3 1.0 1.2 2.0 23.5 1.2 3.2 2.5 48 1.4 6.3 3.0 86 1.6 10.6 3.5 146
Discharge, in million gallons, fiscal year July 1935 to June 1936
Day
1 2 3 4 5
6 7 8 9
10
11 12 13 14 15
16 17 18 19 20
21 22 23 24 25
26 27 28 29 30 31
July
7.2 5.1 7.2 5.4
21.
12.0 6.5 7.0 5.6
21.5
31 8.2 6.3 5.3 4.5
8.1 5.8
16.0 38.5 8.3
5.3 4.6 6.8
13.2 16.6
7.3 8.2 5.2
18.5 7.0 7.7
Aug.
9.2 2911.7 7.3 5.3
4.6 4.3 7.8 4.5
14.6
12.1 6.1
15.5 7.6 4.8
10.7 4.9 4.8 3.8 7.3
8.1 4.8 3.6
18.0 4.5
3.6 3.2 3.2 3.5 3.0 3.5
Sept.
25.5 6.5 4.6 3.3
16.0
37.5 7.3 4.6 4.3
29.5
6.9 10.9 4.B 6.7 4.0
9.6 35 10.6 5.6 4.3
6.3 5.0 3.6 3.2 3.0
2.8 2.7 2.6 2.4 2.3
Month
Jul Auff Sep Oct NOT Dec
C
Jan Fob liar Apr May Jun
F
Oct.
2.2 2.6
39.5 5.6 4.2
3.1 2.7 2.4 2.1 2.0
2.5 4.4 4.5
20.5 4.4
2.7 2.3 2.2 2.1 1.9
5.3 4.6 1.6 1.8 1.7
1.3 1.1 *.9
.8
.8
.7
Nov.
0.8 .7 .6
1.2 .8
.6
.5
.5
.5
.4
.4
.3
.3
.4 15.3
1.8 120 10.4 12.6 3.8
2.9 2.3 1.9 6.2 2.7
1.6 1.3 2.2 2.5 6.4
Dec.
2.5 2.0 1.4 1.1 1.0
1.0 2.7 1.5 1.0 8.0
7.8 2.3 4.3 5.4 2.1
1.2 1.1 1.0 1.0
.8
.8
.7
.7
.6
.7
.7
.7
.7
.5
.4
.4
Jan.
0.4 .4 .4 .4 .5
1.7 2.4 1.9 9.21.9
.8
.5
.5 1.5
10.1
7.8 52 4.7 2.2 1.4
1.0 .9 .8 .6 .6
.5
.4
.4
.5 2.0 1.7
Feb.
3.4 17.4 4.4 1.8 2.9
1.4 .9 .7 .5 .5
.4
.4
.3
.3
.3
.3
.3
.3
.4
.3
.41.0 1.6 2.7
15.0
3.3 7.9 1.4 6.4
Million gallon's a day
Maximum
alendar year 19
Iscal year 1935 36
38.5 29 37.5 39.5
120 8.0
630
52 17.4 70 18.3 68 27
120
Minimum Mean
4.5 10.7 3.0 7.58 2.3 9.05
.7 4.34
.3 6.73
.4 1.81
.3 G.70
.4 3.55
.3 2.65 1.7 9.13 1.6 5.48 3.6 13.2 2.8 7.58
.3 6.83
Mar.
8.8 17.4 13.4 3.3 2.4
2.6 1.7 2.4
14.1 8.0
3.9 7.4 7.9 4.2 3.0
4.6 13.0 70 467.7
5.4 4.5 3.8 3.5 3.1
9.2 3.0 2.5 2.2 2.0 2.0
Second- feet
(mean)
Apr.
3.61.9 1.5 1.6 7.5
11.0 4.0 2.3 1.9 7.1
5.0 2.3
18.3 12.3 5.1
17.6 16.5 4.5 3.5 3.0
2.7 2.4 3.2 2.4 2.4
2.1 1.7 1.6 2.0
13.4
May
27.5 19.7 4.5 4.0
16.6
27 6.3
13.9 7.3 7.7
4.5 3.9 3.6
26.5 68
55 18.5 16.8 9.47.7
6.7 6.3 5.3 5.3 5.6
4.6 4.3 8.0 4.5 3.8 7.2
June
4.3 4.0 6.8 5.3
11.3
7.1 4.4 5.4 3.3 3.0
3.0 3.9 2.8 6.9 3.5
4.8 4.2 8.1
19.7 27
8.4 5.4 5.4 8.5 6.2
18.1 19.6 7.1 4.7 5.1
Total run-off
gabions *
16.6 331 1,080 11.7 235 721 14.0 271 833 6.71 134 413
10.4 202 620 2.80 56.1 172
13.5 3,180 9,760
5.49 110 338 4.10 76.9 236
14.1 283 868 8.48 164 505
20.4 410 1,260 11.7 227 698
10.6 2,500 7,680
»Partly estimated.
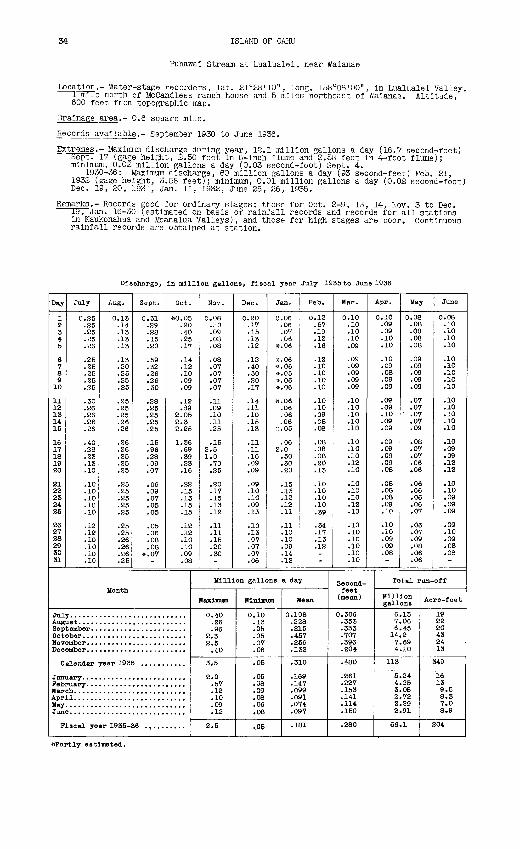
34 ISLAND OF OAHU
Puhawal Stream at Lualualei, near Waianae
Location.- Water-stage recorders, lat. 21°28'10", long. 158°08'00", in Lualualei Valley, I mile north of McCandless ranch house and 5 miles northeast of Waianae. Altitude, 600 feet from topographic map.
Drainage area.- 0.6 square mile.
Records available.- September 1930 to June 1936.
Extremes.- Maximum discharge during year, 12.1 million gallons a day (18.7 second-feet) Sept. 17 (gage height, 2.50 feet in 6-inch flume and 2.58 feet in 4-foot flume); minimum, 0.02 million gallons a day (0.03 second-foot) Sept. 4.
1930-36: Maximum discharge, 60 million gallons a day (93 second-feet) Feb. 21, 1932 (gage height, 3.58 feet); minimum, 0.01 million gallons a day (0.02 second-foot) Dec. 19, 20, 1931, Jan. 11, 1932, June 25, 26, 1935.
Remarks.- Records good for ordinary stages; those for Oct. 2-9, 13, 14, Nov. 3 to Dec. 19, Jan. 16-30 (estimated on basis of rainfall records and records for all stations in Kaukonahua and Moanalua Valleys), and those for high stages are poor. Continuous rainfall records are obtained at station.
Discharge, In million gallons, fiscal year July 1935 to June 1936
Day
1 2 3 4 5
6 7 8 9
10
11 12 13 14 15
16 17 18 19 20
21 22 23 24 25
26 27 28 29 30 31
July
0.25 .25 .25 .25 .26
.25
.25
.25
.25
.25
.30
.26
.26
.26
.26
.40
.28
.23
.13
.10
.10
.10
.10
.10
.10
.12
.12
.10
.10
.10
.10
Aug.
0.13 .14 .13 .13 .13
.13
.20
.25
.25
.25
.25
.25
.25
.26
.26
.26
.26
.25
.25
.25
.25
.25
.25
.25
.25
.25
.25
.26
.26
.26
.25
Sept.
0.31 .29 .28 .15 .20
.59
.32
.26
.26
.30
.28
.25
.25
.25
.25
.15
.96
.28
.09
.07
.06
.09
.07
.05
.05
.05
.06
.08
.08 #.07
Oct.
#0.05 .90 .40 .25 .17
.14
.12
.10
.09
.09
.12
.89 2.05 2.3 2.25
1.36 .69 .39 .23 .16
.22
.15
.13
.15
.15
.12
.12
.10
.10
.09
.08
Month
Jul Augi Sep Got NOT Dec
C
Jan Feb Mar Apr May Jun
P
alendar year 193
Iscal year 1935-
Nov.
0.08 .10 .09 .08 .08
.08
.07
.07
.07
.07
.11
.09
.10
.11
.25
.15 2.5 1.0 .70 .25
.20
.17
.15
.13
.12
.11
.11
.15
.20
.30
Dec.
0.20 .17 .15 .13 .12
.12
.40
.30
.20
.17
.14
.11
.10
.15
.13
.11
.11
.10
.09
.09
.09
.10
.10
.09
.13
.10
.13
.07
.07
.07
.06
Jan.
0.06 .06 .07 .06
#.06
#.06 #.06 #.05 *.06 #.06
#.06 .06 .06 .06
-::-.05
.06 2.0 .50 .30 .20
.15
.13
.12
.12
.11
.11
.10
.10
.09
.14
.12
Feb.
0.12 .57 .19 .12 .16
.12
.10
.10
.10
.10
.10
.10
.09
.08
.08
.08
.08
.08
.20
.13
.10
.10
.10
.10
.39
.34
.17
.13
.12
Million gallons a day
Maximum
0.40 .26 .96
2.3 2.6 .40
3.5
2.0 .57 .12 .10 .09 .12
2.5
Minimum
0.10 .13 .06 .05 .07 .06
.06
.05
.08
.09
.08
.06
.08
..06
Mean
0.198 .228 .215 .457 .256 .132
.310
.169
.147
.099
.091
.074
.097
.181
Mar.
0.10 .10 .10 .10 .09
.09
.09
.09
.09
.09
.10
.10
.10
.10
.10
.10
.10
.10
.12
.10
.10
.10
.10
.12
.10
.10
.10
.10
.10
.10
.10
Apr.
0.10 .09 .09 .10 .10
.10
.09
.08
.09
.09
.09
.09
.10
.09
.09
.09
.09
.09
.09
.08
.08
.08
.08
.09
.10
.10
.10
.09
.09
.08
Second- feet (mean)
0.306 .353 .333 .707 .396 .2(54
.480
.261
.227
.153
.141
.114
.150
.280
May
0.08 .08 .08 .08 .08
.09
.09
.09
.09
.09
.07
.07 ' .07 .07 .09
.08
.07
.07
.06
.06
.06
.06
.06
.06
.07
.06
.07
.09
.08
.06
.06
June
0.08 .10 .10 .10 .10
.10
.10
.10
.10
.10
.10
.10
.10
.10
.10
.10
.09
.09
.12
.12
.10
.10
.09
.09
.09
.09
.10
.09
.08
.08
Total run-off
Million gallons
6.13 7.06 6.45
14.2 7.69 4.10
113
5.24 4.25 3.08 2.72 2.29 2.91
66.1
Acre-feet
19 22 20 43 24 13
349
16 13 9.5 8.3 7.0 8.9
204
ftPartly estimated.
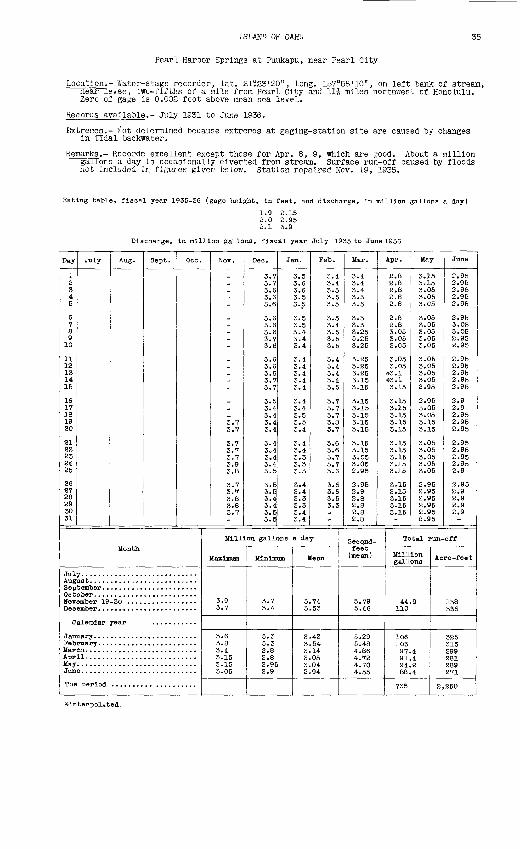
ISLAND OF OAHU 35
Pearl Harbor Springs at Puukapu, near Pearl City
Location.- later-stage recorder, lat. 21"23'20", long. 157°58'10", on left bank of stream, near levee, two-fifths of a mile from Pearl City and 11-J miles northwest of Honolulu. Zero of gage is 0.002 foot above mean sea level.
Records available.- July 1931 to June 1936.
Extremes.- Kot determined because extremes at gaging-station site are caused by changes IrfTTdal backwater.
Remarks.- Records excellent except those for Apr. 8, 9, which are good. About a million gallons a day is occasionally diverted from stream. Surface run-off caused by floods not included in figures given below. Station repaired Nov. 19, 1935.
Rating table, fiscal year 1935-36 (gage height, in feet, and discharge, In million gallons a day)
1.92.02.1
2.152.953.9
Discharge, In million gallons, fiscal year July 1935 to June 1936
Day
1 2 3 4 5
6 7 8 9
10
11 12 13 14 15
16 17 18 19 20
21 22 23 24 25
26 27 28 29 30 31
July Aug. Sept. Oct.
Month
Jul Aug< Sep Oct Nov Dec
C
Jan Feb liar Apr May Jun
The
ember 19
alendar year
uerlod
Nov.
3.7 3.7
3.7 3.7 3.7 3.9 3.8
3.7 3.7 3.8 3.8 3.7
Dec.
3.7 3.7 3.6 3.6 3.6
3.6 3.6 3.6 3.7 3.6
3.6 3.6 3.6 3.7 3.7
3.5 3.4 3.4 3.4 3.4
3.4 3.4 3.4 3.4 3.5
3.5 3.5 3.4 3.4 3.5 3.5
Jan.
3.5 3.6 3.6 3.5 3.5
3.5 3.5 3.4 3.4 3.4
3.4 3.4 3.4 3.4 3.4
3.4 3.4 3.5 3.5 3.4
3.4 3.4 3.3 3.3 3.3
3.4 3.4 3.3 3.3 3.4 3.4
Feb.
3.4 3.4 3.5 3.5 3.5
3.5 3.4 3.5 3.5 3.5
3.4 3.4 3.4 3.4 3.5
3.7 3,7 3.7 3.8 3.7
3.6 3.6 3.7 3.7 3.6
3.6 3.6 3.5 3.3
Million gallons a day
Maximum
3.9 3.7
3.6 3.8 3.4 3.15 3.15 3.05
MinljnUBi
3.7 3.4
3.3 3.3 2.8 2.8 2.95 2.9
Mean
3.74 3.53
3.42 3.54 3.14 3.05 3.04 2.94
Mar.
3.4 3.4 3.4 3.3 3.3
3.3 3.3 3.25 3.25 3.25
3.25 3.25 3.25 3.15 3.15
3.15 3*15 3.15 3.15 3.15
3.15 3.15 3.05 3.05 2.95
2.95 2.9 2.8 2.8 2.8 2.8
Apr.
2.8 2.8 2.8 2.8 2.8
2.8 2.8 3.05 3.05 3.05
3.05 3.05
*3.1 *3.1 3.15
3.15 3.15 3.15 3.15 3.15
3.15 3.15 3.153.15 3.15
3.15 3.15 3.15 3.15 3.15
Secqnd- feet (mean)
5.79 5.46
5.29 5.48 4.86 4.72 4.70 4.55
May
3.15 3.15 3.05 3.05 3.05
3.05 3.05 3.05 3.05 3.05
3.05 3.05 3.05 3.05 2.95
2.95 3.05 3.05 3.15 3.15
3.05 3.05 3.05 3.05 3.05
2.95 2.95 2.95 2.95 2.95 2.95
June
2.95 2.95 2.95 2.95 2.95
2.95 3.05 3.05 2.95 2.95
2.95 2.95 2.95 2.95 2.95
2.9 2.9 2.95 2.95 2.95
2.95 2.95 2.95 2.95 2.9
2.95 2.9 2.9 2.9 2.9
Total run-off
Million gallons
44.9 110
106 103 97.4 91,4 94.2 88.4
735
Acre-feet
138 336
325 315 299 281 289 271
2,250
^Interpolated.
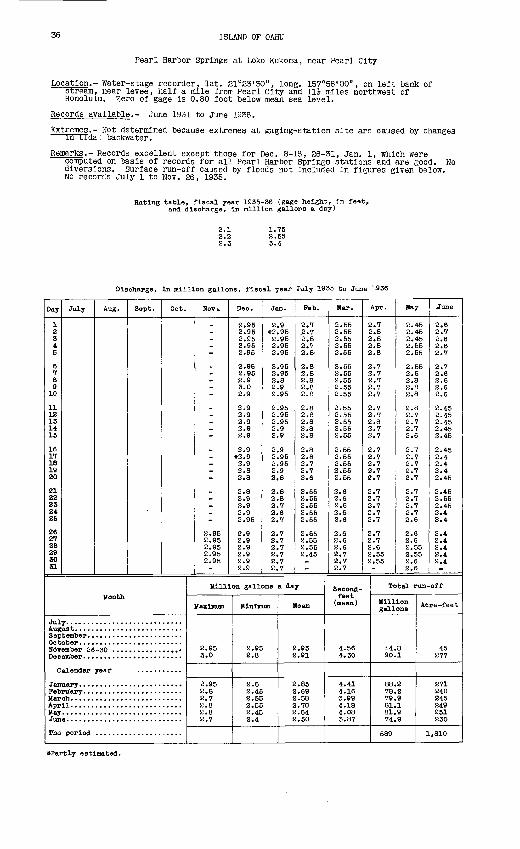
36 ISLAND OF OAHU
Pearl Harbor Springs at Loko Kukona, near Pearl City
Location.- Water-stage recorder, lat. 21°23'30", long. 157°58'00", on left bank of stream, near levee, hair a mile from Pearl City and Hi miles northwest of Honolulu. Zero of gage Is 0.80 foot below mean sea level.
Records available.- June 1931 to June 1936.
Extremes.- Not determined because extremes at gaglng-statlon site are caused by changes in tidal backwater.
Remarks.- Records excellent except those for Dec. 8-16, 26-31, Jan. 1, which werecomputed on basis of records for all Pearl Harbor Springs stations and are good. No diversions. Surface run-off caused by floods not Included In figures given below. No records July 1 to Nov. 26, 1935.
Rating table, fiscal year 1935-36 (gage height, in feet, and discharge, in million gallons a day)
2.12.22.3
1.752.553.4
Discharge In million gallons, fiscal year July 1935 to June 1936
Day
1 2 3 4 5
6 7 8 9
10
11 12 13 14 15
16 17 18 19 20
21 22 23 24 25
26 27 28 29 30 31
July Aug. Sept. Oct.
Month
Jul Aug Sep Oct HOT Dec
C
Jan Feb Mar Apr May Jun
The
ember 26 ember...
alendar year
e. ...........................
period
HoVi.
2.95 2.95 2.95 2.95 2.95
Dec.
2.95 2.95 2.95 2.95 2.95
2.95 2.95 2.9 3.0 2.9
2.9 2.9 2.9 2* 9 2^9
2.9 *2.9 2.9 2.8 2.8
2.8 2.9 2«9s'.s2.95
2.9 2.9 2 »9 2^9 2«9 2\9
Jan.
2.9 #2.95 2.95 2.95 2.95
2.95 2.95 2.8 2.9 2.95
2.95 2.95 2.95 2.9 2.9
2.9 2.95 2.95 2.9 2.8
2.8 2.8 2.7 2.6 2.7
2.7 2.7 2.7 2.7 2.7 2.7
Feb.
2.7 .2.7 2»8 2.7 2.8-
2.8 2.8 2.8 2.8 2.8
2.8 2.8 2.8 2.8 2.8
2.8 2.8 2.7 2.7 2.6
2.55 2.55 2.55 2.55 2.55
2.55 2.55 2.55 2.45
Million gallons a day
Maximum
2.95 3.0
2.95 2.8 2.7 2.8 2.8 2.7
Minimum
2.95 2.8
2.6 2.45 2.55 2.55 2.45 2.4
Mean
2.95 2.91
2.85 2.69 2.58 2.70 2.64 2.50
Mar.
2.55 2.55 2.55 2.55 2.55
2.55 2.55 2.55 2.55 2.55
2.55 2.55 2.55 2.55 2.55
2.55 2.55 2.55 2.55 2.55
2.6 2.6 2.6 2.6 2.6
2.6 2.6 2.6 2.7 2.7 2.7
Apr.
2.7 2*8 2.8 2.8 2.8
2.7 2.7 2.7 2.7 2.7
2.7 2.7 2.8 2.7 2.7
2.7 2.7 2.7 2.7 2.7
2.7 2.7 2.7 2.7 2.7
2.7 2.7 2.6 2.55 2.55
Second- feet (mean)
4.56 4.50
4.41 4.16 3.99 4.18 4.08 3.87
May
2.45 2.45 2.45 2.55 2.55
2.55 2.6 2.8 2.8 2.8
2.8 2.7 2.7 2.7 2.6
2.7 2.7 2.7 2.7 2.7
2.7 2.7 2.7 2.7 2.6
2.6 2.6 2.55 2.55 2.6 2.6
.June
2.6 2.7 2.6 2.6 2.7
2.7 2.6 2.6 2.6 2.6
2.45 2.45 2.45 2.45 2.45
2.45 2.4 2.4 2.4 2.45
2.45 2.55 2.45 2.4 2.4
2.4 2.4 2.4 2.4 2.4
Total run-off
gallons A° feet
14.8 45 90.1 277
88.2 271 78.2 240 79.9 245 81.1 249 81.9 251 74.9 230
589 1,810
Partly estimated.
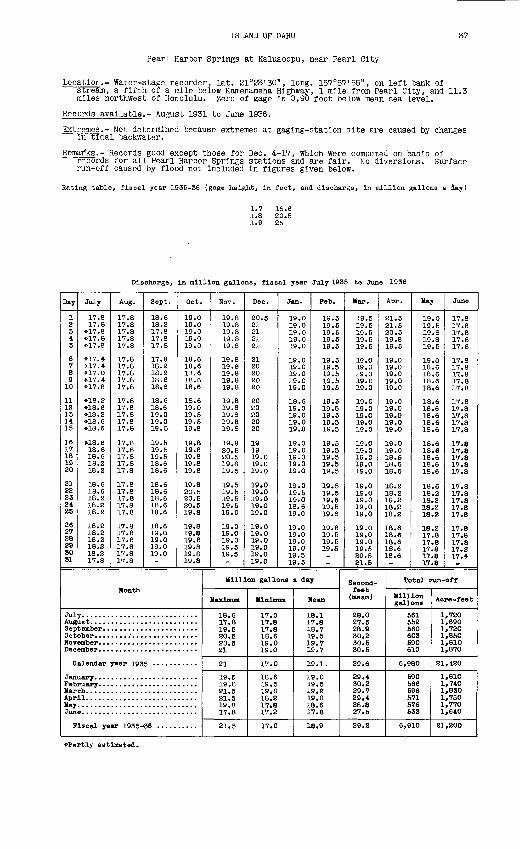
ISLAND OF OAHU 37
Pearl Harbor Springs at Kaluaoopu, near Pearl City
Location.- Water-stage recorder, lat. 21°23'30", long. 157°57'55", on left bank ofstream, a fifth of a mile below Kamehameha Highway, 1 mile from Pearl City, and 11.3 miles northwest of Honolulu. Zero of gage Is 0.90 foot below mean sea level.
Records available.- August 1931 to June 1936.
Extremes.- Not determined because extremes at gaglng-statlon site are caused by changes in tidal backwater.
Remarks.- Records good except those for Dec. 4-17, which were computed on basis ofrecords for all Pearl Harbor Springs stations and are fair. No diversions. Surface run-off caused by flood not Included in figures given below.
Rating table, fiscal year 1935-36 (gage height, In feet, and discharge, In million gallons a day)
1.7 16.61.8 20.51.9 25
Discharge, In million gallons, fiscal year July 1935 to June 1936
Day
1 2 34 5
6 7 89
10
11 12 13 14 15
16 17 18 19 20
21 22 Z3 24 25
26 27 28 29 30 31
July
17.8 17.8
*17.8 «17.8 *17.8
#17.4 *17.4 *17.0 *17.4 *17.8
#18.2 *18.6 *18.2 *18.6 *18.6
*18.6 18.6 18.6 18.2 18.2
18.6 18.6 18.2 18.2 18.2
18.2 18.2 18.2 18.2 18.2 17.8
Aug.
17.8 17.8 17.3 17.8 17.8
17.8 17.8 17.8 17.8 17.8
17.8 17.8 17.8 17.8 17.8
17.8 17.8 17.8 17.8 17.8
17.8 17.8 17.8 17.8 17.8
17.8 17.8 17.8 17.8 17.8 17.8
Sept.
18.6 18.2 17.8 17.8 17.8
17.8 18.2 18.2 18.6 18.6
18.6 18.6 19.0 19.0 19.5
19.5 19.5 19.5 18.6 18.6
18.6 18.6 18.6 18.6 18.6
18.6 19.0 19.0 19.0 19.0
Oct.
19.0 19.0 19.0 19.0 19.0
18.6 18.6 18.6 18.6 18.6
18.6 19.0 19.5 19.5 19.8
19.8 19.8 19.8 19.8 19.8
19.8 20.5 20.5 20.5 19.8
19.8 19.8 19.8 19.8 19.8 19.8
Month
Jul Aug Sep Oct Mov Dec
C
Jan Feb Mar Apr May Jun
F
alendar year 193
11...........................
Iscal year 1935-1
HOT.
19.8 19.8 19.8 19.8 19.8
19.8 19. 6 19.8 19.8 19.8
19.8 19.8 19.8 19.8 19.8
19.8 20.5 20.5 19.8 19.5
19.5 19.5 19.5 19.5 19.0
19.0 19.0 19.0 19.5 19.5
Dec.
20.5 21 21 21 21
21 20 20 20 20
20 20 20 20 20
19 19 19.0 19.0 19.0
19.0 19.0 19.0 19.0 19.0
19.0 19.0 19.0 19.0 19.0 19.0
Jan.
19.0 19.0 19.0 19.0 19.0
19.0 19.0 19.0 19.0 19.0
18.6 19.0 19.0 19.0 19.0
19.0 19.0 19.0 19.0 19.0
19.0 19.5 19.0 18.6 19.0
19.0 19.0 19.0 19.0 19.5 19.5
Feb.
19.5 19.5 19.5 19.5 19.5
19.5 19.5 19.5 19.5 19.5
19.5 19.5 19.5 19.5 19.5
19.5 19.5 19.5 19.5 19.5
19.5 19.5 19.5 19.5 19.8
19.8 19.5 19.5 19.5
Million gallons a day
Maximum
18.6 17.8 19.5 20.5 20.5 21
21
19.5 19.8 21.5 21.5 19.8 17.8
21.5
jHnlimliH
17.0 17.8 17.8 18.6 19.0 19.0
17.0
18.6 19.5 19.0 18.2 17*8 17.2
17.0
Mean
18.1 17.8 18.7 19.5 19.7 19.7
19.1.
19.0 19.5 19.2 19.0 18.6 17.8
18.9
Mar.
19.5 19.5 19.5 19.5 19.5
19.0 19.0 19.0 19.0 19.0
19.0 19.0 19.0 19.0 19.0
19.0 19.0 19.0 19.0 19.0
19.0 19.0 19.0 19.0 19.0
19.0 19.0 19.0 19.5 20.5 21.5
Apr.
21.5 21.5 20.5 19.8 19.5
19.0 19.0 19.0 19.0 19.0
19.0 19.0 19.0 19.0 19 .O
19.0 19.0 18.6 18.6 18.6
18.2 18.2 18.2 18.2 18.2
18.6 18.6 18.6 18.6 18.6
Second- foot
(mean)
28.0 27.5 28.9 30.2 30.5 30.5
29.6
29.4 30.2 29.7 29.4 28.8 27.5
29.2
May
19.0 19.5 19.8 19.8 19.5
19.0 18.6 18.6 18.6 18.6
18.6 18.6 18.6 18.6 '18.6
18.6 18.6 18.6 18.6 18.6
18.6 18.2 18.2 18.2 18.2
18.2 17.8 17.8 17.8 17.8 17.8
June
17.8 17.8 17.8 17.8 17.8
17.8 17.8 17.8 17.8 17.8
17.8 17.8 17.8 17.8 17.8
17.8 17.8 17.8 17.8 17.8
17.8 17.8 17.8 17.8 17.8
17.8 17.8 17.8 17.2 17.4
Total run-off
Million gallons
561 552 560 603 590 610
6,980
590 566 596 571 576 533
6,910
Acre -feet
1,720 1,690 1,720 1,850 1,810 1,870
21,420
1,810 1,740 1,830 1,750 1,770 1,640
21,200
Partly estimated.
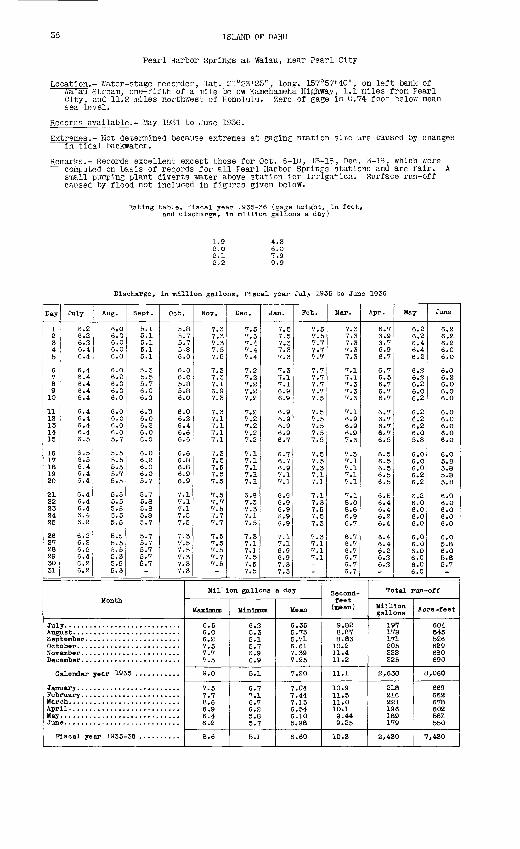
38 ISLAND OF OAHU
Pearl Harbor Springs at Waiau, near Pearl City
Location.- Water-stage recorder, lat. 21°23'25", long. 157°57'40", on left bank of Waiau Stream, one-fifth of a mile below Kamehameha Highway, 1.1 miles from Pearl City, and 11.2 miles northwest of Honolulu. Zero of gage is 0.74 foot below mean sea level.
Records available.- May 1931 to June 1936.
Extremes.- Not determined because extremes at gaging station site are caused by changes in tidal backwater.
Remarks.- Records excellent except those for Oct. 8-10, 13-18, Dec. 3-18, which were computed on basis of records for all Pearl Harbor Springs stations and are fair. A small pumping plant diverts water above station for irrigation. Surface run-off caused by flood not included in figures given below.
Rating table, fiscal year 1935-36 (gage height, in feet, and discharge, in million gallons a day)
4.3 6.0 7.9
Discharge, In million gallons, fiscal year July 1935 to June 1936
Day
1 2 3 4 5
6 7 8 9
10
11 12 13 14 15
16 17 18 19 20
21 22 23 24 25
26 27 28 29 30 31
July
6.2 6.2 6.2
6.4
6.4 6.4
6.46.4
6.4 6.4 6.4 6.4 6.5
6.5 6.5 6.4 6.4 6.4
6.4 6.4 6.4 6.4 6.2
6.2 6.26.2 6.4 6.2 6.2
Aug.
6.0 6.0 6.0
6.0
6.0 6.0
6.0 6.0
6.0 6.0 6.0 6.0 5.7
5.5 5.5 5.5 5o7 5.5
5.5 5.5 5.5 5.5 5.5
5.5 5.5 5.5 5.3 5.5 5.3
Sept.
5.1 5.1 5.1
5.1
5.3 5.5
6.0 6.0
6.D 6.0 6.2 6.0 6.0
6.0 6.2 6.0 6.0 5.7
5.7 5.8 5.8 5.85.7
5.7 5.7 5.7 5.7 £.7
Oct.
5.85.7 5.7
6.0
6.0 6.0
5.8 6.0
6.0 6.26.4 6.6 6.6
6.6 6.8 6.8 6.9 6.9
7.1 7.1 7.1 7.57.5
7.3 7.5 7.5 7.3 7.3 7.3
Month
Jul Aug Sep Oct NOT Dec
C
Jan Peb Mar Apr May Jun
P
ember ........................
alendar year 192
Lscal year 1935-
Nov.
7.3 7.3 7.3
7.5
7.3 7.3
6.9 7.3
7.3 7.1 7.1 7.1 7.1
7.3 7.5 7.5 7.5 7.5
7.5 7.7 7.5 7.7 7.7
7.5 7.5 7.5 7.7 7.5
Dec.
7.5 7.5 7.4
7.4
7.2 7.2 7 27.2 7.2
7.2 7.2 7.2 7.2 7.2
7.1 7.1 7.1 7.1 7.1
6.9 7.3 7.3 7.1 7.5
7.3 7.1 7.1 7.5 7.5 7.5
Jan.
7.5 7.5 7.3
7.3
7.3 7.1
6.9 6.9
6.9 6.9 6.9 6.9 6.7
6.7 6.7 6.9 7.1 7.1
6.9 6.9 6.96.9 6.9
7.1 7.1 6.9 6.9 7.3 7.3
Peb.
7.5 7.5 7.7
7.7
7.7 7.7
7.7 7.5
7.5 7.5 7.5 7.5 7.5
7.5 7.5 7.3 7.1 7.1
7.1 7.3 7.5 7.5 7.3
7.3 7.17.1 7.1
Million gallons a day
Maximum
6.5 6.0 6.27.5 7.7 7.5
9.0
7.5 7.7 8.6 6.9 6.4 6.2
8.6
Minimum
6.2 5.3 5.1 5.7 6.9 6.9
5.1
6.7 7.1 6.7 6.2 5.8 5.7
5.1
Mean
6.35 5.73 5.71 6.61
7~.25
7.20
7.04 7.44 7.13 6.54 6.10 5.98
6.60
Mar.
7.3 7.3 7.3
7.3
7.1 7.1
7.3 7.3
7.1 6.9 6.9 6.9 7.3
7.3 7.1 7.1 7.1 7.1
7.1 8.0 8.6 6.9 6.7
6.7 6.7 6.7 6.7 6.7 6.7
Apr.
6.7 6.9 6.7
6.7
6.7 6.5
6.7 6.7
6.7 6.7 6.7 6.7 6.5
6.5 6.5 6.5 6.5 6.5
6.5 6.4 6.4 6.2 6.4
6.4 6.4 6.2 6.2 6.2
Second- fee t
(mean)
9.82 8.87 8.83
10.2 11.4 11.2
11.1
10.9 11.5 11.0 10.1 9.44 9.25
10.2
May
6.2 6.2 6.4 6.4 6.2
6.2 6.2
6.0 6.2
6.2 6.2 6.2 6.0 5.8
6.0 6.0 6.0 6.2 6.2
6.2 6.0 6.0 6.0 6.0
6.0 6.0 6.0 6.0 6.0 6.0
June
6.2 6.2 6.2 6.0 6.0
6.0 6.2
6.0 6.0
6.0 6.0 6.0 6.0 6.0
6.0 5.8 5.8 5.8 5.8
6.0 6,0 6.0 6.0 6.0
6.0 5.8 6.0 5.8 5.7
Total run-off
Billion gallons
197 178 171 205 222 225
2,630
218 216 221196 189 179
2,420
Acre-feet
604 545 526 629 680 690
8,060
669 662 678 602 581 550
7,420
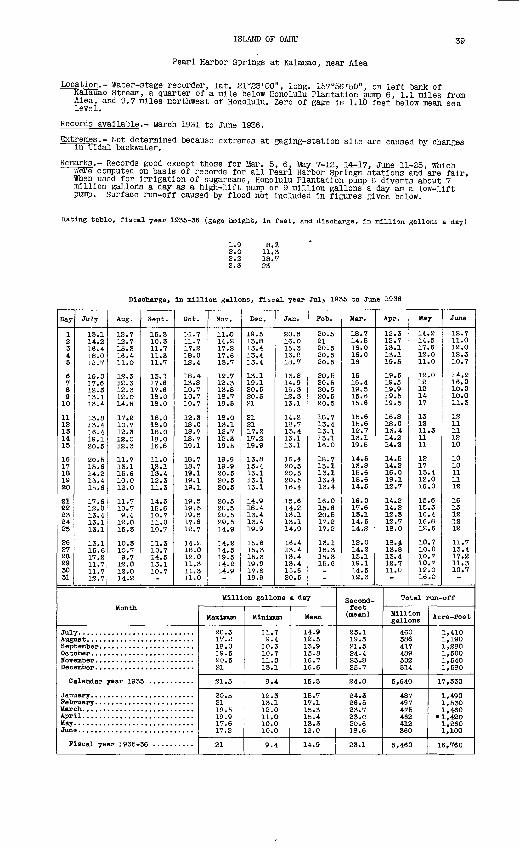
ISLAND OF OAHU
Pearl Harbor Springs at Kalauao, near Alea
39
Location.- Water-stage recorder, lat. 21°23'00", long. 157056'50", on left dank ofKalauao Stream, a quarter of a mile below Honolulu Plantation pump 6, 1.1 miles from Alea, and 9.7 miles northwest of Honolulu. Zero of gage is 1.10 feet below mean sea level.
Records available.- March 1931 to June 1936.
Extremes.- Not determined because extremes at gaging-station site are caused by changes in tidal backwater.
Remarks.- Records good except those for Mar. 5, 6, May 7-12, 14-17, June 11-25, which were computed on basis of records for all Pearl Harbor Springs stations and are fair. When used for irrigation of sugarcane, Honolulu Plantation pump 6 diverts about 7 million gallons a day as a high-lift pump or 9 million gallons a day as a low-lift pump, surface run-off caused by flood not included in figures given below.
Rating table, fiscal year 1935-36 (gage height, in feet, and discharge, in nillion gallons a day)
1.92.02.'s
8.111.318.723
Discharge, In million gallons, fiscal year July 1935 to June 1936
Day
1 2 3 4 5
6 7 8 9 10
11 12 13 14 15
16 17 18 19 20
21 22 23 24 25
26 27 28 29 30 31
July
13.1 14.2 16.4 1S.O 12.7
16.0 17.6 12.3 13.1 13.4
13.8 13.4 16.4 19.1 20.5
20.5 15.6 14.2 13.4 15.6
17.6 12.0 13.4 13.1 13.1
13.1 15.6 17.2 11.7 11.7 12.7
Aug.
12.7 12.7 15.3 16.4 11.0
12.3 12.3 12.3 12.0 14.5
17.2 10.7 12.3 12.0 12.3
11.7 13.1 15.6 10.0 12.0
11.7 10.7 9.4 12.0 15.3
10.3 10.7 9.7 12.0 12.0 14.2
Sept.
15.3 10.3 11.711.3 11.7
13.1 17.6 17.6 18.0 18.0
18.0 18.0 18.0 18.0 16.8
11.0 ],3.1 13.4 12.311.3
14.5 15.6 10.7 11.0 10.7
11.3 10.7 14.5 13.1 10.7
Oct.
11.7 11.7 17.2 18.0 IS. 4
18.4 13.8 10.7 10.7 10.7
12.318.0 18.7 18.7 19.1
18.7 18.7 19.1 19.1 19.1
19.5 19.5 19.5 17.6 12.7
14.2 18.0 12.011.3 11.3 11.0
Month
Jul Augi Sep Oct HOT Dec
C
Jan Peb Mar Apr May Jun
P
alendaz* year 193
Iscal year 1935-
HOT.
11.0 14.2 17.2 17.6 13.7
12.7 12.3 13.8 18.7 19.5
18.0 13.1 12.7 12.3 19.5
19.9 19.9 20.5 20.5 20.5
20.5 20.5 20.5 20.5 14.9
14.2 14.5 19.5 14.2 14.9
Dec.
19.5 13.8 13.4 13.4 13.4
13.1 19.1 20.5 20.5 21
21 21 17.2 17.2 19.9
13.8 13.4 13.1 13.1 13.1
14.9 18.4 13.4 13.4 19.9
15.6 15.3 15.3 19.9 17.6 19.9
Jan.
20.5 16.0 15.3 16.8 18.7
13. S 14.9 15.3 12.3 13.1
14.2 18.7 13.4 13.1 13.1
16.4 20.5 20.5 20.5 16.4
15.6 14.2 13.1 13.1 14.9
16.4 13.4 13.4 13.4 15.6 20.5
Peb.
20.5 21 20.5 20.5 20.5
20.5 20.5 20.5 20.5 20.5
18.7 13.4 13.1 13.1 16.0
18.7 13.1 13.1 13.4 13.4
16.0 15.6 20.5 17.2 17.2
13.1 15.3 15.3 15.6
Million gallons a day
Maximum
20.5 17.2 18.0 19.5 20.5 21
21.5
20.5 21 19.5 19.9 17.6 17.2
21
Minimum
11.7 9.4 10.3 10.7 11.0 13.1
9.4
12.3 13.1 12.0 11.0 10.0 10.0
9.4
Mean
14.912.5 13.9 15.8 16.7 16.6
15.5
15.7 17.1 15.3 15.4 13.3 12.0
14.9
Mar.
18.7 14.5 16.0 16.0 16
16 16.4 19.5 15.6 15.6
15.6 15.6 12.7 13.1 19.5
14.5 13.8 15.6 15.6 14.5
16.0 17.6 13.1 14.5 14.2
12.0 14.2 13.1 19.1 14.5 12.3
App.
12.3 12.7 13.1 13.1 19.5
19.5 19.5 19.9 19.519.5
16.8 18.0 13.4 14.2 14.2
14.5 14.2 16.0 19.1 12.7
14.2 14.2 12.3 12.7 18.0
18.4 13.8 13.4 12.711.0
Second- feet
(mean)
23.1 19.3 21.5 24.4 25.8 25.7
24.0
24.3 26.5 23.7 23. 6 20.6 18.6
23.1
May
14.214.5 17.6 12.0 11.0
12.0 12 12 14 17
13 12 11.3 11 11
1217 13.4 12.0 16.0
15.6 15.3 16.4 16.8 12.6
10.7 10.0 10.7 10.7 12.0 16.0
June
12.7 11.0 12.0 12.3 10.7
14.2 16.0 10.0 10.0 11.3
12 11 11 12 10
10 10 11 11 12
16 13 12 12 12
11.7 13.4 17.2 11.3 10.7
Total run-off
Million gallons
460 386 417 489 502 514
5,640
487 497 475 462 412 360
5,460
Acre-feet
1,410 1,190 1,280 1,500 1,540 1,580
17,330
1,490 1,530 1,460
1,420 1,260 1,100
16,760
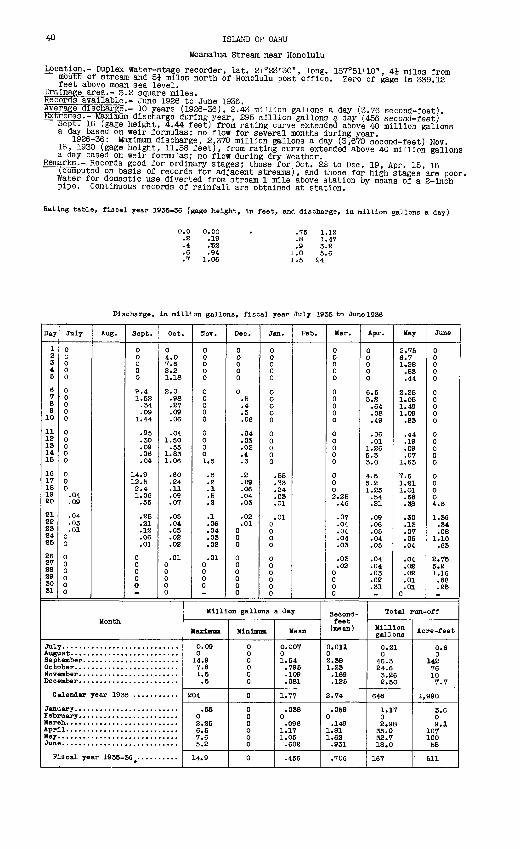
40 ISLAND OF OAHU
Moanalua Stream near Honolulu
Location.- Duplex water-stage recorder, lat. 21°23'30", long. 157°51'10", 4i miles frommoutn of stream and 5J miles north of Honolulu post office. Zero of gage Is 339.12feet above mean sea level.
Drainage area.- 3.2 square miles. Records" available.- June 1926 to June 1936.Average discharge.- 10 years (1926-36), 2.43 million gallons a day (3.76 second-feet). Extremes.- Maximum discharge during year, 295 million gallons a day (456 second-feet)
SepTT 16 (gage height, 4.44 feet) from rating curve extended above 40 million gallonsa day based on weir formulas; no flow for several months during year.
1926-36: Maximum discharge, 2.370 million gallons a day (3,670 second-feet) Nov.18, 1930 (gage height, 11.58 feet), from rating curve extended above 40 million gallonsa day based on weir formulas; no flow during dry weather.
Remarks.- Records good for ordinary stages; those for Oct. 22 to Dec. 19, Apr. 15, 16(computed on basis of records for adjacent streams), and those for high stages are poor.Water for domestic use diverted from stream 1 mile above station by means of a 2-inchpipe. Continuous records of rainfall are obtained at station.
Rating table, fiscal year 1935-36 (gage height, in feet, and discharge, in million gallons a day)
0.0 0.00.2 .19.4 .52.6 .94.7 1.06
.75 1.12
.8 1.47
.9 3.21.0 5.61.5 24
Discharge, in million gallons, fiscal year July 1935 to June 1936
Day
1 2 3 4 5
6 7 8 9
10
11 IS 13 14 15
16 17 18 19 20
212223 24 S5
26 27 28 29 30 31
July
00 0 0 0
0 0 00 0
0 0 0 0 0
0 0 0
.04
.09
.04
.03
.01 0 0
0 0 0 0 0 0
Aug. Sept.
0 0 0 0 0
9.4 1.52
.34
.091.44
.95
.30
.09
.06
.04
14.9 12.5 2.4 1.06
.55
.25
.21
.12
.06
.01
0 0 0 0 0
Oct.
0 4.0 7.6 2.21.18
2.0 .98 .27 .09 .06
.04 1.50
.55 1.83 1.06
.60
.24
.11
.09
.07
.05
.04
.03
.02
.02
.01 0 0 0 0 0
Month
Jill Augi Sep Dot HOT Dec
C
Jam Feto Mar Apr May Jun
F
alendar year 193
Lacal year 1936-36.. .........
HOT.
0 0 0 0 0
0 0 0 0 0
00 0 0 1.5
.5
.2
.1
.5
.2
.1
.06
.04
.03
.02
.01 0 0 0 0
Dec.
0 0 0 00
0 .5 .4 .3 .06
.04
.03
.02
.4
.3
.2
.09
.06
.04
.03
.02
.01 0 0 0
0 0 0 0 0 0
Jan.
0 0 0 0 0
0 0 0 0 0
0 0 0 0 0
.55
.33
.24
.03
.01
.01 0 0 0 0
0 0 0 0 0 0
Feb.
Million gallons a day
KaTlmim
0.09 0
14.9 7.6 1.5 .5
204
.55 0 2.25 6.5 7.6 5.2
14.9
Minimum
0 0 0 0 0 0
0
0 0 0 0 0 0
0
Mean
0.007 0 1.54
.795
.109
.081
1.77
.038 0
.096 1.17 1.05
.602
.456
Mar.
0 0 0 0 0
0 0 0 0 0
0 0 0 0 0
0 0 0 2.25
.46
.07
.04
.04
.04
.03
.03
.02 0 0 0 0
Apr.
0 0 0 0 0
6.5 5.2
.64
.08
.49
.06
.01 1.26 5.3 3.0
4.5 5.2 1.25
.54
.21
.09
.06
.05
.04
.05
.04
.04
.03
.02
.31
Second- feet
(mean)
0.011 0 2.38 1.23
.169
.125
2.74
.059 0
.149 1.81 1.62
.931
.706
May
2.75 6.7 1.28
.83
.44
2.25 1.05 1.49 1.09
.83
.44
.19
.09
.07 1.63
7.6 1.21 1.01
.66 38
.30
.13
.07
.06
.04
.04
.02
.02
.01
.01 0
June
0 0 0 0 0
0 0 0 0 0
0 0 0 0 0
0 0 0 0 4.5
1.36 .34 .08
1.10 .63
2.75 S.2 1.16
.68
.25
Total run-off
Million gallons
0.21 0
46.3 24.6 3.26 2.50
646
1.17 0 2.98
35.0 32.7 18.0
167
Acre -feet
0.6 0
142 76 10 7.7
1,990
3.6 0 9.1
107 100
55
511
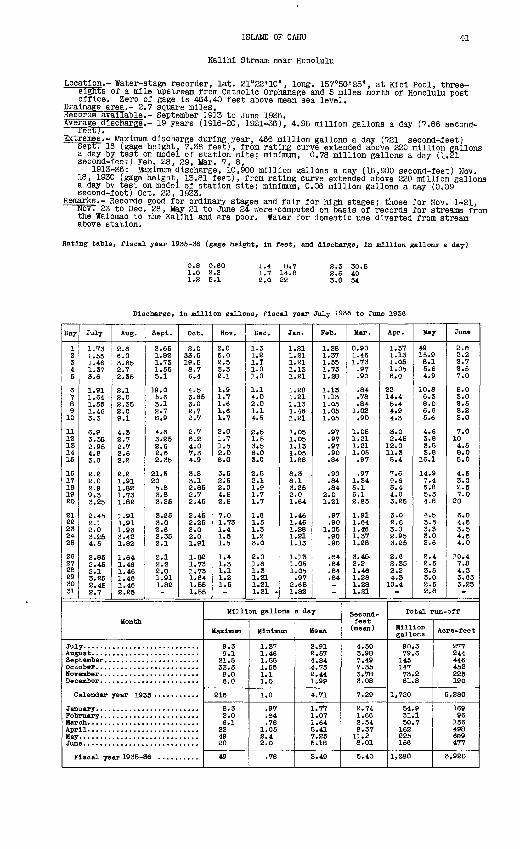
ISLAND OF OAHU
Kalih.1 Stream near Honolulu
41
Location.- Water-stage recorder, lat. 21°22'10", long. 157050'25n , at Klol Pool, three- eights of a mile upstream from Catholic Orphanage and 5 miles north of Honolulu post office. Zero of gage Is 464.40 feet above mean sea level.
Drainage area.- 2.7 square miles.Records available.- September 1913 to June 1936.Average discharge.- 19 years (1916-20, 1921-36), 4.95 million gallons a day (7.66 second-
reet;.Extremes.- Maximum discharge during year, 466 million gallons a day (721 second-feet)
sept. 16 (gage height, 7.38 feet), from rating curve extended above 220 million gallons a day by test on model of station site; minimum, 0.78 million gallons a day (1.21 second-feet) Feb. 28, 29, Mar. 7, 8,
1913-36: Maximum discharge, 10,900 million gallons a day (16,900 second-feet) Nov. 18, 1930 (gage height. 13.81 feet), from rating curve extended above 220 million gallons a day bv test on model of station site; minimum, 0.06 million gallons a day (0.09 second-foot) Oct. 22, 1933.
Remarks.- Records good for ordinary stages and fair for high stages; those for Nov. 1-21, Nov. 23 to Dec. 28, May 21 to June 24 were -computed on basis of records for streams from the Walomao to the Kalihl and are poor. Water for domestic use diverted from stream above station.
Rating table, fiscal year 1935-36 (gage height, in feet, and discharge, In million gallons a day)
0.8 0.601.0 2.21.2 5.1
1.4 1.7 2.0
8.714.822
2.3 30.52.6 403.0 54
Discharge, In million gallons, fiscal year July 1935 to June 1936
Day
1 2 3 4 5
6 7 8 9
10
11 12 13 14 15
16 17 18 19 20
21 22 23 24 25
26 27 28 29 30 31
July
1.73 1.55 1.46 1.37 3.6
1.91 1.64 1.55 1.46 3.3
6.9 3.35 2.95 4.8 3.0
2.2 2.0 2.9 9.3 3.25
2.45 2.1 2.0 3.25 4.5
2.85 2.45 2.1 3.25 2.45 2.7
Aug.
2.6 6.0 3.65 2.7 2.35
2.1 2.0 2.35 2.0 9.1
4.3 2.7 2.7 2.6 2.2
2.2 1.91 1.82 1.73 1.82
1.91 1.91 1.93 3.42 1.82
1.64 1.46 1.46 1.46 1.46 2.25
Sept.
2.65 1.82 1.73 1.55 5.1
19.0 5.6 3.1 2.7 S.9
4.6 3.25 2.6 2.6 2.35
21.5 20 5.8 3.8 3.25
3.25 3.0 2.6 2.35 2.1
2.1 2.2 2.0 1.91 1.82
Oct.
2.0 33.5 19.5 8.7 6.4
4.5 3.65 3.0 2.7 2.7
2.7 6.2 4.0 7.3 4.9
3.8 3.1 2.85 2.7 2.45
2.45 2.25 2.0 2.0 1.91
1.82 1.73 1.73 1.64 1.55 1.55
Month
Jul Aug Sep Dot HOT Dec
0
Jan Feb Mar Apr Hay Jun
F
alendar year 19:
11...........................
Iscal year 1935-!56 ..........
Nov.
2.0 5.0 2.5 3.3 2.1
1.9 1.7 1.6 1.6 1.7
2.0 1.7 1.5 2.0 8.0
3.5 2.'5 2.0 4.5 2.5
7.0 1.73 1.4 1.5 1.5
1.4 1.3 1.1 1.2 1.5
Dec.
1.31.2 I.I 1.0 1.0
1.14.0 2.0 1.1 4.5
2.5 1.5 3.5 6.0 3.0
2.5 2.1 1.9 1.7 1.7
1.6 1.5 1.3 1.2 3.0
2.0 1.6 1.3 1.21 1.21 1.21 »
Jan.
1.21 1.21 1.21 1.13 1.21
1.28 1.21 1.13 1.46 1.21
1.05 1.05 1.13 1.05 1.88
8.3 6.1 3.25 2,0 1.64
1.46 1.46 1.28 1.21 1.13
1.13 1.05 1.05
.97 2.65 1.82
Feb.
1.28 1.37 1.55 1.73 1.28
1.13 1.13 1.05 1.05 1.05
.97
.97
.97
.90
.84
.90
.84
.84 2.0 1.21
.97
.90 1.05
.90
.90
,64 .84 .84 .84
Million gallons a day
Maximum
9.3 9.1
21.5 33.5 8.0 6.0
216
8.3 2.0 6.1
22 49 20
49
Minimum
1.37 1.46 1.55 1.55 1.1 1.0
1.0
.97
.64
.78 1.05 2.4 2.0
.78
Mean
2.91 2.57 4.84 4.75 2.44 1(,99
4.71
1.77 1.07 1.64 5.41 7.25 5.18
3.49
Mar.
0.90 1.46 1.73
.97
.90
.84
.78
.84 1.02
.90
1.05 1.21 1.21 1.05 .97
.97 1.34 5.1 6.1 2.85
1.91 1.64 1.46 1.37 1.28
3.46- 2.2 1.46 1.28 1.28 1.21
Apr.
1.37 1.13 1.05 1.05 6.0
22 14.4 5.4 4.9 4.3
3.0 2.45
12.0 11.3 5.4
7.6 9.6 5.4 4.0 3.25
3.0 2.6 3.0 2.95 3.25
2.6 2.35 2.2 4.3
10.4
Second- feet
(mean)
4.50 3.98 7.49 7.35 3.78 3.08
7.29
2.74 1.66 2.54 8.37
11.2 8.01
5.40
May
49 15.9 8.1 5.S 4.9
10.8 6.3 8.0 6.6 5.6
4.6 3.8 3.5 3.8
16.1
14.9 7.4 5.8 5.3 4.8
4.5 3.5 3.3 3.0 2.6
2.4 ' 2.5
3.5 3.0 2.5 2.8
June
s.e2.2 2.7 2.5 7.0
6.0 3.0 2.5 2.2 2.0
7.0 10 4.5 8.0 5.0
4.5 3.0 2.5 7.0
20
6.0 4.5 3.5 4.5 4.0
10.4 7.8 4.5 3.65 3.25
Total run-off
Hilllon gallons
90.3 79.6
145 147 73.2 61.8
1,720
54.9 31.1 50.7
162 225 156
1,280
Acre-feet
277 244 446 452 225 190
5,280
169 96
156 498 669 477
3,920
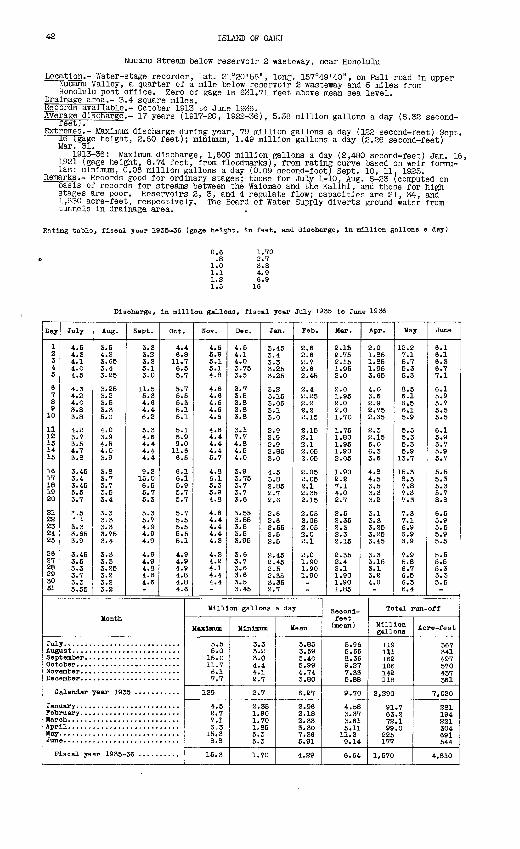
42 ISLAND OF OAHU
Nuuanu Stream below reservoir 2 wasteway, near Honolulu
Location.- Water-stage recorder, lat. 21020'55", long. 157°49'40", on Pall road In upper KTuuanu Valley, a quarter of a mile below reservoir 2 wasteway and 5 miles from Honolulu post office. Zero of gage Is 631.71 feet above mean sea level.
Drainage area.- 3.4 square miles.Records available.- October 1913 to June 1936.Average discharge.- 17 years (1917-20, 1922-36), 5.38 million gallons a day (8.32 second-
reetj.Extremes.- Maximum discharge during year, 79 million gallons a day (122 second-feet) Sept.
16 (gage height, 2.60 feet); minimum, 1.49 million gallons a day (2.26 second-feet) Mar. 31.
1913-36: Maximum discharge, 1,600 million gallons a day (2,480 second-feet) Jan. 16, 1921 (gage height, 8.74 feet, from floodmarks), from rating curve based on weir formu las: minimum, 0.06 million gallons a day (0.09 second-foot) Sept. 10, 11. 1925.
Remarks.- Records good for ordinary stages; those for July 1-10, Aug. 8-23 (computed on basis of records for streams between the Waiomao and the Kalihl, and those for high stages are poor. Reservoirs 2, 3, and 4 regulate flow; capacities are 21, 34, and 1,630 acre-feet, respectively. The Board of Water Supply diverts ground water from tunnels In drainage area.
Rating table, fiscal year 1935-36 (gage height. In feet, and discharge, in Million gallons a day)
1.01.11.2 1.5
1.702.73.84.96.9
16
Discharge, in million gallons, fiscal year July 1935 to Ju
Day
1 2 3 4 5
6 7 8 9
10
11 12 13 14 15
16 17 18 19 20
21 22 23 2425
26 27 28 29 30 31
July
4.5 4.3 4.1 4.0 4.5
4.3 4.2 4.0 3.8 3.8
4.2 3.7 3.5 4.7 3.8
3.45 3.4 3.45 5.5 3.7
.'.5 * 1 3.3 3.65 3.9
3.45 3.5 3.3 3.7 3.3 3.55
Aug.
3.5 4.2 3.65 3.4 3.25
3.25 3.2 3.5 3.3 5.0
4.0 3.9 4.5 4.0 3.9
3.8 3.7 3.7 3.5 3.4
3.3 3.3 3.3 3.75 3.4
3.3 3.3 3.25 3.2 3.2 3.2
Sept.
3.3 3.2 3.2 3.1 3.0
11.5 5.3 4.6 4.4 6.2
5.3 4.6 4.4 4.4 4.4
9.2 15.0 6.5 5.7 5.3
5.3 5.7 4.9 4.9 4.9
4.9 4.9 4.8 4.6 4.6
Oct.
4.4 6.8
11.7 6.5 5.7
5.7 5.5 5.3 5.15.1
5.1 5.9 9.0 11.6 6.5
6.1 6.1 5.95.7 5.7
5.7 5.5 5.5 5.5 5.1
4.9 4.9 4.9 4.8 4.8 4.6
Month
Jul Augi Sep Oct HOT Dec
C
Jan Fob Mar Apr May Jun
F
alendar year 192
.seal year 1935-
HOT.
4.6 5.9 5.1 5.1 4.8
4.6 4.6 4.6 4.6 4.6
4.6 4.4 4.4 4.4 5.7
4.8 6.1 5.3 5.94.8
4.64.4 4.4 4.4 4.3
4.2 4.2 4.1 4.4 4.4
Dec.
4.5 4.1 4.0 3.75 3.5
2.7 3.5 2.8 2.8 3.8
3.17.7 4.8 4.5 4.0
3.9 3.75 3.7 3.7 3.6
3.55 3.55 3.5 3.5 3.95
3.6 3.7 3.6 3.6 3.5 3.45
Jan.
3.45 3.4 3.3 3.25 3.25
3.2 3.15 3.05 3.1 3.0
2.9 2.9 2.9 2.85 3.0
4.5 3.8 2.85 2.7 2.6
2.6 2.6 2.55 2.5 2.5
2.45 2.45 2.5 2.35 3.35 2.7
Feb.
2.6 2.6 2.7 2.6 2.45
2.4 2.25 2.2 2.22.15
2.15 2.1 2.1 2.05 2.05
2.05 2.05 2.1 2.35 2.15
2.05 2.05 2.05 2.0 2.1
2.0 1.90 1.90 1.90
Million gallons a day
Maximum
5.5 5.0 15.0 11.7 6.1 7.7
129
4.5 2.7 7.1 6.3
15.3 8.8
15.3
Minimum
3.3 3.2 3.0 4.4 4.1 2.7
2.7
2.35 1.90 1.70 1.85 5.3 5.3
1.70
Mean
3.85 3.59 5.40 5.99 4.74 3.80
6.27
2.96 2.18 2.33 3.30 7.26 5.91
4.29
Mar.
2.15 2.75 2.15 1.95 2.0
2.0 1.95 2.0 2.0 1.70
1.75 1.80 1.95 1.90 2.05
1.90 2.2 7.1 4.0 2.7
2.5 2.35 2.3 2.3 2.15
2.35 2.4 2.1 1.90 1.90 1.85
Apr.
2.0 1.85 1.85 1.95 3.65
4.0 3.6 2.9 2.75 2.65
2.3 2.15 5.0 6.3 3.6
4.8 4.5 3.5 3.3 3.2
3.1 3.3 3.25 3.25 3.45
3»3 3.15 3.1 3.24.0
Second- feet (mean)
5.96 5.55 Q.36 9.27 7.33 5.88
9.70
4.58 3.37 3.61 5.11
11.2 9.14
6.64
May
12.2 7.1 5.7 5.3 5.3
8.5 6.1 6.5 6.1 5.9
5.5 5.3 5.3 5.9
13.7
15.3 8.3 7.8 7.3 7.3
7.3 7.1 6.9 6.9 6.9
7.9 5.8 6.7 6.56.3 6.4
June
6.1 6.1 6.3 6.77.1
6.1 5.9 5.7 5.5 5.5
6.1 5.9 5.7 5.9 5.7
5.5 5.3 5.35.7 8.8
6.5 5.9 5.5 5.9 5.5
5.5 5,5 5.3 5.3 5.5
Total run-off
Million gallons
119 111 162 186 142 118
8,290
91.7 63.2 72.1 99.0 225 177
1,570
Acre-feet
367 341 497 570 437 361
7,020
281 194 221 304 691 544
4,810
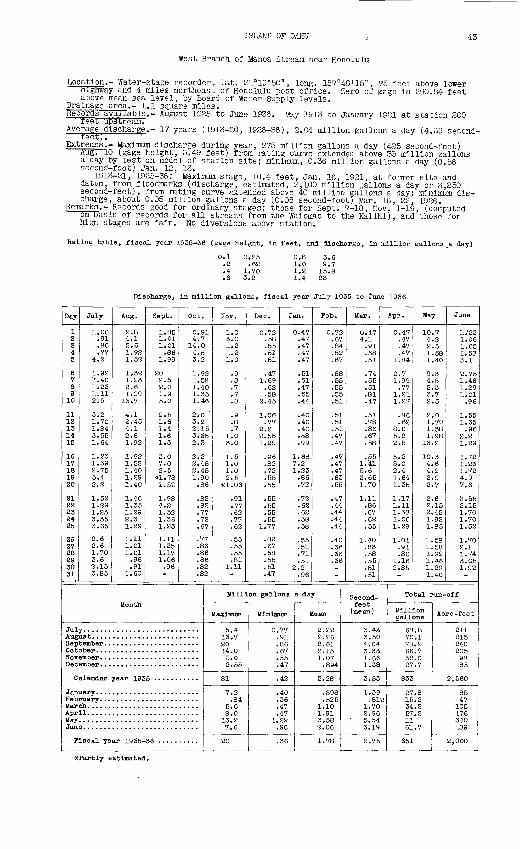
ISLAND.OF OAHU > 43
West Branch of Manoa Stream near Honolulu
Location.- Water-stage recorder, lat. 21°19'50", long. 157°48'15", 75 feet above lower nTghway and 4 miles northeast of Honolulu post office. Zero of gage is 290.84 feet above mean sea level, by Board of Water Supply levels.
Drainage area.- 1.1 square miles,Records available.- August 1925 to June 1936. May 1913 to January 1921 at station 200
reet upstream.Average discharge.- 17 years (19-13-20, 1926-36), 2.84 million gallons a day (4.39 second-
reetj. *"Extremes.- Maximum discharge during year, 275 million gallons a day (425 second-feet)
Aug. 10 (gage height, 3.49 feet] from rating curve extended above 35 million gallons a day by test on model of station site; minimum, 0.36 million gallons a day (0.56 second-foot) Jan. 12, 13.
1913-21, 1925-36: Maximum stage, 10.4 feet, Jan. 16, 1921, at former site and datum, from floodmarks (discharge, estimated, 2,100 million gallons a day or 3,250 second-feet), from rating curve extended above 40 million gallons a day; minimum dis charge, about 0.05 million gallons a day (0.08 second-foot) Mar. 16, 22, 1926.
Remarks.- Records good for ordinary stages; those for Sept. 7-18, Nov. 1-19, (computed on basis of records for all streams from the Waiomao to the Kalihi), and those for high stages are fair. No diversions above station.
Rating table, fiscal year 1935-36 (gage height, in feet, and discharge, in million gallons _a day)
O.P.5 .62
1.70 3.2
0.8 1.0 1.2 1.4
Discharge, In million gallons, fiscal year July 1935 to June 1936
Day
1 2 3 4 5
6 7 8 9
10
11 12 13 14 15
16 17 18 19 20
21 22 23 24 25
26 27 28 29 30 31
July
1.06 .91 .86 .77
4.2
1.92 1.40 1.23 1.11 2.9
3.2 1.70 1.84 3.55 1.64
1.23 1.39 2.75 5.4 2.2
1.52 1.29 1.23 3.35 3.65
2.6 2.6 1.70 3i6 2.15 3.85
Aug.
2.8 4.1 2.6 1.92 1.52
1.32 1.23 2.61.29
13.7
4.12.45 4.1 2.6 1.92
l!52 1.40 1.29 1.40
1.46 1.35 1.29 2.3 1.29
1.11 1.01 1.01
.96
.91 1.60
Sept.
1.85 1.01 1.01
.86 1.99
20 2.5 2.0 1.9 5.0
i!s1.4 1.6 1.3
3.0 7.0 2.5
#1.78 1.52
1.98 4.2 1.52 1.35 1.23
1.11 1.35 1.17 1.06
.96
Oct.
0.91 4.7
14.0 4.5 3.2
1.92 1.58 1.40 1.35 1.462.0 '
3.2 2.15 3.35 2.3
2.45 2.45 1.90 .86
.82
.82
.77
.72
.67
.77
.86
.86
.86
.82
.82
Month
Jul Augi Sep Oct Hov Dec
C
Jan Pet) Mar Apr May Jun
P
alendar year 193
Lseal year 1935-
Nov.
1.0 3.0 1.2 1.2 1.0
.9
.8
.7
.7
.8
.9
.8
.7 1.0 3.0
1.5 1.0 1.0 2.5
#1.06
.91
.77
.62
.77
.62
.55
.55
.55
.81 1.11
Dec.
0.72 .58 .55 .51 .51
.47 1.69
.62
.58 2.45
1.06 .77
2.2 2.55 1.29
.96
.82
.72
.55
.55
.55
.55
.55
.55 1.77
.82
.67
.58
.55
.51
.47
Jan.
0.47 .47 .47 .47 .47
.51
.51
.47
.55
.44
.40
.40
.40
.58
.99
1.66 7.2 1.23
.86
.72
.72
.62
.62
.58
.58
.55
.51
.71
.51 2.2
.96
Pet).
0.72 .67 .84 .82 .67
.58
.55
.55
.55
.51
.51
.51
.51
.47
.47
.47
.47
.47
.63
.55
.47
.44
.44
.44
.44
.40
.36
.36
.36
Million gallons a day
Maximum
5.4 13.7 20 14.0
G.O 2.55
81
7.2 .84
5.6 8.0
13.2 7.6
20
Minimum
0.77 .91 .86 .67 .55 .47
.42
.40
.36
.47
.47 1.29
.96
.36
Mean
2.22 2.26 2.61 2.15 1.07
.894
2.28
.898
.525 1.10 1.91 3.58 2.06
1.78
Mar.
0.47 4.1
.91
.58
.51
.74
.55
.51
.81
.47
.51
.78
.86
.67
.58
.55 1.41 5.6 3.651.70
1.11 .86 .67 .62 .55
1.40 .83 .58 .55.51 .51
Apr.
0.47 .47 .47 .47
1.84
2.7 1.99
.77 1.21 1.27
.86
.62 8.0 5.2 2.5
5.2 5.0 2.4 1.64 1.35
1.17 1.11 1.38 1.06 1.29
1.01 .91 .86
1.162.85
Second- feet
(mean)
3.43 3.50 4.04 3.33 1.66 1.38
3.53
1.39 .812
1.70 2.96 5.54 3.19
2.75
May
10.7 4.2 2.3
.58
.40
'. .5 .3 .7
.0
.70
.58
.98 1 .2
1 .3 .6 .2 .9 .7
.6
.15
.45
.92
.85
.58
.58
.92
.46
.29
.40
June
1/23 1.06 1.65 1.58 3.1
2.75 1.46 1.29 1.01
.96
1.55 1.35
.96 2.2 1.29
1.72 1.23 1.72 4.9 7.6
3.55 2.15 1.70 1.70 1.52
1.70 2.1 1.74 3.05 1.92
Total run-off
Million gallons
68.8 70.1 78.3 66.7 32.0 27.7
833
27.8 15.2 34.2 57.2
111 61.7
651
Acre-feet
211 215 240 205
98 85
2,560
85 47
105 176 340 189
2,000
*Partly estimated.
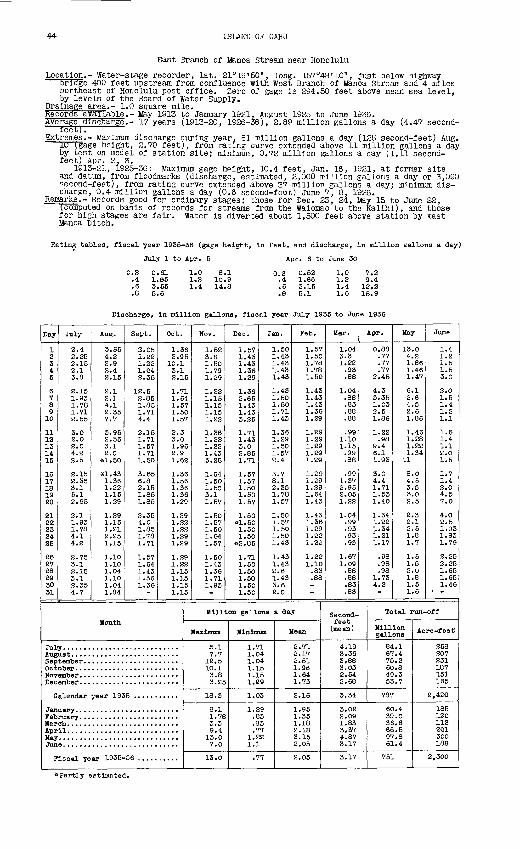
44 ISLAND OF OAHU
East Branch of Manoa Stream near Honolulu
Location.- Water-stage recorder, lat. 21°19'50", long. 157°48'10", just below highway Driage 400 feet upstream from confluence with Weat Branch of Manoa Stream and 4 miles northeast of Honolulu post office. Zero of gage Is 294.50 feet above mean sea level, by levels of the Board of Water Supply.
Drainage area.- 1.0 square mile.Records available.- May 1913 to January 1921, August 1925 to June 1936.Average discharge.- 1? years (1913-20, 1926-36), 2.89 million gallons a day (4.47 second- feet;.
Extremes.- Maximum discharge during year, 81 million gallons a day (125 second-feet) Aug. lu (gage height, 2.70 feet), from rating curve extended above 11 million gallons a day by test on model of station site; minimum, 0.72 million gallons a day (1.11 second- feet) Apr. 2, 3.
1913-21, 1925-36: Maximum gage holght, 10.4 feet, Jan. 16, 1921, at former site and datum, from floodmarks (discharge, estimated, 2,000 million gallons a day or 3,090 second-feet), from rating curve extended above 37 million gallons a day; minimum dis charge, 0.4 million gallons a day (0.6 second-foot) June 7, 8, 1926.
Remarks.- Records good for ordinary stages; those for Dec. 23, 24, May 15 to June 22, (computed on basis of records for streams from the Walomao to the Kallhl), and those for high stages are fair. Water Is diverted about 1,500 feet above station by East Manoa Ditch.
Rating tables, fiscal year 1935-36 (gage height, in feet, and discharge, in million gallons a day)
July 1 to Apr. 5 Apr. 6 to June 30
0.2 0.61 1.0 8.1 0.2 0.52 1.0 7.2 .4 1.65 1.2 10.9 .4 1.65 1.2 9.4 .6 3.55 1.4 14.8 .6 3.15 1.4 12.2 .8 5.6 .6 5.1 1.6 15.9
Discharge, In million gallons, fiscal year July 1935 to June 1936
Day
1 2 3 4 5
6 7 8 9 10
11 12 13 14 15
16 17 18 19 20
21 22 23 24 25
26 27 28 29 30 31
July
2.4 2.25 2.15 2.1 3.8
2.15 1.93 1.78 1.71 2.55
3.0 2.0 2.0 4.2 2.5
2.15 2.35 3.1 5.1 2.65
2.1 1.93 1.78 4.1 4.2
2.75 3.1 2.15 3.1 2.35 4.7
Aug.
3.55 4.2 2.9 2.*4 2.15
2.1 2.1 4.1 2.35 7.7
3.95 2.55 3.1 2.0
*1.50
*1.43 1.36 1.22 1.15 1.29
1.29 1.15 1.21 2.25 1.15
1.10 1.10 1.04 1.10 1.04 1.84
Sept.
2.05 1.22 1.22 1.04 2.35
12.5 2.85 1.85 1.71 4.4
2.15 1.71 1.57 1.71 1.50
3.65 6.8 2.15 1.85 1.85
2.35 4.0 1.85 1.78 1.71
1.57 1.64 1.43 1.36 1.36
Oct.
1.36 3.95
10.1 3.1 2.15
1.71 1.64 1.57 1.50 1.57
2.3 3.0 1.96 2.9 1.62
1.36 1.56 1.36 1.36 1.29
1.29 1.22 1.22 1.29 1.29
1.29 1.22 1.15 1.15 1.15 1.15
Month
JuOf Aug Sep Oct NOT Dec
C
Jan Feb Mar Apr May Jun
F
ember ........................
alendar year 192
e. ...........................
iscal year 1935-
Nov.
1.52 3.S 1.50 1.79 1.29
1.22 1.15 1.15 1.15 1.22
1.36 1.22. 1.22 1.43 3.25
1.64 1.50 1.50 3.1 1.57
1.50 1.57 1.50 1.64 1.57
1.50 1.43 1.36 1.71 1.93
Dec.
1.57 1.43 1.43 1.36 1.29
1.36 2.65 1.43 1.43 3.25
1.71 1.43 3.0 2.85 1.71
1.57 1.57 1.50 1.50 1.57
1.50 *1.50 1.50 1.50
*2.85
1.71 1.50 1.50 1.50 1.50 1.50
Jan.
1.50 1.43 1.43 1.43 1.43
1.43 1.50 1.50 1.71 1.43
1.36 1.29 1.50 1.57 2.4
3.7 8.1 2.35 1.78 1.57
1.50 1.57 1.50 1.50 1.43
1.43 1.43 2.6 1.43 3.6 2.0
Feb.
1.57 1.50 1.78 1.78 1.50
1.43 1.43 1.43 1.36 1.29
1.29 1.29 1.29 1. 29 1.29
1.29 1.29 1.29 1.64 1.43
1.43 1.36 1.29 1.22 1.22
1.22 1.10 .83 .88
Million gallons & day
Maximum
.5.1 7.7
12.5 10.1 3.8 3.25
18.3
8.1 1.78 3.3 9.4 13.0 7.0
13.0
Minimum Mean
1.71 2.71 1.04 2.17 1.04 2.51 1.15 1.96 1.15 1.64 1.29 1.73
1.03 2.16
1.29 1.95 .83 1.35 .83 1.18 .77 2 . 18
1.22 3.15 1.1 2.05
.77 2.05
Mar.
1.04 3.3 1.22 .93 .88
1.04 .88 .83 .88 .88
.991.10 1.15 .99 .88
.99 1.37 2.95 2.05 1.22
1.04 .99 .93 .93 .93
1.67 1.09 .88 .88 .83 ,83
Apr.
0.88 .77 .77 .77
2.45
4.3 3.35 1.03 2.5 1.86
1.22 .98
9.4 6.1 1.93
3.0 4.4 1.71 1.53 1.40
1.34 1.22 1.34 1.21 1.17
.98
.98
.98 1.73 4.2
Second- feet (mean)
4.19 3.36 3.88 3.03 2.54 2.68
3.34
3.02 2.09 1.83 3.37 4.87 3.17
3.17
^May
13 41 1 1
6 24 21
1 1 1 1
11
8 4 3 3 2
2 2 21 1
1 1 21 1 1
0 2 86 4647
1 6 5 6 86
46 28 22 34
05 5 0 5
31 5 8 7
5 5 0 8 5 6
June
1.4 1.2 1.5 1.5 3.0
2.01.5 1.4 1.2 1.1
1.6 1.4 1.1 2.0 1.5
1.7 1.4 2.0 4.5 7.0
4.0 2.5 1.93 1.93 1.79
2.25 2.25 1.65 1.65 1.46
Total run-off
Million gallons
84.1 67.4 75.2 60.8 49.3 53.7
787
60.4 39.0 36.6 65.5 97.8 61.4
751
Acre-feet
258 207 231 187 151 165
2,420
185 120 112 201 300 188
2,300
*Partly estimated.
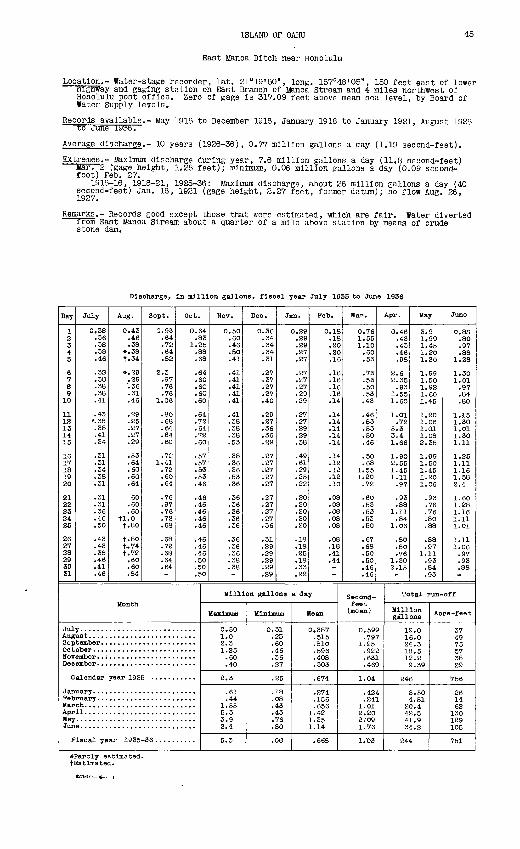
ISLAND OF OAHU 45
East Manoa Ditch near Honolulu
Location.- Water-stage recorder, lat. 21°19'50", long. 157°48'05", 150 feet east of lower nignway and gaging station on East Branch of Manoa Stream and 4 miles northwest of Honolulu post office. Zero of gage Is 317.09 feet above mean sea level, by Board of Water Supply levels.
Records available.- May 1915 to December 1916, January 1918 to January 1921, August 1925 to June I93b.
Average discharge.- 10 years (1926-36), 0.77 million gallons a day (1.19 second-feet).
Extremes.- Maximum discharge during year, 7.6 million gallons a day (11.8 second-feet) JMar. 2 (gage height, 1.28 feet); minimum, 0.06 million gallons a day (0.09 second- foot) Feb. 27.
1915-16, 1918-21, 1925-36: Maximum discharge, about 26 million gallons a day (40 second-feet) Jan. 16, 1921 (gage height, 2.27 feet, former datum); no flow Aug. 26. 1927.
Remarks.- Records good except those that were estimated, which are fair. Water diverted from East Manoa Stream about a quarter of a mile above station by means of crude stone dam.
Discharge, In million gallons, fiscal year July 1935 to June
Day
1 2 3 4 5
6 7 8 9
10
11 12 13 14 15
16 17 18 19 20
21 22 23 24 25
26 27 28 29 30 31
July
0,38 .36 .33 .38 .46
.33
.38
.38
.38
.41
.43 -.38 .38 .41 .34
.31
.31
.34
.38
.31
.31
.31
.36
.46
.50
.43
.43
.38
.46
.41
.46
Aug.
0.43 .46 .38
*.38 t.34
*.29 .29 '.36 .31 .46
.29
.25
.27
.27
.29
.53
.64
.60
.60
.64
60 .60 .60
tl.O t.80
t.80 t-74 t.72 .60 .60 .84
Sept.
0.93 .64 .72 .64 .82
2.3 .97 .76 .76
1.06
.80
.68
.64
.64
.60
.78 1.41 .72 .60 .64
.76
.97
.76
.72
.68
.68
.72
.68
.64
.64
Oct.
0.64 .83
1.25 .88 .68
.64
.60
.60
.60
.60
.64
.72
.64
.72
.60
.57
.57
.53
.53
.46
.46
.46
.46
.46
.46
.46
.46
.46
.50
.50
.50
Month
Jul Aug Sep Oct Nov Dec
C
Jan Peb Mar Apr May Jun
P
alendar year 193
Isoal year 1935
Nov.
0.50 .60 .46 .50 .41
.41
.41
.41
.41
.41
.41
.38
.38
.38
.53
.38
.36
.36
.53
.36
.36
.36
.36
.36
.36
.36
.36
.36
.38
.38
Dec.
0.36 .34 .34 .34 .31
.27
.37
.27
.27
.40
.29
.27
.36
.36
.39
.27
.27
.27
.27
.27
.27
.27
.27
.27
.36
.31
.29
.29
.29
.29
.29
Jan.
0.29 .29 .29 .27 .27
.27
.27
.27
.29
.29
.27
.27
.29
.29
.38
.49
.61
.29
.25
.22
.20
.20
.20
.20
.20
.18
.18
.25
.18
.33
.22
Peb.
0.18 .18 .20 .20 .16
.16
.16
.16
.16
.14
.14
.14
.14
.14
.14
.14
.12
.12
.12
.10
.08
.08
.08
.08
.08
.08
.18
.41
.44
Million gallons a day
Maximum
0.50 1.0 2.3 1.25 .60 .40
2.3
.61
.44 1.55 5.3 3.9 2.4
5.3
Minimum Mean
0.31 0.387 .25 .515 .60 .810 .46 .596 .36 .408 .27 .303
. 25 . 674
.18 .274
.08 .156
.43 .656
.43 1.42
.76 1.35
.80 1.14
.08 .668
Mar.
0.76 1.55 1.10 .60 .53
.73
.53
.50
.53
.43
.46
.53
.53
.50
.46
.50
.68 1.55 1.20 .72
.60
.53
.53
.53
.50
.67
.68
.50
.50
.46
.46
Apr.
0.46 .43 .43 .46 .98
2.6 2.35 .93
1.55 1.60
1.01 .72
5.3 3.4 1.66
1.90 2.55 1.45 1.11 .97
.93
.88 1.11 .84
1.06
.80
.80
.76 1.30 2.15
Second- feet (mean)
0.599 .797
1.25 .922 .631 .469
1.04
.424
.241 1.01 2.20 2. '09 1.76
1.'03
May
3.9 1.991.45 1.20 1.20
1.99 1.50 1.92 1.60 1.45
1.20 1.06 1.01 1.08 2.35
1.99 1.50 1.45 1.20 1.06
.93
.76
.76
.80
.88
.88
.97 1.11 .93 .84 .93
June
0.8S .80 .97 .88
1.28
1.30 1.01 .97 .84 .80
1.15 1.30 1.01 1.30 1.11
1.25 1.111.16 1.58 2.4
1.60 1.28 1.16 1.111.01
1.11 1.06 .97 .93 .88
Total run-off
Million gallons
1S.O 16.0 24.3 18.5 12.2 9.39
246
8.50 4.51
20.4 42.5 41.9 34.2
244
Acre-feet
37 49 75 57 38 29
756
26 14 62
130 129 105
751
Partly estimated. tEstimated.
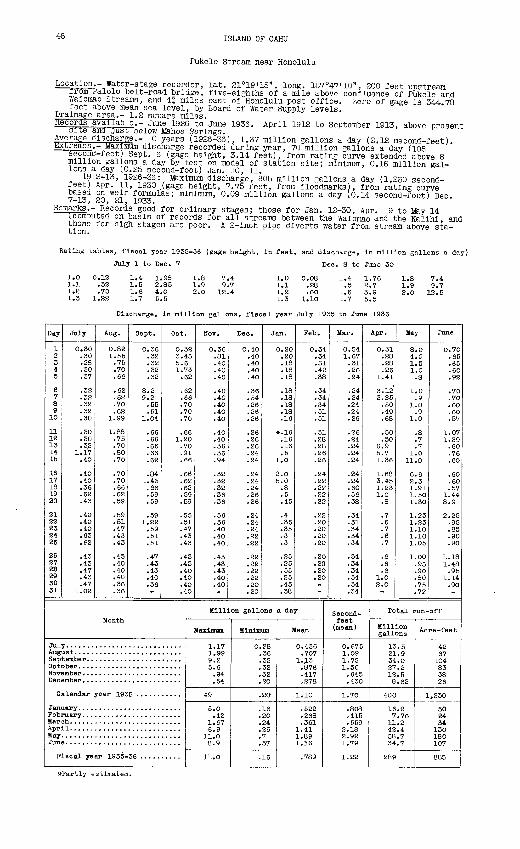
4(3 ISLAND OF OAHU
Pukele Stream near Honolulu
Location.- Water-stage recorder, lat. 21°19'15", long. 157°47'10", 200 feet upstream rrom Palolo belt-road bridge, five-eighths of a mile above confluence of Pukele and Waiomao Streams, and 4f miles east of Honolulu post office. Zero of gage is 344 78 feet above mean sea level, by Board of Water Supply levels.
Drainage area.- 1.2 square miles.Kecoras available.- June 1926 to June 1936. April 1912 to September 1913, above present
site ana just below Mahoe Springs.Average discharge.- 10 years (1926-36), 1.37 million gallons a day (2.12 second-feet).Extremes.- Maximum discharge recorded during year, 70 million gallons a day (108
second-feet) Sept. 6 (gage height, 3.14 feet), from rating curve extended above 8 million gallons a day by test on model of station site: minimum, 0.16 million gal lons a day (0.25 second-foot) Jan. 10, 11.
1912-13, 1926-36: Maximum discharge, 805 million gallons a day (1,250 second- feet) Apr. 11, 1930 (gage height, 7.75 feet, from floodmarks), from rating curve 713 20 W8ir rormulas; mlnlmum> °-°9 million gallons a day (0.14 second-foot) Dec.
Remarks.- Records good for ordinary stages; those for Jan. 12-30, Apr. 19 to May 14(computed on basis of records for all streams between the Waiomao and the Kalihi, and those for high stages are poor. A 2-inch pipe diverts water from stream above sta tion.
Rating tables, fiscal year 1935-36 (gage height, in feet, and discharge, in million gallons a day)
July 1 to Dec. 7 Dec. 8 to June 30
1.01.1 l.E 1.3
0.12.32.70
1.22
1.41.51.61.7
2.854.05.5
1.92.0
1.01.11.21.3
.60 1.10
1.41.51.61.7
1.76 2.7 3.9 5.5
1.8 7.41.9 9.72.0 12.5
Discharge, In million gallons, fiscal year July 1935 to June 1936
Day
1 2 3 4 5
6 7 8 9
10
11 12 13 14 15
16 17 18 19 20
21 22 23 24 25
26 27 28 29 30 31
July
0.30 ,30 .28 ,30 .37
.32
.32
.32
.32
.30
.30
.30
.32 1.17
.40
.40
.40
.36
.62
.43
.40
.40
.40
.63
.62
.43
.43
.47
.43
.47 1.02
Aug.
0.82 1.55
.75
.70
.66
.62
.62
.70
.62 1.99
1.88 .75 .70 .80 .70
.70
.70
.66
.62
.59
.59
.51
.47
.43
.43
.43
.40
.40
.40
.36
.36
Sept.
0.36 .32 .32 .32 .32
8.2 9.2
.55
.51 1.04
.66
.66
.66
.66
.62
.84 1.43
.66
.59
.59
.59 1.22
.59
.51
.51
.47
.43
.43
.40
.36
Oct.
0.32 3.45 5.6 1.73
.62
.62
.66
.70
.70
.70
.66 1.20
.70
.91
.66
.66
.62
.62
.59
.59
.55
.51
.47
.43
.43
.43
.43 ,40 .40 .40 .40
Month
JulAugi Sep Oct NOT Dec
C
Jan Feb Mar Apr May Jun
F
alendar year 193
iscal year 1935-
Nov.
0.36 .81 .40 .40 .40
.40
.40
.40
.40
.40
.40
.40
.36
.36
.94
.32
.32
.32
.36
.36
.36
.36
.40
.40
.40
.43
.43
.43
.40
.40
Dec.
0.40 .40 .40 .40 .40
.36
.54
.26
.26
.26
.26
.26
.26
.24
.24
.24
.24
.24
.26
.26
.24
.24
.24
.22
.22
.22
.22
.22
.22
.20
.20
Jan.
0.20 .20 .18 .18 .18
.18
.18
.18
.18
.16
#.16 .16 .16 .5
1.0
2.0 5.0
.8
.5
.45
.4
.35
.35
.3
.3
.25
.25
.35
.25
.45
.38
Feb.
0.34 .34 .31 .42 .38
.34
.34
.34
.31
.31
.31
.28
.28
.26
.26
.24
.22
.22
.22
.22
.22
.20
.20
.20
.20
.20
.20
.20
.20
Million gallons a day
Maximum
1.17 1.99 9.2 5.6
.94
.54
49
5.0 .42
1.67 6.9
11.0 8.9
11.0
Minimum
0,28 .36 .32 .32 .32 .20
.20
.16
.20
.24
.26
.7
.57
.16
lie an
0.436 .707
1.J3 .876 .417 .278
1.10
.522
.268
.361 1.41 1.89 1.16
,789
liar.
0.54 1.67
.31
.26
.24
.24
.24
.24
.24
.26
.26
.24
.24
.24
.24
.24
.24
.60
.56
.38
.34
.31
.34
.34
.34
.34
.34
.34
.34
.34
.34
Apr.
0.31 .28 .28 .26
1.41
3.12 3.85
.50
.49
.68
.50
.506.9 5.7 1.36
1.68 3.45 1.23 1.0
.8
.7
.6
.7
.6
.7
.6
.6
.6 1.0 2.0
Second- feet
(mean)
0.675 1.09 1.75 1.36
.645
.430
1.70
.808
.415
.559 2.18 2.92 1.79
1.22
May
8.0 4.0 1.5 1.0
.8
1.0 .9
1.0 .9
1.0
.8
.7
.7 1.0
11.0
6.6 2.3 1.91 1.50 1.30
1.23 1.23 1.10 1.10 1.05
1.00 .95 .90 .80 .75 .72
June
0.70 .65 .65 .60 .92
.70
.70
.60
.60
.57
1.07 1.39
.60
.76
.60
.60
.60
.57 1.44 8.9
2.25 .95 .85 .90 .90
1.18 1.48
.95 1.14
.90
Total run-off
Million gallons
13.5 21.9 34.0 27.2 12.5 8.62
400
16.2 7.76
11.2 42.4 58.7 34.7
289
Acre-feet
42 67
104 83 38 26
1,230
50 24 34
130 180 107
885
*Partly estimated.
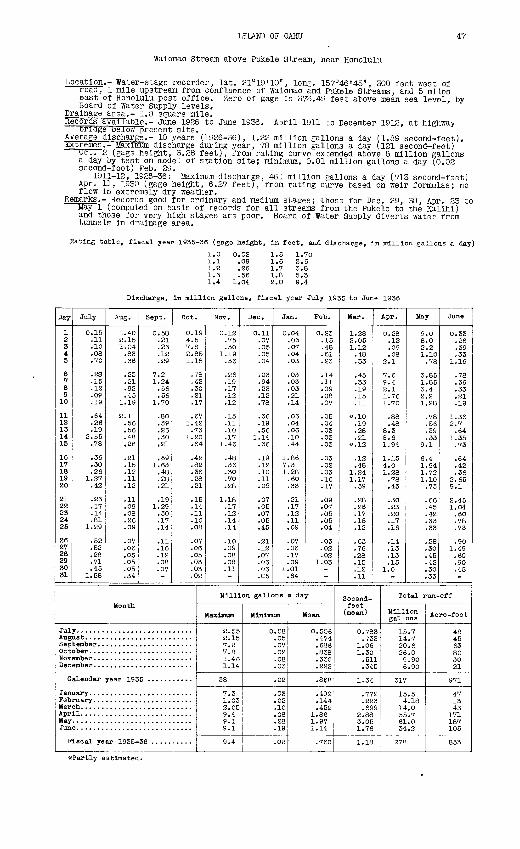
ISLAND OF OAHU 47
Waiomao Stream above Pukele Stream, near Honolulu
Location.- Water-stage recorder, lat. 21°19'10", long. 157°46'45", 300 feet west of road, 1 mile upstream from confluence of Waiomao and Pukele Streams, and 5 miles east or Honolulu post office. Zero of gage Is 373.49 feet above mean sea level, by Board of Water Supply levels.
Drainage area.- 1.0 square mile.Records available.- June 1926 to June 1936. April 1911 to December 1912, at highway
bridge below present site.Average discharge.- 10 years (1926-36), 1.22 million gallons a day (1.89 second-feet).sxtremes.- Maximum discharge during year, 78 million gallons a day (121 second-feet)
uct. 2 (gage height, 3.28 feet), from rating curve extended above 5 million gallons a day by test on model of station site; minimum, 0.01 million gallons a day (0.02 second-foot) Feb. 29.
1911-12, 1926-36: Maximum discharge, 461 million gallons a day (713 second-feet) Apr. 11, 1930 (gage height, 6.27 feet), from rating curve based on weir formulas; no flow in extremely dry weather.
Re-marks.- Records good for ordinary and medium stages; those for Dec. 29, 30, Apr. 23 to May 1 (computed on basis of records for all streams from the Pukele to the Kalihl) and those for very high stages are poor. Board of Water Supply diverts water from tunnels In drainage area.
Rating table, fiscal year 1935-36 (gage height, in feet, and discharge, in million gallons a day)
1.0 0.02 1.5 1.70 1.1 .09 1.6 2.6 1.2 .26 1.7 3.8 1.3 .56 1.8 5.3 1.4 1.04 2.0 9.4
Discharge, in million gallons, fiscal year July 1935 to June 1936
Day
1 2 3 4 5
6 7 8 9
10
11 12 13 14 15
16 17 18 19 20
21 22 23 24 25
26 27 28 2930 31
July
0.15 .11 .10 .08 .70
.28
.15
.12
.09
.19
.64
.26
.19 2.55 .78
.36
.30
.26 1.27 .42
.23
.17
.14
.81 1.29
.52
.52
.28
.71
.45 1.58
Aug.
1.40 2.15 1.04 .83 .36
.23
.21
.92
.45 1.19
2.1 .56 .56 .48 .26
.21
.15
.12
.11
.12
.11
.09
.08
.26
.09
.07
.06
.05
.05
.05
.34
Sept.
0.58 .21 .23 .12 .29
7.2 1.24 .56 .56
1.70
.80
.39
.26
.30
.21
.69 1.63 .48 .28 .21
.19 1.29 .30 .17 .14
.11
.16
.12
.08
.07
Month
Jul Aug Sep Oct Nov Dec
C
Jan Feb Mar Apr May Jun
F
Oct.
0.19 4.5 7.S 2.85 1.18
.78
.42
.30
.21
.17
.67 1.42 .73
1.20 .64
.42
.82
.36
.28
.21
.15
.14
.11
.10
.08
.07
.06
.05
.03
.03
.02
Nov.
0.12 .75 .30
1.19 .36
.26
.19
.17
.12
.12
.15
.11
.10
.17 1.46
.48
.36
.30
.70
.28
1.18 .17 .12 .14 .14
.10
.09
.08
.08
.11
Dec.
0.11 .07 .05 .05 .04
.03
.94
.23
.12
.78
.36
.19
.56 1.14 .36
.19
.12
.10
.11
.09
.07
.05
.07
.05
.45
.21
.12
.07
.06
.06
.C5
Jan.
0
1 71
1
Million gallons
Maximum
alendar year 193
iscal year 1935-36
2.55 2.15 7.2 7.8 1.46 1.14
38
7.3 1.03 2.05 9.4 9.1 9.1
9.4
Minimum
0.08 .05 .07 .02 .08 .03
.02
.03
.02
.10
.08
.28
.19
.02
.04
.03
.07
.04
.03
03 .03.03.21 .14
06 04 .06 1044
86 .3 28 60 33
21 17 12 11 09
07 06 17 09 01 64
Feb.
0.23 .15 .48 .61 .23
.14
.11
.09
.08
.07
.05
.04
.03
.03
.03
.03
.02
.03
.16
.17
,09 .07 .05 .05 .04
.03
.02
.02 1.03
a day
Mean
0.506 .474 .686 .838 .330 .223
.868
.499
.144
.452 1.86 1.97 1.14
.760
Mar.
1.28 2.05 1.12 .48 .33
.45
.33
.19
.15
.11
«.10 .19 .28 .21
«.12
.12
.48 1.24 1.17 .59
.28
.26
.17
.15
.12
.63
.76
.28
.15
.12
.11
Second- feet (mean)
Apr.
0.28 .12 .09 .08
2.1
7.6 9.4 2.1 1.76 1.70
.88
.48 8.3 8.6 1.94
1.15 4.0 1.28 .78 .45
.30
.23
.20
.17
.16
.14
.13
.13
.15 1.0
May
9.0 8.0 2.2 1.10.78
3.85 1.85 3.4 2.2 1.28
.78
.56
.39
.33 9.1
6.4 1.94 1.72 1.10 .73
.66
.45
.42
.33
.33
.28
.30
.45
.42
.30
.33
June
0.33 .26 .39 .33
1.16
.78
.36
.33
.21
.19
1.36 2.7 .64
1.35 .73
.64
.42
.36 2.65 9.1
2.45 1.04 .60 .78 .73
.90 1.49 .60 .90.45
Total run-off
M1^ion Acre-feet gallons
0.783 15.7 48 .733 14.7 45
1.06 20.6 63 1.30 26.0 80 .511 9.90 30 .345 6.90 21
1.34 317 971
.772 15.5 47
.223 4.18 13
.699 14.0 43 2.88 55.7 171 3.05 61.0 187 1.76 34.2 105
1.18 278 853
#Partly estimated.
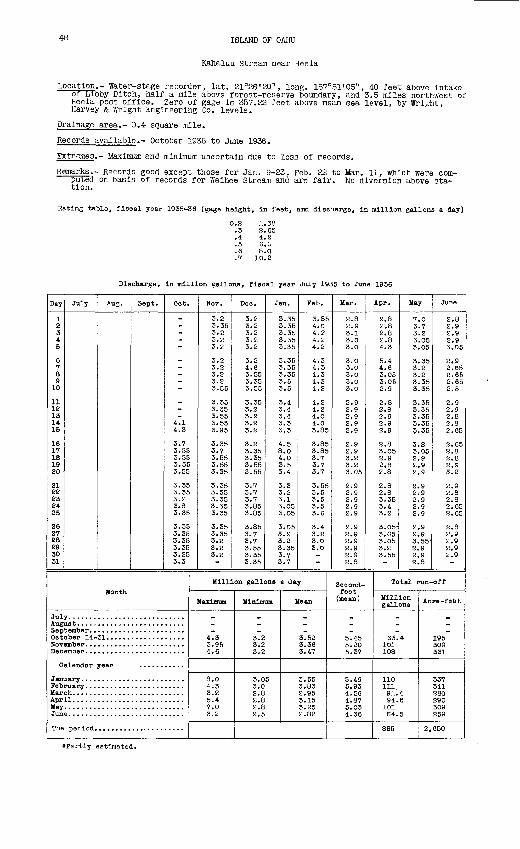
48 ISLAND OF OAHU
Kahaluu Stream near Heeia
Location.- Water-stage recorder, lat. 21°26'20", long. 157°51'05", 40 feet above intake or Libby Ditch, half a mile above forest-reserve boundary, and 3.5 miles northwest of Heeia post office. Zero of gage is 357.22 feet above mean sea level, by Wright, Harvey & Wright Engineering Co. levels.
Drainage area.- 0.4 square mile.
Records available.- October 1935 to June 1936.
Extremes.- Maximum and minimum uncertain due to loss of records.
Remarks.- Records good except those for Jan. 9-23, Feb. 22 to Mar. 11, which were com- puted on basis of records for Walhee Stream and are fair. No diversion above sta tion.
Rating table, fiscal year 1935-36 (gage height, In feet, and discharge, In million gallons a day)
0.2 1.382.654.26.08.0
10.2
Discharge, In million gallons, fiscal year July 1935 to June 1936
Day
1 2 3 4 5
6 7 8 9
10
11 12 13 14 15
16 17 18 1920
21 22 23 24 25
26 27 28 29 30 31
July Aug. Sept. Oct.
4.1 4.3
3.7 3.55 3.55 3.55 3.55
3.35 3.35 3.2 3.8 3.35
3.35 3.35 3.35 3.35 3.35 3.3
Month
Jul Augi Sep Oct Nov Dec
C
Jan Fob Mar Apr May Jun
The
ober 14-
alendar year
11...........................
Nov.
3.2 3.35 3.2 3.2 3.2
3.2 3.2 3.2 3.2 3.55
3.35 3.35 3.553.55 3.95
3.35 3.7 3.55 3.55 3.35
3.35 3.35 3.35 3.35 3.35
3.35 3.35 3.2 3.2 3.2
Dec.
3.2 3.2 3.2 3.2 3.2
3.2 4.6 3.55 3.35 3.55
3.35 3.2 3.2 3.2 3.2
3.2 3.35 3.35 3.55 3.55
3.7 3.7 3.7 3.85 3.85
3.85 3.7 3.7 3.55 3.35 3.35
Jan.
3.35 3.35 3.35 3.35 3.35
3.35 3.35 3.35 3.5 3.5
3.4 3.4 3.4 3.3 3.3
4.5 8.0 4.0 3.5 3.4
3.3 3.2 3.1 3.05 3.05
3.05 3.2 3.2 3.35 3.7 3.7
Feb.
3.85 4.0 4.24.2 4.2
4.3 4.3 4.3 4.3 4.2
4.2 4.2 4.0 4.0 3.85
3.85 3.85 3.7 3.7 3.7
3.55 3.5 3.5 3.5 3.6
3.4 3.2 3.0 3.0
Million gallons a day
Maximum
4.3 3.95 4.6
8.0 4.3 3.2 5.4 7.0 3.2
Minimum
3.2 3.23.2
3.05 3.0 2.8 2.8 2.8 2.5
Mean
3.52 3.363.47
3.55 3.83 2.95 3.15 3.25 2.82
Mar.
2.8 2.9 3.1 3.0 3.0
3.0 3.0 3.0 3.0 3.0
2.9 2.9 2.92.9 2.9
2.9 2.9 3.2 3.23.05
2.9 2.9 2.9 2.9 2.9
2.9 2.9 2.9 2.9 2.9 2.8
Apr.
2.8 2.8 2.8 2.8 4.3
5.4 4.6 3.05 3.05 2.9
2.8 2.8 2.9 2.9 2.9
2.8 3.05 2.9 2.8 2.8
2.8 2.8 3.35 3.4 3.2
3.05- 3.05 3.05 3.2 3.55
Second- feet
(mean)
5.45 5.20 5.37
5.49 5.93 4.56 4.87 5.03 4.36
May
7.0 3.7 3.2 3.05 3.05
3.35 3.2 3.2 3.35 3.35
3.35 3.35 3.35 3.35 3.35
3.23.05 2.9 2.9 2.9
2.9 2.9 2.9 2.9 2.9
2.9 2.9 3.55- 2.9 2.9 2.8
June
2.8 2.9 2.9 2.9 3.05
2.9 2.65 2.65 2.65 2.5
2.9 2.9 2.8 2.8 2.65
2.65 2.8 2.8 2.9 3.2
2.9 2.8 2.8 2.65 2.65
2.8 2.9 2.9 2.9 2.9
Total run-off
Million gallons
63.4 101 108
110 111 91'. 4 94.6
101 S4.5
865
Acre-feet
195 309 331
337 341 280 290 309 259
2,650
*Partly estimated.
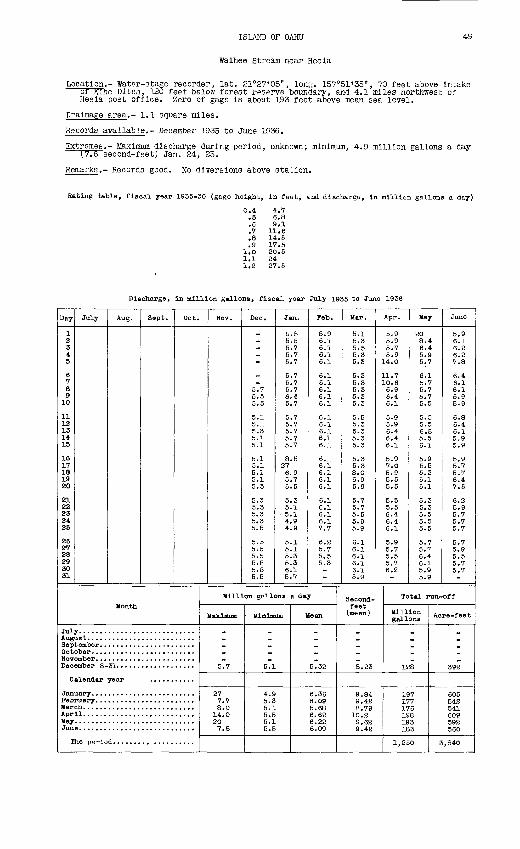
ISLAND OF OAHU 49
Walhee stream near Heela
Location.- Water-stage recorder, lat. 21°27'05", long. 157°51'35", 70 feet above Intake or Kine Ditch, 120 feet below forest reserve boundary, and 4.1 miles northwest of Heela post office. Zero of gage Is about 193 feet above mean sea level.
Drainage area.- 1.1 square miles.
Records available.- December 1935 to June 1936.
Extremes . - Maximum discharge during period, unknown; minimum, 4.9 million gallons a day 17.6 second-feet) Jan. 24, 25.
Remarks . - Records good. No diversions above station.
Rating table, fiscal year 1935-36 (gage height, in feet, and discharge, in million gallons a day)
0.4 .5 .6 .7 .8 .9
1.01.11.2
4.76.89.1
11.614.517.520.52427.5
Discharge, in million gallons, fiscal year July 1935 to June 1936
Day
1 2 3 4 5
6 7 8 9 10
11 12 13 14 15
16 17 18 19 20
21 22 23 24 25
26 27 28 29 30 31
July Aug. Sept. Oct.
Month
Jul Aug Sep Oct NOT Dec
C
Jan Fob Mar Apr May Jun
T
ember 8-
alendar year
he perio
Nov. Dec.
5.7 5.5 5.5
5.1 5.1 5.3 5.1 5.1
5.15.1 5.1 5.1 5.3
5.3 5.3 5.3 5.3 5.5
5.5 5.5 5.5 5.5 5.5 5.5
Jan.
D.5 5.5 5.7 5.7 5.7
5.7 5.7 5.7 6.4 5.7
5.7 5.7 5.7 5.7 5.7
8.5 27 6.9 5.7 5.5
5.3 5.1
5.1 4.9 4.9
5.1 5.1 5.3 5.3 6.1 5.7
Feb.
5.9 6.1 6.1 6.1 6.1
6.1 6.1 6.1 6.1 6.1
6.1 6.1 6.1 6.1 6.1
6.1 6.1 6.1 6.1 6.1
6.1 6.1 6.1 6.1 7.7
6.2 5.7 5.5 5.3
Million gr lions a day
Maximum
5.7
27 7.7 8.0
14.0 20 7.8
Minimum
5.1
4.95.3 5.1 5.5 5.15.5
Mean
5.32
6.36 6.09 5.68 6.62 6.22 6.09
Mar.
5.1 5.3 5.5 5.3 5.3
5.3 5.3 5.3 5.3 5.3
5.5 5.3 5.3 5.3 5.3
5.3 5.3 8.0 6.9 5.9
5.7 5.7 5.5 5.9 5.9
6.1 6-1 6.1 6.1 6.1 5.9
Apr.
5.9 5.9 5.7 5.9
14.0
11.7 10.6 6.9 6.4 6.1
5.9 5.9 6.4 6.4 6.1
5.9 7.0 5.9 5.5 5.5
5.5 5.5 6.4 6.4 6.1
5.9 5.7 5.5 5.7 6.2
Second- feet (mean)
8.23
9.84 9.42 8.79 10.2 9.62 9.42
May
20 8.4 6.4 5.9 5.7
6.1 5.7 5.7 5.7 5.5
5.5 5.5 5.5 5.5 6.1
5.9 5.5 5.35.1 5.1
5.3 5.3 5.5 5.5 5.5
5.7
e!4 6.1 5.9 5.9
June
5.96.1 6.2 6.2 7.8
6.4 6.1 6.1 5.9 5.9
6.8 6.4 6.1 5.9 5.9
5.9 5.7 5.7 6.4 7.5
6.2 5.9 5.7 5.7 5.7
5.7 5.9 5.5 5.7 5.7
Total run-off
Million gallons
128
197 177 176 198 193 183
1,250
Acre-feet
392
605 542 541 609 592 560
3,840
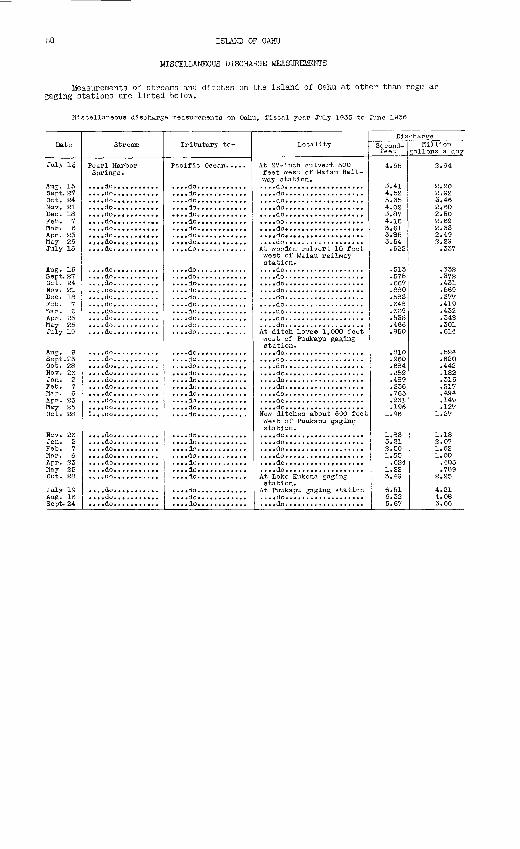
50 ISLAND OF OAHU
MISCELLAKEOUS DISCHARGE MEASUREMENTS
Measurements of streams and ditches on the island of Oahu at other than regular gaging stations are listed below.
discharge surements on Oahu, fiscal year July 1935 to June 1936
Date
July 1§
Oct 24
Mav 25
Oct 24
Apr. £3May 25
Sept. 24
Stream
Pearl Harbor Springs.
dododo
do
do
Tributary to-
Pacific Ocean.....
do
dodo
....do............
....do............
Locality
At 27- inch culvert 300 feet west of Waiau Rail way station.
west of Waiau railway station.
west of Puukapu gaging station.
....do...................
west of Puukapu gaging station.
do
station.
....do...................
DisSecond- feet
4.55
5£2
.231
.196
5.67
chargeMillion
gallons a day
2.94
2.69
442
P17
.149
.403
3.66
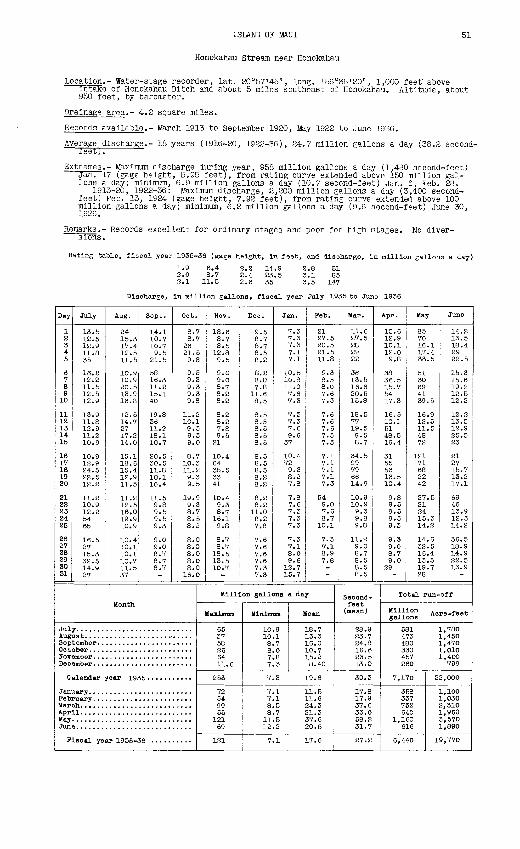
ISLAND OF MAUI
Honokah.au stream near Honokahau
51
Location.- Water-stage recorder, lat. 20°57'45", long. 156°35'20", 1,000 feet' above intake of Honokahau Ditch and about 5 miles southeast of Honokahau. Altitude, about 950 feet, by barometer.
Drainage area.- 4.2 square miles.
Records available.- March 1913 to September 1920, May 1922 to June 1936.
Average discharge.- 18 years (1916-20, 1922-36), 24.7 million gallons a day (38.2 second- feet ).
Extremes.- Maximum discharge during year, 958 million gallons a day (1,480 second-feet) Jan. 17 (gage height, 5.95 feet), from rating curve extended above 150 million gal lons a day; minimum, 6.9 million gallons a day (10.7 second-feet) Jan. 6, Feb. 28,
1913-20, 1922-36: Maximum discharge, 2,200 million gallons a day (3,400 second- feet) Feb. 13, 1924 (gage height, 7.92 feet), from rating curve extended above 100 million gallons a day; minimum, 6.2 million gallons a day (9.6 second-feet) June 30, 1926.
Remarks.- Records excellent for ordinary stages and poor for high stages. No diver- sions.
Rating table, fiscal year 1935-36 (gage height, in feet, and discharge, in million gallons a day)
1.9 6.4 2.2 14.9 2.8 51 2.0 8.7 2.4 23.5 3.1 85 2.1 11.5 2.6 35 3.5 147
Discharge, in million gallons, fiscal year July 1935 to June 1936
Day
1 2 3 4 5
6 7 8 910
11 12 13 14 15
16 17 18 19 20
21 22 23 24 25
26 27 28 29 30 31
July
13.5 12.5 12.9 11.8 35
16.2 12.2 11.5 12.5 12.9
13.9 11.8 12.9 11.2 10.9
10.9 12.9 24.5 22.5 12.2
11.2 10.9 12.2 54 65
16.5 27 15.3 32.5 14.9 27
Aug.
24 15.3 17.4 12.5 11.5
10.9 10.9 20.5 13.9 16.8
12.5 14.7 27 17.2 14.0
15.1 18.6 15.4 12.9 11.5
11.2 12.5 16.0 19.9 10.9
10.4 10.1 10.1 10.7 11.5 37
Sept.
14.1 10.7 10.7 9.5
21.5
58 16.3 11.2 15.1 40
19.8 36 11.2 18.1 10.7
20.5 30.5 11.8 10.1 10.4
11.5 9.8 9.5 9.5 9.3
9.0 9.0 8.7 8.7 8.7
Oct.
8.7 8.7
26 21.5 9.8
9.5 9.3 9.3 9.3 9.8
11.2 10.1 9.3 9.3 9.0
8.7 10.3 11.2 9.3 9.5
19.9 9.3 8.7 8.5 8.2
8.0 8.0 8.0 8.0 8.0
16.0
Month
Jul Augi Sep Oct Nov Dec
0
Jan Peb Mar Apr May Jun
P
alendar year 19
Lscal year 1935-
Nov.
18.6 8.7 8.5
12.8 9.5
9.0 9.0 8.7 8.2 8.2
8.2 8.2 7.8 9.5
21
10.464
33 41
10.4 9.3 8.7 16.1 9.8
8.7 8.7 18.5 13.5 10.7
Dec.
9.5 8.7 8.7 8.5 8.2
8.2 8.0 7.8
11.6 8.5
8.5 8.5 8.5 8.5 8.5
8.5 8.5 8.5 8.2 8.2
8.2 8.2
11.0 8.2 7.8
7.6 7.6 7.6 7.6 7.3 7.3
Jan.
7.3 7.3 7.3 7.1 7.1
10.5 10.8 11.0 7.6 7.3
7.3 7.3 7.6 9.6
37
10.4 72 9.3 8.2 7.8
7.8 7.6 7.3 7.3 7.3
7.3 7.1 8.0 9.6
12.7 15.7
Million gallons
Maxijmim
65 37 58 26 64 11.6
253
72 54 99 55
121 69
121
Minimum
10.9 10.1 8.7 8.0 7.8 7.3
7.3
7.1 7.1 8.5 8.7
11.5 12.2
7.1
Feb.
21 27.5 20.5 21.5 11.8
9.3 8.5 8.07.6 7.3
7.6 7.6 7.6 7.3 7.3
7.1 7.1 7.1 7.1 7.3
54 9.0 7.6 8.7
10.1
7.3 7.1 8.9 7.8
a day
Mean
18.7 15.3 16.0 10.7 15.2 8.40
19.6
11.5 11.6 24.3 21.3 37.6 20.5
17.6
Mar.
11.6 27.5 28 29 22
36 13.5 16.6 20.5 15.8
18.5 77 19.5 9.5 8.7
34.5 99 79 66 14.9
10.9 10.9 9.3 9.8 9.8
11.2 9.0 8.7 8.5 8.5 8.5
Apr.
15.6 12.9 10.1 12.0 9.8
38 36.5 15.7 54 17.3
16.5 10.1 51 48.5 16.4
31 55 53 13.5 10.4
9.8 9.5 9.5 9.3 9.3
9.3 9.0 8.7 9.0
29
Second- feet (mean)
28.9 23.7 24.8 16.6 23.5 13.0
30.3
17.8 17.9 37.6 33.0 58.2 31.7
27.2
May
85 70 16.1 17.4 33.5
51 30 69 41 39.5
16.9 12.5 11.5 48 72
121 71 68 22 42
27.5 21 24 15.3 14.2
14.6 32.5 16.4 13.5 19.7 28
June
14.2 13.5 18.4 29 22.5
15.3 15.6 19.2 12.5 12.2
12.2 13.5 12.9 25.5 23
21 27 15.7 13.2 17.1
69 46 13.9 12.5 14.2
36.5 18.9 14.9 22.5 13.9
Total run-off
SS£ A 581 1 , 780 473 1,450 480 1,470 330 1,010 457 1,400 260 799
7,170 22,000
358 1,100 337 1,030 752 2,310 640 1,960
1,160 3,570 616 1,890
6,440 19,770
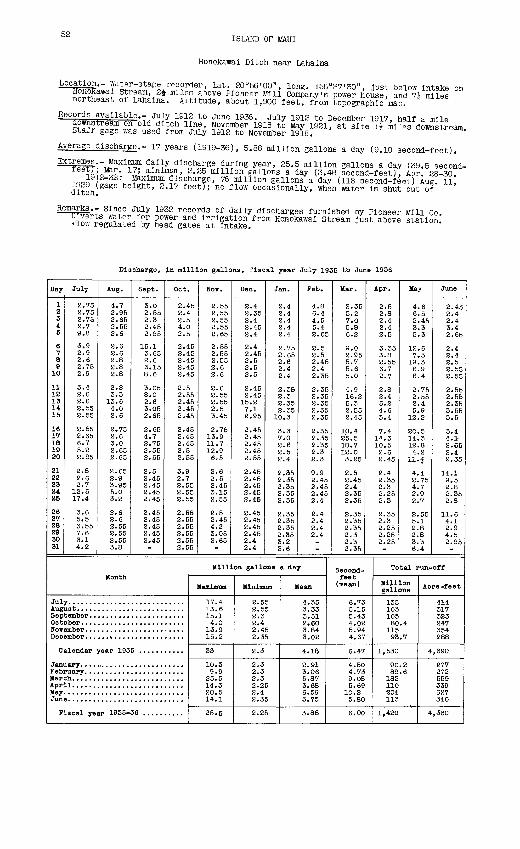
52 ISLAND OF MAUI
Honokawai Ditch near Lahaina
Location.- Water-stage recorder, lat. 20°56'00", Ions?. 156°37'30", lust below intake on " °*a!^ Stream ,2i ml ^^ ab°Ve Ploneer mii Company's power Aousll aid 7* miles northeast of Lahaina. Altitude, about 1,900 feet, from topographic map.
mileRecords available.- July 1912 to June 1936. July 1912 to December 1917, half
Average discharge.- 17 years (1919-36), 5.88 million gallons a day (9.10 second-feet).
Bctremes.- Maximum daily discharge during year, 25.5 million gallons a day (39.5 second-iln; 9^£' ,/ mlnlm > 2 - 25 million gallons a day (3.48 second-feet), Apr. 28-30.
1QPQ f S :hM^mU? ^S Shar?e ' 76 I!11111011 gallons a day (118 second-feet) Aug. 11, ditch heleht > 2 - 17 feet); no flow occasionally, when water is shut out of
Remarks - since July 1932 records of daily discharges furnished by Pioneer Mill Co. ' 11 ^^ ̂^ Ju8t ^ Statl °n '
Discharge, In million gallons, fiscal year July 1955 to June 1936
Day
1 2 3 4 5
6 7 8 9
10
11 12 13 14 15
16 17 18 19 20
21 22 23 24 25
26 27 28 29 30 31
July
2.75 2.75 2.75 2.7 9.8
3.9 2.9 2.6 2.75 2.9
3.4 2.6 2.6 2.55 2.55
2.55 2.65 6.7 5.2 2.85
2.8 2.6 2.7
12.5 17.4
3.6 5.5 3.55 7.6 3.1 4.2
Aug.
4.7 2.95 2.65 2.55 2.6
2.6 2.6 2.8 2.8 2.8
2.8 3.3
13.6 4.0 2.6
2.75 2.6 3.0 2,65 2.65
2.65 2.9 3.95 5.0 3.2
2.6 2.6 2.55 2.55 2.55 3.8
Sept.
3.0 2.55 2.3 2.45 2.85
15.1 3.65 2.6 3.15 8.6
3.05 8.0 2.6 3.05 2.65
2.65 4.7 2.75 2.55 2.55
2.5 2.45 2.45 2.45 2.45
2.45 2.45 2.45 2.45 2.45
Oct.
2.45 2.4 2.54.0 2.5
2.45 2.45 2.45 2.45 2.45
2.5 2.55 2.45 2.45 2.45
2.45 2.45 2.45 2.5 2.55
3.9 2.7 2.55 2.55 2.55
2. 652.55 2.55 2.55 2.55 2.55
Month
Jul Augi Sep Oct HOT Dec
C
Jan Peb Mar Apr May Jun
P
alendar year 193
Lseal year 1935-36 ..........
Nov.
2.55 2.55 2.55 2.55 2.65
2.55 2.55 2.55 2.6 2.6
2.6 2.55 2.55 2.5 3.45
2.75 13.9 11.7 12.9 6.5
2.6 2.5 2.45 3.15 2.55
2.5 2.45 4.2 3.05 2.65
Dec.
2.4 2.35 2.4 2.45 2.4
2.4 2.45 2.5 2.5 2.5
2.45 2.45
15.2 7.1 2.95
2.45 2.45 2.45 2.45 2.55
2.45 2.45 2.45 2.45 2.45
2.45 2.45 2.45 2.45 2.4 2.4
Jan.
2.4 2.4 2.4 2.4 2.4
2.75 2.65 2.6 2.42.4
2.35 2.3 2.35 2.35
10.3
3.3 7.0 2.6 2.5 2.4
2.35 2.35 2.35 2.35 2.35
2.35 2.35 2.35 2.35 3.2 3.6
Peb.
4.8 6.4 4.5 5.4 2.65
2.5 2.5 2.45 2.4 2.35
2.35 2.35 2.35 2.35 2.35
2.35 2.35 2.35 2.3 2.3
9.9 2.45 2.45 2.45 2.4
2.42.4 2.42.4
Million gallons a day
Maximum
17.4 13.6 15.1 4.0
13.9 15.2
33
10.3 9.9
25.5 14.3 20.5 14.1
25.5
Minimum
2.55 2.55 2.3 2.4 2.45 2.35
2.3
2.3 2.3 2.3 2.25 2.4 2.35
2.25
Mean
4.35 3.33 3.51 2.60 3.84 3.02
4.18
2.91 3.06 5.87 3.68 6.59 3.75
3.88
Mar.
2.35 5.2 7.0 5.8 6.2
9.0 2.95 5.7 5.6 5.0
4.9 16.2 5.3 2.55 2.45
10.4 25.5 18.7 12.0 3.25
2.52.45 2.4 2.35 2.35
2.35 2.35 2.35 2.3 2.3 2.35
Apr.
2.5 2.8 2.4 2.4 2.5
3.35 3.8 2.55 6.7 2.7
2.8 2.4 5.2 4.6 3.4
7.4 14.3 10.5 2.6 2.45
2.4 2.35 2.3 2.25 2.3
2.35 2.3 2.25 2.25 2.25
Second- feet (mean)
6.73 5.15 5.43 4.02 5.94 4.67
6.47
4.50 4.73 9.08 5.69
10.2 5.80
6.00
May
4.6 6.5 2.45 3.3 5.3
12.6 7.5
19.3 6.9 6.4
2.75 2.55 2.4 5.9
12.2
20.5 14.3 12.8 4.2
11.4
4.4 2.75 4.7 2.9 2.7
2.55 5.1 2.8 2.8 3.3 6.4
June
2.45 2.4 2.4 3.4 2.65
2.4 2.4 2.5 2.55 2,55
2.55 2.55 2.35 3.55 3.5
3.4 4.1 2.65 2.4 2.35
14.1 9.5 2.8 2.35 2.8
11.6 4.1 2.9 4.5 2.85
Total run-off
Million gallons
135 103 105 80.4 115 93.7
1,530
90.2 88.6
182 110 204 113
1,420
Acre-feet
414317 323 247 354 288
4,690
277 272 559 339 627 346
4,360
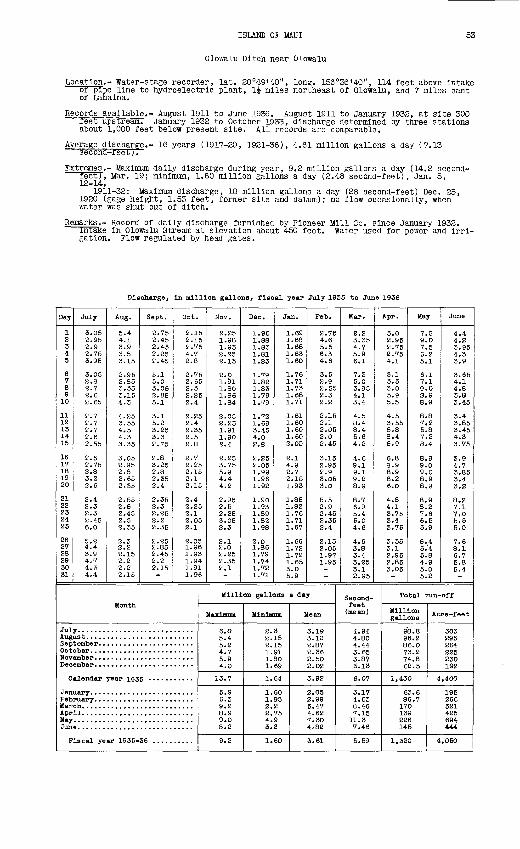
ISLAND OF MA.UI 53
Olowalu Ditch near Olowalu
Location.- Water-stage recorder, lat. 20°49'40", long. 156°36'40", 114 feet above Intake or pipe line to hydroelectric plant, 1£ miles northeast of Olowalu, and 7 miles east of Lahaina.
Records available.- August 1911 to June 1936. August 1911 to January 1932, at site 300 feet upstream. January 1932 to October 1933, discharge determined by three stations about 1,000 feet below present site. All records are comparable.
Average discharge.- 16 years (1917-20, 1921-36), 4.61 million gallons a day (7.13 secona-reet;7
Extremes.- Maximum daily discharge during year, 9.2 million gallons a day (14.2 second- feet;, Mar. 19; minimum, 1.60 million gallons a day (2.48 second-feet), Jan. 5, 12-14.
1911-32: Maximum discharge, 18 million gallons a day (28 second-feet) Dec. 25, 1920 (gage height, 1.53 feet, former site and datum); no flow occasionally, when water was shut out of ditch.
Remarks.- Record of daily discharge furnished by Pioneer Mill Co. since January 1932. intake in Olowalu Stream at elevation about 450 feet. Water used for power and irri gation. Flow regulated by head gates.
Discharge, In million gallons, fiscal year July 1936 to June
Day
1 2 3 4 5
6 7 8 9
10
11 12 13 14 15
1617 18 19 20
21 22 23 24 25
26 27 28 29 30 31
July
3.05 2.95 2.9 2.75 3.95
3.05 2.8 2.7 2.6 2.65
2.7 2.7 2.7 2.6 2.55
2.5 2.75 2.8 3.2 2.6
2.4 2.3 2.3 2.45 6.0
5.2 4.4 3.9 4.7 4.3 4.4
Aug.
5.4 4.1 3.9 3.5 3.15
2.95 2.85 3.35 3.15 4.3
4.25 3.55 4.5 4.3 3.35
3.05 2.95 2.8 2.65 2.55
2.55 2.5 2.45 2.5 2.35
2.3 2.2 2.15 2.2 2.2 2.15
Sept.
2.75 2.45 2.46 2.25 2.45
5.1 5.0 3.05 2.85 3.1
3.1 5.2 3.25 3.3 2.75
2.8 3.25 2.8 2.35 2.4
2.35 2.3 2.25 2.2 2.35
2.25 2.85 2.45 2.2 2.15
Oct.
2.15 2.15 2.75 4.7 2.8
2.75 2.65 2.3 2.25 2.4
2.25 2.4 2.35 2.5 2.8
2.7 2.25 2.15 2.1 2.15
2.4 2.25 2.1 2.05 2.1
2.05 1.96 1.93 1.94 1.91 1.96
Month
Jul Augi Sep Oct HOT Dec
C
Jan Fob Mar Apr May Jun
F
alendar year 193
Isoal year 1935-
Nov.
2.25 1.98 1.95 2.25 2.15
2.0 1.91 1.80 1.86 1.84
2.05 2.25 1.91 1.90 2.4
2.25 3.75 5.9 4.4 4.2
2.95 2.5 2.25 3.05 2.3
2.1 2.0 2.25 2.35 2.1
Dec.
1.96 .88 .83 .81 .83
.79
.82
.83
.79
.79
.72
.69
.45
.0
.8
.25
.05
.99
.96
.92
.90
.93
.89
.82
.98
.0
.86
.79
.74
.72
.71
Jan.
.69
.68
.68
.63
.60
.76
.71
.73
.68
.71
.61
.60
.60
.60
.05
.1
.9
.15
.93
.85
.82
.76
.71
.67
.66
.72
.72
.65
.0 5.9
Feb.
2.76 4.6 5.5 6.3 4.6
3.5 2.9 2.55 2.3 2.2
2.15 2.1 2.05 2.0 2.45
3.15 2.95 2.9 3.06 3.0
5.5 2.9 2.45 2.35 2.4
2.15 2.05 1.97 1.95
Million gallons a day
Maximum
6.05.4 5.2 4.7 5.9 4.0
13.7
6.9 6.3 9.2 8.9 9.0 8.2
9.2
Minimum
2.3 2.15 2.15 1.91 1.80 1.69
1.64
1.60 1.95 2.2 2.75 4.9 3.2
1.60
Mean
3.19 3.10 2.87 2.36 2.50 2.02
3.92
2.05 2.99 5.47 4.62 7.30 4.82
3.61
Mar.
2.2 3.35 4.7 5.9 6.1
7.3 5.0 3.95 4.1 3.4
4.5 8.4 8.4 5.6 4.2
4.6 9.1 9.1 9.2 8.9
8.7 6.9 5.4 6.0 4.6
4.6 3.8 3.4 3.25 3.1 2.95
Apr.
3.0 2.95 2.75 2.75 4.1
3.1 3.5 3.0 5.9 5.5
4.5 3.55 5.8 8.4 5.9
6.8 8.9 8.9 8.2 6.0
4.8 4.1 3.75 3.4 3.76
3.35 3.1 2.95 2.85 3.05
Second- feet
(mean)
4.94 4.80 4.44 3.65 3.87 3.13
6.07
3.17 4.63 8.46 7.15
11.3 7.46
5.59
May
7. 9. 7. 6. 5.
6. 7. 9. S. 8.
8.7. 5. 7. 8.
8. 9. 9. 8. 8.
8. 8. 7. 6. 5.
5. 5.6. 4. 5. 5.
5 0 5 21
1 1 0 9 9
8 2 8 2 4
9 0 0 9 9
9 2 6 5 9
4 4 8 9 0 2
June
4.4 4.2 3.95 4.3 3.9
3.65 4.1 4.8 3.8 3.45
3.4 3.85 3.45 4.3 3.75
3.9 4.7 3.85 3.4 3.2
8.2 7.1 7.0 5.5 5.0
7.6 8.1 6.7 5.85.4
Total run-off
Million gallons
98.8 96.2 86.0 73.2 74.8 62.5
1,430
63.6 86.7
170 139 226 145
1,320
Acre -feet
303 295 264 225 230 192
4,400
195 266 521 425 694 444
4,050
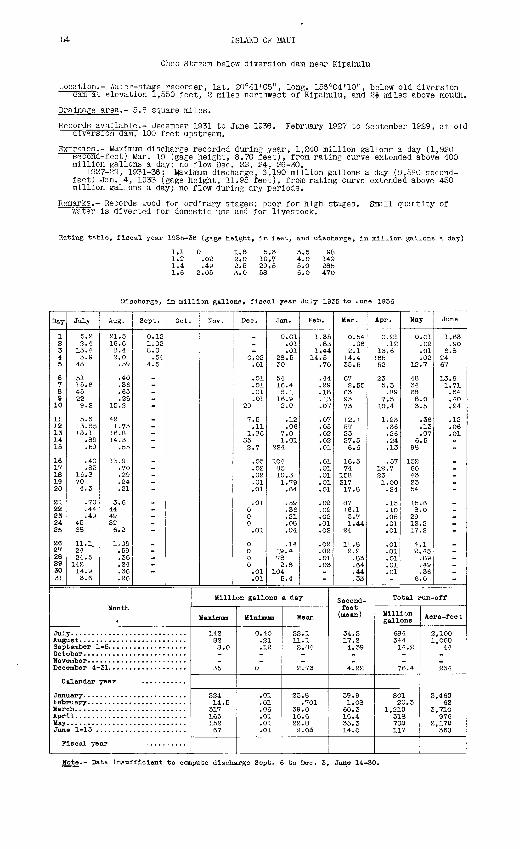
54 ISLAND OF MAUI
Oheo Stream below diversion dam near Kipahulu
Location.- Wat3r-stage recorder, lat. 20°41'05", long. 156°04'10", below old diversion dam at elevation l,5sO feet, 2 miles northwest or Kipahulu, and 2£ miles above mouth.
Drainage area.- 5.8 square miles.
Records available.- December 1931 to June 1936. February 1927 to September 1929, at old diversion dam, 100 feet upstream.
Extremes.- Maximum discharge recorded during year, 1,240 million gallons a day (1,920 second-feet) Mar. 19 (gage height, 8.70 feet), from rating curve extended above 400 million gallons a day: no flow Dec. 22, 24, 26-30.
1927-29, 1931-36: Maximum discharge, 6,190 million gallons a day (9,580 second- feet) Jan. 4, 1933 (gage height, 11.95 feet), from rating curve extended above 450 million gallons a day; no flow during dry periods.
Remarks.- Records good for ordinary stages; poor for high stages. Small quantity of water is diverted for domestic use and for livestock.
Rating table, fiscal year 1935-36 (gage height, in feet, and discharge, in million gallon
1.11.2 1.4 1.6
1.8 2.0 2.5 3.0
5.310.729.558
3.5 4.0 5.0 6.0
149285470
day)
Discharge, in million gallons, fiscal year July 1935 to June 1936
Day
1 2 3 4 5
6 7 8 9 10
11 12 13 14 15
16 17 18 19 20
21 22 23 24 25
26 27 28 29 30 31
July
5. P. 2.4
15.4 3.9
43
51 15.6 45 22 9.2
5.6 3.85
13.1 .89.59
.40
.83 16.8 70 4.3
.70
.44
.49 45 88
11.1. 24 24.5
142 14.9 3.6
Aug.
21.5 16.68.4 2.0 .59
.40
.36
.63
.2615.2
42 1.73
16.8 14.3
.55
13.9 .70 .29 .24 .21
3.6 44 49 82 6.2
1.09 .59 .36 .24 .36 .26
Sept.
0.12 1.02 8.0 .54
4.5
Oct.
Month
Jul Aug Sep Oct Nov Dec
C
Jan Pet Mar Apr May Jun
P
tember 1obel*
ember 4-
alendar
31 ...............
year
e 1-13 . ....................
Iscal year
Nov. Dec.
0.02 .01
.01
.01
.01
.01 29
7.5 .11
1.86 35 2.7
.05
.02
.02
.01
.01
.01 0 0 0 .01
0 0 0 0 .01 .01
Jan.
0.01 .01 .01
28.5 30
54 16.4 8.1
16.9 2.0
.12
.06 7.0 1.01
224
104 85 10.3 1.79 .64
.59
.36
.21
.08
.04
.14 19.4 78 2.8
104 5.4
Peb.
1.35 .83
1.44 14.5
.70
.44
.29
.18
.13
.07
.07
.05
.02
.02
.01
.01
.01
.01
.01
.01
.02
.02
.02
.01
.02
.02
.02
.01
.03
Million gallons a day
Maximum
142 82 8.0
35
224 14.5
317 165 152 67
Minimum
0.40 .21 .12
0
.01
.01
.06
.01
.01
.01
Mean
22.1 11.1 2.84
2.73
25.8 .701
39.0 10.6 22.8 9.03
Mar.
0.54 .06
2.114.4 35.5
67 2.55
63 93 73
12.1 57 23 27.5 6.6
16.5 74
158 317 17.8
87 16.1 3.7 1.44
24
11.8 2.2 .83 .64 .44 .33
Apr.
0.21 .12
13.6 165 52
23 5.3 .89
7.5 10.4
1.23 .36 .26 .24 .13
.57 12.7 23 1.00 .24
.15
.10
.05
.01
.01
.01
.01
.01
.01
.01
Second- feet (mean)
34.2 17.2 4.39
4.22
39.9 1.08 60.3 16.4 35.3 14.0
May
0.01 .02 .01 .02
12.7
48 34 68 8.0 3.5
.36
.13
.07 6.5
98
152 60 43 23 54
15.6 8.0
29 12.2 17.2
4.1 2.45 .89 .49 .36
6.0
June
1.63 .90
6.8 24 67
13.9 1.71 .64 .40 .24
.12
.06
.01
Total run-off
Million gallons
684 344 14.2
76.4
801 20.3
1,210 318 708 117
Acre -feet
2,100 1,060
44
234
2,460 62
3,710 976
2,170 360
Hote.- Data insufficient to compute discharge Sept. 6 to Dec. 3, June 14-30.
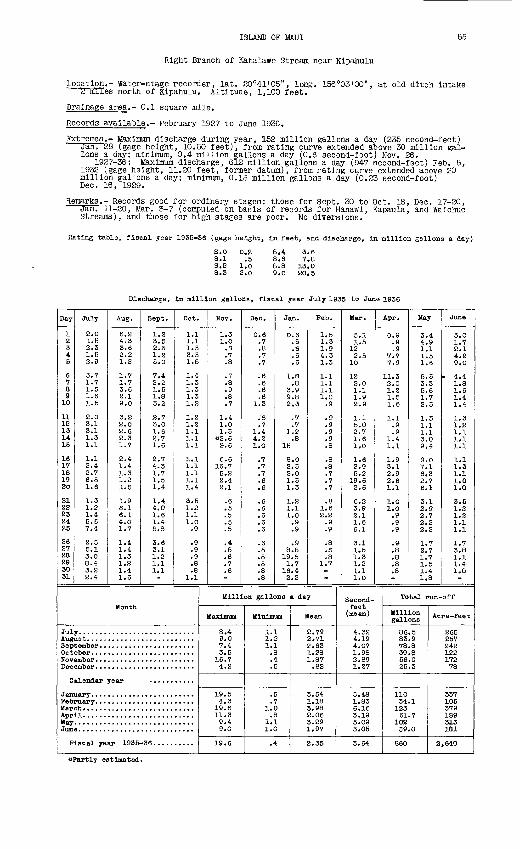
ISLAND OF M/UJI 55
Right Branch of Kahalawe Stream near Kipahulu
Location.- Water-stage recorder, lat. 20°41'05", long. 156°03'00", at old ditch intake 2 miles north of Kipahulu. Altitude, 1,100 feet.
Drainage area.- 0.1 square mile.
Records available.- February 1927 to June 1936.
Extremes.- Maximum discharge during year, 152 million gallons a day (235 second-feet) Jan. 28 (gage height, 10.50 feet), from rating curve extended above 30 million gal lons a day; minimum, 0.4 million gallons a day (0.6 second-foot) Nov, 26.
1927-36: Maximum discharge, 612 million gallons a day (947 second-feet) Feb. 5, 1932 (gage height, 11.20 feet, former datum), from rating curve extended above 20 million gallons a. day: minimum, 0.15 million gallons a day (0.23 second-foot) Dec. 16, 1929.
Remarks.- Records good for ordinary stages; those for Sept. 30 to Oct. 18, Dec. 17-20, JafTT 11-20, Mar. 3-7 (computed on basis of records for Hanawi, Kapaula, and Waiohue Streams), and those for high stages are poor. No diversions.
Rating table, fiscal year 1935-36 (gage height, in feet, and discharge, in million gallons a day)
0.2.5
1.02.0
3.67.813.020.5
Discharge, In million gallons, fiscal year July 1935 to June 1936
Day
1 2 3 4 5
6 7 8 9 10
11 12 13 14 15
1617 18 19 20
21 22 23 24 25
26 27 28 29 30 31
July
2.0 1.5 2.3 1.5 2.9
3.7 1.7 1.5 1.6 1.5
2.0 3.1 3.1 1.3 1.1
1.1 2.4 2.7 6.5 1.6
1.3 1.2 1.4 5.5 7.4
2.5 5.1 3.0 8.4 3.2 2.4
Aug.
6.24.3 3.6 2.2l.S
1.7 1.7 3.6 2.19.0
3.2 2.0 2.6 2.31.7
2.4 1.4 1.3 1.2 1,5
1.9 6.1 6.1 4.0 1.7
1.4 1.4 1.3 1.2 1.4 1.6
Sept.
1.2 3.5 S.3 1.2 5.0
7.4 2.2 1.5 1.85.2
2.7 3.0 1.6 2.7 1.6
2.7 4.3 1.7 1.5 1.4
1.44.0 1.6 1.4 5.8
S.6 3.1 1.2 1.1 1.1
Oct.
1.1 1.1 1.5 3.5 1.5
1.4 1.3 1.3 1.31.2
1.2 1.2 1.1 1.1 1.1
1.1 1.1 1.1 1.1 1.4
3.5 1.2 1.1 1.0 .9
.9
.9
.9
.8
.8 1.1
Month
Jul Aug< Sep Oct HOT Dec
C
Jan Fob Mar Apr May Jun
F
alendar year
iscal year 1935
Nov.
1.3 1.0 .3 .7 .8
.7
.8
.9
.7
1.4 1.0 1.5
*2.6 S.6
6.6 16.7 5.2 2.4 2.1
.6
.5
.5
.5
.5
.4
.5
.6
.7
.6
Dec.
0.6 .7 .8 .7 .7
.6
.6
.6
1.3."8
.7 1.4 4.2 1.0
.7
.7
.7
.6
.6
.6
.6
.6
.6
.6
.6
.5
.5
.5
.8
.8
Jan.
0.6 .5 .6 .6 .6
l.S .8
3.9
S.3
.7
.7 1.2 .8
15
8.0 2.5 2.0 1.5 1.3
1.2 1.1 1.0 .9 .9
.9 8.8 19.5 1.7
16.4 2.2
Feb.
1.5 1.3 1.9 4.3 1.3
1.1 1.1 1.1
.9
.9
.9
.9
.9
.8
.8
.8
.7
.7
.7
.8 1.6 2.2 .9 .9
.8
.3
.8 1.7
Million gallons a day
Maximum
8.4 9.0 7.4 3.5
16.7 4.2
19.5 4.3
19.6 11.3 9.4 9.0
19.6
Minimum
1.1 1.2 1.1 .8 .4 .5
.5
.7 1.0 .8
1.1 1.0
.4
Mean
2.79 2.71 2.63 1.28 1.87 .82
3.54 1.18 3.98 2.06 3.29 1.97
2.35
Mar.
5.1 1.5
12 2.5
10
12 2.0 1.1
2.9
1.1 5.0 2.7 1.6 1.0
1.6 2.9 5.2
19.6 2.6
6.2 3.9 2.11.6 6.1
3.1 1.5 1.3 1.2 1.1 1.0
Apr.
0.9 .9 .9
7.7 7.9
11.3 2.0 1.2
1.6
1.1 .9 .9
1.4 1.1
1.9 3.1 2.9 2.61.1
1.0 1.0 .9 .9 .9
.9
.8
.8
.8
.8
Second- feet (mean)
4.32 4.19 4.07 1.98 2.89 1.27
5.48 1.83 6.16 3.19 5.09 3.05
3.64
May
3.4 4.9 1.11.5 1.6
5.5 3.35.6
2.5
1.3 1.1 1.1 3.0 9.4
9.0 7.1 6.3 2.7 6.1
3.1 2.9 2.7 2.2 2.2
1.7 2.7 1.7 1.5 1.4 1.8
June
3.0 1.7 2.1 4.2 9.0
4.4 1.8 1.6
1.4
1.3 1.2 1.1 1.1 1.1
1.1 1.3 1.1 1.0 1.0
3.5 1.2 1.21.1 1.1
1.7 3.8 1.1 1.4 1.0
Total run-off
Million gallons
86.5 83.9 78.8 39.8 56.0 25.3
110 34.1
123 61.7
102 59.0
860
Acre-feet
265 257 242 122 172 78
337 105 379 189 313 181
2,640
KPartly estimated.
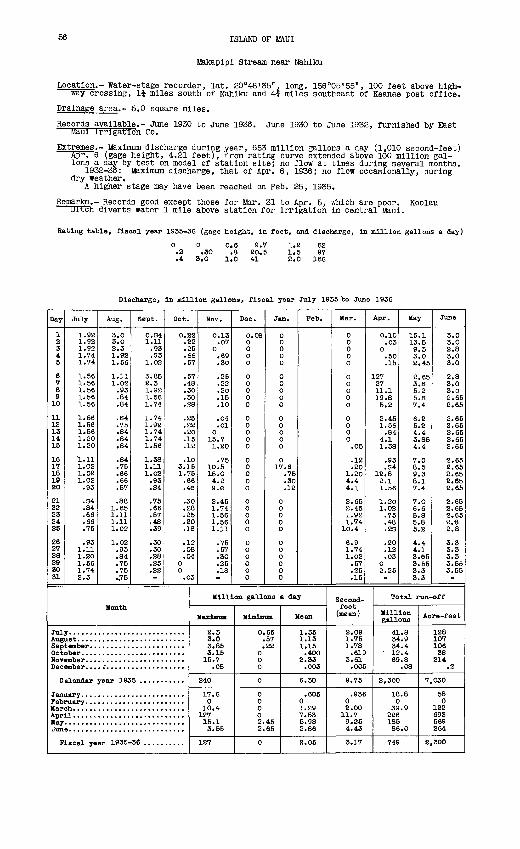
56 ISLAM) OF MAUI
Makapipi Stream near Nahiku
Location.- Water-stage recorder, lat. 20°48 I 35", long. 156°05'55", 100 feet above high way crossing, 11 miles south of Nahiku and 4f miles southeast of Keanae post office.
Drainage area.- 5.0 square miles.
Records available.- June 1930 to June 1936. June 1930 to June 1932, furnished by East Maul irrigation Co.
Extremes.- Maximum discharge during year, 653 million gallons a day (1,010 second-feet) Apr. 6 (gage height, 4.21 feet), from rating curve extended above 100 million gal lons a day by test on model of station site; no flow at times during- several months.
1932-36: Maximum discharge, that of Apr. 6, 1936; no flow occasionally, during dry weather.
A higher stage may have been reached on Feb. 25, 1935.
Remarks.- Records good except those for Mar. 31 to Apr. 5, which are poor. Koolau HTEch diverts water 1 mile above station for irrigation in central Maul.
Rating table, fiscal year 1935-36 (gage height, in feet, and discharge, in million gallons a day)
.30 3.0
0.6.8
1.0
9.720.541
1.2 1.5 2.0
6297
166
Discharge, In million gallons, fiscal year July 1935 to June 1936
Day
1 2 3 4 5
6 7 8 9
10
11 12 13 14 15
16 17 18 19 20
21 22 23 24 25
26 27 28 29 30 31
July
1.92 1.92 1.92 1.74 1.74
1.56 1.56 1.56 1.56 1.56
1.56 1.56 1.56 1.20 1.20
1.11 1.02 1.02 1.02
.93
.54
.84
.66
.66
.75
.93 1.11 1.20 1.56 1.74 2.3
Aug.
3.0 3.0 2.3 1.92 1.56
1.11 1.02
.93
.84
.84
.34
.75
.84
.84
.84
.84
.75
.66
.66
.57
.88 1.65 1.11 1.11 1.02
1.02 .93 .84 .75 .75 .,75
Sept.
O.S4 1.11
.93
.93 1.02
3.85 2.31.92 1.56 1.74
1.74 1.92 1.74 1.74 1.56
1.38 1.11 1.02
.93
.34
.75
.66
.57
.48
.39
.30
.30
.28
.25
.22
Oct.
0.22 .22 .25.66 .57
.57
.48
.30
.30
.28
.25
.22
.20
.15
.12
.10 3.15 1.75
.66
.46
.30 .28 .25 .20.18
.12
.08
.04 0 0
.03
Month
Jul Augi Sep Oct HOT Dec
C
Jan Feo liar Apr May Jun
F
alendar year 193
e. ...........................
iscal year 1935- 36 ..........
Nov.
0.13 .07
0 .69 .30
.25
.22
.20
.15
.10
.04
.01 0
15.7 1.20
.75 10.5 15.0 4.2 9.6
2.451.74 1.56 1.56 1.11
.75
.57
.30
.25
.18
Dec.
0.08 0 0 0 0
0 0 0 0 0
0 0 0 0 0
0 0 0 0 0
0 0 0 0 0
0 0 0 0 0 0
Jan.
0 0 0 0 0
0 0 0 0 0
0 0 0 0 0
0 17.6
.75
.30
.12
0 0 0 0 0
0 0 0 0 0 0
Feb.
Million gallons a day
Haxlmm
2.3 3.0 3.85 3.15
15.7 .08
240
17.6 0
10.4 127 15.1 3.55
127
Minimum Mean
0.66 1.35 .67 1.13 .22 1.15
0 .400 0 2.33 0 .003
0 6.30
0 .605 0 0 0 1.29 0 7.53 2.45 5.98 2.65 2.86
0 2.05
Har.
0 0 0 0 0
0 0 0 0 0
0 0 0 0
.05
.12
.20 1.20 4.4 4.1
2.65 2.45 1.92 1.74
10.4
6.9 1.74 1.02
.57
.25
.15
Apr.
0.10 .03
0 .50 .15
127 27 11.1 19.8 5.2
2.45 1.56
.84 4.1 1.38
.93
.54 12.8 2.1 1.56
1.20 1.02
.75
.48
.23
.20
.12
.03 0 2.25
Second- feet
(mean)
2,09 1.75 1.78
.619 3.61
.005
9.75
.936 0 2.00
11.7 9.25 4.43
3.17
May
15.1 13.5 9.3 3.0 2.45
2.65 3.S 5.2 5.S 7.4
6.2 5.2 4.4 3.85 4.4
7.0 8.5 9.3 8.1 7.4
7.0 6.6 5.8 5.8 5.2
4.4 4.1 3.65 3.55 3.3 3.3
June
3.0 3.0 2.8 3.0 3.0
2.8 3.0 3.0 2.65 2.65
2.65 2.65 2.65 2.65 2.65
2.65 2.65 2.65 2.65 2.65
2.65 2.65 2.65 2.8 2.8
3.3 3.3 3.3 3.55 3.55
Total run-off
Million gallons
41.8 34.9 34.4
12.4 69.8
.08
2,300
18.8 0
39.9 226 185 86.0
749
Acre-feet
128 107 106
38 214
.2
7,030
58 0
122 693 569 264
2,300
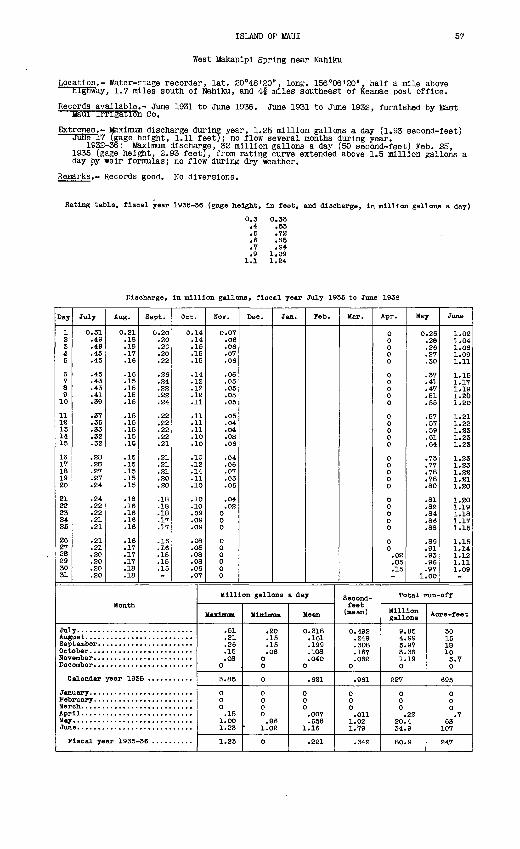
ISLAND OF MAUI 57
West Makaplpl Spring near Nahiku
Location.- Water-stage recorder, lat. 20°48'20", long. 156°06'20", half a mile above highway, 1.7 miles south of Nahlku, and 4f miles southeast of Keanae post office.
Records available.- June 1931 to June 1936. June 1931 to June 1932, furnished by East uaui irrigation Co.
Extremes.- Maximum discharge during year, 1.25 million gallons a day (1.93 second-feet) June 17 (gage height, 1.11 feet); no flow several months during year.
1932-36: Maximum discharge, 32 million gallons a day (50 second-feet) Feb. 25, 1935 (gage height, 2.93 feet), from rating curve extended above 1.5 million gallons a day by weir formulas; no flow during dry weather.
Remarks.- Records good. No diversions.
Rating table, fiscal year 1936-36 (gage height, In feet, and discharge, In million gallons a day)
0.3 0.33.4 .63.6 .72.6 .85.7 .94.9 1.09
1.1 1.24
Discharge, In million gallons, fiscal year July 1936 to June 1936
Day
1 2 3 4 6
6 7 8 9 10
11 12 13 14 15
16 17 18 19 20
21 22 23 24 25
26 27 28 29 30 31
July
0.51 .49 .49 .46 .45
.45
.43
.43
.41
.39
.37
.35
.33
.32
.32
.28
.28
.27
.27
.24
.24
.22
.22
.21
.21
.21
.21
.20
.20
.20
.20
Aug.
0.21 .18 .18 .17 .16
.16
.15
.15
.15
.15
.15
.15
.15
.15
.15
.15
.15
.15
.15
.15
.16
.16
.16
.16
.16
.16
.17
.17
.17
.18
.18
Sept.
0.20 .20 .20 .20 .22
.26
.24
.22
.22
.24
.22
.22
.22
.22
.21
.21
.21
.21
.20
.20
.18
.18
.18
.17
.17
.16
.16
.15
.15
.15
Oct.
0.14 .14 .15 .15 .15
.14
.12
.12
.12
.11
.11
.11
.11
.10
.10
.10
.12
.14
.11
.10
.10
.10
.09
.09
.09
.08
.08
.08
.08
.06
.07
Month
Jul Aug Sep Oct Hov Dec
C
Jan Feb Mar Apr May Jun
P
alendar year 19;
Iscal year 1955-
Hov.
0.07 .06 .06 .07 .06
.06
.05
.06
.05
.05
.05
.04
.04
.OS
.06
.04
.06
.07
.05
.06
.04
.02 0 0 0
0 0 0 0 0 0
Dec. Jan. Feb.
Million gallons a day
Maximum
.51
.21
.26
.15
.OS 0
3.86
0 0 0 .15
1.00 1.23
1.28
Minimum
.20
.15
.15
.06 0 0
0
0 0 0 0 .36
1.02
0
Mean
0.318 .161 .199 .108 .040
0
.621
0 0 0 .007 .658
1.16
.221
Har. Apr.
0 0 0 0 0
0 0 0 0 0
0 0 0 0 0
0 0 0 00
0 0 0 0 0
0 0 .02 .05 .15
Second- feet (mean)
0.492 .249 .308 .167 .062
0
.961
0 0 0 .011
1.02 1.79
.342
May
0.26 .26 .26 .27 .30
.37
.41
.47
.51
.55
.57
.57
.59
.61
.64
.73
.77
.78
.78
.80
.81
.82
.84
.86
.88
.89
.91
.93
.96
.97 1.00
June
1.02 1.04 1.06 1.09 1.11
1.16 1.17 1.19 1.2(3 1.20
1.21 1.22 1.23 1.28 1.23
1.23 1.23 1.22 1.21 1.20
1.20 1.19 1.18 1.17 1.16
1.15 1.14 1.12 1.11 1.09
Total run-off
fawns' * * *
9.85 30 4.99 15 5.97 18 3.36 10 1.19 3.7 0 0
227 696
0 0 0 0 0 0 .22 .7
20.4 63 34.9 107
80.9 247
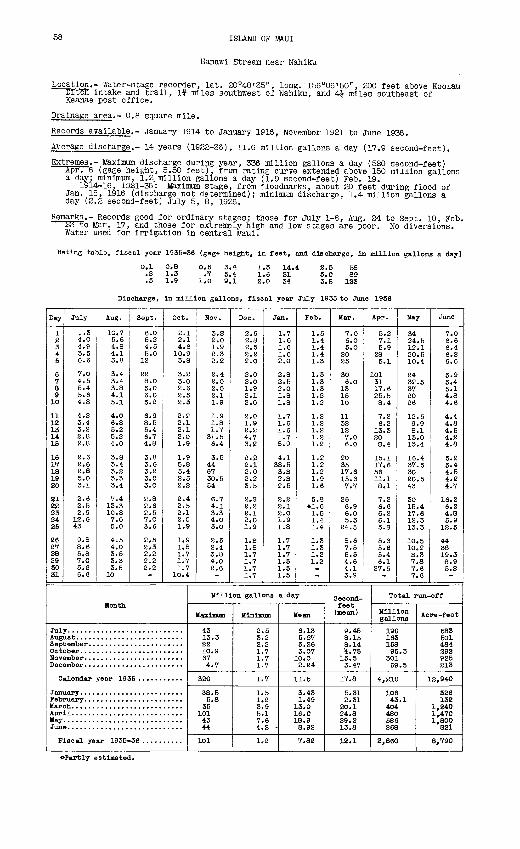
58 ISLAND OF MAUI
Hanawi Stream near Nahiku
Location.- Water-stage recorder, lat. 20°48'35", long. 156°06'50", 200 feet above Koolau Ditch intake and trail, if miles southwest of Nahiku, and 4J miles southeast of Keanae post office.
Drainage area.- 0.8 square mile.
Records available.- January 1914 to January 1916, November 1921 to June 1936.
Average discharge.- 14 years (1922-36), 11.6 million gallons a day (17.9 second-feet).
Extremes.- Maximum discharge during year, 336 million gallons a day (520 second-feet) Apr. 6 (gage height, 5.50 feet), from rating curve extended above 150 million gallons a day; minimum, 1.2 million gallons a day (1.9 second-feet) Feb. 19.
1914-16, 1921-36: l&ximum stage, from floodmarks, about 20 feet during flood of Jan. 18, 1916 (discharge not determined); minimum discharge, 1.4 million gallons a day (2.2 second-feet) July 5, 8, 1926.
Remarks.- Records good for ordinary stages; those for July 1-8, Aug. 24 to Sept. 10, Feb. S5~To Mar. 17, and those for extremely high and low stages are poor. No diversions. Water used for irrigation in central Maul.
Rating table, fiscal year 1935-36 (gage height, In feet, and discharge. In million gallons a day)
0.1 .2 .3
0.8 1.3 1.9
0.5 .7
1.0
3.4 5.4 9.1
1.3 1.6 2.0
14.42134
2.5 S.O3.5
5889
123
Discharge, In million gallons, fiscal year July 1935 to June 1956
Day
1 2 3 4 5
6 7 8 9
10
11 12 13 14 15
16 IV 18 19 20
21 22 23 24 25
26 2V 28 29 SO 31
July
,.3 4.0 4.9 3.5 6.6
7.0 4.5 5.4 5.6 4.8
4.2 3.4 3.2 2.8 2.8
2.6 2.6 2.8 5.0 3.1
2.6 2.5 2.9
12.6 43
9.8 8.6 5.8 7.0 5.6 6.6
Aug.
10.7 5.6 4.8 4.1 3.8
3.4 3.4 3.8 4.1 5.1
4.0 6.8 5.2 5.2 4.0
3.8 3.4 3.2 3.3 3.4
7.4 13.3 10.8 7.0 5.0
4.5 4.0 3.5 3.3 3.5
10
Sept.
6.0 5.2 4.5 5.0
12
22 8.0 5.0 6.0 5.2
6.9 8.5 5.4 6.7 4.8
3.8 3.6 3.2 3.0 3.0
2.8 2.6 2.5 7.0 3.6
2.5 2.3 2,2 2.2 2.2
Oct.
2.1 2.1 4.6
10.9 3.8
3.2 3.0 2.6 2.5 2.3
2.2 2.1 2.1 2.0 1.9
1.9 5.8 5.4 2.5 2.2
2.4 2.5 2.1 2.0 1.9
1.9 1.8 1.7 1.7 1.7
10.4
Month
Jul Augi Sep Oct NOT Dec
C
Jan Peb Mar Apr May Jun
P
alendar year 19C
Iscal year 1935-
NOT.
3.S 2.0 1.9 2.3 2.2
2.4 2.0 2.0 2.1 1.9
1.9 1.8 1.7
31.5 6.4
3.5 44 67 30.5 54
6.7 4.1 3.3 4.0 3.0
2.5 2.4 3.8 4.0 2.6
Dec.
2.6 2.8 2.5 2.2 2.0
2.0 2.0 1.9 2.1 2.0
2.0 1.9 2.2 4.7 3.2
2.2 2.1 2.0 2.2 3.5
2.S 2.2 2.1 2.0 1.9
l.S 1.8 1.7 1.7 1.7 1.7
Jan.
l.V 1.6 1.6 1.6 2.0
2.8 2.5 2.0 1.8 1.8
1.7 1.6 1.61.7 8.9
4.1 38.5 3.S 2.S 2.5
2.2 2.1 2.0 1.9 1.8
1.7 1.7 1.7 1.5 1.5 1.5
Peb.
1.5 1.4 1.4 1.4 1.3
1.3 1.3 1.3 1.2 1.2
1.2 1.2 1.2 1.2 1.2
1.2 1.2 1.2 1.9 1.6
5.8 1.6 1.5 1.4 1.4
1.3 1.3 1.2 1.2
Million gallons a day
Maximum
43 13.3 22 10.9 67 4.7
320
38.5 5.8
35 101 43 44
101
Minimum
2.5 3.2 2.2 1.7 1.7 1.7
1.7
1.5 1.2 3.9 5.1 7.6 4.2 -
1.2
Mean
6.13 5.2V 5.26 3.07
10.0 2.24
11.5
3.43 1.49
13.0 16.0 18.9 8.92
7.82
Mar.
7.0 6.0 5.0
20 25
30 6.0
13 15 10
11 32 12 7.0 6.0
20 35 17.6 15.6 7.7
26 6.9 6.0 5.3
24.5
8.6 7.5 5.5 4.6 4.1 3.9
Apr.
5.2 7.1 5.9
28 5.1
101 31 17.6 25.5 8.4
7.2 6.2
13.3 20 S.4
15.1 17.6 56 11.1 8.1
7.2 6.6 6.2 6.1 5.S
5.6 5.6 5.4 6.1
27.5
Second- feet (mean)
9.48 8.15 8.14 4.75 15.5 3.47
17.8
5. SI 2.31
20.1 24.8 29.2 13.8
12.1
May
34 24 12 20 10
24 32 37 20 26
12 9 8
13 IS
16 37 30 20 43
30 15 17 12 13
10 10 S 7 7 7
.5
.1
.5
.4
.5
.5
.9
.1
.0
.4
.4
.5
.5
.4
.6
.3
.3
.5
.2
.3
.8
.6
.6
June
7.0 6.6 6.4 6.S 6.6
5.9 5.4 5.1 4.8 4.6
4.4 4.8 4.5 4.2 4.8
5.2 5.4 4.5 4.2 4.7
16.2 6.2 4.8 5.9
12.5
44 38 19.3 8.9 5.S
Total run-off
Million gallons
190 163 158 95.3
301 69.5
4,210
106 43.1
404 480 586 268
2,860
Acre-feet
583 501 484 292 925 21S
12,940
S26 132
1,240 1,470 1,800
821
8,790
Partly estimated.
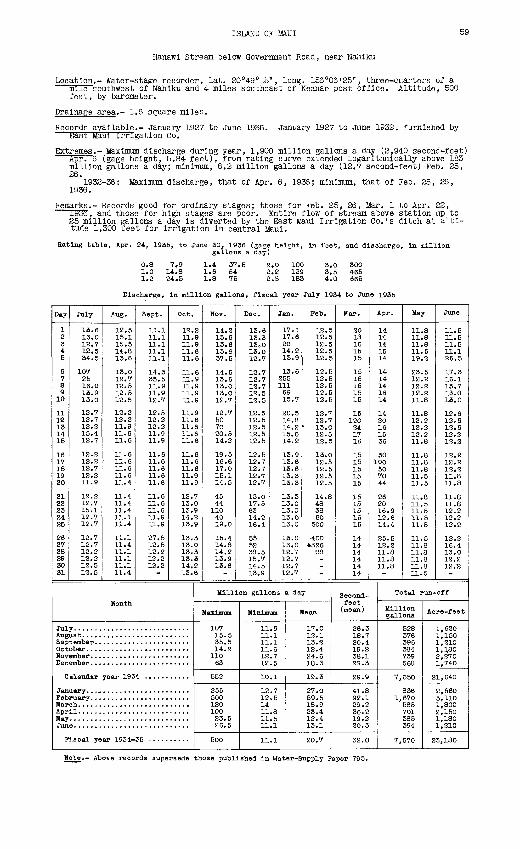
ISLAND OF mm 59
Hanawl Stream below Government Road, near Nahiku
Location.- Water-stage recorder, lat. 20°49°15", long. 156°06'25", three-quarters of a mile southwest of Nahiku and 4 miles southeast of Keanae post office. Altitude, 500 feet, by barometer.
Drainage area.- 1.6 square miles.
Records available.- January 1927 to June 1936. January 1927 to June 1932, furnished by East Maul irrigation Co.
Extremes.- Maximum discharge during year, 1,900 million gallons a day (2,940 second-feet) Apr. 6 (gage height, 5.84 feet), from rating curve extended logarithmically above 183 million gallons a day; minimum, 8.2 million gallons a day (12.7 second-feet) Feb. 25, 26.
1932-36: Maximum discharge, that of Apr. 6, 1936; minimum, that of Feb. 25, 26, 1936.
Remarks.- Records good for ordinary stages; those for Feb. 25, 26, Mar. 1 to Apr. 22, 1936, and those for high stages are poor. Entire flow of stream above station up to 25 million gallons a day Is diverted by the East Maul Irrigation Co.'s ditch at alti tude 1,300 feet for Irrigation In central Maul.
Rating table, Apr. 24, 1935, to June 30, 1936 (gage height, in feet, and discharge, in milliongallons a day)
0.8 7.9 1.4 37.5 2.0 100 3.0 300 1.0 14.8 1.6 54 2.2 129 3.5 465 1.2 24.5 1.8 75 2.5 183 4.0 665
Discharge, in million gallons, fiscal year July 1934 to June 1935
Day
1 2 34 5
6 7 8 9 10
11 12 13 14 15
16 17 18 19 20
21 22 23 24 25
26 27 28 29 30 31
July
13.6 13.0 12.7 12.5 34.5
107 25 16.0 13.9 13.0
12.7 12.7 12.2 15.4 12.7
12.2 12.2 12.7 12.2 11.9
12.2 12.7 15.1 12.7 12.7
12.7 12.7 12.2 12.2 12.5 12.5
Aug.
12.5 15.1 15.5 14.8 13.6
13.0 12.7 12.5 12.5 12.5
12.2 12.2 11.9 11.6 11.6
11.6 11.6 11.6 11.6 11.4
11.4 11.4 11.4 11.1 11.4
11. 11. 11. 11. 11. 11.4
Sept.
11.1 11.1 11.1 11.1 11.1
14.3 35.5 11.9 11.9 12.7
12.5 12.2 12.211.9 11.9
11.6 11.6 11.6 11.6 11.6
11.6 11.6 11.6 11.9 11.9
27.5 12.5 12.2 12.2 12.2
Oct.
12.2 11.9 11.9 11.6 11.6
11.6 11.9 11.9 11.9 11.9
11.9 11.6 11.6 11.6 11.6
11.6 11.6 11.6 11.9 11.9
12.7 13.0 13.9 14.2 13.9
13.3 13.0 13.3 13.3 14.2 13.6
Month
Jul Augi Sep Oct HOT Dec
C
Jan Peb Mar Apr May Jun
F
alendar year 1934 ...........
e. ...........................
iscal year 1934-
Nov.
14.2 13.6 13.6 13.6 37.5
14.5 13.6 13.0 13.0 12.7
12.7 50 70 20.5 14.2
19.5 16.6 17.0 15.1 14.5
45 44 110 40 19.0
15.4 14.8 14.2 13.9 13.6
Dec.
13.6 13.3 13oO 13.0 12.7
12.7 12.7 12.7 12.5 12.5
12.5 12.5 12.5 12.5 12.5
12.5 12.7 12.7 12.7 12.7
13.0 17.5 62 14.2 16.4
55 52 38.5 15.7 14.5 13.9
Jan.
17.1 17.6 20 14.2 13.9
13.6 255 111 69 15.7
20.5 14.8 14.2 15.0 14.2
13.9 13.6 13.6 13.3 13.3
13.3 13.0 13.0 13.0 13.0
13.0 13.0 12.7 12.7 12.7 12.7
Feb.
12.5 12.5 12.5 12.5 12.5
12.5 12.5 12.5 12.5 12.5
12.7 12.7
1 13.0 12.5 12.5
13.0 12.5 12.5 12.5 12.5
14.8 48 38 60
500
'400 *326
Million gallons a day
Maxijnum
107 15.5 35.5 14.2
110 63
552
255 500 120 100 23.5 26.5
500
Minimum
11.9 11.1 11.1 11.6 12.7 12.5
10.1
12.7 12.514 11.8 11.5 11.1
11.1
Mean
17.0 12.1 13.2 12.4 24.6 18.3
19.3
27.0 59.5 18.9 23.4 12.4 13.1
20.7
Mar.
2018 16 15 15
15 15 15 15 15
15 120 24 17 16
15 15 15 15 15
15 15 15 15 15
14 14 14 14 14 14
Apr.
1414 1415 14
14 14 14 16 14
14 20 16 15 36
30 100 5070 44
26 20 16.9 12.6 14.4
25.5 12.2 11.8 11.8 11.8
Second- feet (mean)
26.3 18.7 20.4 19.2 38.1 2S.3
29.9
41.8 92.1 29.2 36.2 19.2 20.3
32.0
May
11 11 11. 11. 19.
23.12. 12. 12. 11.
11. 12. 12. 12. 11.
11. 11. 11. 11. 11.
11. 11. 11. 11. 11.
11. 11. 11. 11. 11. 11.
8 8 8 5 2
5 2 2 2 8
8 2 2 2 8
8 8 8 5 5
8 5 5 5 5
5 8 8 8 8 5
June
11.5 11.5 11.5 11.1 26.5
17.3 16.1 13.7 13.0 13.0
12.6 12.6 12.6 12.2 12.2
12.2 12.2 12.2 11.8 11.8
11.8 11.8 12.2 12.2 12.2
12.2 16.4 13.0 12.2 12.2
Total run-off
Million gallons
528 376 396 384 739 568
7,050
836 1,670
585 701 385 394
7,570
Acre-feet
1,620 1,150 1,210 1,180 2,270 1,740
21,640
2,560 5,110 1,800 2,150 1,180 1,210
23,180
Note.- Above records supersede those published in Water-Supply Paper 795.
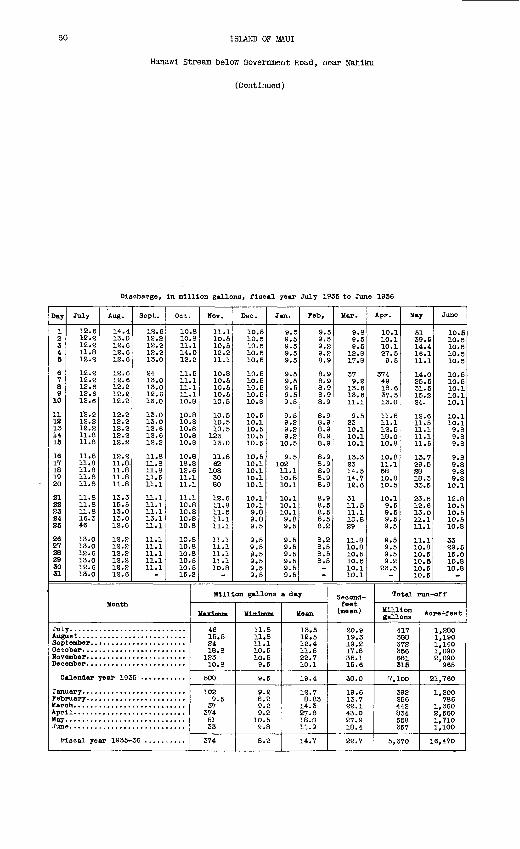
60 ISLAND OF MAUI
Hanawl Stream below Government Road, near Nahiku
(Continued)
Discharge, In million gallons, fiscal year July 1935 to June 1936
Day
1 2 3 4 5
6 7 8 9
10
11 12 13 14 15
16 17 18 19 20
21 22 23 24 25
26 27 28 29 30 31
July
12.6 12.2 12.2 11.8 12.2
12.2 12.2 12.6 12.6 12.6
1'2.2 12.2 12.2 11.8 11.8
11.8 11.8 11.8 11.8 11.8
11.8 11.8 11.8 16.3 46
13.0 13.0 12.6 13.0 12.6 13.0
Aug.
14.4 13.0 12.6 12.6 12.6
12.6 12.6 12.2 12.2 12.2
12.2 12.2 12.2 12.2 12.2
12.2 11.8. 11.8 11.8 11.8
13.3 15.5 13.0 13.0 12.6
12.2 12.2 12.2 12.2 12.2 12.6
Sept.
12.6 12.2 12.2 12.2 13.0
24 13.0 13.0 12.6 13.0
13.0 13.0 12.6 12.6 12.2
11.8 11.8 11.8 11.5 11.1
11.1 11.1 11.1 13.1 11.1
11.1 11.1 11.1 11.1 11.1
Oct.
10.8 10.8 11.1 14.0 12.2
11.5 11.1 11.1 11.1 10.8
10.8 10.8 10.8 10.8 10.8
10.8 18.8 12.611.1 11.1
11.1 10.8 10.8 10.8 10.8
10.8 10.8 10.8 10.5 10.5 15.2
Month
Jul Augi Sep Oct HOT Dec
C
Jan Feb Mar Apr May Jun
P
alendar year 192
Iscal year 1935-
Nov.
11.1 10.5 10.5 12.2 11.1
10.8 10.5 10.5 10.5 10.5
10.5 10.5 10.5
123 13.0
11.8 62
108 30 80
12.6 11.8 11.5 11.1 11.1
11.1 11.1 11.1 11.1 10.8
Dec.
10.5 10.5 10.5 10.5 10.5
10.5 10.5 10.5 10.5 10.8
10.5 10.1 10.5 10.5 10.5
10.5 10.1 10.1 10.1 10.1
10.1 10.1 9.8 9.8 9.5
9.5 9.5 9.5 9.5 9.5 9.5
Jan.
9.5 9.5 9.5 9.5 9.5
9.5 9.5 9.5 9.5 9.5
9.5 9.2 9.2 9.2
10.5
9.5 102 11.1 10.5 10.1
10.1 10.1 10.1 9.8 9.5
9.5 9.5 9.5 9.5 9.5 9.5
Feb,
9.5 9.5 9.2 9.2 8,9
8.9 8.9 8.9 8.9 8.9
8.9 8.9 8.9 8.9 8.9
8.9 8.9 8.9 8.9 8.9
8.9 8.6 8.5 8.5 8.2
8.2 8.5 8.5 8.5
Million gallons a day
HaxljBum
46 15.5 24 18.8
123 10.8
500
1029.5
37 374
51 33
374
|f Jt.Tftlnnm
11.8 11.8 11.1 10.5 10.5 9.5
9.5
9.2 8.2 9.2 9.2
10.5 9.8
8.2
Mean
13.6 12.512.4 11.5 22.7 10.1
19.4
12.7 8.83
14.3 27.8 18.0 11.9
14.7
Mar.
9.8 9.5 9.5
12.8 17.8
37 9.2
13.6 13.611.1
9.5 23 10.1 10.1 10.1
13.3 23 14.5 14.7 12.6
31 11.5 11.1 10.8 29
11.8 10.8 10.5 10.5 10.1 10.1
Apr.
10.1 10.1 10.1 27.5 9.5
374 49 18.6 37.5 13.0
11.5 11.1 12.5 18.0 10.8
10.8 11.1 58 10.8 10.5
10.1 9.5 9.5 9.5 9.5
9.5 9.5 9.5 9.2
23.5
Second- feet
(mean)
20.9 19.3 19.2 17.8 35.1 15.6
30.0
19.6 13.7 22.1 43.0 27.9 18.4
22.7
May
51 39.5 14.4 16.1 11.1
14.0 25.5 31.5 15.2 24.
12.6 11.5 11.1 11.1 11.5
13.7 29.5 28 18.3 33.5
23.5 12.6 13.0 11.1 11.1
11.1 10.8 10.5 10.5 10.5 10.5
June
10.5 10.5 10.5 10.5 10.5
10.5 10.5 10.1 10.1 10.1
10.1 10.1 9.8 9.8 9.8
9.8 9.8 9.8 9.8
10.1
12.8 10.5 10.5 10.5 10.8
3329.5 15.0 10.8 10.8
Total run-off
Million gallons
417 388 372 356 681 315
7,100
392 256 442 834 558 357
5,370
Acre^feet
1,280 1,190 1,140 1,090 2,090
965
21,760
1,200 786
1,360 2,560 1,710 1,100
16,470
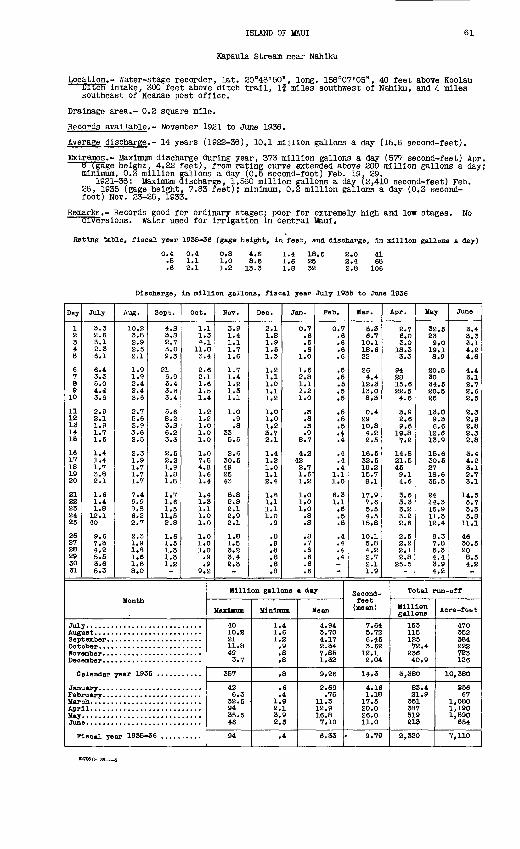
ISLAND OF MMJI 61
Kapaula Stream near Nahlku
Location.- Water-stage recorder, lat. 20°48'50", long. 156°07'05", 40 feet above Koolau til ten Intake, 300 feet above ditch trail, If miles southwest of Nahlku, and 4 miles southeast of Keanae post office.
Drainage area.- 0.2 square mile.
Records available.- November 1921 to June 1936.
Average discharge.- 14 years (1922-36), 10.1 million gallons a day (15.6 second-feet).
Extremes.- Maximum discharge during year, 373 million gallons a day (577 second-feet) Apr. e (gage height, 4.22 feet), from rating curve extended above 200 million gallons a day; minimum, 0.3 million gallons a day (0.5 second-foot) Feb. 19, 29.
1921-36: Maximum discharge, 1,560 million gallons a day (2,410 second-feet) Feb. 25, 1935 (gage height, 7.83 feet); minimum, 0.2 million gallons a day (0.3 second- foot) NOV. 23-25, 1933.
Remarks.- Records good for ordinary stages; poor for extremely high and low stages. No diversions. Water used for Irrigation In central Maul.
Rating table, fiscal year 1935-36 (gage height, In feet, and discharge, in million gallons a day)
0.4 .6
0.4 1.1 2.1
0.8 1.0 1.2
4.S8.6
13.3
1.4 1.6 l.S
18.62632
2.0 2.4 2.8
4168
106
Discharge, In million gallons, fiscal year July 1936 to June 1936
Day
1 2 3 4 6
6 7 8 9 10
11 12 13 14 16
16 17 18 19 20
21 22 23 24 25
26 27 28 29 30 31
July
3.3 2.6 3.1 2.3 6.1
6.4 3.3 5.0 4.4 3.6
2.9 2.1 1.9 1.7 1.5
1.4 1.4 1.7 3.3 2.1
1.6 1.4 1.8 12.1 40
9.6 7.3 4.2 5.5 3.6 5.3
Aug.
10.2 3.8 2.9 2.5 2.1
1.9 1.9 2.4 2.4 3.6
2.7 5.6 3.9 3.6 2.5
2.3 1.9 1.7 1.7 1.7
7.4 9.9 9.8 6.2 2.7
2.3 1.9 1.8 1.6 1.8 8.0
Sept.
4.S 3.S 2.7 3.0 9.3
21 6.9 3.4 3.6 3.4
5.6 8.2 3.S 6.2 3.3
2.5 2.2 1.9 1.8 1.8
1.7 1.6 1.5
11.5 2.8
1.6 1.5 1.3 1.31.2
Oot.
1.1 1.3 4.1
11. S 3.4
2.6 2.1 1.6 1.5 1.4
1.2 1.2 1.0 1.0 1.0
1.0 7.5 4.8 1.6 1.4
1.4 1.3 1.1 1.0 1.0
1.0 1.0 1.0 .9 .9
9.2
Month
Jul Aug Sep Oot HOT Dec
C
Jan Pet) Mar Apr May Jun
P
alendar year 193
Isoal year 1935- 36 ..........
HOT.
3.9 1.4 1.1 1.7 1.6
1.7 1.4 1.2 1.31.1
1.0 .9 .8
33 5.5
2.6 30.5 49 2543
6.8 2.8 2.1 2 9 2!l
1.8 1.5 3.2 3.4 2.3
Dec.
2.1 l.S 1.9 1.6 1.3
1.2 1.1 1.0 1.1 1.2
1.0 1.0 1.2 3.7 2.1
1.4 1.2 1.0 1.1 2.4
1.6 1.1 1.1 1.0 .9
.8
.9
.8
.8
.8
.8
Jan.
0.7 .6 .6 .6
1.0
1.6 2.8 1.1 1.2 1.0
.S
.8
.S
.9 8.7
4.242 2.7 1.6 1 1.2
1.0 1.0 1.0 .8 .S
.8
.7
.6
.6
.6
.6
Feb.
0.7 .6 .6 .6.6
.6
.5
.6
.5
.5
.5
.5
.5 4
.4
.4
.4 1.1 1.0
6.3 1.1 .6 .5 .6
.4
.4
.4
.4
Million gallons a day
Maximum
40 10.2 21 11.8 49 3.7
357
42 6.3
32.5 94 35.5 46
94
Minimum
1.4 1.6 1.2 .9 .8.8
.8
.6
.4 1.9 2.1 3.92 V »V
.4
Mean
4.94 3.70 4.17 2.34 7.86 1.32
9.26
2.69 .76
11.3 12.9 16.8 7.10
6.33
Mar.
6.3 6.7
10.1 18.6 22
26 4.4 12.3 13.0 8.3
e.429 10.8 4.2 2.5
16.6 32.5 18.2 15.7 8.1
17.9 7.6 5.5 4.5
15.8
10.1 5.8 4.2 2.7 2.1 1.9
Apr.
2.7 6.0 3.0
IS. 3 3.3
94 28 15.6 22.5 4.6
3.9 2.6 9.6
19.8 7.2
14.8 21.5 46 9.1 4.6
3.6 3.3 3.2 3.2 2.6
2.5 2.2 2.1 2.8
25.5
Second- feet (mean)
7.64 5.72 6.46 3.62
12.1 2.04
14.3
4.16 1.18 17.5 20.0 26.0 11.0
9.79
May
32.6 23 9.0
19.1 8.9
20.5 30 34.6 20.6 26
13.0 9.3 6.6
12.613.9
16.6 30.6 27 18.6 35.5
24 14.3 15.9 11.3 12,4
9.3 7.8 6.3 4.4 3.9 4.2
June
3.4 3.3 3.1 4.2 4.6
4.4 3.1 2.7 3.6 2.5
2.3 2.9 2.8 2.3 2.8
3.4 4.2 3.1 2.7 3.1
14.5 5.7 3.3 5.S
11.1
46 30.5 20 8.5 4.2
Total run-off
Million gallons
153 115 125 72.4 236 40.9
3,380
83.4 21.9 361 387 519 213
2,320
Acre-feet
470 352 384 222 723 126
10,380
856 67
1,080 1,190 1,690
654
7,110
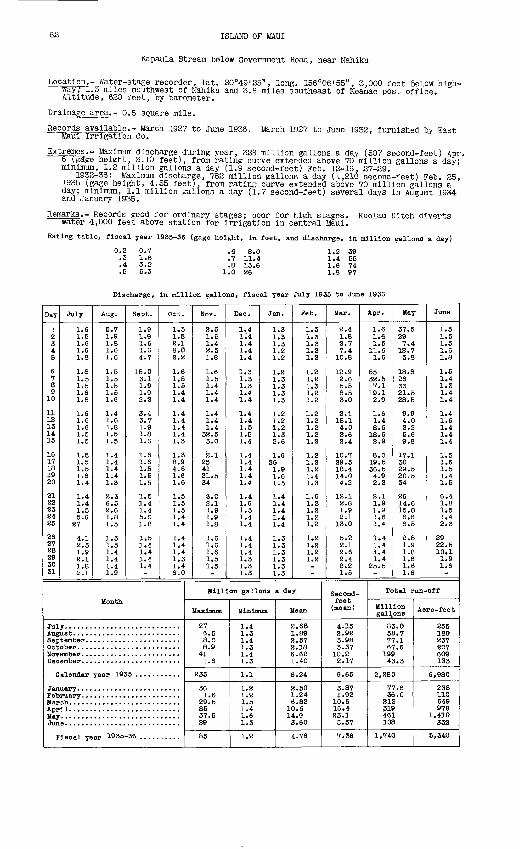
62 ISLAND OF MAUI
Kapaula Stream below Government Road, near Nahiku
Location.- Water-stage recorder, lat. 20049 I 25", long. 156°06'55", 3,000 feet Below high way; 1.3 miles southwest of Nahiku and 3.8 miles southeast of Keanae post office. Altitude, 620 feet, by barometer.
Drainage area.- 0.5 square mile.
Records available.- March 1927 to June 1936. March 1927 to June 1932, furnished by East TauT Irrigation Co.
Extremes.- Maximum discharge during year, 328 million gallons a day (507 second-feet) Apr. eTgage height, 3.10 feet), from rating curve extended above 70 million gallons a day; minimum, 1.2 million gallons a day (1.9 second-feet) Feb. 12-16, 27-29.
1932-36: Maximum discharge, 782 million gallons a day (1,210 second-feet) Feb. 25, 1935 (gage height, 4.55 feet), from rating curve extended above 70 million gallons a day; minimum, 1.1 million gallons a day (1.7 second-feet) several days In August 1934 and January 1935.
Remarks.- Records good for ordinary stages; poor for high stages. Koolau Ditch diverts water 4,000 feet above station for Irrigation In central Maul.
Rating table, fiscal year 1935-36 (gage height. In feet, and discharge, In million gallons a day)
0.2 0.7 .6 8.0 1.2 39 .3 1.6 .7 11.4 1.4 55 .4 3.2 .8 15.6 1.6 74 .5 5.3 1.0 26 1.8 97
Discharge, In million gallons, fiscal year July 1935 to June 1936
Day
1 2 3 4 5
6 7 8 9
10
11 12 13 14 15
16 17 18 19 20
21 22 23 24 25
26 27 28 29 30 31
July
1.6 1.5 1.6 1.6
1.81.5 1.5
1.8
1.6
1.5 1.5
1.5 1.5 1.5 1.6 1.4
1.4 1.4 1.5 5.6
27
4.1 2.5
2.1 1.8 2.1
Aug.
5.7 1.9 1.8 1.6
1.5 1.5 1.5
1.6
1.6
1.5 1.5
1.4 1.4 1.4 1.4 1.3
2.3 6.5 2.61.8 1.5
1.5 1.5
1.4 1.4 1.9
Sept.
1.9 1.9 1.6 1.6
18.0 3.1 1.9
2.2
3.7
1.8 1.6
1.6 1.6 1.5 1.5 1.5
1.5 1.4 1.4 5.0 1.8
1.5 1.4
1.4 1.4
Oct.
1.31.5
8.0
1.6 1.5 1.5
1.4
1.4
1.4 1.3
1.3 8.9 4.61.6 1.6
1.5 1.5 1.5 1.4 1.4
1.4 1.4
1.3 1.4 6.0
Month
Jul Aug Sep Oct HOT Dec
C
Jan Pet) Mar Apr May Jun
F
ember. .......................
alendar year 1935 ...........
u
e. ...........................
Iscal year 1935- 36 ..........
Nov.
2.51.5
2.3
1.6 1.5 1.4
1.4
1.4
32.5 3.0
2.1 25 41 21.5 34
3.0 2.1 1.9 1.9 1.8
1.61.6
1.5 1.5
Dec.
1.4
1.4
1.3 1.3 1.3
1.4
1.4
1.5 1.4
1.4 1.4 1.4 1.4 1.4
1.4 1.6 1.5 1.4 1.4
1.4 1.4
1.3 1.3 1.3
Jan.
1.31.3
1.2 1 2
1.2 1.3 1.3
1.3
1.2
1.3 2.6
1.6 3& 1.91.6 1.5
1.4 1.4 1.4 1.4 1.4
1.3 1.3
1.3 1.31.3
Feb.
1.3 1.3
1.2
1.2 1.21.3
1.2
1.2
1.2 1.2
1.2 1.2 1.2 1.4 1.3
1.6 1.3 1.2 1.2 1.2
1.2 1.2
1.2
Million gallons a day
Maximum
27 6.5
18.0 8.9
41 1.6
235
36 1.6
29.5 85 37.5 29
85
Minimum Mean
1.4 2.68 1.3 1.89 1.4 2.57 1.3 2.18 1.4 6.62 1.3 1.40
1.1 6.24
.2 2.50
.2 1.24
.5 6.82
.4 10.6
.6 14.9 1.3 3.60
1.2 4.76
Mar.
2.41.8
7.4
12.9 2.6 5.5 8.5 3.0
18.1
2.6 2.4
10.7 29.5 18.4 14.0 4.2
12.1 2.8 1.9 2.1
13.0
5.2 2.1
2.4 2.21.5
Second- feet (mean)
Apr.
1.6 1.6
11.6
85 32.5 17.1 19.1 2.9
1.4 8.6
18.6 2.9
8.0 19.5 36.5 4.9 2.2
2.1 1.9 1.9 1.6 1.4
1.4 1.4
1.4 25.5
May
37.5 29 7.4 12.7
18.8 26 33 21.5 28.5
9.9 4.0 2.2 5.6 9.8
17.1 30
2o'.5 34
26 14.6 15.0 6.6 6.5
2.81.9
1.6 1.6 1.6
June
1.5 1.5 1.5 1.6
1.5 1.4 1.3 1.4 1.4
1.4 1.6 1.4 1.4 1.4
1.5 1.6 1.5 1.4 1.5
6.4 1.8 1.5 1.4 2.3
29 22.5 10.1 1.9 1.6
Total run-off
"I"10" Acre-feet gallons
4.15 83.0 255 2.92 58.7 180 3.98 77.1 237 3.37 67.6 207
10.2 199 609 2.17 43.3 133
9.65 2,280 6,980
3.87 77.6 238 1.92 36.0 110
10.6 21E 649 16.4 319 978 23.1 461 1,410 5.57 108 332
7.36 1,740 5,340
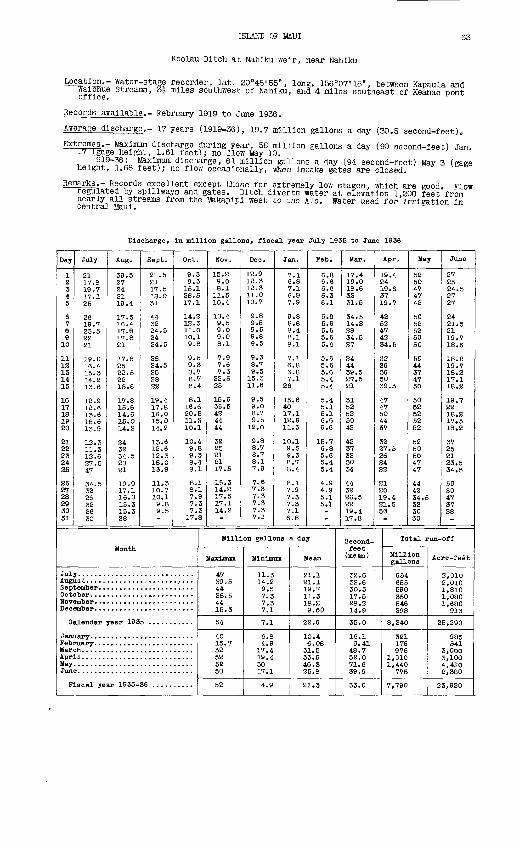
ISLAND OF MAUI
Koolau Ditch at Nahilcu weir, near Nahilcu
63
Location.- Water-stage recorder, lat. 20°48'55", long. 156°07'15", between Kapaula and ffalohue Streams, 3J miles southwest of Nahilcu, and 4 miles southeast of Keanae post office.
Records available.- February 1919 to June 1936.
Average discharge.- 17 years (1919-36), 19.7 million gallons a day (30.5 second-feet).
Extremes.- Maximum discharge during year, 58 million gallons a day (90 second-feet) Jan. 17 (gage height, 1.61 feet); no flow May 10.
1919-36: Maximum discharge, 61 million gallons a day (94 second-feet) May 3 (gage height, 1.68 feet); no flow occasionally, when Intake gates are closed.
Remarks.- Records excellent except those for extremely low stages, which are good. Flow regulated by spillways and gates. Ditch diverts water at elevation 1,200 feet from nearly all streams from the Makapipi west to the Alo. Water used for irrigation in central Maul.
Dlscliarge, In million gallons, fiscal year July 1935 to June 1936
Day
1 2 34 5
6 7e9
10
11 12 13 14 15
16 IV 18 19 20
21 22 23 24 25
26 27 28 29 30 31
July
2117.8 19.7 17.1 25
26 19.7 23.5 22 21
19.016.4 15.3 14.2 13.6
12.9 12.6 13.6 18.6 13.9
12.3 11.3 12.6 27.5 47
34.5 32 26 32 26 30
Aug.
39.5 27 24 21 19.4
17.5 16.4 17.8 17.8 21
17.8 25 22.5 22 18.6
17.8 15.6 14.6 15.0 14.2
24 32 34.5 28 21
19.0 17.1 16.0 15.3 15.3 28
Sept.
21.5 21 17.5 18.0 31
44 32 24.5 24 24.5
28. 24.5 25 28 22
19.4 17.8 16.0 15.0 14.2
13.6 12.6 12.3 18.0 13.9
11.3 10.7 10.1 9.8 9.5
Oct.
9.3 9.3 15.1 28.5 17.1
14.2 12.3 11.0 10.1 9.8
9.5 9.38.7 8.7 8.4
8.1 16.6 20.5 11.3 10.1
10.4 9.8 9.38.4 8.1
8.1 8.1 7.9 7.3 7.3 17.8
Month
Jul Augi Sep Dot HOT Dec
C
Jan Feb Mar Apr" May Jun
F
alendar year 193
Iscal year 1935-
Nov.
15.2 9.0 8.1
11.5 10.4
10.4 9.5 9.0 9.0 8.1
7.9 V.6 7.3 22.5 25
15.6 35.5 42 44 44
32 25 21 21 17.5
15.3 14.2 17.5 17.1 14.2
Dec.
12.9 12.3 12.311.0 10.7
9.8 9.5 9.5 9.8 9.5
9.3 8.7 9.5 15.3 11.6
9.5 9.0 8.7 9.5 12.0
9.8 8.7 8.7 8.1 7.9
7.6 7.3 7.3 7.3 7.3 7.1
Jan.
7.1 6.8 7.1 6.8 7.9
9.8 9.8 8.4 8.1 8.1
7.1 6.8 6.8 7.1
26
15.6 40 17.1 12.9 11.3
10.1 9.5 9.38.7 8.4
8.1 7.9 7.3 7.3 7.1 6.8
Feb.
6.8 6.6 6.6 6.3 6.1
5.9 5.9 5.6 5.6 5.6
5.6 5.6 5.6 5.4 5.4
5.4 5.1 5.1 6.6 6.6
15.7 6.8 5.6 5.4 5.4
4.9 4.9 5.1 5.1
Million gallons a day
Maximum
47 39.5 44 28.5 44 15.3
54
40 15.7 52 52 52 50
52
Minimum
11.3 14.2 9.5 7.3 7.3 7.1
7.1
6.8 4.9
17.4 19.4 30 17.1
4.9
Mean
21.1 21.1 19.7 11.3 18.2 9.60
22.6
10.4 6.08 31.5 33.6 46.3 25.8
21.3
Mar.
17.4 19.0 18.6 32 31.5
34.5 14.2 28 34.5 27
24 44 39.5 27.5 21
31 52 52 50 42
42 3V 32 30 34
44 32 26.5 22 19.4 17.8
Apr.
19.4 24 19.6 3V 19.7
42 52 47 42 34.5
32 26 36 50 39.5
47 47 50 44 3V
32 27.5 26 24 22
21 20 19.4 21.5 50
Second- feet (mean)
32.6 32.6 30.5 17.5 28.2 14.9
35.0
16.1 9.41
48. V 52.0 71.6 39.9
33.0
May
52 50 4V 4V 42
50 52 52 50 50
50 44 3V 47 50
50 52 52 52 52
52 50 50 47 4V
44 42 34.5 32 30 30
June
27 25 24.5 27 27
24 21.5 21 19. V 18.6
18.2 19.7 18.2 17.1 18.2
19. V 22 18.2 17.5 18.2
3V 25 21 23.5 34.5
50 50 47 37 28
Total run-off
Million gallons
654 655 590 350 546 298
8,240
321176 976
1,010 1,440
775
V.790
Acre-feet
2,010 2,010 1,810 1,080 1,680 913
25,290
985 541
3,000 3,100 4,410 2,380
23,920
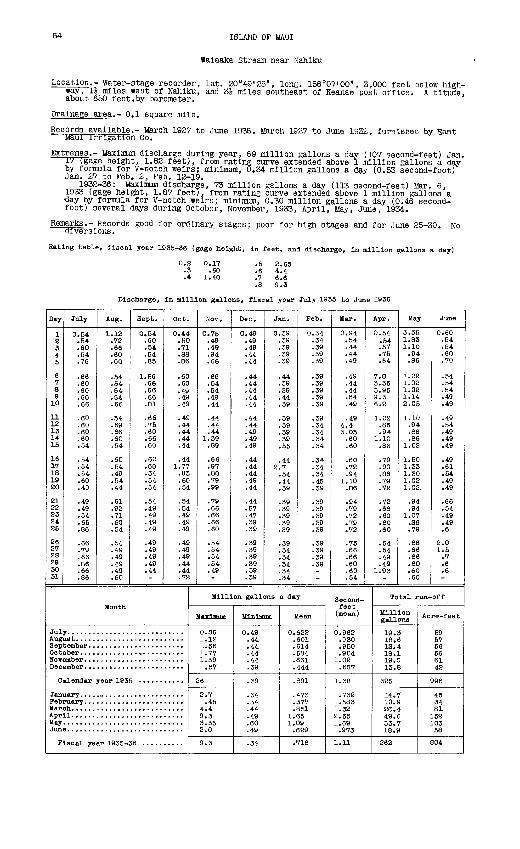
64 ISLAND OF mm
Walaaka Stream near Nahlku
Location.- Water-stage recorder, lat. 20°49'25", long. 156°07'00", 3,000 feet below high way, 1£ miles west of Nahlku, and 3£ miles southeast of Keanae post office. Altitude, about 650 feet,by barometer.
Drainage area.- 0.1 square mile.
Records available.- March 1927 to June 1936. March 1927 to June 1932, furnished by East Maul Irrigation Co.
Extremes.- Maximum discharge during year, 69 million gallons a day (107 second-feet) Jan. 17 (gage height, 1.82 feet), from rating curve extended above 1 million gallons a day by formula for V-notch weirs; minimum, 0.34 million gallons a day (0.53 second-foot) Jan. 27 to Feb. 2, Feb. 12-19.
1932-36: Maximum discharge, 73 million gallons a day (113 second-feet) Mar. 6, 1933 (gage height, 1.87 feet), from rating curve extended above 1 million gallons a day by formula for V-notch weirs; minimum, 0.30 million gallons a day (0.46 second- foot) several days during October, November, 1933, April, May, June, 1934.
Remarks.- Records good for ordinary stages; poor for high stages and for June 25-30. No aiversions.
Rating table, fiscal year 1935-36 (gage height. In feet, and discharge, In million gallons a day)
0.2 .3 .4
0.17.60
1.40
2.65 4.4
Discharge, in million gallons, fiscal year July 1935 to June 1936
Day
1 2 3 4 5
6 7 8 9
10
11 12 13 14 15
16 17 18 19 20
21 22 23 24 25
26 27 2S 29 30 31
July
0.54 .54 .60 .54 .76
.66
.60
.60
.60
.66
.60
.60
.60
.60
.54
.54
.54
.54
.60
.49
.49
.49
.54
.65
.86
.66
.79
.66
.86
.66
.86
Aug.
1.12 .72 .66.60 .60
.54
.54
.54
.54
.66
.54
.69
.66
.60
.54
.60
.54
.49
.54
.44
.61
.92
.71
.60
.54
.54
.49
.49
.49
.49
.60
Sept.
0.54 .60 .54 .54 .85
1.56 .66 .66 .66 .81
.66
.75
.60
.66
.60
.60
.60
.54
.54
.54
.54
.49
.49
.49
.49
.49
.49
.49
.49
.44
Oct.
0.44 .50 .71 .88 .86
.60
.60
.49 .49 .49
.49
.44
.44
.44
.44
.44 1.77
.83
.60
.54
.54
.54
.49
.49
.49
.49
.49
.49
.44
.44
.72
Month
Jul Augi Sep Get Nor Dee
C
Jan Fob Mar Apr May Jun
F
alendar year 193
Laeal year 1935-
Nov.
0.75 .49 .49.94 .66
.66
.54
.54
.49
.44
.44
.44
.44 1.39
.89
.66
.97
.80
.79
.99
.79
.66
.66
.66
.60
.54
.54
.54
.54
.49
Dec.
0.49 .49 .49.44 .44
.44
.44
.44
.44
.44
.44
.44
.49
.49
.49
.44
.44
.44
.49
.44
.44
.57
.47
.39
.39
.39
.39
.39
.39
.39
.39
Jan.
0.39 .39 .39 .39 .39
.44
.39
.39
.44
.39
.39
.39
.39
.39
.55
.44 2.7
.54
.44
.39
.39
.39
.39
.39
.39
.39
.34
.34
.34
.34
.34
Feb.
0.34 .34 .39 .39 .39
.39
.39
.39
.39
.39
.39
.34
.34
.34
.34
.34
.34
.34
.45
.39
.39
.39
.39
.39
.39
.39
.39
.39
.39
Million gallons a day
Maximum
O.S6 1.12 1.56 1.77 1.39
.57
26
2.7.45
4.4 9.3
2.0
9.3
Minimum
0.49 .44 .44 .44 .44 .39
.39
.34
.34
.44
.49
.60
.19
.31
Mean
0.622 .601 .614 .584 .6S1 .444
.691
.473
.377
.851 1.65 1.09
.629
.716
Mar.
0.94 .54 .44 .44 .49
.49
.44
.44
.54
.49
.49 4.4 3.05
.60
.60
.60
.72
.94 1.10
.86
.94
.79
.72
.79
.72
.75
.66
.66
.60
.60
.54
Second- feet
(mean)
0.962 .930 .950 .904
1.02 .637
1.38
.732
.583 1.32 2.55 1.69
.973
1.11
Apr.
0.54 .54 .57 .75 .54
7.3 3.35 3.95 9.3 6.2
1.02 .86.94
1.10 .36
.79
.90
.86
.79
.72
.72
.66
.60
.60
.60
.54
.54
.49
.49 1.93
May
3.35 1.83 1.10
.94
.36
1.02 1.02 1.02 1.14 2.05
1.10 .94 .86 .86
l.OS
1.50 1.33 1.30 1.02 1.02.
.94
.94 1.07
.86
.79
.66
.66
.66
.60
.60
.60
June
0.60 .54 .54 .60 .70
.54
.54
.54
.49
.49
.49
.54
.49
.49
.49
.49
.61
.54
.49
.49
.66
.54
.49
.49
.6
2.0 1.5
.7
.6
.6
Total run-off
Million gallons
19.3 18.6 IS. 4 18.1 19. S 13.8
325
14.7 10.9 26.4 49.6 33.7 18.9
262
Acre-feet
59 57 56 56 61 42
996
45 34 81
152 103
58
304
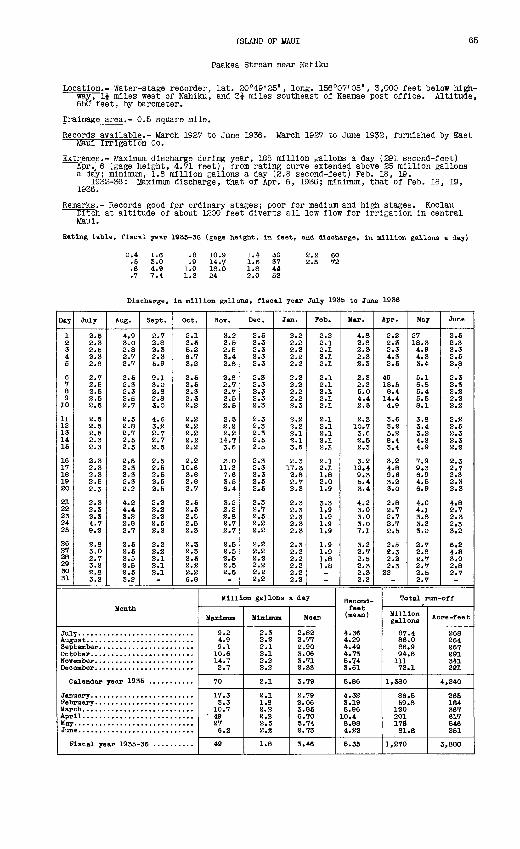
ISLAND OF MAUI
Paakea Stream near Nahlku
65
Location.- Water-stage recorder, lat. 20°49'25", long. 156°07'05", 3,000 feet below high way, 1J miles west of Nahiku, and 3J miles southeast of Keanae post office. Altitude, 65CT feet, by barometer.
Drainage area.- 0.5 square mile.
Records available.- March 1927 to June 1936. March 1927 to June 1932, furnished by East Maul Irrigation Co.
Extremes.- Maximum discharge during year, 188 million gallons a day (291 second-feet) Apr., 6 (gage height, 4.71 feet), from rating curve extended above 25 million gallons a day; minimum, 1.8 million gallons a day (2.8 second-feet) Feb. 18, 19.
1932-36: Maximum discharge, that of Apr. 6, 1936; minimum, that of Feb. 18, 19, 1936.
Remarks.- Records good for ordinary stages; poor for medium and high stages. Koolau Ditch at altitude of about 1200 feet diverts all low flow for irrigation in central Maui.
Rating table, fiscal year 1935-36 (gage height, in feet, and discharge, in million gallons a day)
0.4 1.6.5 3.0.6 4.9.7 7.4
Discharge,
.8 10.9
.9 14.71.0 18.01.2 24
1.4 301.6 371.8 442.0 52
2.2 2.5
6072
In million gallons, fiscal year July 1935 to Juniie 1936
Day
1 2 3 46
6 7 8 9 10
11 12 13 14 15
16 17 18 19 20
21 22 23 24 25
26 27 28 29 30 31
July
2.5 2.3 2.6 2.3 2.8
2.7 2.5 2.5 2.5 2.5
2.5 2.5 2.5 2.3 2.3
2.3 2.3 2.3 2.5 2.3
2.3 2.3 2.3 4.7 9.2
2.8 3.0 2.7 3.2 2.8 3.2
Aug.
4.9 3.0 2.8 2.7 2.7
2.5 2.3 2.3 2.5 2.7
2.5 2.8 2.7 2.5 2.5
2.5 2.3 2.3 2.3 2.2
4.2 4.4 3.2 2.8 2.7
2.5 2.5 2.5 2.5 2.5 3.2
Sept.
2.7 2.8 2* 3 2.3 5.9
9.1 3.0 2.8 2.8 3.0
4.6 3.2 2.7 2.7 2.5
2.5 2.5 2.5 2.5 2.5
2.2 2.2 2.2 2.5 2.2
2.2 2.2 2.1 2.1 2.1
Oct.
2.1 2.3 5.2 6.7 3.2
2.5 2.5 2.3 2.3 2.2
2.2 2.2 2.2 2.2 2.2
2.2 10.6 3.8 2.8 2.7
2.5 2.5 2.5 2.5 2.3
2.3 2.3 2.3 2.2 2.2 6.8
Month
Jul Aug Sep Got HOT Dec
C
Jan Fob liar Apr May Jun
F
alandar year 193
iscal year 1935-
HOT.
3 2 s'.5 2.5 3.4 2.8
2.8 2.7 2.7 2.5 2.5
2.5 2.2 2.2 14.7 3.6
.3.0 11.2 7.6 3.5 6.4
3.2
2\B 2.7 2.7
2.5 2.5 2.5 2.5 2.5
Dec.
2.5 2.3 2.3 2.3 2.3
2.3 2.3 2.3 2.3 2.3
2.3 2.3 2.3 2.5 2.5
2.3 2.3 2.3 2.5 2.5
2.3 2.7 2.5 2.2 2.2
2.2 2.2 2.2 2.2 2.2 2.2
Jan.
2.2 2.2 2.2 2.2 2.2
2.2 2.2 2.2 2.2 2.3
Z.Z 2.2 2.1 2.1 3.6
2.3 17.3 2.8 2.7 2.3
2.3 2.3 2.3 2.3 2.3
2.3 2.2 2.2 2.2 2.2 2.2
Feb.
2.2 2.1 2.1 2.1 2.1
2.1 2.1 2.X 2.1 2.1
2.1 2.1 2.1 2.1 2.1
2.1 2.1 1.8 2.0 1.9
3.3 1.9 1.9 1.9 1.9
1.9 1.9 1.8 1.8
Million gallons a day
Maximum
9.2 4.9 9.1 10.6 14.7 2.7
70
17.3 3.3
10.7 49 27 6.2
49
Minimum
2.3 2.2 2.1 2.1 2.2 2.2
2.1
2.1 1.8 2.2 2.2 2.5 2.2
1.8
Mean
2.82 2.77 2.90 3.06 3.71 2.33
3.79
2.79 2.06 3.85 6.70 5.74 2.73
3.46
Mar.
4.8 2.8 2.3 2.3 2.3
2.3 2.2 5.0 4.4 2.5
2.3 10.7 3.6 2.5 2.3
3.2 10.4 9.3 5.4 3.4
4.2 3.0 3.0 3.0 7.1
3.2 2.7 2.5 2.3 2.3 2.2
Apr.
2.2 2.3 2.3 4.3 2.5
49 18.5 8.4 14.4 4.9
3.6 3.2 5.2 8.4 3.4
3.2 4.8 9.6 3.2 3.0
2.8 2.7 2.7 2.7 2.5
2.5 2.3 2.2 2.3
22
Second- feet
(mean)
4.36 4.29 4.49 4.73 5.74 3.61
5.86
4.32 3.19 5.96 10.4 8.88 4.22
5.36
May
27 18.3 4.9 4.3 3.4
5.1 6.B 5.4 5.5 8.1
3.8 3.4 3.2 4.2 4.9
7.9 9.3 6.9 4.5 6.9
4.C 4.1 3.8 3.2 3.0
2.7 2.8 2.7 2.7 2.5 2.7
June
2.5 2.3 2.3 2.5 2.8
2.3 2.3 2.2 2.2 2.2
2.2 2.5 2.3 2.3 2.2
2.3 2.7 2.3 2.3 2.3
4.8 2.7 2.3 2.3 3.2
6.2 4.8 3.0 2.8 2.7
Total run-off
Million gallons
87.4 86.0 86.9 94.8 111 72.1
1,380
86.5 59.8 120 201 178 81.8
1,270
Acre-feet
268 264 267 291 341 221
4,240
265184 367 617 546 251
3,880
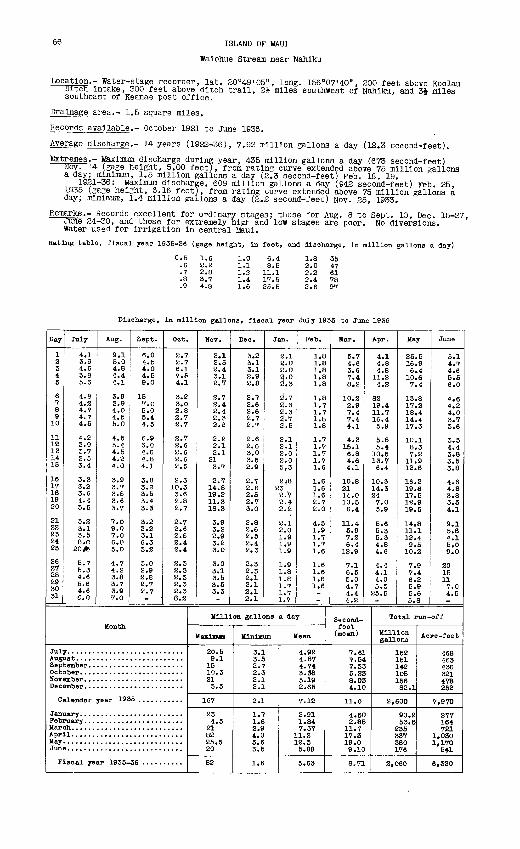
ISLAND OF MAUI
Waiohue Stream near Nahiku
Location.- Water-stage recorder, lat. 20°49'05", long. 156°07'40", 200 feet above Koolau Ditch intake, 300 feet above ditch trail, 2£ miles southwest of Nahiku, and 3* miles southeast of Keanae post office.
Drainage area.- 1.5 square miles.
Records available.- October 1921 to June 1936.
Average discharge.- 14 years (1922-36), 7.92 million gallons a day (12.3 second-feet).
Extremes.- Maximum discharge during year, 435 million gallons a day (673 second-feet) Nov. 14 (gage height, 5.00 feet], from rating curve extended above 75 million gallons a day; minimum, 1.5 million gallons a day (2.3 second-feet) Feb. 18, 19.
1921-36: Maximum discharge, 609 million gallons a day (942 second-feet) Feb. 25, 1935 (gage height, 6.16 feet), from rating curve extended above 75 million gallons a day; minimum, 1.4 million gallons a day (2.2 second-feet) Nov. 25, 1933.
Remarks.- Records excellent for ordinary stages; those for Aug. 8 to Sept. 10, Dec. 15-27. June 24-30, and those for extremely high and low stages are poor. No diversions. Water used for irrigation in central Maul.
Rating table, fiscal year 1935-36 (gage height, in feet, and discharge, in million gallons a day)
1.6 2.2 2.8 3.7
1.01.11.2 1.4 1.6
8.611.117.525.5
1.8 2.0 2.2 2.4 2.6
3647617897
Discharge, in million gallons, fiscal year July 1936 to June 1936
Day
1 2 3 4 5
6 7 8 9 10
11 12 13 14 16
16 17 18 19 20
21 22 23 24 25
26 27 28 29 30 31
July
4.1 3.9 4.6 3.8 5.6
4.8 4.2 4.7 4.7 4.5
4.2 3.9 3.7 3.5 3.4
3.3 3.2 3.6 4.4 3.6
3.2 3.1 3.6 8.6
20 JE
6.7 5.3 4.6 5.6 4.6 C.O
Aug.
9.1 5.0 4.8 4.4 4.1
3.9 3.9 4.0 4.5 5.0
4.5 5.4 4.5 4.2 4.0
3.9 3.73.5 3.6 3.7
7.0 9.0 7.0 6.0 5.0
4.7 4.2 3.8 3.7 3.9 7.0
Sept.
6.0 4.5 4.0 4.5 9.0
16 7.0 6.0 5.4 4.5
6.96.0 4.6 4.8 4.1
3.8 3.6 3.6 3.4 3.3
3.2 3.2 3.1 6.3 3.2
3.0 2.9 2.8 2.7 2.7
Oct.
2.7 2.7 6.1 7.6 4.1
3.2 3.02.8 2.7 2.7
2.7 2.6 2.62.6 2.5
2.6 10.3 3.6 2.8 2.7
2.7 2.6 2.5 2.4 2.4
2.3 2.3 2.3 2.3 2.3 8.2
Month
Jul Augi Sep Oct NOT Dec
C
Jan Feb liarApr May Jun
F
slender year 192 5 ...........
.seal year 1935-
Nov.
3.12.6 2.4 3.1 2.7
2.7 2.4 2.4 2.3 2.2
2.2 2.1 2.1
213.7
2.7 14.8 19.2 11.3 18.3
3.9 3.2 2.9 3.2 3.0
3.0 3.1 3.6 3.6 3.3
Dec.
3.2 3.1 3.1 2.9 2.8
2.7 2.6 2.6 2.7 2.7
2.6 2.6 3.0 3.6 2.9
2.7 2.6 2.5 2.7 3.0
2.8 2.6 2.5 2.4 2.3
2.3 2.3 2.1 2.1 2.1 2.1
Jan.
2.1a.o2.02.0
d.v a. 62.32.7 2.5
2.1 2.1 2.0 2.05 t 3
248 23 2.7 2.4 2.2
1 2.1 2.0 1.9 1.9 1.9
1.9 1.8 1.8 1.7 1.7 1.7
Feb.
1.8 1.8 1.8 1.8 1.8
1.8 1.7 1.7 1.8 1.8
1.7 1.7 1.7 1.7 1.6
1.6 1.6 1.6 2.7 2.0
4.5 1.9 1.7 1.7 1.6
1.6 1.6 1.6 1.6
Million gallons a day
Maximum
20.6 9.1
16 10.3 21 3.6
167
23 4.5
21 82 25.5 20
82
Minimum
3.1 3.5 2.7 2.3 2.1 2.1
2.1
1.7 1.6 2.9 4.0 5.6 3. ,6
1.6
Mean
4.92 4.87 4.74 3. 36 5.19 , 2.65
7.12
2.91 1.84 7.67
11.2 12.3 6.68
5.63
Mar.
5.7 4.6 3.6 7.4 8.2
10.2 2.9 7.4 7.4 4.1
4.3 15.1 6.8 4.6 4.1
10.8 21 14.0 10.5 6.4
11.4 5.9 7.2 6.4
12.9
7.1 6.6 5.0 4.7 4.4 4.2
Apr.
4.14.8 4.8
11.2 4.2
82 19.4 11.7 16.4 5.9
5.8 5.4 10.6 13.7 6.4
10.3 14.3 24 7.0 5.9
5.6 6.3 6.3 4.8 4.6
4.4 4.1 4.0 5.5
25.5
Second- feet (mean)
7.61 7.64 7.33 5.23 8.03 4.10
11.0
4.50 2.85
11.7 17.3 19.0 9.10
8.71
May
25.6 16.9 6.4
10.6 7.4
13.8 17.2 18.4 14.4 17.3
10.1 8.3 7.2 11.9 12.6
16.2 19.6 17.6 12.9 19.5
14.8 11.1 12.4 9.5 10.2
7.9 7.4 6.2 5.9 5.6 5.8
June
5.14.7 4.6 5.5 6.0
4.6 4.2 4.0 3.7 3.6
3.5 4.4 3.8 3.6 3.8
4.6 4.8 3.8 3.6 4.1
9.1 5.8 4.1 5.0 9.0
20 15 117.0 4.5
Total run-off
Million gallons
162 161 142 105 156 82.1
2,600
90.2 53.5
235 337 380 176
2,060
Acre-feet
468 463 436 321 478 258
7,970
277 164 721
1,030 1,170
541
6,320
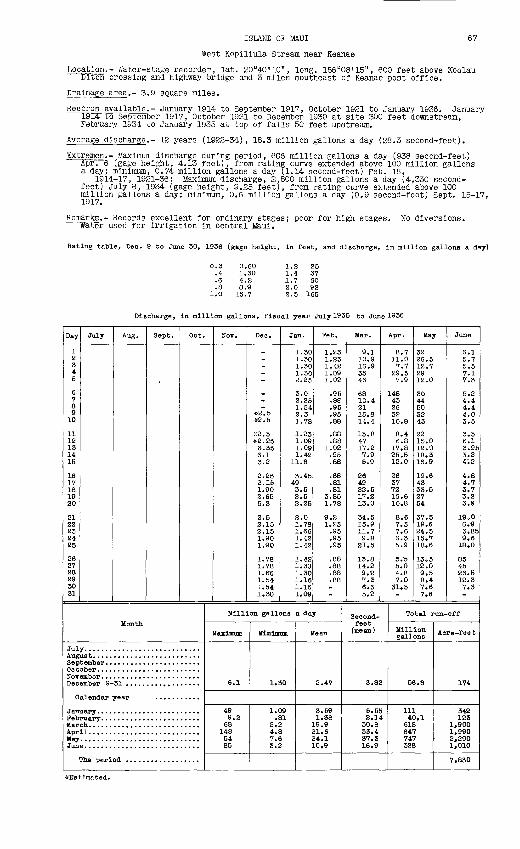
ISLAND OF MAUI 67
West Koplllula Stream near Keanae
Location.- Water-stage recorder, lat. 20°40'10", long. 156°08'15", 600 feet above Koolau Ditch crossing and highway bridge and 3 miles southeast of Keanae post office.
Drainage area.- 3.9 square miles.
Records available.- January 1914 to September 1917, October 1921 to January 1936. January 1914 to September 1917, October 1921 to December 1930 at site 300 feet downstream, February 1934 to January 1935 at top of falls 50 feet upstream.
Average discharge.- 12 years (1922-34), 18.3 million gallons a day (28.3 second-feet).
Extremes.- Maximum discharge during period, 606 million gallons a day (938 second-feet) Apr. 6 (gage height, 4.13 feet), from rating curve extended above 100 million gallons a day; minimum, 0.74 million gallons a day (1.14 second-feet) Fete. 18.
1914-17, 1921-36: Maximum discharge, 2.800 million gallons a day (4,330 second- feet) July 8, 1934 (gage height, 9.25 feet], from rating curve extended above 100 million gallons a day; minimum, 0.6 million gallons a day (0.9 second-foot) Sept. 15-17, 1917.
Remarks.- Records excellent for ordinary stages; poor for high stages. No diversions. "Water used for Irrigation in Central Maul.
Rating table, Dec. 9 to June 30, 1936 (gage height, in feet, and discharge, in million gallons a day)
0.601.304.2
1.2 1.4 1.7 2.0
2537
Discharge, in million gallons, fiscal year July 1935 to June 1936
Day
1 2 3 4 5
6 7 8 9 10
11 12 13 14 15
16 17 18 19 20
21 22 23 24 25
26 27 28 29 30 31
July Aug. Sept. Oct.
Month
Jul Augi Sep Oct NOT Dec
C
Jan Feb Mar Apr May Jun
Briber 9-31 ..................
alendar year
11...........................
The peri
Nov. Dec.
»2.5 »2.5
#2.5 #2.25 3.356.1 3.2
2.25 2.15 1.90 2.65 5.3
2.5 2.15 2.15 1.90 1.90
1.78 1.78 1.66 1.54 1.54 1.30
Jan.
1.30 1.30 1.30 1.30 2.25
3.0 2.25 1.54 2.3 1.78
1.23 1.09 1.09 1.42
11.8
3.45 49 3.5 2.5 2.25
2.0 1.78 1.66 1.42 1.42
1.42 1.30 1.30 1.16 1.16 1.09
Peb.
1.23 1.231.42 1.09 1.02
.95
.86
.95
.95
.88
.88
.88 1.02 .95 .88
.88
.81
.81 3.85 1.78
9.2 1.23 .95 .95 .95
.88
.88
.88
.88
Million gallons a day
Maximum
6.1
49 9.2
68 148 54 85
Mil*..
1.30
1.09 .81
5.2 4.8 7.6 3.2
Mean
2.47
3.59 1.38 19.9 21.6 24.1 10.9
Mar.
9.1 10.9 16.9 35 46
68 10.4 21 15.8 14.4
15.8 47 17.2 7.9 5.9
2649 22.5 17.2 13.0
34.5 15.9 11.7 9.8 21.5
13.8 14.2 9.2 7.3 6.3 5.2
Apr.
8.7 11.0 7.7
29.57.9
148 43 26 32 10.8
8.4 6.8
17.8 25.5 12.0
26 3772 16,6 10.8
8.6 7.3 7.6 6.3 5.9
5/5 5.0 4.8 7.0 31.5
Second- feet
(mean)
3.82
5.55 2.14 30.8 33.4 37.3 16.9
May
3226.5 12.7 29 12.0
30 44 50 32 43
22 15.0 12.0 18.3 16.9
19.6 43 33.5 27 54
37.5 19.6 24.5 15.7 18.6
13.5 12.0 9.5 8.4 7.6 7.6
June
6.1 5.7 5.5 7.1 7.3
5.24.4 4.4 4.0 3.5
3.5 6.1 3.95 3.2 4.2
4.8 4.V 3.V 3.2 3.9
19.0 6.9 3.85 9.6
18.0
85 45 26.5 12.3 7.3
Total run-off
Million gallons
56.8
111 40.1
618 647 747 328
Acre-feet
174
342 123
1,900 1,990 8,290 1,010
7,830
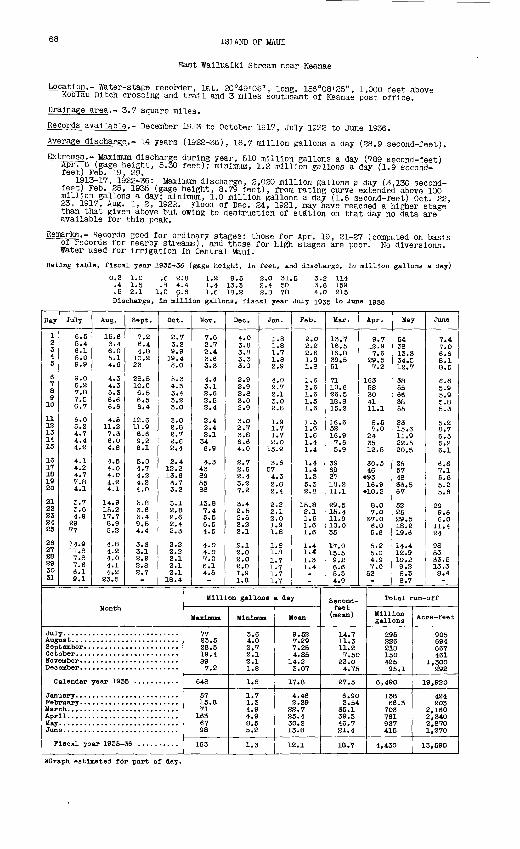
ISLAND OF MAUI
East Wallualkl Stream near Keanae
Location.- Water-stage recorder, lat. 20°49'05", long. 156°08'25", 1,000 feet above Koolau Ditch crossing and trail and 3 miles southeast of Keanae post office.
Drainage area.- 3.7 square miles.
Records available.- December 1913 to October 1917, July 1928 to June 1936.
Average discharge.- 14 years (1922-36), 18.7 million gallons a day (28.9 second-feet).
Extremes.- Maximum discharge during year, 510 million gallons a day (789 second-feet) Apr. 6 (gage height, 5.30 feet); minimum, 1.2 million gallons a day (1.9 second- £66"t / FSD 19 f 29
1913-17, 1922-36: Maximum discharge, 2,020 million gallons a day (3,130 second- feet) Feb. 25, 1935 (gage height, 8.79 feet), from rating curve extended above 100 million gallons a day; minimum, 1.0 million gallons a day (1.6 second-feet) Oct. 22, 23, 1917, Aug. 1, 2, 1922. Flood of Dec. 24, 1921, may have reached a higher stage than that given above but owing to destruction of station on that day no data are available for this peak.
Remarks.- Records good for ordinary stages: those for Apr. 19, 21-27 (computed on basis of records for nearby streams), and those for high stages are poor. No diversions. Water used for Irrigation In Central Maul.
Rating table, fiscal year 1935-36 (gage height, in feet, and discharge, in million gallons a day)
0.3 1.0 .6 2;8 1.2 9.5 2.0 31.5 3.2 114 .4 1.5 .8 4.4 1.4 13.3 2.4 50 3.6 159 .5 2.1 1.0 6.6 1.6 18.2 2.8 78 4.0 215 Discharge, In million gallons, fiscal year July 1935 to June 1933
Day
1 2 3 4 5
6 7 8 9 10
11 12 13 14 15
16 17 18 19 20
21 22 23 24 25
26 27 28 29 30 31
July
6.5 5.4 6.1 5.0 9.9
9.0 6.27.8 7.5 6.7
6.0 5.2 4.7 4.4 4.2
4.1 4.2 4.7 7.8 4.1
3.7 3.6 4.9
29 77
14.9 11.8 7.8 7.6 6.1 9.1
Aug.
15.6 6.4 6.0 5.1 4.C
4.3 4.3 5.3 6.6 6.6
4.6 11.2 7.3 6.0 4.8
4.5 4.0 4.0 4.2 4.1
14.9 15.2 17.7 8.9 5.2
4.8 4.2 4.0 4.1 4.2
23.5
Sept.
7.2 6.4 4.8
10.2 23
28.5 10.0 6.5 6.5 6.4
12.6 11.9 6.6 9.2 6.1
5.0 4.7 4.2 4.2 4.0
3.8 3.6 3.4 9.5 4.4
3.3 3.1 2.92.8 2.7
Oct.
2.7 3.2 9.9 19.4 5.0
5.3 4.3 3.4 3.2 3.0
3.0 2.8 2.7 2.6 2.4
2.4 12.2 13.6 3.7 3.2
3.1 2.8 2.6 2.4 2.3
2.2 2.2 2.1 2.1 2.1
18.4
Month
Jul Aug Sep Oct Hov Dec
C
Jan Fetf MarApr May Jun
F
alendar year 193
iacal year 1935-
Hov.
7.6 2.7 2.4 3.6 3.3
4.4 3.1 2.6 2.5 2.4
2.4 2.4 2.1 34 6.9
4.3 43 89 5588
13.8 7.4 5.5 6.5 4.5
4.0 4.07.0 6.14.5
Dec.
4.0 3.8 3.8 3.3 3.0
2.9 2.9 2.8 3.0 2.9
3.0 2.7 3.8 6.6 4.0
2.7 2.6 2.4 3.27.2
3.4 2.5 2.5 2.2 2.1
2.1 2.0 2.0 2.0 1.9 1.8
Jan.
1.8 1.8 1.7 1.8 2.9
4.0 2.7 2.1 3.02.8
1.9 1.7 1.7 2.0
15.9
3.6 57 4.3 2.8 2.4
2.22.1 2.0 1.9 1.8
1.8 1.8 1.7 1.7 1.7 1.7
Feb.
2.0 2.22.6 1.9 1.8
1.6 1.6 1.6 1.5 1.6
1.5 1.6 1.6 1.4 1.4
1.4 1.4 1.3 5.3 2.8
15.8 2.1 1.6 1.6 1.6
1.4 1.41.3 1.4
Million gallons a day
Maximum
77 23.5 28.519.4 897.2
648
57 15.8 71
163 67 98
163
Minimum
3.6 4.0 2.7 2.1 2.1 1.8
1.8
1.7 1.3 4.9 4.9 8.5 5.2
1.3
Mean
9.52 7.29 7.25 4.85
14.2 3.07
17.8
4.46 2.29
22.7 25.4 30.2 13.8
12.1
Mar.
13.7 16.5 16.8 39.551
71 10.6 26.5 18.8 15.2
16.6 52 16.9 7.6 5.9
39 69 27 18.2 11.1
29.5 15.4 11.9 10.0 35
17.0 15.5 9.2
5\5 4.9
Apr.
9.7 12.9 7.6 29.5 7.2
163 58 30 41 11.1
8.5 7.0 24 35 12.5
30.5 46
*93 16.9 »10.2
8.0 7.0 »7.0 6.0 5.6
5.2 5.0 4.9 7.0
52
Second- feet (mean)
14.7 11.3 11.2 7.50
22.0 4.75
27.5
6.90 3.54
35.1 39.3 46.7 21.4
18.7
May
54 38 13.3 34.5 12.7
38 55 66 38 55
2315.6 11.9 22.5 20.5
25 57 48 33.5 67
52 25 29.5 18.2 19.6
14.4 12.9 10.2 9.2 8.5 8.7
June
7.4 7.0 6.6 8.1 8.5
6.6 5.9 5.9 5.8 5.3
5.2 8.7 6.5 5.2 6.1
6.6 7.1 5.6 5.2 5.6
299.6 6.0
11.4 24
98 53 33.5 13.38.4
Total run-off
,. JT ~!!n Acre -feet gallons
295 905 226 694 218 667 150 461 425 1,300 95.1 2'92
6,490 19,920
138 424 66.3 203
703 2,160 761 2,340 937 2,870 415 1,270
4,430 13,590
aGraph estimated for part of day.
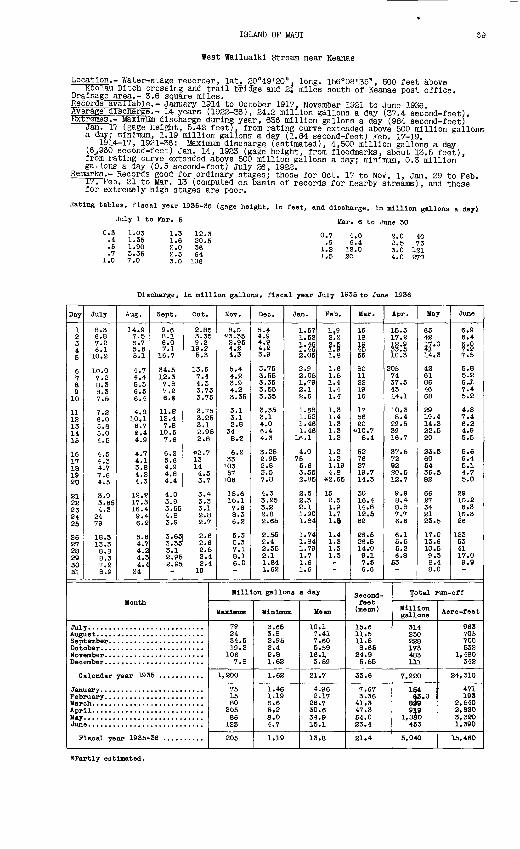
ISLAND OF 11AUI 69
West Wallualkl Stream near Keanae
Location.- Water-stage recorder, lat. 20°49'20", long. 156 008'35", 500 feet aboveKooTau Ditch crossing and trail bridge and 2f miles south of Keanae post office.
Drainage area.- 3.6 square miles.Records available.- January 1914 to October 1917, November 1921 to June 1936. Aygrage flTscharge.- 14 years (1922-36), 24.2 million gallons a day (37.4 second-feet). actremes.- Maximum discharge during year, 636 million gallons a day (984 second-feet)
Jan- IV (gage height, 5.42 feet), from rating curve extended above 500 million gallonsa day; minimum, 1.19 million gallons a day (1.84 second-feet) Feb. 17-19.
1914-17, 1921-36: Maximum discharge (estimated), 4,500 million gallons a day(6^960 second-feet) Jan. 14, 1923 (gage height, from floodmarks, about 13.5 feet).from rating curve extended above 500 million gallons a day; minimum, 0.3 milliongallons a day (0.5 second-foot) July 26, 1922.
Remarks.- Records good for ordinary stages; those for Oct. 17 to Nov. 1, Jan. 29 to Feb.17, Feb. 21 to Mar. 13 (computed on basis of records for nearby streams), and thosefor extremely high stages are poor.
Rating tables, fiscal year 1935-36
July 1 to Mar. 5
ge height, in feet, and discharge, in million gallons a day)
Mar. 6 to June 30
0.3 .4 .5 .7
1.0
1.031.351.903.357.0
1.3 1.6 2.0 2.5 3.0
12.320.536 1.2
1.5
4.06.4
12.020
2.0 2.5 3.0 4.0
73121270
Discharge, In million gallons, fiscal year July 1935 to June 1936
Bay
1 S 3 4 5
6 7a9 10
11 12 13 14 15
16 17 18 19 20
21 22 23 24 25
26 27 28 29 30 31
July
8.3 6.8 7.2 6.1 10.2
10.0 7.2 8.3 8.3 7.5
7.2 6.0 5.8 5.0
4.5 4.3 4.77.6 4.5
3.9 3.65 4.3
24 79
18.3 13.3 8.8 8.3 7.2 8.9
Aug.
14.9 7.5 6.7 5.6 5.1
4.7 4.4 5.3 6.5 6.4
4.8 10.1 6.7 6.4
4.7 4.1 3.8 4.2 4.3
18.2 17.3 16.4 9.4 6.2
5.6 4.7 4.2 4.3 4.4
24
Sept.
9.6 8.1 6.0 7.1
16.7
34.5 12.3 7.8 7.2 6.6
11.8 12.4 7.8 10.5
6.2 5.64.9 4.84.4
4.0 3.9 3.55 4.8 3.9
3.65 3.35 3.1 8.95 2.95
Oct.
2.85 3.35 9.2 19.2 5.3
13.6 7.4 4.3 3.75 3.75
3.75 3.25 3.1 2.95
*2.7 13 14 4.5 3.7
3.4 3.3 3.1 2.8 2.7
2.6 2.6 2.5 2.4 2.4
19
Month
Jul Aug Sep Dot NOT Bee
C
Jan Fob Mar Apr Bay Jun
P
alendar year 193
ia.cal year 1935-
Nov.
8.0 *3.35 2.95 4.2 4.3
5.4 4.2 3.9 4.2 3.35
3.1 3.1 2.8
34
6.2 33 103 57
106
18.6 10.1 7.6 8.3 6.2
5.3 5.3 7.1 8.1 6.0
Bee.
5.4 4.9 4.9 4.2 3.9
3.75 3.55 3.35 3.55 3.35
3.35 3.1 4.0 6.4 4.3
3.25 2.95 2.8 3.57.8
4.3 3.25 3.2 2.8 2.65
2.55 2.4 2.35 2.1 1.84 1.62
Jan.
1.57 1.52
i:!i2.05
2.9 2.05 1,79 2.1 2.6
1.68 1.52 1.46 1.46
16.1
4.0 75 5.6 3.55 2.85
2.5 2.32.1 1.90 1.64
1.74 1.84 1.79 1.7 1.6 1.6
Feb.
1,9 2.2
i!s1.6 1.5 1.4 1.4 1.4
1.3 1.4 1.3 1.3 1.2
1.2 1.2 1.19 4.8
*2.65
15 2.5 1.9 1.7 1.5
1.4 1.3 1.3 1.3
Million gallons a day
Maximum
79 24 34.5 19.2
106 7.8
1,200
75 15 80
205 86
123
205
Minimum
3.65 3.8 2.95 2.4 2.8 1.62
1.62
1.46 1.19 6.6 5.2 8.0 4.7
1.19
Mean
10.1 7.41 7.60 5.59
16.1 3.59
21.7
4.96 2.17
26.7 30.6 34.9 15.1
13.8
Mar.
16 18
11 56
80 11 22 19 16
17 56 20
*10.7 8.4
52 76 27 19.7 14.3
30 16.4 14.8 12.5 62
26.5 26.5 14.0 9.1 7.5 6.6
Apr.
15.3 17.2
3§.i10.3
205 74 37.5 43 14.1
10.3 8.4 29.5 39 16.7
37.5 72 92 20.5 12.7
9.9 8.4 8.8 7.7 6.6
6.1 5.5 5.2 6.8
53
Second- feet (mean)
15.6 11.5 11.8 8.65
24.9 5.55
33.6
7.67 3.36
41.3 47.3 54.0 23.4
21.4
May
65 42H-°14.3
42 61 86 46 68
29 19.4 14.3 22.5 20
23.5 60 54 36.5 82
66 27 34 21 23.5
17.0 13.6 10.5 9.3 8.4 8.0
June
6.9 6.4
9:87.5
5.8 5.2 6. 1 7.4 5.2
4.8 7.4 6.2 4.9 5.5
5.6 6.4 5.1 4.7 5.0
29 10.2 6.3
1S.3 26
123 53 41 17.0 9.9
Total run-off
*H^°° Acre-feet gallons
314 963 230 705 228 700 173 532 483 1, 480 111 348
7,920 24,310
154 471 93.0 193
829 2,540 919 2, 820
1, 08D 3, 320 453 1, 390
5,040 15,460
Partly estimated.
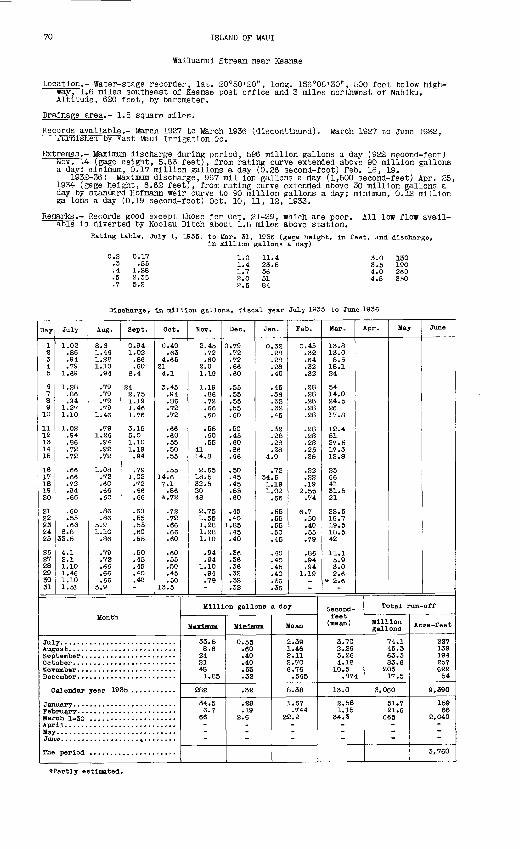
70 ISLAND OF
Wailuanui Stream near Keanae
Location.- Water-stage recorder, lat. 20°50'20", long. 156°08'30", 500 feet below high way, 1.6 miles southeast of Keanae post office and 3 miles northwest of Nahiku. Altitude, 620 feet, by barometer.
Drainage area.- 1.8 square miles.
Records available.- March 1927 to March 1936 (discontinued), furnished by ^ast Maul Irrigation Co.
March 1927 to June 1932,
Extremes.- Maximum discharge during period, 596 million gallons a day (922 second-feet) Nov. 14 (gage height, 5.63 feet), from rating curve extended above 90 million gallons a day; minimum, 0.17 million gallons a day (0.26 second-foot) Feb. 18, 19.
1932-36: Maximum discharge, 967 million gallons a day (1,500 second-feet) Apr. 25, 1934 (gage height, 6.62 feet), from rating curve extended above 30 million gallons a day by standard Hofmann weir curve to 90 million gallons a day; minimum, 0.12 million gallons a day (0.19 second-foot) Oct. 10, 11, 12, 1933.
Remarks.- Records good except those for Oct. 21-29, which are poor. aBIe is diverted by Koolau Ditch about 1.5 miles above station.
All low flow avail-
Rating table, July 1, 1935, to Mar. 31, 1936 (gage height, in feet, in million gallons a day)
and discharge
0.17.55
1.282.355.2
1.0 1.4 1.7 2.0 2.5
11.423.536
3.0 1303.5 1904.0 2604.5 350
Discharge, In million gallons, fiscal year July 1935 to June 1936
Day
1 2 3 4 5
6 7 8 9
10
11 12 13 14 15
16 17 18 19 20
21 22 23 24 25
26 27 28 29 30 31
July
1.02 .86 .94 .79
1.69
1.28 .86 .94
1.27 1.10
1.02 .94 .86 .72 .72
.66
.66
.72
.94
.66
.60
.55
.66 8.8
33.5
4.1 2.1 1.10 1.46 1.10 1.51
Aug.
8.6 1.46 1.28 1.10 .94
.79
.79
.79
.79 1.46
.79 1.26 .94 .92 .72
1.08 .72 .60 .66 .60
.86
.86 5.9 1.10 .86
.79
.72
.66
.66
.66 5.9
Sept.
0.94 1.02 .86 .60
8.4
24 2,75 1.19 1.46 1,76
3.15 5.0 1.10 1.19 .94
.79 1.02 .72 .66 .66
.60
.55
.55
.60
.55
.50
.45
.45
.40
.40
Oct.
0.40 .63
4.65 21 4.1
3.45 .94 .86 .72 .72
.66
.60
.55
.50
.55
.55 14.6 7.1 .86
*.72
.72
.72
.66
.66
.60
.60
.55
.50
.45
.50 13.5
Month
Jul Aug Sep Oct NOT Dec
C
Jan Feb Mar Apr May Jun
The
ember ........................
alendar year 1935 ...........
uarrruarvOh 1-30Jn
e. .................. ». .......
period
Nov.
2.45 .72 .60
2.0 1.19
1.19 .86 .72 .66 .60
.55
.60
.55 41 14.8
2.65 18.5 32.5 20 48
2.75 1.55 1.28 1.28 1.10
.94
.94 1.10 .94 .79
Dec.
0.79 .72 .72 .66 .60
.55
.55
.55
.55
.60
.50
.45
.60
.86
.66
.50
.45
.45
.55
.60
.45
.40 1.85 .45 .40
.36
.36
.36
.32
.32
.32
Jan.
0.32 .28 .28 .28 .40
.45
.36
.32
.32
.45
.32
.28
.28
.28 4.0
.72 34.5 1.19 1.02 .66
.55
.55
.55
.50
.45
.40
.40
.45
.40
.36
.36
Feb.
0.45 .32 .64 .32 .32
.28
.28
.28
.28
.28
.28
.28
.28
.25
.25
.22
.22
.19 2.55 .74
6.7 .50 .40 .55 .79
.86
.94
.94 1.19
Million gallons a day
Maximum
33.5 8.6
24 21 48 1.85
282
34.5 6.7
66
Minimum Mean
0.55 2.39 .60 1.46 .40 2.11 .40 2.70 .55 6.76 .32 .565
.32 8.38
.28 1.67
.19 .744 2.6 22.2
Mar.
13.8 13.0 8.5
18.1 24
54 14.0 24.5 26 17.8
12.4 51 27.5 17.3 12.8
23 66 41 31.5 21
22.5 19.7 19.5 18.5 42
11.1 5.9 3.0 2.6
* 2.6
Apr.
Second- feet (mean)
3.70 2.26 3.26 4.18
10.5 .874
13.0
2.58 1.15
34.3
May June
Total run-off
M1"10" Acre-feet gallons
74.1 227 45.3 139 63.3 194 83.6 257
203 622 17.5 54
3,060 9,390
51.7 159 21.6 66
665 2,040
3,760
*Partly estimated.
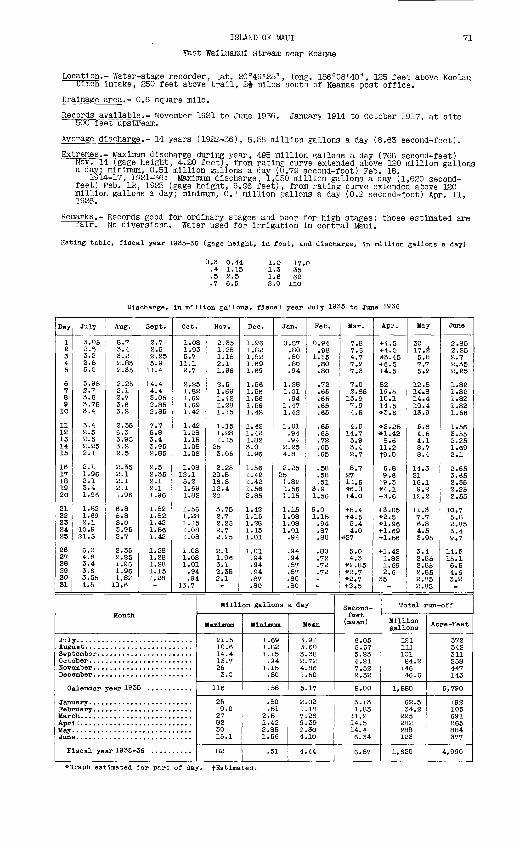
ISLAND OF MUI
East Walluanul Stream near Keanae
71
Location.- Water-stage recorder, lat. 20°49 t 25", long. 156°08'40", 125 feet above Koolau Ditch Intake, 250 feet above trail, 24 miles south of Keanae post office.
Drainage area.- 0.6 square mile.
Records available.- November 1921 to June 1936. January 1914 to October 1917, at site 500 feet upstream.
Average discharge.- 14 years (1922-36), 5.58 million gallons a day (8.63 second-feet).
Extremes.- Maximum discharge during year, 495 million gallons a day (766 second-feet) Nov. 14 (gage height, 4.20 feet), from rating curve extended above 120 million gallons a day; minimum, 0.51 million gallons a day (0.79 second-foot) Feb. 18.
1914-17, 1921-36: Maximum discharge, 1,050 million gallons a day (1,620 second- feet) Feb. 12, 1925 (gage height, 6.96 feet), from rating curve extended above 120 million gallons a day; minimum, 0.1 million gallons a day (0.2 second-foot) Apr. 11, 1926.
Remarks.- Records good for ordinary stages and poor for high stages: those estimated are fair. No diversions. Water used for Irrigation in central Maul.
Rating table, fiscal year 1935-36 (gage height, In feet, and discharge, in million gallons a. day)
0.3 0.44.4 1.15.5 2.5.7 6.5
1.0 17.01.3 351.6 622.0 110
Discharge, in million gallons, fiscal year July 1935 to June 1936
Day
1 2 3 4 5
6 7 8 9
10
11 12 13 14 15
16 17 18 19 20
21 22 23 24 25
26 27 28 29 30 31
July
3.05 2.5 3.2 2.5 5.0
3.95 2.7 3.6 3.75 3.4
3.4 2.5 2.5 2.25 2.1
2.1 1.96 2.1 3.4 1.96
1.82 1.69 2.1
10.9 21.5
6.0 4.8 3.4 3.6 3.05 4.5
Aug.
8.7 3.4 3.2 2.85 2.35
2.25
2.7 3.6 3.2
2.35 6.3 3.95 3.2 2.5
2.35 2.1 2.1 2.1 1.96
6.8 5.8a.o3.95 2.7
2.35 2.25 1.96 1.96 1.82
10.6
Sept.
2.7 2.5 2.25 5.9
11.4
14.4
3.05 2.35 2.35
7.7 5.8 3.4 3.95 2.85
2.5 2.35 2.1 2.11.96
1.82 1.82 1.42 1.56 1.42
1.28 1.28 1.28 1.15 1.28
Oct.
1.08 1.93 5.7
11.1 2.7
2.25
1.69 1.69 1.42
1.42 1.28 1.15 1.08 l.OS
1.08 12.1 5.2 1.69 1.82
1.56 1.28 1.15 1.08 1.08
1.08 1.08 1.01
.94
.94 13.7
Month
Jul Augi Sep Oct Hov Dec
C
Jan Fet> Mar Apr May Jun
F
alendar year 193
Lscal year 1935-C 6 ..........
Nov.
2.35 1.28 1.15 2.1 1.96
2.5
1.42 1.28 1.15
1.15 1*28 1.15
25 3.05
2.25 20.5 16.3 12.4 20
3.75 2.7 2.25 2.7 2.25
2.1 1.96 3.1 2.35 2.1
Dec.
1.96 1.82 1.82 1.69 1.69
1.56
1.56 1.56 1.42
1.42 1.42 1.82 3.0 1.96
1.56 1.42 1.42 1.56 2.85
1.42 1.15 1.23 1.15 1.01
1.01 .94 .94 .94 .87 .80
Jan.
0
11
1 1
1
24
2 25
1 11
1 1 1 1
Million gallons
Maximum
21.5 10.6 14.4 13.7 25 3.0
116
25 9.0
27 82 30 15.1
32
Minimum
1.69 1.32 1.15
.94 1.15
.80
.58
.80
.51 2.5 1.42 2.85 1.56
.51
.87
.80
.80
.80
.94
.28
.01
.94
.47
.42
.01
.94
.94
.25
.8
.25
.82
.56
.15
.15
.08
.08
.01
.94
.94 94 37 87 80 80
Feb.
0.94 ,98
1.15 .SO .80
.72
.65
.65
.65
.65
.65
.65
.72
.65
.65
.58
.58
.51 3.9 1.56
9.0 1.15
.94
.87
.80
.80
.72
.72
.72
a day
Mean
3.91 3.60 3.38 2.72 4.86 1.50
5.17
2.02 1.13 7.26 9.39 9.30 4.10
4.44
Mar.
7.8 7.6 4.7 7.2 7.3
7.0 2.85
13.9 7.9 4.5
4.0 14.7 5.9 3.4 2,7
8.7 27 11.6 *6.0 +4.0
+5.4 +4.5 5.4 4.0
*27
5.0 4.3
»2.85 #2.7 *2.7 +2.5
Apr.
+4.5 + 4.0 *3.45 + 8.5 +4.5
82 19.5 10.1 14.5 »3.6
»2.25 *1.42
3.6 11.2 t9.0
6.8 9.5
19.3 »4.1 +3.6
+3.05 *2.5 *1.96 + 1.69 +1.56
+1.4S 1.82 1.69 2.6
35
Second- feet
(mean)
6.05 5.57 5.23 4.21 7.52 2.32
8.00
3.13 1.83
11.2 14.5 14.4 6.34
6.87
May
30 A. 17.4 5.8 7.7 5.2
12.8 14.8 14.4 10.4 13.9
5.6 4.5 4.1 3.7 3.4
14.3 21 16.1 9.2
12.2
11.3 7.7 6.3 4.5 3.95
3.4 2.85 2.85 2.85 2.35 2.85
June
2.85 2.S5 2.7 2.35 2.25
1.82 1.32 1.82 1.82 1.56
1.56 3.55 2.25 1.69 2.1
2.65 3.65 2.35 2.25 2.55
10.7 5.3 2.85 3.4 9.7
14.5 15.1 6.6 4.6 3.2
Total run-off
Million gallons
121 111 101 84.2
146 46.6
1,880
62.5 34.2
225 282 288 123
1,620
Acre-Tee t
372 342 311 258 447 143
5,790
192 105 691 365 884 377
4,990
#Graph estimated for part of day. fEstlmated.
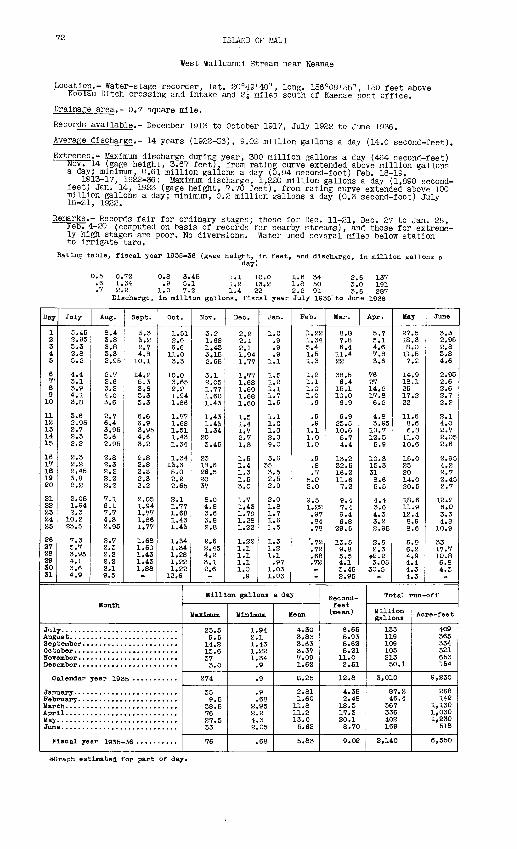
72 ISLAND OF MAUI
West Wailuanui Stream near Keanae
Location.- Water-stage recorder, lat. 20°49'40", long. 156°08'55", 150 feet above Koolau Ditch crossing and Intake and 2i miles south of Kaenae post office.
Drainage area.- 0.7 square mile.
Records available.- December 1913 to October 1917, July 1922 to June 1936.
Average discharge.- 14 years (1922-36), 9.02 million gallons a day (14.0 second-feet).
Extremes.- Maximum discharge during year, 300 million gallons a day (464 second-feet) Nov. 14 (gage height, 3.67 feet), from rating curve extended above million gallons a day; minimum, 0.61 million gallons a day (0.94 second-foot) Feb. 18-19.
1913-17, 1922-36: Maximum discharge, 1,220 million gallons a day (1,890 second- feet) Jan. 14, 1923 (gage height, 7.70 feet), from rating curve extended above 100 million gallons a day; minimum, 0.2 million gallons a day (0.3 second-foot) July
Remarks.- Records fair for ordinary stages; those for Dec. 11-21, Dec. 27 to Jan. 28, Feb. 4-20 (computed on basis of records for nearby streams), and those for extreme ly high stages are poor. No diversions. Water used several miles below station to irrigate taro.
Rating table, fiscal year 1935-36 (gage height, in feet, and discharge, in million gallons aday)
0.5 0.72 0.8 3.45 1.1 10.0 1.6 34 2.6 137 6 1.34 .9 5.1 1.2 13.2 1.8 50 3.0 191 .7 2.2 1.0 7.2 1.4 22 2.2 91 3.6 287
Discharge, in million gallons, fiscal year July 1935' to June 1936
Day
1 2 3 4 5
6 7' 8 9
10
11 12 13 14 15
16 17 18 19 20
21 22 23 24 25
26 27 28 29 30 31
July
3.45 £.95 3.3 2.8 5.£
4.4 3.1 3,94.1 3.8
3.6 2.95 2.7 2.3 £.2
2.3 2.2 £.45 3.8 £.2
2.05 1.94 2.3
10.2 23.5
7.3 5.7 3.95 4.1 3.6 4.9
Aug.
8.4 3.8 3.8 3.3 2.95
2.7 2.6 3.2 4.0 3.6
2.7 6.4 3.95 3.6 2.95
2.8 2.3 2.2 2.2 2,£
7.1 6.1 7.7 4.3 2.95
2.7 2.3 2.2 2.2 2.1 9.5
Sept.
3.3 3.2 £.7 4.8 10.1
14.2 5.3 3.6 3.3 3.3
6.6 6.9 3.95 4.6 3.2
£.8 2.8 2.S 2.3 2.2
2.05 1.94 1.77 1.86 1.77
1.68 1.60 1.43 1.43 1.88
Oct.
1.51 £.6 6.6
11.0 3.3
10.0 3.65 2.2 1.94 1.86
1.77 1.68 1.51 1.43 1.34
1.34 13.6 5.0 2.2 2.65
2.1 1.77 1.68 1.43 1.43
1.34 1.34 1.28 1.22 1.22
12.6
Month
Jul Augi Sep Oct SOT Dec
C
Jan Feb Mar Apr May Jun
P
alendar year 193
11...........................
Iseal year 1935-
Nov.
3.2 1.68 1.43 3.15 £.65
3.1 2.05 1.77 1.60 1.43
1.43 1.43 1.34 20 3.45
23 18.6 26.5 20 37
8.0 4.8 3.6 3.8 £.8
2.6 2.45 4.2 3.1 £.6
Dec.
2.2 2.1 2.11.94 1.77
1.77 1.68 1.60 1.68 1.60
1.5 1.4 1.7 2.7 1.8
1.5 1.4 1.3 1.5 3.0
1.7 1.43 1.79 1.28 1.22
1.22 1.1 1.1 1.1 1.0 .9
Jan.
1.0 .9 .9 .9
1.1
1.5 1.2 1.1 1.7 1.6
1.1 1.0 1.0 2.0 9.0
3.0 35 3.5 2.5 2.0
2.0 1.8 1.7 1.6 1.5
1.31.2 1.1 .97
1.03 1.03
Pet).
1.22 1.34 5.4 1.5 1.3
1.2 1.1 1.0 1.0 .9
.9
.91.1 1.0 1.0
.9
.8
.7 5.0 2.0
9.5 1.22 .97 .84 .78
'.72 .72 .68 .72
Million gallons a day
Maximum
23.5 9.5
14.2 13.6 37 3.0
274
35 9.5 38.5 76 27.5 33
76
Minimum
1.94 2.1 1.43 1.22 1.34 .9
.9
.9
.68 2.95 2.2 4.3 2.05
.68
Mean
4.30 3.83 3.63 3.37 7.09 1.62
8.25
2.81 1.60
11.8 11.2 13.0 5.62
5.83
Mar.
8.8 7.8 6.4
11.4 22
38.5 6.4
15.1 10.0 6.9
6.9 £3.5 10.6 5.7 4.4
13.2 32.5 16.211.6 7.2
9.4 7.4 9.4 6.8
29.5
13.5 9.8 5.5 4.1 3.45 2.95
Apr.
5.7 5.1 4.6 7.8 3.6
76 27 14.2 17.8 6.2
4.8 3.95 10.7 12.5 5.9
10.3 15.3 31 8.6 5.5
4.4 3.6 4.3 3.2 £.95
2.6 2.3
*E.2 3.05
30.5
Second- feet (mean)
6.65 5.93 5.62 5.21
11.0 2.51
12.8
4.35 2.48
18.3 17.3 20.1 8.70
9.02
May
27.518.3 8.0 11.5 7.2
14.9 18.1 25 17.2 22
11.6 8.6 6.8
11.0 10.6
15.0 23 20 14.0 20.5
18.6 11.9 12.4 8.9 8.6
6.8 6.2 4.94.4 4.3 4.3
June
3.S 2.95 £.8 3.8 4.6
2.95 £.6 2.6 2.7 2.£
2.1 4.0 2.7 2.05 2.6
2.95 4.2 2.7 2.45 2.7
12.2 6.0 3.3 4.8
10.9
33 17.7 10.8 6.8 4.3
Total run-off
Million gallons
133 119 109 105 213 50.1
3,010
87.2 46.4
367 336 402 169
2,140
Acre-feet
409 365 334 321 653 154
9,230
268 142
1,130 1,030 1,230
518
6,550
*Graph estimated for part of day.
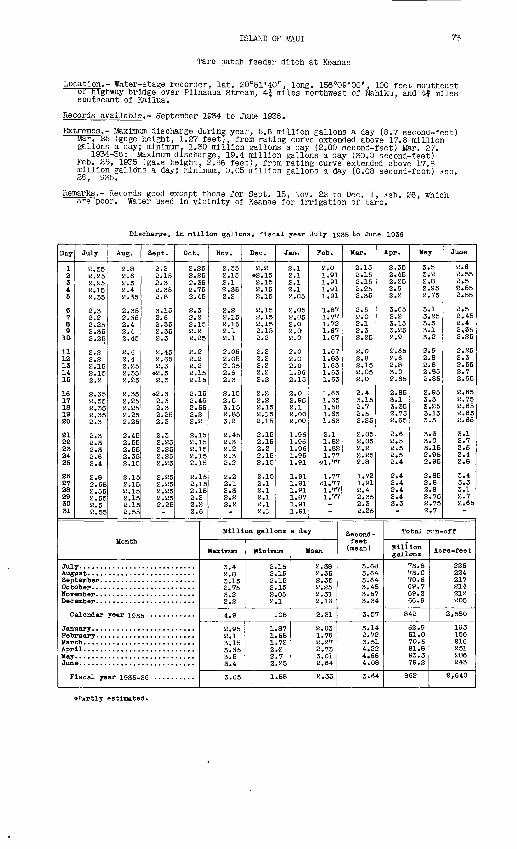
ISLAND OF MA.UI 73
Taro patch feeder ditch at Keanae
Location.- Water-stage recorder, lat. 20°51'40", long. 156°09'00", 100 feet southeast or highway bridge over Piinaaua Stream, 4J miles northwest of Nahiku, and 4? miles southeast of Kailua.
Records available.- September 1934 to June 1936.
Extremes.- Maximum discharge during year, 5.6 million gallons a day (8.7 second-feet) Mar. 25 (gage height, 1.27 feet), from rating curve extended above 17.8 million gallons a day; minimum, 1.30 million gallons a day (2.00 second-feet) Mar. 27.
1934-36: Maximum discharge, 19.4 million gallons a day (30.0 second--?eet) Feb. 25, 1935 (gage height, 2.86 feet), from rating curve extended above 17.8 million gallons a day; ninlmum, 0.05 million gallons a day (0.08 second-foot) Feb. 28, 1935.
Remarks.- Records good except those for Sept. 15, Nov. 22 to Dec. 1, Feb. 26, which are poor. Water used in vicinity of Keanae for irrigation of taro.
Discharge, In million gallo fiscal year July 1935 to June 1936
Day
1 2 34 5
6 7 8 910-
11 12 13 14 15
16 17 18 19 20
21 22 23 24 25
26 27 28 29 30 31
July
2.35 2.25 2.25 2.15 2.35
2.3 2.2 2.25 2.35 2.25
2.2 2.2 2.15 2.15 2.2
2.35 2.35 2.35 2.35 2.3
2.3 2.3 2.3 2.6 3.4
2.8 2.65 2.55 2.55 2.5 2.55
Aug.
2.8 2.6 2.5 2.4 2.35
2.35 2.35 2.4 2.4 2.45
2.4 2.4 2.25 2.35 2.25
2.35 2.25 2.25 2.25 2.25
2.45 2.55 2.55 2.35 2.15
2.15 2.15 2.15 2.15 2.15 2.55
Sept.
2.2 2.15 2.3 2.35 2.8
3.15 2.6 2.35 2.35 2.3
2.45 2.65 2.3
*2.3 2.3
*2.3 2.3 2.3 2.25 2.3
2.3 2.25 2.25 2.25 2.25
2.25 2.25 2.25 2.25 2.25
Oct.
2.25 2.25 2.35 2.75 2.45
2.3 2.2 2.15 2.2 2.25
2.2 2.2 2.2 2.15 2.15
2.15 2.45 2.55 2.2 2.2
2.15 2.15 2.15 2.15 2.15
2.15 2.15 2.15 2.2 2.2 2.5
Month
Jul Aug Sep Oct HOT Dec
C
Jan Feb Mar Apr May Jun
F
alendar year 193
11...........................
Iscal year 1935-
Nov.
2.35 2.15 2.1 2.35 2.2
2.2 2.15 2.15 2.1 2.1
2.05 2.05 2.05 2.6 2.3
2.15 2.5 3.15 2.85 3.2
2.45 2.3 2.2 2.3 2.2
2.2 2.1 2.3 2.2 2.2
Dec.
2.2 *2.15 2.15 2.15 2.15
2.15 2.15 2.15 2.15 2.2
2.2 2.2 2.2 2.2 2.2
2.2 2.2 2.15 2.15 2.15
2.15 2.15 2.2 2.15 2.15
2.15 2.1 2.1 2.1 2.1 2.1
Jan.
2.1 2.1 2.1 2.1 2.05
2.05 2.05 2.0 2.0 2.0
2.0 2.0 2.0 1.96 2.15
2.0 2.95 2.1 2.00 2.00
1.96 1.96 1.96 1.96 1.91
1.91 1.91 1.91 1.87 1.91 1.91
Feb.
2.0 1.91 1.91 1.91 1.91
1.87 1.77 1.72 1.67 1.67
1.67 1.63 1.63 1.63 1.63
1.63 1.63 1.58 1.63 1.63
2.1 1.82 1.82 1.77
*1.77
1.77 *1.77 1.77 1.77
Million gallons a day
Maximum
3.4 2.8 3.15 2.75 3.2 2.2
4.9
2.95 2.1 3.15 3.65 3.5 3.4
3.65
Minimum
2.15 2.15 2.15 2.15 2.05 2.1
.08
1.87 1.58 1.72 2.2 2.7 2.25
1.58
Mean
2.38 2.35 2.35 2.25 2.31 2.16
2.31
2.03 1.76 2.27 2.73 3.01 2.64
2.35
Mar.
2.15 2.15 2.15 2.25 2.35
2.5 2.0 2.1 2.3 2.25
2.0 2.8 2.15 2.05 2.0
2.4 3.15 2.7 2.5 2.25
2.05 2.05 2.2 2.25 2.8
1.72 1.91 2.4 2.35 2.3 2.25
Apr.
2.35 2.45 2.25 2.6 2.2
3.65 3.2 3.15 3.25 2.9
2.65 2.6 2.8 3.0 2.65
2.85 3.1 3.35 2.75 2.65
2.6 2.5 2.5 2.5 2.4
2.4 2.4 2.4 2.4 3.3
Second- feet (mean)
3.68 3.64 3.64 3.48 3.57 3.34
3.57
3.14 2.72 3.51 4.22 4.66 4.08
3.64
May
3.5 3.2 2.8 2.95 2.75
3.1 3.25 3.3 3.1 3.2
2.9 2.8 2.8 2.85 2.85
2.95 3.3 3.25 3.15 3.3
3.3 3.0 3.15 2.95 2.95
2.85 2.8 2.8 2.75 2.75 2.7
June
2.6 2.55 2.5 2.55 2.55
2.5 2.45 2.4 2.35 2.25
2.25 2.3 2.55 2.7 2.65
2.65 2.75 2.65 2.65 2.65
3.1 2.7 2.5 2.4 2.8
3.4 3.3 3.1 2.7 2.65
Total i-.-n-of f
Million gallons
73.8 73.0 70.6 69.7 69.2 66.9
842
62.9 51.0 70.5 81.8 93.3 79.2
862
Acre -feet
226 224 217 214 212 205
2,580
193 156 216 251 286 243
2,640
Partly estimated.
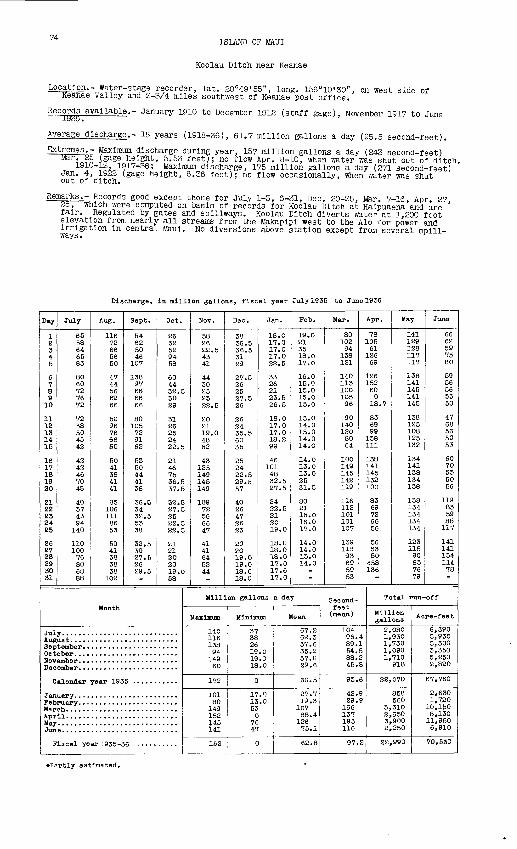
74 ISLAND OF mm
Koolau Ditch near Keanae
Location.- Water-stage recorder, lat. 20°49'55", long. 156°10'30", on west side of Keanae Valley and 2-3/4 miles southwest of Keanae post office.
ReC ?£Sf available.- January 1910 to December 1912 (staff gage), November 1917 to June 1936
Average discharge.- 18 years (1918-36), 61.7 million gallons a day (95.5 second-feet).
Extremes.- Maximum discharge during year, 157 million gallons a day (243 second-feet) Mar. 25 (gage height, 5.53 feet); no flow Apr. 8-10, when water was shut out of ditch.
1910-12, 1917-36: Maximum discharge, 175 million gallons a day (271 second-feet) Jan. 4, 1922 (gage height, 6.36 feet); no flow occasionally, when water was shut out of ditch.
Remagk3 -- Records S°od except those for July 1-3, 3-31, Dec. 20-25, Mar. 7-16, Apr. 27 28 > which were computed on basis of records for Koolau Ditch at Halpuaena and are fair. Regulated by gates and spillways. Koolau Ditch diverts water at 1,200 foot elevation from nearly all streams from the Makapipl west to the Alo Tor power and Irrigation In central Maul. No diversions above station except from several spill ways . K
Discharge, In million gallons, fiscal year July 1935 to June 1936
Day
1 2 3 4 5
6 7 8 9 10
11 12 13 14 15
16 17 18 19 20
21 22 23 24 25
26 27 28 29 30 31
July
65 58 64 65 83
80 60 72 76 72
72 58 50 45 42
42 42 46 70 45
40 37 43 94
140
110 100 76 80 68 88
Aug.
116 72 66 56 50
47 44 56 62 66
50 96 76 66 50
50 41 38 41 41
85 106 111 86 53
50 41 38 38 38
102
Sept.
54 62 50 46
107
138 97 66 66 66
80 105 72 91 62
53 50 44 41 38
36.5 34 32.5 53 38
32.5 30 27.5 26 29.5
Oct.
26 32 52 94 58
60 44 32.5 30 29
31 26 25 24 22.5
21 46 75 36.5 37.5
32.5 27.5 25 22.5 22.5
21 21 20 20 19.0 58
Month
Jul Aug Sep Oct HOT Dec
C
Jan Fob Mar Apr May Jun
F
ember. .......................
alendar year 193
e. ...........................
Iscal year!935-C
Nov.
58 26 22.5 43 41
44 30 25 25 22.5
20 21 19.0 48 62
43 125 149 145 149
109 72 56 66 47
41 41 64 52 44
Dec.
38 36.5 36.5 31 29
27.5 26 25 27.5 26
26 24 35.5 60 35
25 24 22.5 29.5 57
40 26 47 26 23
20 20 19.0 19.0 18.0 18.0
Jan.
18.0 17.0 17.0 17.0 22.5
33 26 21 23.5 26.5
18.0 17.0 17.0 18.2 99
46 101 48 32.5 27.5
24 22.5 21 20 19.0
18.0 18.0 18.0 17.0 17.6 17.0
Feb.
19.0 21 35 18.0 17.0
16.0 15.0 15.0 15.0 15.0
15.0 14.0 15.0 14.0 14.0
14.0 13.0 13.0 25 31.5
80 21 16.0 16.0 17.0
14.0 14.0 13.0 14.0
Million gallons a day
Maximum
140 116 138 94
149 60
172
101 80
149 152 145 141
152
Minimum
37 38 26 19.0 19.0 18.0
0
17.0 13.0 53 0
76 47
0
Mean
67.2 62.3 57.6 35.2 57.0 29,6
60.5
27.7 19.3
107 88.4
126 75.1
62.8
Mar.
80 102 94
138 121
140 113 100 105 96
90 140 120 80 64
100 149 145 142 119
116 112 101 101 107
139 118 93 69 59 53
Apr.
78 105 61
126 69
126 152 60 0 18.7
83 69 99
138111
138 141 145 132 100
83 69 72 66 56
56 53 50-
*58 136
Second- feet (mean)
104 96.4 89.1 54.5 88.2 45.8
93.6
42.9 29.9
166 137 195 116
97.2
May
141 129 128 117 117
138141 145 141 145
138 125 108 125 132
134 141 138 134 138
138 134 134 134 134
123 115 90 83 76 79
June
66 62 59 75 80
5956 56 53 50
47 68 56 50 53
60 70 53 50 56
119 83 59 88 117
141 141 134 114 78
Total run-off
Million gallons
2,080 1,930 1,730 1,090 1,710 918
22,070
858 560
3,310 2,650 3,900 2,250
22,990
Acre -feet
6,390 5,930 5,300 3,350 5,250 2,820
67,760
2,630 1,720 10,150 8,130 11,950 6,910
70,530
frPartly estimated.
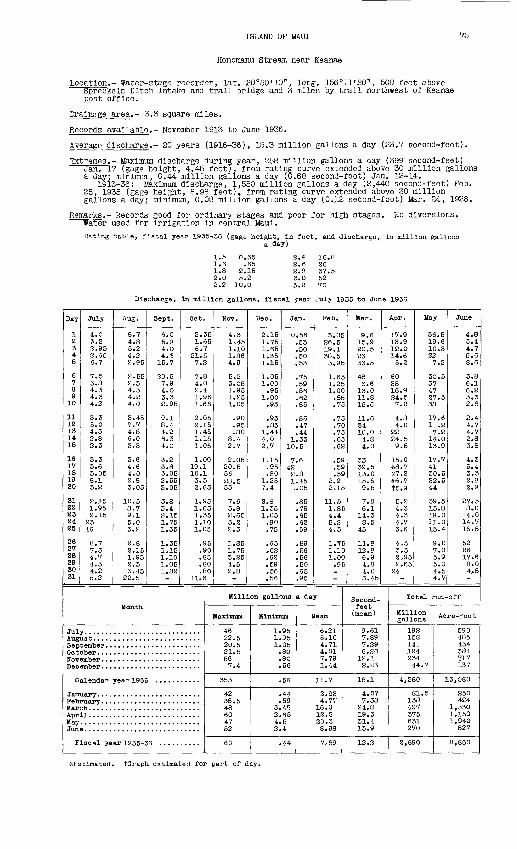
ISLAND OF MAUI 75
Honomanu Stream near Keanae
Location.- Water-stage recorder, lat. 20°50'10", long. 156°11'20", 500 feet above Spreckels Ditch intake and trail bridge and 3 miles by trail northwest of Keanae post office.
Drainage area.- 3.3 square miles.
Records available.- November 1913 to June 1936.
Average discharge.- 20 years (1916-36), 15.3 million gallons a day (23.7 second-feet).
Extremes.- Maximum discharge during year, 258 million gallons a day (399 second-feet) Jan. 17 (gage height, 4.45 feet), from rating curve extended above 30 million gallons a day; minimum, 0.44 million gallons a day (0.68 second-foot) Jan. 12-14.
1913-36: Maximum discharge, 1,580 million gallons a day (2,440 second-feet) Feb. 25, 1935 (gage height, 8.98 feet), from rating curve extended above 30 million gallons a day; minimum, 0.08 million gallons a day (0.12 second-foot) Mar. S4, 1928.
Remarks.- Records good for ordinary stages and poor for high stages. No diversions, mater used for irrigation in central Maul.Rating table, fiscal yea 1935-36 (gage height, in feet, and discharge, in million gallons
a day)
1 5 0.35 2 4 16.8 16 .65 2 6 26 18 2.15 28 37.5 2 0 5.2 30 52 2 2 10.0 32 70
Discharge, In million gallons, fiscal year July 1935 to June 1936
Day
1 2 3 4 5
6 7 8 9 10
11 12 13 14 15
16 17 18 19 20
21 22 23 24 25
26 27 28 29 30 31
July
4.0 3.2 2.95 2.65 6.7
7.5 3.8 4.3 4.3 4.2
3.3 5.0 4.3 2.8 2.3
3.3 3.6 3.05 8.1 3.2
2.15 1.95 2.15
23 46
8.7 7.5 4.7 4.3 4.2 5.2
Aug.
8.7 4.8 5.2 4.2 2.95
2.55 2.3 4.3 4.2 4.0
3.45 7.7 4.8 6.0 3.3
3.6 4.6 4.0 2.8 3.05
10.5 8.7 9.1 5.0 3.2
2.8 2.15 1.95 2.3 3.45
22.5
Sept.
6.0 5.9 4.0 4.315.7
20.5 7.9 4.0 3.3 2.95
9.1 8.4 4.2 6.3 4.0
3.2 3.8 3.05 2.55 3.05
3.8 3.4 2.15 1.75 1.55
1.35 1.15 1.10 1.05 1.82
Oct.
2.35 1.65 6.7
21.5 7.2
7.8 4.0 2.4 1.95 1.65
2.05 2.15 1.451.15 1.05
1.00 19.1 10.1 3.3 2.65
1.95 1.65 1.35 1.10 1.05
.95
.90
.85
.80
.80 11.6
Month
Jul Aug Sep Oct HOT Dec
C
Jan Feb Mar Apr May Jun
F
alendar year 193E
iscal year 1935-;
Nov.
4.3 1.45 1.10 1.86 4.9
5.2 3.05 1.95 1.25 1.05
.90
.95
.80 8.4 2.7
2.05 20.5 56 28.5 53
7.6 3.8 2.65 3.2 2.3
1.85 1.75 3.25 4.5 2.8
Dec.
2.15 1.75 1.65 1.35 1.15
1.05 1.00 .95
1.00 .95
.95
.85 1.44 4.0 2.7
1.15 .95 .80
1.25 7.4
2.6 1.35 1.05 .90 .75
.65
.62
.62
.59
.56
.56
Jan.
0
1 10
7 42 21 1
Million gallons
Maximum
46 22.5 20.5 21.5 56 7.4
353
42 38.5 48 60 47 52
60
Mini*
1.95 1.95 1.05 .80 .80 .56
.56
.44
.59 3.45 2.65 4.5 2.4
.44
.56
.53 50 50 53
75 .59 .56 .62 .85
.56
.47
.44
.33
.5
.6
.8
.45
.05
.85
.75
.65
.62
.59
.59
.56
.56
.50
.65
.95
Feb.
3.05 26.5 19.1 38.5 3.95
1.65 1.25 1.00 .85 .75
.75
.70
.75
.65
.62
.59
.59
.59 2.2 2.15
11.5 1.85 4.4 5.2 4.3
1.75 1.10 1.00 .95
a day
Mean
6.21 5.10 4.71 4.01 7.79 1.44
11.7
2.63 4.77
16.0 12.5 20.3 8.98
7.89
Mar.
9.6 15.9 20.5 B3 33.5
48 6.6
13.0 11.8 15.6
11.6 34 10.0 4.8 4.0
33 39.513.0 15.6 9.5
7.0 6.1 14.3 8.5
45
11.8 12.8 6.9 4.8 4.0 3.45
Second- feet (mean)
Apr.
17.9 13.9 12.0 14.6 5.2
60 35 16.9 24.5 7.2
4.8 4.0
22 24.5 9.5
15.0 *8.7 »7.2 #6.7 t5.9
5.2 4.3 4.3 4.7 3.6
4.5 3.3 2o95 2.65
24
May
36.5 19.6 10.3 22 7.2
30.5 37 47 27.5 38
17.6 11.2 7.2
14.0 13.9
17.7 41 30.5 22.5 44
39.5 13.8 19.0 11.0 15.4
9.0 7.0 5.9 5.6 4.5 4.7
June
4.8 5.4 4.7 5.6 8.6
5.8 6.1 6.2 3.3 2.8
2.4 4.7 4.7 2.8 3.8
4.3 5.4 3.3 2.8 2.9
27.5 8.0 4.0 14.7 16.5
52 26 17.6 8.0 4,8
Total run-off
Million , . gallons Acre-feet
9.61 192 590 7.89 158 485 7.29 141 434 6.20 124 381
12.1 234 717 2.23 44.7 137
18.1 4,260 13,080
4.07 81.5 250 7.38 138 424
24.8 497 1,530 19.3 375 1,150 31.4 631 1,940 13.9 270 827
12.2 2,890 8,860
^Estimated. tGraph estimated for part of day.
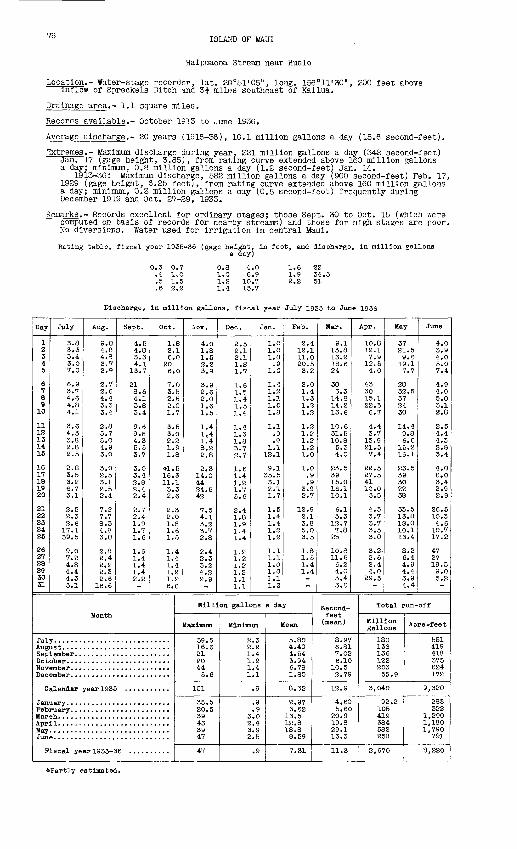
ISLAND OF
Halpuaena Stream near Huelo
Location.- Water-stage recorder, lat. 2Q°51'05", long. 156°11'30", 200 feet above inflow of Spreckels Ditch and 3J miles southeast of Kailua.
Drainage area.- 1.1 square miles.
Records available.- October 1913 to June 1936.
Average discharge.- 20 years (1916-36), 10.1 million gallons a day (15.6 second-feet).
Extremes . - Maximum discharge during year, 221 million gallons a day (342 second-feet) Jan. 17 (gage height, 3.85), from rating curve extended above 160 million gallons a day; minimum, 0.8 million gallons a day (1.2 second-feet) Jan. 14.
1913-36: Maximum discharge, 582 million gallons a day (900 second-feet) Feb. 17, 1929 (gage height, 6.25 feet), from rating curve extended above 160 million gallons a day; minimum, 0.3 million gallons a day (0.5 second-foot) frequently during December 1919 and Oct. 27-29, 1933.
Remarks . - Records excellent for ordinary stages; those Sept. 30 to Oct. 15 (which were computed on basis of records for nearby streams) and those for high stages are poor. No diversions. Water used for irrigation in central Maul.
Rating table, fia al year 1935-36 (gage height, in feet, and discharge, in million gallons a day)
0.3 0.7 0.8 4.0 1.6 22 .4 1.0 1.0 6.9 1.9 34.5 .5 1.5 1.2 10.7 2.2 51 .6 2.2 1.4 15.7
Discharge, In million gallons, fiscal year July 1935 to June 1936
Day
1 2 34 5
6 7 8 9 10
11 12 13 14 15
16 17 18 19 20
21 22 23 24 26
26 27 28 29 30 31
July
3.8 3.3 3.4 3.0 7.0
6.9 3.7 4.6 4.8 4.1
3.6 4.3 3.8 2.8 2.5
2.8 3.5 3.26.7 3.1
2.5 2.3 2.6
17.1 39.5
9.0 7.2 4.8 4.4
5.1
Aug.
9.0 4,8 4.8 3.7 2.9
2.7 2.6 4.4 3.3 3.4
2.8 5.7 5.0 4.9 3.0
3.0 2.5 3.1 2.5 2.4
7.8 7.7 8.3 4.8 3.0
2.8 2.4 2.2 2.3
16.6
Sept.
4.5 4.8 3.3 4.1
13.7
21 8.6 4.1 3.8 3.4
9.6 9.6 4.3 5.5 3.7
3.0 3.4 2.8 2.4 2.4
2.7 2.4 1.9 1.7 1.6
1.6 1.4 1.4 1.4
-
Oct.
1.8 2.1 6.0
20 6.0
7.0 3,5 2.5 2.0 1.7
3.5 3.0 2.3 1.9 1.8
*1.5 16.3 11.1 3.3 2.6
2.32.0 1.8 1.6 1.5
1.4 1.4 1.4 1.2
6.6
Month
Jul Augi Sep Dot Nov Dec
C
Jan Peb HapAprMay Jun
F
alendar year 1935
Iscal year 1935-3
NOT.
4.0 1.8 1.5 2.2 3.9
3.9 2.6 2.0 1.6 1.5
1.4 1.4 1.4 8.2 2.8
2.314.0 44 24.5 42
7.5 4.1 3.2 3.7 2.8
2.4 2.3 3.24.3
-
Dec.
2.5 2.1 2.1 l.S 1.7
1.6 1.5 1.4 1.5 1.4
1.4 1.3 1.8 3.7 2.7
1.6 1.4 1.21.7 5.6
2.4 1.8 1.9 1.4 1.4
1.2 1.2 1.2 1.2
1.1
Jan.
1.0 1.0 1.0 .9
1.0
1.4 1.2 1.1 1.0 1.8
1.1 .9 .9
1.1 12.1
9.1 35.5 3.1 2.1 1.7
1.5 1.4 1.4 1.2 1.2
1.1 1.1 1.0 1.0
1.2
Peb.
2.4 12.1 11.0 20.5 3.2
2.0 1.4 1.31.3 1,3
1.2 1.2 1.2 1.21.0
1.0 .9 .9
3.9 2.7
12.9 2.1 3.8 5.0 3.5
1.8 1.5 1.4 1.4
-
Million gallons a day
Maximum
39.5 16.6 21 20 44 5.6
151
35.5 20.5 39 43 39 47
47
Minimum Mean
2.3 5.80 2.2 4.40 1.4 4.54 1.2 3.94 1.4 6.78 1.1 1.80
.9 8. 32
.9 2.97
.9 3.62 3.0 13.5 2.4 12.8 3.9 18.8 2.5 8.59
.9 7.31
Mar.
9.1 13.8 13.218.6 24
30 6.3
14.8 14.2 13.6
10.6 31.5 10.8 5.3 4.0
23.5 39 15.0 16.1 10.1
6.1 5.3
12.7 7.8
25
10.8 11.5 6.2 4.0
3.0
Apr.
10.8 12.1 7.9
12.5 4.0
43 30 15.1 22.5 6.7
4.4 3.7
15.9 21.5 7.4
22.5 27.5 41 10.0 5.5
4.3 3.7 3.7 3.5 3.0
3.2- 2.6 2.4 4.0 29.5
Second- feet (mean)
8.97 6.81 7.02 6.10
10.5 2.79
12.9
4.60 5.60
20.9 19.8 29.1 13.3
11.3
May
37 21.5 9.6
19.1 7.7
28 32.5 37 24 30
14.4 9.8 6.6
15.2 16.1
23.5 39 30 22 38
33.5 13.8 18.0 10.1 13.4
8.2 6.4 4.9 4.4 3.9 4.4
June
4.0 3.9 4.0 5.0 7.4
4.9 4.0 5.0 3.1 2.8
2.5 4.4 4.3 2.8 3.4
4.0 6.0 3.4 2 9 2^9
26.5 10.3 4.6
10.7 17.2
47 27 19.5 9.0 5.2
Total run-off
"I"011 Acre-feet gallons
180 551 136 419 136 418 122 375 203 624 55.9 172
3,040 9,320
92.2 283 105 322 419 1,290 384 1,180 582 1,790 258 791
2,670 8,220
*Partly estimated.
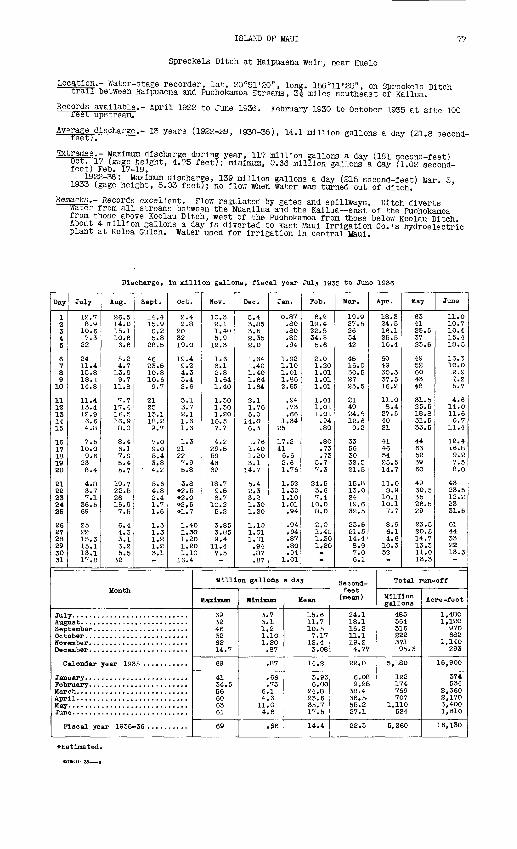
ISLAM) OF MAUI
Spreckels Ditch at Haipuaena weir, near Huelo
. 156°11'25", on Spreckels Ditch miles southeast of Kailua.
February 1930 to October 1935 at site 100
1930-36), 14.1 million gallons a day (21.8 second-
Loc|tion.- Water-stage recorder, lat. 20°51'20", long trail between Haipuaena and Puohokamoa Streams, 3l
Records available.- April 1922 to June 1936. rest upstreamT
Average discharge.- 13 years (1922-2 reet;.
mremes.- Maximum discharge during year, 117 million gallons a day (181 second-feet) °.ct;, 17 (gage height, 4.75 feet); minimum, 0.66 million gallons a day (1.02 second-I66u/ r 6 D« 17 19«
n ry**922'36 \, Maxlmum discharge, 139 million gallons a day (215 second-feet) Mar. 5, 1.V66 (gage height, 5.03 feet); no flow when water was turned out of ditch.
Remarks.- Records excellent. Flow regulated by gates and spillways. Ditch diverts water from all streams between the Nuaailua and the Kailua east of the Puohokamoa from those above Koolau Ditch, west of the Puohokamoa from those below Koolau Ditch. About 4 million gallons a day is diverted to East Maul Irrigation Co.'s hydroelectric plant at Kolea Gulch. Water used for irrigation in central Maul.
Discharge, In million gallons, fiscal year July 1935 to June 1936
Day
1 2 3 4 5
6 7 8 9
10
11 12 1314 15
16 17 18 19 20
21 22 23 24 25
26 27 28 29 30 31
July
12.7 8.9
10.6 7.3
22
24 11.4 15.8 18.1 14.8
11.4 13.4 12.9 6.6 4.8
7.5 10.0 9.6
23 8.4
4.8 3.7 7.1
36.5 69
25 22 15.3 15.1 13.1 17.8
Aug.
26.5 14.0 15.1 10.6 6.6
5.2 4.7
13.9 9.7
11.8
7.7 17.4 16.5 16.9 8.0
8.4 6.1 7.9 5.4 6.7
19.7 22.5 26 15.9 7.5
6.4 4.3 3.1 3.2 5.5
32
Sept.
14.4 15.9 10.2 5.8
28.5
46 23.5 10.8 10.6 9.7
21 25 13.1 18.2 9.7
7.0 9.0 5.4 3.8
4.2
5.6 4.8 2.4 1.7 1.6
1.5 1.3 1.2 1.2 3.1
Oct.
2.4 2.8
20 32 19.0
19.4 9.2 4.3 3.4 2.6
5.1 3.7 2.1 1.6 1.6
1.3 21 22 7.9 5.8
3.8 »2.5 *2.0 *2,5 *1.7
1.40 1.30 1.20 1.20 1.10
16.4
Month
Jul Aug Sep Oct HOT Dec
C
Jan Feb Mar Apr May Jun
F
alendar year 19S
Iscal year 1935-
Nov.
10.3 2.1 1.40 5.9
12.3
11.6 6il 2.8 1.54 1.40
1.30 1.30 1.20 16.5 7.7
4.2 29.5 59 46 62
18.7 9.5 6.7
10.2 5.2
3.85 3.85 9.4
11.4 7.5
Dec.
5.4 3.85 3.5 2.35 2.0
1.64 1.40 1.40 1.64 1.64
2.1 1.76 5.0
14.0 6.3
1.76 1.40 1.20 3.1
14.7
5.4 2.3 3.2 1.30 1.20
1.10 1.01 1.01 .94 .87 .87
Jan.
0.87 .80 .80 .80 .94
1.92 1.10 1.01 1.86 2.65
.94
.73
.66 1.34
25
17.2 41 6.6 2.6 1.76
1.52 1.30 1.10 1.01 .94
.94
.94
.87
.80
.94 1.01
Feb.
6.2 19.4 22.5 34.5 5.6
2.0 1.20 1.01 1.01 1.01
1.01 1.01 1.01 .94 .80
.80
.73
.73 5.7 7.3
24.5 3.6 7.4
10.0 8.0
2.0 1.40 1.30 1.20
Million gallons a day
Maximum
69 32 46 32 62 14.7
69
41 34.5 56 60 63 61
69
Minimum
3.7 3.1 1.2 1.10 1.20 .87
.87
.66
.73 6.1 4.6 11.0 4.6
.66
Mean
15.6 11.7 10.5 7.17
12.4 3.08
14.2
3.93 6.00
24.8 23.6 35.7 17.5
14.4
Mar.
19.9 27.5 26 34 42
45 16.0 30.5 27 25.5
81 49 24.5 12.6 9.2
33 56 30 32.5 21.5
15.8 13.0 24 19.6 32.5
23.5 21.5 14.4 8.9 7.0 6.1
Apr.
18.3 24.5 16.1 25.5 10.4
60 49 30.5 37.5 16.2
11.0 8.4
27.5 40 21
41 46 54 25.514.7
11.0 8.9
10.1 10.1 7.7
8.9 6.1 4.6 10.3 52
Second- feet (mean)
24.1 18.1 16.2 11.1 19.2 4.77
22.0
6.08 9.28
38.4 36.5- 55.2 27.1
22.3
May
63 41 25.5 37 23.5
49 52 60 43 48
31.5 25.5 18.8 31.5 33.5
44 63 52 39 60
49 30.5 35 26.5 29
23.5 20.5 14.7 13.3 11.0 13.3
June
11.0 10.7 10.4 15.4 18.5
13.3 10.0 12.9 7.2 5.7
4.6 14.0 11.6 6.7
11.4
12.4 16.8 9.2 7)5 8.0
43 23.5 12.2 23 31.5
61 44 33 22 13.3
Total run-off
Million gallons
483 364 316 222 371 95.3
5,180
122 174 769 707
1,110 524
5,260
Acre-feet
1,480 1,120
970 6BS
1,140 293
15,900
374 534
2,360 2,170 3,400 1,610
16,130
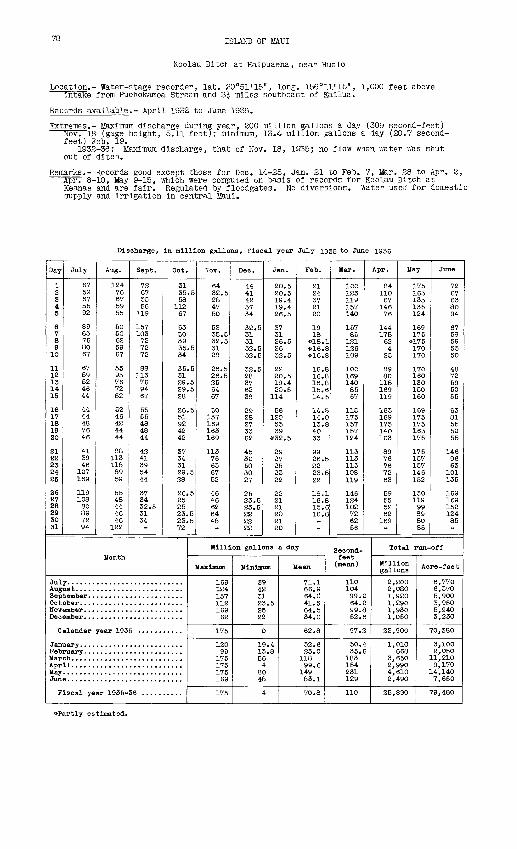
fa ISLAND OF MAUI
Koolau Ditch at Haipuaena, near Huelo
Location.- Water-stage recorder, lat. 20°51'15", long. 156°11'15", 1,000 feet above intake from Puohokamoa Stream and 5J miles southeast of Kailua.
Records available.- April 1932 to June 1936.
Extremes.- Maximum discharge during year, 200 million gallons a day (309 second-feet) Nov. 18 (gage height, 5.11 feet); minimum, 13.4 million gallons a day (20.7 second- feet) Feb. 19.
1932-36: Maximum discharge, that of Nov. 18, 1935; no flow when water was shut out of ditch.
Remarks.- Records good except those for Dec. 14-25, Jan. 21 to Feb. 7, Mar. 28 to Apr. 2, IprT 8-10, May 9-15, which were computed on basis of records for Koolau Ditch at Keanae and are fair. Regulated by floodgates. No diversions. Water used for domestic supply and irrigation in central Maul.
Discharge, In million gallons, fiscal year July 1935 to June 1936
Day
1 2 3 4 5
6 7 8 9 10
11 1213 14 15
16 17 18 19 20
21 22 23 24 25
26 27 28 29 30 31
July
67 59 67 55 92
89 63 76 80 67
67 59 52 4644
44 44 48 7646
41 39 46
107 169
119 108 80 89 72 94
Aug.
124 76 67 59 55
50 50 62 59 67
55 95 76 72 52
52 46 42 4444
88 113 118 89 59
55 48 44 46 46
122
Sept.
72 67 55 56
119
157 103 72 72 72
88 113 76 94 67
55 55 48 4844
42 41 39 5444
37 34 32.5 3134
Oct.
31 35.5 58
112 67
63 50 39 35.5 34
35.5 31 29.5 29.5 28
26,5 51 92 42 42
37 34 31 29.5 28
26.5 25 25 23.5 23.5 72
Month
Jul Aug- Sep Oct Hov Dec
C
Jan Feb Bar Apr Bay Jun
F
alendar year 193
11.... .......................
Iscal year 1935-
Nov.
64 32.5 28 47 50
52 35.5 32.5 31 28
26.5 26.5 25 64 67
50 137 169 163 169
113 76 63 67 52
46 46 62 64 48
Dec.
44 41 42 37 34
32.5 31 31 32.5 32.5
32.5 28 37 62 38
29 28 27 33 62
45 30 50 30 27
25 23.5 23.6 22 22 22
Jan.
20.5 20.5 19.4 19.4 26.5
37 31 26.5 26 32.5
22 20.5 19.4 20.5
114
56 120 55 39
#32.5
29 27 25 23 22
22 21 21 20 21 20
Feb.
21 24 37 21 20
19 18
*18.1 #16.8 #16.8
16.8 16.8 16.8 15.614.5
14.. "5 14.0 13.8 40 33
99 26.5 22 23.5 22
18.1 16.8 15.6 16.8
Million gallons a day
Maximum
169 124 157 112 169 62
175
120 99
175 175 175 169
175
Minimum
3942 31 23.5 25 22
0
19.4 13.8 56 4
80 48
4
Mean
71.1 66.9 64.0 41.5 64.5 34.0
62.8
32.6 23.0
118 99.6
149 83.1
70.8
. Mar.
100 123 119 157 140
157 85
121 126 109
100 169 140 85 67
115 175 157 157 124
113 113 113 108119
146 124 102 72 62 56
Apr.
84 110 67
146 76
144 175 62 4
25
89 80 115 169 119
163 169 175 140 103
89 76 76 72 63
59 55 52 62
169
Second- feet (mean)
110 104 99.0 64.2 99.8 52.6
97.2
50.4 35.6
183 154 231 129
110
May
175 163 135 135 124
169 175 #175 170 170
170 160 130 150 160
169 175 175 163 175
175 157 157 146152
130 119 99 89 80 85
June
72 67 63 80 94
67 59 59 55 50
48 72 59 50 55
63 81 55 50 55
146 96 63
101 135
169 169 152 124 85
Total run-off
Million gallons
2,200 2,080 1,920 1,290 1,930 1,050
22,900
1,010 668
3,650 2,990 4,610 2,490
25,890
Acre -feet
6,770 6,370 5,900 3,950 5,940 3,230
70,380
3,100 2,050
11,210 9,170
14,140 7,650
79,480
sPartly estimated.

ISLAND OF MA.UI
Puohokamoa Stream near Huelo
Location.- Water-stage recorder, lat. 20°51'20", long. 156°11'25", Just above Spreckels DTtch inflow and trail crossing and 3 miles southeast of Kailua.
Drainage area.- 2.6 square miles.
Records available.- December 1910 to June 1936. December 1910 to June 1913 from staff gage at site 550 feet downstream, June 1913 to May 1934 from recorder at site 500 feet downstream.
Average discharge.- 19 years (1917-36), 20.7 million gallons a day (32.0 second-feet).
Extremes.- Maximum discharge recorded during year, 502 million gallons a day (777 second- reetT Jan. 17 (gage height, 4.28 feet); minimum, 1.8 million gallons a day (2.8 second-feet) Jan. 13.
1910-36: Maximum discharge, 1,250 million gallons a day (1,930 second-feet) Feb. 26, 1935 (gage height, 7.09 feet), from rating curve extended above 500 million gallons a day; minimum, 0.1 million gallons a day (0.2 second-foot) Nov. 17, 1929, former site and datum.
Remarks.- Records good for ordinary stages; poor for high stages and for Aug. 25-31, NovT 17, Jan. 16-18, Mar. 14-20. Kula Pipe Line diverts small amount of water above station at elevation 4,300 feet for domestic use.
Rating table, fiscal year 1935-36 (gage height, in feet, and discharge, in million gallonsa day)
0.7 1.5 1.0 7.5 1.8 63 .8 2.6 1.2 15.5 2.1 100 .9 4.6 1.5 36
Discharge, In million gallons, fiscal year July 1935 "to June 1936
Day
1 2 3 4 5
6 7 8 9 10
11 12 13 14 15
16 17 18 19 20
21 22 23 24 25
26 27 28 29 30 31
July
10.7 8.9 8.2 7.2
16.5
16.9 10.0 11.1 11.1 10.4
9.3 10.4 9.7 6.3 6.0
6.38.6 8.2
17.2 7.9
6.0 5.5 6.3
40 81
26.5 17.2 12.9 12.4 12.0 13.3
Aug.
2312.0 12.4 10.0 7.5
6.9 6.9
11.7 8.2 8.5
6.9 14.2 12.7 12.6 7.5
7.2 5.8 6.6 6.0 6.0
18.2 18.6 19.6 12.4 7.0
6.0 5.6 5.2 5.0 8.0 25
Sept.
12.6 12.8 9.3 9.9
33
47 19.3 10.4 8.9 8.6
2324 11.1 14.2 9.3
7.9 8.2 6.9 6.3 6.0
6.3 5.8 4.9 4.4 4.4
4.2 4.0 4.0 3.8
10.3
Oct.
6.0 4.9
26 39.5 15.6
17.2 8.9 6.0 5.5 4.9
7.5 6.0 4.6 4.2 4.0
3.8 48 27 7.9 6.0
5.5 4.6 4.2 4.0 3.6
3.6 3.4 3.4 3.2 3.2 9.1
Month
Jul Aug- Sep Oct HOT Dec
C
Jan Feb Mar Apr May Jun
F
alendar year 193
iacal year 1935-2
Nov.
7.1 3.8 3.2 4.6 9.2
7.5 5.5 5.2 4.6 4.0
3.4 3.0 2.8 12.7 5.5
4.6 35 80 47 94
11.1 8.6 7.5 7.3 6.0
5.2 5.2 5.8 6.6 6.9
Dec.
6.3 4.6 4.6 4.2 3.6
3.6 3.6 3.4 3.4 3.2
3.0 3.4 4.6 9.3 7.5
4.2 3.2 3.0 4.0 15.7
7.5 4.2 5.3
*3.4 *3.3
*3.2 *3.1 *3.0 *2.9 *2.8 *2.7
Jan.
*2.6 »2.5 »2.4 *2.3 *2.2
*2.8 »2.4 *2.3 *2.0 3.8
2.8 2.4 1.9 3.8
34.5
25 45 7.0 5.5 4.2
3.42.8 2.6 2.42.4
2.4 2.4 2.3 2.2 2.2 2.4
Feb.
4.9 9.6
22 34 6.0
3.8 3.4 3.0 2.6 2.5
2.5 2.5 2.5 2.4 2.4
2.32.2 2.2 7.7 6.9
31.54.8 9.4 8.77.4
4:0 3.2 3.0 2.8
Million gallons a day
Maximum
81 25 47 48 94 15.7
267
45 34 70 94 87 85
94
Minimum
5.5 5.0 3.8 3.2 2.8 2.7
2.4
1.9 2.2 8.2 6.3
11.1 6.0
1.9
Mean
14.0 10.4 11.4 9.72
13.8 4.51
ia.65.96 6.90
28.2 28.8 43.3 19.0
16.4
Mar.
19.4 27 26 37.5 44
55 14.2 34 33 27
19.0 64 24.5 14 11
30 70 35 3725
16.0 13.7 26.5 19.8 53
26.5 26.5 16.6 11.1 9.5 8.2
Apr.
20.5 28 18.0 2811.1
92 62 34.5 50 16.6
12.4 10.0 3245 18.8
52 57 94 24 15.1
12.0 10.0 9.7 9.3 8.2
8.9 6.9 6.3 8.7 64
Seeond- feet (mean)
21.7 16.1 17.6 15.0 21.4 6.98
28.8
9.2210.7 43.6 44.6 67.0 29.4
25.4
May
80 48 23 46 19.9
59 79 82 53 64
3224.5 17.2 34.5 35.5
5387 69 53 81
76 34.5 43 27.5 ' 31
21 17.7 14.2 12.9 11.1 12.0
June
10.7 11.5 10.4 12.9 16.5
11.5 8.9
10.4 7.5 6.6
6.0 10.2 10.1 6.6 8.9
10.0 14.9 8.2 6.9 6.9
60 22.5 11.1 18,5 41
85 59 42 22 13»3
Total run-off
Million gallons
434 323 341 301 413 140
6,770
185 200 874 865
1,340 570
5,990
Acre-feet
1,330 992
1,050 925
l;270 429
20,810
567 614
2,680 2,650 4,120 1,750
18,380
sPartly estimated.
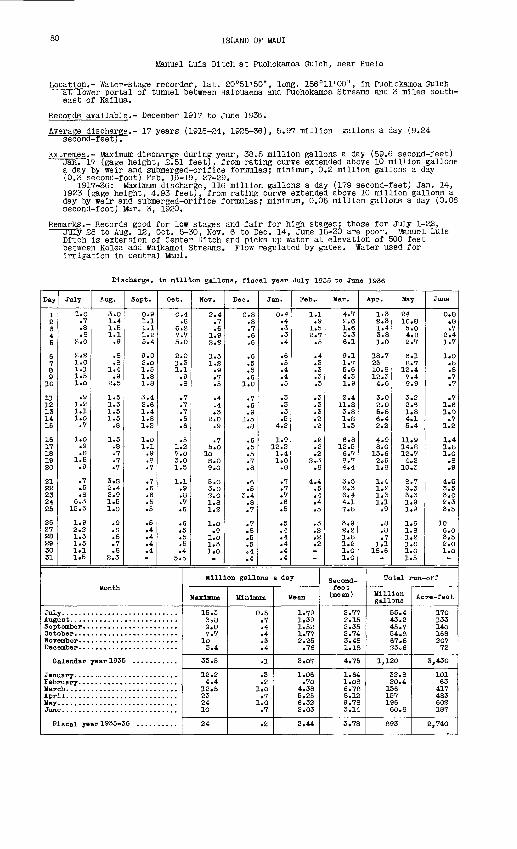
80 ISLAND OF MA.UI
Manuel Luis Ditch at Puohokamoa Gulch, near Huelo
Location.- Water-stage recorder, lat. 20°51 I 50", long. 156 0 11'00", in Puohokamoa Gulch at lower portal of tunnel between Haipuaena and Puohokamoa Streams and 3 miles south east of Kailua.
Records available.- December 1917 to June 1936.
Average discharge.- 17 years (1918-24, 1925-36), 5.97 million gallons a day (9.24 second-feet).
Extremes.- Maximum discharge during year, 38.5 million gallons a day (59.6 second-feet) Jan. 17 (gage height, 2.51 feet), from rating curve extended above 10 million gallons a day by weir and submerged-orifice formulas; minimum, 0.2 million gallons a day (0.3 second-foot) Feb. 16-19, 27-29.
1917-36: Maximum discharge, 116 million gallons a day (179 second-feet) Jan, 14, 1923 (gage height, 4.93 feet), from rating curve extended above 10 million gallons a day by weir and submerged-orifice formulas; minimum, 0.05 million gallons a day (0.08 second-foot) Mar. 3, 1920.
Remarks.- Records good for low stages and fair for high stages; those for July 1-22, July 28 to Aug. 12, Oct. 5-30, Nov. 6 to Dec. 14, June 15-30 are poor. Manuel Luis
Drtch is extension of Center Ditch and picks up water at elevation of 500 feet between Kolea and Waikamoi Streams. Flow regulated by gates. Water used for irrigation in central Maul.
Discharge, In million gallons, fiscal year July 1935 to June 1936
Day
1 2 3 4 5
6 7 8 9
10
11 12IS 14 15
16 17 18 19 20
21 22 23 24 25
26 27 28 29 SO 31
July
1.0
.8
.8 2.0
2.2 1.0 1.1 1.5 1.0
.9 1.2
1.0 .7
1.0 .9 .3
1.5.9
.7
.5
.3 6.3
15.3
1.9 2.2 1.5 1.5 1.1 1.5
Aug.
3.0
1.5 1.1
.9
.8
.8 1.4 .9
2.5
1.5 1.3
1.5 .8
1.5 .8 .7 .7 .7
3.S 2.4 2.9 1.5 1.0
.9
.3
.8
.7
.8 2.3
Sept.
0.9
1.1 1.2 5.4
9.0 2.0 1.5 1.8 1.8
3.4 2.6
1.8 1.2
1.0 1.1
.9
.8
.7
.7
.6
.6
.5
.5
.5
.4
.4
.4
.4
Oct.
0.4
6.2 7.7 5.0
2.0 1.3 1.1
.9
.8
.7
.7
.6
.6
.5 1.2 7.0 3.0 1.5
1.1 .9 .8 .7 .6
.6
.5
.5
.5
.4 5.5
Month
Jul Augi Sep Oct HOT Dec
0
Jan Feb Mar Apr May Jun
F
alendar year 193£
Iscal year!935-J 6 ..........
NOT.
2.4
.6 1.9 2.2
1.5 1.2.9 .7 .5
.4
.4
2.0 .9
.7 5.0
10 S.O 9.0
5.0 3.0 2.0 1.8 1.2
1.0 .9
1.0 1.3 1.0
Dec.
0.8
.7
.6
.6
.6
.5
.5
.6 1.0
.7
.6
1.5 .8
.6
.5
.5
.7
.8
.6
.5 3.4 .8 .7
.7
.8
.5
.5
.4
.4
Jan.
0.4
.3
.3
.4
.6
.5
.4
.4
.5
.3
.3
.5 4.2
1.9 12.2 1.4 1.0 .8
.7
.7
.7
.6
.5
.5
.4
.4
.4
.4
.4
Feb,
1.1
1.5 2.7
.5
.4
.3
.3
.3
.3
.3
.3
.2
.2
.2
.2
.2 2.3
.8
4.4 .5 .4 .4 .5
.3
.2
.2
.2
Million gallons a day
Maximum
15.3 3o8 9.0 7.7
10 3.4
33.5
12.2 4.4
12.5 23 24 10
24
Minimum
0.5 .7 .4 .4 .3 .4
.1
.3
.2 1.0 .7
1.0 .7
.2
Mean
1.79 1.39 1.52 1.77 2.25
.76
3.07
1.06 .70
4.38 5.25 6.32 2.03
2.44
Mar.
4.7
1.6 3.3 6.1
9.1 1.7 5.6 4.3 1.9
2.4 11.8
1.8 1.3
6.8 12.5 6.7 8.7 4.4
3.0 2.3 6.4 4.1 7.8
3.9 2.2 1.8 1.2 1.0 1.0
Apr.
1.3
1.4 3.8 1.0
18.7 23 10.8 12.3 4.6
3.0 2.0
6.4 2.2
4.9 8.0
13.6 2.6 1.8
1.4 1.2 1.3 1.1
.9
,8 .8 .7
1.1 18.6
Second- feet
(mean)
2.77 2.15 2.35 2.74 3.48 1.18
4.75
1.64 1.08 6.78 8.12 9.78 3.14
3.78
May
24
5.0 4.8 2.7
6.1 8.7
12.4 7.4 9.9
3.2 2.S
4.15.4
11.9 14.8 12.7 4.2
10.3
8.7 3.3 3.3 1.9 1.9
l.S 1.3 1.2 1.0 1.0 1.5
June
0.8 .8 .7
2.4 1.7
1.0 .8 .8 .7 .7
.7 1.6
.7 1.2
1.4 1.8 1.0
.8
.9
4.5 3.5 3.0 2.3 3.5
10 6.0 3.5 2.0 1.0
Total run-off
Million gallons
55.4 43.2 45.7 54.8 67.5 23.6
1,120
32.8 20.4
136 157 196 60.8
893
Acre-feet
170 133 140 168 207
72
3,430
101 63
417 483 602 187
2,740
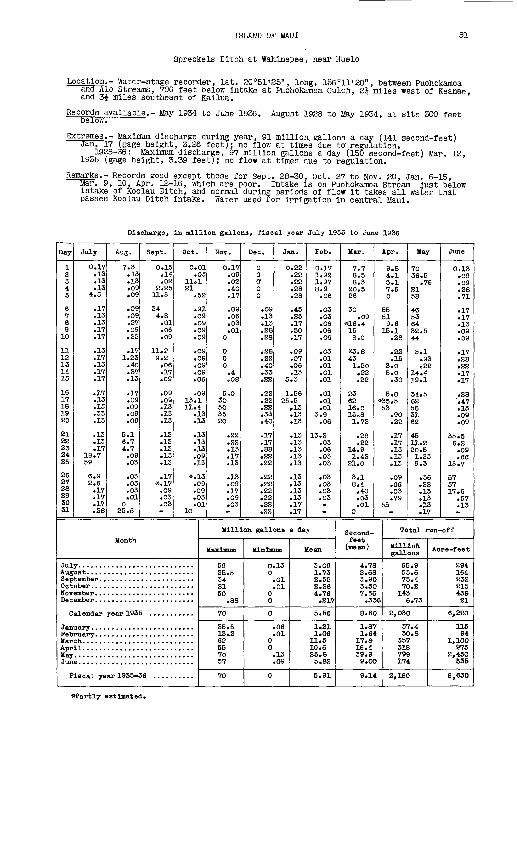
ISLAND OF MAUI 81
Spreckels Ditch at Wahlnepee, near Huelo
Location.- Water-stage recorder, lat. 20°51'25", long. 156°11'20'1 , between Puohokamoa and Alo Streams, 700 feet below Intake at Puohokamoa Gulch, 2£ miles west of Keanae, and 3% miles southeast of Kallua.
Records available.- May 1934 to June 1936. Deiow.
August 1928 to May 1934, at site 300 feet
Extremes.- Maximum discharge during year, 91 million gallons a day (141 second-feet) Jan. "17 (gage height, 3.26 feet); no flow at times due to regulation.
1928-36: Maximum discharge, 97 million gallons a day (150 second-feet) Mar. 12. 1935 (gage height, 3.39 feet); no flow at times due to regulation.
Remarks.- Records good except those for Sept. 28-30, Oct. 27 to Nov. 20, Jan. 6-15, Mar. 9, 10, Apr. 12-16, which are poor. Intake Is on Puohokamoa Stream Just below Intake of Koolau Ditch, and normal during periods of flow It takes all water that passes Koolau Ditch Intake. Water used for Irrigation In central Maul.
Discharge, in million gallons, fiscal year July 1935 to June
Day
1 2 3 4 5
6 7 8 9 10
11 12 13 14 15
16 17 18 19 20
21 22 23 24 25
26 27 28 29 30 31
July
0.1V .13 .13 .13
4.5
.IV
.13
.13
.IV
.17
.13
.17
.13
.17
.17
.17
.13
.13
.33
.13
.13
.13
.17 18.V 59
6.9 2.6 .IV .IV .17 .28
Aug.
7.3 .13 .13 .09 .09
.09
.09
.27
.09
.22
.17 1.23 .40 .37 .13
.17
.09
.09
.09
.09
5.1 6.V 4.V .09 .03
.03
.03
.03
.01 0
25.5
Sept.
0.15 .14 .02
2.25 11.5
34 4.8 .01 .06 .09
11.2 9.2 .06 .17 .09
.09
.09
.13
.13
.13
.13
.13
.13
.13
.13
.IV *.17 .09 .03 .03
Oct.
0.01 .03
11.1 21
.52
.91
.09
.09
.09
.09
.09
.09
.09
.09
.06
.09 13.1 11.4
.13
.13
.13
.13
.13
.09
.13
*.13 .09 .09 .03 .01
10
Month
Jul Aug Sep Dot Hov Dec
C
Jan Peb Mar Apr May Jun
f
alendar year 193
iseal year 1935- 56 ..........
HOT.
0.1V .09 .02 .40 .17
.09
.06 o03 .01
0
0 0 0 .4 .08
5oO 30 50 35 20
.22
.22
.13
.IV
.13
.13
.09
.17
.09
.03
Dec.
0 0 CT 0 0
.09
.13
.13
.28
.28
.28
.22
.40
.33
.22
.22
.22
.22
.33
.40
.17
.17
.88
.22
.22
.22
.22
.22
.22
.22
.22
Jan.
0.22 .22 .22 .28 .28
.45
.25 «1V .50 .17
.09
.07
.06
.13 5.3
1.56 25.5 »13 .13 .13
.13
.13
.13
.13
.13
.13
.13
.13
.13
.IV
.IV
Feb.
0.17 1.92 1.97 8.9 .06
.03
.03
.06
.06
.06
.03
.01
.01
.01
.01
.01
.01
.01 3.9 .06
13.2 .03 .06 .03 .03
.03
.03
.03
.03
Million gallons a day
M&xJjnum
59 25.5 34 21 50
.88
70
25.5 13.2 62 55 VO 5V
VO
Minimum
0.13 0 .01 .01
0 0
0
.06
.01 0 0 .13 .09
0
Mean
3.09 1.V3 2.52 2.26 4.76 .21V
5.56
1.21 1.06
11.5 10.6 25.8 5.82
5.91
Mar.
V.V 8.5 8.3 20.5 26
30 .09
*16.4 158.0
*3.8 43 1.20 .22 .22
23 62 16.0 15.8 1.72
.28
.22 14.9 1.42 21.0
3.1 8.4 .40 .03 .01
0
Apr.
9.8 4.1 5.1 7.6 0
55 51 9.6
15.1 .28
.22
.15 3.0 5.0 .30
5.0 *35.5 53
.90
.22
.17
.IV
.13
.13
.13
.09
.06
.03
.V9 55
Second- fast (mean)
4.78 2.68 3.90 3.50 7.36 .336
8.60
1.8V 1.64
IV. 6 16.4 39.9 9.00
9.14
May
70 36.5
.V6 21 58
46 53 64 32.5 44
5.1 .93 .22
14.4 19.1
34.5 62 56 31 62
45 11.2 20.5 1.33 9.3
.36
.22
.13
.13
.13
.17
June
0.13 .09 .09 .28 .71
.17
.17
.13
.09
.09
.17
.28
.22
.17
.17
.28 '.47 .13 .09 .09
35.5 6.2 .09 .66
15.7
57 37 17.6
.57
.13
Total run-off
Million gallons
95.9 53.6 75.4 V0.2 143
6.73
2,030
37.4 30.8
357 318 799 174
2,160
Acre-feat
294 164 232 215 439 21
6,220
115 94
1,100 975
2,450 535
6,630
*Partly estimated.
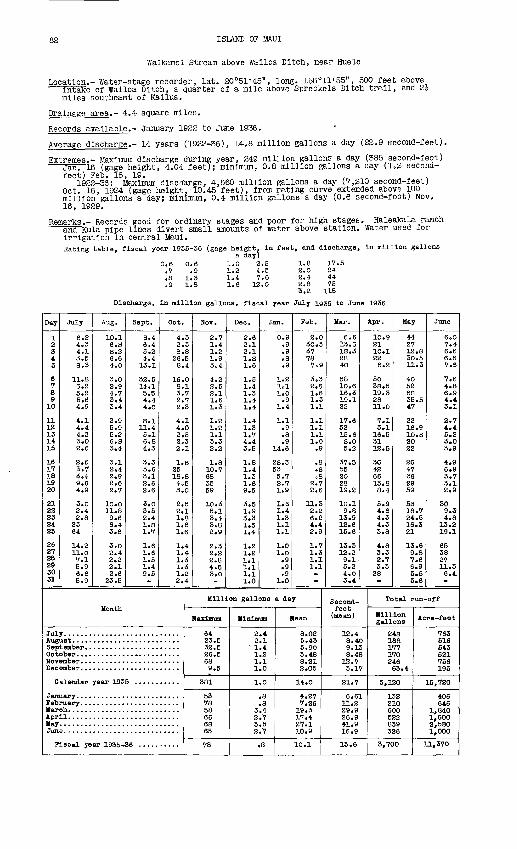
ISLAND OF MAUI
Walkamol Stream above Walloa Ditch, near Huelo
Location.- Water-stage recorder, lat. 20°51'45", long. 156°11'55", 500 feet above Intake of Walloa Ditch, a quarter of a mile above Spreckels Ditch trail, and 2*
miles southeast of Kallua.
Drainage area.- 4.4 square miles.
Records available.- January 1922 to June 1936.
Average discharge.- 14 years (1922-36), 14.8 million gallons a day (22.9 second-feet).
Extremes.- Maximum discharge during year, 249 million gallons a day (385 second-feet) Jan. 16 (gage height, 4.04 feet); minimum, 0.8 million gallons a day (1.2 second-
feet) Feb. 18, 19.1922-36: Maximum discharge, 4,660 million gallons a day (7,210 second-feet)
Oct. 16, 1924 (gage height. 10.45 feet), from rating curve extended above 100 million gallons a day; minimum, 0.4 million gallons a day (0.6 second-foot) Nov. 16, 1929.
Remarks.- Records good for ordinary stages and poor for high stages. Haleakala ranch ancTKula pipe lines divert small amounts of water above station. Water used for
irrigation In central Maul.Rating table, fiscal year 1935-36 (gage height. In feet, and discharge, In million gallons
0.6 .7
1.3 1.8
1.0 1.2 1.4 1.6
2.54.57.6
12.0
1.8 2.0 2.4 2.8 3.2
17.524
75118
Discharge, In million gallons, fiscal year July 1935 to June 1936
Day
1 2 3 4 5
6 7 8 9
10
11 12 13 14 15
16 17 18 19 20
21 22 23 24 25
26 27 28 29 30 31
July
6.2 4.3 4.1 3.5 S.3
11.8 6.2 5.2 5.6 4.9
4.14.4 4.2 3.0 2.6
2.6 3.7 3.4 9.S 4.9
3.0 2.4 2.8
23 64
14.2 11.0 7.1 5.9 6.6 5.9
Aug.
10.1 6.S S.2 6.6 4.0
3.0 2.9 4.7 3.4
2.9 5.9 5.2 6.S 3.4
3.1 2.4 2.9 2.6 2.7
10.0 11.8 9.6 6.4 3.6
3.0 2.4 2.2 2.1 2.6
23.5
Sept.
S.4 6.4 5.2 4.4 13.1
32.5 14.1s.b4.4
11.4 5.1 6.8 4.3
3.3 3.6 3.1 2.6 2.6
3.0 3.5 2.4 l.S 1.7
1.6 1.6 1.5 1.4 9.5
Oct.
4.3 2.3 8.8
26.5 8.4
16.0 8.1 3.7 2.7
4.0 2.5 2.3 2.1
l.S 25 18.8 4.5 3.0
2.5 2.1 1.8 1.6 1.6
1.4 1.4 1.3 1.3 1.2 2.4
Month
Jul Augi Sep Oct Hov Dec
C
Jam Feb Mar Apr May Jun
P
alendar year 193
Lscal year 1935-.
HOT.
2.7 1.4 1.2 1.93.4
4.2 2.5 2.1 1.6
1.2 1.1 3.3 2.2
1.8 10.7 68 35 59
10.3 5.1 3.4 3.8 2.9
2.3 2.2 2.8 4.6 3.0
Dec.
2.6 2.1 2.1 l.S 1.6
1.5 1.4 1.3 1.4
1.3 1.7 4.4 3.5
1.8 1.4 1.3 1.6 9.5
3.5 1.9 3.3 1.5 1.4
1.2 1.2 1.1 1.1 1.1 1.0
Jan.
0.9 .9 .9 .3 .9
1.2lol
1.0 .9
.9
.8
.9 14.6
2S. 5 53 5.7 2.7 1.9
1.6 1.4 1.3 1.1 1.1
1.0 1.0 .9 .9 .9
1.0
Feb.
2.0 30.5 37 78 7»9
3.3 2.6 1.6 1.3
1.1 1.1 1.0 .9
.8
.3
.8 2.7 2.6
11.3 2.2 6.2 4.4 2.9
1.7 1.3 1.1 1.1
Million gallons a day
Maximum
64 23.5 32.5 26.5 68 9.5
381
53 78 58 66 6S 65
78
Minimum
2.4 2.1
' 1.4 1.2 1.1 1.0
1.0
.8
.8 3.4 2.7 5.5 2.7
.8
Mean
8.02 5.43 5.90 5.48 8.21 2.05
14.0
4.27 7.26
19.3 17.4 27.1 10.9
10.1
Mar.
6.6 13.3 IS. 3 28 4O
58 10.6 16.3 19.1 22
17.6 52 15.6 S.O 5.2
37.5 55 20 28 19.2
10.1 9.3
13.9 12.6 15.6
13.3 12.2 9.1 5.2 4.0 3.4
Apr.
10.9 21 10.1 22 6.2
50 3S. 5 19.3 28 11.0
7.1 5.1
16.5 31 12.5
36 42 66 15.8 8.4
5.9 4.6 4.3 4.3 3.8
4.8 3.3 2.7 3*3 28
Second- feet (mean)
12.4 8.40 9.13 8.48
IB. 7 3.17
21.7
6.61 11.2 29.9 26.9 41.9 16.9
15.6
May
44 27 12.8 30.5 11.3
40 52 6S 35.5 47
22 16.9 10. S 20 22
26 47 36 29 59
53 18.7 24.5 16.3 21
13.6 9.8 7.6 6.9 5.5 5.6
June
6.0 7.4 6.6 6.6 7.S
7.6 4.8 6.9 4.4 3.1
2.7 4.45.2 3.0 3.9
4.9 6.9 3.7 3.1 2.9
30 9.3 4.8
13.2 19.1
65 38 27 11.3 6.4
Total run-off
Million gallons
24S 168 177 170 246 63.4
5,120
132 210 600 522 839 326
3,700
Acre-feet
763 516 543 521 756 195
15,720
406 646
1,840 1,600 2,580 1,000
11,370
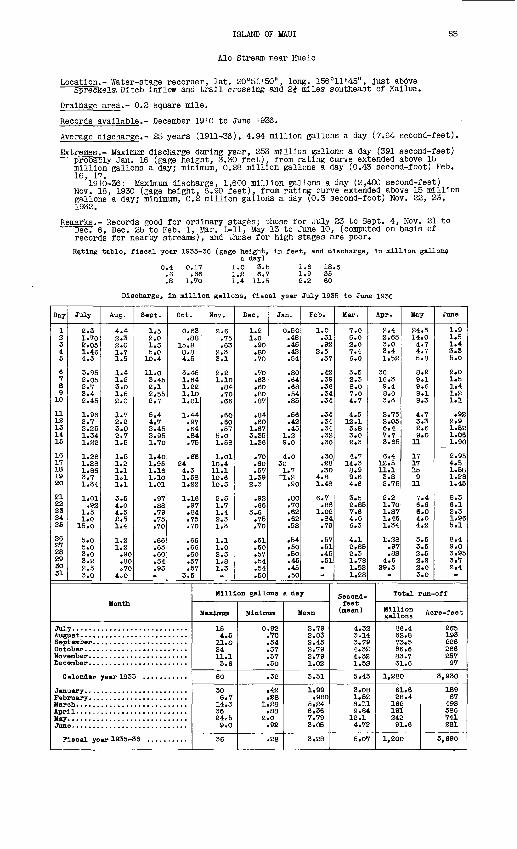
ISLAND OF MA.UI
Alo Stream near Huelo
Location.- Water-stage recorder, lat. 20°51'50 n , long. 156°11'45", Just above Spreckels, Ditch Inflow and trail crossing and 2£ miles southeast of Kallua.
Drainage area.- 0.2 square mile.
Records available.- December 1910 to June 1936.
Average discharge.- 25 years (1911-36), 4.94 million gallons a day (7.64 second-feet).
Extremes.- Maximum discharge during year, 253 million gallons a day (391 second-feet) probably Jan. 16 (gage height, 3.30 feet), from rating curve extended above 15 million gallons a day; minimum, 0.28 million gallons a day (0.43 second-foot) Feb. 16, 17.
1910-36: Maximum discharge, 1,600 million gallons a day (2,480 second-feet) Nov. 18, 1930 (gage height, 6.90 feet), from rating curve extended above 15 million gallons a day; minimum, 0.2 million gallons a day [0.3 second-foot) Nov. 22, 23, 1932.
Remarks.- Records good for ordinary stages; those for July 23 to Sept. 4, Nov. 21 to Dec. 6, Dec. 25 to Feb. 1, Mar. 1-11, May 13 to June 10, (computed on basis of
records for nearby streams), and those for high stages are poor.Rating table, flacal year 1935-36 (gage height, In feet, and discharge, In million gallon^
a day)0.4 0.17 1.0 3.5 1.6 18.5 .6 .66 1.2 6.7 1.9 35 .8 1.70 1.4 11.5 2.2 60
Discharge, In million gallons, flacal year July 1935 to June 1936
Day
1 2 3 4 5
6 7 8 9
10
11 12 13 14 15
16 17 18 19 20
21 22 23 24 25
26 27 28 29 30 31
July
2.3 1.70 2.05 1.46 4.3
3.95 2.05 2.7 3.4 2.45
1.96 2.7 2.25 1.34 1.22
1.28 1.28 1.86 3.7 1.34
1.01 .92
1.5 1.0
15.0
5.0 5.0 3.0 3.2 2.5 3.0
Aug.
4.4 2.3 2.0 1.7 1.5
1.4 1.2 3.0 1.5 2.0
1.7 2.2 3.0 2.7 1.5
1.5 1.2 1.1 1.1 1.1
3.5 4.0 4.5 2.5 1.4
1.2 1.2 .90 .80 .70
4.0
Sept.
1.5 2.0 1.5 5.0 10.4
11.0 3.45 2.1 2.55 2.7
5.4 4.7 2.45 2.95 1.70
1.40 1.95 1.16 1.10 1.01
.97
.38
.79
.75
.70
.66
.63
.60
.54
.95
Oct.
0.63 .88
15.8 8.8 4.5
3.45 1.64 1.22 1.10 1.01
1.44 .97 .34 .84 .75
.6B 24 4.3 1.58 1.22
1.16 .97 .84 .75 .70
.66
.66
.60
.57
.57 3.5
Month
Jul Augi Sep Oct NOT Dec
C
Jan Feb Mar Apr May Jun
P
alendar year 193,
iaeal year 1935-,
Nov.
2.6 .75 .63
2.3 3.1
2.2 1.10 .84 .70 .66
.60
.60
.57 5.0 1.58
1.01 10.4 11.1 10.6 10.5
2.5 1.7 1.4 2.3 1.3
1.1 1.0 2.5 1.8 1.3
Dec.
1.2 1.0 .90 .80.70
.70
.63
.60
.80
.87
.84
.60 1.67 3.35 1.36
.70
.60
.57 1.39 2.3
.92
.66 3,6 .75 ,70
.61
.60
.57
.54
.54
.50
Jan.
0.50 .48 .45 .42 .54
.80
.64
.68
.54
.85
.56
.42
.45 1.2 9.0
4.0 30 1.7 ~1.2
.90
.80
.70
.62
.62
.53
.54
.50
.50
.45
.45
.50
Feb.
1.0 .51 .92
2.5.57
.42
.39
.36
.34
.34
.34
.34
.34
.32
.30
.30
.28
.30 4.8 1.48
6.7 .88
1.02 .84 .79
.57
.51
.45
.51
Million gallons a day
Maximum
15 4.5 U.O 24 11.1 3.6
60
30 6.7
14.3 36 24o5 9.0
36
Minimum
0.92 .70 .54 .57 .57 .50
.32
.42
.28 1.28 .38
2.0 .92
.28
Mean
2.79 i S.03 2.45 2.79 2.79 1.02
3.51
1.99 .980
5.24 6.36 7.79 3.05
3.28
Mar.
7.0 6.0 2.0 7.4 6.0
3.5 2.3 8.0 7.0 4.7
4.5 12.1 5.8 3.0 2.3
4.7 14.3 8.9 9.6 4.6
3.5 2.85 7.6 4.6 6.3
4.1 2,85 2.3 1.78 1.52 1.28
Apr.
2.4 2.65 3.0 3.4 1.52
36 16.3 9.4 8.0 3.3
2.75 2.05 6.4 7.7 3.65
6.4 12.5 11.1 3.8 2.75
2.2 1.70 1.S7 1.46 1.34
1.28 .97 .83
4.6 29.5
Second- feet (mean)
4.32 3.14 3.79 4.32 4.32 1.5S
5.43
3«08 1.52 8.11 9.84
12.1 4.72
5.07
May
24 144 4 5
8 9 9 8 8
4 3 2 9
11
17 17 15 9 U
7 6 6 4 4
3 3 2 2 2 3
.5
.0
.7
.7
.8
.2
.1
.6
.1
.3
.7
.3
.6
.0
.4
.6
.0
.0
.2
.5
.5
.5
.2
.0
.0
June
1.9 1.5 1.4 3.3 5.0
2.0 1.5 1.4 1.2 1.1
.92 2.9 1.52 1.06 1.90
2.95 4.5 1.58 1.28 1.45
8.3 6.1 2.3 1.96 5.1
8.4 9.0 3.95 3.7 2.4
Total run-off
Million gallons
86.4 62.8 73.5 86.6 83.7 31.6
1,280
61.6 28.4
162 191 242 91.6
1,200
Acre-feet
265 193 226 266 257 97
3,930
189 87
498 586 741 281
3,690
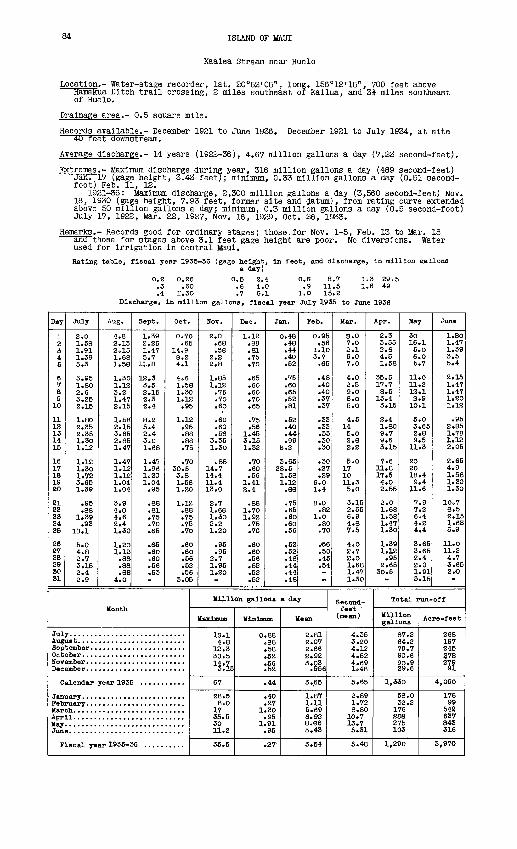
84 ISLAND OF MA.UI
Kaalea Stream near Huelo
Location.- Water-stage recorder, lat. 20°52'05", long. 156°12 1 15", 700 feet above Hamakua Ditch trail crossing, 2 miles southeast of Kallua, and 3i miles southeast of Huelo.
Drainage area.- 0.5 square mile.
Records available.- December 1921 to June 1936. December 1921 to July 1934, at site 4U feet downstream.
Average discharge.- 14 years (1922-36), 4.67 million gallons a day (7.23 second-feet).
Extremes.- Maximum discharge during year, 316 million gallons a day (489 second-feet) Jan. 17 (gage height, 3.43 feet); minimum, 0.33 million gallons a day (0.51 second- foot) Feb. 11, 12.
1921-36: Maximum discharge, 2,300 million gallons a day (3,560 second-feet) Nov. 18, 1930 (gage height, 7.93 feet, former site and datum), from rating curve extended above 50 million gallons a day; minimum, 0.3 million gallons a day (0.5 second-foot) July 17, 1922, Mar. 22, 1927, Nov. 16, 1929, Oct. 26, 1933.
Remarks.- Records good for ordinary stages; those.for Nov. 1-5, Feb. 13 to Mar. 18 and those for stages above 3.1 feet gage height are poor. No diversions. Water used for Irrigation In central Maul.Rating table, fiscal year 1935-36 (gage height, in feet, and discharge, in million gallons
a day)
0.2 0.26 0.5 2.4 O.S 8.7 1.3 29.5 .3 .60 .6 4.0 .9 11.5 1.6 49 .4 r.30 .7 6.1 1.0 15.2
Discharge, In million gallons, fiscal year July 1935 to June 1936
Day
1 2 3 4 5
6 7 8 9 10
11 12 13 14 15
16 17 18 19 20
21 22 23 24 25
26 27 28 29 30 31
July
2.0 1.58 1.91 1.39 5.3
3.95 1.80 2.6 3.25 2.15
1.80 2.35 2.35 1.30 1.12
1.12 1.30 1.72 3.65 1.39
.95
.88 1.39 .93
18.1
5.0 4.8 2.7 3.15 2.4 2.9
Aug.
4.8 2.15 2.15 1.68 1.58
1.30 1.12 3.2 1.47 2.15
1.58 2.15 3.65 2.85 1.47
1.47 1.12 1.12 1.04 1.04
3.9 4.0 4.6 2.4 1.30
1.20 1.12 .88 .88 .88
4.0
Sept.
1.39 2.25 1.47 5.7
11.8
12.3 3.5 2.15 2.3 2.4
8.2 5.4 2.4 3.0 1.68
1.47 1.96 1.20 1.04 .95
.88
.81
.75
.70
.65
.65
.60
.60
.56
.93
Oct.
0.70 .65
14.9 8.2 4.1
4.6 1.58 1.30 1.12 .95
1.12 .95 .88 .88 .75
.70 30.5 3.8 1.58 1.20
1.12 .88 .75 .75 .70
.60
.60
.56
.52
.56 3.05
Month
Jul Augi Sep Dot Nov Dec
0
Jan Peb Mar Apr May Jun
P
alendar year 193!
11...........................
.seal year 1935 «
NOT.
2.0 .68 .58
2.2 2.8
1.85 1.12 .75 .70 .60
.60
.60
.56 3.35 1.30
.88 14.7 14.4 11.4 13.0
2.7 1.68 1.30 2.2 1.20
.95
.95 2.7 1.95 1.20
Dec.
1.12 .88 .81 .75 .70
.65
.60
.60
.70
.65
.75
.56 1.45 3.15 1.32
.70
.60
.56 1.41a.4.38
1.70 1.92 .75 .70
.60
.60
.56
.52
.52
.52
Jan.
0.48 .48 .44 .40 .52
.75
.60
.65
.52
.81
.52
.40
.44
.99 8.2
3.65 28.5 1.58 1.12 .88
.75
.65
.60
.60
.56
,52 .52 .48'
.44
.44
.48
Million gallons
Maximum
1S.1 4.8
12.3 30.5
^L67
28.5 8.0
17 35.5 30 11.2
35.5
Minimum
0.88 .88 .58 .52
1.56 .52
.44
.40
.27 1.30 .95
1.91 .95
.27
Feb.
0.95 .56
1.10 3.7 .65
.48
.40
.40
.37
.37
.33
.33
.33
.30
.30
.30
.27
.29 6.0 1.4
8.0 .82
1.0 .80 .70
. 56
.50
.45
.54
a day
Mean
2.81 2.07 2.66 2.92 3.03 .956
3. ,65
1.87 1.11 5.69 6.92 8.66 3.43
3.54
Mar.
S.O 7.0 2.1 9.0 7.0
4.0 2.5 9.0 8.0 5.0
4.5 14 5.0 2.8 2.2
5.0 17 10 11.35.0
3.15 2.55 6.9 4.8 7.5
4.0 2.7 2.0 1.68 1.47 1.30
Apr.
2.3 3.55 2.5 4.5 1.58
35.5 17.7 8.5
13.4 3.15
2.4 1.80 9.7 9.S 3.15
7.6 11.8 17.5 4.0 2.55
2.0 1.68 1.58 1.47 1.30
1.39 1.12 .95
2.65 30.5
Second- feet '
(mean)
4.35 3.20 4.12 4.52 4.69 1.48
5.65
2.89 1.72 8.80
10.7 13.7 5.31
5.48
May
30 16 5 65
11 11 12 S 10
5 3 2 9
11
20 20 18 9 11
7 7 6 4 4
3 3 2 2 1 3
.1
.0
.0
.7
.0
.2
.1
.9
.1
.0
.65
.8
.5
.3
.4
.4
.6
.9
.2
.4
.2
.4
.65
.65
.4
.0
.91
.15
June
1.80 1.47 1.39 3.5 5.4
2.15 1.47 1.47 1.20 1.12
.95 2.85 1.78 1.12 2.05
2.65 4.9 1.58 1.30 1.30
10.7 8.5 2.15 1.6S 5.9
11.0 11.2 4.7 3.65 2*0
Total run-off
Million gallons
87.2 64.2 79.7 90.6 90.9 29.6
1,330
58.0 32.2
176 208 275 103
1,290
Acre-feet
268 197 245 §78 279 91
4,090
178 99
542 637 843 316
3,970
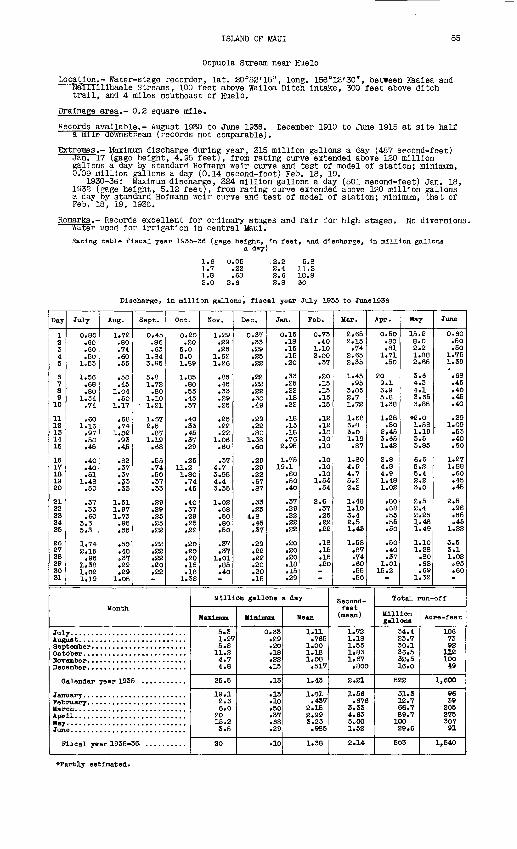
ISLAND OF MAUI 85
Oopuola Stream near Huelo
Location.- Water-stage recorder, lat. 20°52'15", long. 156°12'30", between Kaalea and Naiiilllliaele Streams, 100 feet above Wailoa Ditch Intake, 300 feet above, ditch trail, and 4 miles southeast of Huelo.
Drainage area.- 0.2 square mile.
Records available.- August 1930 to June 1936. December 1910 to June 1915 at site half a mile downstream (records not comparable).
Extremes.- Maximum discharge during year, 315 million gallons a day (487 second-feet) Jan. 17 (gage height, 4.95 feet), from rating curve extended above 120 million gallons a day by standard Hofmann weir curve and test of model of station; minimum, 0/09 million gallons a day (0.14 second-foot) Feb. 18, 19.
1930-36: Maximum discharge, 324 million gallons a day (501 second-feet) Jan. 18, 1932 (gage height, 5.12 feet), from rating curve extended above 120 million gallons s. day by standard Hofmann weir curve and test of model of station: minimum, that of Feb. 18, 19, 1936.
Remarks.- Records excellent for ordinary stages and fair for high stages. No diversions. Ifa^er used for Irrigation In central Maul.Rating table fiscal year 1935-36 (gage height, In feet, and discharge, In million gallons
a day)
1.61.71.8 2.0
0.05 .22
,2.2 2.4 2.6 2.8
5.8 11.2- 18.8
Discharge, In million gallons, fiscal year July 1935 to June1936
Day
1 2 3 4 5
6 7 8 9
10
11 12 13 14 15
16 17 18 19 20
21 22 23 24 25
26 27 28 29 30 31
July
0.80 .60 .50 .50
1.53
1.56 .68 .80
1.34.74
.60 1.16 .97 .50 .45
.40
.40
.51 1.48 .50
.37
.33
.60 3.3 5.3
1.74 2.15 .95
1.38 1.02 1.19
Aug.
1.72 .80 .74 .60 .55
.50
.45 1.04 .50
1.17
.68
.74 1.02 .93 .45
.82
.37
.37
.33
.33
1.51 1.97 1.73 .95 .55
.50
.40
.37
.29
.29 1.05
Sept.
0.45 .86 .63
1.84 3.95
5.8 1.72 .80
1.10 1.21
1.S7 2.5 .87
1.19 .68
.55
.74
.50
.37
.33
.29
.29
.25
.25
.22
.22
.22
.22
.20
.22
Oct.
0.20 .20
5.0 5.0 1.89
1.85 .80 .55 .45 .37
.40
.33
.45
.37
.29
.25 11.2 1.80 .74 .45
.40
.37
.29
.25
.22
.20
.20
.20
.18
.18 1.38
Month
Jul Augi 8ep Dot HOT Dec
0
Jan Feb Mar Apr May Jun
F
alendar year 193
Iscal year 1935-.36, ..........
Nov.
1.29 .29 .25
1.62 1.26
.85
.45
.33
.29
.25
.25
.22
.22 1.06 .60
.37 4.7 3.95 4.4 3.35
1.02 .68 .50 .80 .50
.37
.37 1.01 .85 .40
Dec.
0.37 .33 .29 .25 .22
.22
.22
.22
.30
.49
.29
.22
.80 1.38 .60
.29
.29
.22
.67
.87
.33
.25 4.8 .45 .37
.29
.22
.22
.20
.20
.15
Jan.
0.15 .18 .15 .15 .20
.33
.25
.22
.18
.22
.18
.15
.18
.76 2.95
1.75 19.1
.80
.50
.40
.37
.29
.22
.22
.22
.20
.20
.20
.18
.15
.29
Feb.
0.73 .40
1.10 2.00 .37
.20
.15
.15
.15
.15
.12
.12
.10
.10
.10
.10
.10
.10 1.54 .54
2.6 .37 .25 .22 .22
.18
.15
.15
.20
Million gallons a day
Maxlnum
5.3 1.9V 5.8 11.2 4.7 4.8
25.5
19.1 2.6 6.0
20 15.2 3.5
20
Minimum
0.33 .29 .20.18 .22 .15
.15
.15
.10
.50
.37
.68
.29
.10
Mean
1.11 .765
1.00 1.18 1.08 .517
1.43
1.01 .437
2.15 2.99 3.23 .985
1.38
Mar.
2.65 2.15 .74
2.65 2.35
1.45 .95
3.05 2.7 1.72
1.68 6.0 3.0 1.19 .87
1.80 4.9 4.7 5.2 2.2
1.48 1.10 3.4 2.5 1.4S
1.58 .87 .74 .60 .55 .50
Apr.
0.50 .80 .81
1.71 .50
20 9.1 3 9 5.8 1.38
1.28 .80
2.45 3.65 1.42
2«8 4.8 4.9 1.48 1.02
.80
.68
.55
.55
.50
.50
.40
.37 1.01
15.2
Second- feet (mean)
1.72 1.18 1.55 1.83 1.67 .800
2.21
1.56 .676
3.33 4.63 5.00 1.52
2.14
May
15.2 8.0 2.2 1.88 2.85
3.6 4.3 4.1 3.65 3.85
«e.o1.58 1.19 3.5 3.85
6.6 5.2 5.4 2.2 3.0
2.5 2.4 2.25 1.48 1.49
1.10 1.28 .80 .68 .69
1.32
June
0.60 .50 .50
1.75 1.39
.68
.45
.40
.45
.40
.29 . 1.09
.53
.40
.SO
1.27 1.88 .60 .45 .45
2.5 .98 .55 .45
1.22
3.5 3.1 1.02 .95 .60
Total run-off
Million gallons
34.4 23.7 30.1 36.5 32.5 16.0
522
31.3 12.7 66.7 89.7 100 29.6
503
Acre -feet
106 73 92
112 100 49
1,600
96 39 205 275 307 91
1,540
*Partly estimated.
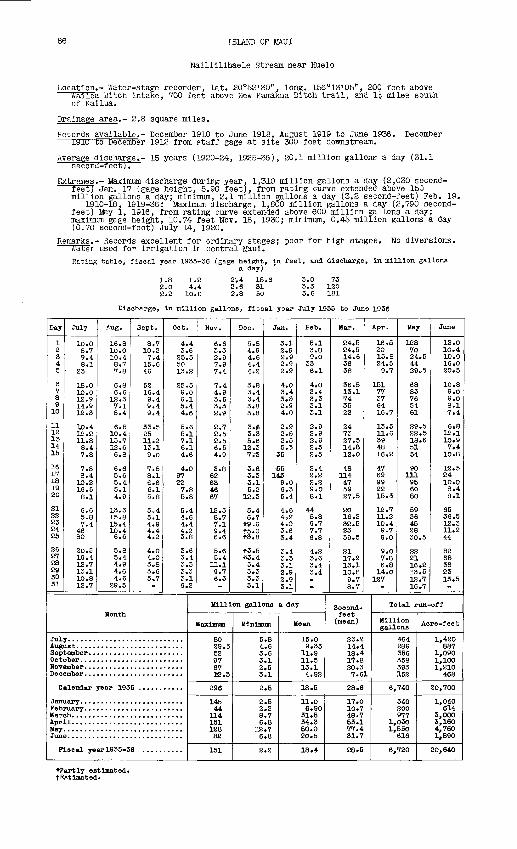
ISLAND OF MAUI
Nailiilihaele Stream near Huelo
Location.- Water-stage recorder, lat. 20 052'30'? , long. 156°13'05", 200 feet above Walloa Ditch intake, 700 feet above New Kamakua Ditch trail, and 1| miles south of Kailua.
Drainage area.- 2.8 square miles.
DecemberRecords available.- December 1910 to June 1918, August 1919 to June 1936. 1910 to December 1912 from staff gage at site 300 feet downstream.
Average discharge.- 15 years (1920-24, 1925-36), 20.1 million gallons a day (31.1 seconrt-feet;7
Extremes.- Maximum discharge' during year. 1,310 million gallons a day (2,030 second- feet; Jan. 17 (gage height, 5.90 feet), from rating curve extended above 150 million gallons a day; minimum, 2.1 million gallons a day (3.2 second-feet) Feb. 19.
1910-18, 1919-36: Maximum discharge, 1,800 million gallons a day (2,790 second- feet) May i, 1916, from rating curve extended above 600 million gallons a day; maximum gage height, 10.74 feet Nov. 18, 1930; minimum, 0.45 million gallons a day (0.70 second-foot) July 14, 1920.
Remarks.- Records excellent for ordinary stages; poor for high stages. water used for irrigation in central Maul.
No diversions.
Rating tatile, fiscal year 1935-36 (gage height, in feet, and discharge, in million gallonsa day)
1.8 1.2 2;4 18.6 3.0 73 2.0 4.4 2.6 31 3.3 120 2.2 10.0 2.8 50 3.6 181
Discharge, in million gallons, fiscal year July 1935 to June 1936
Day
1 2 34 5
6 7 8 9 10
11 12 13 14 15
16 17 18 19 20
21 22 23 24 25
26 27 28 29 30 31
July
10.0 8.7 9.4 8.1
- 23
18.0 10.0 12.9 14.9 12.3
10.4 12.2 11.8 8.4 7.8
7.8 8.4
10.2 16.5 8.1
6.6 5.8 7.4
46 80
20.5 19.4 12.7 13.1 10.8 12.7
Aug.
16.8 10.0 10.4 8.7 7.8
6.8 6.6
12.3 7.1 8.4
6.8 10.4 13.7 12.6 6.8
6.6 5.6 5.4 5.1 4.9
13.3 15.8 15.4 10.4 6.6
5.8 5.4 4.9 4.6 4.6
29.5
Sept.
8.7 10.2 7.4
15.6 46
52 16.4 9.4 9.4 9.4
33.5 25 11.2 13.1 9.0
7.8 8.1 6.6 6.1 5.8
5.4 5.1 4.9 4.4 4.2
4.04.0 3.8 3.6 5.7
Oct.
4.4 3.6
25.5 50 13.2
25.5 9.0 6.1 5.4 4.6
5.6 5.1 7.1 6.1 4.6
4.0 97 22 7.8 5.8
5.4 4.6 4.4 4.2 3.8
3.6 3.4 3.3 3.3 3.1 6.2
Month
Jul Augi Sep Oct Nor Dec
C
Jan Fob Mar Apr May Jun
F
alendar year 193
iscal year 1935-3
NOT.
6.6 3.3 2.9 7.9 7.4
7.4 4.9 3.6 3.3 2.9
2.7 2.5 2.5 6.5 4.9
3.8 62 63 46 67
12.3 8.7 7.1 9.4 6.6
5.6 5.4
11.1 9.7 6.3
Dec.
5.8 4.9 4.6 4.4 4.2
3.8 3.4 3.4 3.8 3.8
3.5 3.3 5.6
12.3 7i3
3.8 3.3 3.1 5.2
12.3
5.4 6.7
#9.6 f5.0 f3.8
f3.5 #3.4 3.4 3.3 3.3 3.1
Jan.
3.1 2.9 2.9 2.9 2.9
4.0 3.4 3.3 2.9 4.0
2.9 2.5 2.55.3
35
55 145
9.0 6.3 5.4
4.6
4^0 3.6 3.4
3.4 3.3 3.1 2.9 2.9 3.1
Million gallons
Maximum
80 29.5 52 97 67 3S.3
296
145 44
114 151 128 82
151
Minimum
5.8 4.6 3.6 3.1 2.5 3.1
2.5
2.5 2.2 8.7 6.8
12.7 6.8
2.2
*Partly estimated. fEstimated.
Feb.
5.1 3.8 9.0
33 6.1
4.0 3.4 3.3 3.1 3.1
2.9 2.9 2*9 2.5 2.5
2.4 2.2 2.2 9.0 8.1
44 5.8 9.7 7.7 6.8
4.2 3.6 3.4 3,4
a day
Mean
15.0 9.33
11.9 11.5 13.1 4.92
18.5
11.0 6.90
31,5 34.3 50.0 20.5
18.4
Mar.
24.5 24.5 14.6 3638
36.5 13.1 74 35 22
24 73 27.5 14.8 12.0
48 114 47 59 27.5
20 16.2 32.5 23 39.5
21 17.2 13.1 10.8 9.7 8.7
Second- feet (mean)
Apr.
16.5 20 15.8 24.5 9.7
151 77 37 64 16.7
13.5 11.6 39 48 16.2
47 69 99 22 15.3
12.7 11.2 10.4 9.7 9.0
9.0 7.8 6.8 14.0
127
May
128 70 24.5 44 29.5
68 83 76 54 61
29.5 22.5 18.6 5154
90 111 95 60 80
59 36 45 28 30.5
22 21 16.2 13.5 12.7 16.7
June
12.0 10.4 10.0 16.0 20.5
10.8 9.0 9.0 8.1 7.4
6.8 12.1 10.9 7.4
10.8
12.5 24 10.0 8.4 8.1
65 36.5 12.3 11.2 44
82 68 36 23 13.5
Total run-off
Million gallons
23.8 464 14.4 289 18.4 356 17.8 358 20.3 393 7.61 152
28.6 6,740
17.0 340 10.7 200 48.7 977 53.1 1,030 77.4 1,550 31.7 616
28.5 6,720
Acre-feet
1,420 887
1,090 1,100 1,210
468
20,700
1,040 614
3,000 3,160 4,760 1,890
20,640
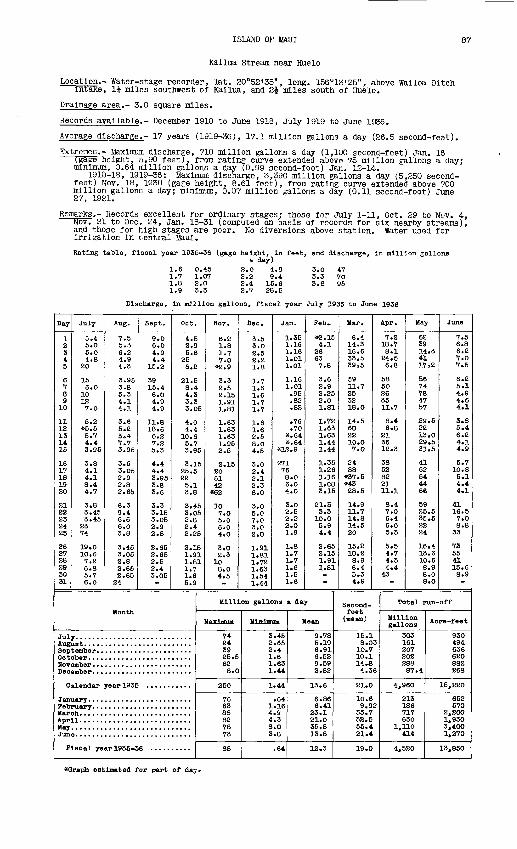
ISLAM) OF UAUI
Kallua Stream near Huelo
Location.- Water-stage recorder, lat. 20°52'35", long. 156°13'25", above Wailoa Ditch intake, li miles southwest of Kailua, and 24 miles south of Huelo.
Drainage area.- 3.0 square miles.
Records available.- December 1910 to June 1913, July 1919 to June 1936.
Average discharge.- 17 years (1919-36), 17.1 million gallons a day (26.5 second-fest).
^trenes.- Maximum discharge, 710 million gallons a day (1,100 second-feet) Jan. 16 (gage height, 5.90 feet), from rating curve extended above 75 million gallons a day; minimum, 0.64 million gallons a day (0.99 second-foot) Jan. 12-14.
1910-15, 1919-36: Maximum discharge, 3,390 million gallons a day (5,250 second- feet) Nov. 18, 1930 (gage height, 8.61 feet), from rating curve extended above 700 million gallons a day; minimum, 0.07 million gallons a day (0.11 second-foot) June 27, 1921.
Remarks.- Records excellent for ordinary stages; those for July 1-11, Oct. 29 to Nov. 4, Nov. 21 to Dec. 24, Jan. 13-31 (computed on basis of records for six nearby streams), and those Tor high stages are poor. No diversions above station. Water used for Irrigation in central Maul.
Rating table, fiscal year 1935-35 (gage height, In feet, and discharge, in million gallonsa day)
1.6 0.45 2.0
1.9
1.072.03.3
2.2 2.4 2.7
4.99.4
15.628.5
3.0 3.3 3.6
Discharge, In million gallons, fiscal year July 1935 to June 1936
Day
1 2 34 5
6 7 8 9 10
11 12 13 14 15
16 17 18 19 20
21 22 23 24 25
26 27 28 29 30 31
July
5.4 5,0 5.0 4.8
20
15 6.0
10 12 7.0
5.2 *5.5 5.7 4.4 3.95
3.8 4.1 4.1 8.4 4.7
3.8 3.45 3.45
23 74
19.0 10.6 7.2 6.8 5.7 6.0
Aug.
7.5 5.3 6.2 4.9 4.3
3.95 3.8 5.3 4.1 4.1
3.6 5.2 5.4 7.7 3.95
3.6 3.05 2.9 2.8 2.65
6.3 9.4 6.6 6.0 3.8
3.45 3.05 2.8 2.65 2.65 24
Sept.
9.0 6.0 4.9 4.4
15.2
39 15.4 6.0 4.9 4.9
11.8 18.6 6.2 7.2 5.3
4.4 4.4 3.95 3.8 3.6
3.3 3.15 3.05 2.9 2.8
2.65 2.65 2.5 2.4 3.05
Oct.
4.5 2.9 5.6
25 6.2
21.5 8.4 4.3 3.3 3.05
4.0 4.4
10.6 5.7 3.95
3.15 25.5 22 5.1 3.8
3.45 3.05 2.8 2.4 2.25
2.15 1.91 1.81 1.7 1.6 5.9
Month
Jul Augi Sep Oct NOT Dee
C
Jan Fob Mar Apr May Jun
P
alendar year 19 3£
iscal year 1935-3
Nov.
6.2 1.8 1.7 7.0
*2.9
3.3 2.5 E.15 1.91 1.81
1.63 1.63 1.63 1.95 2.5
2.15 20 61 42
«62
10 7.0 5.0 6.0 4.0
3.0 2.3
10 8.0 4.5
Dec.
3.5 3.0 2.5 2.2 1.8
1.7 1.6 1.6 1.7 1.7
1.6 1.6 2.5 8.0 4.5
3.0 2.4 2.1 2.3 8.0
3.0 5.0 7.0 3.0 2.0
1.91 1.81 1.72 1.63 1.54 1.44
Jan.
1.35 1.16 1.16 1.01 1.01
1.16 1.01 .95 .82 .82
.76
.70 «.64 *.64
*12.9
«71 76 8.0 6.0 4.0
3.0 2.5 2.2 2.0 1.9
1.8 1.7 1.7 1.6 1.5 1.6
Feb..
*2.15 4.1
26 63 7.8
3.6 2.9 2.25 2.0 1.81
1.72 1.63 1.63 1.44 1.44
1.35 1.26 1.16 1.68 3.15
21.5 3.3
10.0 5.9 4.4
2.65 2.15 1.91 1.81
Million gallons a day
Maximum
74 24 39 25.5 62 8.0
250
76 63 88 82 78 73
88
Minimum
3.45 2.65 2.4 1.6 1.63 1.44
1.44
.64 1.16 4.9 4.3 8.0 3.8
.64
Mean
9.78 5.19 6.91 6.52 9.59 2.82
13.6
6.86 6.41
23.1 21.0 35.8 13.8
12.3
Mar.
6.4 14.3 16.6 33.5 39.5
59 11.7 25 32 18.0
14.5 60 22 10.0 7.0
24 88 »37.5 *43 28.5
14.9 11.7 14.8 14.5 20
15.2 10.2 8.9 6.4 5.3 4.9
Apr.
7.2 18.7 8.1 24.5 6.8
58 50 26 35 11.7
8.4 6.8
21 36 12.3
38 52 82 21 11.1
8.4 7.0 6.4 6.0 5.3
5.5 4.7 4.3 4.4
43
Second- feet (mean)
15.1 8.03 10.7 10.1 14.8 4.36
21.0
10.6 9.92
35.7 38.5 55.4 21.4
19.0
May
62 39 14.3 41 17.2
56 74 78 47 57
29.5 22 13.0 29.5 31.5
41 62 54 44 66
59 25.5 35.5 22 24
16.4 13.6 10.6 8.9 8.0 8.0
June
7.5 6.8 6.2 7.0 7.5
6.2 5.1 4.9 4.6 4.1
3.8 5.4 6.2 4.1 4.9
5.7 10.8 5.1 4.4 4.1
41 16.5 7.0 8.8
33
73 55 41 15.6 8.9
Total run-off
Million gallons
303 161 207 202 288 87.4
4,960
213 186 717 630
1,110 414
4,520
Acre-feet
930 494 636 620 882 268
15,220
652 570
2,2OO 1,930 3,400 1,270
13,850
*Qraph estimated for part of day.
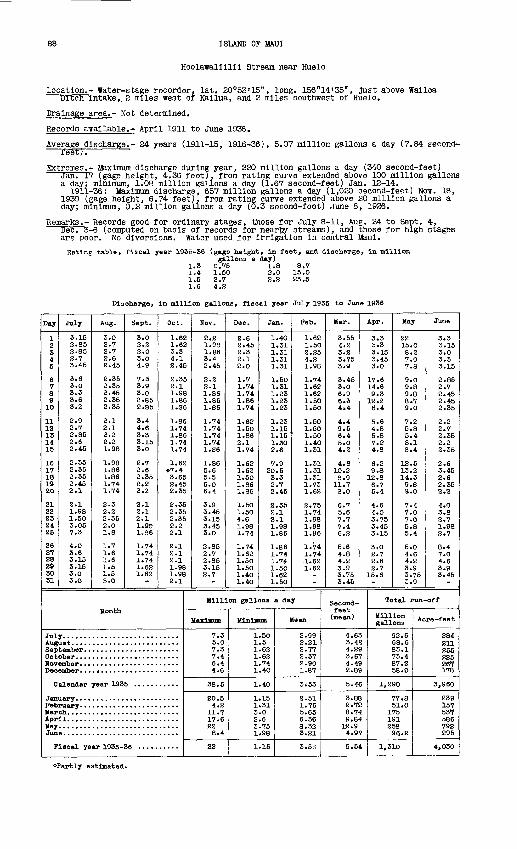
88 ISLAND OF MAUI
Hoolawallllll Stream near Huelo
Location.- Water-stage recorder, lat. 20 053'15", long. 156°14'35", Just above Walloa Dltcn Intake,. 2 miles west of Kailua, and 2 miles southwest of Huelo.
Drainage area.- Not determined.
Records available.- April 1911 to June 1936.
Average discharge.- 24 years (1911-15, 1916-36), 5.07 million gallons a day (7.84 second- feet).
Extremes.- Maximum discharge during year, 220 million gallons a day (340 second-feet) Jan. 17 (gage height, 4.36 feet), from rating curve extended above 100 million gallons a day; minimum, 1.08 million gallons a day (1.67 second-feet) Jan. 12-14.
1911-36: Maximum discharge, 657 million gallons a day (1,020 second-feet) Nov. 18, 1930 (gage height, 6.74 feet), from rating curve extended above 20 million gallons a day; minimum, 0.2 million gallons a day (0.3 second-foot) June 8, 1926.
Remarks.- Records good for ordinary stages, those for July 8-11, Aug. 24 to Sept. 4, Dec. 3-6 (computed on basis of records for nearby streams), and those for high stages are poor. No diversions. Water used for irrigation in central Maul.
Rating table, fiscal year 1935-36 (gage height, in feet, and discharge, In milliongallons a day)
1.3 0.75 1.8 8.7 1.4 1.50 2.0 15.0 1.5 2.7 2.2 23.5 1.6 4.2
Discharge, In million gallons, fiscal year July 1935 to June 1936
Day
1 2 3 4 5
6 7a9
10
1112 13 14 15
16 17 18 19 20
21 22 23 24 25
26 27 28 2930 31
July
3.15 2.85 2.85 2.7 3.45
3.0 3.3 3.6
2.9 2.7 2.85 2.6 2.45
2.35 2.35 2.35 2.45 2.1
2.1 1.98 1.50 3.05 7.3
4.0 3.6 3.15 3.15 3.0 3.0
Aug.
3.02.7 2.7 2.6 2.45
2.35 2.35 2.45 2.35 2.35
2.1 2.1 2.2 2.2 1.98
1.98 1.86 1.86 1.74 1.74
2.3 2.2 2.35 2.0 1.8
1.7 1.6 1.6 1.5 1.5 5.0
Sept.
3.0 2.2 2.0 3.0 4.9
7.3 3.9 3.0 2.85 2.35
3.4 4.6 3.3 3.15 3.0
2.7 2.6 2.35 2.2 2.2
2.1 2.1 2.1 1.96 1.86
1.74 1.74 1.74 1.62 1.62
Oct.
1.62 1.62 3.3 4.1 2.45
2.35 2.1 1.98 1.86 1.S6
1.86 1.74 1.86 1.74 1.74
1.62 *7.4 3.65 2.45 2.35
2.35 2.35 2.35 2.2 2.1
2.1 2.1 2.1 1.98 1.98 2.1
Month
Jul Aug Sep Oct HOT Dec
C
Jan Fob Mar Apr May Jun
PIscal year 1935-
Nov.
2.21.93 1.86 3.4 2.45
2.2 2.1 1.86 1.86 1.86
1.74 1.74 1.74 1.74 1.S6
1.86 5.6 5.5 6.0 6.4
3.9 3.45 3.15 3.45 3.0
2.85 2.7 2.85 3.15 2.7
Dec.
2.6 2.45 2.3 2.1 2.0
1.7 1.74 1.74 1.86 1.74
1.62 1.50 1.86 2.1 1.74
1.62 1.62 1.50 1.86 1.86
1.50 1.50 4.6 1.98 1.74
1.74 1.62 1.50 1.50 1.40 1.40
Jan.
1.40 1.31 1.31 1.31 1.31
1.50 1.31 1.23 1.23 1.23
1.23 1.15 1.15 1.30 2.6
7.9 20.5 3.3 2.7 2.45
2.35 2.1 2.1 1.98 1.86
1.86 1.74 1.74 1.50 1.62 1.50
Feb.
1.62 1.50 2.25 4.2 1.98
1.74 1.62 1.62 1.50 1.50
1.50 1.50 1.50 1.40 1.31
1.31 1.31 1.31 1.73 1.62
2.75 1.74 1.98 1.98 1.86
1.74 1.74 .1.62 1.62
Million gallons a day
Maximum
7.3 5.0 7.3 7.4 6.4 4.6
38.5
20.5 4.2
11.7 17.6 22 8.4
22
Minimum
1.50 1.5 1.62 1.62 1.74 1.40
1.40
1.15 1.31 3.0 2.6 3.75 1.98
1.15
Mean
2.99 2.21 2.77 2.37 2.90 1.87
3*53
2.51 1.76 5.65 6.36 8.32 3.21
3. 55
Mar.
3.55 4.2 3.2 3.75 3.9
3.45 3.0 6.9 6.3 4»4
4.4 9.5 6.4 5.0 4.2
4.8 10.2 3.9
11.7 8.0
6.7 5.67.7 7.4 6.2
5.6 4.8 4.2 3.9 3.75 3.45
Apr.
3.3 3.3 3.15 3.45 3.0
17.6 14.6 9.3
12.2 6.4
5.6 4.8 5.8 7.2 4.8
6.2 9.8
12.8 6.7 5.4
4.6 4.0 3.75 3.45 3.15
3.0 2.7 2.6 2.7
15.6
Second- feet
(mean)
4.63 3.42 4.29 3.67 4.49 2.89
5.46
3.88 2.72 8.74 9.84
12.9 4.97
5.54
May
22 15.0 8.2 7.0 7.8
9.0 9.8 9.8 8.7 9.0
7.2 5.3 5.4 8.1 8.4
12.5 13.2 14.3 9.8 9.0
7.4 7.0 7.0 5.8 5.4
5.0 4.6 4.2 3.93.75 3.9
June
3.3 3.15 3.0 3.3 3.15
2.85 2.7 2.45 2.45 2.35
2.2 2.7 2.35 2.2 2.35
2.6 3.45 2.6 2.35 2.2
4.0 3.8 2.7 1.98 2.7
8.4 7.0 4.6 3.9 3.45
Total run-off
Million gallons
92.6 68.6 83.1 73.4 87.2 58.0
1,290
77.8 51.0
175 191 258 96.2
1,310
Acre-feet
284 211 255 225 267 178
3,960
239 157 537 586 792 295
4,030
^Partly estimated.
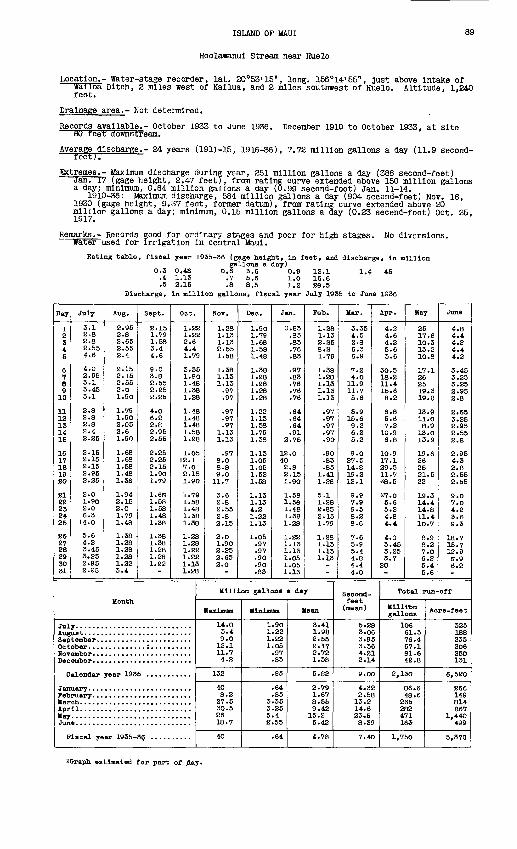
ISLAND OF MAUI 89
Hoolawanui Stream near Huelo
Location.- Water-stage recorder, lat. 20°53'15", long. 156°14'55", Just above Intake of wailoa Ditch, 2 miles west of Kallua, and 2 miles southwest of Huelo. Altitude, 1,240 fest.
Drainage area.- Not determined.
Records available.- October 1933 to June 1936. December 1910 to October 1933, at site so reet downstream.
Average discharge.- 24 years (1911-15, 1916-36), 7.72 million gallons a day (11.9 second- reetj.
Extremes.- Maximum discharge during year, 251 million gallons a day (388 second-feet) Jan. 17 (gage height, 2.47 feet;, from rating curve extended above 150 million gallons a day; minimum, 0.64 million gallons a day (0.99 second-foot) Jan. 11-14.
1910-36: Maximum discharge, 584 million gallons a day (904 second-feet) Nov. 18, 1930 (gage height, 9.37 feet, former datum), from rating curve extended above 20 million gallons a day; minimum, 0.15 million gallons a day (0.23 secend-foot) Oct. 25, 1917.
Remarks.- Records good for ordinary stages and poor for high stages. No diversions, water used for Irrigation in central Maul.
Rating table, fiscal year 1935-36 (gage height, in feet, and discharge, in milliongallons a day)
0.3 0.4S 0.6 3.6 0.9 12.1 1.4 45 .4 1.13 .7 5.6 l.O 16.6 .5 2.15 .8 8.5 1.2 26.5
Discharge, in million gallons, fiscal year July 1935 to June 1936
Day
1 2 3 4 5
6 7 8 9 10
11 12 13 14 15
16 17 18 19 20
21 22 23 24 25
26 27 28 29 30 31
July
3.1 2.8 2.8 2.55 4.6
4.0 2.95 3.1 3.453.1
2.8 2.8 2.8 2.4 2.25
2.15 2.15 2.15 2.95 2.25
2.0 1.9O 2.0 6.3
14. 0
5.6 4.2 3.45 3.25 2.95 2.S5
Aug.
2.95 2.8 2.65 2.55 2.4
2.15 2.15 2.55 2.0 1.90
1.79 1.90 2.05 2.6 1.9O
1.68 1.68 1.58 1.48 1.3S
1.94 2.15 2.0 1.79 1.48
1.38 1.28 1.28 1.28 1.22 3.4
Sept.
2.15 1.79 1.58 3.4 4.6
9.0 3.8 2.55 2.25 2.25
4.O 6.2 2.8 2.95 2.55
2.25 2.25 2.15 1.9O 1.79
1.6S 1.58 1.58 1.48 1.38
1.38 1.38 1.28 1.28 1.22
Oct.
1.22 1.22 2.6 4.4 1.79
3.35 1.90 1.48 1.38 1.28
1.48 1.48 1.48 1.58 1.28
1.O5 12.1 7.0 2.15 1.9O
1.79 1.58 1.48 1.38 1.38
1.28 1.28 1.22 1.22 1.13 1.28
Month
Jul Aug Sep Oct HOT Dec
C
Jan Feb Mar Apr May Jun
P
alendar year 193
iseal year 1935-
Nov.
1.28 1.13 1.13 2.55 1.58
1.38 1.13 1.13 .97 .97
.97
.97
.97 1.13 1.13
.97 8.O 8.8 9.0 11.7
3.6 2.8 2.55 2.8 2.15
2.0 1.9O 2.25 2.65 2.0
Dec.
1.9O 1.79 1.68 1.58 1.48
1.38 1.28 1.28 1.28 1.28
1.22 1.13 1.58 1.79 1.38
1.13 1.O5 1.05 1.52 1.58
1.13 1.13 4.2 1.22 1.13
1.O5 .97 .97 .90 .90 .83
Jan.
0.83 .83 .83 .76 .83
.97
.83
.76
.76
.76
.64
.64
.64
.91 2.75
12.0 40 2.8 2.15 1.9O
1.58 1.56 1.48 1.38 1.28
1.22 1.13 1.13 1.05 1.05 1.13
Feb.
1.28 1.13 2.25 8.2 1.79
1.38 1.28 1.13 1.13 1.13
.97
.97
.97
.97
.90
.90
.83 83
1.41 1.28
5.1 1.28 2.85 2.15 1.79
1.28 1.13 1.13 1.13
Million gallons a day
Maximum
14.0 3.4 9.O 12.1 11.7 4.2
132
40 8.2 27.5 30.5 26 18.7
40
mnlmrm
1.90 1.221.22 1.O5 .97 .83
.83
.64
.83 3.35 3.25 5.4 2.55
.64
Mean
3.41 1.98 2.55 2.17 2.72 1.38
5.82
2.79 1.67 8.55 9.42
15.2 5.42
4.78
Mar.
3.35 4.5 2.8 6.3 6.9
7.2 4.0
11.9 11.7 5.6
5.9 15.6 9.2 6.2 5.2
9.0 27. E 14.8 19.212.1
9.9 7.9 9.5 8.2 8.6
7.6 5.9 5.4 4.8 4.4 4.0
Apr.
4.2 4.6 4.2 5.6 3.6
30.5 18.2 11.4 15.6 8.2
6.8 5.6 7.2 10.9 6.8
10.9 17.1 29.5 11.7 «8.5
«7.0 5.6 5.2 4.8 4.4
4.0 3.45 3.25 3.7 20
Second- feet (mean)
5.28 3.O6 3.95 3.36 4.21 2.14
9.00
4.32 2.58 13.2 14.6 23.5 8.39
7.40
Hay
25 17.6 1O.3 13.2 10.8
17.1 26 25 19.3 19.8
13.9 11.0 8.9
13. 0 13.9
19.6 26 25 21.5 22
19.3 14.4 14.8 11.4 1O.7
8.9 8.2 7.0 6.2 5.4 5.6
June
4.8 4.4 4.2 4.4 4.2
3.45 3.25 3.25 2.95 2.8
2.65 3.25 2.95 2.55 2.8
2.95 4.3 2.8 2.55 2.55
9.O 7.0 4.2 3.6 9.3
18.7 15.7 12.9 S.9 6.2
Total run-off
Hlllltm gallons
106 61.3 76.4 67.1 81.6 42.8
2,13O
86.6 48.6
265 282 471 163
1,750
Acre-feet
325 188 235 206 250 131
6,520
266 149 814 867
1,440 499
5,370
KGraph estimated for part of .day.
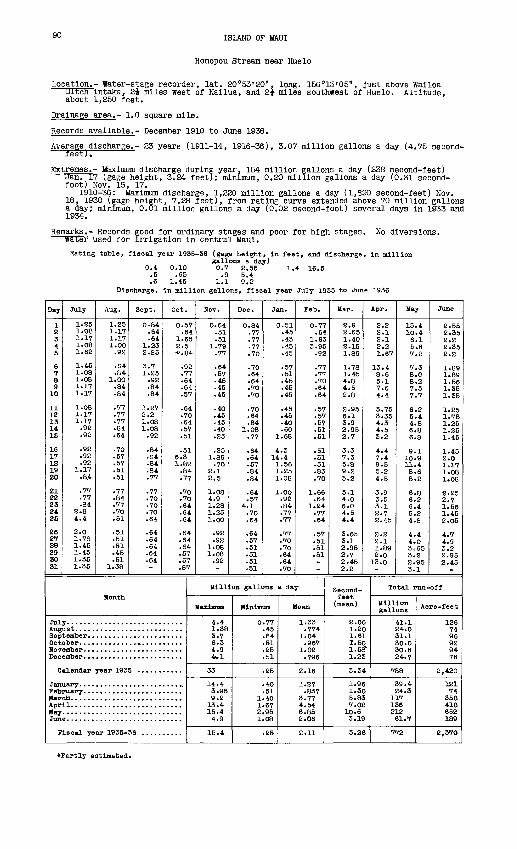
ISLAND OF MAUI
Honopou Stream near Huelo
Location.- Water-stage recorder, lat. 20°53'20", long. 156°15'05't , just above Wailoa Ditch intake, 2i miles west of Kailua, and 2i miles southwest of Huelo. Altitude, about 1,250 feet.
Drainage area.- 1.0 square mile.
Records available.- December 1910 to June 1936.
Average discharge.- 23 years (1911-14, 1916-36), 3.07 million gallons a day (4.75 second- feet).
Extremes.- Maximum discharge during year, 154 million gallons a day (238 second-feet) Jan. 17 (gage height, 3.24 feet); minimum, 0.20 million gallons a day (0.31 second- foot) Nov. 15, 17.
1910-36: Maximum discharge, 1,220 million gallons a day (1,890 second-feet) Nov. 18, 1930 (gage height, 7.28 feet), from rating curve extended above 70 million gallons a day; minimum, 0.01 million gallons a day (0.02 second-foot) several days in 1933 and 1934.
Remarks.- Records good for ordinary stages and poor for high stages. No diversions, water used for irrigation in central Maul.
Rating table, fiscal year 1935-36 (gage height, in feet, and discharge, in milliongallons a day)
0.4 0.10 O.Y 2.55 1.4 16.5 .5 .65 .9 5.4 .6 1.45 1.1 9.2
Discharge, In million gallons, fiscal year July 1935 to June 1936
Day
1 2 3 4 5
6 7 8 9
10
11 12 13 14 15
16 1Y IS 19 20
21 22 23 2425
26 27 28 29 30 31
July
1.25 1.08 1.1Y 1.08 1.62
1.45 1.08 1.08 1.17 1.17
1.08 1.1Y 1.17 .92 .92
.92
.92
.92 1.17
8.4
.Y7
.77
.84 2.8 4.4
2.0 l.YS 1.45 1.45 1.35 1.35
Aug.
1.25 1.17 1.17 1.00 .92
.S4
.84 1.00 .84 .84
.77
.77
.77
.84
.64
70 .57 .57 .51 .51
.77
.84
.77
.70
.51
.51
.51
.51
.45
.51 1.38
Sept.
0-84 .64 .64
1.23 2.85
3.Y 1.25 .92 .84 .84
1.27 2.2 1.08 1.08 .92
.84 S4 .84 .84 .77
.77
.70
.70
.70
.64
.64
.64
.64
.64
.64
Oct.
0.57 .64
1.65 2.5 *.84
.92
.77
.64
.64
.57
.64
.70
.64
.57
.51
.51 6.3 1.82 .84.77
.70
.70
.64
.64
.64
.64
.64
.64
.57
.57
.57
Month
Jul Augi Sep Oct Hov Dec
C
Jan Feb Mar Apr
52
F
alendar year 193
lacal year 1935-
Nov.
0.64 .51 .51
1.79 .77
.64
.57
.45
.45
.45
.40
.45
.45
.40
.25
.25 1.89 .70
2.1 2.5
1.08 4.9 1.28 1.25 1.00
.92
.92 1.08 1.08 .92
Dec.
0.84 .77 .77 .77 .70
.70
.64
.64
.70
.70
.70
.64
.84 1.08 .77
.64
.64
.57
.84
.84
.64
.57 4.1 .70 .64
.64
.57
.51
.51
.51
.51
Jan.
0.51 .45 .45 .45.45
.57
.51
.45
.45
.45
.45
.45 40 .60
1.68
4.3 14.4 1.56 1.25 1.08
1.00 .92 .84 .77 .77
.77
.70
.70
.64
.64
.70
Feb.
0.77 .64
1.63 3.95 .92
.77
.77
.70 64 .64
.57
.57
.57
.51
.51
.51
.51
.51
.83
.70
1.66 .64
1.24 .77 .64
.57
.51
.51
.51
Million gallons a day
Maximum
4.4 1.38 3.7 6.3 4.9 4vl
33
14.4 3.95 9.2 13.4 15.4 4.9
15.4
Minimum
0.77 .45 .64 .51 .25 .51
.25
.40
.51 1.40 1.67 2.95 1.08
.25
Mean
1.33 .774
1.04 .967
1.02 .796
2.16
1.27 .837
3.77 4.54 6.85 2.06
2.11
Mar.
2.9 2.65 1.40 2.15 1.89
1.78 1.45 4.8 4.5 2.8
2.95 6.1 3 .9 2.95 2.7
3.3 7.3 5.8 9.2 5.2
5.1 4.0 6.0 4.5 4.4
3.65 3.2 2.95 2.7 2.45 2.2
Apr.
2.2 2.1 2.1 2.21.67
13.4 8.6 5.1 7.6 4.4
3.75 3.35 4.3 4.5 3.2
4.4 7.4 9.5 5.2 4.5
3.9 3.5 3.1 2.7 2.45
2.2 2.1 1.89 2.0 13.0
Second- feet (mean)
2.06 1.20 1.61 1.50 1.58*
1.23
3.34
1.96 1.30 5.83 7.02
10.6 3.19
3.26
May
15.4 10.4 6.1 5.67.2
7.3 8.0 8.2 7.5 7.7
6.2 5.4 4.8 6.8 6.8
9.1 10.9 11.4 8.6 8.2
6.8 6.2 6.4 5.? 4.8
4.4 4.0 3.65 3.2 2.95 3.1
June
2.55 2.35 2.2 2.35 2.2
1.89 1.89 1.56 1.35 1.35
1.25 1.78 1.25 1.25 1.45
1.45 2.0 1.17 1.08 1.08
2.25 2.7 1.56 1.45 2.05
4.7 4.9 3.2 2.95 2.45
Total run-off
Million gallons
41.1 24.0 31.1 30.0 30.6 24.7
788
39.4 24.3 117 136 212 61.7
772
Acre -feet
126 74 96 92 94 76
2,420
121 74
358 418 652 189
2,370
*Partly estimated.
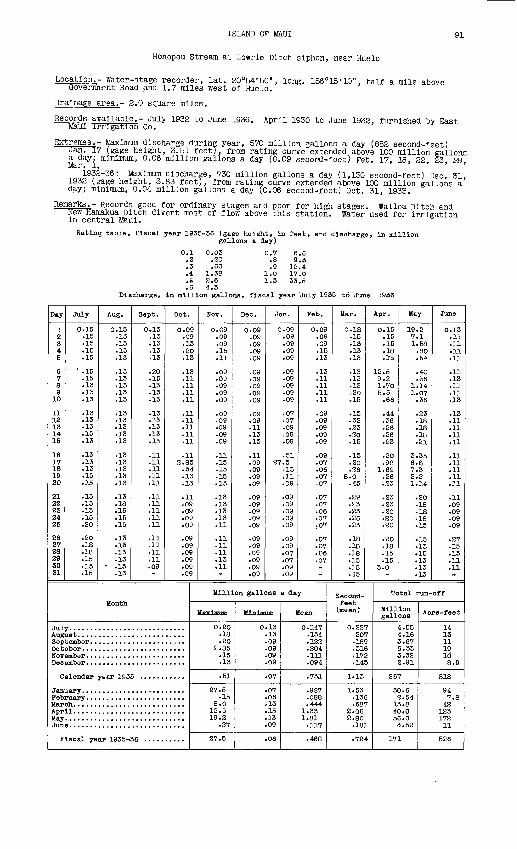
ISLAND OF MAUI
Honopou Stream at Lowrie Ditch siphon, near Huelo
Location.- Water-stage recorder, lat. 20°54'50", long. 156°15'10", half a mile above Government Road and 1.7 miles west of Huelo.
Drainage area.- 2.0 square miles.
Records available.- July 1932 to June 1936. April 1930 to June 1932, furnished by East Maul irrigation Co.
Extremes.- Maximum discharge during year, 570 million gallons a day (882 second-feet) Jan. 17 (gage height, 3.51 feet], from rating curve extended above 100 million gallons a.day; minimum, 0.06 million gallons a day (0.09 second-foot) Feb. 17, 18, 22, 23, 28 Mar. 1.
1932-36: Maximum discharge, 730 million gallons a day (1,130 second-feet) Dec. 31. 1932 (gage height, 3.83 feet), from rating curve extended above 100 million gallons a day; minimum, 0.04 million gallons a day (0.06 second-foot) Oct. 31, 1933.
Remarks.- Records good for ordinary stages and poor for high stages. Walloa Ditch and Hew Hamakua Ditch divert most of flow above this station. Water used for irrigation in central Maul.
Rating table, fiscal year 1935-36 (gage height, in feet, and discharge, in million gallons a day)
0.1 .2 .3 .4
0.03.20.60
1.382.64.3
1.0 1.3
6.6 9.3
12.417.033.5
Discharge, in million gallons, fiscal year 'July 1935 to June 1936
Day
1 2 34 5
6 7 89
10
11 12 13 14 15
16 17 18 19 20
21 22 23 24 25
26 27 28 29 30 31
July
0.15 .15 .15 .15 .15
' .15 .15 .13 .13 .13
.13
.13
.13
.15
.13
.13
.13
.13
.15
.15
.13
.13
.13
.15
.20
.20
.18
.18
.15
.15
.15
Aug.
0.15 .13 .13 .13 .13
.13
.13
.13
.13
.13
.13
.13
.13
.13
.13
.13
.13
.13
.13
.13
.13
.18
.15
.15
.15
.13
.13
.13
.13 .13
.13
Sept.
0.13 .13 .13 .13 .13
.20
.15
.13
.13
.13
.13
.13
.13
.13
.13
.11
.11
.11
.11
.11
.11
.11
.11
.11
.11
.11
.11
.11
.11
.09
Oct.
0.09.09 .13 .20 .13
.13
.11
.11
.11
.11
.11
.11
.11
.11
.11
11 2.85 .34 .13 .13
.11
.09
.09
.09
.09
.09
.09
.09
.09
.09
.09
Month
Jul Augi Sep Oot HOT Dee
C
Jan Feto- Mar Apr May Jun
F
alendar year 193
11...........................
e
iseal year 1935-
Nov.
0.09 .09 .09 .15 .11
.09
.09
.09
.09
.09
.09
.09
.09
.09
.09
.11
.15
.15
.15
.13
.13
.13
.13
.13
.11
.11
.11
.11
.13
.11
Dec.
0.09.09 .09 .09 .09
.09
.09
.09
.09
.09
.09
.09
.11
.13
.13
.11
.09
.09
.09
.09
.09
.09
.09
.09
.09
.09
.09
.09
.09
.09
.09
Jan.
0.09 .09 .09 .09 .09
.09
.09
.09
.09
.09
.07
.07
.09
.09
.09
.51 27.5
.13
.11
.09
.09
.09
.09
.09
.09
.09
.09
.07 07 .09 .09
Feb.
0.09 .09 .09 .15 .13
.13
.11
.11
.11
.11
.09
.09
.09
.09
.09
.09
.07
.06
.07
.07
.07
.07
.06
.07
.07
.07
.07
.06
.07
Million gallons a day
Ma*!*
0.20 .18 .20
2.85 .15 .13
.51
27.5 .15
8.0 12.5 19.2
.27
27.5
Mi.TtJ.HTVP1"
0.13 .13 .09 .09 .09 .09
.07
.07
.06
.13
.15
.13
.09
.06
Mean
0.147 .134 .122 .204 .111 .094
.731
.937
.088
.444 1.33 1.81 .117
.468
Mar.
0.18 .15 .13 .13 .13
.13
.13 13 .20 .15
.13
.32
.23
.20
.15
13 .20 .26
8.0 .45
.29
.23
.23
.26
.23
.18
.18
.18
.15
.15
.15
Apr.
0.15 .15 .15 .18 .15
12.5 9.2 1.70 5.5 .66
.44
.36
.26
.26
.23
.20
.98 1.69 .26 .23
.23
.23
.20
.20
.20
.20
.18
.15
.15 3.0
Second- feet (mean)
0.227 .207 .189 .316 .172 .145
1.13
1.53 .136 .687
2.06 2.80 .181
.724
May
19.7. 1.
1. 1.
3. 6.7. 2.1.
21 58 80 54
40 36 14 07 36
23 18 18 18 21
35 8 3 2 14
20 18 18 18 15
15 13 15 13 13 13
June
0.13.11 .11 .11 .11
.11
.13
.11
.11
.13
.13
.11
.11
.11
.11
.11
.11
.11
.11
.31
.11
.09
.09
.09
.09
.27
.15
.13
.11
.11
Total run-off
Million gallons
4.55 4.16 3.67 6.33 3.32 2.91
267
30.6 2.54 13.8 40.0 56.0 3.52
171
Acre-feet
14 13 11 19id8.9
818
94 7.8
42 123 172 11
526
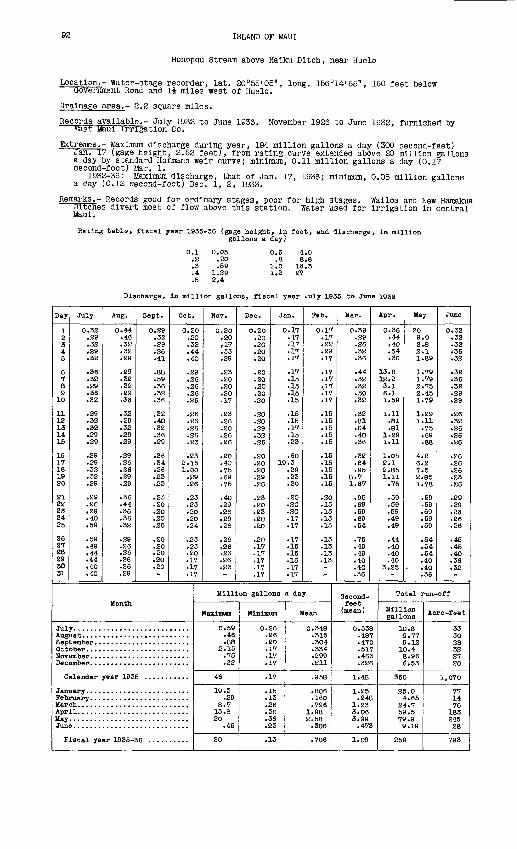
92 ISLAND OF MAUI
Honopou Stream above Haiku Ditch, near Huelo
Location.- Water-stage recorder, lat. 20°55'05", long. 156°14'55", 150 feet below Government Road and li miles west of Huelo.
Drainage area.- 2.2 square miles.
Records available.- July 1932 to June 1936. November 1926 to June 1932, furnished by uast Maul irrigation Co.
Extremes.- Maximum discharge during year, 194 million gallons a day (300 second-feet) Jan. 17 (gage height, 2.52 feet), from rating curve extended above 20 million gallons a day by standard Hofmann weir curve; minimum, 0.11 million gallons a day (0.17 second-foot) Mar. 1.
1932-36: Maximum d-lscharge, that of Jan. 17, 1936; minimum, 0.08 million gallons a day (0.12 second-foot) Dec. 1, 2, 1933.
Remarks.- Records good for ordinary stages, poor for high stages. Walloa and New Hamakua uitcnes divert most of flow above this station. Water used for Irrigation In central Maul.
Rating table, fiscal year 1935-36 (gaga height, in feet, and discharge, in milliongallons a day)
0.1 .2 .3.4
0.05.20.59
1.292.4
1.0 1.2
4.08.8
16.327
Discharge, In million gallons, fiscal year July 1935 to June 1936
Day
1 2 3 4 5
6 7 8 9
10
11 12 13 14 15
16 17 18 19 20
21 22 23 24 25
26 27 28 29 SO 31
July
0.32 .29 .32 .29 .32
.36
.32
.29
.36
.32
.29
.32
.32
.29
.29
.29
.29
.32
.32
.29
.29
.26
.29
.40
.59
.59
.49
.44
.44
.40
.40
Aug.
0.44 .46 .32 .32 .29
.29
.32
.32
.29
.36
.32
.29
.32
.29
.29
.29
.26
.26
.29
.29
.36
.44
.36
.36
.32
.29
.26
.26
.26
.26
.29
Sept.
0.29 .32 .29 .26 .41
.88
.59
.36
.32
.36
.32
.40
.32
.36
.29
.26
.34
.26
.23
.23
.23
.20
.20
.20
.20
.20
.20
.20
.20
.20
Oct.
0.20 .20 .32 .44 .40
.29
.26
.26
.26
.26
.26
.26
.26
.26
.23
.23 2.15 1.00
.29
.26
.23
.23
.20
.20
.24
.23
.23
.20
.17
.17
.17
Month
Jul Augi Sep
Hov Dec
C
Jan Feb Mar Apr May Jun
P
alendar year 193
iacal year 1935-
Noy.
0.20 .20 .17 .33 .29
.23
.20
.20
.20
.17
.23
.26
.20
.26
.26
.20
.40
.75
.69
.75
.40
.29
.26
.29
.26
.26
.26
.26 .26 .23
Dec.
0.20 .20 .20 .20 .20
.20
.20
.20
.20
.20
.20
.20
.29
.32
.26
.20
.20
.20
.29
.26
.23 .20 .23 .20 .20
.20
.17
.17
.17
.17
.17
Jan.
0.17 .17.17 .17 .17
.17
.15
.15
.15
.15
.15
.15
.17
.15
.23
.60 19.3
.29
.23
.20
.20
.20
.20
.17
.17
.17
.15
.15 15.17 .17
Feb.
0.17 .17 .22 .29.17
.17
.17
.17
.'17
.17
.15
.15
.15
.15
.15
.15
.15
.15
.15
.15
.20
.15
.15
.13
.13
.13
.13
.13
.13
Million gallons a day
Maximum
0.59 .46 .88
2.15 .75 .32
46
19.3 .29
8.7 13.8 20
.45
20
Minimum
0.26 .26 .20 .17 .17 .17
.17
.15
.13
.26
.36
.36
.23
.13
Mean
0.348 .315 .304 .334 .299 .211
.958
.806
.160
.796 1.98 2.58
.306
.706
Mar.
0.39 .29 .26 .32 .36
.44
.32
.32
.50
.32
.32
.81
.64
.40
.36
.32
.64
.95 8.7 1.67
.95
.69
.59
.69
.54
.75
.49
.49
.40
.40
.36
Apr.
0.36 .44 .40 .54 .36
13.8 12.2 3.1 6.1 1.59
1.11 .81 .81
1.29 1.11
1.05 2.1 2.85 1.11
.75
.59
.59
.59
.49
.49
.44
.40
.40
.40 3.25
Second- feet
(mean)
0.538 .487 .470 .517 .463 .326
1.48
1.25 .248
1.23 3.06 3.99
.473
1.09
May
20 9.0 2.8 2.1 1.89
1.79 1.79 2.75 2.45 1.79
1.29 1.11
.75
.69
.88
4.8 6.2 7.5 2.85 1.78
.59 -59 .59 .59 .59
.54
.54
.54
.40
.40
.36
June
0.32 .32 .32 .36 .32
.32
.36
.32
.29
.29
.26
.32
.26
.26
.26
.26
.26
.26
.23
.86
.29
.29
.26
.26
.26
.45
.45
.40
.36
.32
Total run-off
Million gallons
10.8 9.77 9.12
10.4 8.96 6.53
350
25.0 4.65
24.7 59.5 79.9 9.19
259
Acre-Teet
33 30 28 32 27 20
1,070
77 14 76
183 245 28
793
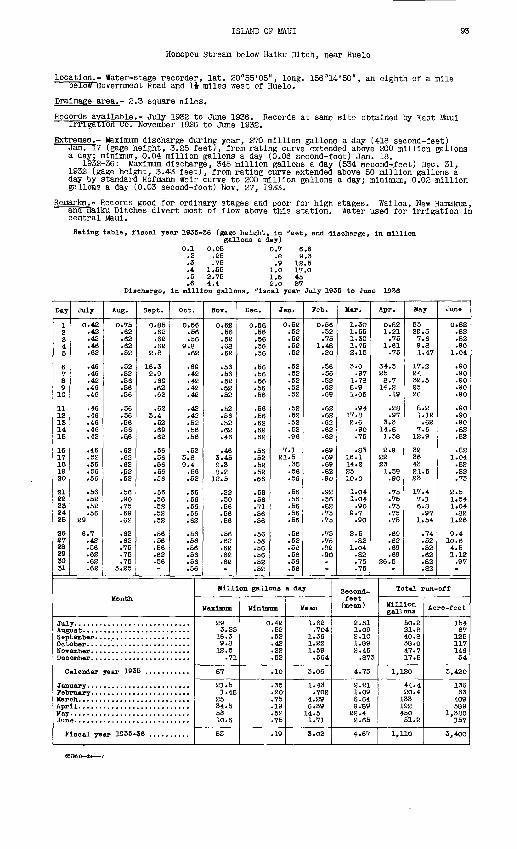
ISLAND OF 1BUJI 93
Honopou Stream below Haiku Ditch, near Huelo
Location.- Water-stage recorder, lat. 20°55'05", long. 156 014'50", an eighth of a mile oeiow Government Road and li miles west of Huelo.
Drainage area.- 2.3 square miles.
Records available.- July 1932 to June 1936. Records at same site obtained by ^ast Maul irrigation uo. November 1926 to June 1932.
Extremes.- Maximum discharge during year, 270 million gallons a day (418 second-feet) Jan. 17 (gage height, 3.25 feetT, from rating curve extended above 200 million gallons a day; minimum, 0.04 million gallons a day (0.06 second-foot) Jan. 18.
1932-36: l&ximum discharge, 345 million gallons a day (534 second-^eet) Dec. 31, 1932 (gage height, 3.43 feet), from rating curve extended above 50 million gallons a day by standard Hofmann weir curve to 200 million gallons a day; minimum, 0.02 million gallons a day (0.03 second-foot) Nov. 27, 1933.
Remarks.- Records good for ordinary stages and poor for high stages. Walloa, New Hamakua, ana Hallcu Ditches divert most of flow above this station. Water used for irrigation in central Maul.
Rating table, fiscal year 1935-36 (gage height, In feet, and discharge, in milliongallons a day)
0.1 0.05 0 7 6.6 .2 .25 6 9.3 .3 .75 S 12.5 .4 1.55 10 17.0 .5 2.75 15 45 .6 4.4 2 0 S7
Discharge, In million gallons, fiscal year July 1S35 to June 1936
Day
1 2 3 4 5
6 7 8 9
10
11 12 13 14 15
16 17 18 19 20
21 22 23 24 25
26 27 28 2930 31
July
0.42 .42 .42 .46 .62
.46
.46
.42
.46
.46
.46
.46
.46
.46
.42
.46
.52
.56
.56
.56
.56
.52
.52
.56 29
6.7 .42 .56 .62 .62 .62
Aug.
0.75 .62 .62 .62 .52
.52
.52
.56
.56
.56
.56
.56
.56
.56
.5,6
.62
.62
.62
.52
.52
.56
.90
.75
.69
.62
.62
.62
.75
.75
.75 3.25
Sept.
0.85 .62 .62 .62
2.8
16.3 2.9
.69
.62
.62
.62 3.4
.52
.69
.62
.56
.56
.56
.56
.56
.56
.56
.52
.52
.52
.56
.56
.56
.62
.56
Oct.
0.56 .56 .56
9.8 .62
.69
.42
.42
.42
.42
.42
.42
.52
.56
.56
.52 3.8 9.4
.56
.52
.56
.56
.56
.56
.62
.56
.56
.56
.56
.56
.56
Month
Jul Aug Sep Oct NOT Dec
C
Jan Peb Mar Apr May Jun
P
alendar year 193 5 ...........
iscal year 1935-
Nov.
0.62 .56 .52 .68 .62
.56
.56
.52
.52
.52
.52
.56
.52
.62
.46
.46 3.45 9.3 8.2
12.5
.22
.50
.56
.56
.56
.56
.62
.62
.62
.62
Dec.
0.56 .56 .56 .56 .56
.56
.56
.56
.56
.56
.56
.56
.62
.62
.62
.56
.52
.52
.52
.56
.56
.56
.71
.56
.56
.56
.56
.56
.56
.52
.52
Jan.
0.52 .52 .52 .52 .52
.52
.52
.52
.52
.52
.52
.52
.52
.52
.96
7.1 21.5
.35
.56
.56
.56
.56
.56
.56
.56
.56
.52
.52
.56
.56
.56
Million gallons
Maxlmnn
29 3.25
16.3 9.8
12.5 .71
87
21.5 1.48
25 34.5 53 10.6
53
Minimum
0.42 .52 .52 .42 .22 .52
.10
.35
.20'
.75
.19
.52
.75
.19
Peb.
0.56 .52 .75
1.48 .20
.56
.56
.62
.62
.69
.62
.62
.62
.62
.62
.69
.69
.69
.82
.90
.92
.56
.82
.75
.75
.75
.75
.82
.90
a day
Mean
1.62 .704
1.36 1.22 1.59
.564
3.06
1.43 .702
4.29 6.39
14.5 1.71
3.02
Mar.
1.30 1.55 1.30 1.75 2.15
3.0 .97
1.78 8.9 1.05
.94 17.8 2.6
.90
.75
.83 16.1 14.2 25 10.0
1.04 1.04
.90 9.7
.90
2.5 .82
1.04 .82 .75 .75
Second- feet
(mean)
Apr.
0.82 1.21
.75 1.61
.75
34.5 25 8.7
14.2 .19
.28
.97 3.3
14.8 1.38
2.9 22 23
1.59 .90
.75
.75
.75
.75
.75
.69
.62
.69
.69 26.5
May
53 29
7 9 1
17 24 32 2526
8 1
7 12
32 36 43 21 23
17 7 6
1
5 6 8 47
2
5
2 12 62 6 9
5
41 8 97 54
74 52 52 62 82 82
June
0.82 .82 .82 .90
1.04
.90
.90
.90
.90
.90
.90
.90
.90
.82
.82
.82 1.04
.82
.82
.75
2.5 1.54 1.04
.82 1.26
9.4 10.6 4.5 1.12
.97
Total run-off
Million gallons
2.51 50.2 1.09 21.8 2.10 40.8 1.89 38.0 2.46 47.7
.873 17.5
4.73 1,120
2.21 44.4 1.09 20.4 6.64 133 9 .89 192
22.4 450 2.65 5'1.2
4.67 1,110
Acre-feet
154 67
125 117 146 54
3,420
136 63
409 589
1,380 157
3,400
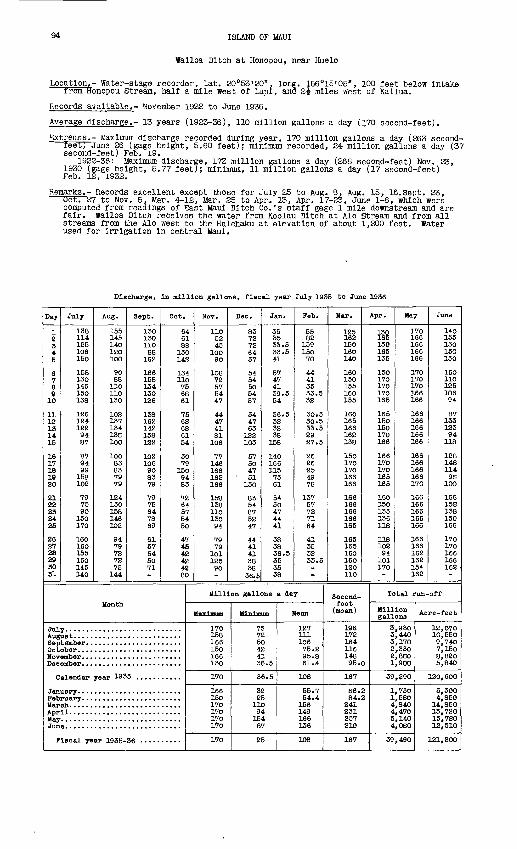
94 ISLAND OF MAUI
Wailoa Ditch at Honopou, near Huelo
Location.- Water-stage recorder, lat. 20 053 I 20n , long. 156°15'05", 100 feet below intake from Honopou Stream, half a mile west of Lupi, and Z\ miles west of Kailua.
Records available.- November 1922 to June 1936.
Average discharge.- 13 years (1923-36), 110 million gallons a day (170 second-feet).
TJSctremes.- Maximum discharge recorded during year, 170 million gallons a day (263 second- reet; June 26 (gage height, 5.60 feet); minimum recorded, 24 million gallons a day (37 second-feet) Feb. 19.
1922-36: Maximum discharge, 173 million gallons a day (268 second-feet) Nov. 23, 1930 (gage height, 5.77 feet); minimum, 11 million gallons a day (17 second-feet) Feb. 12, 1932.
Remarks.- Records excellent except those for July 25 to Aug. 8, Aug. 15, 16,Sept. 23, Oct. 27 to Nov. 5, Mar. 4-12, Mar. 25 to Apr. 13, Apr. 17-23, June 1-8, which were computed from readings of ^ast Maul Ditch Co.'s staff gage 1 mile downstream and are fair. Wailoa Ditch receives the water from Koolau Ditch at Alo Stream and from all streams from the Alo west to the Halehaku at elevation of about 1,200 feet. Water used for Irrigation in central Maul.
Discharge, in million gallons, fiscal year July 1935 to June 1956
Day
1 2 34 5
6 7 8 910
11 12 13 14 15
16 17 18 19 20
21 22 23 24 25
26 27 28 29 30 31
July
138 114 125 106 150
158 130 146 150 138
126 124 122 94 87
87 94 99 158 102
79 75 90
150 170
160 160 155 160 145 140
Aug.
155 145 140 120 100
90 88
110 110 130
102 137 134 13S 100
100 83 83 79 79
124 150 158 146 102
94 79 72 72 75
144
Sept.
130 130 110 88
162
166 158 134 130 126
138 162 142 158 122
102 106 90 83 79
79 75 64 78 69
61 57 54 50 71
Oct.
6461 88
150 142
134 110 75 68 61
75 6S 68 61 54
50 79
150 94 83
72 64 57 54 50
47 45 42 42 42 80
Month
Jul Aug Sep Oct Hov Dec
C
Jan Feb Mar Apr May Jun
F
alendar year 1955 ...........
iscal year 1935-
Nov.
110 52 45
100 90
108 72 57 54 47
44 47 41 81
106
77 146 166 162 166
158 138 110 130 94
79 79
101 125 90
Dec.
83 72 72 64 57
54 54 50 54 57
54 47 63
122 103
57 50 47
' 51 130
83 54 87 52 47
44 41 41 38 38 36.5
Jan.
35 35 33.5 33.5 41
57 47 41 39.5 54
36.5 32 32 38 158
140 166 115 75 61
54 50 47 44 4l
38 38 36.5 35 35 38
Feb.
55 82
139 150 70
44 41 35 33.5 32
30.5 30.533.5 29 27.5
26 26 25 49 78
137 57 72 71 64
41 35 32 33.5
Million gallons a day
Maximum
170 158 166 150 166 130
170
166 150 170 170 170 170
170
Minimum
75 72 50 42 41 S6.5
36.5
32 25
110 94 154 87
25
Mean
127 111 106 75.2 95.8 61.4
108
55.7 54.4
156 149 166 136
108
Mar.
125 162 150 160 140
160 150 155 160 155
160 165 166 162 138
150 170 170 166 166
166 166 166 166 165
165 165 160 160 120 110
Apr.
iiS130 165135
150 170 170 170 165
165 150 150 170 166
166 170 170 165 165
160 150 135 136 118
118 102 94 101 170
Second- feet (mean)
196 172 164 116 148 95.0
167
S6.2 84.2
241 231 257 210
167
May
170 166 166 166 166
170 170'
170 166 166
166 166 166 166 166
166 166 166 166 170
166 166 166 166 166
166 166 162 162 154 162
June
140 155 130 150 150
160 110 125 106 94
87 133 123 94
118
128 148 114 9S
100
166 15S 138 150 166
170 170 166 166162 .
Total run-off
Million gallons
3.930 3,440 3,170 2,330 2,8SO 1,900
39,290
1.730 1,580 4,840 4,470 5,140 4,OSO
39,490
Acre-feet
12,070 10,550 9,740 7,150 8,820 5,840
120, 600
5,300 4,850 14,850 13,720 15,7SO 12,510
121,200
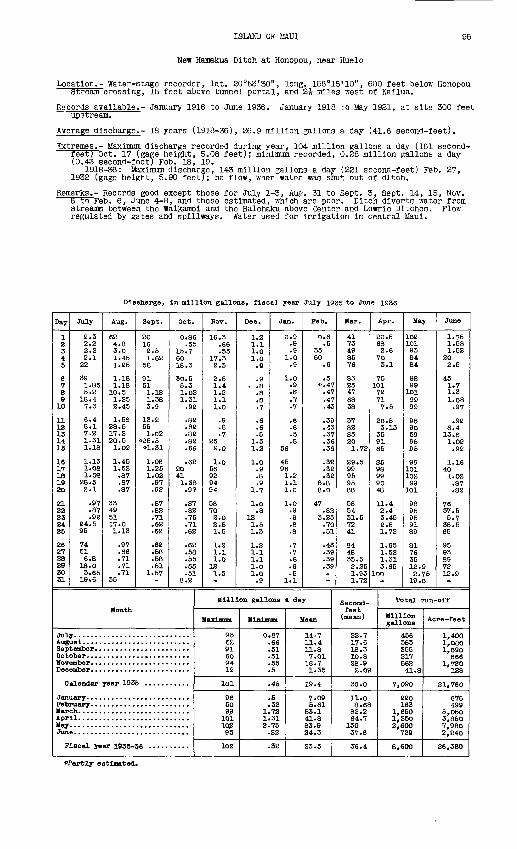
ISLAND OF UMJI 95
New Hamakua Ditch at Honopou, near Huelo
Location.- Water-stage recorder, lat. 20°53'30", long. 156°15'10", 600 feet below Honopou Stream crossing, 15 feet above tunnel portal, and 2i miles west of Kallua.
Records available.- January 1918 to June 1936. January 1918 to May 1921, at site 300 feet upstream.
Average discharge.- 18 years (1918-36), 26.9 million gallons a day (41.6 second-feet).
Extremes.- Maximum discharge recorded during year, 104 million gallons a day (161 second- reetj Oct. 17 (gage height, 5.08 feet); minimum recorded, 0.28 million gallons a day (0.43 second-foot] Feb. 18, 19.
1918-36: Maximum discharge, 143 million gallons a day (221 second-feet) Feb. 27, 1932 (gage height, 5.90 feet); no flow, when water was shut out of ditch.
Remarks.- Records good except those for July 1-3, Aug. 31 to Sept. 3, Sept. 14, 15, Nov. 6 to Feb. 6, June 4-8, and those estimated, which are poor. Ditch diverts water from streams between the Walkamol and the Halehaku above Center and Lowrle Ditches. Flow regulated by gates and spillways. Water used for Irrigation In central Maul.
Discharge, In million gallons, fiscal year July 1935 to June 1936
Day
1 2 3 4 5
6 7 8 9 10
11 12 13 14 15
16 17 18 19 20
21 22 23 24 25
26 27 28 29 50 31
July
2.3 2.2 2.2 2.1
22
39 1.85 5.2
18.4 7.3
6.4 8.1 7.2 1.31 1.18
1.13 1.08 1.08
28.5 2.1
.97
.87
.92 24.5 95
74 51 6.8
18.0 3.65 19.6
Aug.
62 4.8 3.0 1.45 1.25
1.18 1.18
10.5 1.25 2.45
1.5S 28.5 17.2 20.5 1.02
1.45 1.52 .87 .S7 .87
33 4951 17.0 1.13
.97
.66
.71
.71
.71 35
Sept.
20 16 2.5 1.62
58
91 51 1.18 1.38 3.9
13.2 55 1.02
#25.5 «1.B1
1.08 1.25 1.02 .97 .92
.87
.82
.71
.62
.62
.62
.58
.58
.51 1.57
Oct.
0.86 .55
15.7 60 18.3
30.5
1.02 1.31 .92
.82
.82
.82
.82
.66
.62 20 41 1.38 .97
.S7
.82
.76
.71
.62
.62
.58
.55
.55
.51 8.2
Month
JuiAUKSep Oct SOT Dec
C
Jan Fob- Map Apr May Jun
P
alendar year 193
lacal year 1935-
NOT.
16.3 .66 .55
17.3 2.3
2.5
1.2 1.1 1.0
.9
.8
.7 25 2.0
1.0 56 92 94 94
58 70 2.0 2.51.5
1.2 1.1 1.0
12 1.5
Dec.
1.2 1.1 1.0 1.0 .9
.9
.S
.S
.7
.6
.6
.51.5 1.2
1.0.9 .8 .9
1.7
1.0 .8
12 1.5 1.3
1.2 1.1 1.1 1.0 1.0 .9
Jan.
0.9 .9 .9
1.0 .9
1.0 .9.3 .7 7
.6
.6
.5
.5 56
45 961.2 1.1 1.0
1.0 .9 .9 .8 .8
.7
.7 6 .6.5
1.1
Feb.
0.6 .5
35 50
.6
.5
.47
.47
.43
.39
.43
.37
.36
.36
.32
.32
.32 8.8 8.0
47 .82
3.25 .70 .51
.43
.39
.39
.39
Million gallons a day
Maximum
95 62 91 60 94 12
101
96 50 99 101 102 95
102
Minimum
0.87 .66 .51 .51 .65 .5
.45
.5
.32 1.72 1.31 2.75 .32
.32
Mean
14.7 11.4 11.8 7.01 18.7 1.35
19.4
7.09 5.61
53.1 41.8 83.9 24.3
23.5
Mar.
41 73 49 85 76
83 25 47 68 38
37 82 S5 20 1.72
29.5 99 95 95 88
58 54 31.5 72 41
84 43 35.5 2.25 1.93 1.72
Apr.
20.5 68 2.6 70 3.1
75 101 72 71 7.5
20.5 3.15
35 91 65
35 98 99 90 48
11.4 2.4 3.45 2.5 1.72
1.65 1.52. 1.31 3.65
100
Second- feet (mean)
22.7 17.6 18.3 10.8 28.9 2.09
30.0
11.0 8.68 82.2 64.7
130 37.6
36.4
May
102 101 93 9484
98 99 101 99 99
95 90 59 95 95
99 101 102 99
101
98 95 95 91 89
81 76 35 12.9 2.75 19.0
June
1.35 1.58 1.52
20 2.5
451.7 1.3 1.08 .97
.92 6.4
13. S 1.02 .92
1.16 40 1.02 .87 .82
76 37.5 5.7
38.5 65
95 93 89 72 12.9
Total run-off
Million gallons
456 353 355 217 562 41.8
7,090
220 163
1.650 1,250 2,600
728
8,600
Acre -feet
1,400 1,080 1,090
666 1,720
128
21,760
675 499
5,050 3,850 7,980 2,240
26,380
«Partly estimated.
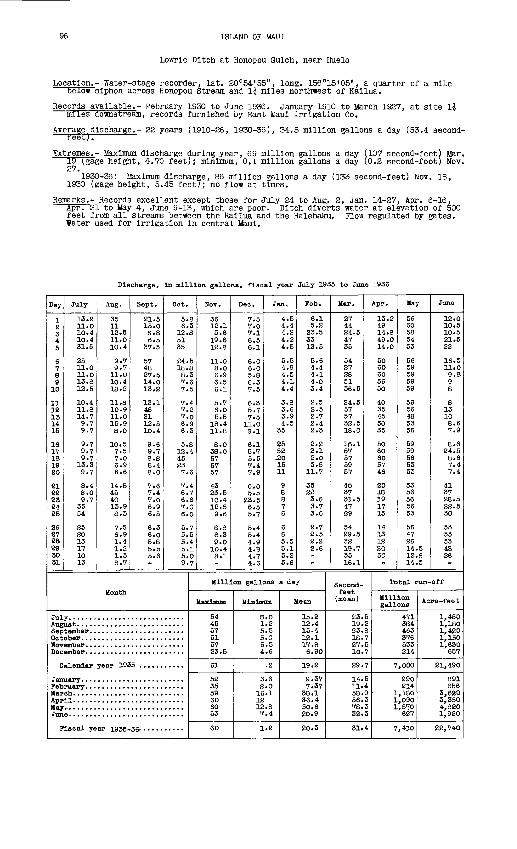
96 ISLAND OF MAUI
Lowrie Ditch at Honopou Gulch, near Huelo
Location.- Water-stage recorder, lat. 20°54'55", long. 156°15'05", a quarter of a mile below siphon across Honopou Stream and li miles northwest of Kailua.
Records available.- February 1930 to June 1936. January 1910 to March 1927, at site 14 miles downstream, records furnished by East Maul Irrigation Co.
Average discharge.- 22 years (1910-26, 1930-36), 34.5 million gallons a day (53.4- second- feet).
Extremes.- Maximum discharge during year, 69 million gallons a day (107 second-feet) Mar. 19 ( gage height, 4.70 feet); minimum, 0.1 million gallons a day (0.2 second-foot) Nov. 27.
1930-36: Maximum discharge, 86 million gallons a day (133 second-feet) Nov. 18, 1930 (gage height, 5.45 feetT; no flow at times.
Remarks.- Records excellent except those for July 24 to Aug. 2, Jan. 14-27, Apr. 6-16, Apr. 21 to May 4, June 9-13, which are poor. Ditch diverts water at elevation of 500 feet from all streams between the Kailua and the Halehaku. Flow regulated by gates. Water used for irrigation in central Maul.
Discharge, In million gallons, fiscal year July 1935 to June 1936
Day
1 2 3 4 5
6 7 8 910
11 12 13 14 15
16 17 18 19 20
21 22 23 24 25
26 27 28293031
July
13.2 11.0 10.4 10.4 31.5
25 11.0 11.0 13.8 12.5
10.4 11.8 14.7 9.7 9.7
9.7 9.7 9.7
13.3 9.7
8.4 S.O 9.7
3554
25 20 13 17 10 13
Aug.
35 11 12.5 11.010.4
9.7 9.7 11.0 10.4 18.2
11. S 10.9 11.0 15.9 S.O
10.5 7.5 7.0 6.9 6.6
14.5 45 40 13.9 8.3
7.5 6.9 1.4 1.2 1.3 8.7
Sept.
21.5 15.0S.8 6.5
37.5
57 48 27.5 14.0 13.2
13.1 48 21 12.5 10.4
9.6 9.7 8.S 8.4 8.0
7.6 7.4 7.0 6.9 6.5
6.3 6.0 5.8 5.5 5.6
Oct.
5.8 6.3
12 .S 51 35
24.5 18.8 8.3 7.6 7.5
7.4 7.2 7.0 6.9 6.3
5.8 12.4 45 23 7.6
7.4 6.7 6.6 7.0 6.0
5.7 5.5 5.4 5.1 5.0 9.7
Month
Jul Aug Sep Oct HOT Dec
C
Jan Fob Mar Apr May Jun
F
alendar year 192
iscal year 1935-
Nov.
36 12.1 5.6 19.6 12.8
11.0 8.0 6.9 6.56.1
5.7 6.0 5.5
18.4 11.8
8.0 33.0 57 57 57
43 23.5 10.4 12.5 9.6
8.8 8.3 9.0 10.48.1
Dec.
7.5 7.0 7.1 6.5 6.1
6.0 6.0 5.8 6.3 7.5
6.35.7 7.5
11,0 S.I
6.15.7 5.5 7.4 7.9
6.05.5
23.5 6.5 5.7
5.4 5.4 4.9 4.8 4.7 4.6
Jan.
4.5 4.4 4.2 4.2 4.5
5.5 4.9 4.5 4.1 4.4
3.8 3.6 3.9 4.5
35
25 52 J20 15 11
9 8 8 7 6
6 6 5.5 5.1 5.2 5.6
Feb.
6.15.2
23.5 3312.5
5.6 4.4 4.1 4.0 3.4
2.5 2.5 2.7 2.4 2.3
g.2 2.1 g.O 3.5
11.7
35 22 3.6 3.7 3.6
B.7 2.5 2.2 B.6
Million gallons a day
Maximum
54 45 57 51 57 23.5
61
52 35 59 60 60 53
60
Minimum
S.O 1.2 5.5 5.0 5.5 4.6
.2
3.6 2.016.1 12 12.8 7.4
1.2
Mean
15.2 12.4 15.4 12.1 17.8 6.90
19.2
9.37 7.37
38.1 36.4 50.6 20.9
20.3
Mar.
27 44 24.5 47 35
54 27 28 51 36.5
24.5 57 57 32.518.0
16.1 57 57 59 57
40 37 31.5 47 29
54 29.5 32 19.7 35 16.1
Apr.
13.2 49 14.8 49.0 14.0
50 60 60 56 50
40 35 45 50 35
50 60 6057 46
20 18 19 17 15
14 13 12 20 50
Second- feet (mean)
23.5 19.2 23.8 18.7 27.5 10.7
29.7
14.5 11.4 58.9 56.3 78.3 32.3
31.4
May
56 60 58 54 53
56 59 59 59 59
59 56 48 53 56
59 59 56 5353
53 56 56 56 53
56 47 26 14.5 12.8 14.5
June
12.0 10.5 10.5 21.5 22
16.5 11.0 9.8 9 8
8 1310 8.6 7.9
8.6 24.5 8.6 7.4 7.4
41 37 28.5 22.5 30
53 53 53 48 26
Total pun-off
Million gallons
471 384 463 376 533 214
7,000
290 214
1,180 1,090 1,570
627
7,410
Acre -feet
1,450 1,180 1,420 1,150 1,630
657
21,490
891 656
3,620 3,350 4,820 1,920
22,740
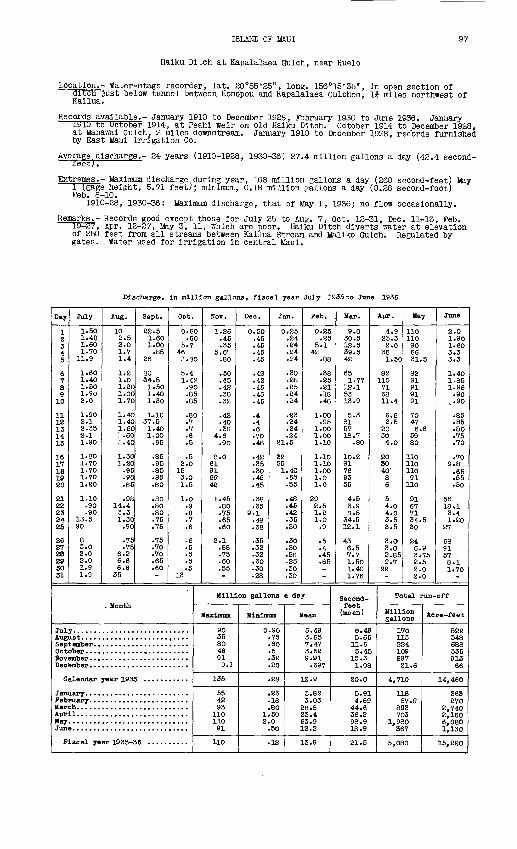
ISLAND OF MAUI
Haiku Ditch at Kapalalaea Gulch, near Huelo
Location.- Water-stage recorder, lat. 20°55'25", long. 156°15'35", in open section of aitcn Just below tunnel between Honopou and Kapalalaea Gulches, If miles northwest of Kailua.
Records available.- January 1910 to December 1928, February 1930 to June 1936. January 1910 to October 1914, at Peahi weir on old Haiku Ditch. October 1914 to December 1928, at Manawal Gulch, 2 miles downstream. January 1910 to December 1928, records furnished by East Maul Irrigation Co.
Average discharge.- 24 years (1910-1928, 1930-36) 27.4 million gallons a day (42.4 second- feet;.
Extremes.- Maximum discharge during year, 168 million gallons a day (260 second-feet) May l (gage height, 5.71 feet); minimum, 0.18 million gallons a day (0.28 second-foot) Feb. 8-10.
1910-28, 1930-36: Maximum discharge, that of May 1, 1936; no flow occasionally.
Remarks.- Records good except those for July 25 to Aug. 7, Oct. 12-31, Dec. 11-13, Feb. ltJ-27, Apr. 12-27, May 3, 11, which are poor. Haiku Ditch diverts water at elevation of 250 feet from all streams between Kailua Stream and Maliko Gulch. Regulated by
Water used for irrigation in central Maul.
Discharge, In million gallons, fiscal year July 1935to June 1936
Day
1 2 34 5
6 7 8 9
10
11 12 13 14 15
16 17 18 19 20
21 22 23 24 25
26 27 28 29 30 31
July
1.50 1.40 1.60 1.70
11.9
1.60 1.40 1.50 1.90 2.0
1.90 2.1 2.35 2.1 1.90
1.80 1.70 1.70 1.70 1.20
1.10 .90 .90
13.5 90
8 3.0 2.0 2.0 1.9 1.9
Aug.
10 2.5 2.0 1.7 1.4
1.2 1.0 1.20 1.00 1.70
1.40 1.40 1.60 1.60 1.40
1.50 1.20
.95
.90
.35
.98 14.4 3.3 1.30
.90
.75
.75 6.2 6.6 6.6
35
Sept.
22.5 1.60 1.00
.8526
80 34.5 1.50 1.40 1.30
1-10 37.5 1.40 1.00
.95
.85
.95
.85
.85
.SO
.80
.80
.80
.75
.75
.75
.70
.70
.65
.60
Oct.
0.60 .60
5.7 46 1.80
5.4 1.42
.90
.85
.85
.80
.7
.7 6 .5
.5 2.0
15 3.0 1.5
1.0 .9 .8 .7 .6
.6
.5
.5
.5
.5 13
. Montn
Jul Aug Sep Oct SOT Dec
C
Jan Feb MarAprMayJun
P
alendar year 193,
Lscal year 1935-C
Nov.
1.26 .45 .35
5.61 .80
.50
.45
.42
.38
.32
.42
.40
.33 4.6
.90
8.0 61 91 69 42
1.45 .80 .75 .65 .60
2.1 .88 .75 .60 .55
Dec.
0.50 .45 .45 .45 .45
.42
.42
.45
.45
.45
.4
.4
.6
.70
.48
.42
.35
.30
.45
.45
.38
.35 9.1
.48
.38
.35
.32
.32
.30
.30
.28
Jan.
0.25 .24 .24 .24 .24
.30
.28
.25
.24
.24
.23
.24
.24
.24 21.5
32 55 1.40
.65
.55
.48
.45
.42
.35
.30
.30
.30
.23
.25
.30
.30
Feb.
0.25 .85
5.1 42
.88
.38
.25
.21
.18
.48
1.00 .95
1.00 1.00 1.10
1.10 1.10 1.00 1.0 1.0
20 2.5 1.2 1.0
.9
.5
.4
.45
.65
Million gallons a day
Maximum
90 35 80 46 91 9.1
135
55 42 93
110 110 91
110
Minimum
0.90 .75 .60 .5 .32 .2S
.28
.23
.18
.80 1.50 2.0
.50
.15
Mean
5.49 3.65 7.47 3.52 9.91
.697
12.9
3.82 3.03
28.8 23.4 63.9 12.2
13.9
Mar.
9.0 30.5 12.5 39.542
65 1.77
12.1 53 13.9
5.3 81 57 18.7
.80
10.2 91 76 93 55
4.5 3.9 3.8
34.5 12.1
43 6.5 7.7 1.50 1.40 1.76
Apr.
4.9 25.5 2.0
36 1.50
82 110 71 68 11.4
6.6 2.5
20 30 4.0
20 3040
8 6
5 4.0 4.0 3.5 3.5
3.0- 3.0 2.85 2.7
92
Second- feet
(mean)
e.495.65
11.6 5.45
15.3 1.08
20.0
5.91 4.69
44.6 36.2 98.9 18.9
21.5
May
110 110 90 66 31.5
82 91 91 91 91
70 47 6.6
59 80
110 110 110 91
110
91 67 71 34.5 30
24 6.9 3.75 2.5 2.0 2.0
June
2.0 1.90 1.60 3.3 3.3
1.40 1.85 1.96
.90 ,.90
.85
.85
.80
.75
.70
.70 9.8
.65
.55
.50
56 18.1 3.4 1.20
27
68 91 57 8.1 1.70
Total run-off
Million gallons
170 113 224 109 297 21.6
4,710
118 87.8
893 703
1.980 367
5,080
Aere^fe"et
522 348 688 335 913
66
14,460
363 270
2,740 2,160 6,080 1,130
15,220
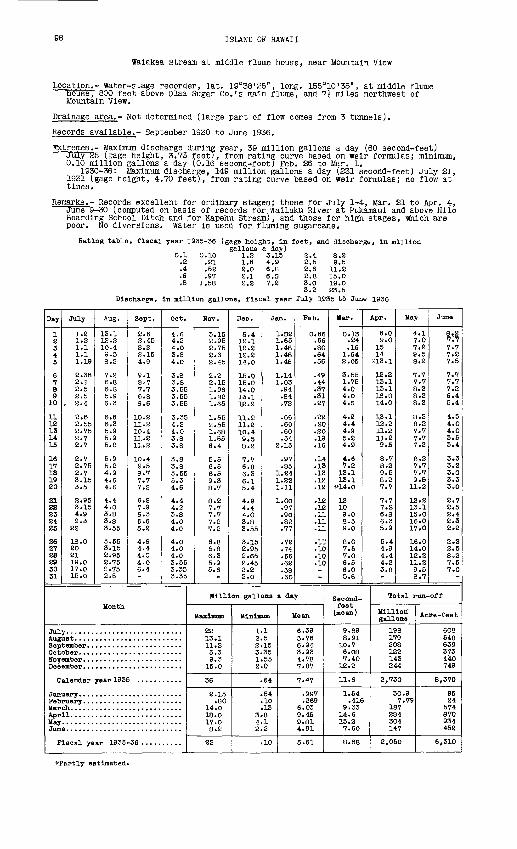
98 ISLAND OF HAWAII
Waiakea Stream at middle flume house, near Mountain View
Location.- Water-stage recorder, lat. 19°38'25", long. 155°10'35", at middle flume nouse, 800 feet above Olaa Sugar Co.'s main flume, and 7-i miles northwest of Mountain View.
Drainage area.- Not determined (large part of flow comes from 3 tunnels).
Records available.- September 1930 to June 1936.
Extremes.- Maximum discharge during year, 39 million gallons a day (60 second-feet) July 25 (gage height, 3.73 feet), from ratine curve based on weir formulas; minimum, 0.10 million gallons a day (0.16 second-foot) Feb. 26 to Mar. 1.
1930-36: Maximum discharge, 149 million gallons a day (231 second-feet) July 21, 1931 (gage height, 4.70 feet), from rating curve based on weir formulas; no flow at times.
Remarks.- Records excellent for ordinary stages; those for July 1-4, Mar. 21 to Apr, 4, June 9-30 (computed on basis of records for Wailuku River at Pukamaui and above Hilo Boarding School Ditch and for Kapehu Stream), and those for high stages, which are poor. No diversions. Water is used for fluming sugarcane.
Rating table, fiscal year 1935-36 (gage height, In feet, and discharge, in milliongallons a day)
0.1 0.10 1.2 3.15 2.4 8.2 .2 .21 1.6 4.9 2.5 9.5 .4 .52 2.0 6.8 2.6 11.2 .6 .97 2.1 6.S 2.8 15.0 .8 1.58 2.2 7.2 3.0 19.0
3.2 23.5 Discharge, In million gallons, fiscal year July 1935 to June 1936
Day
1 2 34 5
6 7 8 9
10
11 12 13 14 15
16 17 18 19 20
21 22 23 24 25
26 27 28 29 30 31
July
1.2 1.2 1.1 1.1 1.19
2.35 2.1 2.5 2.5
, 2.4
2.6 2.55 2.75 2.7 2.7
2.7 2.75 2.7 3.15 3.5
2.95 3.15 4.9 9,3
22
18.0 20 21 19.0 17.0 15.0
Aug.
12.1 12.2 10.4 9.5 8.2
7.2 6.8 6.8 5.9 6.3
6.6 6.3 5.9 5.9 5.2
5.9 5.2 4.9 4.6 4.6
4.44.0 3.8 3.8 3.55
3.55 3.15 2.95 2.75 2.75 2.5
Sept.
2.62.45 2.2 2.15 4.9
9.1 8.7 7.7 6.8 3.6
10.2 11.2 10.4 11.2 11.2
10.4 9.5 8.7 7.7 7.2
6.8 7.9 6.3 5.6 5.2
4.6 4.4 4.0 4.0 6.4
Oct.
4.6 4.2 4.0 3.8 4.0
3.8 3.8 3.55 3.55 3.55
3.354.2 4.0 3.8 3.8
3.8 3.8 3.55 5.3 4.6
4.44.2 3.8 4.0 4.0
4.0 4.0 4.0 3.55 3.35 3.35
Month
Jul Augi Sep Oct Hoy Dec
0
Jan Feb liar Apr May Jun
P
alendar year 193>
e. ...........................
Lscal year 1935-
Nov.
3.15 2.95 2.75 2.62.45
2.2 2.15 1.96 1.82 1.65
1.55 2.55 1.68 1.55 6.4
5.5 6.5 6.5 9.3 8.7
8.2 7.7 7.7 7.2 7.2
6.8 6.8 6.3 5.9 5.6
Dec.
5.4 12.1 12.2 12.2 14.0
15.0 15.0 14.0 13.1 12.2
11.2 11.2 10.4 9.5 8.2
7.7 6.8 6.3 6.1 5.4
4.9 4.4 4.0 3.8 3.55
3.15 2.95 2.65 2.45 2.2 2.0
Jan.
1.S2 1.65 1.48 1.48 1.4S
1.14 1.03
.94
.84
.72
.66 ,60 .60 .54
2.15
.97
.85 1.24 1.221.11
1.00 .97 .90 .82 .77
.72
.74
.66
.62
.58
.60
Feb.
0.66 ,66 .80 .64 .56
.49
.44
.37
.31
.27
.22
.20
.20
.19
.16
.14
.13
.13
.12
.12
.12
.12
.11
.11
.11
.11
.10
.10
.10
Million gallons a day
Maximum
2213.1 11.2 5.3 9.3
15.0
36
2.15 .80
14.0 18.0 17.0
8 »2
22
Minimum
1.1 2.5 2.15 3.35 1.55 2.0
.64
.54
.10
.13 3.8 4.1 2.2
.10
Mean
6.39 5.76 6.94 3.93 4.78 7.87
7.47
.997
.269 6.03 9.45 9.81 4.91
5.61
Mar.
0.33 .24 .16
1.64 2.05
3.55 1.75 4.0 4.0 4.S
4.2 4.4 4.9 5.2 4.9
4.6 7.2
13,1 13.1
#14.0
12 10 9.0 8.5 9.0
8.0 7.5 7.0 6.5 6.0 5.6
Second- feet
(mean)
Apr.
6.0 9.0
as14
*13.1
12.2 13.1 13.1 18.0 14.0
13.1 12.2 11.2 11.2 9.5
8.7 8.2 9.5 8.2 7.7
7.7 7.2 6.S 6.3 5.9
5.4 4.9 4.4 4.23.8
May
4.1 7.0 7.2 9.5 8.2
7.7 7.7 8.2 8.2 8.2
8.2 8.2 7.7 7.7 7.2
8.2 7,7 7.7 9.5
11.2
12.213.1 15.0 16.0 17.0
16.0 14.0 12.2 11.2 9.5 8.7
June
7.7 7.2 7.5
7.7 7.7 7.2 6.4 5.4
4.5 4.0 4.0 3.5 3.4
3.3 3.2 3.0 3.3 3.0
2.7 2.5 2.4 2.3 2.2
2.2 2.5 8.2 7,5 7.0
Total run-off
Million gallons
9.89 198 8.91 179
10.7 208 6.08 122 7.40 143
12.2 244
11.6 2,730
1.54 30.9 .416 7.79
9.33 187 14.6 284 15.2 304 7.60 147
8.68 2,050
Acre -feet
608 548 639 373 440 749
8,370
95 24
574 870 934 452
6,310
^Partly estimated.
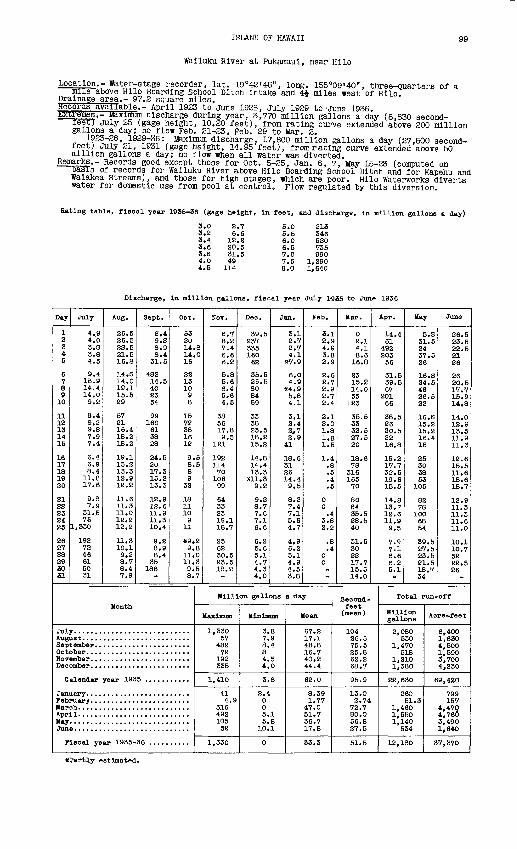
ISLAND OF HAWAII 99
Wailuku River at Pukamaui, near Hilo
Location.- Water-stage recorder, lat. 19°42'45", long. 155°09'40", three-quarters of a mile"above Hilo Boarding School Ditch intake and 4i miles west of Hilo.
Drainage area.- 97.2 square miles.Kecoras available.- April 1923 to June 1928, July 1929 to -June 1936.Extremes.- Maximum discharge during year, 3,770 million gallons a day (5,830 second-
reetj July 25 (gage height, 10.20 feet), from rating curve extended above 200 million gallons a day; no flow Feb. 21-23, Feb. 29 to Mar. 2.
1923-28, 1929-36: Maximum discharge, 17,800 million gallons a day (27,500 second- feet) July 21, ±931 (gage height, 14.95 feet), from rating curve extended above 50 million gallons a day; no flow when all water was diverted.
Remarks.- Records good except those for Oct. 5-25, Jan. 6, 7, May 15-23 (computed onoasis of records for Wailuku River above Hilo Boarding School Ditch and for Kapehu and Walakea Streams), and those for high stages, which are poor. Hilo Waterworks diverts water for domestic use from pool at control. Flow regulated by this diversion.
Rating table, fiscal year 1935-36 (gage height, in feet, and discharge, in million gallons a day)
3.0 3.2 3.4 3.6 3.S 4.0 4.5
2.76.6
12.220.531.549
114
5.0 5.5 6.0 6.5 7.0 7.5 8.0
213346520735990
1,2901,640
Discharge, In million gallons, fiscal year July 1-935 to June 1936
Day
1 2 3 4 5
6 7 8 910
11 12 13 14 15
16 17 18 19 20
21 22 23 24 25
26 27 28 29 30 31
July
4.9 4.0 3.S 3.8 4.5
9.4 15.9 14.4 14.0 9.2
8.4 9.2 9.8 7.9 7.4
6.4 6.9 8.4 11.8 17.6
9.8 7.9 31.5 75
1,330
192 72 46 61 50 31
Aug,
26.5 26.5 2S.5 21.5 16.8
14.S 14.0 19.1 15.6 29
57 21 16.4 18.2 18.2
19.1 15.2 13.3 12,9 12.2
11.6 11.3 11.0 12.2 12.2
11.3 10.1 9.2 8.7 8.4 7,9
Sept.
S.4 9.S 8.9 8.4 31.5
482 14.5 40 23 54
99 160 61 38 28
24.5 20 17.3 15.2 13.3
12.9 12,6 11.9 11.3 10.4
9.2 8.9 8.4
35 188
Oct.
53 20 14.8 14,0 16
22 13 10 9 8
15 72 38 16 12
9.5 8.5 8 9
32
18 11 10 9
11
«9.2 9.8
11.0 11.3 9.5 8.7
Month
Jul Aug Sep Oct HOT Dee
0
Jan Peb Mar Apr May Jun
P
alendar year 193
11...........................
lacal year 1935-
Nov.
S.7 8.2 7.4 6.6 6.2
5.8 5.6 6.4 5.6 4.5
38 56 17,8 9,5
121
192 114 70
106 99
64 33 23 19.1 18.7
25 62 30.5 23,5 18.2
Dec.
39.5 237 335 160 62
35.5 25.5 80 84 59
33 38 23.5 18.2 15.2
14.8 14.4 13.3
*11.3 9.2
9.2 8.7 7.6 7.1 6.6
6.2 5.6 5.1 4.7 4.3 4.0
Jan.
3.1 2.7 2.7 4.1
*7.9
6.0 4.9
*4.9 5.84,1
3,1 2.4 2,7 2.9
41
18.6 31 26 14.4 9,5
8.2 7.4 7.1 5.64.7
4,9 6.2 5,1 4,9 4.5 3.8
Feb.
3.1 2.9 4.9 3.8 2.9
2.6 2,7 2.9 2.7 2.4
2,1 2.0 1.8 1.8 1.5
1.4 .8 .5.4 .5
0 0 .4
3.8 2.2
.8
.4 0 0
Million gallons a day
Maximum
1,330 57
482 72 192 335
1,410
41 4.9
316 492 105 52
1,330
Minimum Mean
3.8 67.2 7,9 17.1 8.4 48.8 8 16.7 4.5 40.2 4,0 44.4
3.8 62,0
2.4 8.39 0 1.77 0 47.0 5.1 51,7 5.8 36.7
10.1 17.8
0 33.3
Mar.
0 2.1 4.1 8.6
16.8
23 15.2 14.0 55
123
35,5 33 32.5 27.5 20
18.6 78
316 165 70
80 84 35.5 28.5 40
31.5 30 22 17,7 15,5 14.0
Apr.
14.4 61
492 203 56
31.5 39.5 67
201 66
38.5 26 20.5 22 16.8
15.2 17.7 32.5 19.6 15.5
14.8 13.7 12.6 11.9 9.5
7.9 7.1 6.6 6.2 5.1
Second- feet
(mean)
104 26.5 75,5 25.8 62.2 68.7
95.9
13.0 2.74
72.7 80.0 56.8 27.5
51.5
May
5.S 31.5 24 37.5 26
16. S 24.5 46 26.5 22
16. S 15.2 15.2 16.4 15
25 30 38 53
105
82 78
100 6854
39.5 27.5 23.5 21.5 18.7 34
June
26.5 23.5 22.5 21 26
26 20.5 17.7 15.9 14.8
14.0 12.9 13.3 11.9 11,3
12.6 15.5 11.6 18.6 18.7
12.9 11.3 11.3 11.6 11.0
10.1 10.7 52 22.5 26
Total run-off
Million gallons
2,080 530
1,470 518
1,210 1,380
22,630
260 51.3
1,460 1,550 1,140
534
12,180
Acre-feet
6,400 1,630 4,500 1,590 3,700 4,230
69,420
799 157
4,470 4,760 3,490 1,640
37,370
*Partly estimated.
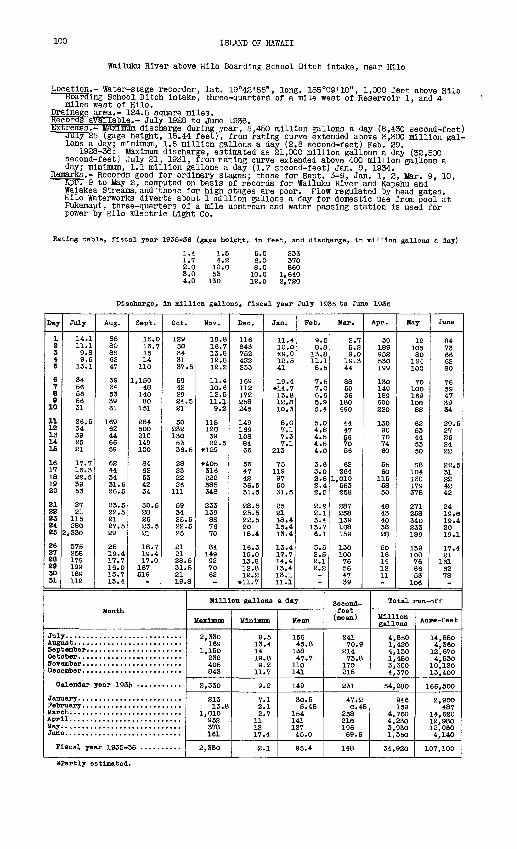
100 ISLAND OF HAWAII
Walluku River above Hllo Boarding School Ditch Intake, near Hllo
Location.- Water-stage recorder, lat. 19042'55" ( long. 155°09'10", 1,000 feet above Hllo Hoaralng School Ditch Intake, three-quarters of a mile west of Reservoir 1, and 4 miles west of Hllo.
Drainage area.- 124.5 square miles.Kecoras available.- July 1928 to June 1936.Extremes.- Maximum discharge during year, 5,450 million gallons a day (8,430 second-feet)
July 25 (gage height, 15.44 feet), from rating curve extended above 3,300 million gal lons a day; minimum, 1.8 million gallons a day (2.8 second-feet) Feb. 29.
1928-36: Maximum discharge, estimated as 21,000 million gallons a day (32,500 second-feet) July 21, 1931, from rating curve extended above 400 million gallons a day; minimum, 1.1 million gallons a day (1.7 second-feet) Jan. 9, 1934.
Remarks.- Records good for ordinary stages; those for Sept. 3-9, Jan. 1, 2, Mar. 9, 10, Apr r 9 to May 2, computed on basis of records for Walluku River and Kapehu and Walakea Streams, and those for high stages are poor. Flow regulated by head gates. Hllo Waterworks diverts about 1 million gallons a day for domestic use from pool at Pukamaul, three-quarters of a mile upstream and water passing station Is used for power by Hllo Electric Light Co.
Rating table, fiscal year 1935-36 (gage height, in feet, and discharge, In million gallons a day)
1.4 1.5 5.0 233 1.7 4.2 6.0 370 2.0 10.0 8.0 860 3.0 53 10.0 1,640 4.0 130 12.0 2,720
Discharge, In million gallons, fiscal year July 1935 to June 1936
Day
1 2 3 4 6
6 7a9 10
1112 13 14 15
16 17 IS 19 20
21 22 23 24 25
26 27 28 293031
July
14.1 11.1 9.8 9.5
13.1
34 56 56 56 31
26.5 34 39 2521
17.7 16.3 22.5 39 53
27 21
115 280
2,330
575 258 179 199 169 112
Aug.
88 80 8S 62 47
39 34 53 3961
169 62 44 66 59
62 44 34 31.5 26.5
23.5 22.5 21 27.5 29
25 19.4 17.7 16.0 15.7 13.4
Sept.
16.0 16.7 15 14
110
1,150 48
140 80
151
284 500 210 149 100
84 62 53 42 34
30.5 28 26 23.521
18.7 19.4 17.0
167 519
Oct.
129 50 34 31 37.5
59 42 29 24.5 21
50 232 130 53 36.5
28 23 22 26
111
59 34 25.5 22.5 25
21 21 28.5 31.5 21 19.8
Month
Jul Augl Sep Oct HOT Dec
C
Jam Fob Mar Apr May Jun
P
alendar year 193
Lscal year 1935-
Nov.
19.8 16.7 13.8 12.8 12.2
11.4 10.6 12.5 ll.l 9.2
11S 120 39 22.5
*129
*405 316 222 385 348
233 139 8S 76 70
84 149 92 70 62
Dec.
116 843 752 4S2 233
169 112 172 258 245
149 169 108 84 66
56 47 42 36.5 31.5
28.5 25.5 22.5 2018.4
16.3 15.0 13.8 12.8 12.2
*11.7
Jan.
11.4 10.0 *9.0 12.5 41
19.4 *14.7 13.8 12.3 10.3
8.0 7.1 7.3 7.1
213
75 119 97 50 31.5
25 21 16.4 15.4 13.4
13.4 17.7 14.4 13.4 13.1 11.1
Feb.
9. K 8.£
13.811.1 8.5
7.5 7.0 6.6 5.9 5.4
5.0 4.S 4.5 4.5 4.0
3.6 3.0 2.6 2.4 2.5
2.2 2.1 3.4
13.7 6.1
3.5 2.5 2.1 2.2
Million gallons a day
M&xlJBuni
2,330 169
1,150 232 405 843
2,330
213 13.8
1,010 952 378 161
2,330
Minimum
9.5 13.4 14 19.8 9.2 11.7
9.2
7.1 2.1 2.7
11 12 17.4
2.1
Mean
156 45.8 138 47.7
110 141
149
30.5 5.48
154 141 127 45.0
95.4
Mar.
2.7 5.2 9.0 19.3 44
88 50 56
180 490
44 47 56 70 56
62 264
1,010 553 258
287 258 139108 159
130 100 76 56 47 39
Second- feet (mean)
241 70.9
214 73.8
170 218
231
47.2 6.4£
238 216 196 69.6
148
Apr.
39 189 952 530 199
130 149 1S9 600 220
130 90 70 74 60
55 60
115 58 50
48 43 40 38 28
2016 14 12 11
May
12 105 80
124 100
70 100 169 106 83
62 53 44 53 50
S8 104 130 179 378
271 258 340 233 189
139 100 76 66 53
106
June
84 73 66 62 80
76 59 47 39 34
29.5 27 26 24 22
22.5 31 22 42 42
24 19. 6 19.4 20 19.1
17.4 21 161 62 78
Total run-off
Million gallons
4,850 1,420 4,130 1,480 3,300 4,370
54,280
946 159
4,760 4,830 3,930 1,350
34,920
Acpe-feet
14,880 4,360 12,670 4.530
10,120 13,400
166,500
2,900 487
14,620 12,980 12,050 4,140
107,100
Partly estimated.
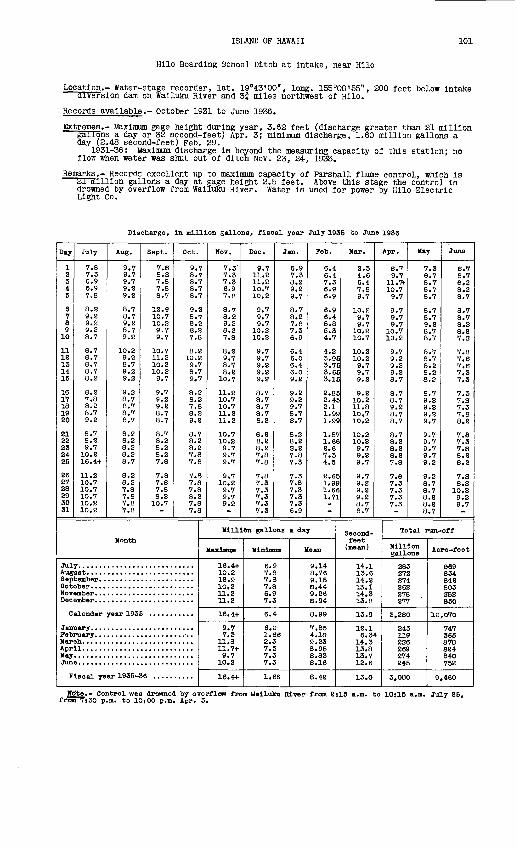
ISLAND OF HAWAII 101
Hllo Boarding School Ditch at Intake, near Hllo
Location.- Water-stage recorder, lat. 19°43'00", long. 155°08'55", 200 feet below Intake diversion dam on Walluku River and 3f miles northwest of Hllo.
Records available.- October 1931 to June 1936.
Extremes.- Maximum gage height during year, 3.62 feet (discharge greater than 21 million gallons a day or 32 second-feet) Apr. 3; minimum discharge, 1.60 million gallons a day (2.48 second-feet) Feb. 29.
1931-36: Maximum discharge Is beyond the measuring capacity of this station; no flow when water was shut out of ditch Nov. 23, 24, 1933.
Remarks.- Records excellent up to maximum capacity of Parshall flume control, which Is ""million gallons a day at gage height 2.5 feet. " " ' ' ' - - -drowned by overflow from Walluku River. Light Co.
Above this stage the control Is Water Is used for power by Hllo Electric
Discharge, In million gallons, fiscal year July 1935 to June 1936
Day
1 2 3 4 5
6 7 8 9 10
11 12 13 14 15
16 17 18 19 20
21 22 23 24 25
26 27 28 29 30 31
July
7.8 7.3 6.9 6.9 7.8
8.8 9.8
9^2 8.7
8.7 8.7 8.7 8.7 8.2
8. 2 7.8 8.2 8.7 9.2
8.7 8.8 9.7
10.2 16.4+
11.2 10.7 10.7 10.7 10.2 10.2
Aug.
9.7 9.7 9.7 9.8
8.78.7 9.2 8.7 9.2
10.2 9.8 8.7 9.2 9.2
9.2 8.7 8.7 8.7 8.7
8.2 8.2 8.2 8.2 8.7
8.2 8.2 7.8 7.8 7.8 7.8
Sept.
7.S 8.2 7.8 7.8
12.910.7 10.2 9.7 9.7
10.7 11.2 10.2 10.2 9.7
9.7 9.2 9.2 8.7 8.7
8.7 8.2 8.2 8.2 7.8
7.8 7.8 7.8 8.2
10.7
Oct.
9.7 8.7 8.7 8.7
9.28.7 8.2 8.8 7.8
8.2 10.2 9.7 8.7 9.7
8.8 8.2 7.8 8.2 9.2
8.7 8.2 8.2 7.8 7.8
7.B 7.8 7.8 8.2 7.8 7.8
Month
Jul Augi Sep Oct Nov Dec
0
Jan Fob Mar Apr May Jun
P
alendar year 193
Iscal year 1935- 56 ..........
Hov.
7.3'
7.3 7.3 6.9
8.78.2 9.2 8.2 7.8
8.8 9.7 8.7 8.2
10.7
11.2 10.7 10.7 11.2 11.2
10.7 10.2 9.7 9.7 9.7
9.7 10.2 9.7 9.7 9.2
Dec.
9.7 11.8 11.2 10.7
9.7 9.7
10.2 10.8
9.7 9.7 9.2 9.2 9.8
8.7 8.7 8.7 8.7 8.2
8.2 8.2 8.2 7.8 7.8
7.8 7.3 7.3 7.3 7.3 7.3
Jan.
6.9 7.3 8.2 9.2 9 7
8.2 7.8 7.3 6.9
6.4 6.0 6.4 6.0 9.2
9.2 9.2 9.7 8.7 S.7
8.2 8.2 S.2 7.8 7.3
7.3 7.8 7.3 7.3 7.3 6.9
Feb.
6.4 6.4 7.3 6.9 6 9
6.4 5.8 5.3 4.7
4.2 3.9. 3.7. 3.6E 3.1E
2.8£ 2.4E 2.1 1.9S 1.9£
1.81-i.ee2.6 7.3 4.5
2.6E 1.9Si.ee1.71
Million gallons a day
Maximum
16.4+ 10.2 12.9 10.2 11.2 11.2
16,4+
9.7 7.3
11.8 11.7+ 9.7
10.2
16.4+
Minimum
6.9 7.8 7.8 7.8 6.9 7.3
6.4
6.0 1.66 2.3 7.3 7.3 7.3
1.66
Mean
9.14 8.76 9.15 S.44 9.26 S.94
8.99
7.85 4.10 9.23 8.95 8.83 8.16
8.42
Mar.
2.3 4.6 6.4 7.8
9.7 9.7
10.2 10.7
10.2 > 10.2 > 9.7
9.7 > 9.2
9.2 10.2 11.8 10.7 10.2
10.2 10.2 9.7 9.2 9.7
9.7 9.2 9.2 9.2 8.7 8.7
Apr.
S.7 9.7
11.7+ 10.7
9.7 9.7
10.7 10.2
9.7 9.2 9.2 9.2 8.7
8.7 8.7 9.2 8.7 8.7
8.7 8.2 8.2 8.2 7.8
7.6 7.3 7.3 7.3 7.3
Second- foot (mean)
14.1 13.6 14.2 13.1 14.3 13.8
13.9
12.1 6.34
14.3 13.8 13.7 12.6
13.0
May
7.3 6.7 8.7 8.7
8.7 9.2 8.7 8.7
8.7 8.7 8.2 8.2 S.S
8.7 9» 3 9.3 9« <2 9.7
9.7 9.7 9.7 9.7 9.2
9.2 8.7 8.7 8.2 8.2 8.7
June
3.7 8.7 6.2 8.2
8.7 8.2 8.2 7.3
7.8 7.S 7.S 7.3 7.3
7.3 7.3 7.3 7.8 8.2
7.8 7.3 7.S 8.2 8.2
7.S 8.2
10.2 9.2 9.7
Total run-off
Million gallons
283 272 274 262 278 277
3,230
243 119 236 269 274 245
3,080
Acre-feet
669 834 842 803 352 850
10,070
747 365 878 824 840 752
9,460
Hote.- Control was drowned by overflow from Walluku River from 2jl5 a.m. to lOilB a.i from 7j30 p.ffl. to lOjOO p.m. Apr. 3.
July 25,
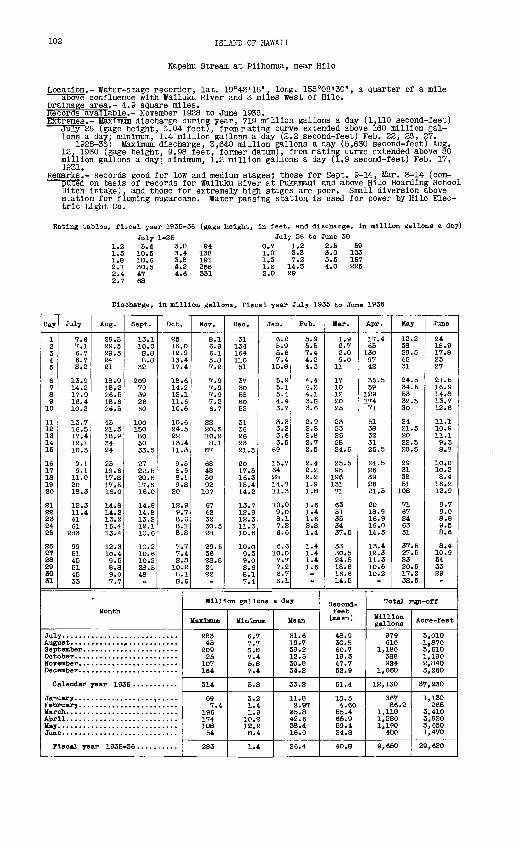
102 ISLAND OF HAWAII
Kapehu Stream at Pllhonua, near Hllo
Location.- Water-stage recorder, lat. 19°43'15", long. 155°08'30", a quarter of a-mlle adove confluence with Walluku River and 3 miles west of Hllo.
Drainage area.- 4.9 square miles.Records available.- November 1928 to June 1936.Extremes.- Maximum discharge during year, 719 million gallons a day (1,110 second-feet) July 25 (gage height, 6.04 feet), from rating curve extended above 160 million gal
lons a day; minimum, 1.4 million gallons a day (2.2 second-feet) Feb. 22, 26, 27.1928-36: Maximum discharge, 3,640 million gallons a day (5,630 second-feet) Aug.
12, 1930 (gage height, 9.98 feet, former datum), from rating curve extended above 80 million gallons' a day; minimum, 1.2 million gallons a day (1.9 second-feet) Feb. 17, 1931.
Remarks.- Records good for low and medium stages; those for Sept. 9-14, Mar. 3-14 (com- puted on basis of records for Walluku River at Pukamaul and above Hllo Boarding School Ditch Intake), and those for extremely high stages are poor. Small diversion above station for flumlng sugarcane. Water passing station Is used for power by Hllo Elec tric Light Co.
Rating tables, fiscal year 1935-36 (gage height, in feet, and discharge, in million gallons a day)
1.2 1.5 1.8 2.1 2.4 2.7
July 1-255.4
10.5 18.6 30.5 47
3.0 3.4 3.8 4.2 4.6
94138191256331
July 26 to June 30
0.7 1.0 1.3 1.6 2.0
1.23.37.2
14.529
2.5 3.0 3.5 4-.0
59103157225
Discharge, in million gallons, fiscal year July 1935 to June 1936
Day
1 2 3 4 5
6 7 8 9 10
11 12 13 14 15
16 17 18 19 20
21 22 23 24 25
26 2V 28 29 30 31
July
7.6 7.1 6.7 6.7 S.2
13.9 14.2 17.9 16.4 10.3
13.7 16.5 17.4 12.1 10.3
9.1 9.1
11.0 20 18.3
12.3 11.4 41 61
283
99 51 45 51 45 33
Aug.
29.5 29.5 29.5 24 21
18.9 18.2 26.5 18.6 26.5
45 21.5 18.9 34 24
25 19.6 17. S 17.5 16.0
14.8 14.2 13.2 15.4 13.4
12.3 10.4 9.5 8.8 9.0 7.7
Sept.
13.1 10.0 S.8 8.8 32
209 79 39 26 6O
100 150 80 50 33.5
27 22.5 20.5 17. S 16.0
14.8 14.8 13.2 12.1 10.6
10.2 10.6 10.2 2S.5 48
Oct.
25 16.0 12.9 13.4 17.4
18.6 14.2 12.1 11.6 10.6
10.6 24.5 22 13.4 11.3
9.5 S.6 8.1 9.S
20
12.9 9.7 8.6 8.1 8.8
7.7 7.4 S.S 10.2 8.1 S.6
Month
Jul Augi Sep Dot HOT Dec
C
Jan Feb Mar Apr May Jun
F
alendar year 19.
iscal year 1935
Nov.
8.16.9 6.1 5.8 7.2
7.9 7.9 7.9 7.2 6.7
22 20.5 10.2 8.1
S7
68 48 50 92
107
67 42 32 30.5 28
29.5 36 2S.5 24 22
Dec.
31 134164 110 51
37 30 58 60 52
31 36 26 23 21.5
20 17.5 16.3 15.4 14.2
13.7 12.9 12.3 11.3 10.6
10.0 9.3 9.0 S.6 8.1 7.4
Jan.
6.2 5.9 5.6 7.4
15.8
5.9 5.15.4 4.4 3.7
3.3 3.2 3.6 3.5
69
15.7 64 28 14.8 11.3
10.0 9.0 8.1 7.2 6.6
6.6 10.07.7 7.2 6.7 6.1
Feb.
5.95.5 7.4 4.2 4.3
4.4 4.2 4.1 3.S 3.6
2.9 2.8 2.8 2.7 2.5
2.4 2.2 2.2 1.9 l.S
1.6 1.4 1.6 2.S 1.4
1.4 1.4 1.4 1.6
Million gallons a day
Maximum
283 45
209 25
107 164
314
69 7.4
196 174 108 54
283
Minimum
6.7 7.7 S *S 7.4 5.8 7.4
5.8
3.2 1.4 1.9
10.2 12.2 S.4
1.4
Mean
31.6 19.7 39.2 12.5 30.8 34.2
33.2
11.8 2.97 35.8 42.6 38.4 16.0
26.4
Mar.
1.9 2.7 2.0 9.0
11
17 10 12 20 25
23 23 25 28 24.5
25.5 95
196 131 71
63 51 35 34 37.5
33 30.5 24.5 18.6 16.6 14.5
Apr.
17.4 65
130 97 42
35.5 59
129 174 71
51 38 32 31 25.5
24.5 26 39 26 21.5
2018.9 16.9 16.014.5
13.4 12.3 11.3 10.6 10.2
Second- feet (mean)
48.9 30.5 60.7 19.3 47.V 52.9
51.4
IS. 3 4.60 55.4 65.9 59.4 24.8
40.8
May
12.2 38 29.5 45 31
24.5 34.5 53 32.5 30
24 21.5 20 22.5 20.5
29 31 38 51
10S
71 67 S4 63 51
37.5 27.5 23 20.5 17,2 32.5
June
24 IS. 9 17.8 23 27
21.5 16.9 14.8 13.7 12.6
11.1 10.9 11.1 9.3 8.8
10.0 10.2 8.4
16.2 12.9
9.7 9.0 8.8 9.5 8.6
8.4 10.9 54 33 29
Total ru/i-off
Million gallons
979 610
1,180 388 924
1,060
12,130
367 86.2
1,110 1,280 1,190
480
9,650
Acre-feet
3,010 1.870 3,610 1,190 2,840 3,260
37,230
1,130 265
3,410 3,920 3,650 1,470
29,620
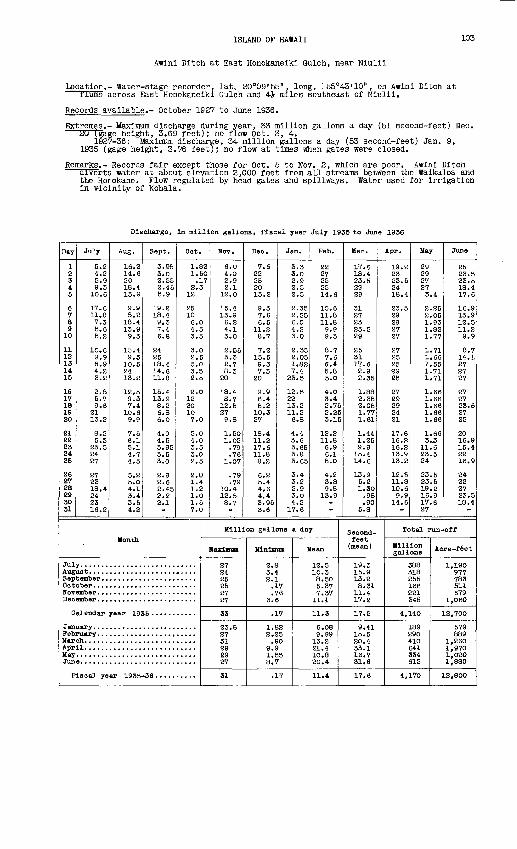
ISLAND OF HAWAII 103
Awinl Ditch at East Honokaneikl Gulch, near Nlulll
Location.- Water-stage recorder, lat. 20°09'55", long, 155°43'10", on Awlnl Ditch at riume across East Honokaneikl Gulch and 4t miles southeast of Nlulll.
Records available.- October 1927 to June 1936.
Extremes.- Maximum discharge during year, 33 million gallons a day (51 second-feet) Dec. 20 {gage height, 3.69 feet); no flow Oct. 3, 4.
1927-36: Maximum discharge, 34 million gallons a day (53 second-feet) Jan. 9, 1935 (gage height, 3.76 feet); no flow at times when gates were closed.
Remarks.- Records fair except those for Oct. 5 to Nov. 2, which are poor. Awini Ditch diverts water at about elevation 2,000 feet from all streams between the Walkaloa and the Honokane. Flow regulated by head gates and spillways. Water used for irrigation In vicinity of Kohala.
Discharge, In million gallons, fiscal year July 1935 to June 1936
Day
1 2 3 4 5
6 V 8 9 10
11 12 13 14 15
16 17 18 19 20
21 22 23 24 25
26 27 28 29 30 31
July
5.2 4.2 5.9 9.3
10.6
17.6 11.8 7.3 5.6 5.2
10.6 9.9 5.9 4.2 3.2
2.8 5.7 9.6
21 13.2
8.2 5.3
23.5 24 27
27 23 18.4 24 23 16.2
Aug.
16.2 14.6 20 18.4 13.9
9.9 8.2 18.4 13.9 9.3
15.4 9.3
10.5 24 13.2
12.5 9.3 7.4 10.6 9.9
7.5 6.1 5.1 4.7 4.5
5.2 5.0 4.1 3.4 3.5 4.2
Sept.
3.95 3.0 2.55 2.45 5.9
19.2 18.4 9.3 7.4 6.8
24 25 18.4 14.6 11.8
15.4 13.9 8.2 6.8 6.0
4.9 4.5 3.95 3.5 3.0
2.9 2.6 2.45 2.2 2.1
Oct.
1.82 1.50 .17
2.3 12
25 10 6.0 4.5 3.5
3.0 2.5 5.0 3.5 2.5
2.0 12 20 10 7.0
5.0 4.0 3.5 3.0 2.5
2.0 1.4 1.2 1.0 1.5 7.0
Month
Jul Aug Sep Oct HOT Dec
C
Jan Peb Mar Apr May Jun
P
alendar year 19;
Iscal year 1935
NOT.
6.0 4.0 2.9 2.1
12.0
15.4 13.9 6.2 4,1 3.0
2.55 3.3 2.7 8.3
20
18.4 S.7
12.5 27 9.8
1.50 1.02 .79 .76
1.0V
.79
.79 10.4 12.5 8.7
Dec.
7.6 22 25 20 13.2
9.3 7.6 6.5
11.2 8.7
7.2 15.5 9.3 7.3
20
9.9 6.4 5.2
10.3 27
18.4 11.2 17.6 11.8 8.2
6.2 5.4 4.6 4.4 3.95 3.6
Jan.
3.3 3.0 2.9 2.5 2.5
2.35 2.55 6.0 4.2 3.0
2.35 2.05 1.82 7.4 23.5
12.5 22 13.2 11.2 6.8
4.4 3.6 3.65 3.8 3.65
3.4 3.2 2.9 3.0 4.2
17.6
Peb.
22 27 25 25 14.6
10.6 11.8 11.8 9.9 9.3
8.7 7.6 6.4 5.8 5.0
4.0 3.4 2.75 2.25 3.15
12.2 11.8 6.9 6.1 5.0
4.2 3.8 9.8
13.9
Million gallons a day
Maximum
27 24 25 25 27 27
33
23.5 27 31 29 29 27
31
Minimum
2.8 3.4 2.1 .17 .76
3.6
.17
1.82 2.25 .90
9.9 1.55 8.7
.17
Mean
12.5 10.3 8.50 5.37 7.37 11.1
11.3
6.08 9.99
13.2 21.4 10.8 20.4
11.4
Mar.
17.5 18.4 23.5
29
31 27 23 23.5 29
25 31 17.6 2.9 2.35
1.88 2.35 2.05 1.77 1.61
1.44 1.25 9.9 15.4 14.6
13.9 5.2 1.30 .98 .90
5.8
Apr.
19.2 23 23.5 24 18.4
23.5 29 29 27 27
27 25 25 29 25
27 29 29 24 21
17.6 16.?. 16.2 13.9 13.2
12.5 11.8 10.6 9.9
14.6
Second- feet (mean)
19.3 15.9 13.2 8.31 11.4 17.2
17.5
9.41 15.5 20.4 33.1 16.7 31.6
17.6
May
29 29 27 27 3.4
2.25 2.05 1.93 1.82 1.77
1.71 1.66 1.55 1.71 1.71
1.66 1.66 1.66 1.66 1,66
1.66 3.3
11.6 23.5 24
23.5 23.5 19.2 16.9 17.6 27
June
25 23.5 23.5 18.4 17.6
16.9 13.9 12.5 11.2 9.9
8.7 14.1 27 27 27
27 27 23.5 27 25
20 16.9 15.4 22 16.9
24 22 27 23.5 18.4
Total run-off
Million gallons
388 318 255 166 221 345
4,140
189 290 410 641 334 612
4,170
Acre-feet
1,190 977 783 511 679
1,060
12,700
579 889
1,260 1,970 1,020 1,880
12,800
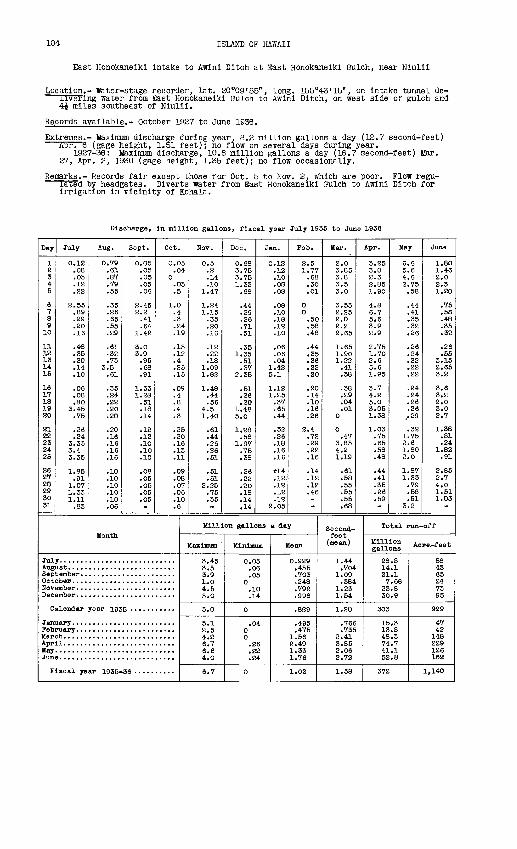
104 ISLAND OF HAWAII
East Honokanelkl Intake to Awlnl Ditch at East Honokanelkl Gulch, near Nlulli
Location.- Water-stage recorder, lat. 20°09'55n , long. 155°43'15", on Intake tunnel de- iiverlng water from East Honokanelkl Gulch to Awlni Ditch, on west side of gulch and 4J miles southeast of Nlulli.
Records available.- October 1927 to June 1936.
Extremes.- Maximum discharge during year, 8.2 million gallons a day (12.7 second-feet) Apr. 6 (gage height, 1.51 feet); no flow on several days during year.
1927-36: Maximum discharge, 10.8 million gallons a day (16.7 second-feet) Ifer. 27, Apr. 2, 1930 (gage height, 1.35 feet); no flow occasionally.
Remarks.- Records fair except those for Oct. 5 to Nov. 2, which are poor. Flow regu- lated by headgates. Diverts water from East Honokanelkl Gulch to Awlni Ditch for Irrigation In vicinity of Kohala.
Discharge, In million gallons, fiscal year July 1935 to June 1936
Day
1 2 3 4 5
6 7 8 9
10
11 12 13 14 15
16 17 18 19 20
21 22 23 24 25
26 27 28 29 30 31
July
0.12 .08 .05 .12 .22
2.55 .89 .29 .20.16
.46
.35
.20
.14
.10
.06
.08
.80 3.45
.75
.26
.24 3.35 3.4 3.35
1.85 .91
1.07 1.33 1.11
.83
Aug.
0.79 .61 .87 .79 .55
.35
.26
.65
.55
.29
.61 -32 .73
3.5 .61
.35
.24
.22
.20
.20
.20
.16
.16 ,16 .16
.10
.10
.10
.10
.10
.06
Sept.
0.05 .05 .05 .05 .06
2.45 2.2
.41
.64 1.42
3.0 3.9
.95
.68
.91
1.33 1.28
.51
.18
.14
.12
.12
.10
.10
.10
.08
.05
.05
.05
.05
Oct.
0.05 .04
0 .05 .5
1.0.4 .3 .24 .19
.15
.12
.4
.25
.15
.09
.4
.8
.4
.3
.25
.20
.16
.13
.11
.09
.08
.07
.06
.10
.6
Month
Jul Augi Sep Oet NOT Dee
C
Jam Feb liar Apr May Jun
P
alendar year 193
"h
.seal year 1935-
Nov.
0.5 .2 .14 .10
1.47
1.24 1.15
.35
.20
.16
.12
.22
.18 1.09 1.82
1.48 .44 .56
4.5 1.40
.61
.44
.26
.26
.51
.51
.51 2.25
.75
.35
Dec.
0.68 3.75 3.75 1.33
.68
.44
.29
.26
.71
.51
.35 1,35
.51
.37 2.35
.51
.26
.20 1.48 5.0
1.28 .58
1.97 .75 .38
.26
.22
.20
.18
.14
.14
Jan.
0.12 .12 .10 .OS .08
.08
.10
.18
.12
.10
.06
.06
.04 1.42 5.1
1.12 1.25
.37
.65
.44
.32
.26
.18
.16
.16
f!4 .12. .12 .12 .12
2.05
Feb.
2.5 1.77
.68
.30
.01
0 0
.50
.58
.48
.44
.35
.26
.22
.20
.20
.14
.10
.16
.26
2.4 .72 .29 .22 .16
.14
.12
.12
.46
Million gallons a day
MmHiimm
3.45 3.5 3.9 -L.O 4.6 5.0
5.0
5.1 2.5 4.2 6.7 6.6 4.0
6.7
Minimum
0.05 .06 .05
0.10 .14
0
.04 0 0
.26
.22
.24
0
lie an
0.929 .455 .703 .248 .792 .996
.829
.495
.475 1.56 2.49 1.33 1.76
1.02
Mar.
2.0 3.85 3.8 3.5 3.0
3.55 2.25 2.0 2.2 2.65
1.65 1.90 1.S2
.41
.38
.38
.29
.04
.01 0
0 .47
3.85 4.2 1.19
.61
.58
.55
.55
.55
.68
Apr.
3,25 3.0 2.3 2.85 1.90
4.8 6.7 5.6 3.9 2.9
2.75 1.70 2.6 5.6 1.95
3.7 4.S 5.0 3.05 1.38
1.03 .75 .65 .58 .48
.44
.41
.35
.26
.59
Second;- feet
(mean)
1.44 .704
1.09 .384
1.23 1.54
1.28
.766
.735 2.41 3.85 2.06 2.72
1.58
May
6,6 5.6 4.6 2.75
.58
.44
.41
.35
.32
.26
.26
.24
.22
.22
.22
.24
.24
.26
.26 ..29
.32 1.75 2.6 1.80 2.0
1.87 1.33
.79
.58
.51 3.2
June
1.80 1.46 2.0 2.3 1.20
.75
.53
.48
.35
.32
.26
.55 3.15 2.65 3.2
3.6 3.2 2.0 3.0 2.7
1.38 .81 .24
1.82 .91
2.85 2.7 4.0 1.51 1.03
Total run-off
MgSons < »*
28.8 88 14.1 43 21.1 65 7.68 24
23.8 73 30.9 95
303 929
15.3 47 13.8 42 48.3 148 74.7 229 41.1 126 52.8 162
372 1,140
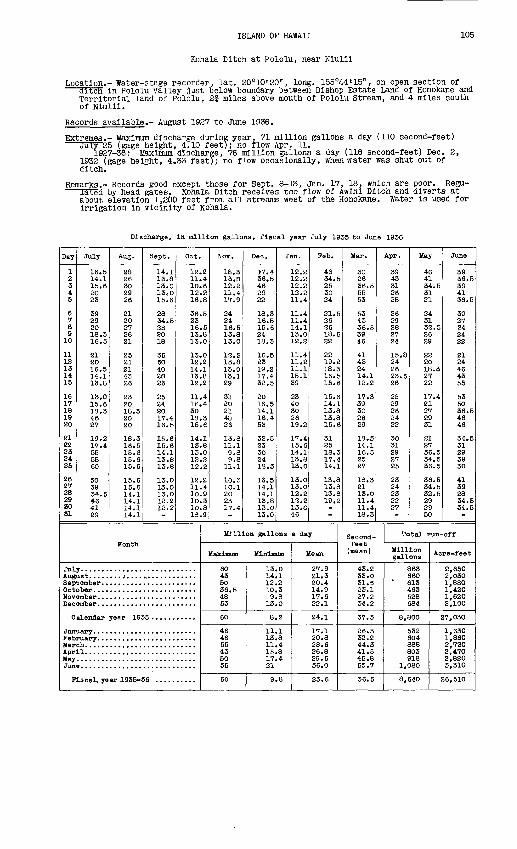
ISLAND OF HAWAII 105
Kohala Ditch at Pololu, near Niulii
Location.- Water-stage recorder, lat. 20°10'20", long. 155 e>44'15'1 , on open section of ditch in Pololu Valley dust below boundary between Bishop Estate Land of Honokane and
Territorial land of Pololu, 2f miles above mouth of Pololu Stream, and 4 miles south of Niulii.
Records available.- August 1927 to June 1936.
Extremes.- Maximum discharge during year, 71 million gallons a day (110 second-feet) July 25 (gage height, 4.10 feet); no flow Apr. 11.
1927-36: Maximum discharge, 76 million gallons a day (118 second-feet) Dec. 2, 1932 (gage height, 4.33 feet); no flow occasionally, when water was shut out of ditch.
Remarks.- Records good except those for Sept. 8-13, Jan. 17, 18, which are poor. Regu- la^ed by head gates. Kohala Ditch receives the flow of Awini Ditch and diverts at
about elevation 1,200 feet from all streams west of the Honokane. Water is used for irrigation in vicinity of Kohala.
Discharge, In million gallons, fiscal year July 1935 to June 1936
Day
1 2 3 4 5
6 V 8 9 10
11 12 13 14 15
16 17 18 19 20
21 22 23 24 25
26 2V 28 29 30 31
July
16.5 14.1 15.6 20 23
39 29 20 18.3 16.5
21 20 16.514.1 13.8
13.0 15.618.3 46 27
19.2 17.4 55 55 60
50 39 34.5 46 41 29
Aug.
28 26 30 29 26
21 20 27 26 21
2521 21 43 26
23 20 18.3 20 20
18.3 16.5 15.6 15.6 15.6
15.6 15.5 14.1 14.1 14.1 14.1
Sept.
14.1 13.8 13.0 13.0 15.6
28 34.5 2S 20 18
35 50 40 2S 23
25 24 SO 17.4 16.5
15.6 15.6 14.1 13. S 13.8
13.0 13.0 13.0 12.2 12.2
Oct.
12.2 11.4 10.6 12. S 16.8
36.5 23 16.5 13.8 13.0
13.0 12.2 14.1 13.8 12.2
11.4 16.4 30 18.3 15.6
14.1 13.8 13.0 12.2 12.2
12.2 11.4 10.9 10.3 10.8 18.9
Month
Jul Augi Sep Oct HOT Dec
C
Jan Peb Mar Apr May Jun
P
alendar year 19
IscaX year 1935-
Nov.
18.3 13.S 12.2 11.4 17.9
24 24 16.5 13.8 13.0
12.E 13.8 13.0 13.1 29
31 20 21 48 26
13.8 11.1 9.8 9.8
11.1
10.3 10.1 20 23 17.4
Dec.
17.4 36.5 46 29 22
18.3 16.5 15.6 24 18.3
16.5 23 19.2 17.4 32.5
20 16.5 14.1 16.4 53
32.5 23 30 24 18.3
16.5 14.1 14.1 13.8 13.0 13.0
Jan.
12.2 12.2 12.2 12.2 11.4
11.4 11.4 14.1 13.0 12.2
11.4 11.2 11.1 15.1 39
23 40 30 26 19.2
17.4 15.6 14.1 13.8 13.0
13.0 13.0 12.2 12.2 13.0 46
Feb.
46 34.5 25 30 24
21.5 26 26 18.6 22
22 19.2 18.3 16.5 15.6
15.6 14.1 13.8 13.8 15.6
31 25 18.3 17.4 14.1
13.8 13.8 13.8 19.2
Million gallons a day
Maximum
60 43 50 36.5 48 53
60
46 46 55 43 50 55
60
Minimum
13.0 14.1 12.2 10.3 9.8 13.0
8.2
11.1 13.8 11.4 15.8 17.4 21
9.8
Mean
27.9 21.3 20.4 14.9 17.6 22.1
24.1
17.1 20.8 28.6 26.8 29.6 36.0
23.6
Mar.
30 26 36.5 55 53
53 43 36.5 39 46
41 43 24 14.1 12.2
17.3 39 30 26 29
18.3 14.1 16.5 25 27
18.3 21 13.0 11.4 11.4 18.3
Apr.
39 43 31 26 25
26 2928 27 24
15.8 24 26 23.5 26
28 29 26 24 22
30 31 29 27 25
23 24 23 22 27
Second- feet
(mean)
43.2 33.0 31.5 23.1 27.2 34.2
37.3
26.5 32.2 44.3 41.5 45.8 55.7
36.5
May
46 41 34.5 31 21
24 31 32.5 26 29
22 20 18.3 27 22
17.4 21 27 29 31
21 27 36.5 34.5 36.5
36.5 34.5 32.5 29 29 50
June
39 36.5 39 41 36.5
30 27 24 24 22
21 24 46 43 55
53 50 36.5 46 46
34.5 31 29 39 30
41 39 28 34.5 34.5
Total run-off
Million gallons
863 660 613 463 528 684
8,800
532 604 888 803 918
1,080
8,640
Acre -feet
2,650 2,030 1,880 1,420 1,620 2,100
27,030
1,630 1,860 2,720 2,470 2,820 3,310
26,510
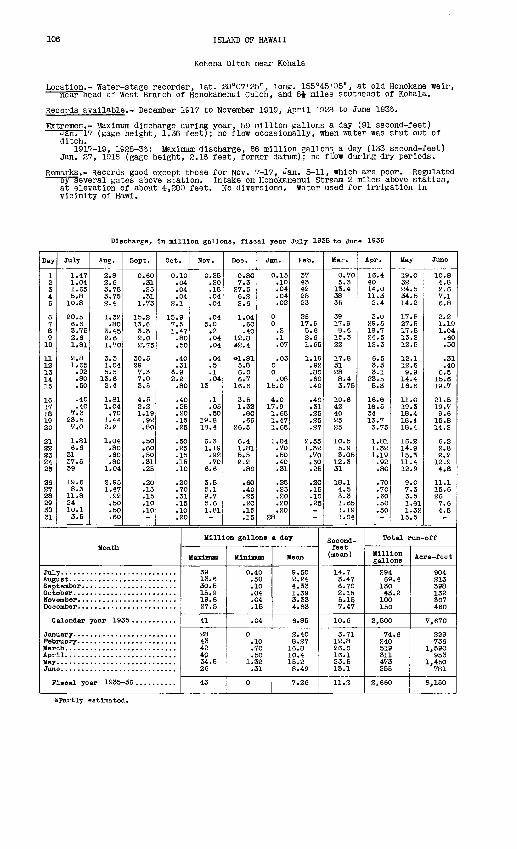
106 ISLAM) OF HAWAII
Kehena Ditch near Kohala
Location.- Water-stage recorder, lat. 20°07'25", long. 155°45'05", at old Honokane weir, near nead of West Branch or Honokanenui Gulch, and 8J miles southeast or Kohala.
Records available.- December 1917 to November 1919, April 1928 to June 1936.
Extremes.- Maximum discharge during year, 59 million gallons a day (91 second-feet) Jan. 17 (gage height, 1.36 feet); no flow occasionally, when water- was shut out of
ditch.1917-19, 1928-36: Maximum discharge, 86 million gallons a day (133 second-feet)
Jan. 27, 1918 (gage height, 2.16 feet, former datum); no flow during dry periods.
Remarks.- Records good except ttiose for Nov. 7-17, Jan. 5-11, which are poor. Regulated byseveral gates above station. Intake on Honokanenui Stream 2 miles above station,
at elevation of about 4,200 feet. No diversions. Water used for irrigation in vicinity of Hawi.
Discharge, In million gallons, fiscal year July 1935 to June 1936
Day
1 2 3 4 5
6 7 8 9 10
11 12 13 1415
16 17 18 19 20
21 22 23 24 25
26 27 28 29 30 31
July
1.47 1.04 1.65 5.8
10.8
20.5 6.6 3.75 2.6 1.81
2.8 1.65 .92 .80 .50
.40
.40 7.3
23.5 7.0
1.81 6.6
31 37.5 39
19.6 8.3
11.8 24 10.1 3.5
Aug.
2.8 2.6 3.75 3.75 2.4
1.32 .80
3.45 2.6 1.70
3.3 1.04 5.5
13.6 2.4
1.81 1.04 .70
1.44 2.2
1.04 .80 .60 .80
1.04
2.95 1.47 .92 .50 .50 .60
Sept.
0.60 .31 .25 .31
1.73
15.2 13.6 3.3 2.0 2'. 75
30.5 29 7.3 7.0 3.5
4.5 2.2 1.19 .92 .80
.50
.60
.50
.31
.25
.20
.15
.15
.10
.10
Oct.
0.10 .04 .04 .04
2.1
15.9 7.5 1.47 .80 .50
.40
.31 6.9 2.2 .80
.40
.25
.20
.15
.25
.50
.25
.15
.15
.10
.20
.70
.31
.15
.10
.20
Month
Jul Augi Sep Oct Hov Dec
C
Jan Feb Mar Apr May Jun
P
alendar year 19
local year 1935-
HOT.
0.25 .20 .15 .04 .04
.04 5.0 .2 .04 .04
.04
.5
.1
.0413
.1
.05
.50 19.8 18.4
6.3 1.19 .92 .70
6.6
3.5 5.1 9.7 5.6 1.81
Dec.
0.80 7.3
27.5 6.2 2.6
1.04 .60 .40
12.8 »2.4
1.81 5.8 6.0 6.7
16.6
3.5 1.32 .60 .66
26.5
6.4 1.81 5.5 2.2 .80
.60
.40
.25
.20
.15
.15
Jan.
0.15 .10 .04 .04 .02
0 0 .2 .1 .07
.03 0 0 .08
15.0
4.0 17.9 1.65 1.47 1.65
1.04 .70.50 .40 .31
.25
.25
.20
.20
.20 28
Feb.
37 43 42 28 23
28 17.6 5.6 2.6 1.65
1.19 .92 .80 .60 .40
.40
.31
.25
.25
.27
2.55 1.32 .70 .60 .25
.20
.15
.10
.25
Million gallons a day
Maximum
39 13.6 30.5 15.9 19.8 27.5
41
28 43 42 4P 34.5 26
43
Minimum
0.40 .50 .10 .04 .04 .15
.04
0 .10 .70 .50
1.32 .31
0
Mean
9.50 2.24 4.33 1.39 3.33 4.83
6.85
2.40 8.27 16.8 10.4 15.2 8.49
7.26
Mar.
0.70 5.3
13.4 38 35
39 17.9 8.6 15.3 22
17.8 31 28 8.4 3.75
10.6 42 40 25 25
10.5 5.9 3.05
12.3 31
18.1 4.5 3.3 1.65 1.19 1.04
Apr.
16.4 40 14.0 11.3 2.4
3.0 29.5 19.7 24.5 12.3
6.5 3.3 3.1
23.5 5.3
16.6 16.5 34 13.7 3.75
1.81 1.32 1.19 .92 .80
.70
.70
.60
.50
.50
Second- feet (mean)
14.7 3.47 6.70 2.15 5.15 7.47
10.6
3.71 12.8 26.0 16.1 23.5 13.1
11.2
May
19 32 34 34 14
17 27 17 13 12
12 12 9
14 16
11 19 18 18 18
16 14 15 11 12
9 7 3 1 1
15
0
.5
.5 2
.5
.5
.5 25
15 9 4 6
0 .34 44
2 9 3 4 9
0 3 5 61 32 5
June
10.8 4.8 2.6 7.1 6.8
2.2 1.19 1.04 .60 .50
.31
.40 6.5
15.6 19.7
21.5 19.7 9.6 15.8 14.2
6.2 2.8 2.2 12.9 4.8
11.1 15.6 26 7.6 4.5
Total run-off
Million gallons
294 69.4
130 43.2 100 150
2,500
74.6 240 519 311 473 255
2,660
Acre-feet
904 213 398 132 307 460
7,670
229 736
1,590 953
1,450 781
8,150
»Partly estimated.
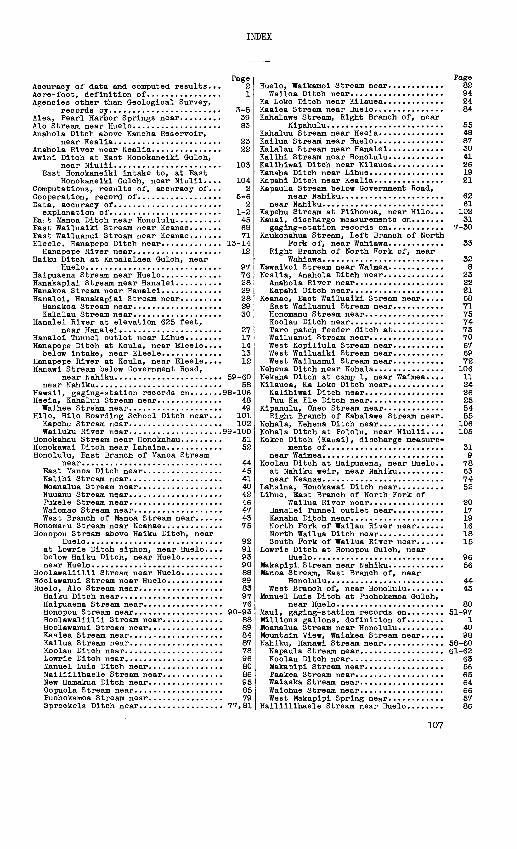
INDEX
Accuracy of data and computed results... Acre-foot, definition of................Agencies other than Geological Survey,
records by........................Aiea, Pearl Harbor Springs near.........Alo Stream near Huelo...................Anahola Ditch above Kaneha Reservoir,
near Kealia.......................Anahola River near Kealia...............Awlnl Ditch at East Honokanelkl Gulch,
near Niulil.......................East Honokaneiki intake to, at East
Honokaneiki Gulch, near Nlulli....Computations, results of, accuracy of... Cooperation, record of..................Data, accuracy of.......................
explanation of........................Ea; t Manoa Ditch near Honolulu..........East Wailuaikl Stream near Keanae.......East Walluanui Stream near Keanae.......
Page 21
3-5 39 83
2322
103
1042
5-6 2
1-2 45 68 71
Eleele, Hanapepe Ditch near............. 13-14Hanapepe River near................... 12
Haiku Ditch at Kapalalaea Gulch, nearHuelo............................. 97
Haipuaena Stream near Huelo............. 76Hanakaplal Stream near Hanalel.......... 28Hanakoa Stream near Hanalei............. 29Hanalel, Hanakaplai Stream near......... 28
Hanakoa Stream near................... 29Kalalau Stream near................... 30
Hanalei River at elevation 625 feet,near Hanalel...................... 27
Hanalei Tunnel outlet near Lihue........ 17Hanapepe Ditch at Koula, near Eleele.... 14belcw intake, near Eleele............. 13
Hanapepe River at Koula, near Eleele.... 12Hanawi Stream below Government Road,
near Nahlku....................... 59-60near Nahlku........................... 58
Hawaii, gaglng-station records on.......98-106Heeia, Kahaluu Stream near.............. 48Waihee Stream near.................... 49
Hilo, Hilo Boarding School Ditch near... 101 Kapehu Stream near.................... 102Wailuku River near....................99-100
Honokahau Stream near Honokahau......... 51Honokawai Ditch near Lahalna............ 52Honolulu, East Branch of Manoa Stream
near.............................. 44East Manoa Ditch near................. 45Kallhi Stream near.................... 41Moanalua Stream near.................. 40Nuuami Stream near.................... 42Pukele Stream near.................... 46Waiomao Stream near................... 47West Branch of Manoa Stream near...... 43
Honomanu Stream near Keanae............. 75Honopou Stream above Haiku Ditch, near
Huelo............................. 92at Lowrie Ditch siphon, near Huelo.... 91below Haiku Ditch, near Hueio......... 93near Huelo............................ 90
Hoolawalillll Stream near Huelo......... 88HcSclawanui Stream near Huelo............ 89Huelo, Alo Stream near.................. 83
Haiku Ditch near...................... 97Haipuaena Stream near................. 76Honopou Stream near................... 90-93
8889 84 87 78 96 80 86 95 85 79
Spreokels Ditch near.................. 77,81
Hoolawallllil Stream near. Hoolawanui Stream near....Kaaiea Stream near........Kailua Stream near........Koolau Ditch near.........Lowrie Ditch near.........Manuel Luis Ditch near....Nalliillhaele Stream near. New Hamakua Ditch near....Oopuola Stream near.......Puohokamoa Stream near....
Page Huelo, Waikamoi Stream near............ 82Walloa Ditch near.................... 94
Ka Loko Ditch near Kilauea............. 24Kaaiea Stream near Huelo............... 84Kahalawe Stream, Right Branch of, near
Kipahulu......................... 55Kahaluu Stream near Heela.............. 48Kailua Stream near Huelo............... 87Kalalau Stream near Hanalel............ 30Kalihi Stream near Honolulu............ 41Kalihiwai Ditch near Kilauea........... 26Kanaha Ditch near Lihue................ 19Kapahi Ditch near Kealia............... 21Kapaula Stream below Government Road,
near Nahiku...................... 62near Nahiku.......................... 61
Kapehu Stream at Plihonua, near Hilo... 102 Kauai, discharge measurements on....... 31
gaging-statlon records on............ 7-30Kaukonahua Stream, Left Branch of North
Fork of, near Wahlawa............ 33Right Branch of North Fork of, near
Wahiawa.......................... 32Eawaikol Stream near Walmea............ 8Kealia, Anahola Ditch near............. 23Anahola River near................... 22Kapahi Ditch near.................... 21
Keanae, East Wailuaikl Stream near..... 68East Wailuanui Stream near........... 71Honomanu Stream near................. 75Koolau Ditch near.................... 74Taro patch feeder ditch at........... 73Wailuanui Stream near................ 70West Kopillula Stream near........... 67West Wailuaiki Stream near........... 69West Wailuanui Stream near........... 72
Kehena Ditch near Kohala............... 106Kekaha Ditch at camp 1, near Waimea.... 11Kilauea, Ka Loko Ditch near............ 24Kalihiwai Ditch near................. 26Puu Ka Ele Ditch near................ 25
Kipahulu, Oheo Stream near............. 54Right Branch of Kahalawe Stream near. 55
Kohala, Kehena Ditch near.............. 106Kohala Ditch at Pololu, near Niulii.... 105Kokee Ditch (Kauai), discharge measure
ments of......................... 31near Waimea........................... 9
Koolau Ditch at Haipuaena, near Huelo.. 78 at Nahiku weir, near Nahiku.......... 63near Keanae.......................... 74
Lahaina, Honokawai Ditch near.......... 52Lihue, East Branch of North Fork of
Wailua River near................ 20Hanalel Tunnel outlet near........... 17Kanaha Ditch near.................... 19North Fork of Wallau River near...... 16North Wailua Ditch near.............. 18South Fork of Wailua River near...... 15
Lowrie Ditch at Honopou Gulch, nearHuelo............................ 96
Makapipi. Stream near Nahiku............ 56Manoa Stream, East Branch of, near
Honolulu......................... 44West Branch of, near Honolulu........ 43
Manuel Luis Ditch at Puohokamoa Gulch,near Huelo....................... 80
Maul, gaging-station records on........ 51-97Millions gallons, definition of........ 1Moanalua Stream near Honolulu.......... 40Mountain View, Waiakea Stream near..... 98Nahiku, Hanawi Stream near............. 58-60Kapaula Stream near.................. 61-62Koolau Ditch near.................... 63Makapipi Stream near................. 56Paakea Stream near................... 65Waiaaka Stream near.................. 64Waiohue Stream near.................. 66West Makapipi Spring near............ 57
Nalliilihaele Stream near Huelo........ 86
107
108 INDEX
Page Hew Hamakua Ditoli at Honopou, near
Huelo............................ 95Niulii, Awini Ditoli near............... 103
East Honokaneiki intake near......... 104Kohala Ditch near.................... 105
North Wailua Ditoli near Lihue.......... 18Nuuanu Stream below reservoir 2 waste-
way, near Honolulu............... 42Oahu, discharge measurements on........ 50gaging-station records on............ 32-49
Oheo Stream below diversion dam nearKipahulu......................... 54
Olowalu Ditch near Olowalu............. 53Oopoula Stream near Huelo.............. 85Paakea Stream near Nahiku.............. 65Pearl City, Pearl Harbor Springs near.. 35-38 Pearl Harbor Springs at Kalauao, near
Aiea............................. 39at Kaluaoopu, near Pearl City........ 37at Loko Kukona, near Pearl City...... 36at Puukapu, near Pearl City.......... 35at Waiau, near Pearl City............ 38discharge measurements of............ 50
Publications on stream flow, list of... 3 Puhawai Stream at Lualualei, near
Waianae.......................... 34Pukele Stream near Honolulu............ 46Puohokamoa Stream near Huelo........... 79Puu Ka Ele Ditch near Kilauea.......... 25Second-foot, definition of............. 1Spreckels Ditch at Haipuaena weir, near
Huelo............................ 77at Wahinepee, near Huelo............. 81
Taro patch feeder ditch at Keanae...... 73Terms, definition of................... 1
Eage Wahiawa, Left Branch of North Fork of
Kaukonahua Stream near........... 33Right Branch of North Fork of
Kaukonahua Stream near........... 32Waiaaka Stream near Nahiku............. 64Waiahulu Stream near Waimea............ 10Waiakea Stream at middle flume house,
near Mountain View............... 98Waianae, Puhawai Stream near........... 34Waihee Stream near Heeia............... 49Waikamoi Stream above Wailoa Ditch,
near Huelo....................... 82Wailoa Ditch at Honopou, near Huelo.... 94Wailua River, East Branch of North Fork
of, near Lihue................... 20North Fork of, at elevation 650 feet,
near Lihue....................... 16South Pork of, near Lihue............ 15
Wailuanui Stream near Keanae........... 70Wailuku River above Hilo Boarding
School Ditch intake, near Hilo... 100 at Pukamaui, near Hilo............... 99
Waimea, Kawakoi Stream near............ 8Kekaha Ditch near.................... 11Kokee Ditch near..................... 9Waiahulu Stream near................. 10
Waimea River below Kekaha Ditch intake,near Waimea...................... 7
Waiohue Stream near Nahiku............. 66Waiomao Stream above Pukele Stream,
near Honolulu.................... 47West Kopiliula Stream near Keanae...... 67West Makapipi Spring near Nahiku....... 57West Wailuaiki Stream near Keanae...... 69West Wailuanui Stream near Keanae...... 72Work, division of...................... 6
scope of............................. 1
o