Embed Size (px)
Citation preview
57Italian Journal of Engineering Geology and Environment, 2 (2017) © Sapienza Università Editrice www.ijege.uniroma1.it
DOI: 10.4408/IJEGE.2017-02.O-03
Pia Rosella TeCCa(*), Rinaldo GeneVois(**), andRea MaRia deGanUTTi(*)
(*)CNR-IRPI - Corso Stati Uniti 4, - 35127 Padova, Italy(**) University of Padova - Department of Geosciences - Via Gradenigo 6 - 35131 Padova, Italy
Corresponding author: [email protected]
SURFACE VELOCITY DISTRIBUTION AND RHEOLOGICAL PROPERTIESESTIMATION OF DEBRIS FLOWS
EXTENDED ABSTRACTI debris flow sono tra i più pericolosi e distruttivi rischi naturali che interessano le aree montane di tutto il mondo. Nelle Alpi
Europee questi processi geologici, generalmente associati a piogge estive ad alta intensità, sono spesso causa di ingenti danni economici e di perdite di vite umane in relazione all’elevato grado di antropizzazione del territorio alpino e alla rapidità con cui si sviluppano. La conoscenza del comportamento dei debris flow è di fondamentale importanza per la gestione del territorio e per la definizione e mitigazione di questo rischio naturale, eppure la dinamica di questo fenomeno, in particolare l’intrinseca reologia, a scala di campagna, pur oggetto negli ultimi decenni di estese ricerche, è ancora poco conosciuta nella sua complessità.
I debris flow sono costituiti da una miscela di solidi granulari con acqua e aria, con una concentrazione di solidi assai variabile e generalmente mostrano un comportamento da fluido altamente non-Newtoniano, talvolta dotato di una resistenza plastica di soglia (shear strength) ed elevati valori di densità e viscosità dinamica. Tali parametri controllano il comportamento del fenomeno nelle fasi di flusso e deposizione, nonché la sua capacità erosiva. La distribuzione superficiale delle velocità denota le caratteristiche reologiche di quella miscela fluida nella sua fase di scorrimento. L’adozione di un appropriato modello reologico è fondamentale dunque per la progettazione di opere di mitigazione del rischio come bacini di deposizione del detrito o muri ed argini deflettori e per lo sviluppo di tecniche di prevenzione, come sistemi di allarme e definizione di aree a rischio.
Essendo le misure dirette della concentrazione solida, densità, viscosità e resistenza allo scorrimento nei debris flow naturali sono piuttosto difficili o impossibili tout-court da attuare, vengono in parte e sporadicamente realizzate nelle rare stazioni di monitoraggio presenti in varie aree montuose nel mondo. Misure della velocità superficiale di debris flow naturali sono invece più facilmente attuabili mediante sensori a ultrasuoni, rilievi fotografici, geofoni e video registrazione, e sono utili per la stima dei parametri reologici fondamentali. Profili orizzontali di velocità superficiale di debris flow naturali non sono comuni in letteratura; tali elaborazioni sono finora state prodotte solo da videoregistrazioni eseguite in California (USA), Giappone e Cina.
Lo scopo del presente studio è quello di fornire un metodo utile, sebbene indiretto, per stimare alcune proprietà reologiche di debris flow naturali, quali resistenza allo scorrimento e viscosità, la cui conoscenza è cruciale per la mitigazione del rischio. La scelta infatti di parametri reologici non idonei porta sovente ad errori nella progettazione delle opere di controllo, in particolare nel dimensionamento di strutture di ritenuta del materiale solido. Tecniche di analisi di immagine sono state utilizzate per misurare la distribuzione di velocità superficiale su una sezione di flusso di un debris flow naturale, in momenti differenti di un evento registrato dal sistema di monitoraggio del canale di Acquabona, nei pressi di Cortina d’Ampezzo (BL). I filmati sono stati registrati da una videocamera in posizione zenitale rispetto al flusso, sospesa sul canale nella parte bassa del suo percorso. La posizione di singole particelle sulla superficie del flusso è stata tracciata, calibrata su distanza reale, da un fotogramma al successivo, utilizzando il codice open-source VLC.
Nel caso in esame la distribuzione della velocità superficiale, determinata in momenti differenti dell’evento, mostra un comportamento del flusso di tipo Bingham e di tipo Newtoniano perfino nell’ambito di una stessa pulsazione del fenomeno, evidenziando la presenza di una zona centrale a velocità costante (rigid plug) di ampiezza variabile nel tempo o la sua assenza in alcune fasi dell’evento. Dalle elaborazione dei dati di immagine, è possibile determinare che tali differenze del comportamento reologico sono una conseguenza di significative variazioni della concentrazione solida, dello spessore del flusso e della granulometria. La resistenza allo scorrimento della miscela granulare e la viscosità sono state dunque valutate attraverso appropriate relazioni.
L’analisi di immagine e l’elaborazione della distribuzione superficiale della velocità di un debris flow consentono stime realistiche di alcuni parametri reologici di un flusso granulare in condizioni naturali, necessari per il calcolo di cruciali aspetti quali le forze di impatto e la distanza di arresto (run-out) di un debris flow, essenziali per la progettazione e dimensionamento di opere di controllo efficaci.
P.R. TECCA, R. GENEVOIS & A.M. DEGANUTTI
58 Italian Journal of Engineering Geology and Environment, 2 (2017) © Sapienza Università Editrice www.ijege.uniroma1.it
ABSTRACTDebris flows are among the most dangerous natural hazards
in mountainous areas. In European Alps, they are associated to summer heavy rainfalls and can be extremely destructive. Nevertheless, their rheology, at field scale, is still not well known.
These mixtures of debris, water and air behave as non-Newtonian fluids, with a plastic yield strength, a high bulk density and a high dynamic viscosity. Indeed, these parameters are difficult to measure in the field.
In this paper, data from a monitoring system are used to measure the surface velocity of debris flows, through image analysis, following the trajectories of single particles on the flow surface, and to infer shear strength and viscosity of flows. The surface velocity distribution shows at times either rigid plugs of different width or plug does not exist at all.
Our observations indicate the existence of both Bingham and Newtonian behaviour even in a single surge, as the consequence of significant changes in stage, solid concentration and in particle-size. Shear strength and viscosity, can be evaluated through appropriate relationships. The analysis and processing of surface velocity distribution allow realistic estimations of crucial aspects of flow behaviour like impact forces and run-out, parameters essential for the designing of effective countermeasures.
Keywords: debris flows, monitoring system, image processing, velocity distribution, rheology
INTRODUCTIONDebris flows are dense mixtures of soils, rocks and water,
which behave as non-Newtonian fluid (CosTa, 1984) with a high bulk density, a plastic yield strength, and a high dynamic viscosity (iVeRson, 2003), generally around twice that of water.
The adoption of a proper rheological model of these highly hazardous flows is fundamental to the design of effective countermeasures such as retention basins, deflection walls and levees and for testing disaster prevention techniques, such as warning systems and hazard maps.
Physical and rheological properties of natural debris flows, such as density, solid concentration, viscosity and strength, can change significantly for different debris flows events and within a single surge as well, as often observed in the field (PieRson, 1986; GeneVois et alii, 1990), mostly due to the high variability of sediment concentration in debris flows (o’BRien & JUlien, 1988). The concentration of solid fraction can play a crucial role in understanding the dominant physical phenomena in debris flows including the erosion and deposition processes (de Haas & Van WoeRkoM, 2016) and phase separation (PUdasaini & FisCHeR, 2016). Direct field measurements of solid concentration in natural debris flows are very difficult, although possible with proper sampling techniques only in particular field arrangements
(CUi et alii, 2005; HU et alii, 2011; TakesHi, 2011). However, measurement of surface velocity of natural debris flows are feasible with specialized monitoring tools and are useful to estimate those fundamental properties.
So far, surface velocity measurements of natural debris flows have been carried out mainly by means of ultrasonic sensors (PieRson, 1986; sUWa et alii, 1993; aRaTTano et alii, 1997), time-lapse photography (JoHnson, 1970; PieRson, 1986), geophones and video recording techniques (GeneVois et alii, 2000; inaBa et alii, 2000). The vertical velocities distribution in a hyperconcentrated flow has been measured in some flume tests (ZHanG & Ren, 1982; sCoTTon & deGanUTTi, 1997; aRManini et alii, 2005; sanViTale et alii, 2011) and checked against for data collected on natural debris flows (HaMilTon & ZHanG, 1997).
Horizontal profiles of surface velocity of natural debris flow are not common in literature. Such kind of data were obtained so far only from the visual record of a zenithal video camera at Wrightwood, California by JoHnson (1970), from an inclined video camera at Mt Yakedake, Japan, by sUWa et alii (1993) and by means of a stereoscopic photogrammetric system at Dongchuan Observation Station, China, by ZHanG & CHen (2003).
This paper presents the experimental results obtained through image analysis techniques to measure the surface velocity distribution along a cross section of a natural debris flow, using a video camera in zenithal position with respect to the flow. The aim of the study is to provide a useful, although indirect, method to estimate the rheological properties of natural debris flows, a crucial aspect for hazard mitigation. The data obtained have been used to verify the assumption that the velocity profile of the debris flows may be approximated by the plug flow hypothesis (HaMilTon & ZHanG, 1997). The data used in this study have been collected from a debris flow monitoring system devised by the University of Padova in Acquabona, Italy (TeCCa et alii, 2003).
STUDY SITEField observations and measurement of debris flow dynamics
have been carried out on Acquabona Creek ravine (Eastern Italian Alps). The upper rock basin, characterized by steep massive dolomite and limestone cliffs, has a drainage area of 0.30 km2 above the head of the scree-incised channel. The lower basin is covered by a thick talus, consisting of heterogeneous scree, alluvium and debris flow deposits. The main morphometric characteristics of the Acquabona watershed are reported in Table 1; a complete description of the site may be found in TeCCa et alii (2003).
Three observation stations were instrumented for debris flows monitoring at the Acquabona site: one in the initiation area, a second in the lower channel reach (the one equipped with the zenithal video camera used for this work), and a third in the deposition basin. Figure 1 displays the geological sketch of the

SURFACE VELOCITY DISTRIBUTION AND RHEOLOGICAL PROPERTIES ESTIMATION OF DEBRIS FLOWS
59Italian Journal of Engineering Geology and Environment, 2 (2017) © Sapienza Università Editrice www.ijege.uniroma1.it
study site and the location of the monitoring stations at the time of the present study.
METHODSDebris flow data analysis has been carried out using video
shots of the flow, geophones logs and ultrasonic sensors data recorded by the monitoring system at the lower channel station (station no. 2, Fig. 1); for a complete description of the monitoring system, see TeCCa et alii (2003).
Video recordsA video camera in zenithal position above the channel was
used to record the overall appearance of the flow, and to measure flow surface velocities. A calibrated noise level, lasting for a chosen time, detected by the upstream geophone along the channel, triggered a 30 minutes video shot at a rate of 25 frames per second.
The lower channel has an average slope of 6-7° at the monitoring station 2 (which is equipped also with a stage ultrasonic sensor) the video camera is suspended to a steel bar about 6.5 m high above the channel bed, its maximum framing area (image plane) is of 3.7 m x 5 m (at channel bed). Three geophones were set in series along the channel, at a distance of 100 m from each other: the middle one is located in correspondence of the ultrasonic sensor and video camera (Fig. 2).
Motion trackUsing the open-source media player VLC (VIDEOLAN,
2015), the position of individual particles has been tracked, scaled to actual distance, from one frame to the subsequent one; the velocity vectors of single grains have been determined for points from the left channel bank to the centre line of the flow. Since the field of view of the video camera varies as a function of the flow stage, which is recorded by the ultrasonic sensor, a correction of the changes in position and magnification ratio of the view field is necessary (geometric calibration) taking into consideration also
the characteristics of the video lens.
Ultrasonic logsAn ultrasonic sensor (Fig. 2), calibrated based on topographic
surveys, was used to obtain continuous measuring of the flow stage.
Geophone logsThe average surge front velocity is calculated by the analysis
of the signal shift of the geophones.
Fig. 1 - Acquabona catchment: geological sketch and location of the monitoring stations
Tab. 1 - Main morphometric characteristics of the Acquabona watershed
Fig. 2 - Area framed by the video system, from downstream view. Video-camera (focal length: 9 mm, Iris type automatic, max aperture ratio 1:1.2, sensitivity: 0.06 lux, 440.000 pixel CCD, horizontal resolution: 570 lines); angular field of view a: 29.6°; b: 22.2° (zenithal layout); H: distance of flow surface
P.R. TECCA, R. GENEVOIS & A.M. DEGANUTTI
60 Italian Journal of Engineering Geology and Environment, 2 (2017) © Sapienza Università Editrice www.ijege.uniroma1.it
RESULTS AND DISCUSSIONThe debris flow event considered for this study mobilized a
total sediment volume of about 9000 m3 and was triggered by a rainfall with a peak intensity of 16 mm/10 min and a total precipitation of 30 mm in 1 hour. The ultrasonic sensor at the monitoring station 2 recorded the passage of 8 surges in a period of 27 minutes. It has been possible to analyze in detail the surges only during the first 18 minutes due to the oncoming darkness.
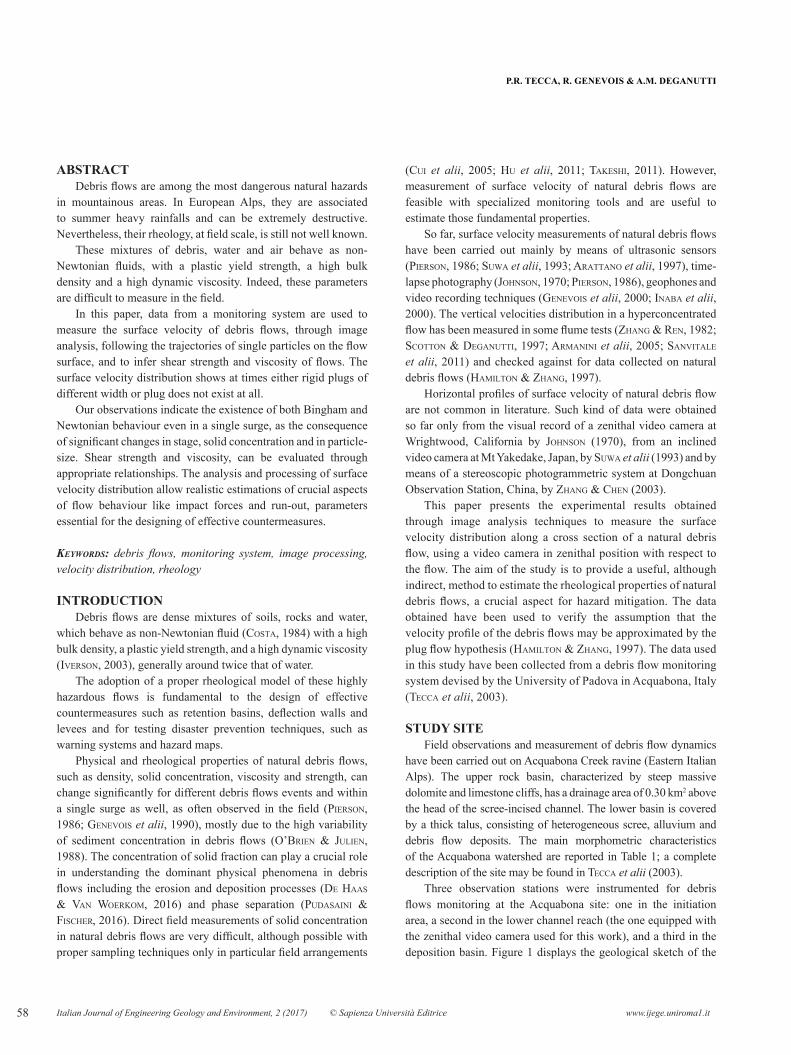
Experimental flow velocitiesParticle paths in the flowing material resulted mainly parallel
to the channel banks; some frame sequences show, however, non-parallel flow as a consequence of inter-particles collisions or side effect (Fig. 3).
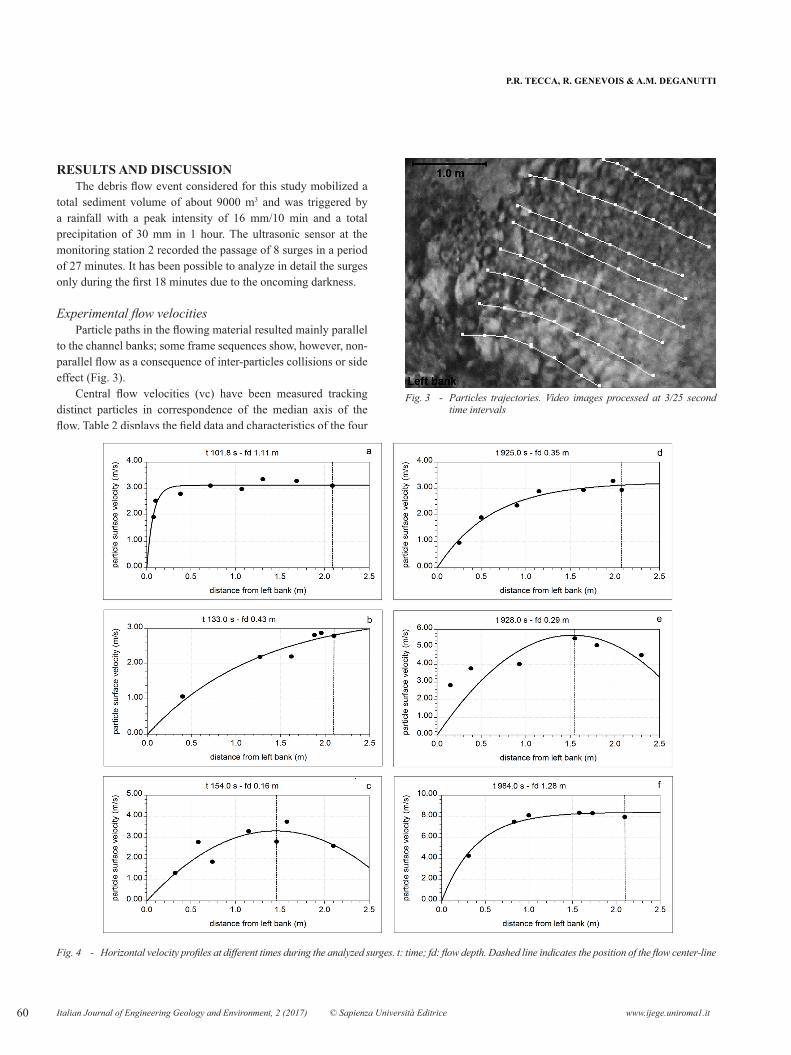
Central flow velocities (vc) have been measured tracking distinct particles in correspondence of the median axis of the flow. Table 2 displays the field data and characteristics of the four
Fig. 3 - Particles trajectories. Video images processed at 3/25 second time intervals
Fig. 4 - Horizontal velocity profiles at different times during the analyzed surges. t: time; fd: flow depth. Dashed line indicates the position of the flow center-line

SURFACE VELOCITY DISTRIBUTION AND RHEOLOGICAL PROPERTIES ESTIMATION OF DEBRIS FLOWS
61Italian Journal of Engineering Geology and Environment, 2 (2017) © Sapienza Università Editrice www.ijege.uniroma1.it
recorded surges.Horizontal surface velocity profiles refer to different times
and their distribution identifies two different flow regimes even within the same surge: a Bingham-like behaviour, described by the equation: τ = k + ηb (dw⁄dy) (1)in which τ is shear stress, k is shear strength, ηb is the coefficient of viscosity, and dw/dy is the rate of shearing (JoHnson & Rodine, 1984).
The Bingham-like velocity distribution is best fitted by an exponential curve of the form y=a (1-e-bx) with correlation coefficients between 0.956 and 0.996 depths (Figs. 4a and 4f); and a Newtonian-like behaviour, best fitted by a quadratic curve of the form y=-ax2+bx , with correlation coefficients ranging from 0.846 and 0.993 (Figs. 4c and 4e). In other cases, the surface velocity distribution displayed an intermediate behaviour between a Bingham and a Newton fluid (Figs. 4b and 4d). In the latter cases, the best fitting curve is of the exponential type y=a (1-e-bx), with correlation coefficients between 0.976 and 0.992.
Figures 5 (a) and (b) show the debris flow hydrograph with the positions where the distributions of surface velocities have been measured, with indication of the apparent flow regime. Within the time interval between 400 s and 900 s, there was not any significant debris flow surge. In the figures, it is possible to observe that the three distinct flow regimes occur within well defined ranges of flow depths. Bingham flow is associated to flow depth higher than 0.46 m, the Intermediate flow regime falls in the range of flow
depths between 0.46 m and 0.26 m, and below the flow depth of 0.26 m, the mixture behaviour is of Newtonian type.
Theoretical shear strenght, viscosity and flow rateMeasuring the velocity distribution across the surface of
the debris flow, assuming the Bingham rheological model, we investigated the variability of the main motion controlling parameters: shear strength, Bingham viscosity mB and apparent Newtonian viscosity mN. Since the lower channel stretch is straight and its slope is almost constant (≈ 6°) as well as the roughness of the channel bed, at least as a first approximation, the flow velocity in the surge front is mainly controlled by the sediment concentration. This way to infer the rheological parameters of a debris flow is not of general use in the field, as pointed out by JoHnson & Rodine (1984) because it requires a favorable combination of circumstances. Actually, only a few analyses of this kind are reported in literature, e.g. (JoHnson, 1970). Values of apparent shear strength k have been computed on the basis of the Bingham rheological law using for width and velocity of the plug the expressions developed by JoHnson (1970) and JoHnson & Rodine (1984) and, based on ultrasonic data and video measurements during the flow, assuming the channel rectangular in which the width is about twice the depth: k = (Wp ⁄ 4) γd sin δ (2)where Wp is the plug width (m); γd is the unit weight of the slurry (N/m3) and δ is the slope of the flow surface (deg).
The velocity distribution across the surface of the flow is: v = (k⁄μB){[(W2 - 4x2) / 4Wp] - W⁄2 + x} x≥Wp/2 (3)
Fig. 5 - Position of the points on the debris flow hydrograph where the velocity distributions have been measured. Symbols indicate the different flow regimes; the dashed line identifies the existence field of Bingham/Intermediate/Newton flow regimes
P.R. TECCA, R. GENEVOIS & A.M. DEGANUTTI
62 Italian Journal of Engineering Geology and Environment, 2 (2017) © Sapienza Università Editrice www.ijege.uniroma1.it
where W is the width of flow (m), Wp is the plug width (m) and x is the distance from the centre of the channel. The velocity v is maximal at the centre of the plug, where x = ±Wp ⁄ 2.
Solving for the Bingham viscosity coefficient: μB= kWp / 4vc)∙[(W/Wp)-1]2 (4)where W is the width of flow (m), Wp is the plug width (m) and vc is the maximum velocity, i.e. the velocity of the plug (m/s), calculated in the centre of the channel.
Ignoring the strength of the mixture and setting x=0 in equation (2), the apparent Newtonian viscosity μN (Pa•s) has been
calculated by the equation (JoHnson & Rodine, 1984): μN = (γd sin δ)/(4 νc) (W⁄2)2 (5)where variables are as defined in equations (2), (3) and (4).
Equations (2), (4) and (5) were used to estimate yield strength, Bingham viscosity and effective Newtonian viscosity, for a slurry with density of 2000 kg/m3, a common value for debris flows by PieRson (1986). A reliable value of the plug width, taken into account in all used formulas, has been identified at a distance from the left bank, where the flow surface velocity is the 98.5% of the maximum velocity vc recorded in the centre of the
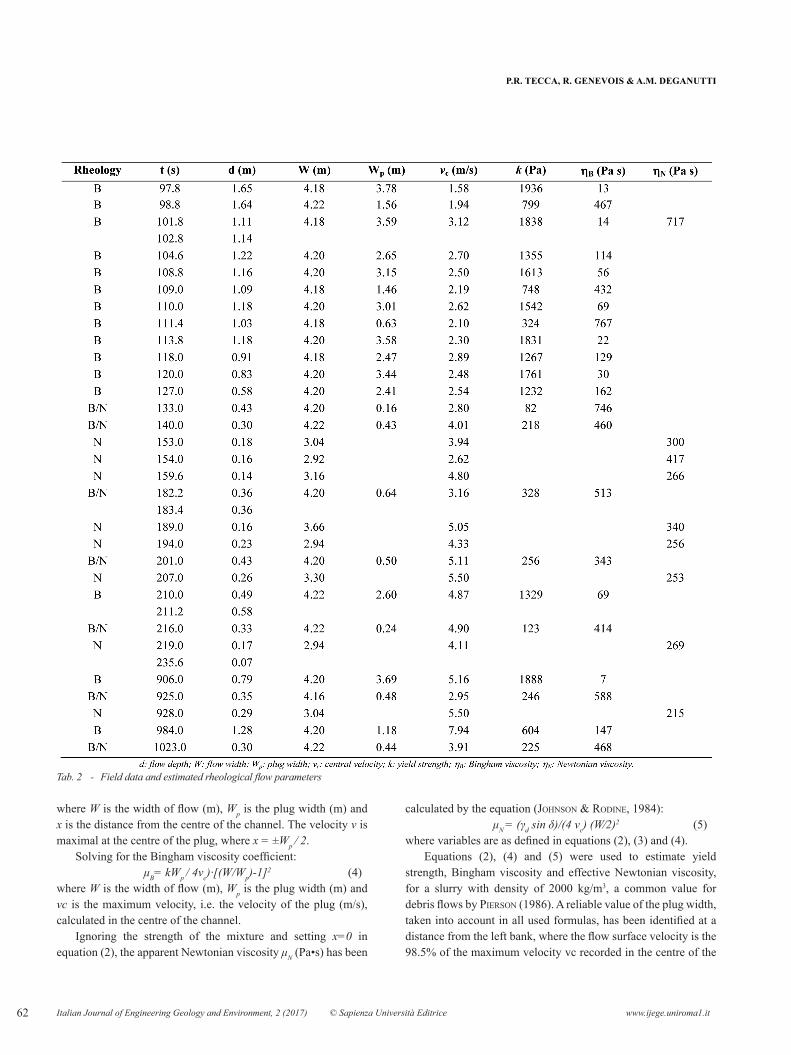
Tab. 2 - Field data and estimated rheological flow parameters
SURFACE VELOCITY DISTRIBUTION AND RHEOLOGICAL PROPERTIES ESTIMATION OF DEBRIS FLOWS
63Italian Journal of Engineering Geology and Environment, 2 (2017) © Sapienza Università Editrice www.ijege.uniroma1.it
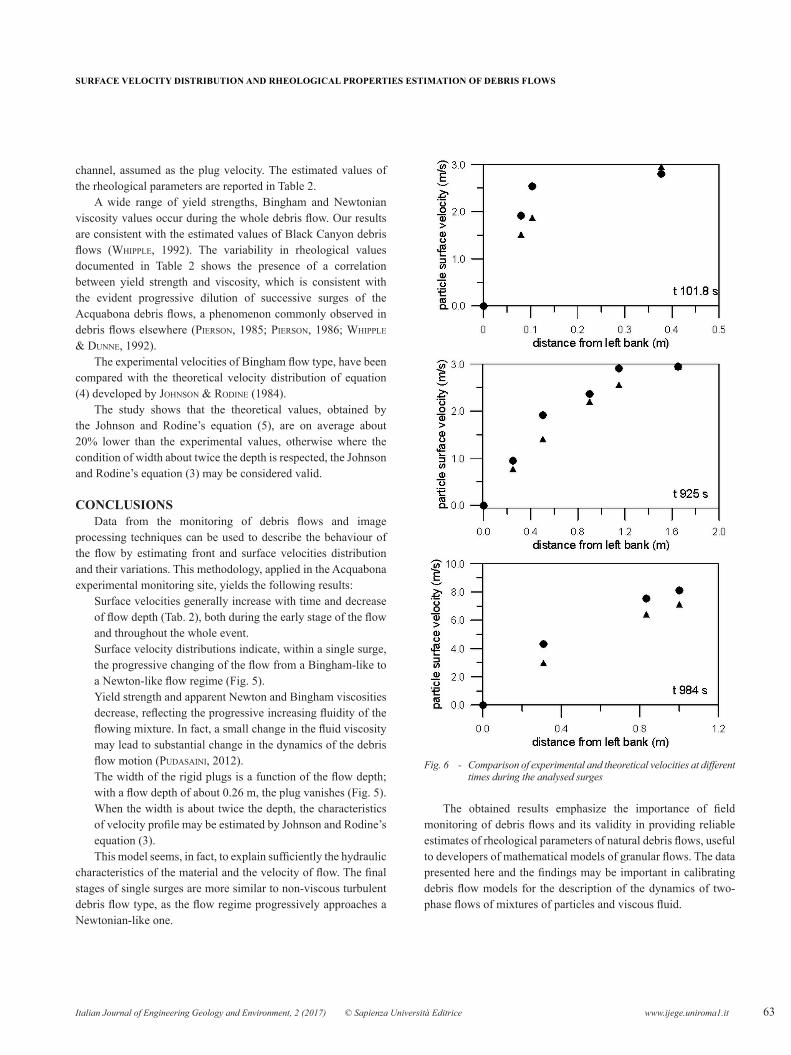
channel, assumed as the plug velocity. The estimated values of the rheological parameters are reported in Table 2.
A wide range of yield strengths, Bingham and Newtonian viscosity values occur during the whole debris flow. Our results are consistent with the estimated values of Black Canyon debris flows (WHiPPle, 1992). The variability in rheological values documented in Table 2 shows the presence of a correlation between yield strength and viscosity, which is consistent with the evident progressive dilution of successive surges of the Acquabona debris flows, a phenomenon commonly observed in debris flows elsewhere (PieRson, 1985; PieRson, 1986; WHiPPle & dUnne, 1992).
The experimental velocities of Bingham flow type, have been compared with the theoretical velocity distribution of equation (4) developed by JoHnson & Rodine (1984).
The study shows that the theoretical values, obtained by the Johnson and Rodine’s equation (5), are on average about 20% lower than the experimental values, otherwise where the condition of width about twice the depth is respected, the Johnson and Rodine’s equation (3) may be considered valid.
CONCLUSIONSData from the monitoring of debris flows and image
processing techniques can be used to describe the behaviour of the flow by estimating front and surface velocities distribution and their variations. This methodology, applied in the Acquabona experimental monitoring site, yields the following results: Surface velocities generally increase with time and decrease
of flow depth (Tab. 2), both during the early stage of the flow and throughout the whole event.
Surface velocity distributions indicate, within a single surge, the progressive changing of the flow from a Bingham-like to a Newton-like flow regime (Fig. 5).
Yield strength and apparent Newton and Bingham viscosities decrease, reflecting the progressive increasing fluidity of the flowing mixture. In fact, a small change in the fluid viscosity may lead to substantial change in the dynamics of the debris flow motion (PUdasaini, 2012).
The width of the rigid plugs is a function of the flow depth; with a flow depth of about 0.26 m, the plug vanishes (Fig. 5).
When the width is about twice the depth, the characteristics of velocity profile may be estimated by Johnson and Rodine’s equation (3). This model seems, in fact, to explain sufficiently the hydraulic
characteristics of the material and the velocity of flow. The final stages of single surges are more similar to non-viscous turbulent debris flow type, as the flow regime progressively approaches a Newtonian-like one.
The obtained results emphasize the importance of field monitoring of debris flows and its validity in providing reliable estimates of rheological parameters of natural debris flows, useful to developers of mathematical models of granular flows. The data presented here and the findings may be important in calibrating debris flow models for the description of the dynamics of two-phase flows of mixtures of particles and viscous fluid.
Fig. 6 - Comparison of experimental and theoretical velocities at different times during the analysed surges
P.R. TECCA, R. GENEVOIS & A.M. DEGANUTTI
64 Italian Journal of Engineering Geology and Environment, 2 (2017) © Sapienza Università Editrice www.ijege.uniroma1.it
REFERENCESaRaTTano M., deGanUTTi a.M. & MaRCHi l. (1997) - Debris flow monitoring activities in and instrumented watershed of the Italian Alps. In CHen C.L.
(ed.). Proceedings of the 1st International Conference on Debris-Flow Hazards Mitigation: Mechanics, Prediction, and Assessment. San Francisco, 7-9 August 1997. American Society of Civil Engineers, New York, 506-515.
aRManini a., CaPaRT H., FRaCCaRollo l. & laRCHeR M. (2005) - Rheological stratification in experimental free-surface flows of granular-liquid mixtures. Journal of Fluid Mechanics, 532: 269-319. http://dx.doi.org/10.1017/S0022112005004283.
CosTa J.E. (1984) - Physical geomorphology of debris flows. In CosTa J.e. & FleisHeR P.J. (eds.). Developments and applications of Geomorphology. Springer, Berlin, 268-317.
CUi P., CHen X.Q., WanG Y.Y., HU k.H. & li Y. (2005) - Jiangjia Ravine debris flows in south-western China. In JakoB M. & HUnGR o. (eds.). Debris-flow hazards and related phenomena. Praxis Springer, Berlin Heidelberg, 565-594.
de Haas T. & Van WoeRkoM T. (2016) - Bed scour by debris flows: experimental investigation of effects of debris-flow composition. Earth Surface Processes and Landforms, 41: 1951-1966. http://dx.doi.org/10.1002/esp.3963.
GeneVois R., TeCCa P.R. BeRTi M. & siMoni a. (2000) - Debris flows in the Dolomites: experimental data from a monitoring system. In WieCZoRek G.F. & naeseR N.D. Proceedings of the 2nd International Conference on Debris-Flow Hazards Mitigation: Mechanics, Prediction, and Assessment. Taipei, 16-18 August 2000. Balkema, Rotterdam, 283-291.
HaMilTon d. & ZHanG s. (1997) - Velocity profile assessment for debris flow hazard. In CHen C.L. (ed.). Proceedings of the 1st International Conference on Debris-Flow Hazards Mitigation: Mechanics, Prediction, and Assessment. San Francisco, 7-9 August 1997. American Society of Civil Engineers, New York, 474-483.
HU k., Wei F. & li Y. (2011) - Real-time measurement and preliminary analysis of debris-flow impact force at Jiangjia Ravine, China. Earth Surface Processes and Landforms, 36: 1268-1278. http://dx.doi.org/10.1002/esp.2155.
InaBa H., iTakURa Y. & kasaHaRa M. (2000) - Surface velocity computation of debris-flows by vector field measurements. Physics and Chemistry of the Earth (B), 25: 741-744. http://dx.doi.org/10.1016/S1464-1909(00)00095-2.
iVeRson R.M. (2003) - The debris-flow rheology myth. In RiCkenMann d. & CHen C.l. (eds.). Proceedings of the 3rd International Conference on Debris-Flow Hazards Mitigation: Mechanics, Prediction, and Assessment, Davos, Switzerland, 10-12 September 2003. Millipress, Rotterdam: 303-314.
JoHnson A.M. (1970) - Rheological properties of debris, ice and lava. In Physical Processes in Geology. Freeman, Cooper & Company, San Francisco, 494-534.
JoHnson A.M. & Rodine J.R. (1984) - Debris flow. In BRUnsden d. & PRioR D.B. (eds.). Slope instability. Wiley, Chichester: 257-361.JoHnson A.M. (1996) - A model for grain flow and debris flow. USGS Open-File Report 96-728, US Geological Survey, Denver, Co.o’BRien J.s. & JUlien P.Y. (1988) - Laboratory analysis of mudflow properties. Journal of Hydraulic Engineering, 114 (8): 877-887. http://dx.doi.org/10.1061/
(ASCE)0733-9429(1988)114:8(877).PieRson T.C. (1985) - Effects of slurry composition on debris flow dynamics, Rudd Canyon, Utah. In BoWles d.s. (ed.). Delineation of landslide, flash flood,
and debris-flow hazard in Utah. General series UWRL/G-85/03, Utah Water Research Laboratory, Utah State University, Logan, 132-152.PieRson T.C. (1986) - Flow behaviour of channelized debris flows, Mount St. Helens, Washington. In aBRaHaMs A.D. (ed.). Hillslope processes. Allen &
Unwin, Boston, 269-296.PUdasaini S.P. (2012) - A general two-phase debris flow model. Journal of Geophysical Research, 117 (F03010): 28. http://dx.doi.org/10.1029/2011JF002186.PUdasaini S.P. & FisCHeR J.T. (2016) - A mechanical erosion model for phase-separation in debris flow. https://arxiv.org/abs/1610.03649 (accessed
03.11.2016).sanViTale n., BoWMan e.T. & GeneVois R. (2011) - Experimental measurements of velocity through granular-liquid flows. In GeneVois R., HaMilTon d.L.
& PResTininZi A. (eds.). Proceedings of the 5th International Conference on Debris-Flow Hazards Mitigation: Mechanics, Prediction, and Assessment, Padova, Italy, 14-17 June, 2011. Università La Sapienza, Roma, 375-384. http://dx.doi.org/10.4408/IJEGE.2011-03.B-043.
sUWa H., okUnisHi k. & sakai M. (1993) - Motion, debris size and scale of debris flows in a valley on Mount Yakedake, Japan. In HadleY R.F. & MiZUYaMa T. (eds.). Proceedings of the International Symposium on Sediment Problems: Strategies for Monitoring, Prediction and Control. Yokohama, 19-21 July 1993. International Association of Hydrological Sciences, Wallingford, UK, 217, 239-248.
TakesHi T. (2011) - Evolution of debris-flow monitoring methods on Sakurajima. International Journal of Erosion Control Engineering, 4 (1): 21-31. http://dx.doi.org/10.13101/ijece.4.21.
sCoTTon P. & deGanUTTi A.M. (1997) - Phreatic line and dynamic impact in laboratory debris flow experiments. In CHen C.l. (ed.). Proceedings of the 1st International Conference on debris-flow hazards mitigation: mechanics, prediction and assessment, San Francisco, 7-9 August 1997. American Society of Civil Engineers, New York, 777-786.
TeCCa P.R., GalGaRo A., GeneVois R. & deGanUTTi A.M. (2003) - Development of a remotely controlled debris flow monitoring system in the Dolomites (Acquabona, Italy). Hydrological Processes, 17 (9): 1771-1784. http://dx.doi.org/10.1002/hyp.1212.

SURFACE VELOCITY DISTRIBUTION AND RHEOLOGICAL PROPERTIES ESTIMATION OF DEBRIS FLOWS
65Italian Journal of Engineering Geology and Environment, 2 (2017) © Sapienza Università Editrice www.ijege.uniroma1.it
VLC media player 2.2.0. Available from http://www.videolan.org/vlc/. (accessed 15.07.2015).WHiPPle K.X. (1992) - Predicting debris flow runout and deposition on fans: the importance of the flow hydrograph. In WallinG d., daVies T.R.H. &
HasHolT B.. (eds.). Proceedings of the International Symposium on Erosion, Debris-Flows and Environment in Mountain Regions. Chengdu, 5-9 July 1992. International Association of Hydrological Sciences, Wallingford, UK, 209, 33-345.
WHiPPle K.X. & dUnne T. (1992) - The influence of debris-flow rheology on fan morphology, Owens Valley, California. Geological Society of American Bulletin, 104 (7): 887-900.
http://dx.doi.org/10.1130/0016-7606(1992)104<0887:TIODFR>2.3.CO;2ZHanG R. & Ren X. (1982) - Discussion on law of resistance of hyperconcentration flow in open channel. Scientia Sinica, 25 (A): 1332-1342.ZHanG S. & CHen J. (2003) - Measurement of debris-flow surface characteristics through close-range photogrammetry. In RiCkenMann D. & CHen C.L.
(eds.). Proceedings of the 3rd International Conference on Debris-Flow Hazards Mitigation: Mechanics, Prediction, and Assessment. Davos, Switzerland, 10-12 September 2003. Millipress, Rotterdam, 775-784.
Received July 2017 - Accepted November 2017


![Reologia de Alimentos Procesados[1]](https://img.pdfslide.us/doc/110x75/55cf9d15550346d033ac2c4a/reologia-de-alimentos-procesados1.jpg)