Embed Size (px)
Citation preview
Surface steam sterilization : steam penetration in narrowchannelsCitation for published version (APA):Doornmalen, van, J. P. C. M. (2013). Surface steam sterilization : steam penetration in narrow channels.Eindhoven: Technische Universiteit Eindhoven. https://doi.org/10.6100/IR758412
DOI:10.6100/IR758412
Document status and date:Published: 01/01/2013
Document Version:Publisher’s PDF, also known as Version of Record (includes final page, issue and volume numbers)
Please check the document version of this publication:
• A submitted manuscript is the version of the article upon submission and before peer-review. There can beimportant differences between the submitted version and the official published version of record. Peopleinterested in the research are advised to contact the author for the final version of the publication, or visit theDOI to the publisher's website.• The final author version and the galley proof are versions of the publication after peer review.• The final published version features the final layout of the paper including the volume, issue and pagenumbers.Link to publication
General rightsCopyright and moral rights for the publications made accessible in the public portal are retained by the authors and/or other copyright ownersand it is a condition of accessing publications that users recognise and abide by the legal requirements associated with these rights.
• Users may download and print one copy of any publication from the public portal for the purpose of private study or research. • You may not further distribute the material or use it for any profit-making activity or commercial gain • You may freely distribute the URL identifying the publication in the public portal.
If the publication is distributed under the terms of Article 25fa of the Dutch Copyright Act, indicated by the “Taverne” license above, pleasefollow below link for the End User Agreement:www.tue.nl/taverne
Take down policyIf you believe that this document breaches copyright please contact us at:[email protected] details and we will investigate your claim.
Download date: 25. Apr. 2020
Surface steam sterilization:
Steam penetration
in narrow channels
PROEFSCHRIFT
ter verkrijging van de graad van doctor aan deTechnische Universiteit Eindhoven, op gezag vande rector magnificus prof.dr.ir. C.J. van Duijn,voor een commissie aangewezen door het Collegevoor Promoties in het openbaar te verdedigen op
maandag 7 oktober 2013 om 16:00 uur
door
Josephus Paulus Clemens Maria van Doornmalen - Gomez Hoyos
geboren te Breda
Dit proefschrift is goedgekeurd door de promotoren en de samenstelling van depromotiecommissie is als volgt:
voorzitter: prof.dr.ir. G.M.W. Kroesen1e promotor: prof.dr.ir. K. Kopingacopromotor(en): dr.ir. J. van Dijkleden: prof.dr.med. A. Kramer (Ernst-Moritz-Arndt-Universitat, Greifswald)
prof.dr. A. Voss (RUN)prof.dr.ir. F.N. van de Vosseprof.dr.ir. A. Hirschberg (UT)
adviseur(s): dr.ir. C.M.M. Luijten (ASML)
CIP-DATA LIBRARY EINDHOVEN UNIVERSITY OF TECHNOLOGY
van Doornmalen - Gomez Hoyos, Josephus Paulus Clemens Maria
Surface steam sterilization: steam penetration in narrow channelsJosephus Paulus Clemens Maria van Doornmalen - Gomez Hoyos.- Eindhoven: Eindhoven University of Technology, 2013. -Proefschrift.
A catalogue record is available from the Eindhoven University of Technology LibraryISBN: 978-90-386-3442-5NUR 924
Trefwoorden: stoomsterilisatie / stoompenetratie / warmteoverdracht /niet condenseerbare gassen /condensatie / numerieke modellenSubject headings: steam sterilization / steam penetration /heat transfer /non-condensible gases/condensation / numerical models
Cover design: Patricia van Doornmalen - Gomez Hoyos en Paul VerspagetPrinted by: Printservice, Technische Universiteit Eindhoven
Part of the work described in this thesis has been carried out in the group
Transport in Permeable Media at the Eindhoven University of Technology,
Department of Applied Physics.

Aan mijn ouders

Contents
1 Introduction 1
1.1 Background . . . . . . . . . . . . . . . . . . . . . . . . . . . . . . . . . . . 1
1.2 Current status of surface steam sterilization . . . . . . . . . . . . . . . . . 3
1.3 Outline of this thesis . . . . . . . . . . . . . . . . . . . . . . . . . . . . . . 6
2 Steam sterilization 9
2.1 Surface steam sterilization conditions . . . . . . . . . . . . . . . . . . . . . 11
2.2 Steam quality . . . . . . . . . . . . . . . . . . . . . . . . . . . . . . . . . . 12
2.3 Steam sterilizer . . . . . . . . . . . . . . . . . . . . . . . . . . . . . . . . . 14
2.4 Surface steam sterilization process . . . . . . . . . . . . . . . . . . . . . . . 16
2.5 Standards . . . . . . . . . . . . . . . . . . . . . . . . . . . . . . . . . . . . 18
3 A validation survey 23
3.1 Introduction . . . . . . . . . . . . . . . . . . . . . . . . . . . . . . . . . . . 23
3.2 Materials and methods . . . . . . . . . . . . . . . . . . . . . . . . . . . . . 24
3.2.1 Steam Sterilizers . . . . . . . . . . . . . . . . . . . . . . . . . . . . 24
3.2.2 Validation program . . . . . . . . . . . . . . . . . . . . . . . . . . . 24
3.2.3 Measurements of the production processes of the steam sterilizers . 25
3.2.4 Measurements of the daily routine control tests . . . . . . . . . . . 25
3.2.5 Evaluation of the data . . . . . . . . . . . . . . . . . . . . . . . . . 25
3.2.6 Statistics . . . . . . . . . . . . . . . . . . . . . . . . . . . . . . . . . 25
3.3 Results . . . . . . . . . . . . . . . . . . . . . . . . . . . . . . . . . . . . . . 26
3.4 Discussion . . . . . . . . . . . . . . . . . . . . . . . . . . . . . . . . . . . . 26
4 Review of surface steam sterilization for validation purposes 31
4.1 Introduction . . . . . . . . . . . . . . . . . . . . . . . . . . . . . . . . . . . 31
4.2 Sterilizing conditions . . . . . . . . . . . . . . . . . . . . . . . . . . . . . . 32
4.3 Validation of steam sterilization processes . . . . . . . . . . . . . . . . . . 35
4.3.1 Number of positions to be measured . . . . . . . . . . . . . . . . . 36
4.3.2 Temperature requirements . . . . . . . . . . . . . . . . . . . . . . . 36
4.3.3 Entrapped air . . . . . . . . . . . . . . . . . . . . . . . . . . . . . . 36
4.3.4 Sampling rate . . . . . . . . . . . . . . . . . . . . . . . . . . . . . . 37
4.4 Criteria in standards . . . . . . . . . . . . . . . . . . . . . . . . . . . . . . 38
4.5 Discussion . . . . . . . . . . . . . . . . . . . . . . . . . . . . . . . . . . . . 40
vi CONTENTS
5 F -, D- and z -values 41
5.1 Introduction . . . . . . . . . . . . . . . . . . . . . . . . . . . . . . . . . . . 41
5.2 Theory . . . . . . . . . . . . . . . . . . . . . . . . . . . . . . . . . . . . . . 42
5.3 Results . . . . . . . . . . . . . . . . . . . . . . . . . . . . . . . . . . . . . . 46
5.4 Discussion . . . . . . . . . . . . . . . . . . . . . . . . . . . . . . . . . . . . 50
6 Steam penetration into narrow channels 53
6.1 Introduction . . . . . . . . . . . . . . . . . . . . . . . . . . . . . . . . . . . 53
6.2 Physical model . . . . . . . . . . . . . . . . . . . . . . . . . . . . . . . . . 55
6.3 Experimental . . . . . . . . . . . . . . . . . . . . . . . . . . . . . . . . . . 59
6.4 Results . . . . . . . . . . . . . . . . . . . . . . . . . . . . . . . . . . . . . . 60
6.5 Discussion . . . . . . . . . . . . . . . . . . . . . . . . . . . . . . . . . . . . 63
7 Measuring NCGs during steam sterilization 67
7.1 Introduction . . . . . . . . . . . . . . . . . . . . . . . . . . . . . . . . . . . 67
7.2 Principle of the ETS . . . . . . . . . . . . . . . . . . . . . . . . . . . . . . 70
7.3 Physical model . . . . . . . . . . . . . . . . . . . . . . . . . . . . . . . . . 71
7.4 Experimental . . . . . . . . . . . . . . . . . . . . . . . . . . . . . . . . . . 75
7.5 Results . . . . . . . . . . . . . . . . . . . . . . . . . . . . . . . . . . . . . . 77
7.6 Discussion . . . . . . . . . . . . . . . . . . . . . . . . . . . . . . . . . . . . 78
8 FVM modeling of steam penetration 83
8.1 Introduction . . . . . . . . . . . . . . . . . . . . . . . . . . . . . . . . . . . 83
8.2 Governing equations . . . . . . . . . . . . . . . . . . . . . . . . . . . . . . 84
8.2.1 Definitions . . . . . . . . . . . . . . . . . . . . . . . . . . . . . . . . 84
8.2.2 Conservation of mass . . . . . . . . . . . . . . . . . . . . . . . . . . 85
8.2.3 Conservation of momentum . . . . . . . . . . . . . . . . . . . . . . 86
8.2.4 Conservation of energy . . . . . . . . . . . . . . . . . . . . . . . . . 86
8.2.5 Boundary and initial conditions . . . . . . . . . . . . . . . . . . . . 87
8.3 Plasimo . . . . . . . . . . . . . . . . . . . . . . . . . . . . . . . . . . . . . 89
8.4 Some preliminary results for steam . . . . . . . . . . . . . . . . . . . . . . 89
8.4.1 Metal plate . . . . . . . . . . . . . . . . . . . . . . . . . . . . . . . 89
8.4.2 Cylindrical bar with an open channel . . . . . . . . . . . . . . . . . 91
8.5 Discussion and outlook . . . . . . . . . . . . . . . . . . . . . . . . . . . . . 93
9 Discussion and outlook 95
Appendices 97
A.1 Impact of studies . . . . . . . . . . . . . . . . . . . . . . . . . . . . . . . . 97
A.2 Steam penetration test . . . . . . . . . . . . . . . . . . . . . . . . . . . . . 97
A.3 Packing of Medical Devices . . . . . . . . . . . . . . . . . . . . . . . . . . . 98
A.4 Central Sterile Supply Department . . . . . . . . . . . . . . . . . . . . . . 99

CONTENTS vii
References 103
Summary 115
Samenvatting 117

viii CONTENTS
Chapter 1
Introduction
1.1 Background
Infection prevention is applied in health care facilities, pharmaceutical, and food indus-tries, to prevent patients, staff, and environment from contamination with microorgan-isms. Sterilization is part of infection prevention in the health care system. Its necessitybecame evident over time [1–5]. Already in the stone age, in Mesopotamia, Egypt, an-cient Latin America and Asia, surgery with instruments was performed [6–9]. However,cleaning, disinfection and sterilization of instruments was not addressed until Antonievan Leeuwenhoek (1632−1723)[10] described viable organisms. Viable organisms can bedefined as organisms that are alive, capable of living, developing, or germinating under fa-vorable conditions. Pasteur (1822−1885)[11], and Koch (1843−1910)[12] recognized that(viable) microorganisms are the carriers of diseases. It was Semmelweis (1818−1865),however, who showed the relation between hand washing and infections of patients [13].Lister (1827−1912) discovered the relation between infection of patients and medicalinstruments. He introduced the concept of aseptic working and the use of sterile instru-ments [14]. Later on, it was discovered that microorganisms are not able to travel bythemselves [15, 16]. They need a carrier, such as a liquid, a person, air borne particles,or instruments to move from one location to another. After the mechanism of transportof micro-organisms was better understood, protection of staff, patients and environmentbecame a more important issue.
Nowadays, social hygiene is widely implemented, e.g., in restaurants and food in-dustries with a Hazard Analysis Critical Control Point (HACCP) [17]. In health careindustries and facilities infection prevention became a key issue, e.g., in dental practices,hospitals and pharmaceutical industries (see appendix A.1). Decontamination has becomean essential part of infection prevention. Three levels of decontamination are recognized:cleaning, disinfection and sterilization. It can be applied on floors, worktables, surgicalinstruments, and medicines in closed containers [18–20]. Cleaning is rinsing and washingof the visible dirt or contamination, e.g., hand washing and rinsing of surgical instru-ments. Items may still be contaminated after washing. Disinfection is deactivating mostof the microorganisms. It can be applied on surfaces such as working tables and endo-scopes that do not penetrate the human natural barriers, e.g., the skin [15]. Disinfectioncan be done with a liquid disinfectant [21] or exposure to an elevated temperature [22].Also after disinfection items may still be contaminated. Generally accepted definitionsfor washing and disinfection are not found in the literature. Viable microorganisms maystill be present after washing and disinfection. The highest level of decontamination issterilization. Sterile is defined as ‘free of all viable organisms’ [18–20], an accepted andrespected definition in health care industry and facilities worldwide [23, 24]. Sterilization
2 Introduction
became an essential step in the process of producing sterile medical devices [15, 25]. Theterm medical device has a broad definition (see inset on page 2). In this thesis, unlessotherwise indicated, a medical device is limited to items that are steam sterilized, suchas surgical instruments.
Definition of a Medical Device
The definition of a medical device as given in the Medical Device Directive(93/42/EEC)[25]:
medical device means any instrument, apparatus, appliance, software, material orother article, whether used alone or in combination, including the software intendedby its manufacturer to be used specifically for diagnostic and/or therapeutic pur-poses and necessary for its proper application, intended by the manufacturer to beused for human beings for the purpose of:
• diagnosis, prevention, monitoring, treatment or alleviation of disease,
• diagnosis, monitoring, treatment, alleviation of or compensation for an injuryor handicap,
• investigation, replacement or modification of the anatomy or of a physiologicalprocess,
• control of conception,
and which does not achieve its principal intended action in or on the human bodyby pharmacological, immunological or metabolic means, but which may be assistedin its function by such means.
In health care facilities steam sterilization is the most frequently applied sterilizationmethod for reusable medical devices. Such devices may vary from textiles used duringsurgery to complex surgical instruments. All surfaces of these medical devices that cancome into contact with the environment have to be sterile. For textiles this means allsurfaces of the individual fibers, and for instruments all inner- and outer-surfaces thatmay come into contact with the environment. Therefore this method of sterilization isreferred to as surface sterilization. In practically every hospital and in many dental andgeneral practitioner offices worldwide steam sterilizers are used for surface sterilizationof medical devices. Steam sterilizers are derived from domestic food cookers, inventedin 1679 by Denis Papin (1647−1712). Chamberlain (1851−1908), working with LouisPasteur, was the first to use elevated pressure for sterilization purposes (1879).
Arrhenius (1859-1927) presented the first models of thermally activated processes inthe 1920s. His Arrhenius law is still in use as a basis for calculations of the killing rateof organisms in food industry, pharmaceutical industry, and health care. Until aboutthe 1980s, various studies on killing mechanisms of organisms and sterilization have beenpublished [26–30]. Especially in the late 1950s and beginning of the 1960s there has beena lot of activity in this field of research in the UK [31–37]. After this period the numberof publications on steam sterilization was decreasing, possibly because steam sterilizationwas sufficiently specified for the items to be sterilized. At that time, the bulk of the items
1.2 Current status of surface steam sterilization 3
to be sterilized in hospitals were textiles, whereas the medical instruments did hardlychange. Nowadays, textiles are being replaced by disposable solutions and, consequently,their use in hospitals reduces.
Since 1990, Minimally Invasive Surgery (MIS) or laparoscopic surgery is developingrapidly. MIS has the advantage that the surgical intervention on the patient is less severethan with open surgery, resulting in a reduction of recovery and healing time and adecrease of the discomfort for a patient [38–40]. An economical side effect is a reductionof costs for patients, hospitals and insurance companies [41–43]. Instruments used forMIS may contain narrow hollow channels, i.e., channels with a radius in the order 1 mmand lengths in the order of 1 m. Establishing surface steam sterilization conditions on theinner surfaces of such channels requires that the air that is initially present in the channelis replaced by steam [31]. This replacement appears to be far from trivial during steamsterilization, as will be demonstrated in the chapters 6, 7 and 8 of this thesis.
Steam sterilization appears to be relatively safe, fast, well accepted by public opinion,and economically interesting compared to alternative sterilization methods (see chapter2). Nevertheless, changes in items to be sterilized and the possibilities created by theapplication of modern techniques are not always satisfactorily addressed or researched[44–47]. In this respect we mention the necessary physical conditions and parametermeasurements and steam penetration in narrow channels. In this thesis several of thesepoints will be addressed.
Unnecessarily long sterilization times
Exposure times for steam sterilization are specified [31], e.g. 134 ◦C for 3 minutes.In this temperature-time combination for sterilization with saturated steam, safetymargins are already included. Nevertheless, frequently exposure times longer than 3minutes are applied, up to even 7 minutes or more. Exposure of medical devices tosterilization conditions for such a long time promotes unnecessary wear out of thesedevices and involves excessive use of energy and water. Consequently, unnecessarycosts may be initiated.
1.2 Current status of surface steam sterilization
To achieve minimal acceptable levels of infection prevention in health care facilities andindustry, standards and legislation are developed. This is done on a national, European,and worldwide scale. Although standards are often interpreted as state of the art, theymerely address minimum requirements. Unfortunately, not all standards or legislation forsteam sterilization are scientifically or evidence based [48–50]. Where possible and avail-able, biological, chemical, or physical data are used to develop the standards. However,when insufficient data is available within the standardization committees, one tries toachieve a consensus between the participating members. Such a consensus can be basedon definitions, opinions and discussions. Standards for surface steam sterilization are noexception to this procedure [51–53]. Evidently, this may introduce a false sense of safetyor even unsafe situations for patients, staff and environment. Also it may result in un-necessary costs, for example, extra treatment of infected staff and patients and cleaning
4 Introduction
costs for contaminated environment. On the other hand, it may give rise to deteriorationof medical devices and energy costs resulting from unnecessarily long exposure times ofthese devices to elevated temperatures (see inset pages 3 and 4).
Prions
Diseases such as Creutzfeld Jacob (CJD) and variant Creutzfeldt-Jakob (vCJD) arerelated to prions. In the literature prions are described as wrongly folded proteins[54]. Because prions, like proteins, are not viable organisms, they are not includedin the definition of ‘sterile’ [18–20, 23, 24]. However, like toxic matter, prions on in-struments may harm people and should not be present on medical instruments usedon patients. In the literature we have not found conclusive evidence that prions aremade harmless in a steam sterilization process.Regardless the above, in several health care facilities steam sterilization processese.g., 121 ◦C for 30 minutes or 134 ◦C for 18 minutes [55], are applied on medicaldevices which are possibly contaminated with prions. This may introduce a falsesense of safety. A better solution might be to remove prions from medical instru-ments before sterilization, like done with toxic matter. Another option might be toadjust the current definition for ‘sterile’ and include not only viable organisms butalso harmful matter.
In the literature and standards minimum requirements for steam sterilization are spec-ified for surface steam sterilization [31, 51]. These time-temperature combinations arespecified as minimum requirements under the assumption that saturated steam is presenton all surfaces to be sterilized. In these time-temperature combinations the temperatureis assumed to be constant. Often aqueous medicines disintegrate at elevated tempera-tures and the specified time-temperature [56–58]. In these cases the so-called F -valuetheory may be used to limit the exposure time to elevated temperatures but also tooptimize the sterilization process. This theory comprises a mathematical model to cal-culate the equivalent of the time-temperature combination of an accepted sterilizationprocess [18, 59]. Basically this calculation is an integration of the killing of organismsover time. The F -value is calculated from the moment that sterilization conditions arepresent, e.g., at temperatures of 105 ◦C and higher. For example, an accepted and stan-dard time-temperature combination for aqueous medicines in closed ampules is 120 ◦C for20 minutes. In this case the reference value is F 120 ◦C
20min and is called the F0-value. Withthe mathematical model the ‘F -value’ of an actual process is calculated from behaviorof the temperature as function of the time. The calculated F -value should be equal orlarger than the F 120 ◦C
20min -value (20 minutes). Currently a similar method is used to calcu-late the disinfection period in washer-disinfectors in hospitals [22, 60, 61] and is called theA0-concept or A-value method. Unfortunately, it is not documented in the literature onwhich temperature domain the F -, and A-values can be applied, because in these meth-ods the killing rate of organisms is linearized around a certain reference temperature. Inchapter 5 the F -value theory is discussed in more detail. It is shown that the currentlyused methods can be extended in a straightforward way to the entire temperature regionof interest.
Although it is difficult to prove that insufficient sterilization may cause infection, con-taminations of patients by instruments have been reported in the literature [1–5, 15, 62–
1.2 Current status of surface steam sterilization 5
68]. Also it has to be noted that the incubation time before symptoms of a contaminationshow up makes it difficult to identify the contamination source. This may lead to unneces-sary discomfort and costs (see inset page 5). If a contamination occurs, patients generallyconsult a General Practitioner (GP) for treatment without knowing or identifying thesource where they were contaminated. This illustrates also that the relation betweensterilization and infection prevention is often difficult to quantify. Possibly, not all in-cidents are published because their cause was not identified, or they are undocumentedbecause of privacy and legislation, or for less ethical reasons. Fortunately, a tendencyis noticed that health care facilities are implementing patient surveillance systems andsystems to monitor (track and trace) medical devices. In the patient file the medicaldevices used on the patients are registered, making it easier to recognize relations be-tween infections of patients, used medical devices and sterilized batches of these devices.An additional economical advantage for the health care facility is that these monitoringsystems can be used to manage, control and schedule preventive maintenance of medicaldevices and the equipment used for decontamination.
Choice of an effective steam sterilization process
A steam sterilization process suitable for non wrapped, solid instruments, is calleda type N process [52]. A sterilizer equipped with N processes costs about AC 2,000.–.A steam sterilization process to sterilize wrapped porous loads is called a type Bprocess [52]. Steam sterilizers equipped with these processes cost about AC 4,000.–,roughly AC 2,000.– more. In dentist treatments hollow instruments are often used,e.g., hollow drills for implantology and re-usable multi-function syringe tips [69].According to standards a type B processes should be used for this type of devices.If a type N process would be used to sterilize these hollow devices a patient may becontaminated during a dentist treatment. Not taking the discomfort for the patientinto account, the costs for treatment are at least AC 30.–; AC 20.– for the consulta-tion of a dentist or general practitioner, and AC 10.– for the medicines. This hollowinstrument may remain contaminated and form a source of contamination and riskfor patients. Again not taking the discomfort into account, after 70 contaminationswith this device or other devices a sterilizer with a type B process would be prof-itable. One should note that oral herpes is a relatively harmless infection comparedto for example a hepatitis infection. Obviously, the return of investment for moresevere infections will be much faster and the discomfort for the patients will besubstantially reduced. Because the contaminated patients usually go to a generalpractitioner for treatment and not to the actual place of the contamination, a pa-tient surveillance system could make this issue better visible for patients, dentistsand insurance companies.
If surface steam sterilization is applied, it should be done in an effective and re-producible way. In this thesis, effective means that all surfaces are exposed to steamsterilization conditions for a predetermined time. With reproducible is meant that eachtime a sterilization cycle is executed, the conditions on all surfaces are similar to the runsbefore. When steam faces barriers, establishing steam sterilization conditions on surfacesbecomes more difficult. Barriers can be porous loads, the wrapping of instruments to besterilized, or instruments with cavities, such as devices with narrow channels. For these
6 Introduction
items replacement of air by steam may require additional attention [52].
It is remarkable that criteria for steam sterilization differ depending on the geograph-ical position, whereas the aim is the same. As an example we mention the performancerequirements of the steam penetration test [32] (appendix A.2). The requirements for sucha test in Europe [70] and the USA [71] differ essentially, whereas the objective, productionof sterile medical devices, is the same. It is also remarkable that criteria [51, 52] for largeand small steam sterilizers differ, although in both types of sterilizers similar items maybe sterilized [49]. It is likely that microorganisms behave similar all over the world, andtherefore procedures, processes and standards for sterilization should be similar worldwideas well.
Summarizing, with a better understanding of surface steam sterilization, suboptimalprocesses can be optimized, resulting in an improvement of steam sterilization processes,global differences in criteria can be reduced, and a false sense of safety can be avoided.More important, effective sterilization introduces less infections of patients, staff andenvironment, and decreases costs.
1.3 Outline of this thesis
This thesis aims to contribute to the fundamental understanding of surface steam ster-ilization, steam sterilization processes and penetration of steam in medical instrumentswith narrow channels during such processes.
In chapter 2 the basic concepts of surface steam sterilization, steam sterilizers andsterilization processes are reviewed. This chapter also briefly addresses the current stan-dards for steam sterilization. It is followed by chapter 3, a survey on the validation statusof 197 steam sterilizers in Dutch hospitals, in 2001 and 2002. The results of this surveyshowed that only 40% of the hospitals in this survey did fulfill the claims they made withrespect to their steam sterilization. All these claims were made based on standards. Thisinitiated the study reported in chapter 4, in which we investigated to which extent thesesteam sterilization standards cover steam sterilization conditions as specified in the liter-ature. The study shows that monitoring and validation of steam sterilization processesbased on temperature and pressure measurements1 is only valid in specific situations. Inthe literature an alternative method for monitoring, the F -value theory, is described. Inchapter 5 the limitations of the original F -value theory are discussed and an improvedmodel is proposed. This modified model can be applied over a broader temperature range.However, even if the sterilization conditions are satisfied within the sterilizer chamber it-self, this does not necessarily imply that all types of loads can be properly sterilized. Forinstance, with the development of MIS instruments more surgical instruments contain hol-low narrow channels. Steam penetration in these channels appears to be far from trivial.In chapter 6 a model for steam penetration in narrow channels in the absence of conden-sation is discussed, where special attention is given to the effect of non-condensible gases(NCGs). In chapter 7 experiments are presented that were performed to quantify the
1In this method a so-called theoretical temperature is calculated from the measured pressure [72].In the standards [51] criteria are given to which extent the measured temperatures and this theoreticaltemperature should agree.

1.3 Outline of this thesis 7
sensitivity to NCGs of a commercially available instrument to assess steam penetration,together with a theoretical model to explain these experimental results. In this modelcondensation is assumed to be dominant. Both models in chapters 6 and 7 are quasi one-dimensional and quasi isothermal. In chapter 8 a two dimensional and non-isothermaltheoretical model is discussed. In the last chapter 9 the conclusions, discussions, and anoutlook are given.
Chapters 3, 4, 5 and 6 of this thesis are papers that have been publishedor submitted, which are included in their original form. Consequently, someoverlap between parts of these chapters is unavoidable.

8 Introduction
Chapter 2
Steam sterilization
‘Free of all viable organisms’ is worldwide accepted as the definition for sterility of medicaldevices [18–20, 23, 24]. To prove that a medical device is actually sterile it has to be tested.During this testing the item is handled and manipulated and cannot be considered sterileanymore. Consequently testing sterile items before use is pointless and even impossible.Therefore a statistical approach was and is necessary. Favero [73] described how thestatistical definition of sterility originated, how it evolved and how the concept of theSterility Assurance Level (SAL) developed over time and is applied in practice. Currently,the European standard EN 556 [23] defines ‘For a terminally-sterilized medical deviceto be designated “STERILE”, the theoretical probability of there being a viable micro-organism present on/in the device shall be equal to or less than 1×10⁻⁶.’ A largely similarconcept is the SAL, which is defined as ‘the probability of a single viable microorganismoccurring in or on a product after sterilization’ [53]. To meet the sterility requirementthe value of the SAL should be 10−6 or less. It can be stated that worldwide the acceptedstatistical definition is ‘Sterility of medical devices is defined as the chance of finding aviable organism in or on a medical device being 1 in 1,000,000 or less’.
Statistical definition of ‘sterile’
In principle, the statistical definition of ‘sterile’ [23] could be interpreted as that atmost 1 of 1,000,000 sterilized items may contain a viable organism [46]. However, itis obvious that the surface of, for instance, 106 scalpels is much smaller than that of106 orthopedic drills. Therefore this definition contains a ‘sliding’ scale with respectto the actual surface area.Apart from this, there is an ongoing discussion whether the actual sterilizationprocess should always reduce the amount of viable organisms by a factor of 106
[46, 47]. When the definition ‘free of viable organisms’ is accepted and is applicableto the medical devices, all steps to produce a sterile item should be considered. Inhospitals, these steps often include washing, disinfection and sterilization. Each stepleads to a certain reduction of the amount of viable organisms. If before sterilizationan item would already be free of viable organisms, it might be considered sterile.However, it is not wrapped and can get recontaminated during handling, transportand storage (see appendix A.3). Nevertheless, if the initial contamination before theactual sterilization process is known, that process might be adjusted accordingly.Standards for sterilization allow for such an approach [53].
Often sterilization is associated with inactivation of organisms rather than removing[20]. Although viable organisms can be separated from a fluid by filtration, this is oftennot considered as sterilization. Filters can start leaking and filtration does not kill or-ganisms. Exposing organisms to deadly conditions will inactivate or destruct them. A
10 Steam sterilization
possible classification of different sterilization methods can be based on the temperature:low temperature sterilization, i.e., sterilization at temperatures below 100 ◦C, and hightemperature sterilization, at temperatures above 100 ◦C. Examples of low temperaturesterilization are ethylene oxide sterilization, formaldehyde-, hydrogen peroxide-, plasma-,ozone-, and irradiation sterilization. Examples of high temperature sterilization are dryheat and steam sterilization. Another basis for classification of sterilization methods couldbe the mechanism of killing the viable microorganisms, such as oxidation, intoxication,destroying vital cell structures. Oxidizing sterilization methods1 are hydrogen peroxide,ozone, and dry heat sterilization, intoxicating methods2 are ethylene oxide and formalde-hyde, and examples of sterilization methods based on changing vital cell structures3 areirradiation and steam sterilization.
Steam sterilization in dental offices
Dry heat sterilization temperatures are typically above 150 ◦C. At a specified tem-perature, exposure times are specified to produce sterile items, e.g., at 160 ◦C theexposure time is 2 hours (see table 2.2). The complete process cycle of a dry heatsterilization process, with warming up and cooling down, will take over 3 hours.A typical exposure time for items processed in steam sterilization at 134 ◦C is 3minutes. A complete steam sterilization cycle will be ended in about 1 hour. En-ergy costs of dry heat sterilization are higher than those of steam sterilization. Inaddition, MIS and complex instruments, e.g., hand-pieces for dentistry, are oftenmade of different parts, consisting of different materials with different thermal ex-pansion characteristics. Most plastics and polymers used in a medical device willdeform irreversibly at temperature above 140 ◦C. In a medical device different ma-terials may be welded together, or moving within each other, e.g., the turbine todrive the drill in a dentist hand-piece. The higher the temperature, the bigger thedifference in expansion of the various materials, and the faster the wearing out ofthe expensive medical device. Obviously, compared to dry heat sterilization, steamsterilization will safe time, energy, wearing out of instruments, and therefore costsin dental practices.
It is important to realize that sterilization is only possible if the organisms are incontact with the sterilization agent or ‘sterilant’. However, as mentioned above, sterilizeditems should not be touched or handled anymore after sterilization. Consequently, deviceshave to be protectively wrapped before sterilization to prevent re-contamination aftersterilization. Protection can be done by wrapping the devices before sterilization in amicro biological barrier, for instance sheets of crepe, or by packing in a container (seeappendix A.3). Obviously the sterilant must be able to penetrate through the wrapping.
Every sterilization method has its advantages and disadvantages. Nevertheless, allsterilization methods have the ability to kill and are therefore by definition hazardous. Asterilant can be even classified carcinogenic, e.g., formaldehyde [74]. This concerns not
1Sterilization methods in which oxygen out of the environment is used to ‘burn’ the viable organismswhich are present.
2Sterilization methods in which the viable organisms are poisoned.3Sterilization methods which irreversible change the vital cell structures necessary for life, e.g., DNA
strings.
2.1 Surface steam sterilization conditions 11
only the target group but also the operators of a sterilizer and its environment. Depend-ing on the specific situation the most effective and safest sterilization method should bechosen (see inset page 10). In pharmaceutical and food industries, for example, items aresterilized only once before being transported to the end-user. During the transport fromindustry to end-user heavy wrapping is necessary to prevent re-contamination but alsoto protect the devices and their micro biological barriers from damaging. Consequently,sterilization methods in industries have to be able to penetrate the heavy transport wrap-ping in order to come into contact with viable microorganisms. Irradiation and ethyleneoxide have good penetration capabilities and are more often applied in industries than inhealth care facilities.
Industrial sterilization is performed at the end of a production line and no or only lim-ited reprocessing is performed. On the other hand, in health care facilities, e.g., hospitalsand dental practices, sterilization of re-usable medical devices such as surgical instru-ments and hand-pieces is performed frequently. Reprocessing of re-usable medical devicescan be classified as an expertise. To perform the reprocessing and sterilizing of medicaldevices efficiently and by experts, a so called Central Sterile Supply Department (CSSD,appendix A.4) can be found in the larger health care facilities.
In health care facilities worldwide steam sterilization is the most generally appliedsterilization method for various reasons. First, the bulk of reusable medical devices canbe processed in it. Second, compared to other sterilization methods it is the least haz-ardous for staff and environment and is therefore socially accepted. Third, the workingmechanism of steam sterilization is fairly well understood and described in the literature[18–20]. Fourth, alternative methods demand extra safety requirements [75, 76]. These ex-tra requirements can be hardware, such as sensors, and monitoring systems for locationsand staff, written procedures for operating the machine, including safety and calamityprocedures, and even requirements for specialized staff to operate the sterilizer. Finally,steam sterilization has economical advantages compared to other sterilization methods.
The result of a sterilization process depends on the combination of the sterilizer, pro-cess, load, loading pattern (placement of the instruments in the sterilizer) and wrapping.In this chapter the surface steam sterilization conditions (section 2.1) and steam quality(section 2.2) will be addressed, followed by the explanation of the working principle of asteam sterilizer (section 2.3) and steam sterilization processes (section 2.4). Over timestandards for steam sterilization have been developed and published [23, 51, 53, 70, 71, 77–80]. In section 2.5 these will be reviewed briefly.
2.1 Surface steam sterilization conditions
Steam sterilization is generally applied in two ways: sterilization of aqueous liquids inclosed containers and surface steam sterilization. Regardless the method the killing mech-anism is coagulation [28]. Without the proteins organisms are not viable and cannot live.Coagulation requires energy and water [20, 28, 81]. Before coagulation can take place theprotein string has to be broken up into smaller chains. In steam sterilization processesfor aqueous liquids in closed containers the steam is used to heat up the liquid in the con-tainer. By heating up the aqueous liquid hydro-sulphide ions and smaller peptide chains
12 Steam sterilization
may be detached from the proteins [81, 82]. Like water molecules these hydro-sulphideions and peptide chains are bipolar. Therefore, these detached ions and chains can movethrough the water to new other locations within the organism. At these locations newbonds between the molecules are formed, the actual coagulation. These new bonds aredifferent from the original bonds and are generally harder and irreversible. Because thesenewly formed molecules differ from the proteins chains, life and viable life is destroyed[20, 28, 81, 82]. In this thesis coagulation is defined as the irreversible change and hard-ening of the protein chains of a microorganism.
In aqueous environments the water content of cell structures is optimal for sterilization.However, contamination of medical instruments occurs on the surfaces of these devices.Before being exposed to surface steam sterilization, the amount of water in the viableorganisms on these surfaces depends on the type of organism and the environmentalconditions [26, 83]. If only exposed to elevated temperatures with insufficient water in theorganism, ions and peptide chains may not be detached and able to relocate. However, thesteam is not only supplying the energy for increasing the temperature. Steam condenseson colder surfaces and provides a condense layer. This layer establishes the necessary wetenvironment to transport the ions and peptides to other locations to form new irreversiblebonds.
Chaufour et al. [84] showed that items have to be cleaned before surface sterilization.A layer of organic material or dirt can prohibit the creation of sterilization conditions.Apart from this, when biologically incompatible materials such as endotoxines are intro-duced in a patient, the patient may develop an infection. In aqueous steam sterilizationthe amount of incompatible materials is often controlled with aseptic processes. However,on a surface of a medical device the amount of such materials has to be reduced as much asreasonably achievable before sterilization. Cleanliness of surfaces after cleaning processesis not trivial, especially not for the inner surfaces of channels in medical devices [85–87].In such cases sterilization is the final security that no viable organisms are brought intoa patient.
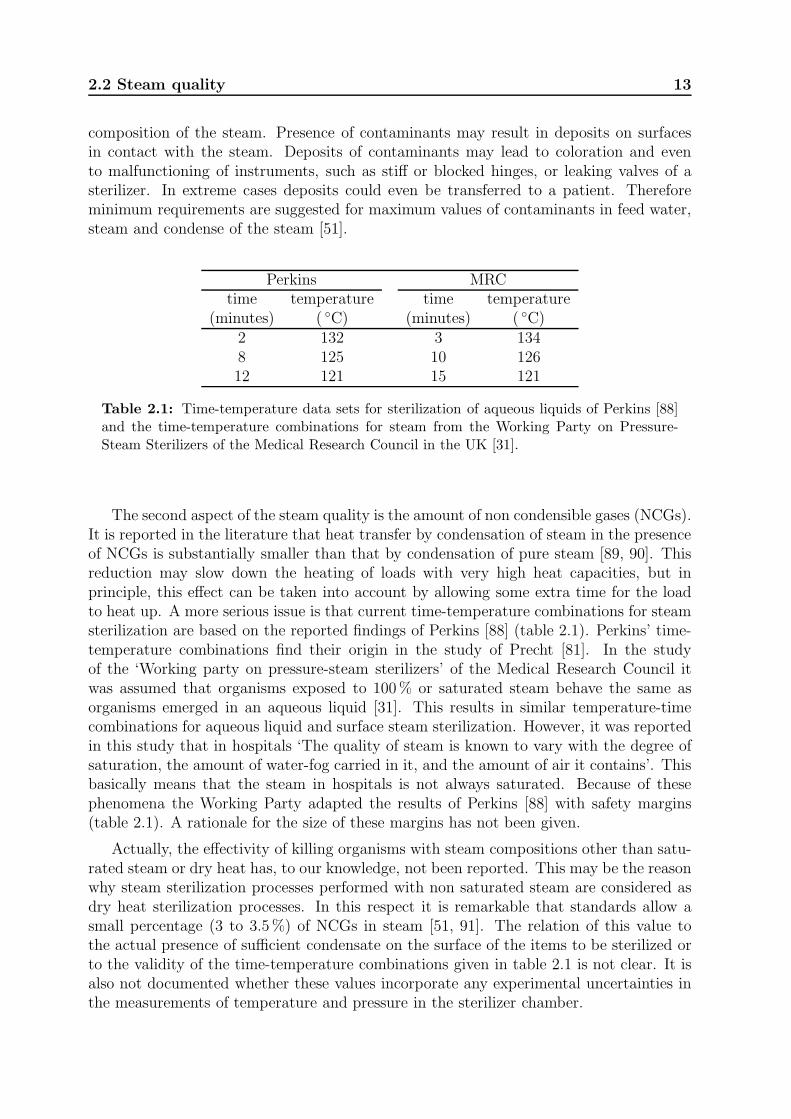
Sterilization can be defined as establishing sterilization conditions and maintainingthese for a predetermined time. Surface steam sterilization conditions are specified assterilization of clean surfaces with saturated steam at a predetermined temperature. Theonly time-temperature combinations for surface steam sterilization with saturated steamfound in the literature are those of the Working Party on Pressure-Steam Sterilizers of theMedical Research Council [31]. In table 2.1 these combinations are presented togetherwith the time-temperature relations determined for sterilization of aqueous liquids byPerkins [88].
2.2 Steam quality
In steam sterilization of aqueous liquids in containers the steam does not come into directcontact with the liquid. As long as the liquid reaches the predetermined temperaturesterilization will occur. For surface steam sterilization the quality of the steam is moreimportant, because the steam will be in contact with the surfaces that have to be steril-ized. In steam sterilization two aspects of steam quality can be distinguished. First the
2.2 Steam quality 13
composition of the steam. Presence of contaminants may result in deposits on surfacesin contact with the steam. Deposits of contaminants may lead to coloration and evento malfunctioning of instruments, such as stiff or blocked hinges, or leaking valves of asterilizer. In extreme cases deposits could even be transferred to a patient. Thereforeminimum requirements are suggested for maximum values of contaminants in feed water,steam and condense of the steam [51].
Perkins MRCtime temperature time temperature
(minutes) ( ◦C) (minutes) ( ◦C)2 132 3 1348 125 10 12612 121 15 121
Table 2.1: Time-temperature data sets for sterilization of aqueous liquids of Perkins [88]and the time-temperature combinations for steam from the Working Party on Pressure-Steam Sterilizers of the Medical Research Council in the UK [31].
The second aspect of the steam quality is the amount of non condensible gases (NCGs).It is reported in the literature that heat transfer by condensation of steam in the presenceof NCGs is substantially smaller than that by condensation of pure steam [89, 90]. Thisreduction may slow down the heating of loads with very high heat capacities, but inprinciple, this effect can be taken into account by allowing some extra time for the loadto heat up. A more serious issue is that current time-temperature combinations for steamsterilization are based on the reported findings of Perkins [88] (table 2.1). Perkins’ time-temperature combinations find their origin in the study of Precht [81]. In the studyof the ‘Working party on pressure-steam sterilizers’ of the Medical Research Council itwas assumed that organisms exposed to 100% or saturated steam behave the same asorganisms emerged in an aqueous liquid [31]. This results in similar temperature-timecombinations for aqueous liquid and surface steam sterilization. However, it was reportedin this study that in hospitals ‘The quality of steam is known to vary with the degree ofsaturation, the amount of water-fog carried in it, and the amount of air it contains’. Thisbasically means that the steam in hospitals is not always saturated. Because of thesephenomena the Working Party adapted the results of Perkins [88] with safety margins(table 2.1). A rationale for the size of these margins has not been given.
Actually, the effectivity of killing organisms with steam compositions other than satu-rated steam or dry heat has, to our knowledge, not been reported. This may be the reasonwhy steam sterilization processes performed with non saturated steam are considered asdry heat sterilization processes. In this respect it is remarkable that standards allow asmall percentage (3 to 3.5%) of NCGs in steam [51, 91]. The relation of this value tothe actual presence of sufficient condensate on the surface of the items to be sterilized orto the validity of the time-temperature combinations given in table 2.1 is not clear. It isalso not documented whether these values incorporate any experimental uncertainties inthe measurements of temperature and pressure in the sterilizer chamber.
14 Steam sterilization
surface steam sterilization dry heattime temperature time temperature
(minutes) ( ◦C) (minutes) ( ◦C)- - 60 170- - 120 160- - 150 150- - 180 1403 134 - -10 126 - -15 121 overnight 121
Table 2.2: Time-temperature data sets for steam [31] and dry heat [19] sterilization.
2.3 Steam sterilizer
Surface steam sterilization is performed in steam sterilizers. These sterilizers come inmany sizes and shapes, but the working principle and the essential parts are similar.Surface steam sterilization can be best (most effective and reproducible) performed in avacuum assisted steam sterilizer, which is schematically shown in figure 2.1. A modernsteam sterilizer has a double wall, called a jacket. In the jacket steam can be submittedwith the purpose to heat up the inner side of the jacket.4 By keeping the jacket at atemperature of about 0.5 to 1 ◦C higher than the chamber temperature, no condensewill be formed on the jacket. By valves in the supply lines the steam inlet into thejacket and sterilizer chamber can be controlled independently. Both steam inlets areconnected to the steam supply. To avoid direct steam impact on the processed load,a baffle plate is mounted in front of the chamber steam inlet. To pump the gases andpossibly water condense out of the sterilizer chamber, a vacuum pump is installed inthe drain line. Between the sterilizer chamber and the vacuum pump a valve is present,which is essential to prevent that potentially contaminated water, vapor or gas can flowback into the sterilizer chamber. When air is submitted it will be filtered with a High-Efficiency Particulate Air (HEPA) filter to avoid re-contamination of loads. At least onedoor is available to load and unload the sterilizer. To avoid that batches of sterilized andunsterilized loads intersect, sterilizers can be equipped with a loading and an unloadingdoor (GMP, appendix A.4). NCGs should not be able to leak into the chamber. Toprevent leaks via the doors gaskets are mounted.
Two pressure sensors are mounted on the sterilizer chamber and two temperaturesensors, often Pt100s, are mounted in the drain of the sterilizer chamber. One pressure andone temperature sensor form a set. One set of senors is used for the control of the sterilizer.The second set is used for independent monitoring and registration of the processes.Modern steam sterilizers are pressure controlled because pressure can be controlled easier,more accurate and faster than temperature. If the gas in the sterilizer chamber is saturatedsteam, a so called theoretical temperature can be calculated from the pressure [72]. This
4Smaller sized steam sterilizers do not always have a jacket. In these cases the independent heatingof the inside of the jacket can be performed with an alternative method, e.g., electrical heating.
2.3 Steam sterilizer 15
vacuum pump
HEPA filter valves
Pt100 housing
baffle plate
drain
gasket
sterilizer chamber
unloading doorloading door
steam inlet to sterilizer chamber
steam inlet to jacket
pressuresensors
Figure 2.1: Schematic representation of a vacuum assisted steam sterilizer.
temperature can be compared with the measurements by the temperature sensor in thecontroller. Based on the input from the control sensors the valves, pump and doorsare controlled by a controller that contains preprogrammed sterilization cycles, i.e., thesterilization processes. A steam sterilizer often has about 5 preprogrammed processes.The monitoring pressure and temperature sensors are installed for an independent checkto ensure that the process is running correctly. Often readings of the monitoring andof the control sensors are presented in a display or indicator5 on the sterilizer and areregistered in a graph or digitally, to print a hard-copy.
To load the sterilizer and to keep the load at its desired position during a process,items to be sterilized are placed in so called nets, trays or baskets. Inside the sterilizerprecautions are made to fix the specific loading system. The loading systems are alsoused to prevent direct contact of the load with the sterilizer jacket and doors. In largersized sterilizers trolleys may be used for loading and unloading purposes.
Steam for a sterilizer can be provided by a central boiler in a facility or by dedicatedsteam generators. As outlined in section 2.2, steam quality is important for an effectiveand reproducible surface steam sterilization process. Nowadays dedicated steam gener-
5In decontamination the term ‘indicator’ can refer to biological, chemical and physical indicators.Biological Indicators (BIs) are devices which contain a specified number and species of microorganismsthat have to be killed after a process [77]. Chemical Indicators (CIs) are indicators based on a chemicalreaction which gives information on a decontamination process [79]. Physical indicators are indicatorsthat use physical measurements to obtain information on a decontamination process.
16 Steam sterilization
ators are preferred because they offer better possibilities to control the steam quality,in particular, the amount of NCGs in the steam. Frequently, the steam generation isconsidered as part of the sterilizer. Reducing and avoiding contaminants and NCGs inthe steam sterilizer starts with the water used for feeding the steam generator. Contam-inants can be separated from the feeding water in various ways, e.g., reversed osmosis,filtration, distillation or combinations of these techniques. Once the contaminants are re-moved the water may still contain NCGs. NCGs found in feeding water are environmentalgases such as carbon dioxide (CO2), nitrogen (N2) and oxygen (O2), typically. Especiallycarbon dioxide (CO2) may dissolve in water and appear as a NCG again during steamgeneration. In steam sterilization degassing of the feeding water can be done, for instance,with a so-called ‘break-tank’. Before the water is supplied into the actual steam generatorit is kept in a closed reservoir at 95 ◦C or higher for a certain minimum time. Gases willdissolve from the water, resulting in limited amounts of NCGs remaining in the feedingwater for the actual steam generator or boiler.
2.4 Surface steam sterilization process
In surface steam sterilization processes all surfaces that can be in contact with the envi-ronment have to be exposed to steam sterilization conditions. These processes consist ofthree phases, which are depicted in figure 2.2. Before the start of the actual sterilizationphase (phase II in figure 2.2) all initially present air has to be replaced by saturated steam,which has to be maintained for a predetermined time. Time-temperature combinations forsaturated surface steam sterilization are listed in table 2.1. After the sterilization phasethe sterilizer has to come to a safe state to open (phase III). For surface steam sterilizationthis means that the pressure in the sterilizer chamber has to be equal to the environmen-tal pressure and the load has to be dry. If the chamber pressure is sub-atmospheric, thesterilizer cannot be opened because the door will be sucked against the sterilizer, whereasin case of a super-atmospheric pressure a door may open too fast, causing injury to theoperator. Loads have to be dry because most, if not all, microbiological barrier systemsare considered to be not a barrier for microorganisms when they are wet (appendix A.3).
In the conditioning phase or phase I several methods can be applied to replace initiallypresent air by steam [69]. These methods are sketched in figure 2.3. Depending on thetype of load that has to be sterilized a particular process can be chosen [52]. Flushingprocesses are the most simple (figure 2.3-A). A pressure vessel with a steam inlet and a gasoutlet is loaded. After closing the door or lid, steam injection is started. The gas outlet isslightly opened. Gas initially present in the sterilizer will be replaced by steam while theaimed pressure is being reached. This kind of sterilizers have similarities with pressurecookers. A disadvantage of these flush processes is the difficulty to determine if all airis replaced by steam and, consequently, to recognize the start of the sterilization phase.This jeopardizes the reproducibly of the process and is often camouflaged by extendingthe sterilization phase. Another disadvantage is that wrapped instruments cannot besterilized in these flush processes, because it cannot be guaranteed that steam penetrateswrappings effectively and reproducibly (see appendix A.3). Also sterilized loads may stillbe wet after the process because of the limited drying capacities of the sterilizer. If thisprocess is used for sterilization of medical devices it is necessary to immediately use the
2.4 Surface steam sterilization process 17
0 200 400 600 800 1000 1200 14000
50
100
150
200
250
300
350
pre
ssure
(kP
a)
Phase II:Sterilization
Phase I:Conditioning
Phase III:Coming to asafe state to
open
time (s)
Figure 2.2: The three typical phases of a steam sterilization process. Phase I or condition-ing phase: replacing air by water vapor, steam. At the end of this phase all surfaces presentin the sterilizer are exposed to saturated steam at a predetermined temperature. Phase IIor sterilization phase: the actual sterilization phase. After establishing the sterilizationconditions the predetermined time has to elapse. Phase III or bringing the sterilizer to asafe state to open: the load is dried and the pressure is equalized with the environmentalpressure.
devices after opening and at the location of the sterilizer. Basically, because of thesedisadvantages flush processes are only appropriate for sterilization of aqueous liquids inclosed containers and to prevent cross contamination of non wrapped and non hollow(massive) instruments. Although these processes are still used in health care facilitiesin daily practice, it was recommended already in 1965 not to use them for general anddentist practices [92].
Air replacement by steam with super-atmospheric steam pulses (figure 2.3-B) is con-sidered to be more effective than flushing. In these processes, steam is injected into thesterilization chamber up to a certain specific pressure. After reaching this pressure levelthe steam valve is closed and the outlet valve is opened until a certain pressure level aboveatmospheric pressure level is reached. This ‘steam pulsing’ is repeated several times. Afterthe final gas outlet, the pressure in the steam sterilizer is brought to the steam steriliza-tion pressure and kept constant for the sterilization time (phase II, figure 2.2). When thesterilization time has elapsed the outlet is opened again and the pressure in the steamsterilizer is equalized to the environmental pressure. Although the steam penetration ofthese processes is better than that of flushing processes, the degree of steam penetrationin loads, especially loads with narrow hollow channels, is limited [93].
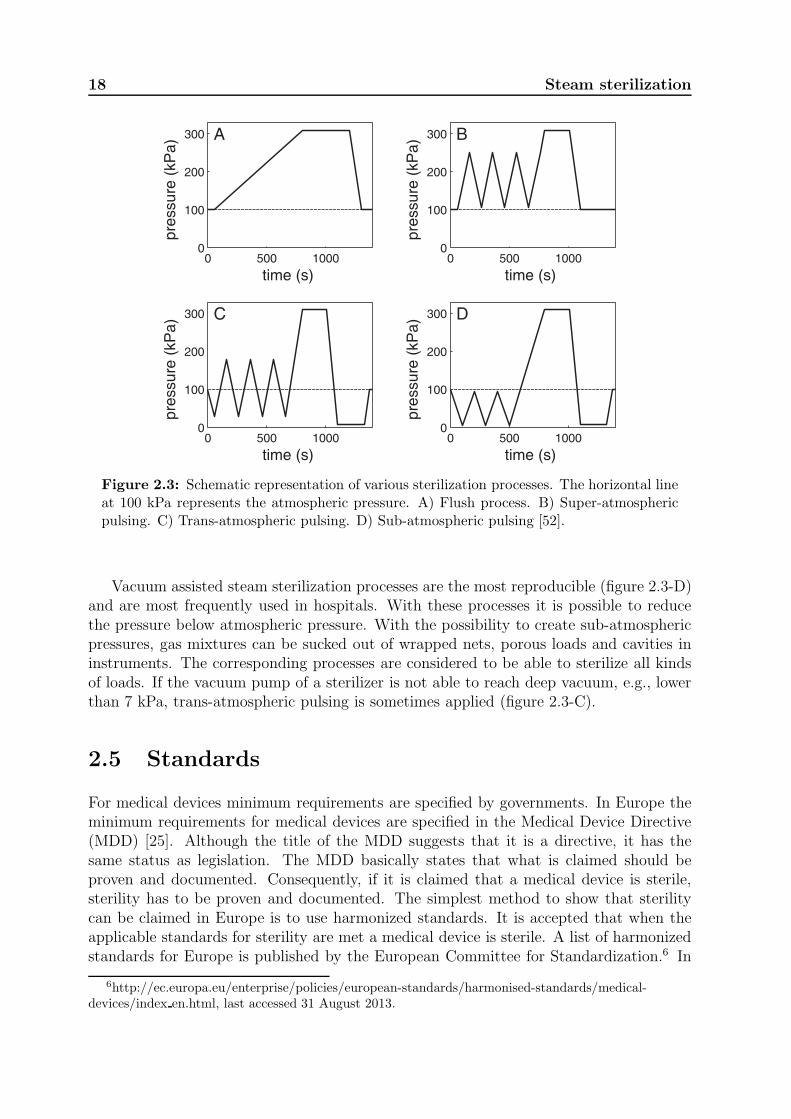
18 Steam sterilization
0 500 10000
100
200
300
time (s)
pre
ssu
re (
kP
a) A
0 500 10000
100
200
300
time (s)
pre
ssu
re (
kP
a) B
0 500 10000
100
200
300
time (s)
pre
ssu
re (
kP
a) C
0 500 10000
100
200
300
time (s)
pre
ssu
re (
kP
a) D
Figure 2.3: Schematic representation of various sterilization processes. The horizontal lineat 100 kPa represents the atmospheric pressure. A) Flush process. B) Super-atmosphericpulsing. C) Trans-atmospheric pulsing. D) Sub-atmospheric pulsing [52].
Vacuum assisted steam sterilization processes are the most reproducible (figure 2.3-D)and are most frequently used in hospitals. With these processes it is possible to reducethe pressure below atmospheric pressure. With the possibility to create sub-atmosphericpressures, gas mixtures can be sucked out of wrapped nets, porous loads and cavities ininstruments. The corresponding processes are considered to be able to sterilize all kindsof loads. If the vacuum pump of a sterilizer is not able to reach deep vacuum, e.g., lowerthan 7 kPa, trans-atmospheric pulsing is sometimes applied (figure 2.3-C).
2.5 Standards
For medical devices minimum requirements are specified by governments. In Europe theminimum requirements for medical devices are specified in the Medical Device Directive(MDD) [25]. Although the title of the MDD suggests that it is a directive, it has thesame status as legislation. The MDD basically states that what is claimed should beproven and documented. Consequently, if it is claimed that a medical device is sterile,sterility has to be proven and documented. The simplest method to show that sterilitycan be claimed in Europe is to use harmonized standards. It is accepted that when theapplicable standards for sterility are met a medical device is sterile. A list of harmonizedstandards for Europe is published by the European Committee for Standardization.6 In
6http://ec.europa.eu/enterprise/policies/european-standards/harmonised-standards/medical-devices/index en.html, last accessed 31 August 2013.
2.5 Standards 19
this list not only European standards are found but also ISO standards. ISO standardsare published by the International Organization for Standardization7 and have the statusof being worldwide standards. Based on the Lisbon Agreement (1989) and the ViennaAgreement (1991) European member states use the ISO standards8 if the standard isaccepted by Europe and ratified by that member state.
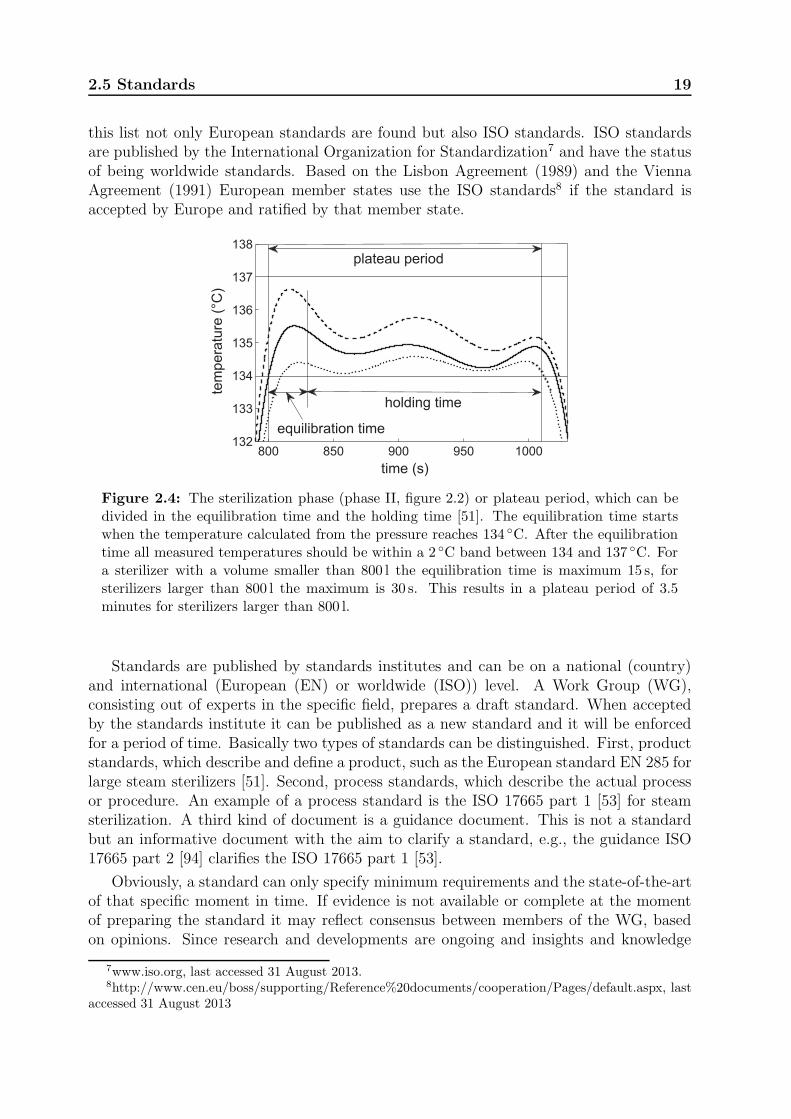
800 850 900 950 1000132
133
134
135
136
137
138
time (s)
tem
pe
ratu
re (
°C)
holding time
equilibration time
plateau period
Figure 2.4: The sterilization phase (phase II, figure 2.2) or plateau period, which can bedivided in the equilibration time and the holding time [51]. The equilibration time startswhen the temperature calculated from the pressure reaches 134 ◦C. After the equilibrationtime all measured temperatures should be within a 2 ◦C band between 134 and 137 ◦C. Fora sterilizer with a volume smaller than 800 l the equilibration time is maximum 15 s, forsterilizers larger than 800 l the maximum is 30 s. This results in a plateau period of 3.5minutes for sterilizers larger than 800 l.
Standards are published by standards institutes and can be on a national (country)and international (European (EN) or worldwide (ISO)) level. A Work Group (WG),consisting out of experts in the specific field, prepares a draft standard. When acceptedby the standards institute it can be published as a new standard and it will be enforcedfor a period of time. Basically two types of standards can be distinguished. First, productstandards, which describe and define a product, such as the European standard EN 285 forlarge steam sterilizers [51]. Second, process standards, which describe the actual processor procedure. An example of a process standard is the ISO 17665 part 1 [53] for steamsterilization. A third kind of document is a guidance document. This is not a standardbut an informative document with the aim to clarify a standard, e.g., the guidance ISO17665 part 2 [94] clarifies the ISO 17665 part 1 [53].
Obviously, a standard can only specify minimum requirements and the state-of-the-artof that specific moment in time. If evidence is not available or complete at the momentof preparing the standard it may reflect consensus between members of the WG, basedon opinions. Since research and developments are ongoing and insights and knowledge
7www.iso.org, last accessed 31 August 2013.8http://www.cen.eu/boss/supporting/Reference%20documents/cooperation/Pages/default.aspx, last
accessed 31 August 2013
20 Steam sterilization
change. An example is the ongoing discussion on the statistical definition of sterility[46, 47] (see inset page 9). It is likely that standards are outdated after a certain time.To keep standards as close as possible to the state-of-the-art after their publication itis necessary to periodically revise them. A typical time period for revision is 5 years.Would an immediate adjustment be necessary an amendment can be used [51, 95, 96].Although standards cannot continuously be state-of-the-art, they are necessary to makeprocesses and machines comparable and to define the relevant terminology. To preventthat standards would impair or stop development and innovation they cannot be designrestrictive. For surface steam sterilization processes this means that only the sterilizationphase (phase II) and the final result, dry loads, can be defined. The method to establishsterilization conditions during phase I (figure 2.2) or how to dry the load during phase IIIcannot be specified in standards.
As shown in section 2.1, the presence of condensate at the surfaces to be sterilized isessential for steam sterilization. When NCGs are present sterilization conditions cannotalways be guaranteed. NCGs can be introduced in a sterilizer chamber by several causes,such as a leak in the sterilizer or its appendages (figure 2.1), insufficiently deep vacuumin combination with insufficient steam injection during phase I (figure 2.2), and NCGs inthe steam caused by poor steam generation (section 2.2). For practical reasons modernsteam sterilizers are controlled using pressure (section 2.3). In the standards pressure andtemperature criteria for steam sterilization processes are specified [51–53]. For example, infigure 2.4 the so-called plateau period is plotted for a 134 ◦C surface sterilization process.The plateau period is divided in the equilibration time and the holding time, i.e., theactual sterilization phase. During this period all temperatures in the loadable space ofthe sterilizer may differ at most 2 ◦C from the theoretical temperature calculated fromthe pressure. If a gas is compressed too rapidly an adiabatic temperature overshoot mayoccur. To loose the extra amount of energy an equilibration time of 15 s is allowed for asterilizer with a chamber volume of less than 800 l. For sterilizers with a volume equalor larger than 800 l the equilibration time is 30 s. To protect the load from excessivetemperatures a maximum temperature for a process is defined. This temperature is theaimed sterilization temperature, e.g., 134 ◦C, plus 3 ◦C. Possibly the rationale for thismaximum temperature is that many plastics used in surgical material will permanentlydeform at temperatures above 140 ◦C. For this reason steam sterilization is often preferredabove dry heat sterilization9 (see inset page 10). For processes at 121 ◦C a similar 3 ◦Cexcess temperature is defined, resulting in a maximum temperature of 124 ◦C, probablyalso to protect items to be sterilized, e.g., fit-prostheses and respirator material.
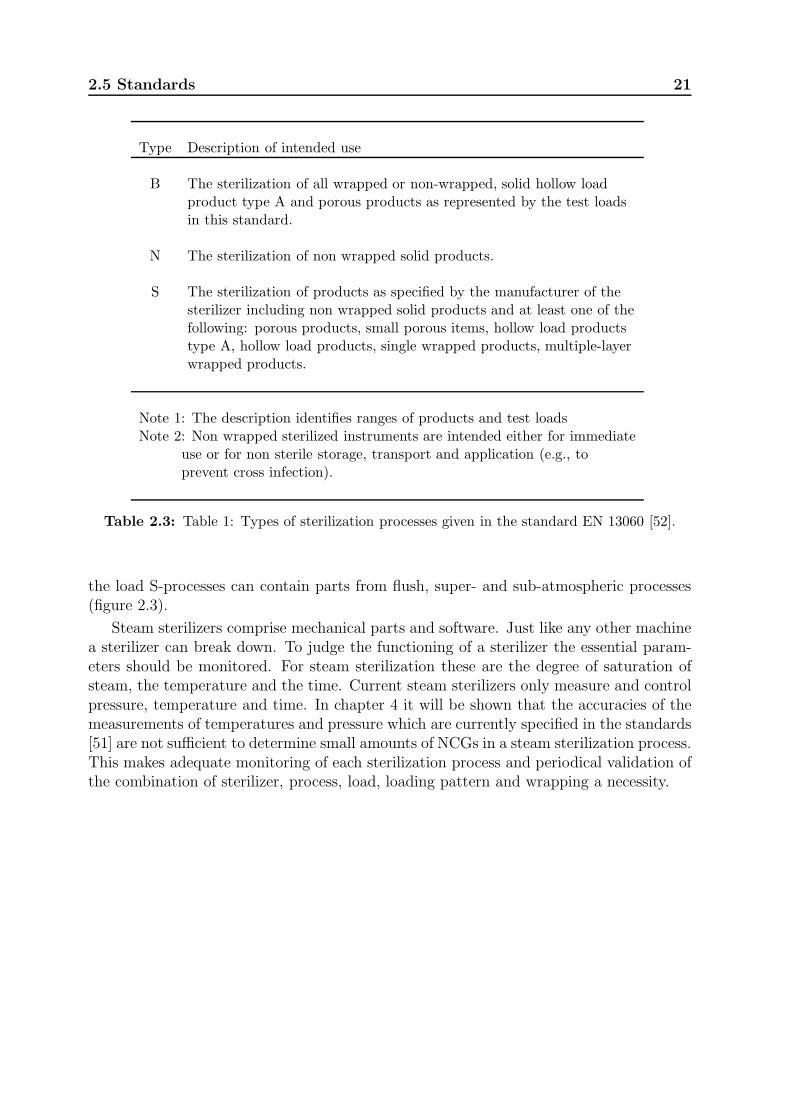
Standards for steam sterilization discriminate between large and small sterilizers. InEurope small sterilizers are defined as sterilizers with a loadable space of 30× 30× 60 cmor smaller than 60 l [52]. All sterilizers with a larger loadable space are considered as largesterilizers [51]. Three types of processes are identified for steam sterilizers [52]. Theseprocesses are listed in table 2.3. A typical ‘B’ or large sterilizer process has sub- or trans-atmospheric pulses in the conditioning phase (figure 2.3-D). A flush process or a processwith super-atmospheric pulsing is a type ‘N’ process (figure 2.3-A and -B). Depending on
9Although not suitable to sterilize medical devices, dry heat sterilization has its application in labo-ratories and pharmaceutical industries. It is an effective method for burning/oxidizing pyrogen materialof surfaces of glass-work and solid metal objects, leaving clean and deposit free surfaces.
2.5 Standards 21
Type Description of intended use
B The sterilization of all wrapped or non-wrapped, solid hollow loadproduct type A and porous products as represented by the test loadsin this standard.
N The sterilization of non wrapped solid products.
S The sterilization of products as specified by the manufacturer of thesterilizer including non wrapped solid products and at least one of thefollowing: porous products, small porous items, hollow load productstype A, hollow load products, single wrapped products, multiple-layerwrapped products.
Note 1: The description identifies ranges of products and test loadsNote 2: Non wrapped sterilized instruments are intended either for immediate
use or for non sterile storage, transport and application (e.g., toprevent cross infection).
Table 2.3: Table 1: Types of sterilization processes given in the standard EN 13060 [52].
the load S-processes can contain parts from flush, super- and sub-atmospheric processes(figure 2.3).
Steam sterilizers comprise mechanical parts and software. Just like any other machinea sterilizer can break down. To judge the functioning of a sterilizer the essential param-eters should be monitored. For steam sterilization these are the degree of saturation ofsteam, the temperature and the time. Current steam sterilizers only measure and controlpressure, temperature and time. In chapter 4 it will be shown that the accuracies of themeasurements of temperatures and pressure which are currently specified in the standards[51] are not sufficient to determine small amounts of NCGs in a steam sterilization process.This makes adequate monitoring of each sterilization process and periodical validation ofthe combination of sterilizer, process, load, loading pattern and wrapping a necessity.

22 Steam sterilization
Chapter 3
A validation survey of 197 hospital
steam sterilizers in The Netherlands
in 2001 and 2002
Steam sterilization is the most common method of sterilization used in hospitals and bycompanies sterilizing for hospitals. This study validated 197 steam sterilizers with respectto technical condition, various production processes and routine control tests, accordingto the European standards for steam sterilization. Overall, only 40% of the validatedsteam sterilizers met the standards. We recommend that adequate measures need to betaken, based on the comments in the validation reports, in order to guarantee the sterilityof processed medical items.
This chapter has been published in the Journal of Hospital Infection 59: 126–130, 2005.1
3.1 Introduction
Sterilization methods for medical devices, equipment, textiles and re-usable items havebeen developed to prevent infection due to contamination of such materials. In health carefacilities, steam sterilization is the most common sterilization method used. Various typesof steam sterilizers or autoclaves are available with different steam sterilizing processes[69, 95, 97, 98]. A steam sterilizing process has to be effective and reproducible and mustbe validated [25]. Failure of steam sterilizing processes, lack of routine control tests tomonitor the steam sterilization processes on a daily basis, and non-validated changes inthe steam sterilizer itself may result in a non-sterile product [99]. This implies that thevarious sterilization processes, loads, loading patterns and wrapping materials have tobe validated. Validation provides documented evidence that after steam sterilization, asterile product with predetermined specifications and quality characteristics is obtained[95, 97, 98]. In addition, validation results can be used for correct interpretation of datafrom the daily routine control tests, e.g., the air leakage test2 and the steam penetration
1In the literature no more recent study addressing the same topic than the survey reported in thischapter is found, suggesting that no significant changes have occurred during the last decade. At thismoment the Dutch RIVM (National Institute for Public Health and the Environment, Ministry of Health,Welfare and Sport (http://www.rivm.nl/English, last accessed 31 August 2013) is performing a study onsterilizers in Dutch hospitals. The results are expected to be published in the second half of 2013.
2A procedure described in the standards [51] to test if the air leak into a sterilizer is below the specifiedmaximum.
24 A validation survey
test3 [95, 97, 98, 100]. To our knowledge, no data are available in the literature from avalidation survey of hospital steam sterilizers. Here, we report the results of 197 validationprograms on steam sterilizers in The Netherlands during the period 2001–2002.
3.2 Materials and methods
3.2.1 Steam Sterilizers
In total, we validated 197 steam sterilizers in The Netherlands during the period 2001–2002. These steam sterilizers represented 18 brands and 93 types. Among these were 182large steam sterilizers with a loadable space of one standard unit (30×30×60 cm) [95, 98]or more and 15 small sterilizers with type B processes. A type B process is defined as aprocess by which wrapped as well as non-wrapped, solid, hollow and porous items can besterilized [98]. All steam sterilizers were used to sterilize medical equipment, textiles andvarious other medical devices. Of the 197 validated steam sterilizers, 186 were locatedin 71 (63%) of the 112 Dutch hospitals. Of these 186 sterilizers, 174 were situated in71 central sterile supply departments (CSSDs) and 12 were situated in eight operatingtheaters (OTs). The remaining 11 steam sterilizers were used by four (66%) of the sixDutch companies that perform steam sterilization for hospitals on a commercial basis.The median age of the CSSD steam sterilizers in the survey group was 9 years; the oldestwas 24 years old. The OT steam sterilizers had a median age of 10 years; the oldest was12 years old. Company steam sterilizers had a median age of 10 years; the oldest was 13years old.
3.2.2 Validation program
During the two-year survey, each steam sterilizer was validated once, either initially orrevalidated. An initial validation means that a steam sterilizer is validated for the firsttime, either because the steam sterilizer was new or because it was subject to a change inprocess, load, loading pattern, wrapping material or procedure since a previous validation.Revalidation means that the steam sterilizer was initially validated before 2001 and thatprocesses, loads, loading patterns, wrapping materials and procedures were not changed.In the previous 10 years, all revalidated steam sterilizers were validated at least once ayear. Prior to each validation, a validation program was prepared by the head of theCSSD, OT or company in co-operation with the validation project leader, who was anengineer from KW2 B.V. (Amersfoort, The Netherlands). In the validation program, thereason for validation and the relevant standards used were indicated. Steam sterilizationprocesses to be validated were sterilization at 121 ◦C for 15 min and at 134 ◦C for 3 min.Furthermore, the validation program included a document study of each steam sterilizerand an inspection of the technical condition according to the standards [95, 97, 98]. Thetechnical condition included the general construction of the steam sterilizer, the devices
3A standardized test to check on a daily basis if the steam penetration capacities in the condition-ing phase and the exposure to sterilization conditions in the actual sterilization phase are meeting therequirements in the standards (see also appendix A.2).
3.2 Materials and methods 25
used for the process display and registration, and the pressure gauge attached to thesteam sterilizer chamber.
3.2.3 Measurements of the production processes of the steam
sterilizers
The production processes were validated with specified loads. Temperatures were mea-sured with type K thermocouples (Eurotherm, Voorburg, The Netherlands). The ther-mocouples were inserted into the steam sterilizer and placed on pre-assessed positions inthe sterilizer chamber and load. An Endress+Hauser type PMC130 or PMC133 pressuresensor (Endress+Hauser, Weil am Rhein, Germany) was connected to the steam sterilizerchamber for pressure measurements [95, 98]. The sensors for temperature and pressuremeasurements were connected to a Chessel recorder type 4200 or 4250 (Eurotherm, Dur-rington, West Sussex, UK). The recorder was connected to a computer with validationsoftware (KWvers5, KW2 B.V., Amersfoort, The Netherlands). The complete validationsets used were calibrated according to international standards [95, 97, 98].
3.2.4 Measurements of the daily routine control tests
The routine control tests that were performed daily were part of the validation program.Both the air leakage test and the steam penetration test (see appendix A.2) were validatedaccording to the standards [95, 97, 98]. In the air leakage test, the pressure was measuredas a function of the time to measure the exposure time. Steam penetration in the 182large steam sterilizers was tested using the standardized Bowie & Dick (B&D) test [95,97, 98]. Once-a-day indicator sheets were used (Propper, Long Island City, NY, USA).In the 15 small steam sterilizers, the standard B&D test package did not fit. Therefore,measurements in these steam sterilizers were made with a disposable B&D test package,the B&D type steam penetration test pack 2000 (Interster International, Wormerveer, TheNetherlands) or the TST single-use B&D type test pack (Albert Browne Ltd., Leicester,UK). The user decided which disposable package was used. The wrapping of each B&Dindicator sheet listed the required temperature, the period of time for which the indicatorhad to be exposed to 100% saturated steam, and the color change of the indicator.
3.2.5 Evaluation of the data
A validation engineer of KW2 B.V. carried out the validation program and prepared thevalidation report. The validation project leader evaluated the final report.
3.2.6 Statistics
Differences between the results of the validations of steam sterilizers located in the CSSDs,OTs and companies were compared using a Chi-square test [101]. The same test was usedto compare the results from the initial validations and re-validations.
26 A validation survey
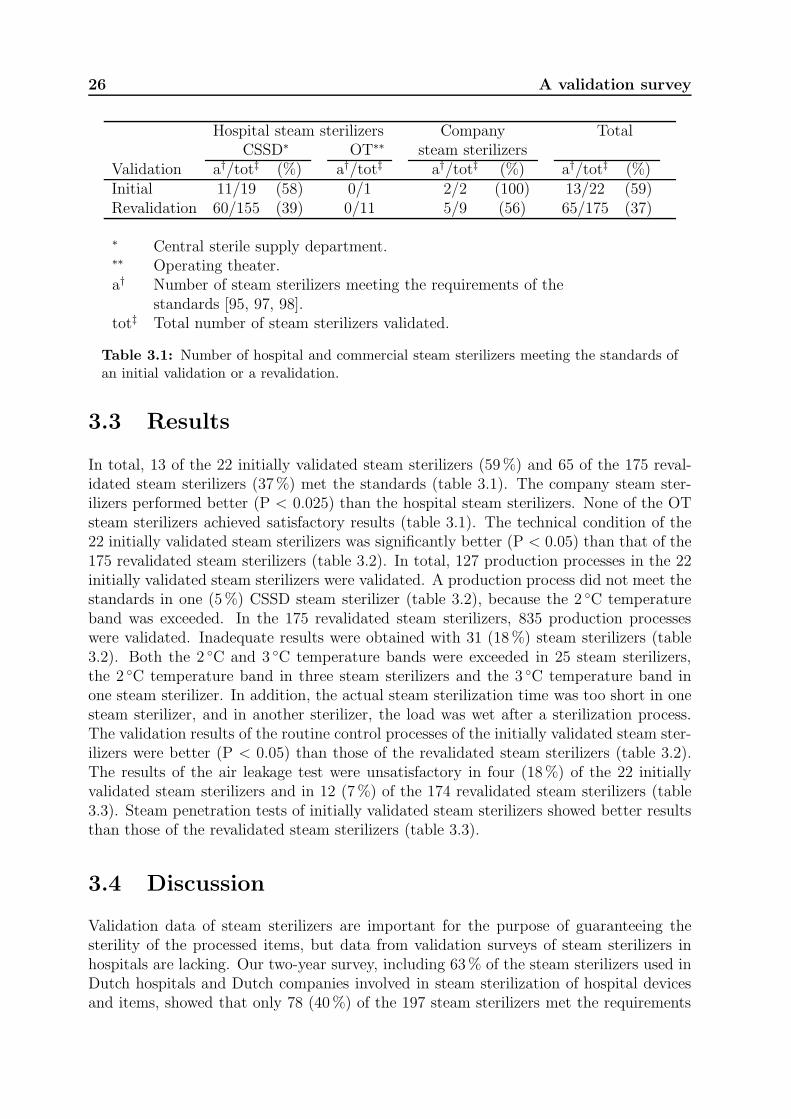
Hospital steam sterilizers Company TotalCSSD∗ OT∗∗ steam sterilizers
Validation a†/tot‡ (%) a†/tot‡ a†/tot‡ (%) a†/tot‡ (%)Initial 11/19 (58) 0/1 2/2 (100) 13/22 (59)Revalidation 60/155 (39) 0/11 5/9 (56) 65/175 (37)
∗ Central sterile supply department.∗∗ Operating theater.a† Number of steam sterilizers meeting the requirements of the
standards [95, 97, 98].tot‡ Total number of steam sterilizers validated.
Table 3.1: Number of hospital and commercial steam sterilizers meeting the standards ofan initial validation or a revalidation.
3.3 Results
In total, 13 of the 22 initially validated steam sterilizers (59%) and 65 of the 175 reval-idated steam sterilizers (37%) met the standards (table 3.1). The company steam ster-ilizers performed better (P < 0.025) than the hospital steam sterilizers. None of the OTsteam sterilizers achieved satisfactory results (table 3.1). The technical condition of the22 initially validated steam sterilizers was significantly better (P < 0.05) than that of the175 revalidated steam sterilizers (table 3.2). In total, 127 production processes in the 22initially validated steam sterilizers were validated. A production process did not meet thestandards in one (5%) CSSD steam sterilizer (table 3.2), because the 2 ◦C temperatureband was exceeded. In the 175 revalidated steam sterilizers, 835 production processeswere validated. Inadequate results were obtained with 31 (18%) steam sterilizers (table3.2). Both the 2 ◦C and 3 ◦C temperature bands were exceeded in 25 steam sterilizers,the 2 ◦C temperature band in three steam sterilizers and the 3 ◦C temperature band inone steam sterilizer. In addition, the actual steam sterilization time was too short in onesteam sterilizer, and in another sterilizer, the load was wet after a sterilization process.The validation results of the routine control processes of the initially validated steam ster-ilizers were better (P < 0.05) than those of the revalidated steam sterilizers (table 3.2).The results of the air leakage test were unsatisfactory in four (18%) of the 22 initiallyvalidated steam sterilizers and in 12 (7%) of the 174 revalidated steam sterilizers (table3.3). Steam penetration tests of initially validated steam sterilizers showed better resultsthan those of the revalidated steam sterilizers (table 3.3).
3.4 Discussion
Validation data of steam sterilizers are important for the purpose of guaranteeing thesterility of the processed items, but data from validation surveys of steam sterilizers inhospitals are lacking. Our two-year survey, including 63% of the steam sterilizers used inDutch hospitals and Dutch companies involved in steam sterilization of hospital devicesand items, showed that only 78 (40%) of the 197 steam sterilizers met the requirements
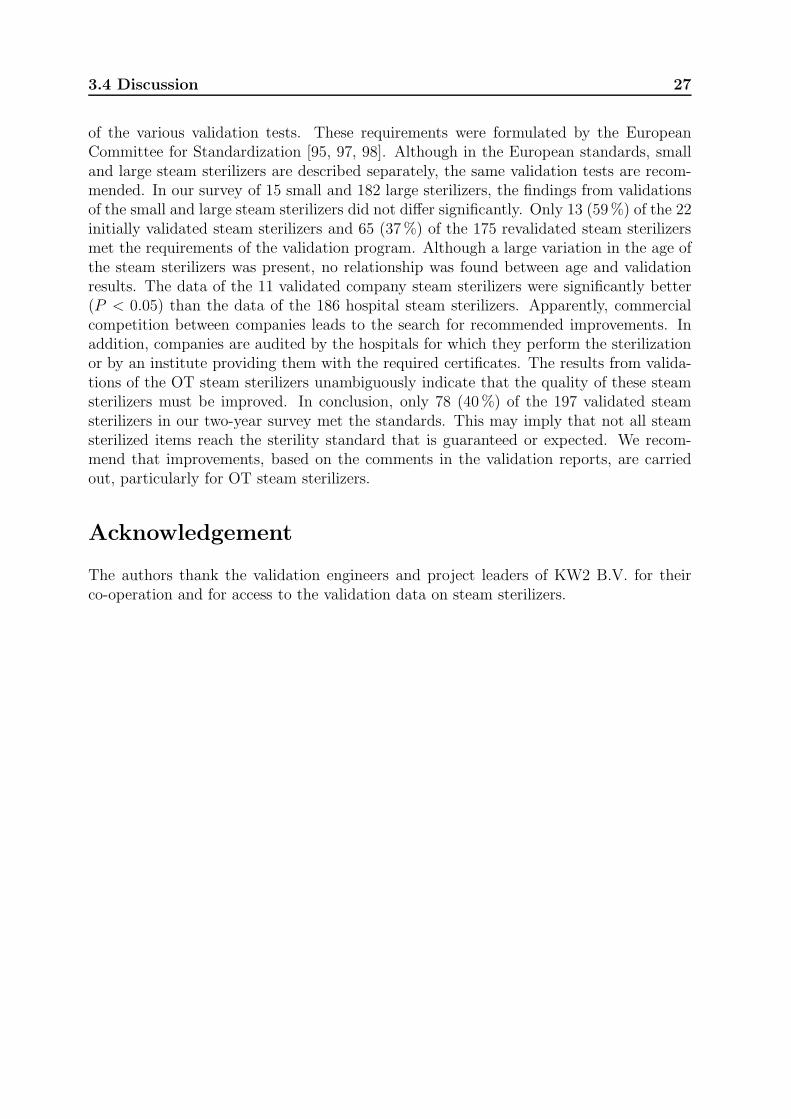
3.4 Discussion 27
of the various validation tests. These requirements were formulated by the EuropeanCommittee for Standardization [95, 97, 98]. Although in the European standards, smalland large steam sterilizers are described separately, the same validation tests are recom-mended. In our survey of 15 small and 182 large sterilizers, the findings from validationsof the small and large steam sterilizers did not differ significantly. Only 13 (59%) of the 22initially validated steam sterilizers and 65 (37%) of the 175 revalidated steam sterilizersmet the requirements of the validation program. Although a large variation in the age ofthe steam sterilizers was present, no relationship was found between age and validationresults. The data of the 11 validated company steam sterilizers were significantly better(P < 0.05) than the data of the 186 hospital steam sterilizers. Apparently, commercialcompetition between companies leads to the search for recommended improvements. Inaddition, companies are audited by the hospitals for which they perform the sterilizationor by an institute providing them with the required certificates. The results from valida-tions of the OT steam sterilizers unambiguously indicate that the quality of these steamsterilizers must be improved. In conclusion, only 78 (40%) of the 197 validated steamsterilizers in our two-year survey met the standards. This may imply that not all steamsterilized items reach the sterility standard that is guaranteed or expected. We recom-mend that improvements, based on the comments in the validation reports, are carriedout, particularly for OT steam sterilizers.
Acknowledgement
The authors thank the validation engineers and project leaders of KW2 B.V. for theirco-operation and for access to the validation data on steam sterilizers.
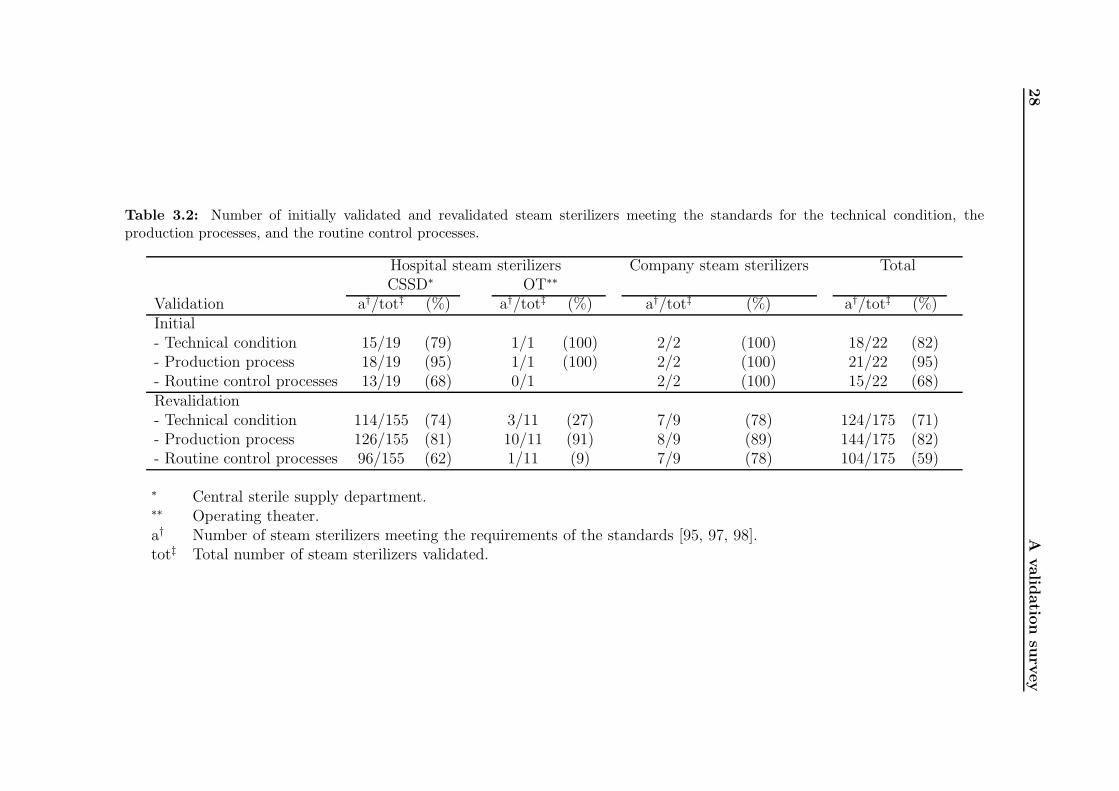
28
Avalid
atio
nsu
rvey
Table 3.2: Number of initially validated and revalidated steam sterilizers meeting the standards for the technical condition, theproduction processes, and the routine control processes.
Hospital steam sterilizers Company steam sterilizers TotalCSSD∗ OT∗∗
Validation a†/tot‡ (%) a†/tot‡ (%) a†/tot‡ (%) a†/tot‡ (%)Initial- Technical condition 15/19 (79) 1/1 (100) 2/2 (100) 18/22 (82)- Production process 18/19 (95) 1/1 (100) 2/2 (100) 21/22 (95)- Routine control processes 13/19 (68) 0/1 2/2 (100) 15/22 (68)Revalidation- Technical condition 114/155 (74) 3/11 (27) 7/9 (78) 124/175 (71)- Production process 126/155 (81) 10/11 (91) 8/9 (89) 144/175 (82)- Routine control processes 96/155 (62) 1/11 (9) 7/9 (78) 104/175 (59)
∗ Central sterile supply department.∗∗ Operating theater.a† Number of steam sterilizers meeting the requirements of the standards [95, 97, 98].tot‡ Total number of steam sterilizers validated.
3.4
Disc
ussio
n29
Table 3.3: Number of validated steam sterilizers with an air leakage test and a steam penetration test meeting the standards.
Hospital steam sterilizers Company steam sterilizers TotalCSSD∗ OT∗∗
Validation a†/tot‡ (%) a†/tot‡ (%) a†/tot‡ (%) a†/tot‡ (%)Initial- Air leakage test 16/19 (84) 0/1 2/2 (100) 18/22 (82)- Steam penetration test 16/19 (84) 0/1 2/2 (100) 18/22 (82)Revalidation- Air leakage test 143/154§ (93) 10/11 (91) 9/9 (100) 162/174§ (93)- Steam penetration test 97/155 (63) 1/11 (9) 7/9 (78) 105/175 (60)
∗ Central sterile supply department.∗∗ Operating theater.a† Number of steam sterilizers meeting the requirements of the standards [95, 97, 98].tot‡ Total number of steam sterilizers validated.§ In one steam sterilizer the air leakage test was not available.

30 A validation survey
Chapter 4
Review of surface steam sterilization
for validation purposes
Sterilization is an essential step in the process of producing sterile medical devices. Toguarantee sterility, the process of sterilization must be validated. Because there is nodirect way to measure sterility, the techniques applied to validate the sterilization processare based on statistical principles. Steam sterilization is the most frequently appliedsterilization method worldwide and can be validated either by indicators (chemical orbiological) or physical measurements. The steam sterilization conditions are describedin the literature. Starting from these conditions, criteria for the validation of steamsterilization are derived and can be described in terms of physical parameters. Physicalvalidation of steam sterilization appears to be an adequate and efficient validation methodthat could be considered as an alternative for indicator validation. Moreover, physicalvalidation can be used for effective troubleshooting in steam sterilizing processes.
The content of this chapter has been published in the American Journal of Infection Control 36:
86–92, 2008.
4.1 Introduction
Sterilization is an integral part of producing sterile medical devices in hospitals and otherhealth care environments. Because sterilization is not directly measurable, other tech-niques must be applied to prove that medical devices have in fact been sterilized. If thesterilization conditions are defined, a validation can be performed either with indicators(chemical or biological) or physically (see footnote page 15). We will argue that physicalvalidation can be a useful alternative for indicator validation.
The term sterile is defined as free of all viable organisms [19, 20]. This can be achievedby removal, inactivation, or destruction of all forms of viable life that are present. Theremoval of organisms can be done by filtration. Inactivation or destruction of viable or-ganisms can be done by exposing them to deadly conditions (e.g. oxidation, intoxication)or by destroying cell structures necessary for life, (i.e., the DNA or protein structures).It is pointless to test a sterile item on sterility before use, because once tested the prod-uct is not sterile anymore. Favero [73] described how the statistical definition of sterilityis used in practice and how the concept of the Sterility Assurance Level (SAL) evolvedover time. The worldwide accepted definition for sterility for medical devices is definedas the chance of finding a viable organism in or on a medical device to be at most 1 in1,000,000 or a SAL of at most 10−6. The SAL is defined as the probability of a singleviable microorganism occurring in or on a product after sterilization [53].
32 Review of surface steam sterilization for validation purposes
Every sterilization process based on killing has three phases. The first phase is creatingsterilization conditions, the second phase is the actual exposure of all object(s) to besterilized to these conditions, and the third phase is used to bring the sterilizer to asafe state to be opened and to remove the object(s) out of the sterilizer. It is generallyaccepted that medical devices are sterile if the combination of sterilizer, sterilizationprocess, load, wrapping method, and distribution of the load within the sterilizer chamber(the loading pattern) yield the desired sterilization conditions in and/or on the medicaldevices for a predetermined period. The validation is the documented procedure forobtaining, recording, and interpreting the data required to establish that a process willconsistently yield a result complying with predetermined specifications [53]. Before avalidation is performed, a validation program is composed. This program includes thereason for validation, the identification and location of the sterilizer, and the standardsto be used. Within the standards, criteria are described for the technical condition ofa steam sterilizer, including the general construction, the devices used for the processdisplay and registration, and the sterilization process itself.
The most generally applied sterilization method for medical devices worldwide is steamsterilization. In contrast to North America [102] and the developing countries [103], wherephysical validation of steam sterilization is not frequently applied in hospitals, physicalvalidation is used in Europe (e.g., the United Kingdom, Sweden, Belgium, Germany, andthe Netherlands)[104]. In this chapter, we discuss a physical validation of the steamsterilization processes that can be performed efficiently and economically in hospitals andother health care environments.
4.2 Sterilizing conditions of aqueous liquids and sur-
face steam sterilization
Without complete protein strings, an organism cannot live. The killing mechanism ofsterilization of aqueous liquids is destroying the protein strings by coagulation. Coagula-tion1 is the irreversible change and hardening of the protein chains of the microorganismsand requires energy and water [20, 81]. In a typical sterilization process for aqueousliquids in a closed container, the liquid is exposed to a temperature of 121 ◦C for 15 min-utes or 120 ◦C for 20 minutes. The elevated temperature supplies the energy to removehydro sulfide ions and smaller peptide chains from the proteins [82]. The bipolar watermolecules provide a mechanism by which the hydro sulfide ions and peptide chains (bothof which are also bipolar) can be transported to other locations within the organism.At these locations, new irreversible and harder bonds between these entities are formed.The amount of water in the cells depends on the type of organism and the environmentalconditions [26, 83]. This amount may be insufficient to transport the molecules that areremoved from the proteins. Water in the direct environment of the organisms can supplythe additional required water for coagulation.
Surface steam sterilization conditions are similar to those for aqueous liquid steriliza-tion. Therefore, the conditions on the surfaces to be sterilized must be identical to theconditions in the aqueous liquid. This means that all surfaces to be sterilized have to be
1See section 2.1 for some more details of this process.
4.2 Sterilizing conditions 33
wet and brought to the predetermined temperature. To establish these conditions in areproducible way, all the air in a surface steam sterilizer has to be replaced by water vaporbefore the start of the actual sterilization phase, and the steam in the sterilizer chambermust not be superheated.2 Furthermore, the surfaces must be clean, so the steam andcondensation have access to all surfaces to be sterilized. Chaufour et al. [84] have shownthat cleaning before sterilization is essential.
In 1937, Savage [26] studied temperature tolerance bands for reproducible surfacesteam sterilization conditions. He found that with 100% saturated steam at 105 ◦C, thetemperature margin was less than 1 ◦C, but as the temperature rises, the margin becomeswider, e.g., at 110 ◦C the temperature margin in the sterilizer might be larger than 8 ◦Cin the range from 110 to 118 ◦C without losing the killing efficacy of the process. Oneof his conclusions was that if the temperature derived from the saturated steam pressureexceeds 132 ◦C, no temperature margins have to be observed. The Working Party onPressure Steam Sterilizers of the Medical Research Council in 1959 [31] and Joslyn in 1991[19] noted that this latter conclusion is questionable, but did not define a temperatureband with appropriate criteria. Instead, the Medical Research Council used the time-temperature combinations reported by Perkins [88] but added safety margins to accountfor deviations in steam quality among different steam sterilizers. In table 4.1, three valuesof Perkins and those of the Medical Research Council concept are presented. The time-temperature combinations defined by the Medical Research Council are still in use forsteam sterilization [105, 106].
Perkins MRCtime temperature time temperature
(minutes) ( ◦C) (minutes) ( ◦C)2 132 3 1348 125 10 12612 121 15 121
Table 4.1: Three recommended time-temperature combinations of the Working Partyon Pressure steam sterilizers of the Medical Research Council [31], derived from time-temperature combinations for saturated steam sterilization reported by Perkins [88].
A gas or vapor can be heated within a large range of temperatures. If the time-temperature combinations of the sterilization of aqueous liquids are to be used for surfacesteam sterilization, it is necessary to verify whether saturated steam is present in thesterilizer chamber and on the surfaces to be sterilized. Therefore, the degree of saturationof the water vapor in a steam sterilization process has to be determined. In a productionsteam sterilizer, no direct measurements of the degree of saturation of the steam areperformed. These measurements appear to be too inaccurate, too slow, or too expensiveto implement in such a sterilizer. Alternative physical methods to determine the degreeof saturation of the steam are an air detector [95] or to use the pressure-temperaturerelation (p − T relation) of saturated steam [72, 107]. An air detector may be useful for
2In sterilization processes, superheated steam should be not considered as steam because its charac-teristics are closer to dry heat than to saturated steam.
34 Review of surface steam sterilization for validation purposes
routine control, but it is not suitable for process control or validation purposes. It doesnot accurately quantify the degree of saturation or the degree of superheating of steam.Using the p − T relation [72] a theoretical temperature (Tp) can be calculated from themeasured pressure (Fig. 4.1). If Tp is compared with the measured temperature(s) in thesterilizer chamber (Tc), three situations may occur:
• Tc equals Tp (100% saturated steam is present in the sterilizer chamber),
• Tc is lower than Tp (the steam is supersaturated),
• Tc is higher than Tp (the steam is superheated).
tem
pe
ratu
re (
°C)
pressure (kPa)
superheated steam
supersaturated steam
140
135
130
125
120
115200 250 300 350
Figure 4.1: Theoretical temperature of 100 % saturated steam (Tp) calculated from thepressure (p) [72]. Above the curve the steam is superheated and below the curve the steamis supersaturated (often called wet steam).
If Tc equals Tp an ideal situation for surface steam sterilization is established. Thewater vapor present in the sterilizer chamber is on the coexistence curve of the water andthe vapor phase (Fig. 4.1). The surfaces are wet and warmed up to the aimed temperature.Supersaturated steam (Tc < Tp) is not a direct problem with respect to the surface steamsterilization conditions, but it may lead to other problems not discussed here (e.g., wetloads after the sterilization process has been completed). Moreover, at lower temperaturesthe sterilization time will be longer. Superheated steam in a steam sterilizer chamber(Tc > Tp) has to lose its surplus of energy before it can condense on colder surfaces.This extra energy loss may be realized by warming up surfaces, evaporating water fromsurfaces, or even by extracting water out of viable cells. The amount of water in the cellsmay become lower than required for coagulation [83], without the possibility to supplyadditional water. A second problem of superheated steam is that energy transfer from avapor to a surface is less efficient than energy transfer by condensation, which slows downthe sterilization process. For an optimal steam sterilization process Tc should be equal
4.3 Validation of steam sterilization processes 35
or lower than Tp (Tc ≤ Tp). According to the findings of Savage [26], an elevation of Tc
equal to 1 ◦C is allowed at 105 ◦C. Because no other results are found in the literature,we assume that the maximum elevation of the chamber temperature is 1 ◦C above Tp,resulting in Tc ≤ Tp + 1. The allowed temperature elevation found by Savage, which wewill generalize as ∆Tns, may be caused by the presence of non-condensible gases or by thesuper-heating of the steam. At 134 ◦C, a temperature elevation of 1 ◦C corresponds to 9kPa, and at 140 ◦C it corresponds to 10 kPa (Fig. 4.1) [72].
4.3 Validation of steam sterilization processes
To validate a steam sterilizer, it must be proven that the steam sterilization conditionsdescribed in the previous section are met throughout the sterilizer chamber and that theexposure times are realized in an effective and reproducible way. If this is the case, allthe surfaces of the medical devices are efficiently and reproducibly sterilized. Therefore,a set of processes to be validated is defined in the validation program, containing thecombination of the sterilizer, the process, the load, the loading pattern, and the wrapping.For example, in a setting in which textiles and instruments are being steam-sterilized at121 ◦C for 15 minutes, the set of processes for the initial or first validation (or performancequalification) could include an air leakage test to prove that the sterilizer is air-tight; asteam penetration test (see appendix A.2) to provide information for the daily monitoringof the steam penetration of the steam sterilizer; an empty load; 50% and 100% instrumentloads; 50% and 100% textile loads; and 50% and 100% mixed loads. With the data ofthe production processes, all other load compositions within the matrix presented in table4.3 can be sterilized. In production chains in the industry, each load to be sterilized maybe identical. In that case, the validation program can be simplified to steam penetrationtest, air leakage test, empty load, and the specified load, the latter test being repeatedthree times.
Air leakage testSteam penetration testTextile load 0% 50% 100%Mixed load - 50% 100%Instrument load - 50% 100%
Table 4.2: Example of a validation program for a sterilizing program at 121 ◦C for 15minutes for textiles, instruments, and mixed loads. Because the empty chamber is validatedfor textiles, it has not to be validated again for the instrument and mixed loads. Thewrapping method, loading, and loading pattern are documented. Compositions of loadsdifferent from the validated loads can be sterilized by means of interpolation of the matrixof textile, mixed loads, and instrument loads. The matrix of production processes showsthat all validations are performed on 0%, 50%, and 100% loads, i.e., in triplicate.
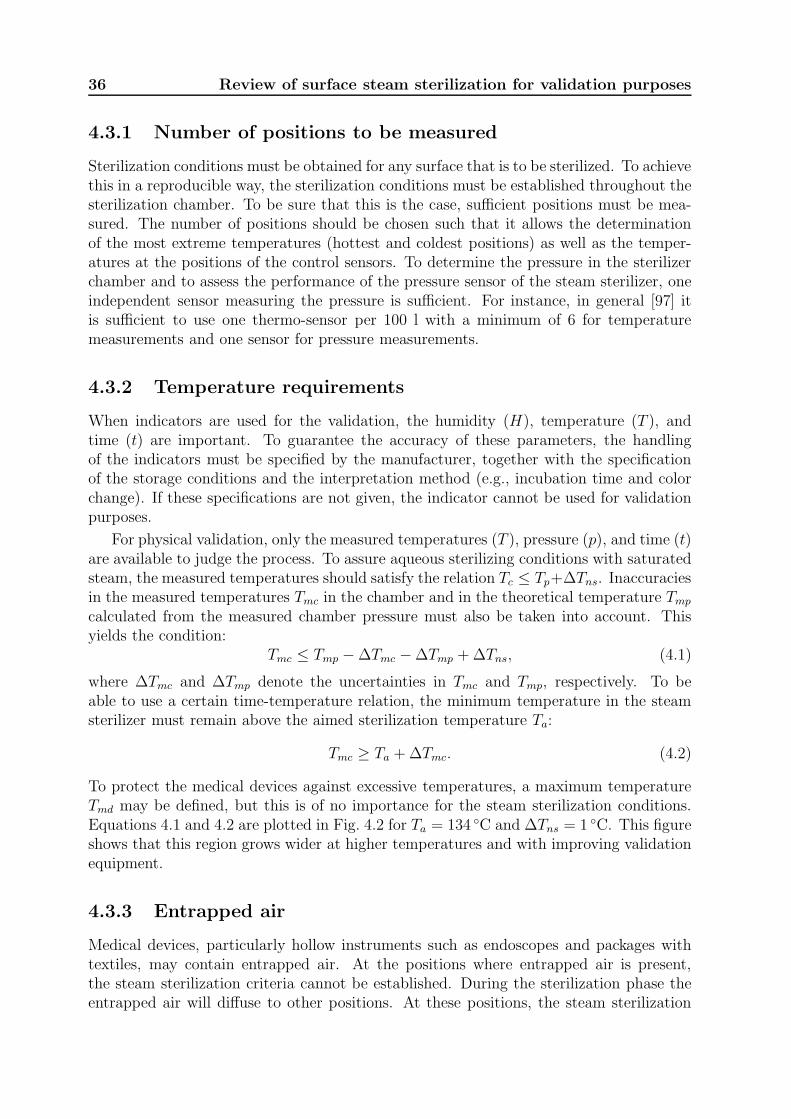
36 Review of surface steam sterilization for validation purposes
4.3.1 Number of positions to be measured
Sterilization conditions must be obtained for any surface that is to be sterilized. To achievethis in a reproducible way, the sterilization conditions must be established throughout thesterilization chamber. To be sure that this is the case, sufficient positions must be mea-sured. The number of positions should be chosen such that it allows the determinationof the most extreme temperatures (hottest and coldest positions) as well as the temper-atures at the positions of the control sensors. To determine the pressure in the sterilizerchamber and to assess the performance of the pressure sensor of the steam sterilizer, oneindependent sensor measuring the pressure is sufficient. For instance, in general [97] itis sufficient to use one thermo-sensor per 100 l with a minimum of 6 for temperaturemeasurements and one sensor for pressure measurements.
4.3.2 Temperature requirements
When indicators are used for the validation, the humidity (H), temperature (T ), andtime (t) are important. To guarantee the accuracy of these parameters, the handlingof the indicators must be specified by the manufacturer, together with the specificationof the storage conditions and the interpretation method (e.g., incubation time and colorchange). If these specifications are not given, the indicator cannot be used for validationpurposes.
For physical validation, only the measured temperatures (T ), pressure (p), and time (t)are available to judge the process. To assure aqueous sterilizing conditions with saturatedsteam, the measured temperatures should satisfy the relation Tc ≤ Tp+∆Tns. Inaccuraciesin the measured temperatures Tmc in the chamber and in the theoretical temperature Tmp
calculated from the measured chamber pressure must also be taken into account. Thisyields the condition:
Tmc ≤ Tmp −∆Tmc −∆Tmp +∆Tns, (4.1)
where ∆Tmc and ∆Tmp denote the uncertainties in Tmc and Tmp, respectively. To beable to use a certain time-temperature relation, the minimum temperature in the steamsterilizer must remain above the aimed sterilization temperature Ta:
Tmc ≥ Ta +∆Tmc. (4.2)
To protect the medical devices against excessive temperatures, a maximum temperatureTmd may be defined, but this is of no importance for the steam sterilization conditions.Equations 4.1 and 4.2 are plotted in Fig. 4.2 for Ta = 134 ◦C and ∆Tns = 1 ◦C. This figureshows that this region grows wider at higher temperatures and with improving validationequipment.
4.3.3 Entrapped air
Medical devices, particularly hollow instruments such as endoscopes and packages withtextiles, may contain entrapped air. At the positions where entrapped air is present,the steam sterilization criteria cannot be established. During the sterilization phase theentrapped air will diffuse to other positions. At these positions, the steam sterilization
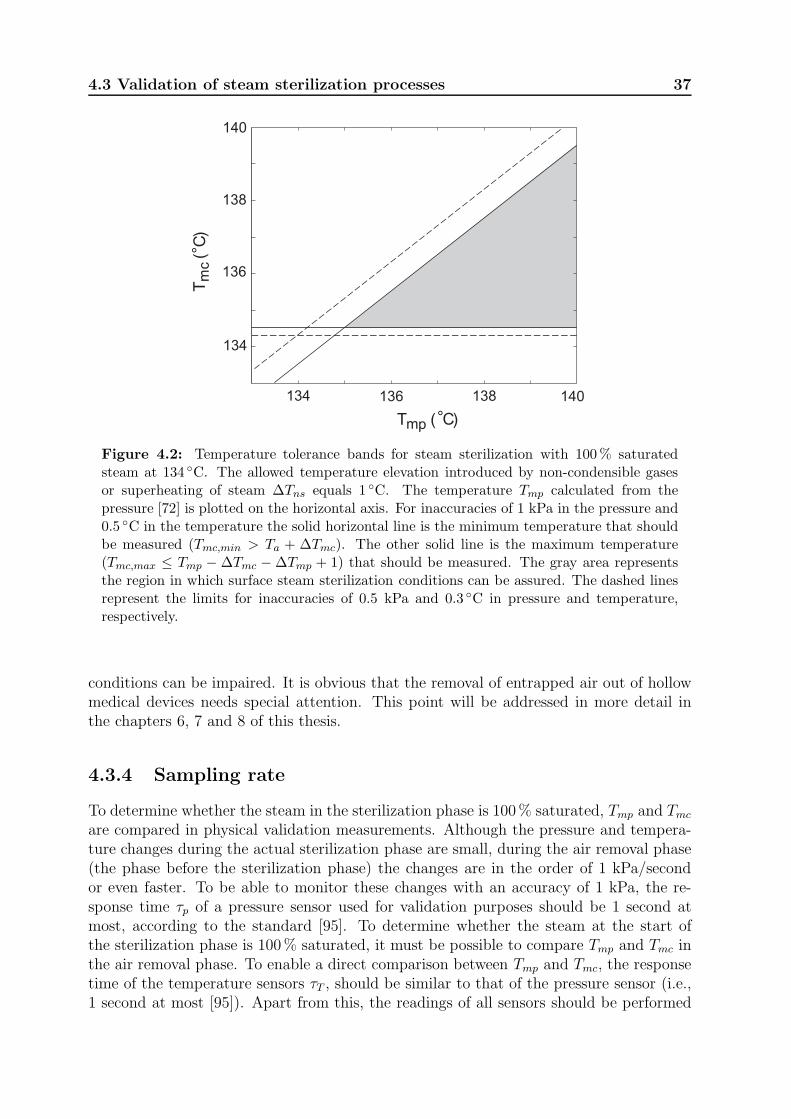
4.3 Validation of steam sterilization processes 37
134 136 138 140
134
136
138
140
Tmp (°C)
Tm
c(°
C)
Figure 4.2: Temperature tolerance bands for steam sterilization with 100% saturatedsteam at 134 ◦C. The allowed temperature elevation introduced by non-condensible gasesor superheating of steam ∆Tns equals 1 ◦C. The temperature Tmp calculated from thepressure [72] is plotted on the horizontal axis. For inaccuracies of 1 kPa in the pressure and0.5 ◦C in the temperature the solid horizontal line is the minimum temperature that shouldbe measured (Tmc,min > Ta + ∆Tmc). The other solid line is the maximum temperature(Tmc,max ≤ Tmp − ∆Tmc −∆Tmp + 1) that should be measured. The gray area representsthe region in which surface steam sterilization conditions can be assured. The dashed linesrepresent the limits for inaccuracies of 0.5 kPa and 0.3 ◦C in pressure and temperature,respectively.
conditions can be impaired. It is obvious that the removal of entrapped air out of hollowmedical devices needs special attention. This point will be addressed in more detail inthe chapters 6, 7 and 8 of this thesis.
4.3.4 Sampling rate
To determine whether the steam in the sterilization phase is 100% saturated, Tmp and Tmc
are compared in physical validation measurements. Although the pressure and tempera-ture changes during the actual sterilization phase are small, during the air removal phase(the phase before the sterilization phase) the changes are in the order of 1 kPa/secondor even faster. To be able to monitor these changes with an accuracy of 1 kPa, the re-sponse time τp of a pressure sensor used for validation purposes should be 1 second atmost, according to the standard [95]. To determine whether the steam at the start ofthe sterilization phase is 100% saturated, it must be possible to compare Tmp and Tmc inthe air removal phase. To enable a direct comparison between Tmp and Tmc, the responsetime of the temperature sensors τT , should be similar to that of the pressure sensor (i.e.,1 second at most [95]). Apart from this, the readings of all sensors should be performed
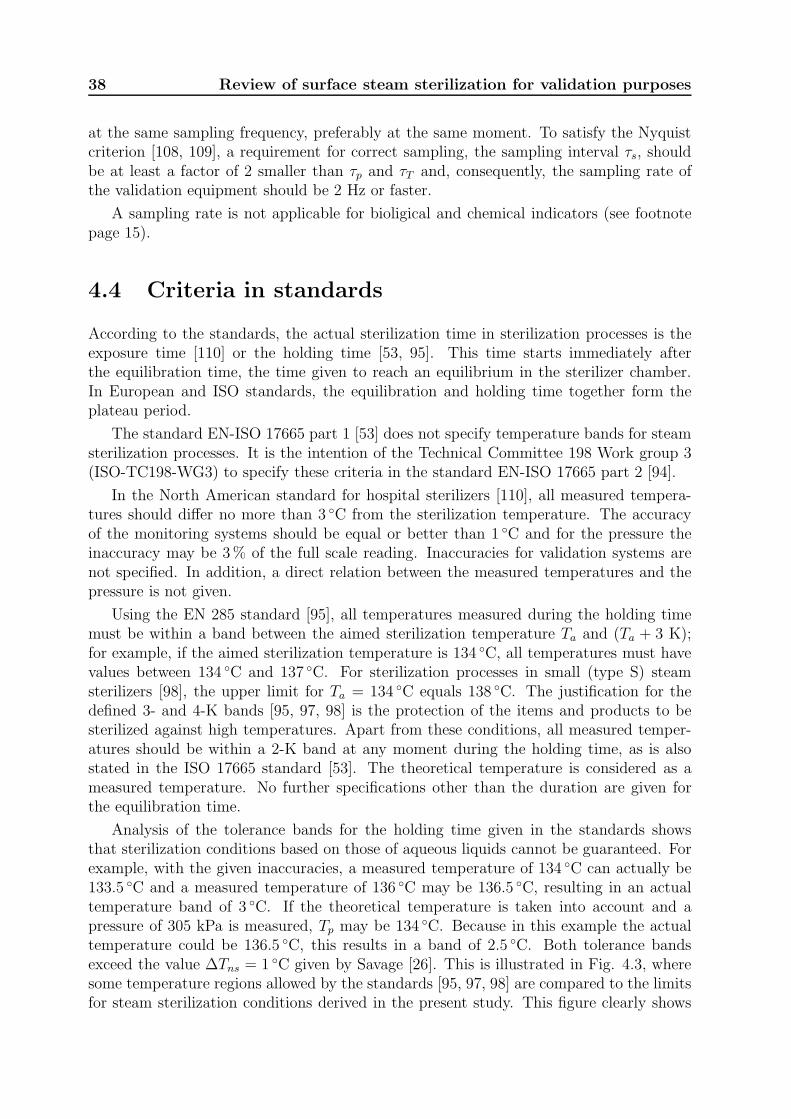
38 Review of surface steam sterilization for validation purposes
at the same sampling frequency, preferably at the same moment. To satisfy the Nyquistcriterion [108, 109], a requirement for correct sampling, the sampling interval τs, shouldbe at least a factor of 2 smaller than τp and τT and, consequently, the sampling rate ofthe validation equipment should be 2 Hz or faster.
A sampling rate is not applicable for bioligical and chemical indicators (see footnotepage 15).
4.4 Criteria in standards
According to the standards, the actual sterilization time in sterilization processes is theexposure time [110] or the holding time [53, 95]. This time starts immediately afterthe equilibration time, the time given to reach an equilibrium in the sterilizer chamber.In European and ISO standards, the equilibration and holding time together form theplateau period.
The standard EN-ISO 17665 part 1 [53] does not specify temperature bands for steamsterilization processes. It is the intention of the Technical Committee 198 Work group 3(ISO-TC198-WG3) to specify these criteria in the standard EN-ISO 17665 part 2 [94].
In the North American standard for hospital sterilizers [110], all measured tempera-tures should differ no more than 3 ◦C from the sterilization temperature. The accuracyof the monitoring systems should be equal or better than 1 ◦C and for the pressure theinaccuracy may be 3% of the full scale reading. Inaccuracies for validation systems arenot specified. In addition, a direct relation between the measured temperatures and thepressure is not given.
Using the EN 285 standard [95], all temperatures measured during the holding timemust be within a band between the aimed sterilization temperature Ta and (Ta + 3 K);for example, if the aimed sterilization temperature is 134 ◦C, all temperatures must havevalues between 134 ◦C and 137 ◦C. For sterilization processes in small (type S) steamsterilizers [98], the upper limit for Ta = 134 ◦C equals 138 ◦C. The justification for thedefined 3- and 4-K bands [95, 97, 98] is the protection of the items and products to besterilized against high temperatures. Apart from these conditions, all measured temper-atures should be within a 2-K band at any moment during the holding time, as is alsostated in the ISO 17665 standard [53]. The theoretical temperature is considered as ameasured temperature. No further specifications other than the duration are given forthe equilibration time.
Analysis of the tolerance bands for the holding time given in the standards showsthat sterilization conditions based on those of aqueous liquids cannot be guaranteed. Forexample, with the given inaccuracies, a measured temperature of 134 ◦C can actually be133.5 ◦C and a measured temperature of 136 ◦C may be 136.5 ◦C, resulting in an actualtemperature band of 3 ◦C. If the theoretical temperature is taken into account and apressure of 305 kPa is measured, Tp may be 134 ◦C. Because in this example the actualtemperature could be 136.5 ◦C, this results in a band of 2.5 ◦C. Both tolerance bandsexceed the value ∆Tns = 1 ◦C given by Savage [26]. This is illustrated in Fig. 4.3, wheresome temperature regions allowed by the standards [95, 97, 98] are compared to the limitsfor steam sterilization conditions derived in the present study. This figure clearly shows
4.4 Criteria in standards 39
that steam sterilization conditions cannot be guaranteed.
134 136 138 140
134
136
138
140
Tmp (°C)
Tm
c(°
C)
Figure 4.3: Temperature tolerance bands for steam sterilization with 100% saturatedsteam at 134 ◦C. Tmp represents the temperature calculated from the measured pressure[72], whereas Tmc represents the temperature measured in the sterilizer chamber. The exper-imental inaccuracies in the pressure and temperature are 1 kPa and 0.5 ◦C, respectively. Thegray area represents the region in which steam sterilization conditions can be assured. Thedashed boxes illustrate some regions that are allowed according to the European standards[95, 97, 98].
In the standards [95, 97, 98] an exception with respect to these general 2 K and3 K tolerance bands is made for the thermometric small load test [95]. In this test, thetemperature measured above a standard test pack [95] should not exceed the temperaturemeasured at a reference measurement point of the sterilizer chamber by more than 5 Kduring the first 60 s and by more than 2 K during the remaining period. No rationale hasbeen found for this exception. The North American standards [110–112] do not explicitlyaddress non-condensible gases.
The European standard [95] allows 3.5% (V/V) non-condensible gases to be present inthe steam, which will result in a pressure raise. From the pressure raise, the temperatureelevation of Tp can be calculated [72], which amounts to approximately 1.2 ◦C at 134 ◦C.In the European standard, no additional criteria are specified with respect to Tp. Thepresent study, however, indicates that in figure 4.2 the boundary relating the upper limitof Tmc to Tmp should be shifted by 1.2 ◦C to higher values of Tmp.
The North American standards [110] give no specification for the sampling rates ofthe measurements. The European standard [95] specifies for the sterilizer equipment asampling rate of at least once per 2.5 s (0.4 Hz) for the temperature, and at least once persecond (1 Hz) for the pressure. The response time for temperature (τ90) is 5 s, tested inwater, which is twice the temperature sampling time. In section 4.3.4 it is explained why,during validation of the processes, a sampling frequency 2 Hz is preferred for all sensors.
40 Review of surface steam sterilization for validation purposes
4.5 Discussion
The main objective of sterilization is to obtain sterile objects. To assure sterile objectsafter a sterilization process, validation is essential. If the theory for aqueous liquid ster-ilization is applied to surface steam sterilization, a straightforward set of criteria can bedefined (see equations 4.1 and 4.2). Although this makes physical validation possible, inmany countries validation of steam sterilization processes is performed with indicators.An advantage of using indicators compared with physical validation is the simplicity ofuse. On the other hand, physical validation yields more insight in the sterilization processitself.
European standards used for the development of indicators for steam sterilizationspecify the accuracies of the steam sterilizer to be used [100, 113] – for example, theaccuracy of the temperature must be better than 0.5 ◦C and the accuracy of the pressurebetter than 2.5 kPa. The ISO standards (ISO 11140-2 and ISO 18472) on this topic arenot yet available or published as standard. For the development of indicators for steamsterilization, the North American standard [111] requires an accuracy of the temperaturebetter than 0.5 ◦C and an accuracy of the pressure better than 3.4 kPa (0.5 psia). TheEuropean standards are therefore a little more strict than the North American standard.Although these specifications for the development of indicators may be comparable withthe physical requirements for validation, it is obvious that an indicator cannot be moreaccurate than the equipment used for its development. Furthermore, the integrity of anindicator can only be guaranteed if the storage and handling is performed according to thespecifications given by the manufacturer. If biological indicators are used, the incubationtime of the indicators will inevitably take time. Consequently, the validation results or,in daily practice, clearance of the sterilized loads will be delayed until the results of theindicators are available. Apart from this, a disadvantage of indicators is that they onlyprovide a one sided test. This implies that in case of a problem, the information given byindicators will often not be sufficient for trouble shooting.
If the set of physical requirements described earlier is used for validation measure-ments, surface steam sterilization conditions can be guaranteed. Moreover, physical mea-surements provide detailed information on the reproducibility and efficacy and can beused for trouble shooting. Because modern steam sterilizers are controlled on the basis ofphysical parameters (e.g., temperature, pressure, and time), it is recommended that theseparameters be monitored and validated. This will lead to better insight into the steriliza-tion process and hence a possible cost reduction. If an independent check is required onthe effectiveness of the sterilization processes that are validated, indicators can be added.
Finally, it is recommended that the criteria described in standards are based on well-established microbiological and physical models. Only then can discrepancies withinstandards for steam sterilization be eliminated.
Chapter 5
Temperature dependence of F -,
D- and z -values used in steam
sterilization processes
The minimum exposure time F for a decontamination process at a certain temperatureis usually calculated from an empirical model with the decimal reduction time D andthe temperature resistance coefficient z as parameters. These are implicitly assumed tobe independent of temperature. Using a microbiological approach, it is shown that alsoD and z depend on temperature, indicating that the usual models provide only reliableresults in a limited temperature region. The temperature dependence of F resulting fromthis approach describes the available experimental data very well. Safety margins toassure sterility can be included in a straightforward way. The results from the presentapproach can be used to safely optimize decontamination processes. The correspondingmathematical model can be implemented rather directly in process control systems. Ourresults show that for steam sterilization and disinfection processes the values of F pre-dicted by the usual models largely underestimate the required minimum exposure timesat temperatures below 120 ◦C. This has important consequences for the optimization ofsuch processes.
This chapter has been published in the Journal of Applied Microbiology: 107, 1054–1060, 2009.
5.1 Introduction
To obtain sterile products, items have to be sterilized. To compare different decontami-nation processes, in practice a description in terms of minimum exposure times F is used[18, 19, 22, 59, 61]. The value of F at a certain temperature is the minimum time that theorganisms, present in or on an item, have to be exposed to a hostile environment to assuresterility of the item. Worldwide, sterility of medical devices is defined as the chance offinding a viable organism in or on a medical device to be at most 1 in 1,000,000 or a Steril-ity Assurance Level (SAL) of at most 10−6 [23, 53, 73, 114, 115]. Already many decadesago, Perkins reported temperature-time combinations for sterilization of aqueous liquids[88]. A few years later, the Working Party on Pressure Steam Sterilizers of the MedicalResearch Council [31] adjusted these values to steam sterilization with 100% saturatedsteam by including safety margins [31]. The resulting temperature-time combinations arestill in use, e.g. 121 ◦C for 15 min and 134 ◦C for 3 min. For a given temperature andtime the value of F for a process can be calculated. This value should be equal to or
42 F -, D- and z -values
larger than that corresponding to an accepted temperature-time combination, in order toassure sterility.
Apart from comparing steam sterilization processes, F -values are used to optimizesuch processes, in order to safe time, energy, money, or to reduce the exposure time ofthermo-labile products to high temperatures. In most cases the exposure time to hightemperatures is made as short as possible. This is done by taking into account thecontribution of each part of the sterilization process to the inactivation of the organisms.
To calculate the value of F for other temperatures than those reported in the literature,empirical models are used with the decimal reduction time D (min) and the temperatureresistance coefficient z ( ◦C) as parameters. Values of D and z can be found in theliterature [18, 19, 59]. From calculations based on an Imaginary Micro Organism (IMO)concept and using the temperature-time combination of 120 ◦C for 20 min [31], Van Astenand Dorpema obtained D = 3.33 min and z = 17 ◦C [59]. With this reference point theycalculated generic temperature-time combinations for other temperatures. Values for Dand z can also be calculated from two accepted temperature-time combinations. Usingthe values given by the MRC [31], 121 ◦C for 15 min and 134 ◦C for 3 min, one obtains D= 2.5 min and z = 18.6 ◦C. The values for F reported in the literature do not seem to bevery consistent [18, 31, 59, 88]. Therefore, we thought it worthwhile to investigate whethera straightforward microbiological approach can be used to obtain a reliable prediction forthe temperature dependence of F . The theoretical framework is presented in the nextsection. In the subsequent section the predictions of the resulting model are comparedwith experimental temperature-time combinations [88], the combinations given by theMRC [31], and the behaviour of F resulting from the two models mentioned above. Thechapter will be concluded with a discussion.
5.2 Theory
It is generally accepted that the most essential mechanism for sterilization of aqueousliquids is coagulation1; the irreversible change and hardening of the protein chains of themicro-organisms [20]. This process can be described in terms of chemical reaction kinetics[116, 117] , in which the inactivation of organisms is given by
dN
dt= −kN, (5.1)
with N the number of organisms, t the time, and k the specific inactivation constantfor an organism. If the conditions required for steam sterilization are satisfied [118],the inactivation is identical to that in aqueous liquids, in which case the temperaturedependence of k obeys the Arrhenius law:
k = A exp
(
− Ea
RT
)
, (5.2)
In this equation A represents a constant, Ea the activation energy for the inactivation re-action (Jmol−1), R the universal gas constant (8.31 Jmol−1K−1), and T the temperature
1See section 2.1 for some more details of this process.
5.2 Theory 43
(K). If the population of organisms is exposed to a constant temperature, the number ofliving organisms after a certain time can be obtained from equation 5.1:
Ne = N0 exp (−kt) or lnNe − lnN0 = −kt, (5.3)
with N0 the initial number of organisms2, Ne the number of organisms that have survivedthe sterilization process, and t the time that has elapsed since the start of the sterilizationprocess. This equation shows that the time required to achieve sterility does not onlydepend on k but also on the initial number of organisms. In papers on sterilization theory[27] and in the pharmaceutical industry [18–20], the 10log (referred to as log) is often usedinstead of the natural logarithm. In that case, equation 5.3 reads:
Ne = N0 10−k′t or logNe − logN0 = −k′t, (5.4)
where k′ = k/ ln(10).
Often, a sterility criterion (S) is defined as S = log(N0/Ne). Substitution of thiscriterion in equation 5.4 shows that S is equal to the product k′t. The minimum time(F ) to satisfy the sterility criterion can be calculated with:
F =1
k′log
(
N0
Ne
)
=1
k′S. (5.5)
The decimal reduction time D is defined as the time needed to reduce the numberof organisms by a factor of 10, e.g., if N(0) = N0 at t = 0, then at t = D the valueN(D) = N0/10. Equation 5.4 shows that
D = 1/k′ = ln(10)/k (5.6)
and the inactivation of a process can be written as:
logNe = − 1
Dt + logN0. (5.7)
This equation illustrates that the inactivation can be represented by a straight line ina graph with a logarithmic N -axis [27, 121, 122]. By substituting equation 5.6 in equation5.5 the minimum exposure time (F ) for a given sterilization criterion S can be expressedas:
F = D log
(
N0
Ne
)
= DS. (5.8)
The decimal reduction time D = ln(10)/k depends on the environment conditions.Since in sterilization of aqueous liquids the temperature dependence of k is exponential(see equation 5.2), D has a similar temperature dependence. In the literature [19, 30, 59,123] the temperature dependence of D is described by a temperature resistance coefficientz ( ◦C), the temperature increase required to reduce D by a factor of 10 with respect toits value Dref at a temperature Tref :
logD = −1
z(T − Tref) + logDref , (5.9)
2In the literature and standards N0 is often taken equal to 106 [77, 119, 120]. It is not clearly definedwhether this number reflects the number of organisms on a surface, in a volume, or on a set of items.
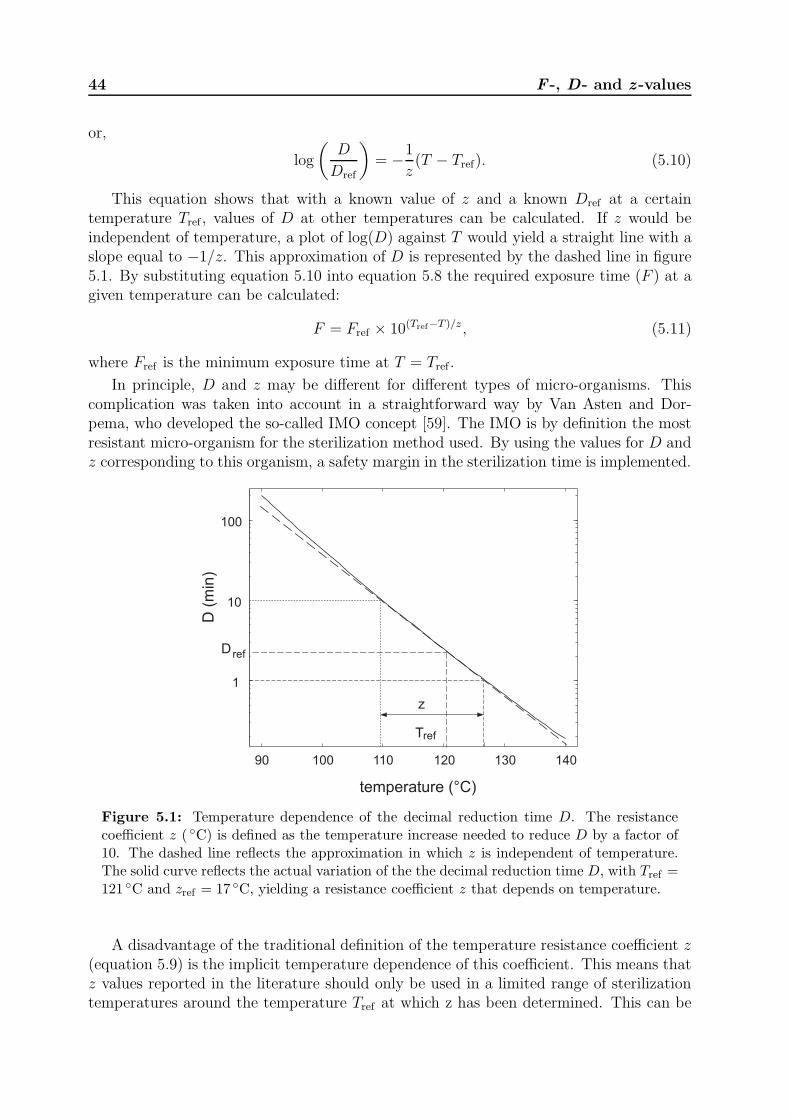
44 F -, D- and z -values
or,
log
(
D
Dref
)
= −1
z(T − Tref). (5.10)
This equation shows that with a known value of z and a known Dref at a certaintemperature Tref , values of D at other temperatures can be calculated. If z would beindependent of temperature, a plot of log(D) against T would yield a straight line with aslope equal to −1/z. This approximation of D is represented by the dashed line in figure5.1. By substituting equation 5.10 into equation 5.8 the required exposure time (F ) at agiven temperature can be calculated:
F = Fref × 10(Tref−T )/z , (5.11)
where Fref is the minimum exposure time at T = Tref .
In principle, D and z may be different for different types of micro-organisms. Thiscomplication was taken into account in a straightforward way by Van Asten and Dor-pema, who developed the so-called IMO concept [59]. The IMO is by definition the mostresistant micro-organism for the sterilization method used. By using the values for D andz corresponding to this organism, a safety margin in the sterilization time is implemented.
temperature (°C)
90 100 110 120 130 140
1
10
100
D (
min
)
z
refT
D ref
Figure 5.1: Temperature dependence of the decimal reduction time D. The resistancecoefficient z ( ◦C) is defined as the temperature increase needed to reduce D by a factor of10. The dashed line reflects the approximation in which z is independent of temperature.The solid curve reflects the actual variation of the the decimal reduction time D, with Tref =121 ◦C and zref = 17 ◦C, yielding a resistance coefficient z that depends on temperature.
A disadvantage of the traditional definition of the temperature resistance coefficient z(equation 5.9) is the implicit temperature dependence of this coefficient. This means thatz values reported in the literature should only be used in a limited range of sterilizationtemperatures around the temperature Tref at which z has been determined. This can be
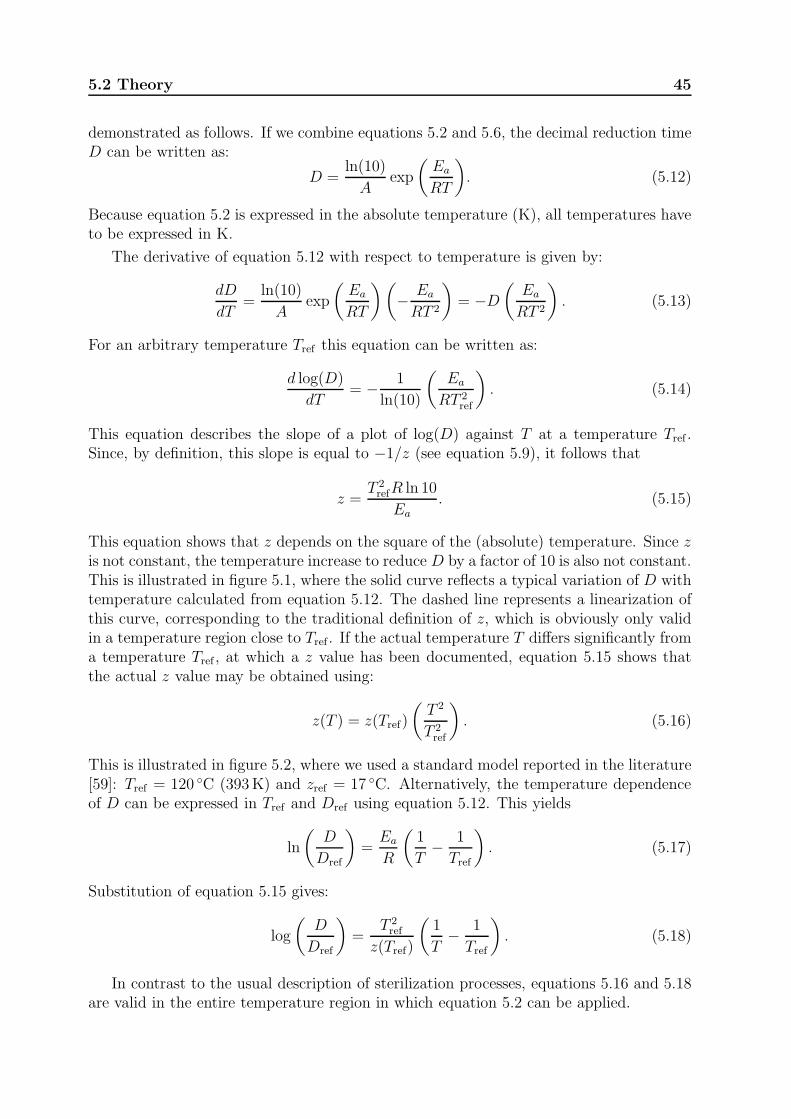
5.2 Theory 45
demonstrated as follows. If we combine equations 5.2 and 5.6, the decimal reduction timeD can be written as:
D =ln(10)
Aexp
(
Ea
RT
)
. (5.12)
Because equation 5.2 is expressed in the absolute temperature (K), all temperatures haveto be expressed in K.
The derivative of equation 5.12 with respect to temperature is given by:
dD
dT=
ln(10)
Aexp
(
Ea
RT
)(
− Ea
RT 2
)
= −D
(
Ea
RT 2
)
. (5.13)
For an arbitrary temperature Tref this equation can be written as:
d log(D)
dT= − 1
ln(10)
(
Ea
RT 2ref
)
. (5.14)
This equation describes the slope of a plot of log(D) against T at a temperature Tref .Since, by definition, this slope is equal to −1/z (see equation 5.9), it follows that
z =T 2refR ln 10
Ea. (5.15)
This equation shows that z depends on the square of the (absolute) temperature. Since zis not constant, the temperature increase to reduce D by a factor of 10 is also not constant.This is illustrated in figure 5.1, where the solid curve reflects a typical variation of D withtemperature calculated from equation 5.12. The dashed line represents a linearization ofthis curve, corresponding to the traditional definition of z, which is obviously only validin a temperature region close to Tref . If the actual temperature T differs significantly froma temperature Tref , at which a z value has been documented, equation 5.15 shows thatthe actual z value may be obtained using:
z(T ) = z(Tref)
(
T 2
T 2ref
)
. (5.16)
This is illustrated in figure 5.2, where we used a standard model reported in the literature[59]: Tref = 120 ◦C (393K) and zref = 17 ◦C. Alternatively, the temperature dependenceof D can be expressed in Tref and Dref using equation 5.12. This yields
ln
(
D
Dref
)
=Ea
R
(
1
T− 1
Tref
)
. (5.17)
Substitution of equation 5.15 gives:
log
(
D
Dref
)
=T 2ref
z(Tref)
(
1
T− 1
Tref
)
. (5.18)
In contrast to the usual description of sterilization processes, equations 5.16 and 5.18are valid in the entire temperature region in which equation 5.2 can be applied.
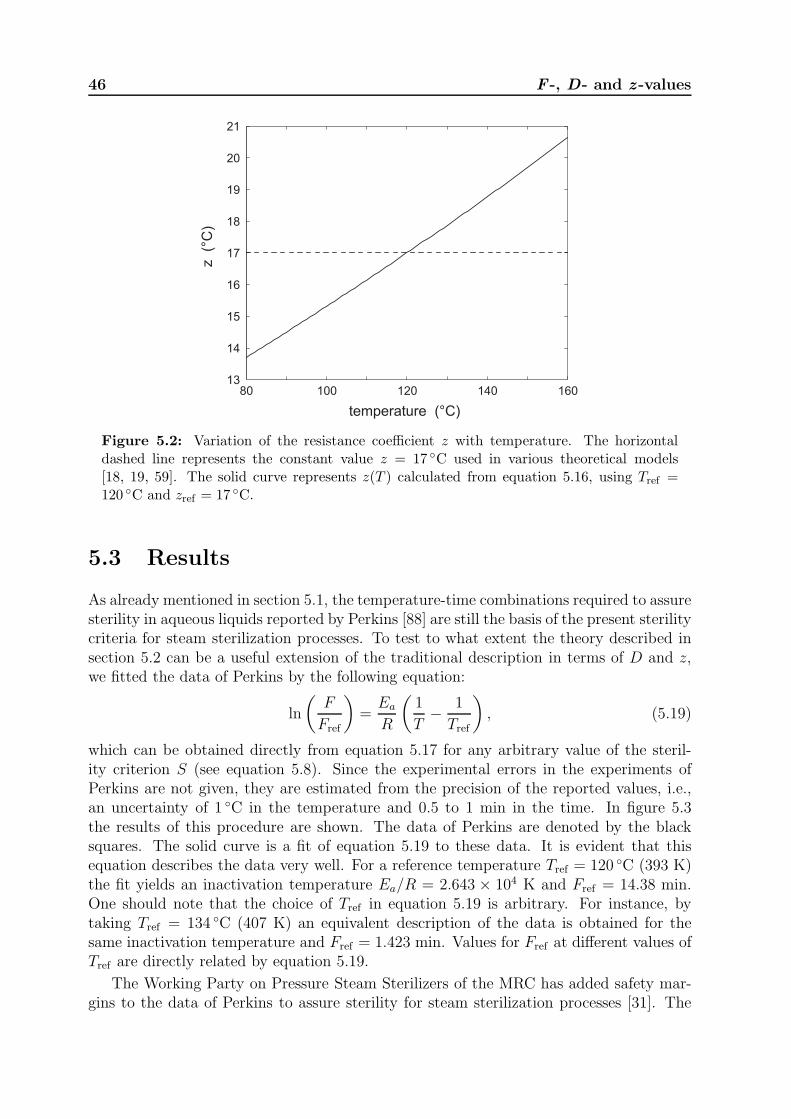
46 F -, D- and z -values
80 100 120 140 16013
14
15
16
17
18
19
20
21
z (°
C)
temperature (°C)
Figure 5.2: Variation of the resistance coefficient z with temperature. The horizontaldashed line represents the constant value z = 17 ◦C used in various theoretical models[18, 19, 59]. The solid curve represents z(T ) calculated from equation 5.16, using Tref =120 ◦C and zref = 17 ◦C.
5.3 Results
As already mentioned in section 5.1, the temperature-time combinations required to assuresterility in aqueous liquids reported by Perkins [88] are still the basis of the present sterilitycriteria for steam sterilization processes. To test to what extent the theory described insection 5.2 can be a useful extension of the traditional description in terms of D and z,we fitted the data of Perkins by the following equation:
ln
(
F
Fref
)
=Ea
R
(
1
T− 1
Tref
)
, (5.19)
which can be obtained directly from equation 5.17 for any arbitrary value of the steril-ity criterion S (see equation 5.8). Since the experimental errors in the experiments ofPerkins are not given, they are estimated from the precision of the reported values, i.e.,an uncertainty of 1 ◦C in the temperature and 0.5 to 1 min in the time. In figure 5.3the results of this procedure are shown. The data of Perkins are denoted by the blacksquares. The solid curve is a fit of equation 5.19 to these data. It is evident that thisequation describes the data very well. For a reference temperature Tref = 120 ◦C (393 K)the fit yields an inactivation temperature Ea/R = 2.643 × 10⁴ K and Fref = 14.38 min.One should note that the choice of Tref in equation 5.19 is arbitrary. For instance, bytaking Tref = 134 ◦C (407 K) an equivalent description of the data is obtained for thesame inactivation temperature and Fref = 1.423 min. Values for Fref at different values ofTref are directly related by equation 5.19.
The Working Party on Pressure Steam Sterilizers of the MRC has added safety mar-gins to the data of Perkins to assure sterility for steam sterilization processes [31]. The
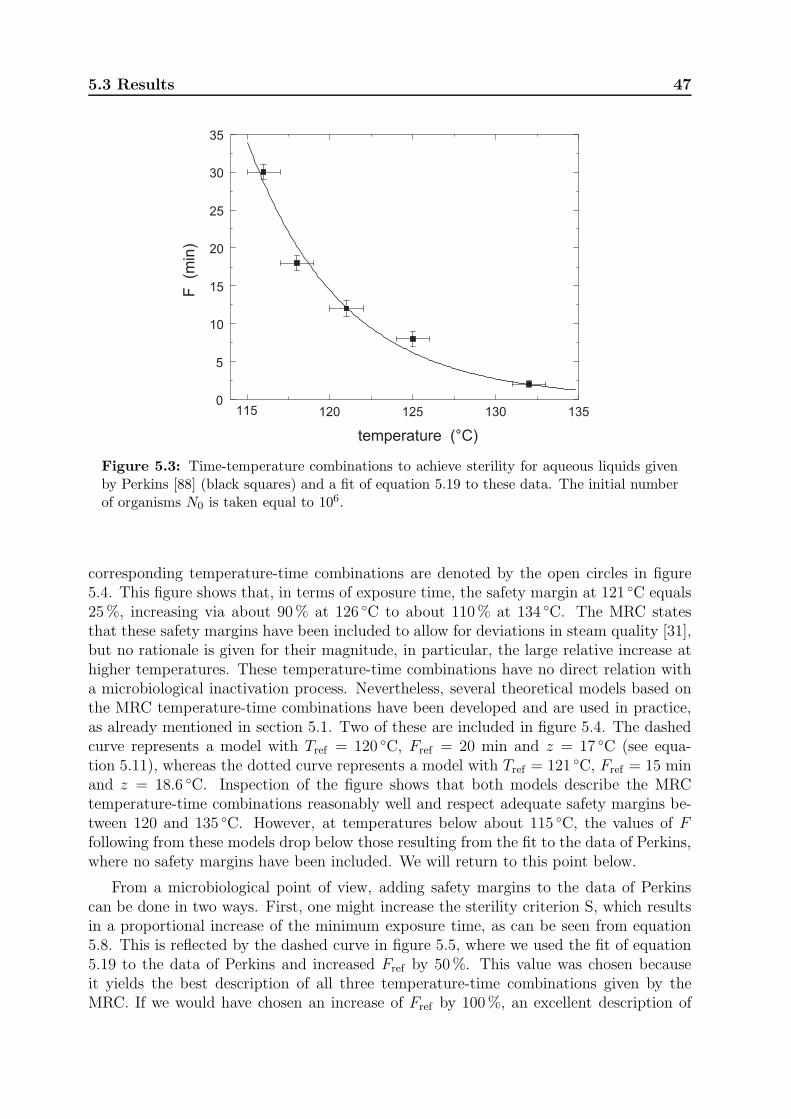
5.3 Results 47
0
5
10
15
20
25
30
35
temperature (°C)
F(m
in)
115 120 125 130 135
Figure 5.3: Time-temperature combinations to achieve sterility for aqueous liquids givenby Perkins [88] (black squares) and a fit of equation 5.19 to these data. The initial numberof organisms N0 is taken equal to 106.
corresponding temperature-time combinations are denoted by the open circles in figure5.4. This figure shows that, in terms of exposure time, the safety margin at 121 ◦C equals25%, increasing via about 90% at 126 ◦C to about 110% at 134 ◦C. The MRC statesthat these safety margins have been included to allow for deviations in steam quality [31],but no rationale is given for their magnitude, in particular, the large relative increase athigher temperatures. These temperature-time combinations have no direct relation witha microbiological inactivation process. Nevertheless, several theoretical models based onthe MRC temperature-time combinations have been developed and are used in practice,as already mentioned in section 5.1. Two of these are included in figure 5.4. The dashedcurve represents a model with Tref = 120 ◦C, Fref = 20 min and z = 17 ◦C (see equa-tion 5.11), whereas the dotted curve represents a model with Tref = 121 ◦C, Fref = 15 minand z = 18.6 ◦C. Inspection of the figure shows that both models describe the MRCtemperature-time combinations reasonably well and respect adequate safety margins be-tween 120 and 135 ◦C. However, at temperatures below about 115 ◦C, the values of Ffollowing from these models drop below those resulting from the fit to the data of Perkins,where no safety margins have been included. We will return to this point below.
From a microbiological point of view, adding safety margins to the data of Perkinscan be done in two ways. First, one might increase the sterility criterion S, which resultsin a proportional increase of the minimum exposure time, as can be seen from equation5.8. This is reflected by the dashed curve in figure 5.5, where we used the fit of equation5.19 to the data of Perkins and increased Fref by 50%. This value was chosen becauseit yields the best description of all three temperature-time combinations given by theMRC. If we would have chosen an increase of Fref by 100%, an excellent description of
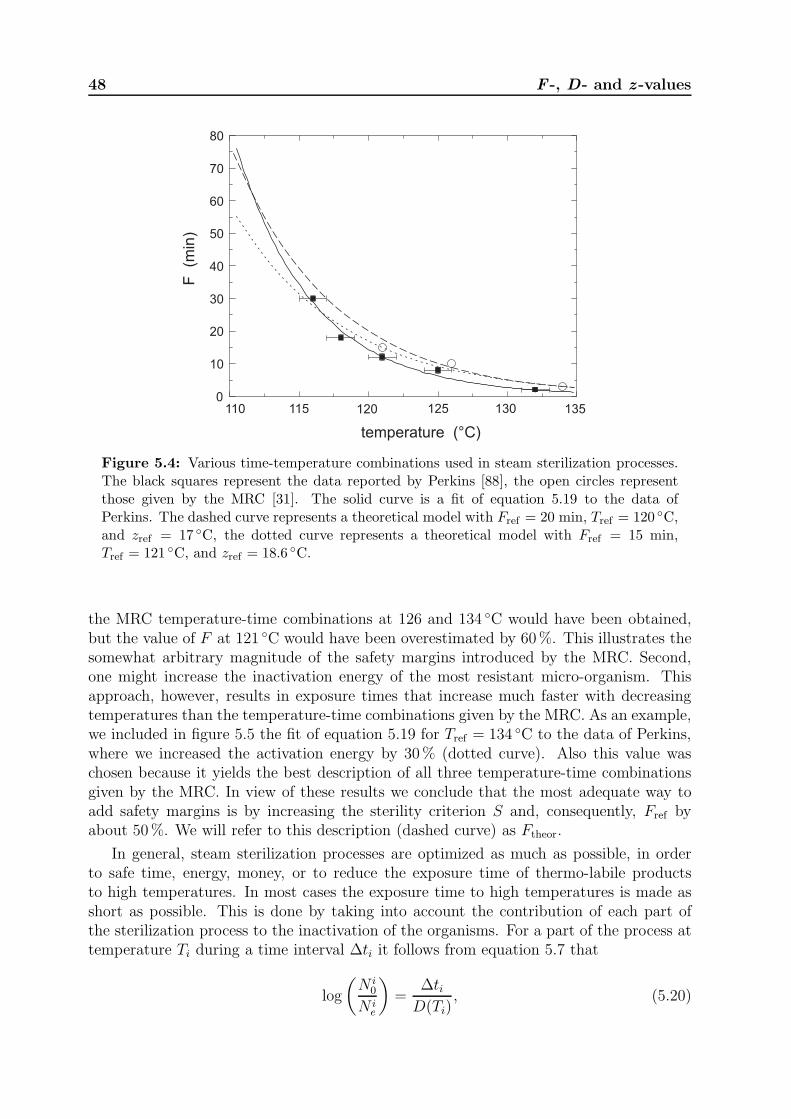
48 F -, D- and z -values
0
10
20
30
40
50
60
70
80
temperature (°C)
F
(min
)
110 120 125 130 135115
Figure 5.4: Various time-temperature combinations used in steam sterilization processes.The black squares represent the data reported by Perkins [88], the open circles representthose given by the MRC [31]. The solid curve is a fit of equation 5.19 to the data ofPerkins. The dashed curve represents a theoretical model with Fref = 20 min, Tref = 120 ◦C,and zref = 17 ◦C, the dotted curve represents a theoretical model with Fref = 15 min,Tref = 121 ◦C, and zref = 18.6 ◦C.
the MRC temperature-time combinations at 126 and 134 ◦C would have been obtained,but the value of F at 121 ◦C would have been overestimated by 60%. This illustrates thesomewhat arbitrary magnitude of the safety margins introduced by the MRC. Second,one might increase the inactivation energy of the most resistant micro-organism. Thisapproach, however, results in exposure times that increase much faster with decreasingtemperatures than the temperature-time combinations given by the MRC. As an example,we included in figure 5.5 the fit of equation 5.19 for Tref = 134 ◦C to the data of Perkins,where we increased the activation energy by 30% (dotted curve). Also this value waschosen because it yields the best description of all three temperature-time combinationsgiven by the MRC. In view of these results we conclude that the most adequate way toadd safety margins is by increasing the sterility criterion S and, consequently, Fref byabout 50%. We will refer to this description (dashed curve) as Ftheor.
In general, steam sterilization processes are optimized as much as possible, in orderto safe time, energy, money, or to reduce the exposure time of thermo-labile productsto high temperatures. In most cases the exposure time to high temperatures is made asshort as possible. This is done by taking into account the contribution of each part ofthe sterilization process to the inactivation of the organisms. For a part of the process attemperature Ti during a time interval ∆ti it follows from equation 5.7 that
log
(
N i0
N ie
)
=∆ti
D(Ti), (5.20)
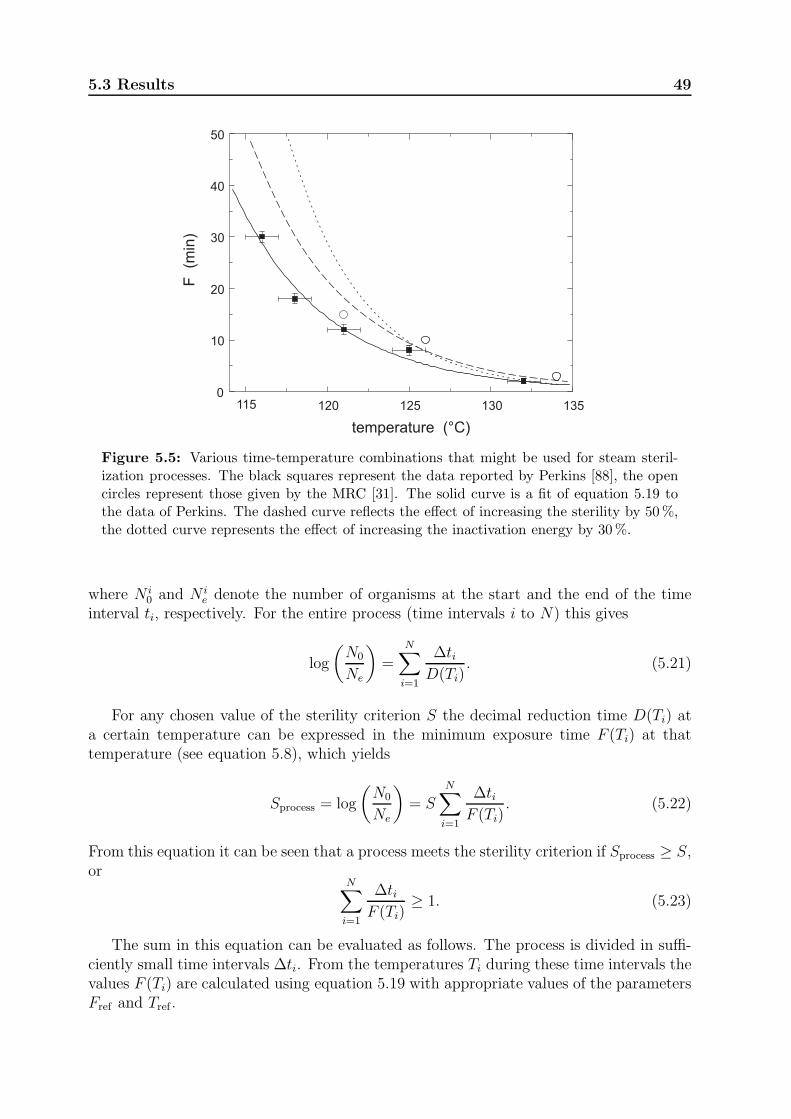
5.3 Results 49
115 120 125 130 1350
10
20
30
40
50
F (m
in)
temperature (°C)
Figure 5.5: Various time-temperature combinations that might be used for steam steril-ization processes. The black squares represent the data reported by Perkins [88], the opencircles represent those given by the MRC [31]. The solid curve is a fit of equation 5.19 tothe data of Perkins. The dashed curve reflects the effect of increasing the sterility by 50%,the dotted curve represents the effect of increasing the inactivation energy by 30%.
where N i0 and N i
e denote the number of organisms at the start and the end of the timeinterval ti, respectively. For the entire process (time intervals i to N) this gives
log
(
N0
Ne
)
=
N∑
i=1
∆tiD(Ti)
. (5.21)
For any chosen value of the sterility criterion S the decimal reduction time D(Ti) ata certain temperature can be expressed in the minimum exposure time F (Ti) at thattemperature (see equation 5.8), which yields
Sprocess = log
(
N0
Ne
)
= SN∑
i=1
∆tiF (Ti)
. (5.22)
From this equation it can be seen that a process meets the sterility criterion if Sprocess ≥ S,or
N∑
i=1
∆tiF (Ti)
≥ 1. (5.23)
The sum in this equation can be evaluated as follows. The process is divided in suffi-ciently small time intervals ∆ti. From the temperatures Ti during these time intervals thevalues F (Ti) are calculated using equation 5.19 with appropriate values of the parametersFref and Tref .
50 F -, D- and z -values
If we compare figures 5.4 and 5.5 it is clear that in the temperature range between 121and 134 ◦C both Ftheor introduced above and the two models mentioned above representthe MRC temperature-time combinations with an acceptable degree of accuracy. At lowertemperatures, however, the latter two models predict minimum exposure times that aremuch lower than those resulting from a microbiological approach. If the F (T ) relations forthese models would be used to evaluate the sum in equation 5.22, the contribution of thelow-temperature parts of the process to the inactivation would be overestimated. In suchcases it cannot be guaranteed that the chosen sterility criterion is actually satisfied. Theerrors in the calculations will be most pronounced for processes that involve temperaturesbelow 115 ◦C during significant time intervals.
5.4 Discussion
Although the minimum exposure times F calculated according to various empirical models[18, 19, 59] are in line with the reported experimental data of Perkins [88] and the MRC[31], the results presented in this chapter show that these methods should only be appliedin the temperature region between 121 and 134 ◦C. Moreover, it is shown that thesecalculations are only valid within a limited temperature range close to some referencetemperature (Tref), because the parameters D and z used in these calculations actuallyvary with temperature. Consequently, the parameters Dref and zref used to calculate thevalue of F must be chosen close to the used Tref , and should be available in the literatureor determined from experiments close to Tref .
This limited temperature range is a major disadvantage of the current methods tocalculate values of F and may lead to incorrect conclusions and even to a false sense ofsafety. For instance, when sterilization temperatures are located significantly below Tref ,the calculated exposure times to sterilization conditions appear to be too short. Thiserror may be very pronounced for sterilization processes in which the items are warmingup and cooling down slowly.
The straightforward microbiological approach presented in this chapter to calculateF (T ) by equation 5.19 perfectly describes the available experimental data [88]. Theresulting mathematical model contains only two independent parameters and can be im-plemented in a similar way as the generally used empirical models [18, 19, 59]. There isno need to improve the description by using a double Arrhenius function, such as the logR−fat function [124], which involves up to five adjustable parameters. By increasing thesterility criterion S by 50% the model gives a fair overall description of the temperature-time combinations of the MRC [31]. It has the major advantage that it is applicable in theentire temperature range where the Arrhenius equation can be applied. For sterilizationof aqueous liquids or surface steam sterilization this temperature range extends at leastfrom 115 to 134 ◦C, as is shown by the perfect fit of our model to the data of Perkins.As long as the dominant killing process is coagulation, which is basically a mechanisticprocess, the Arrhenius equation remains valid. To investigate this point in detail, it maybe worthwhile to supplement the data of Perkins with data at temperatures between, e.g.105 and 115 ◦C.
The model can be implemented rather directly in the computer program used to collect
5.4 Discussion 51
and analyse the data during validation and monitoring of a sterilization process. Anotheradvantage of the use of this model is that no false sense of safety is introduced andproducts are not exposed to high temperatures longer than necessary. This will result insterilized products, saving energy and costs.
In its present simple form, our model cannot directly be used to optimize the thermalpreservation cycles used in the food industry (see, for instance, [125]). Various experimentson the death kinetics of some microorganisms that are relevant for food product qualityshow significant deviations from log-linear behaviour, in the form of ‘shoulders’, lags andtails [124]. If data on the death kinetics of all relevant micro-organisms would be availablefrom controlled experiments in the entire temperature range of interest, a mathematicalmodel might be developed following the approach presented in this chapter, but it wouldbe far more complex.

52 F -, D- and z -values
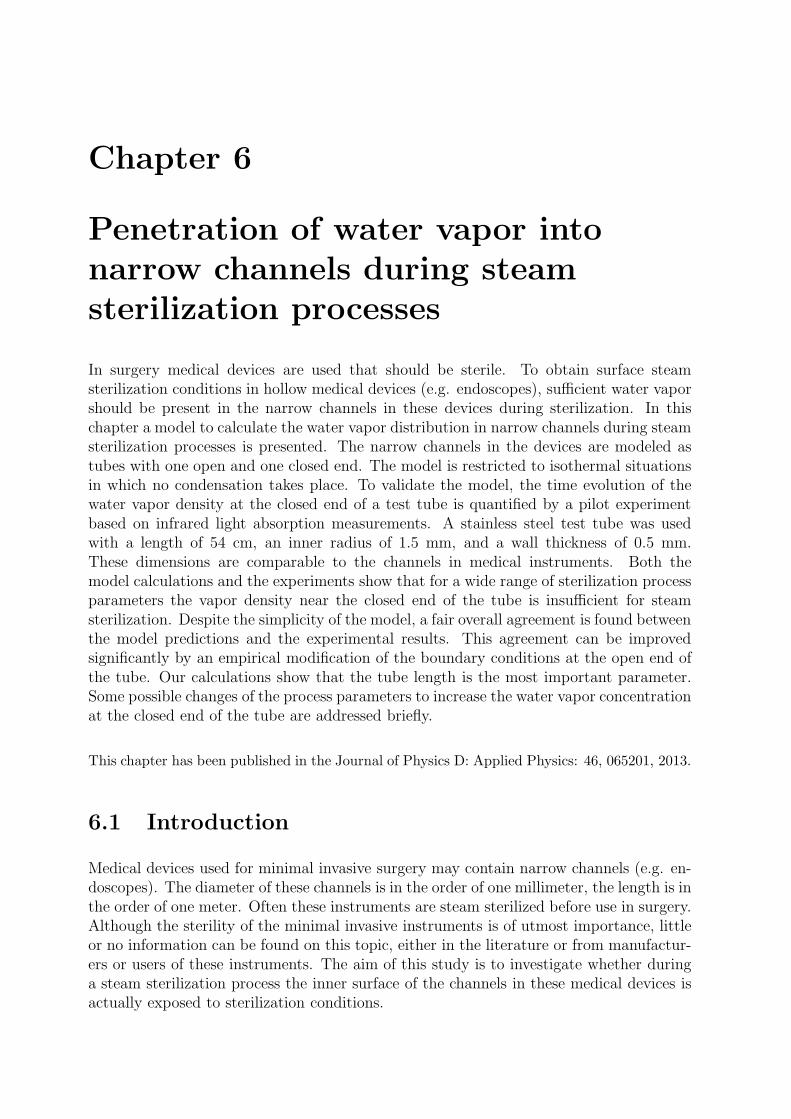
Chapter 6
Penetration of water vapor into
narrow channels during steam
sterilization processes
In surgery medical devices are used that should be sterile. To obtain surface steamsterilization conditions in hollow medical devices (e.g. endoscopes), sufficient water vaporshould be present in the narrow channels in these devices during sterilization. In thischapter a model to calculate the water vapor distribution in narrow channels during steamsterilization processes is presented. The narrow channels in the devices are modeled astubes with one open and one closed end. The model is restricted to isothermal situationsin which no condensation takes place. To validate the model, the time evolution of thewater vapor density at the closed end of a test tube is quantified by a pilot experimentbased on infrared light absorption measurements. A stainless steel test tube was usedwith a length of 54 cm, an inner radius of 1.5 mm, and a wall thickness of 0.5 mm.These dimensions are comparable to the channels in medical instruments. Both themodel calculations and the experiments show that for a wide range of sterilization processparameters the vapor density near the closed end of the tube is insufficient for steamsterilization. Despite the simplicity of the model, a fair overall agreement is found betweenthe model predictions and the experimental results. This agreement can be improvedsignificantly by an empirical modification of the boundary conditions at the open end ofthe tube. Our calculations show that the tube length is the most important parameter.Some possible changes of the process parameters to increase the water vapor concentrationat the closed end of the tube are addressed briefly.
This chapter has been published in the Journal of Physics D: Applied Physics: 46, 065201, 2013.
6.1 Introduction
Medical devices used for minimal invasive surgery may contain narrow channels (e.g. en-doscopes). The diameter of these channels is in the order of one millimeter, the length is inthe order of one meter. Often these instruments are steam sterilized before use in surgery.Although the sterility of the minimal invasive instruments is of utmost importance, littleor no information can be found on this topic, either in the literature or from manufactur-ers or users of these instruments. The aim of this study is to investigate whether duringa steam sterilization process the inner surface of the channels in these medical devices isactually exposed to sterilization conditions.
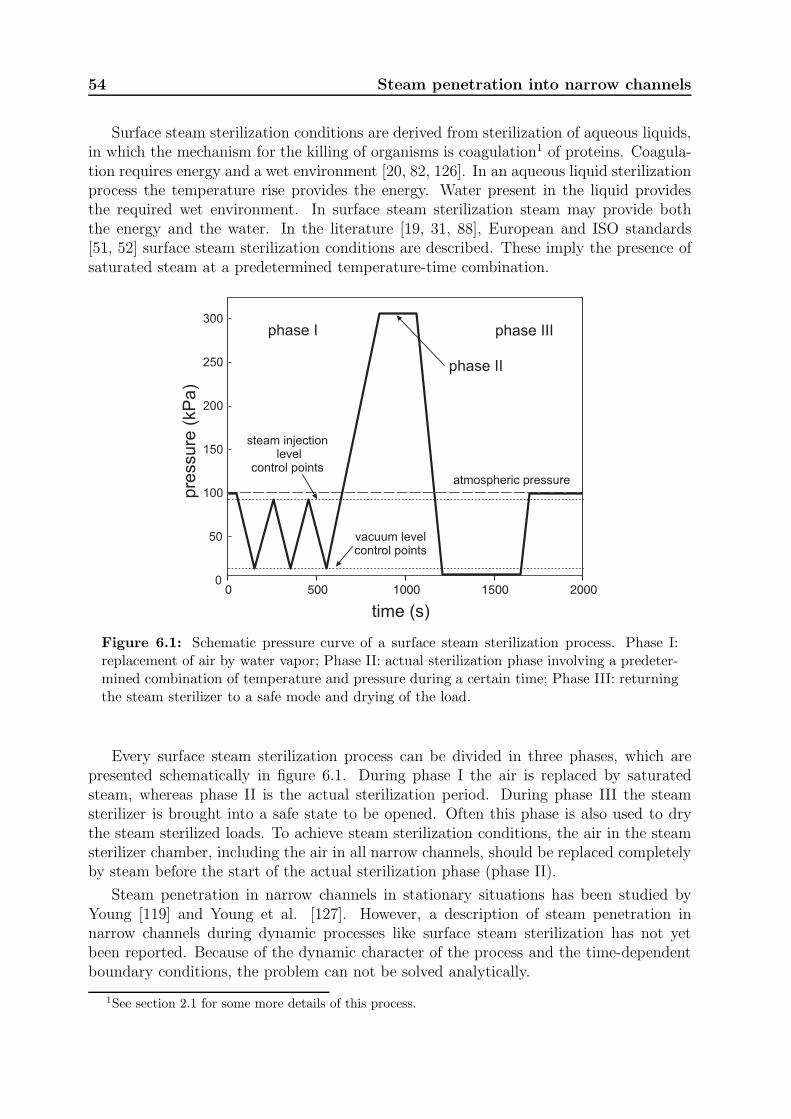
54 Steam penetration into narrow channels
Surface steam sterilization conditions are derived from sterilization of aqueous liquids,in which the mechanism for the killing of organisms is coagulation1 of proteins. Coagula-tion requires energy and a wet environment [20, 82, 126]. In an aqueous liquid sterilizationprocess the temperature rise provides the energy. Water present in the liquid providesthe required wet environment. In surface steam sterilization steam may provide boththe energy and the water. In the literature [19, 31, 88], European and ISO standards[51, 52] surface steam sterilization conditions are described. These imply the presence ofsaturated steam at a predetermined temperature-time combination.
0 500 1000 1500 20000
50
100
150
200
250
300
time (s)
pre
ssure
(kP
a)
atmospheric pressure
vacuum levelcontrol points
steam injectionlevel
control points
phase I
phase II
phase III
Figure 6.1: Schematic pressure curve of a surface steam sterilization process. Phase I:replacement of air by water vapor; Phase II: actual sterilization phase involving a predeter-mined combination of temperature and pressure during a certain time; Phase III: returningthe steam sterilizer to a safe mode and drying of the load.
Every surface steam sterilization process can be divided in three phases, which arepresented schematically in figure 6.1. During phase I the air is replaced by saturatedsteam, whereas phase II is the actual sterilization period. During phase III the steamsterilizer is brought into a safe state to be opened. Often this phase is also used to drythe steam sterilized loads. To achieve steam sterilization conditions, the air in the steamsterilizer chamber, including the air in all narrow channels, should be replaced completelyby steam before the start of the actual sterilization phase (phase II).
Steam penetration in narrow channels in stationary situations has been studied byYoung [119] and Young et al. [127]. However, a description of steam penetration innarrow channels during dynamic processes like surface steam sterilization has not yetbeen reported. Because of the dynamic character of the process and the time-dependentboundary conditions, the problem can not be solved analytically.
1See section 2.1 for some more details of this process.
6.2 Physical model 55
In this chapter we present a model that describes the water vapor distribution ina tube during the first and second phase of a generic steam sterilization process. Insection 6.2 the physical model and its applicability will be discussed. Experiments witha tube with one open and one closed end have have been performed to validate someof the model predictions. Section 6.3 describes the experimental setup. The results ofthe experiments are compared with the corresponding model predictions in section 6.4.Finally, in section 6.5 the results are discussed and some improvements of the model andthe generic sterilization process are suggested.
6.2 Physical model
The process of surface steam sterilization consists of heat transfer and the complete re-placement of air in the steam sterilizer chamber by steam. To obtain surface steamsterilization conditions on the inner surface of the tube the steam has to penetrate thetube to replace the air. According to the European standard [51] a minimum steamfraction of 0.965 is required.
Figure 6.2 schematically presents the model used in this chapter. A steam supplyis connected to the chamber via a steam inlet. To be able to remove gases out of thechamber an outlet with a vacuum pump is connected to the chamber. Valves in the inletand outlet can be opened and closed. Pressurization of the sterilizer chamber is achievedby the injection of steam by opening the steam inlet while the outlet is closed. Evacuationis achieved by pumping away the gas mixture present in the chamber while the steam inletis closed. Initially, only air is present in the steam sterilizer chamber and the tube. Theprocess in the sterilizer chamber is assumed to be ideal: instantaneous mixing of the gasesoccurs, resulting in a homogeneous gas distribution throughout the sterilizer chamber.
steam inlet
gas outlet
sterilizer chamber
tube with narrow channel
Figure 6.2: Schematic representation of the model used in the computations. Duringpressurization steam is injected and the outlet is closed (see figure 2.1). During evacuationthe inlet is closed, the vacuum pump is switched on and the outlet is opened. A tube witha narrow channel is positioned in the steam sterilizer chamber, the closed end up and theopen end down. The tube has no direct thermal contact with the wall.
56 Steam penetration into narrow channels
A medical device with a narrow channel to be sterilized is modeled as a tube positionedin the sterilizer chamber (figure 6.2). The tube is open at one end (x = 0) and closed atthe other end (x = L). The inner radius of the tube is a. The wall of the steam sterilizerchamber is kept at a constant temperature higher than the condensation temperature ofthe steam. Hence no condensation will take place on the wall. At the conditions thatoccur during a steam sterilization process the gas (air) and water vapor act as ideal gases[72, 107]. Therefore the pressure is related to the partial densities ρg and ρv and thetemperature T by:
p = pv + pg = ρvRvT + ρgRgT, (6.1)
where Ri is the specific gas constant of component i and the subscripts v and g representwater vapor and gas, respectively. The total density ρ equals ρv + ρg.
At each chamber pressure increase, i.e. during steam inlet, the spatially averaged gasdensity ρg in the chamber remains constant. At each chamber pressure decrease, thecomposition of the gas-vapor mixture in the chamber does not change. As a consequencethe changes of the composition in the chamber with time are directly related to thepressure p(t).
Next we consider the convection-diffusion process in the tube. In this study only tubeswith large aspect ratios are considered (L ≫ a). The Reynolds number of the flow in thetube (Re = 2ρaV/η, with ρ the density (kgm−3), V the velocity (m s−1), η the viscosity(Pa s)) is smaller than 50. Also the relative pressure difference over the length of the tube((∆p)L/p) is much smaller than unity. Under these conditions the flow inside the tube islocally described by the Poiseuille equation [128]:
u = −a2
8η
∂p
∂x, (6.2)
with u the velocity (m s−1) averaged over the cross-section of the tube and p is the pressure(Pa). The pressure and the water and gas densities in the tube satisfy the ideal gas law(equation 6.1). The conservation of mass in the tube is given by [128]:
∂ρ
∂t+
∂(ρu)
∂x= 0. (6.3)
Fick’s law [128] describes the relation between the diffusion flux and the concentrationgradients. Using this law the equation for the conservation of mass of component ibecomes [128]:
∂ρi∂t
+∂ρiu
∂x=
∂
∂x
(
ρD∗∂(ρi/ρ)
∂x
)
. (6.4)
D∗ is a modified diffusion coefficient, which appears because of the radial dependence ofthe velocity (Taylor dispersion) [129, 130]. Using the dimensionless Peclet number (Pe)and time (ǫ):
Pe =au
D, ǫ =
Dt
a2, (6.5)
the modified diffusion coefficient can be determined [129, 131, 132]. The typical diffusioncoefficient (D) for water vapor in air is in the order of 10−5 m2 s−1 at atmospheric condi-tions. The radius (a) of a modeled tube is typically 1 mm. Depending on the x-position in
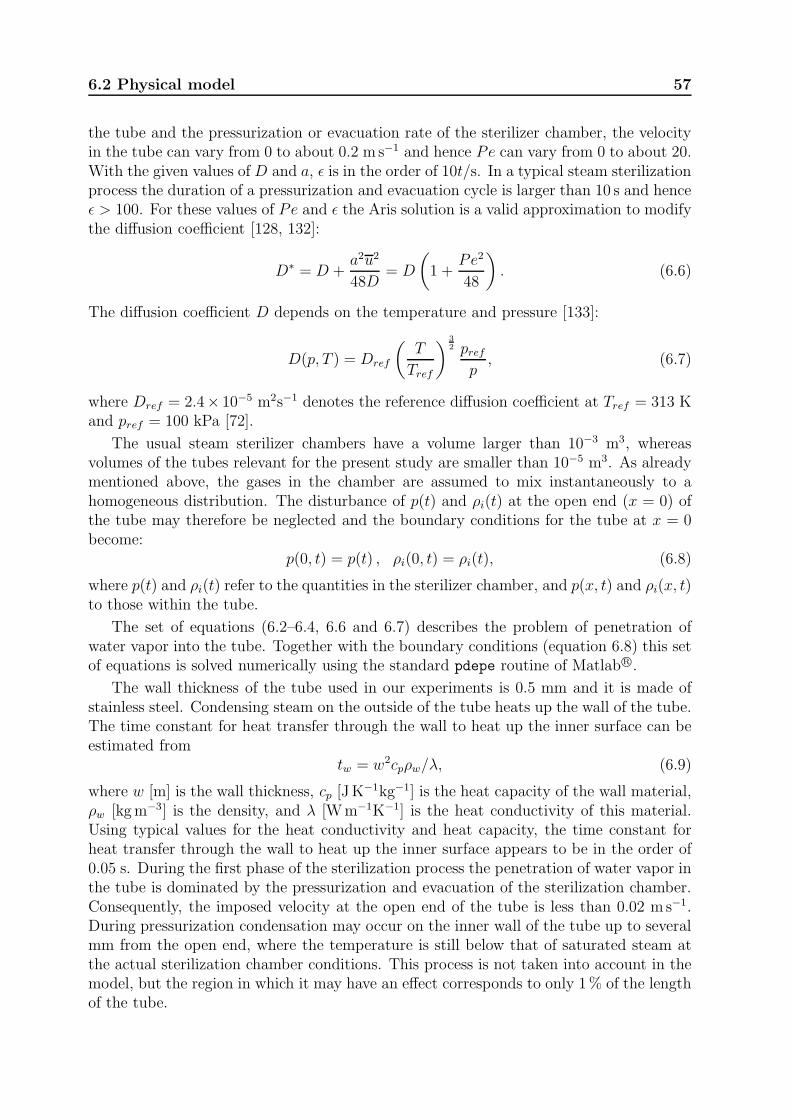
6.2 Physical model 57
the tube and the pressurization or evacuation rate of the sterilizer chamber, the velocityin the tube can vary from 0 to about 0.2 m s−1 and hence Pe can vary from 0 to about 20.With the given values of D and a, ǫ is in the order of 10t/s. In a typical steam sterilizationprocess the duration of a pressurization and evacuation cycle is larger than 10 s and henceǫ > 100. For these values of Pe and ǫ the Aris solution is a valid approximation to modifythe diffusion coefficient [128, 132]:
D∗ = D +a2u2
48D= D
(
1 +Pe2
48
)
. (6.6)
The diffusion coefficient D depends on the temperature and pressure [133]:
D(p, T ) = Dref
(
T
Tref
)3
2 prefp
, (6.7)
where Dref = 2.4× 10⁻⁵ m2s−1 denotes the reference diffusion coefficient at Tref = 313 Kand pref = 100 kPa [72].
The usual steam sterilizer chambers have a volume larger than 10−3 m3, whereasvolumes of the tubes relevant for the present study are smaller than 10−5 m3. As alreadymentioned above, the gases in the chamber are assumed to mix instantaneously to ahomogeneous distribution. The disturbance of p(t) and ρi(t) at the open end (x = 0) ofthe tube may therefore be neglected and the boundary conditions for the tube at x = 0become:
p(0, t) = p(t) , ρi(0, t) = ρi(t), (6.8)
where p(t) and ρi(t) refer to the quantities in the sterilizer chamber, and p(x, t) and ρi(x, t)to those within the tube.
The set of equations (6.2–6.4, 6.6 and 6.7) describes the problem of penetration ofwater vapor into the tube. Together with the boundary conditions (equation 6.8) this setof equations is solved numerically using the standard pdepe routine of MatlabR©.
The wall thickness of the tube used in our experiments is 0.5 mm and it is made ofstainless steel. Condensing steam on the outside of the tube heats up the wall of the tube.The time constant for heat transfer through the wall to heat up the inner surface can beestimated from
tw = w2cpρw/λ, (6.9)
where w [m] is the wall thickness, cp [JK−1kg−1] is the heat capacity of the wall material,
ρw [kgm−3] is the density, and λ [Wm−1K−1] is the heat conductivity of this material.Using typical values for the heat conductivity and heat capacity, the time constant forheat transfer through the wall to heat up the inner surface appears to be in the order of0.05 s. During the first phase of the sterilization process the penetration of water vapor inthe tube is dominated by the pressurization and evacuation of the sterilization chamber.Consequently, the imposed velocity at the open end of the tube is less than 0.02 m s−1.During pressurization condensation may occur on the inner wall of the tube up to severalmm from the open end, where the temperature is still below that of saturated steam atthe actual sterilization chamber conditions. This process is not taken into account in themodel, but the region in which it may have an effect corresponds to only 1% of the lengthof the tube.
58 Steam penetration into narrow channels
0 0.1 0.2 0.3 0.4 0.50
0.2
0.4
0.6
0.8
1
x (m)
c (
-)v
SCP 1
SCP 2
SP
SP + 210 s
SP + 900 s
Figure 6.3: Calculated water vapor distribution cv in a tube that is positioned as indicatedin figure 6.2 during a generic process depicted in figure 6.1. The process has Vacuum ControlPoints (VCPs) of 20 kPa and Steam injection Control Points (SCPs) of 99 kPa. The tubehas a length L = 54 cm, a radius of 1.5 mm and a wall thickness of 0.5 mm. The open andclosed end of the tube correspond to x = 0 and x = L, respectively. The behavior of cv(x)is given at both SCPs, the start of the sterilization phase (SP), and 210 s and 900 s later.
With the model mass fractions or concentrations of vapor and air can be calculatedas a function of position and time. As already mentioned above, for steam sterilizationthe water vapor concentration in the tube, cv(x, t) = ρv(x, t)/ρv=100%, is an important pa-rameter. In figure 6.3 the calculated behavior of cv(x) is plotted for both Steam InjectionControl Points (SCPs), the start of the sterilization phase (SP), and for times 210 s and900 s later. This figure shows that after each evacuation and subsequent pressurizationcycle the vapor concentration at x = 0 has increased. This is a result of the dilution ofthe residual air in the chamber, which is rather significant at this rather high value of theVacuum Control Points.
After the first evacuation, upon pressurizing the sterilization chamber with steam, amixture with a relatively high cv enters the tube and drives the residual air towards a smallregion near the closed end. During this process the front between the mixture and theresidual air broadens because of diffusion (the diffusion length
√Dt at t = 100 s is in the
range of 5− 15 cm, see equation 6.7), but only a small amount of steam penetrates untilthe closed end of the tube. Nevertheless, after the subsequent evacuation the residualmixture in the tube will contain a certain fraction of vapor. During each subsequentpressurization cycle, the steam penetration in the tube increases, partly because of theincreasing value of cv in the sterilization chamber, but mainly because after the precedingevacuation cycle the vapor fraction in the residual mixture in the tube is higher.
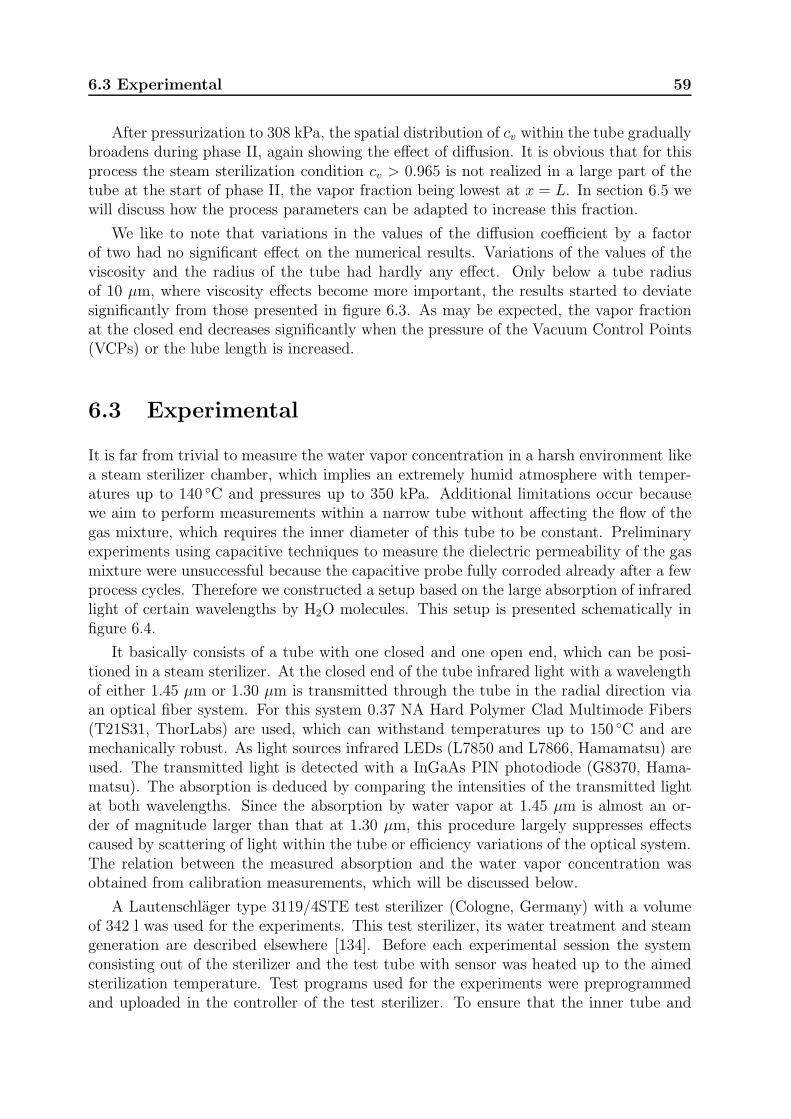
6.3 Experimental 59
After pressurization to 308 kPa, the spatial distribution of cv within the tube graduallybroadens during phase II, again showing the effect of diffusion. It is obvious that for thisprocess the steam sterilization condition cv > 0.965 is not realized in a large part of thetube at the start of phase II, the vapor fraction being lowest at x = L. In section 6.5 wewill discuss how the process parameters can be adapted to increase this fraction.
We like to note that variations in the values of the diffusion coefficient by a factorof two had no significant effect on the numerical results. Variations of the values of theviscosity and the radius of the tube had hardly any effect. Only below a tube radiusof 10 µm, where viscosity effects become more important, the results started to deviatesignificantly from those presented in figure 6.3. As may be expected, the vapor fractionat the closed end decreases significantly when the pressure of the Vacuum Control Points(VCPs) or the lube length is increased.
6.3 Experimental
It is far from trivial to measure the water vapor concentration in a harsh environment likea steam sterilizer chamber, which implies an extremely humid atmosphere with temper-atures up to 140 ◦C and pressures up to 350 kPa. Additional limitations occur becausewe aim to perform measurements within a narrow tube without affecting the flow of thegas mixture, which requires the inner diameter of this tube to be constant. Preliminaryexperiments using capacitive techniques to measure the dielectric permeability of the gasmixture were unsuccessful because the capacitive probe fully corroded already after a fewprocess cycles. Therefore we constructed a setup based on the large absorption of infraredlight of certain wavelengths by H2O molecules. This setup is presented schematically infigure 6.4.
It basically consists of a tube with one closed and one open end, which can be posi-tioned in a steam sterilizer. At the closed end of the tube infrared light with a wavelengthof either 1.45 µm or 1.30 µm is transmitted through the tube in the radial direction viaan optical fiber system. For this system 0.37 NA Hard Polymer Clad Multimode Fibers(T21S31, ThorLabs) are used, which can withstand temperatures up to 150 ◦C and aremechanically robust. As light sources infrared LEDs (L7850 and L7866, Hamamatsu) areused. The transmitted light is detected with a InGaAs PIN photodiode (G8370, Hama-matsu). The absorption is deduced by comparing the intensities of the transmitted lightat both wavelengths. Since the absorption by water vapor at 1.45 µm is almost an or-der of magnitude larger than that at 1.30 µm, this procedure largely suppresses effectscaused by scattering of light within the tube or efficiency variations of the optical system.The relation between the measured absorption and the water vapor concentration wasobtained from calibration measurements, which will be discussed below.
A Lautenschlager type 3119/4STE test sterilizer (Cologne, Germany) with a volumeof 342 l was used for the experiments. This test sterilizer, its water treatment and steamgeneration are described elsewhere [134]. Before each experimental session the systemconsisting out of the sterilizer and the test tube with sensor was heated up to the aimedsterilization temperature. Test programs used for the experiments were preprogrammedand uploaded in the controller of the test sterilizer. To ensure that the inner tube and
60 Steam penetration into narrow channels
light fiber
light inlight out
metal tube
open end to sterilizer chamber
Figure 6.4: Schematic representation of the test tube with water vapor sensor. The tubehas an open and a closed end. It is positioned with the closed end pointing upwards inthe test sterilizer and the open end downwards. At the closed end of the tube (x = L) aninfrared light beam is emitted into the tube via a glass fiber. At the opposite side of thetube a second fiber is receiving the light that is transmitted through the gas mixture in thetube.
sensor were dry at the start of an experiment, the sterilizer chamber with the tube in-cluding the sensor was evacuated to a pressure lower than 5 kPa and kept for 15 minutesat that pressure, before an experiment was started.
The absorption α(t) was obtained from
α(t) =I(1.30)− I(1.45)
I(1.30), (6.10)
where I(1.30) and I(1.45) represent the output voltages of the detector for wavelengthsof 1.30 µm and 1.45 µm, respectively. To relate the values of α(t) to the amount of watervapor, a two-point calibration of the system has been performed.The value of α measuredafter switching on the system in the laboratory (environmental relative humidity 30%)was set to zero by balancing the light intensity of both LEDs. Placing the system in asterilizer chamber that was subsequently evacuated to about 5 kPa did not result in asignificant shift of the zero offset; also pressurizing the chamber with air did not have anoticeable effect. Next, two processes were performed that according to the model wouldresult in nearly 100% saturated steam at the closed end of the tube at the start of thesterilization phase. These will be described in the next section.
6.4 Results
Two processes that according to the model would result in nearly 100% saturated steamat the closed end of the tube at the start of the sterilization phase are a generic process asdepicted in figure 6.1 with Vacuum Control Points (VCPs) of 5 kPa and Steam injection
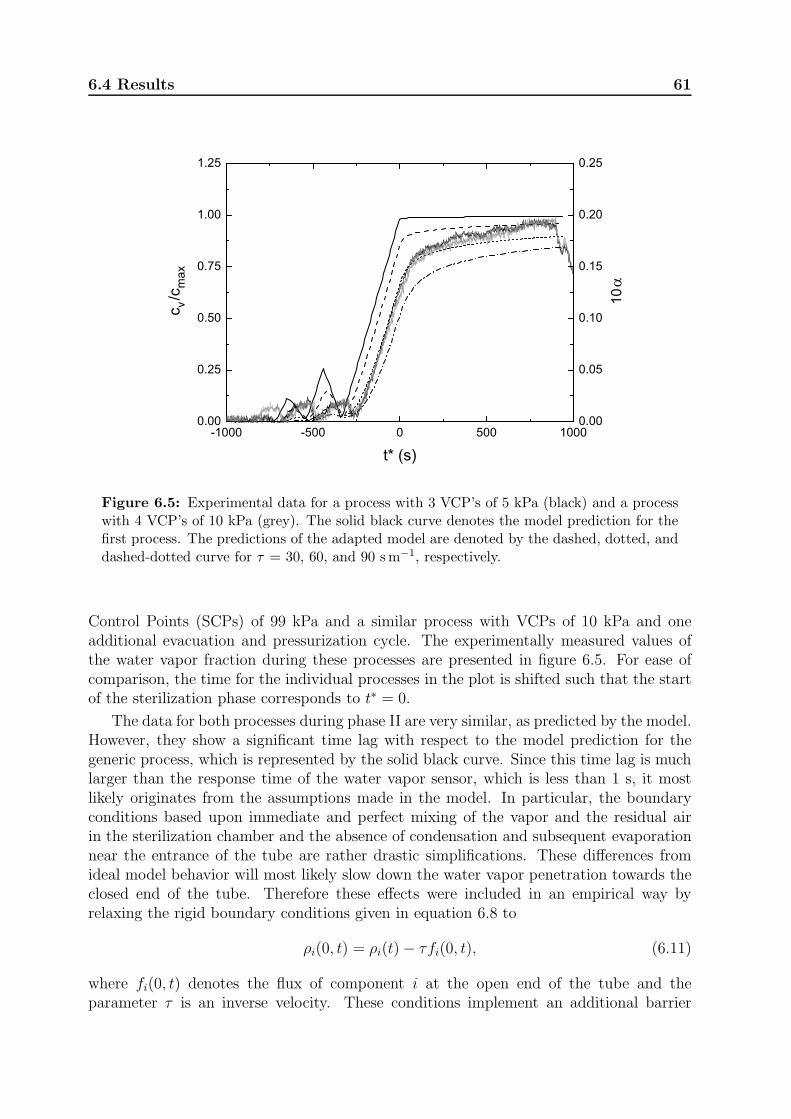
6.4 Results 61
-1000 -500 0 500 10000.00
0.25
0.50
0.75
1.00
1.25
c v /c
max
t* (s)
0.00
0.05
0.10
0.15
0.20
0.25
10
Figure 6.5: Experimental data for a process with 3 VCP’s of 5 kPa (black) and a processwith 4 VCP’s of 10 kPa (grey). The solid black curve denotes the model prediction for thefirst process. The predictions of the adapted model are denoted by the dashed, dotted, anddashed-dotted curve for τ = 30, 60, and 90 sm−1, respectively.
Control Points (SCPs) of 99 kPa and a similar process with VCPs of 10 kPa and oneadditional evacuation and pressurization cycle. The experimentally measured values ofthe water vapor fraction during these processes are presented in figure 6.5. For ease ofcomparison, the time for the individual processes in the plot is shifted such that the startof the sterilization phase corresponds to t∗ = 0.
The data for both processes during phase II are very similar, as predicted by the model.However, they show a significant time lag with respect to the model prediction for thegeneric process, which is represented by the solid black curve. Since this time lag is muchlarger than the response time of the water vapor sensor, which is less than 1 s, it mostlikely originates from the assumptions made in the model. In particular, the boundaryconditions based upon immediate and perfect mixing of the vapor and the residual airin the sterilization chamber and the absence of condensation and subsequent evaporationnear the entrance of the tube are rather drastic simplifications. These differences fromideal model behavior will most likely slow down the water vapor penetration towards theclosed end of the tube. Therefore these effects were included in an empirical way byrelaxing the rigid boundary conditions given in equation 6.8 to
ρi(0, t) = ρi(t)− τfi(0, t), (6.11)
where fi(0, t) denotes the flux of component i at the open end of the tube and theparameter τ is an inverse velocity. These conditions implement an additional barrier
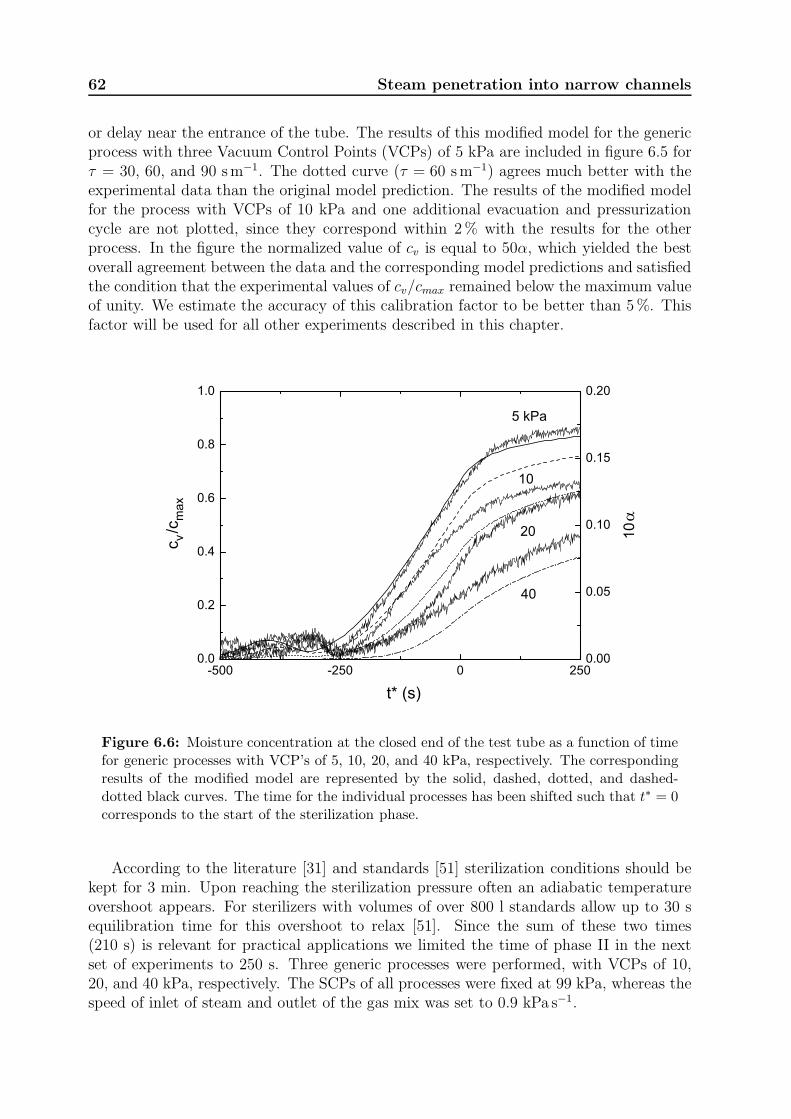
62 Steam penetration into narrow channels
or delay near the entrance of the tube. The results of this modified model for the genericprocess with three Vacuum Control Points (VCPs) of 5 kPa are included in figure 6.5 forτ = 30, 60, and 90 sm−1. The dotted curve (τ = 60 sm−1) agrees much better with theexperimental data than the original model prediction. The results of the modified modelfor the process with VCPs of 10 kPa and one additional evacuation and pressurizationcycle are not plotted, since they correspond within 2% with the results for the otherprocess. In the figure the normalized value of cv is equal to 50α, which yielded the bestoverall agreement between the data and the corresponding model predictions and satisfiedthe condition that the experimental values of cv/cmax remained below the maximum valueof unity. We estimate the accuracy of this calibration factor to be better than 5%. Thisfactor will be used for all other experiments described in this chapter.
-500 -250 0 2500.0
0.2
0.4
0.6
0.8
1.0
c v /c
max
t* (s)
5 kPa
10
20
40
0.00
0.05
0.10
0.15
0.20
10
Figure 6.6: Moisture concentration at the closed end of the test tube as a function of timefor generic processes with VCP’s of 5, 10, 20, and 40 kPa, respectively. The correspondingresults of the modified model are represented by the solid, dashed, dotted, and dashed-dotted black curves. The time for the individual processes has been shifted such that t∗ = 0corresponds to the start of the sterilization phase.
According to the literature [31] and standards [51] sterilization conditions should bekept for 3 min. Upon reaching the sterilization pressure often an adiabatic temperatureovershoot appears. For sterilizers with volumes of over 800 l standards allow up to 30 sequilibration time for this overshoot to relax [51]. Since the sum of these two times(210 s) is relevant for practical applications we limited the time of phase II in the nextset of experiments to 250 s. Three generic processes were performed, with VCPs of 10,20, and 40 kPa, respectively. The SCPs of all processes were fixed at 99 kPa, whereas thespeed of inlet of steam and outlet of the gas mix was set to 0.9 kPa s−1.
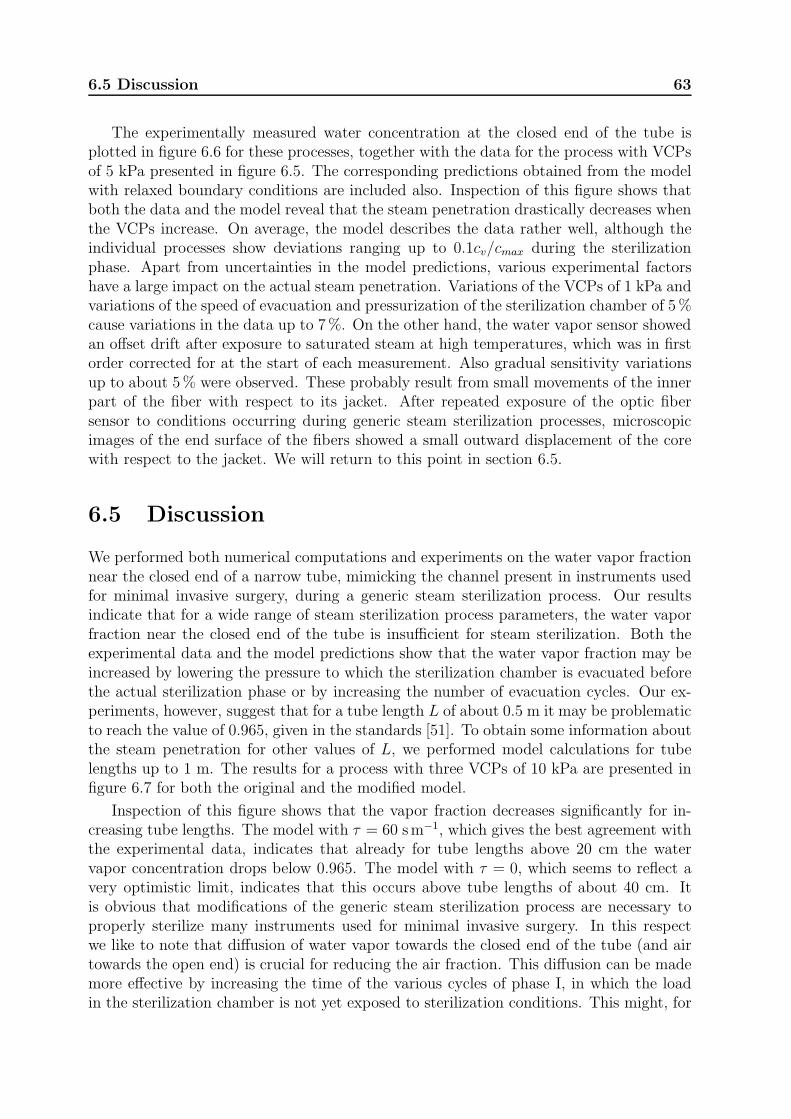
6.5 Discussion 63
The experimentally measured water concentration at the closed end of the tube isplotted in figure 6.6 for these processes, together with the data for the process with VCPsof 5 kPa presented in figure 6.5. The corresponding predictions obtained from the modelwith relaxed boundary conditions are included also. Inspection of this figure shows thatboth the data and the model reveal that the steam penetration drastically decreases whenthe VCPs increase. On average, the model describes the data rather well, although theindividual processes show deviations ranging up to 0.1cv/cmax during the sterilizationphase. Apart from uncertainties in the model predictions, various experimental factorshave a large impact on the actual steam penetration. Variations of the VCPs of 1 kPa andvariations of the speed of evacuation and pressurization of the sterilization chamber of 5%cause variations in the data up to 7%. On the other hand, the water vapor sensor showedan offset drift after exposure to saturated steam at high temperatures, which was in firstorder corrected for at the start of each measurement. Also gradual sensitivity variationsup to about 5% were observed. These probably result from small movements of the innerpart of the fiber with respect to its jacket. After repeated exposure of the optic fibersensor to conditions occurring during generic steam sterilization processes, microscopicimages of the end surface of the fibers showed a small outward displacement of the corewith respect to the jacket. We will return to this point in section 6.5.
6.5 Discussion
We performed both numerical computations and experiments on the water vapor fractionnear the closed end of a narrow tube, mimicking the channel present in instruments usedfor minimal invasive surgery, during a generic steam sterilization process. Our resultsindicate that for a wide range of steam sterilization process parameters, the water vaporfraction near the closed end of the tube is insufficient for steam sterilization. Both theexperimental data and the model predictions show that the water vapor fraction may beincreased by lowering the pressure to which the sterilization chamber is evacuated beforethe actual sterilization phase or by increasing the number of evacuation cycles. Our ex-periments, however, suggest that for a tube length L of about 0.5 m it may be problematicto reach the value of 0.965, given in the standards [51]. To obtain some information aboutthe steam penetration for other values of L, we performed model calculations for tubelengths up to 1 m. The results for a process with three VCPs of 10 kPa are presented infigure 6.7 for both the original and the modified model.
Inspection of this figure shows that the vapor fraction decreases significantly for in-creasing tube lengths. The model with τ = 60 sm−1, which gives the best agreement withthe experimental data, indicates that already for tube lengths above 20 cm the watervapor concentration drops below 0.965. The model with τ = 0, which seems to reflect avery optimistic limit, indicates that this occurs above tube lengths of about 40 cm. Itis obvious that modifications of the generic steam sterilization process are necessary toproperly sterilize many instruments used for minimal invasive surgery. In this respectwe like to note that diffusion of water vapor towards the closed end of the tube (and airtowards the open end) is crucial for reducing the air fraction. This diffusion can be mademore effective by increasing the time of the various cycles of phase I, in which the loadin the sterilization chamber is not yet exposed to sterilization conditions. This might, for
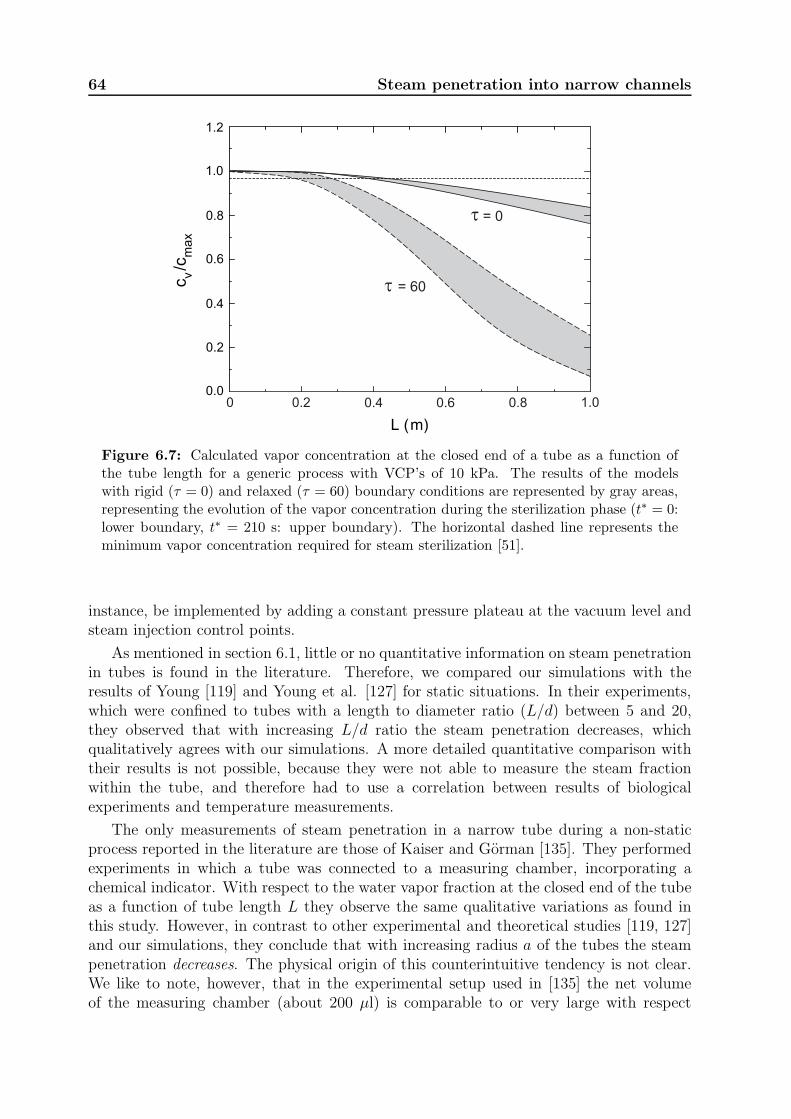
64 Steam penetration into narrow channels
t = 60
t = 0
0 0.2 0.4 0.6 0.8 1.0
Figure 6.7: Calculated vapor concentration at the closed end of a tube as a function ofthe tube length for a generic process with VCP’s of 10 kPa. The results of the modelswith rigid (τ = 0) and relaxed (τ = 60) boundary conditions are represented by gray areas,representing the evolution of the vapor concentration during the sterilization phase (t∗ = 0:lower boundary, t∗ = 210 s: upper boundary). The horizontal dashed line represents theminimum vapor concentration required for steam sterilization [51].
instance, be implemented by adding a constant pressure plateau at the vacuum level andsteam injection control points.
As mentioned in section 6.1, little or no quantitative information on steam penetrationin tubes is found in the literature. Therefore, we compared our simulations with theresults of Young [119] and Young et al. [127] for static situations. In their experiments,which were confined to tubes with a length to diameter ratio (L/d) between 5 and 20,they observed that with increasing L/d ratio the steam penetration decreases, whichqualitatively agrees with our simulations. A more detailed quantitative comparison withtheir results is not possible, because they were not able to measure the steam fractionwithin the tube, and therefore had to use a correlation between results of biologicalexperiments and temperature measurements.
The only measurements of steam penetration in a narrow tube during a non-staticprocess reported in the literature are those of Kaiser and Gorman [135]. They performedexperiments in which a tube was connected to a measuring chamber, incorporating achemical indicator. With respect to the water vapor fraction at the closed end of the tubeas a function of tube length L they observe the same qualitative variations as found inthis study. However, in contrast to other experimental and theoretical studies [119, 127]and our simulations, they conclude that with increasing radius a of the tubes the steampenetration decreases. The physical origin of this counterintuitive tendency is not clear.We like to note, however, that in the experimental setup used in [135] the net volumeof the measuring chamber (about 200 µl) is comparable to or very large with respect
6.5 Discussion 65
to the volume of the actual test tube (1.5 − 300 µl). Such a large additional volumeat the dead end of the test tube will have a dramatic effect on the pressurization andevacuation dynamics, which depends on the tube geometry. For this reason, this setup isnot representative for the medical devices that are used in practice and modeled in oursimulations.
The experimental setup described in section 6.3 enabled us to measure the water vaporconcentration at the closed end of a narrow tube without disturbing the flow pattern. Toour knowledge, no comparable measurements have been reported yet. The observed zerooffset drift and sensitivity variations of the measurements can probably be reduced byusing other types of optical fibers or changing their mechanical attachment to the testtube. Apart from this, a more straightforward calibration of the sensor may be achievedby using a tube length below 10 cm, in which the vapor concentration during phase II ofa generic process will be almost unity. In this respect we like to note that the use of thesensor without a tube in a sterilization process appeared to be problematic, since in thatconfiguration condensing droplets on the fiber ends induce very large irregular absorptionsignals.
It is obvious that various extensions may improve the accuracy of the current model.For instance, a finite heat capacity of the wall and its effect on the condensation andevaporation inside the tube during a non isothermal steam sterilization process may beincluded. On the other hand, since the tube length L is a very dominant parameter,experiments for various tube lengths will probably give information on modifications thatare actually necessary to enable the use of the model as a tool to calculate the steampenetration in practical situations. This will be a topic of future studies.

66 Steam penetration into narrow channels
Chapter 7
Measuring non condensible gases
during steam sterilization processes
In surgery medical devices are used that should be sterile. To obtain surface steamsterilization conditions, not only in the sterilizer chamber itself but also in the loads to besterilized, the amount of non condensible gases (NCGs), for instance air, should be verylow. Even rather small fractions of NCGs (below 1%) seriously hamper steam penetrationin porous materials or devices with hollow channels (e.g. endoscopes). Traditional steampenetration tests have not been developed for the latter type of instruments and oftenyield results of limited use. One of the instruments which according to the manufacturercan detect the presence of residual NCGs in a reliable and reproducible way is the 3MTM
Electronic Test System (ETS). In this paper a physical model is presented that describesthe behavior of this instrument during a typical steam sterilization process. This modelhas been validated by experiments in which known fractions of NCGs were introducedin a sterilizer chamber in which an ETS was placed. Despite several approximationsmade in the model, a good agreement is found between the model predictions and theexperimental results. Our calculations reveal that the ETS is very sensitive to residualNCGs that are present in the sterilizer chamber before sterilization. These NCGs indeedimpair the steam penetration in hollow channels. However, the ETS is also very sensitiveto NCGs present in the steam supplied to the sterilizer, of which the effect on steampenetration is much smaller. The consequences of these observations for the use of theETS in practical applications are addressed briefly.
7.1 Introduction
Sterilization of medical devices is a crucial part of preventing device-related infectionsin hospitals. Worldwide, steam sterilization is the most applied sterilization method forsurface sterilization of surgical instruments. Surface steam sterilization conditions arederived from sterilization of aqueous liquids, in which the mechanism for the killing of or-ganisms is coagulation1. Coagulation requires energy and a wet environment [20, 82, 104].In an aqueous liquid sterilization process the added energy is used to raise the temper-ature. Water present in the liquid provides the required wet environment. In surfacesteam sterilization steam may provide both the energy and the water. In the literature[19, 31, 88] and in European and ISO standards [51, 52] surface steam sterilization condi-tions are described. These imply that 100% water vapor has to be present on the surfaceat a certain temperature for a certain time [31, 104], for example, saturated steam at
1See section 2.1 for some more details of this process.
68 Measuring NCGs during steam sterilization
134 ◦C for 3 minutes. To establish these conditions, the air that is initially present inthe sterilizer chamber has to be replaced by saturated steam. This should occur duringthe first phase of a sterilization process, which is illustrated in figure 7.1. During thesecond phase, the sterilization phase, the established sterilization conditions have to bemaintained for a certain time. During the third phase the sterilizer is brought to a safestate to be opened. In production processes this means that the load has to be dry andthat the pressure in the sterilizer chamber is equal to ambient pressure.
0 500 1000 1500 20000
50
100
150
200
250
300
time (s)
pre
ssure
(kP
a)
atmospheric pressure
vacuum levelcontrol points
steam injectionlevel
control points
phase I
phase II
phase III
ps
pv
pa
Figure 7.1: The three phases of a steam sterilization process. Phase I, conditioningphase: air present in the sterilizer chamber is replaced by steam and the aimed sterilizationtemperature is reached. To this end the sterilizer chamber is evacuated several times downto a pressure pv and subsequently filled with steam to a pressure ps. Phase II, sterilizationphase: the actual sterilization period. Phase III, coming to a safe state to open: the pressureis brought to ambient pressure and the load is dried.
To check if during a process steam sterilization conditions are or have been met in thesterilization chamber, various techniques are available, each with their specific advantagesand disadvantages. Most generally used in practice are physical measurements of temper-ature and pressure [51, 53], or measurements based on biological [77, 78] or chemical [79]indicators.
If small amounts (about 1% or more) of non condensible gases, like air, are presentin the sterilization chamber at the start of the sterilization phase, steam sterilizationconditions may still be met on the surfaces of the load that are exposed directly to thesteam [19, 20, 31], but the penetration of steam in, for instance, porous materials ornarrow channels might be seriously impaired. A possible lack of steam penetration wasalready recognized half a century ago, and led to the development of the Bowie and Dick(B&D) steam penetration test [32]. This original steam penetration test uses a chemicalindicator to judge the penetration of steam through a pack of porous textile towels (seeappendix A.2).
7.1 Introduction 69
Since the introduction of the B&D test in 1963 textile loads are less frequently present,whereas loads with surgical instruments have gradually become more common. Further-more, during the last two decades Minimal Invasive Surgery (MIS) has developed rapidly.Instruments used for MIS often contain hollow channels with diameters of 1 mm or smallerand lengths up to over 1 m. The inner surfaces of these channels have to be sterilizedas well. Unfortunately, a direct measurement of the steam penetration in such channelsis not (yet) possible in practice. Recently, we have performed model calculations andexperiments on a test tube mimicking the channels present in medical instruments [136].This study revealed that a significant fraction of the commonly used sterilization processesmay fail to reduce the amount of NCGs to a level which is sufficiently low for sterilizationof the inner part of such instruments. Since no direct relation has been found betweenthe results of a B&D test and the amount of NCGs in the sterilizer chamber, alternativemethods for the detection of residual amounts of NCGs to assess the performance of asterilizer or sterilization process would be very helpful.
The concentration of NCGs can be derived indirectly from the steam saturation, whichcan be calculated from the measured temperature and pressure, but this approach is ratherinaccurate for small concentrations of NCGs [118].2 On the other hand, small amountsof air can in principle be measured accurately by an Oxygen Analyzer. This instrument,however, has the drawback that it is generally designed to measure a dry gas mixtureat a constant (often rather high) temperature. Hence it cannot be used to measure thegas mixture in the sterilizer chamber directly, because this mixture contains a largelyvarying amount water vapor and varies in temperature between room temperature andabout 410 K. Therefore samples of the gas mixture should be taken, which next have tobe analyzed at a fixed temperature. This hampers a real-time monitoring of the fractionof NCGs. An alternative approach is to measure parameters that are very sensitive tothe presence of small amounts of NCGs, like the speed of condensation and the resultingheat transfer from steam to surface (see for instance [137, 138]). This latter approach isimplemented in a commercially available test device, the ETS (3MTM, Neuss, Germany),but detailed physical specifications of this instrument are not reported. In this chaptera physical model is presented that describes the behavior of this instrument during atypical steam sterilization process. This model has been validated by experiments inwhich known fractions of NCGs were introduced in a sterilizer chamber in which an ETSwas placed. The chapter is organized as follows. In section 7.2 the principle of the ETSwill be outlined. The physical modeling of this instrument will be described in section7.3. The experimental procedure and the results of our measurements will be presentedin section 7.4. In section 7.5 the model predictions will be compared with the data andthe model parameters will be evaluated. The chapter will be concluded with a discussionin section 7.6, where also the added value of the ETS in practical sterilization processeswill be addressed briefly.
2In figure 4.3 the temperature tolerance bands for steam sterilization with 100% saturated steam at134 ◦C are presented for representative experimental inaccuracies in the pressure and temperature. A largepart of the regions reflecting the experimental measurements is outside the gray area where sterilizationconditions are established according to the standards [51, 94, 95, 97, 98]. This shows that, using thesestandards, direct measurements of temperature and pressure are insufficient to ensure saturated steamconditions in the sterilizer chamber.
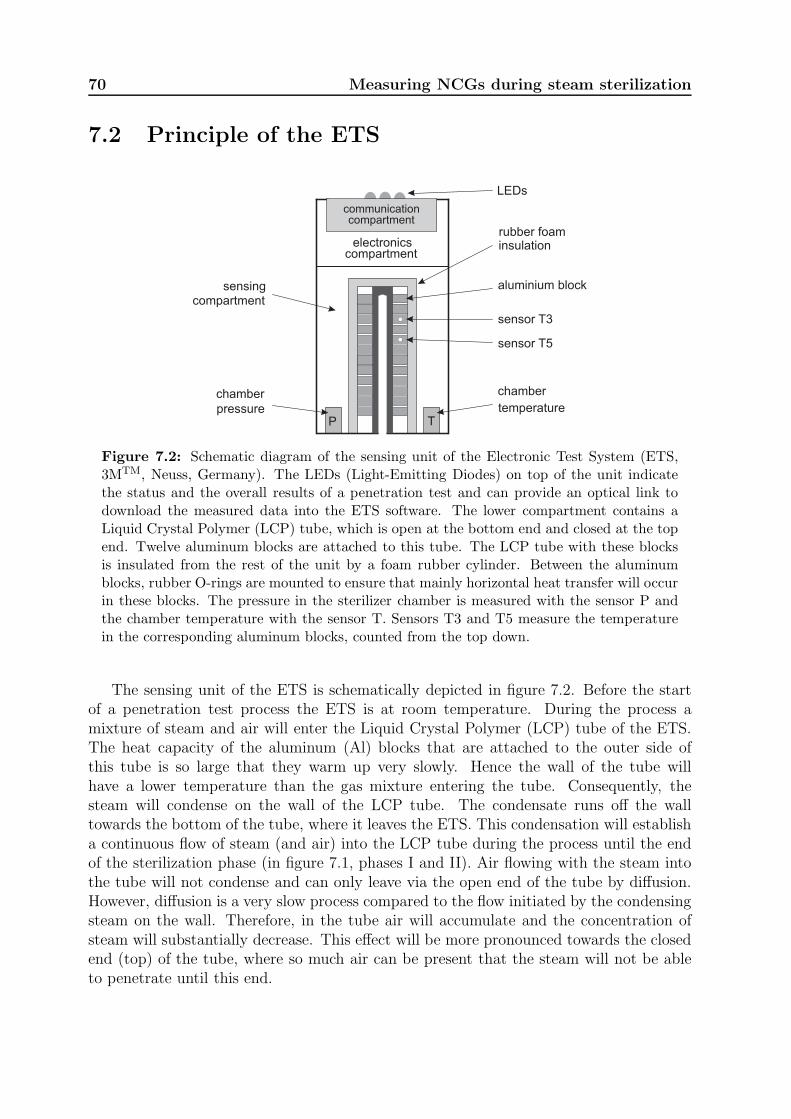
70 Measuring NCGs during steam sterilization
7.2 Principle of the ETS
electronicscompartment
rubber foaminsulation
sensor T3
sensor T5
aluminium block
LEDs
sensingcompartment
P T
chamber
pressure
chamber
temperature
communicationcompartment
Figure 7.2: Schematic diagram of the sensing unit of the Electronic Test System (ETS,3MTM, Neuss, Germany). The LEDs (Light-Emitting Diodes) on top of the unit indicatethe status and the overall results of a penetration test and can provide an optical link todownload the measured data into the ETS software. The lower compartment contains aLiquid Crystal Polymer (LCP) tube, which is open at the bottom end and closed at the topend. Twelve aluminum blocks are attached to this tube. The LCP tube with these blocksis insulated from the rest of the unit by a foam rubber cylinder. Between the aluminumblocks, rubber O-rings are mounted to ensure that mainly horizontal heat transfer will occurin these blocks. The pressure in the sterilizer chamber is measured with the sensor P andthe chamber temperature with the sensor T. Sensors T3 and T5 measure the temperaturein the corresponding aluminum blocks, counted from the top down.
The sensing unit of the ETS is schematically depicted in figure 7.2. Before the startof a penetration test process the ETS is at room temperature. During the process amixture of steam and air will enter the Liquid Crystal Polymer (LCP) tube of the ETS.The heat capacity of the aluminum (Al) blocks that are attached to the outer side ofthis tube is so large that they warm up very slowly. Hence the wall of the tube willhave a lower temperature than the gas mixture entering the tube. Consequently, thesteam will condense on the wall of the LCP tube. The condensate runs off the walltowards the bottom of the tube, where it leaves the ETS. This condensation will establisha continuous flow of steam (and air) into the LCP tube during the process until the endof the sterilization phase (in figure 7.1, phases I and II). Air flowing with the steam intothe tube will not condense and can only leave via the open end of the tube by diffusion.However, diffusion is a very slow process compared to the flow initiated by the condensingsteam on the wall. Therefore, in the tube air will accumulate and the concentration ofsteam will substantially decrease. This effect will be more pronounced towards the closedend (top) of the tube, where so much air can be present that the steam will not be ableto penetrate until this end.
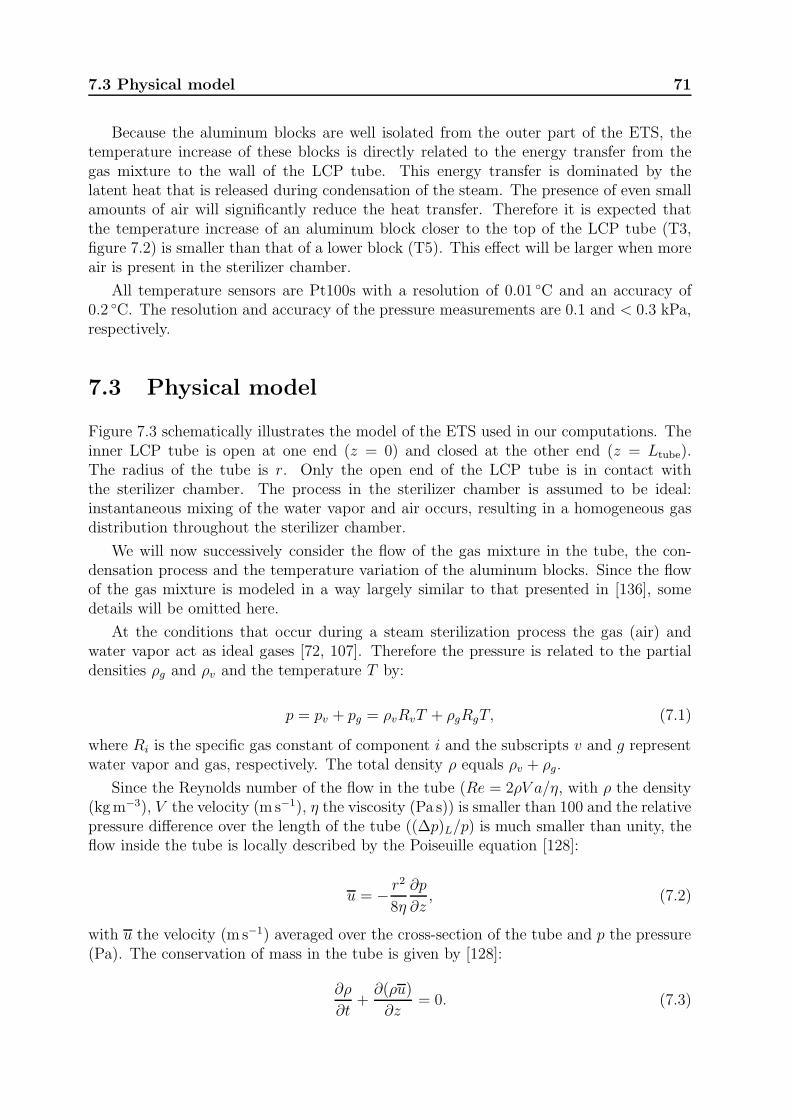
7.3 Physical model 71
Because the aluminum blocks are well isolated from the outer part of the ETS, thetemperature increase of these blocks is directly related to the energy transfer from thegas mixture to the wall of the LCP tube. This energy transfer is dominated by thelatent heat that is released during condensation of the steam. The presence of even smallamounts of air will significantly reduce the heat transfer. Therefore it is expected thatthe temperature increase of an aluminum block closer to the top of the LCP tube (T3,figure 7.2) is smaller than that of a lower block (T5). This effect will be larger when moreair is present in the sterilizer chamber.
All temperature sensors are Pt100s with a resolution of 0.01 ◦C and an accuracy of0.2 ◦C. The resolution and accuracy of the pressure measurements are 0.1 and < 0.3 kPa,respectively.
7.3 Physical model
Figure 7.3 schematically illustrates the model of the ETS used in our computations. Theinner LCP tube is open at one end (z = 0) and closed at the other end (z = Ltube).The radius of the tube is r. Only the open end of the LCP tube is in contact withthe sterilizer chamber. The process in the sterilizer chamber is assumed to be ideal:instantaneous mixing of the water vapor and air occurs, resulting in a homogeneous gasdistribution throughout the sterilizer chamber.
We will now successively consider the flow of the gas mixture in the tube, the con-densation process and the temperature variation of the aluminum blocks. Since the flowof the gas mixture is modeled in a way largely similar to that presented in [136], somedetails will be omitted here.
At the conditions that occur during a steam sterilization process the gas (air) andwater vapor act as ideal gases [72, 107]. Therefore the pressure is related to the partialdensities ρg and ρv and the temperature T by:
p = pv + pg = ρvRvT + ρgRgT, (7.1)
where Ri is the specific gas constant of component i and the subscripts v and g representwater vapor and gas, respectively. The total density ρ equals ρv + ρg.
Since the Reynolds number of the flow in the tube (Re = 2ρV a/η, with ρ the density(kgm−3), V the velocity (m s−1), η the viscosity (Pa s)) is smaller than 100 and the relativepressure difference over the length of the tube ((∆p)L/p) is much smaller than unity, theflow inside the tube is locally described by the Poiseuille equation [128]:
u = − r2
8η
∂p
∂z, (7.2)
with u the velocity (m s−1) averaged over the cross-section of the tube and p the pressure(Pa). The conservation of mass in the tube is given by [128]:
∂ρ
∂t+
∂(ρu)
∂z= 0. (7.3)
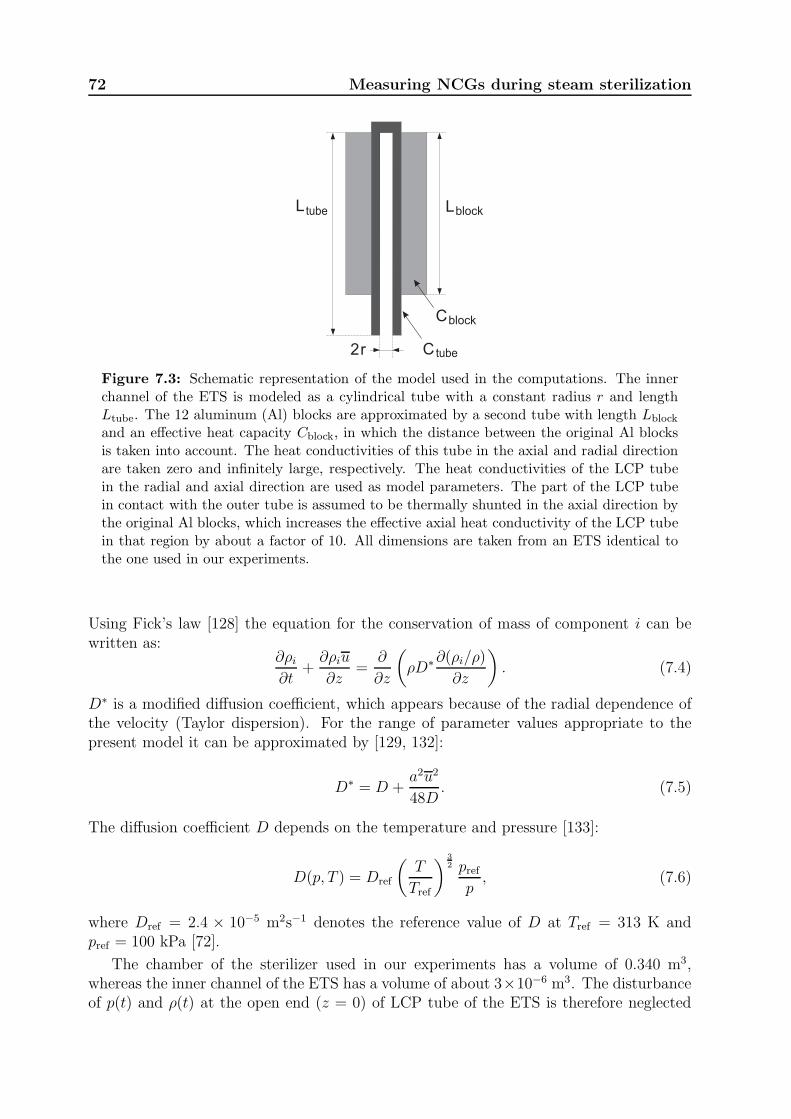
72 Measuring NCGs during steam sterilization
blockL
tube
blockC
C
tubeL
2r
Figure 7.3: Schematic representation of the model used in the computations. The innerchannel of the ETS is modeled as a cylindrical tube with a constant radius r and lengthLtube. The 12 aluminum (Al) blocks are approximated by a second tube with length Lblock
and an effective heat capacity Cblock, in which the distance between the original Al blocksis taken into account. The heat conductivities of this tube in the axial and radial directionare taken zero and infinitely large, respectively. The heat conductivities of the LCP tubein the radial and axial direction are used as model parameters. The part of the LCP tubein contact with the outer tube is assumed to be thermally shunted in the axial direction bythe original Al blocks, which increases the effective axial heat conductivity of the LCP tubein that region by about a factor of 10. All dimensions are taken from an ETS identical tothe one used in our experiments.
Using Fick’s law [128] the equation for the conservation of mass of component i can bewritten as:
∂ρi∂t
+∂ρiu
∂z=
∂
∂z
(
ρD∗∂(ρi/ρ)
∂z
)
. (7.4)
D∗ is a modified diffusion coefficient, which appears because of the radial dependence ofthe velocity (Taylor dispersion). For the range of parameter values appropriate to thepresent model it can be approximated by [129, 132]:
D∗ = D +a2u2
48D. (7.5)
The diffusion coefficient D depends on the temperature and pressure [133]:
D(p, T ) = Dref
(
T
Tref
)3
2 prefp
, (7.6)
where Dref = 2.4 × 10⁻⁵ m2s−1 denotes the reference value of D at Tref = 313 K andpref = 100 kPa [72].
The chamber of the sterilizer used in our experiments has a volume of 0.340 m3,whereas the inner channel of the ETS has a volume of about 3×10⁻⁶ m3. The disturbanceof p(t) and ρ(t) at the open end (z = 0) of LCP tube of the ETS is therefore neglected
7.3 Physical model 73
and the boundary conditions at z = 0 are:
p(0, t) = p(t) , ρi(0, t) = ρi(t), (7.7)
where p(t) and ρi(t) refer to the quantities in the sterilizer chamber, and p(z, t) and ρi(z, t)to those within the tube.
Measurements with a thermocouple inside the ETS showed that the gas temperatureduring the sterilization phase (figure 7.1) decreases from 407 K at z = 0 to about 380 Kat z = Ltube. During the evacuation of the sterilizer chamber during phase I the gastemperature decreases to about 323 K. To keep the model manageable, however, we havedescribed the flow of the gas mixture within the tube by an isothermal process, at atemperature corresponding to that at the open end of the tube during the sterilizationphase. This approximation was also motivated by preliminary calculations, based on theexperimentally observed temperature increase of the Al blocks resulting from condensationof water vapor inside the LCP tube of the ETS. These calculations revealed that the latentheat of the condensing water vapor dominates all other terms in the energy balance ofthe gas-liquid system within this tube. Of course, one might argue that since the relativepressure difference over the length of the tube is very small, a temperature decreasetowards the end of the tube would imply an increase of the density of vapor and air. Assuch this is correct, but this increase (of about 10%) will hardly affect the condensationrate, which depends primarily on the wall temperature of the tube, the partial vaporpressure and the air fraction.
Next, we consider the condensation process of the water vapor. We will model thisprocess as film condensation and use standard Nusselt boundary layer theory [128]. Thistheory predicts a film of condensate running down along the inner wall of the tube witha thickness δ(x) given by
δ(x) =
[
4k(Tsat − Tw)µx
ρf(ρf − ρg)ghfg
]1/4
. (7.8)
In this equation k is the thermal conductivity of liquid water (0.68 Wm−1K−1 in thetemperature range of interest), Tsat the saturation temperature of the vapor, Tw the walltemperature, ρf and ρg the density of the fluid and vapor, respectively, µ the dynamicviscosity of liquid water (0.28×10⁻³ Pa s) and g the gravity constant (9.8 m s−2). Theparameter hfg is the specific latent heat of water vapor (2160 kJ kg−1). The distancefrom the top of the film is denoted by x = Ltube − z. The density of water is takenas 940 kgm−3, where the variation of about 3% in the temperature range of interest isneglected. The vapor density ρg is less than 1% of ρf , so it is neglected in the calculationof δ.
The local heat flux q(x) to the wall of the tube is given by
q(x) =k(Tsat − Tw)
δ=
[
k3ρf (ρf − ρg)ghfg
4µ
]1/4
(Tsat − Tw)3/4x−1/4. (7.9)
Inserting the numerical parameter values and the radius of the LCP tube of the ETS(3 mm) in this equation we obtain the following expression for the local heat transfer permeter through the wall of the tube:
qm(z) = Pm(Tsat − Tw)3/4(z − Ltube)
−1/4, (7.10)
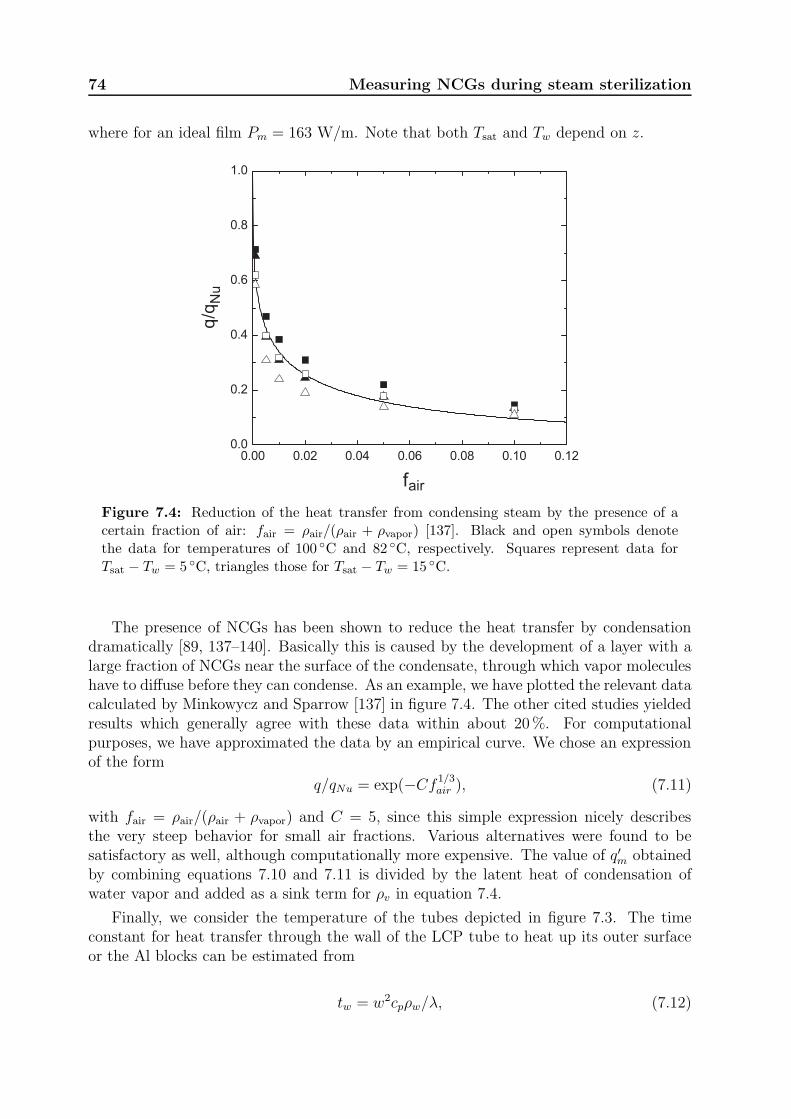
74 Measuring NCGs during steam sterilization
where for an ideal film Pm = 163 W/m. Note that both Tsat and Tw depend on z.
airf
Figure 7.4: Reduction of the heat transfer from condensing steam by the presence of acertain fraction of air: fair = ρair/(ρair + ρvapor) [137]. Black and open symbols denotethe data for temperatures of 100 ◦C and 82 ◦C, respectively. Squares represent data forTsat − Tw = 5 ◦C, triangles those for Tsat − Tw = 15 ◦C.
The presence of NCGs has been shown to reduce the heat transfer by condensationdramatically [89, 137–140]. Basically this is caused by the development of a layer with alarge fraction of NCGs near the surface of the condensate, through which vapor moleculeshave to diffuse before they can condense. As an example, we have plotted the relevant datacalculated by Minkowycz and Sparrow [137] in figure 7.4. The other cited studies yieldedresults which generally agree with these data within about 20%. For computationalpurposes, we have approximated the data by an empirical curve. We chose an expressionof the form
q/qNu = exp(−Cf1/3air ), (7.11)
with fair = ρair/(ρair + ρvapor) and C = 5, since this simple expression nicely describesthe very steep behavior for small air fractions. Various alternatives were found to besatisfactory as well, although computationally more expensive. The value of q′m obtainedby combining equations 7.10 and 7.11 is divided by the latent heat of condensation ofwater vapor and added as a sink term for ρv in equation 7.4.
Finally, we consider the temperature of the tubes depicted in figure 7.3. The timeconstant for heat transfer through the wall of the LCP tube to heat up its outer surfaceor the Al blocks can be estimated from
tw = w2cpρw/λ, (7.12)
7.4 Experimental 75
where w [m] is the wall thickness, cp [JK−1kg−1] the heat capacity of the wall material,ρw [kgm−3] the density, and λ [Wm−1K−1] the heat conductivity of this material. Usingtypical values for the heat conductivity and heat capacity, the time constant for heattransfer through the wall appears to be in the order of 2 s. Since the relevant times ina sterilization process are two orders of magnitude larger, we simplified the problem byassuming a lumped circuit, where the heat capacity is concentrated on the outer side ofthe LCP tube. The temperature Te of this outer side can be described by
∂Te
∂t=
kLCP,zALCP,z
Ctot
∂2Te
∂2z+ qm. (7.13)
The term kLCP,z denotes the heat conductivity of the LCP tube in the axial directionand ALCP,z is its cross sectional area. Ctot represents the heat capacity per meter of thesystem (inner tube only for z < (Ltube − Lblock) or both tubes for larger values of z),whereas the term qm is the heat of condensation discussed above. The heat capacity ofAl, which varies about 7% in the temperature range of interest, was fitted by a secondorder polynomial.
The local value of the temperature Tsat was calculated from the partial air vaporpressure pv = p × (ρvRv)/(ρvRv + ρgRg) using the conversion equations given in [107].The temperature of the inner wall Tw was eliminated from the calculations by combiningequation 7.10 with the equation describing the heat transfer through the wall:
qm = hLCP,r(Tw − Te), (7.14)
where hLCP,r represents the heat transfer coefficient per meter in the radial direction.
Summarizing, the set of equations (7.2–7.6) together with the the boundary conditions(equation 7.7) and the sink term for ρv describes the flow of the vapor-air mixture in theETS. The condensation is modeled by equation 7.10, 7.11 and 7.14. The temperaturevariation of the LCP tube and the Al blocks is modeled by equation 7.13, where the initialtemperature is estimated from the experimental data. The resulting set of 3 second orderPDE’s is solved numerically using the standard pdepe routine of MatlabR©. This routinesolves initial-boundary value problems for parabolic elliptic PDE’s in one dimension. Thenumerical solution was obtained at 150 equally spaced grid points along the LCP tubeand for every 0.5 s up to 650 s.
7.4 Experimental
For the experiments a Lautenschlager type 3119/4STE test sterilizer (Cologne, Germany)with a volume of 340 L is used. Details of this sterilizer and its steam supply can be foundin [134]. Figure 7.5 shows a typical result for a process during which hardly any NoneCondensible Gases (NCGs) were present in the sterilization chamber. The data presentedin this figure indicate that the temperature of the aluminum blocks in the ETS graduallyrises from about 25 ◦C at the start of the final inlet of steam (t ≈ 210 s) to about 80 ◦Cat the end of the sterilization phase (t ≈ 530 s). The temperature increase of T3 (nearthe closed end of the LCP tube) is slightly smaller than that of T5 (more distant fromthe closed end).

76 Measuring NCGs during steam sterilization
The same process was repeated in the other experiments, but now a known volume ofair was injected in the sterilizer chamber just before the final inlet of steam. This volumeis calibrated as cm3 at room temperature (295 K). For each air volume the experimentwas repeated three times. From the reproducibility of these experiments the error isestimated to be about 0.01 ◦Cs−1. The observed values of dT/dt for T3 and T5 areplotted in figure 7.6 versus the injected volume of air. Inspection of this figure shows thatwhen no air is injected, the temperature of T3 and T5 increases at about the same rate atthe start of the sterilization phase. When air is injected, the temperature increase of T3drops significantly below that of T5, corroborating the entrapment of air near the closedend of the LCP tube of the ETS.
0 100 200 300 400 500 600 700 8000
50
100
150
tem
pera
ture
(°C
)
0 100 200 300 400 500 600 700 8000
100
200
300
pre
ssure
(kP
a)
time (s)
0 100 200 300 400 500 600 700 8000
50
100
tem
pera
ture
(°C
)
2000
2
3
4
5
time (s)
1
10 / (
s )
3-1
t
Figure 7.5: Example of data measured by an ETS during the experiments. In the up-per plot the solid curve denotes the pressure and the dotted curve the temperature, bothmeasured in the sterilizer chamber. The dashed curve denotes the so-called theoreticaltemperature, the temperature calculated from the pressure [72]. The start and end of thesterilization phase are denoted by vertical dotted lines. The lower plot shows the measuredtemperature of T3 and T5 (see figure 7.2), denoted by the dotted and dashed curves, re-spectively. From these temperatures an inverse time constant τ−1 is derived, which for eachblock i is equal to (dTi/dt)/(Tchamber − Ti). The behavior of these τ−1-values is denoted bythe dashed-dotted and solid curve for T3 and T5, respectively.
We like to note that the highest amount of injected air (about 900 cm3) correspondsto a concentration of only about 0.25% in the sterilizer chamber. Inspection of the datapresented in figure 7.6 shows that in principle air fractions down to about 0.05%, presentduring a sterilization process, can be clearly detected by an ETS.
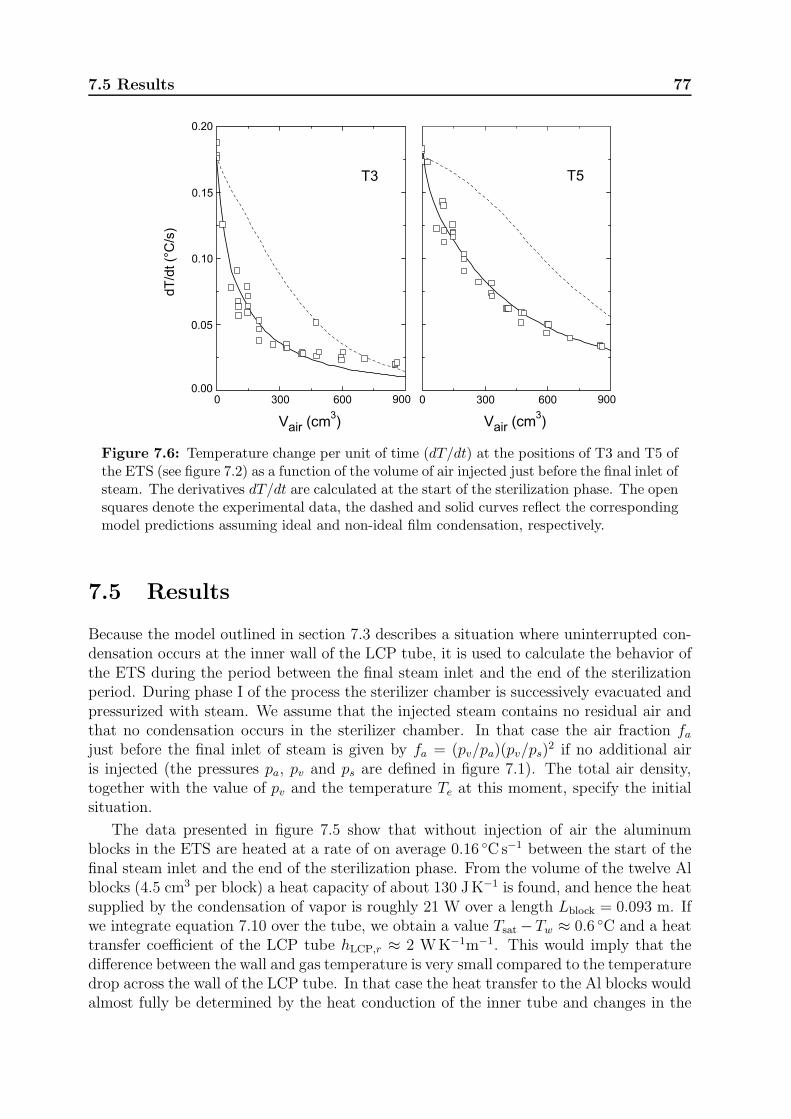
7.5 Results 77
Figure 7.6: Temperature change per unit of time (dT/dt) at the positions of T3 and T5 ofthe ETS (see figure 7.2) as a function of the volume of air injected just before the final inlet ofsteam. The derivatives dT/dt are calculated at the start of the sterilization phase. The opensquares denote the experimental data, the dashed and solid curves reflect the correspondingmodel predictions assuming ideal and non-ideal film condensation, respectively.
7.5 Results
Because the model outlined in section 7.3 describes a situation where uninterrupted con-densation occurs at the inner wall of the LCP tube, it is used to calculate the behavior ofthe ETS during the period between the final steam inlet and the end of the sterilizationperiod. During phase I of the process the sterilizer chamber is successively evacuated andpressurized with steam. We assume that the injected steam contains no residual air andthat no condensation occurs in the sterilizer chamber. In that case the air fraction fajust before the final inlet of steam is given by fa = (pv/pa)(pv/ps)
2 if no additional airis injected (the pressures pa, pv and ps are defined in figure 7.1). The total air density,together with the value of pv and the temperature Te at this moment, specify the initialsituation.
The data presented in figure 7.5 show that without injection of air the aluminumblocks in the ETS are heated at a rate of on average 0.16 ◦Cs−1 between the start of thefinal steam inlet and the end of the sterilization phase. From the volume of the twelve Alblocks (4.5 cm3 per block) a heat capacity of about 130 JK−1 is found, and hence the heatsupplied by the condensation of vapor is roughly 21 W over a length Lblock = 0.093 m. Ifwe integrate equation 7.10 over the tube, we obtain a value Tsat −Tw ≈ 0.6 ◦C and a heattransfer coefficient of the LCP tube hLCP,r ≈ 2 WK−1m−1. This would imply that thedifference between the wall and gas temperature is very small compared to the temperaturedrop across the wall of the LCP tube. In that case the heat transfer to the Al blocks wouldalmost fully be determined by the heat conduction of the inner tube and changes in the
78 Measuring NCGs during steam sterilization
condensation process resulting from NCGs would be largely suppressed. The results forthis situation are represented by the dashed curves in figure 7.6. Inspection of this figureshows that the qualitative characteristics of the experiments are described correctly, i.e.the decrease of dT/dt at increasing air fractions, which is much more pronounced for T3than T5. It is obvious, however, that the experimentally observed decrease of dT/dt atsmall values of Vair is much larger than predicted by the model.
The LCP tube of the ETS can fairly accurately be described as a cylindrical chan-nel with a diameter of 6 mm, centered in a square rod with transverse dimensions8.2×8.2 mm2. If we take the heat conductivity of a typical polymer, which is in theorder of 0.5 Wm−1K−1, we obtain an estimate hLCP,r ≈ 9 WK−1m−1, which is more thana factor of 4 higher than the value inferred above. Since the heat conductivity of LCPmay be even higher, the description of the condensation process by ideal film condensationat the entire inner surface of the LCP tube is probably too much simplified. Actually,inspection of the inner wall of the tube revealed twelve equidistant milled ridges in theaxial direction with a height of about 0.3 mm, which may give rise to preferential conden-sation on only a part of the surface. For this reason hLCP,r was chosen such that the bestagreement with the experimental data was obtained, whereas Pm was adjusted such thatfor Vair = 0 the value of dT/dt was equal to that observed in our experiments. It appearedthat the value for hLCP,r is not very critical; the above estimate of 9 WK−1m−1 resultingin a value Pm = 7.2 Wm−1 was satisfactory. This value of Pm suggests that the actualcondensation process is about a factor 20 less effective than ideal film condensation.
The heat conductivity kLCP,z of the LCP tube in the axial direction, defined in equation7.13, can be used to optimize the difference in the behavior of T3 and T5. For largervalues of kLCP,z the behavior of T3 and T5 becomes more similar, for smaller values thedifference is largest. The best agreement with the experimental data was obtained forkLCP,z ≈ 1.5 Wm−1K−1. This is somewhat larger than expected for a typical polymer,although not unrealistic for LCP. Apart from this, the heat conductivity in the axialdirection may be enhanced by various contributions that are not included in the model.In this respect we like to note that the heat transfer via the air between adjacent Alblocks in the ETS (figure 7.2) already adds 50% to the value calculated for the tubealone. The resulting behavior of dT/dt for T3 and T5 is represented by the solid curvesin figure 7.6. Inspection of this figure shows that our model describes the data for bothtemperature sensors simultaneously within experimental inaccuracy, except for the datafor T3 at high values of Vair. We like to note, however, that by small readjustments ofthe two independent fitting parameters the deviations in this region can be reduced, atthe cost of introducing a small error elsewhere.
7.6 Discussion
We have demonstrated experimentally that an instrument which has been proposed toassess the steam penetration during a steam sterilization process is very sensitive to evensmall concentrations of NCGs. Using a rather simple and straightforward physical model,the response of this instrument to additional volumes of air injected in the sterilizerchamber at the start of the final steam inlet can be described very well.
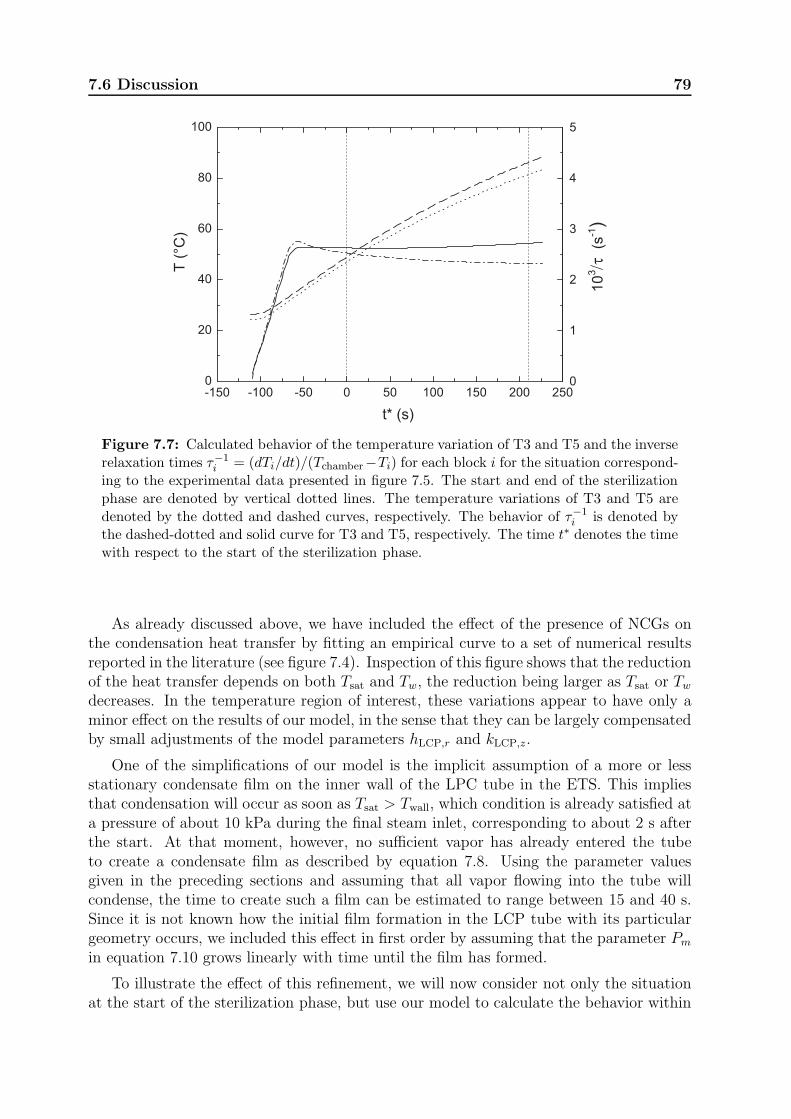
7.6 Discussion 79
Figure 7.7: Calculated behavior of the temperature variation of T3 and T5 and the inverserelaxation times τ−1
i = (dTi/dt)/(Tchamber−Ti) for each block i for the situation correspond-ing to the experimental data presented in figure 7.5. The start and end of the sterilizationphase are denoted by vertical dotted lines. The temperature variations of T3 and T5 aredenoted by the dotted and dashed curves, respectively. The behavior of τ−1
i is denoted bythe dashed-dotted and solid curve for T3 and T5, respectively. The time t∗ denotes the timewith respect to the start of the sterilization phase.
As already discussed above, we have included the effect of the presence of NCGs onthe condensation heat transfer by fitting an empirical curve to a set of numerical resultsreported in the literature (see figure 7.4). Inspection of this figure shows that the reductionof the heat transfer depends on both Tsat and Tw, the reduction being larger as Tsat or Tw
decreases. In the temperature region of interest, these variations appear to have only aminor effect on the results of our model, in the sense that they can be largely compensatedby small adjustments of the model parameters hLCP,r and kLCP,z.
One of the simplifications of our model is the implicit assumption of a more or lessstationary condensate film on the inner wall of the LPC tube in the ETS. This impliesthat condensation will occur as soon as Tsat > Twall, which condition is already satisfied ata pressure of about 10 kPa during the final steam inlet, corresponding to about 2 s afterthe start. At that moment, however, no sufficient vapor has already entered the tubeto create a condensate film as described by equation 7.8. Using the parameter valuesgiven in the preceding sections and assuming that all vapor flowing into the tube willcondense, the time to create such a film can be estimated to range between 15 and 40 s.Since it is not known how the initial film formation in the LCP tube with its particulargeometry occurs, we included this effect in first order by assuming that the parameter Pm
in equation 7.10 grows linearly with time until the film has formed.
To illustrate the effect of this refinement, we will now consider not only the situationat the start of the sterilization phase, but use our model to calculate the behavior within
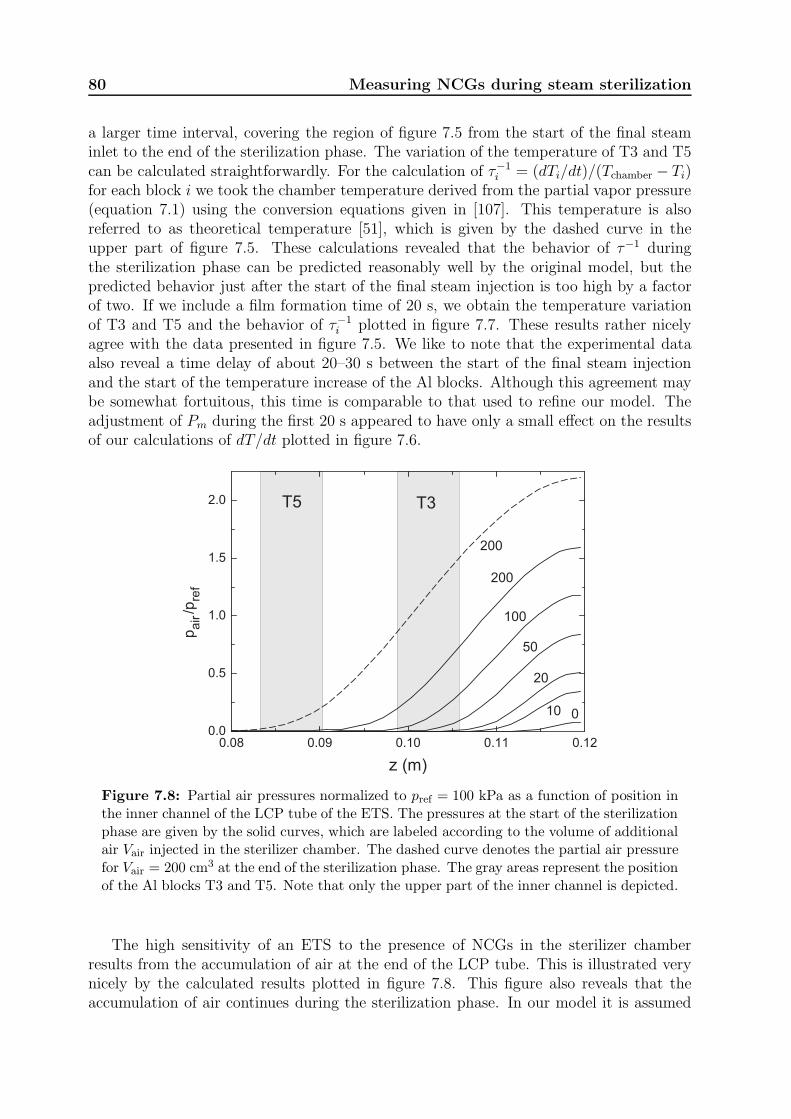
80 Measuring NCGs during steam sterilization
a larger time interval, covering the region of figure 7.5 from the start of the final steaminlet to the end of the sterilization phase. The variation of the temperature of T3 and T5can be calculated straightforwardly. For the calculation of τ−1
i = (dTi/dt)/(Tchamber − Ti)for each block i we took the chamber temperature derived from the partial vapor pressure(equation 7.1) using the conversion equations given in [107]. This temperature is alsoreferred to as theoretical temperature [51], which is given by the dashed curve in theupper part of figure 7.5. These calculations revealed that the behavior of τ−1 duringthe sterilization phase can be predicted reasonably well by the original model, but thepredicted behavior just after the start of the final steam injection is too high by a factorof two. If we include a film formation time of 20 s, we obtain the temperature variationof T3 and T5 and the behavior of τ−1
i plotted in figure 7.7. These results rather nicelyagree with the data presented in figure 7.5. We like to note that the experimental dataalso reveal a time delay of about 20–30 s between the start of the final steam injectionand the start of the temperature increase of the Al blocks. Although this agreement maybe somewhat fortuitous, this time is comparable to that used to refine our model. Theadjustment of Pm during the first 20 s appeared to have only a small effect on the resultsof our calculations of dT/dt plotted in figure 7.6.
010
20
50
100
200
z
200
T3T5
Figure 7.8: Partial air pressures normalized to pref = 100 kPa as a function of position inthe inner channel of the LCP tube of the ETS. The pressures at the start of the sterilizationphase are given by the solid curves, which are labeled according to the volume of additionalair Vair injected in the sterilizer chamber. The dashed curve denotes the partial air pressurefor Vair = 200 cm3 at the end of the sterilization phase. The gray areas represent the positionof the Al blocks T3 and T5. Note that only the upper part of the inner channel is depicted.
The high sensitivity of an ETS to the presence of NCGs in the sterilizer chamberresults from the accumulation of air at the end of the LCP tube. This is illustrated verynicely by the calculated results plotted in figure 7.8. This figure also reveals that theaccumulation of air continues during the sterilization phase. In our model it is assumed
7.6 Discussion 81
that the fraction of air in the sterilizer chamber does not change from the start of the finalsteam inlet to the end of the sterilization phase, since the volume of the sterilizer chamberis about five orders of magnitude larger than that of the inner channel of the LCP tube. Inprinciple this is correct, but the amount of air injected in the sterilizer chamber is limitedand the ETS extracts much more air from the chamber than estimated from the volumeof the LCP tube alone. From the data presented in the figure and the radius of the LCPtube it can be inferred that for an injected air volume of 200 cm3 (at 100 kPa) roughly1.4 cm3 has been accumulated in the tube at the end of the sterilization phase, which willonly have a minor effect on the model. From the figure it can also be deduced that changesof the positions of T3 and T5 have a large effect on the measured temperatures. In thisrespect one should note that our model assumes that the heat transfer by condensationis measured locally, whereas in reality it is averaged over the thickness of an individualAl block (7.1 mm). Possible errors resulting from this approximation are most likelycompensated by the choice of the fitting parameters.
Both our experiments and model calculations reveal that the ETS is very sensitive toresidual NCGs that are present in the sterilizer chamber before the final inlet of steam.If the values of τ−1 of T3 and T5 are significantly lower than their values in the absenceof NCGs and τ−1
3 is substantially lower than τ−15 , the steam penetration in long hollow
channels may be impaired significantly, as has been shown in [136]. The present model,however, can also be used to calculate the effect of small fractions NCGs that are presentin the steam supplied to the sterilizer, which frequently occurs in practical situations. Insuch cases the values of τ−1 given by the ETS will also drop significantly, although theeffect on steam penetration in hollow channels is much smaller or negligible, since thesteam entering the channel is not blocked by air entrapped in the tube. This impliesthat measurements with an ETS do not give unambiguous information on the steampenetration in this type of loads, and should be supplemented with additional data on,for instance, the steam quality. Nevertheless, the present study shows that the ETS verylikely represents a worst case scenario for steam penetration.

82 Measuring NCGs during steam sterilization
Chapter 8
Finite Volume Modeling of steam
penetration during sterilization
processes
8.1 Introduction
In chapter 6 steam penetration in a narrow channel during a generic sterilization process isdiscussed. The behavior of the air-vapor mixture is described by a quasi one-dimensionalmodel, in which condensation is neglected. In chapter 7 a largely similar system withuninterrupted condensation is modeled. Obviously these two models describe extremecases. In daily practice many items, such as channeled surgical instruments, will havea behavior in between these two extreme cases and both condensation and evaporationmay occur on the surfaces of these items. In a model of steam sterilization of theseitems it necessary to calculate the pressure, temperature, the gas composition and theamount of condensate at all locations of the system at any time during a sterilizationprocess. These aspects increase the complexity of the model, because during such a processcondensate may be changing its location, for example by gas flows over the condensate andby gravitational forces. To be able to locate the condensate and to describe the behavior ofthe air-vapor mixture in the radial direction of a channel a model has to comprise at leasttwo dimensions but preferably three. Recently, a project is started to develop a modelthat finally should include all these aspects. In this chapter the first developments withinthis project are presented: air and vapor transport in a non-isothermal, two-dimensionalspace, steady state system, including a condensation and evaporation mechanism.
Obviously, the system cannot be solved analytically. Consequently, a numerical methodand software application have to be used. We have not been able to identify a softwareapplication that appreciates all the aspects necessary to model the steam penetration innarrow channels during a steam sterilization process. An application that already includesseveral of the aspects of the problem and provides a platform to implement the missingaspects is the software application Plasimo [141, 142]. Another advantage of this FiniteVolume Method (FVM) based application is that possibilities for extending the model toother sterilization methods, such as ethylene oxide and even plasma, are possible as well.
In section 8.2 the definitions, governing equations, boundary conditions and initialconditions which describe the condensation and evaporation will be introduced. In sec-tion 8.3 the used numerical software application Plasimo is discussed briefly. In section 8.4some preliminary results are presented. A discussion of the current developments and anoutlook is given in section 8.5.
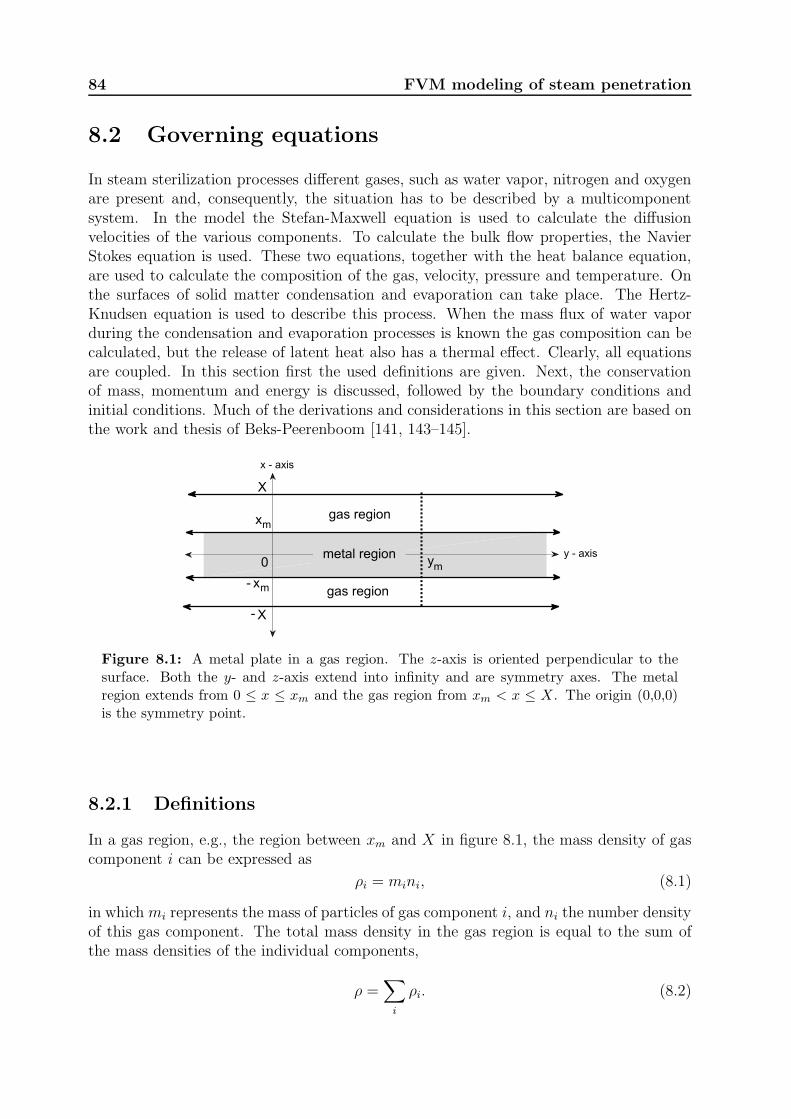
84 FVM modeling of steam penetration
8.2 Governing equations
In steam sterilization processes different gases, such as water vapor, nitrogen and oxygenare present and, consequently, the situation has to be described by a multicomponentsystem. In the model the Stefan-Maxwell equation is used to calculate the diffusionvelocities of the various components. To calculate the bulk flow properties, the NavierStokes equation is used. These two equations, together with the heat balance equation,are used to calculate the composition of the gas, velocity, pressure and temperature. Onthe surfaces of solid matter condensation and evaporation can take place. The Hertz-Knudsen equation is used to describe this process. When the mass flux of water vaporduring the condensation and evaporation processes is known the gas composition can becalculated, but the release of latent heat also has a thermal effect. Clearly, all equationsare coupled. In this section first the used definitions are given. Next, the conservationof mass, momentum and energy is discussed, followed by the boundary conditions andinitial conditions. Much of the derivations and considerations in this section are based onthe work and thesis of Beks-Peerenboom [141, 143–145].
y - axis
gas region
x - axis
0 ymmetal region
gas region
X
X
xm
- xm
-
Figure 8.1: A metal plate in a gas region. The z-axis is oriented perpendicular to thesurface. Both the y- and z-axis extend into infinity and are symmetry axes. The metalregion extends from 0 ≤ x ≤ xm and the gas region from xm < x ≤ X. The origin (0,0,0)is the symmetry point.
8.2.1 Definitions
In a gas region, e.g., the region between xm and X in figure 8.1, the mass density of gascomponent i can be expressed as
ρi = mini, (8.1)
in which mi represents the mass of particles of gas component i, and ni the number densityof this gas component. The total mass density in the gas region is equal to the sum ofthe mass densities of the individual components,
ρ =∑
i
ρi. (8.2)
8.2 Governing equations 85
The mass fraction of component i is defined as
yi =ρiρ. (8.3)
Hence, by definition the mass fractions sum up to unity,∑
i
yi = 1. (8.4)
Equations 8.2, 8.3 and 8.4 show that the composition can be expressed in number densities,mass densities or mass fractions.
Over the gas region the mass averaged or barycentric velocity field (~v) is defined as
~v =∑
i
yi~ui, (8.5)
where ~ui is the averaged velocity of particles of component i. For each component, thediffusion velocity (~vi) is defined as the velocity of that component relative to the massaverage velocity,
~vi ≡ ~ui − ~v. (8.6)
From the definition of the mass averaged velocity field it follows that∑
i
yi~vi =∑
i
yi~ui −∑
i
yi~v = 0. (8.7)
Further on in this chapter this equation will be used as a constraint to solve the set ofthe Stefan-Maxwell equations.
Dalton’s law describes that the sum of the partial pressures yields the total pressure
p =∑
i
pi. (8.8)
In the pressure range (0 to 350 kPa) and temperature range (0 to 150 ◦C) of steam steril-ization processes the various components can be described as ideal gases [72]
pi = nikbT, (8.9)
with kb Boltzmann’s constant (1.3807× 10⁻²³ J/K).
8.2.2 Conservation of mass
Mass conservation on the component level can be described by the continuity equation[128, 141]
∂ρi∂t
+∇ · ρi~ui = miSi, (8.10)
where Si is the production rate of the i-th component per unit volume. It is assumed thatno condensation and no gas production will occur in the gas region, which simplifies thismass conservation equation to
∂ρi∂t
+∇ · ρi~ui = 0. (8.11)
Summation of all components in a gas region yields the mass continuity equation
∂ρ
∂t+∇ · ρ~u = 0. (8.12)
86 FVM modeling of steam penetration
8.2.3 Conservation of momentum
The conservation of momentum is described by the Navier Stokes equation [128]
∂ρ~u
∂t+∇ · (ρ~u~u) = −∇p +∇ · ¯π − ρ~g. (8.13)
On the left hand side of the equation the first term describes the increase of momentumper unit volume and the second term the rate of momentum addition by convection perunit volume. The right hand side represents the pressure gradient, the viscosity termsand the gravitational force. The first term describes the force exerted by the pressure onthe control volume and the second term is the viscous force on the control volume. Thetensor ¯π represents the Stokes viscous stress tensor ([128], page 81 and appendix B). Inthe system considered here the gases are assumed to act as Newtonian fluids. This makesit possible to write the term ∇· ¯π in equation 8.13 as µ∇2~u, with µ the dynamic viscosity(Pa s).
In the gas region the Stefan-Maxwell equations are used to calculate the velocity ofthe components relative to the mass averaged velocity
~di =∑
j
fij(~vi − ~vj). (8.14)
In this equation ~di represent the diffusion driving forces (m−1) and fij the friction (sm−2)of particles j on particle i. As already mentioned above, equation 8.7 is used as a constraintto solve this set of equations.
The barycentric flow field (~u) is calculated in conjunction with the pressure from theNavier Stokes equation and the continuity equation (equation 8.12). Additionally, thetotal mass averaged velocity is calculated. For the Navier Stokes equation the total massdensity is not altered and used as input.
8.2.4 Conservation of energy
For the complete system, gas region and solids, the conservation of energy can be writtenin terms of the component’s specific enthalpy hi (J kg
−1) [141]
∂
∂t(ρyihi) +∇ · (ρ~vyihi) +∇ · ~qi + ¯πi : ∇~v − ~v · ∇pi = Qi. (8.15)
In this equation ~qi (Jm−2s−1) is the conductive heat flux of component i andQi (Jm
−3s−1)the heat source of that component. If it is assumed that the specific heat of each compo-nent is constant over the applied temperature domain its specific enthalpy can be writtenas
hi = h0i + cp,iT, (8.16)
with h0i the specific enthalpy (J kg−1) at a reference temperature T0 (K), cp,i the spe-
cific heat of the i-th component (J kg−1K−1) and T the actual temperature. In case it is
8.2 Governing equations 87
assumed that cp,i is not a constant, a more accurate relation for cp,i(T ) could be imple-mented. All components have locally the same temperature. A single energy balance issolved for the mixture. Summation over the component heat balance equations results in
∂
∂t
(
∑
i
ρyihi
)
+∇ ·(
∑
i
ρ~vyihi
)
= −∇ · ~q − ¯π : ∇~v + ~v · ∇p+Q, (8.17)
where ~q is the heat flux caused by conduction and Q an energy source. Substitution ofequation 8.16 in this equation and using the continuity equation 8.12 and Fourier’s lawof heat conduction (~q = λ∇T , with λ the thermal conductivity (Wm−1K−1) [128]), yields
∂
∂tρ cpT +∇ · ~v cpT −∇ · (λ∇T ) = −¯π : ∇~v + ~v · ∇p+Q. (8.18)
In this equation we have introduced cp =∑
i yicp,i.
8.2.5 Boundary and initial conditions
In steam sterilization processes devices are positioned in a gas region as schematicallyillustrated in figure 8.1. To obtain a solution of the equations given above boundaryconditions and initial conditions have to be imposed. They include the gas composition,pressure, velocity, and temperature. Both sets of conditions are addressed in this section.
Gas composition
At the open boundary of the system, the inlet, the gas composition is imposed. Therelevant gases present are water vapor (H2O), nitrogen (N2), and oxygen (O2). Theconstant values of these components are imposed as Dirichlet conditions, e.g., 0.8% N2,0.2% O2, and 99.0% H2O. Because of the symmetry of the problem, the gas conditionsare identical in adjacent gas regions (at y = 0 and y = ym in figure 8.2) and the flux in they-direction will be zero. At the interface between the solid material and the gas regioncondensation and evaporation may occur. As a first approximation, the evaporation andcondensation are described with the Hertz-Knudsen relation [146]
Γs = Scond − Sevap =p∗ − ps√2πmkbT
, (8.19)
in which Γs represents the net condensation rate per unit of area and time, Sevap theevaporation source and Scond the condensation source, p∗ the partial pressure of the watervapor, and ps the saturation pressure of water at the temperature T . The water vaporflux resulting from condensation and evaporation will change the gas composition in thegas region and with that also the velocity of the components in the gas region.
We like to note that many subtle features of the actual condensation-evaporationprocess are not included in equation 8.19. Among these are the temperature variation inthe condensate film and the temperature step at the liquid-vapor interface [147]. In a laterstage, these effects may be accounted for empirically by using the Hertz-Knudsen-Schragerelation [148] or by using results from, e.g., statistical rate theory [149].
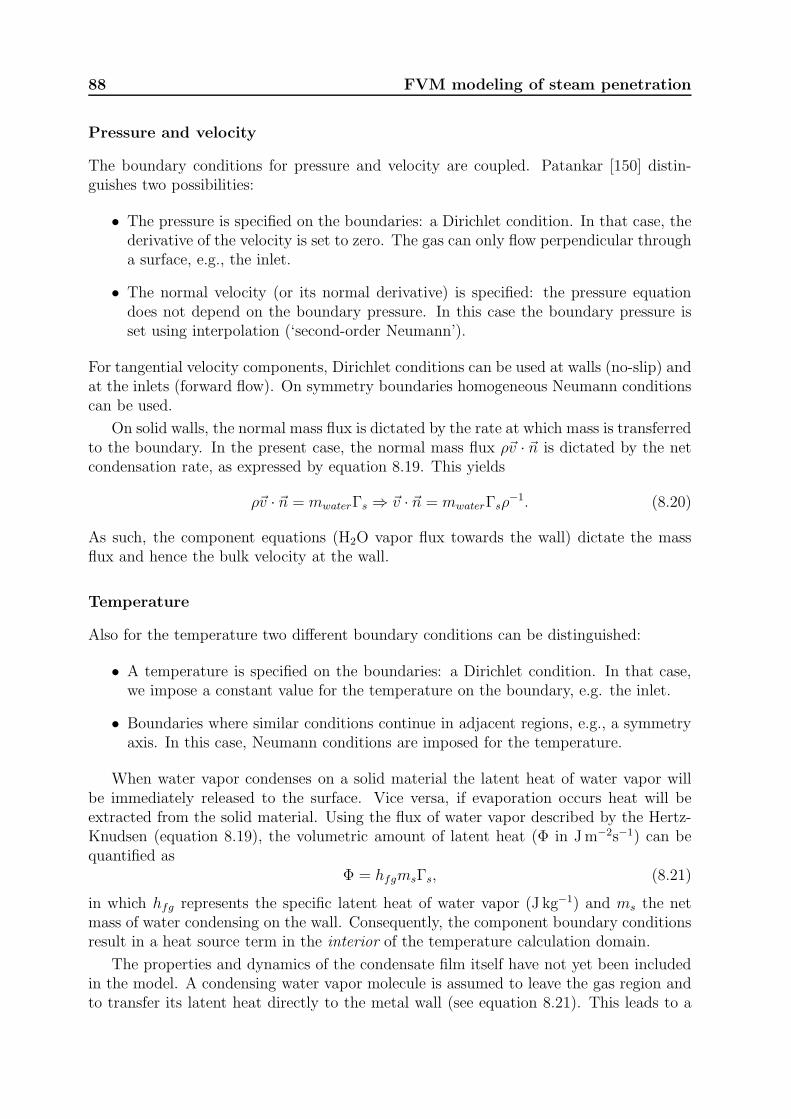
88 FVM modeling of steam penetration
Pressure and velocity
The boundary conditions for pressure and velocity are coupled. Patankar [150] distin-guishes two possibilities:
• The pressure is specified on the boundaries: a Dirichlet condition. In that case, thederivative of the velocity is set to zero. The gas can only flow perpendicular througha surface, e.g., the inlet.
• The normal velocity (or its normal derivative) is specified: the pressure equationdoes not depend on the boundary pressure. In this case the boundary pressure isset using interpolation (‘second-order Neumann’).
For tangential velocity components, Dirichlet conditions can be used at walls (no-slip) andat the inlets (forward flow). On symmetry boundaries homogeneous Neumann conditionscan be used.
On solid walls, the normal mass flux is dictated by the rate at which mass is transferredto the boundary. In the present case, the normal mass flux ρ~v · ~n is dictated by the netcondensation rate, as expressed by equation 8.19. This yields
ρ~v · ~n = mwaterΓs ⇒ ~v · ~n = mwaterΓsρ−1. (8.20)
As such, the component equations (H2O vapor flux towards the wall) dictate the massflux and hence the bulk velocity at the wall.
Temperature
Also for the temperature two different boundary conditions can be distinguished:
• A temperature is specified on the boundaries: a Dirichlet condition. In that case,we impose a constant value for the temperature on the boundary, e.g. the inlet.
• Boundaries where similar conditions continue in adjacent regions, e.g., a symmetryaxis. In this case, Neumann conditions are imposed for the temperature.
When water vapor condenses on a solid material the latent heat of water vapor willbe immediately released to the surface. Vice versa, if evaporation occurs heat will beextracted from the solid material. Using the flux of water vapor described by the Hertz-Knudsen (equation 8.19), the volumetric amount of latent heat (Φ in Jm−2s−1) can bequantified as
Φ = hfgmsΓs, (8.21)
in which hfg represents the specific latent heat of water vapor (J kg−1) and ms the netmass of water condensing on the wall. Consequently, the component boundary conditionsresult in a heat source term in the interior of the temperature calculation domain.
The properties and dynamics of the condensate film itself have not yet been includedin the model. A condensing water vapor molecule is assumed to leave the gas region andto transfer its latent heat directly to the metal wall (see equation 8.21). This leads to a
8.3 Plasimo 89
decrease of the enthalpy in the gas region by an amount mshwater. Apart from this, theeffect of the condensate film on the geometry of the gas region is neglected, since in therelevant practical situations the thickness of the film is more than two orders of magnitudesmaller than, e.g., the diameter of the channel in which the gas mixture is present.
Initial conditions
At the start of a calculation the initial conditions of the system have to be defined. Forthe gas region these include the temperature, pressure, and gas composition. For the solidmaterial these include only the temperature.
8.3 Plasimo
Since the set of equations that govern the system under study cannot be solved ana-lytically, numerical simulations have been performed. As mentioned above the Plasimomodeling toolkit [141, 142] or software application was selected. This application hasoriginally been developed for the simulation of plasma sources and was extended to beable to model neutral gas mixtures as well. For further and future developments it isnecessary that the application can be extended with missing aspects, e.g, the behaviorof condensate on the surfaces of the solid material and condensation in the gas region.Plasimo offers these possibilities.
Plasimo uses the Control Volume Method, as shown in figure 8.2. It also uses theGummel iteration method [141, 142]. This means that in an iteration the equations forall quantities are solved consecutively, and iteration continues until the final solution isobtained. In Plasimo, first the temperature field is updated, next the flow variables p and~v are calculated with the help of the SIMPLE algorithm, and finally the composition isadjusted. For more information we refer to the Plasimo review paper [142].
8.4 Some preliminary results for steam
8.4.1 Metal plate
In a stationary system a metal plate is positioned in a gas region (figure 8.1). The z-axisof the plate is the symmetry axis. Both the y- and z-axis extend to infinity. To calculatea solution a grid is defined in Plasimo (figure 8.2). The metal plate has dimensions0 < x < 0.07 m and the gas region 0.07 < x < 0.15 m. At x = 0 the symmetry axisis located and at x = 0.07 m the interface between the metal plate and the gas regionis present. Initially the temperature of the complete system is 20 ◦C (293.16K) with apressure of 202.07 kPa. In the gas region initially the composition of the gas expressed infractions is 0.79 nitrogen (N2), 0.20 oxygen (O2) and 0.01 water vapor (H2O). At the inletboundary (x = 0.15 m) three different gas compositions are imposed at 373.16K (100 ◦C)and 202.07 kPa. The respective gases are a gas saturated with water vapor, a gas with5% over saturation of water vapor, and a gas with 5% under saturation (see table 8.1).
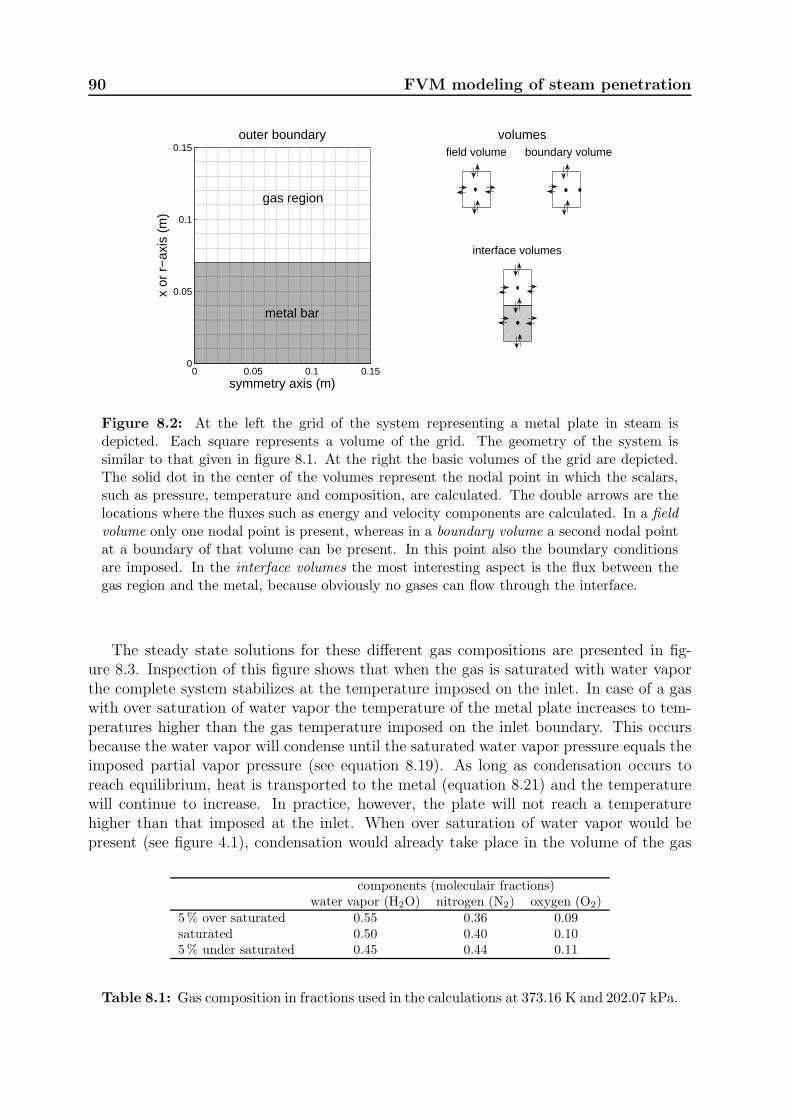
90 FVM modeling of steam penetration
0 0.05 0.1 0.150
0.05
0.1
0.15
metal bar
gas region
symmetry axis (m)
x or
r−
axis
(m
)
outer boundary
0 5 10 150
5
10
15volumes
0 5 10 150
5
10
15boundary volumefield volume
interface volumes
Figure 8.2: At the left the grid of the system representing a metal plate in steam isdepicted. Each square represents a volume of the grid. The geometry of the system issimilar to that given in figure 8.1. At the right the basic volumes of the grid are depicted.The solid dot in the center of the volumes represent the nodal point in which the scalars,such as pressure, temperature and composition, are calculated. The double arrows are thelocations where the fluxes such as energy and velocity components are calculated. In a field
volume only one nodal point is present, whereas in a boundary volume a second nodal pointat a boundary of that volume can be present. In this point also the boundary conditionsare imposed. In the interface volumes the most interesting aspect is the flux between thegas region and the metal, because obviously no gases can flow through the interface.
The steady state solutions for these different gas compositions are presented in fig-ure 8.3. Inspection of this figure shows that when the gas is saturated with water vaporthe complete system stabilizes at the temperature imposed on the inlet. In case of a gaswith over saturation of water vapor the temperature of the metal plate increases to tem-peratures higher than the gas temperature imposed on the inlet boundary. This occursbecause the water vapor will condense until the saturated water vapor pressure equals theimposed partial vapor pressure (see equation 8.19). As long as condensation occurs toreach equilibrium, heat is transported to the metal (equation 8.21) and the temperaturewill continue to increase. In practice, however, the plate will not reach a temperaturehigher than that imposed at the inlet. When over saturation of water vapor would bepresent (see figure 4.1), condensation would already take place in the volume of the gas
components (moleculair fractions)water vapor (H2O) nitrogen (N2) oxygen (O2)
5% over saturated 0.55 0.36 0.09saturated 0.50 0.40 0.105% under saturated 0.45 0.44 0.11
Table 8.1: Gas composition in fractions used in the calculations at 373.16 K and 202.07 kPa.
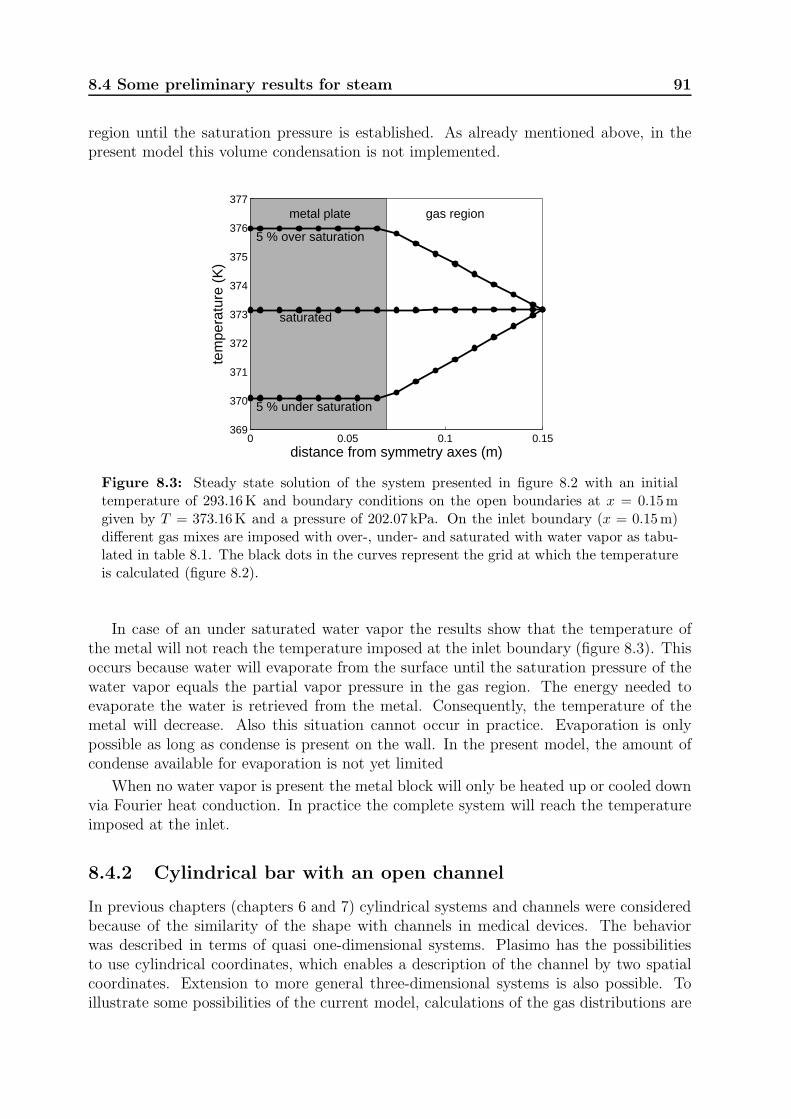
8.4 Some preliminary results for steam 91
region until the saturation pressure is established. As already mentioned above, in thepresent model this volume condensation is not implemented.
0 0.05 0.1 0.15369
370
371
372
373
374
375
376
377metal plate gas region
5 % over saturation
saturated
5 % under saturation
distance from symmetry axes (m)
tem
pera
ture
(K
)
Figure 8.3: Steady state solution of the system presented in figure 8.2 with an initialtemperature of 293.16K and boundary conditions on the open boundaries at x = 0.15mgiven by T = 373.16K and a pressure of 202.07 kPa. On the inlet boundary (x = 0.15m)different gas mixes are imposed with over-, under- and saturated with water vapor as tabu-lated in table 8.1. The black dots in the curves represent the grid at which the temperatureis calculated (figure 8.2).
In case of an under saturated water vapor the results show that the temperature ofthe metal will not reach the temperature imposed at the inlet boundary (figure 8.3). Thisoccurs because water will evaporate from the surface until the saturation pressure of thewater vapor equals the partial vapor pressure in the gas region. The energy needed toevaporate the water is retrieved from the metal. Consequently, the temperature of themetal will decrease. Also this situation cannot occur in practice. Evaporation is onlypossible as long as condense is present on the wall. In the present model, the amount ofcondense available for evaporation is not yet limited
When no water vapor is present the metal block will only be heated up or cooled downvia Fourier heat conduction. In practice the complete system will reach the temperatureimposed at the inlet.
8.4.2 Cylindrical bar with an open channel
In previous chapters (chapters 6 and 7) cylindrical systems and channels were consideredbecause of the similarity of the shape with channels in medical devices. The behaviorwas described in terms of quasi one-dimensional systems. Plasimo has the possibilitiesto use cylindrical coordinates, which enables a description of the channel by two spatialcoordinates. Extension to more general three-dimensional systems is also possible. Toillustrate some possibilities of the current model, calculations of the gas distributions are
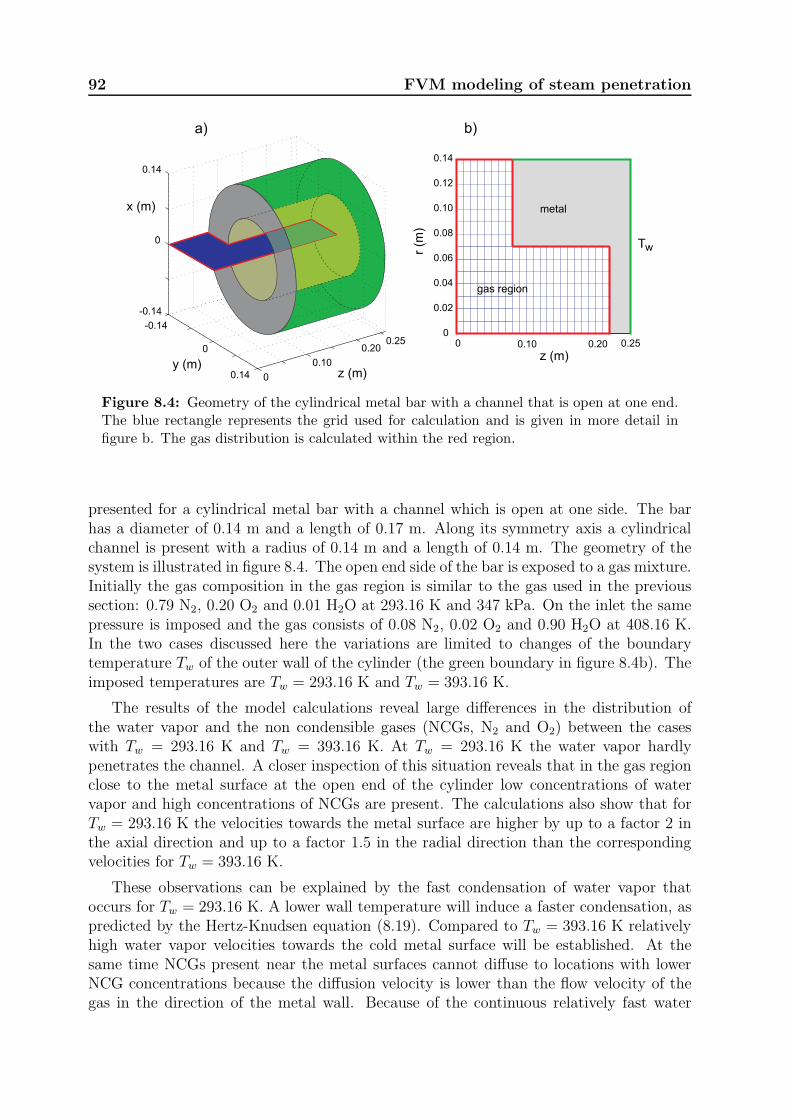
92 FVM modeling of steam penetration
0 0.10 0.20 0.250
0.02
0.04
0.06
0.08
0.10
0.12
0.14
r (m
)
z (m)
gas region
metal
Tw
b)
0
0.10
0.200.25
0.14
0
-0.14
-0.14
0
0.14
z (m)y (m)
a)
x (m)
Figure 8.4: Geometry of the cylindrical metal bar with a channel that is open at one end.The blue rectangle represents the grid used for calculation and is given in more detail infigure b. The gas distribution is calculated within the red region.
presented for a cylindrical metal bar with a channel which is open at one side. The barhas a diameter of 0.14 m and a length of 0.17 m. Along its symmetry axis a cylindricalchannel is present with a radius of 0.14 m and a length of 0.14 m. The geometry of thesystem is illustrated in figure 8.4. The open end side of the bar is exposed to a gas mixture.Initially the gas composition in the gas region is similar to the gas used in the previoussection: 0.79 N2, 0.20 O2 and 0.01 H2O at 293.16 K and 347 kPa. On the inlet the samepressure is imposed and the gas consists of 0.08 N2, 0.02 O2 and 0.90 H2O at 408.16 K.In the two cases discussed here the variations are limited to changes of the boundarytemperature Tw of the outer wall of the cylinder (the green boundary in figure 8.4b). Theimposed temperatures are Tw = 293.16 K and Tw = 393.16 K.
The results of the model calculations reveal large differences in the distribution ofthe water vapor and the non condensible gases (NCGs, N2 and O2) between the caseswith Tw = 293.16 K and Tw = 393.16 K. At Tw = 293.16 K the water vapor hardlypenetrates the channel. A closer inspection of this situation reveals that in the gas regionclose to the metal surface at the open end of the cylinder low concentrations of watervapor and high concentrations of NCGs are present. The calculations also show that forTw = 293.16 K the velocities towards the metal surface are higher by up to a factor 2 inthe axial direction and up to a factor 1.5 in the radial direction than the correspondingvelocities for Tw = 393.16 K.
These observations can be explained by the fast condensation of water vapor thatoccurs for Tw = 293.16 K. A lower wall temperature will induce a faster condensation, aspredicted by the Hertz-Knudsen equation (8.19). Compared to Tw = 393.16 K relativelyhigh water vapor velocities towards the cold metal surface will be established. At thesame time NCGs present near the metal surfaces cannot diffuse to locations with lowerNCG concentrations because the diffusion velocity is lower than the flow velocity of thegas in the direction of the metal wall. Because of the continuous relatively fast water
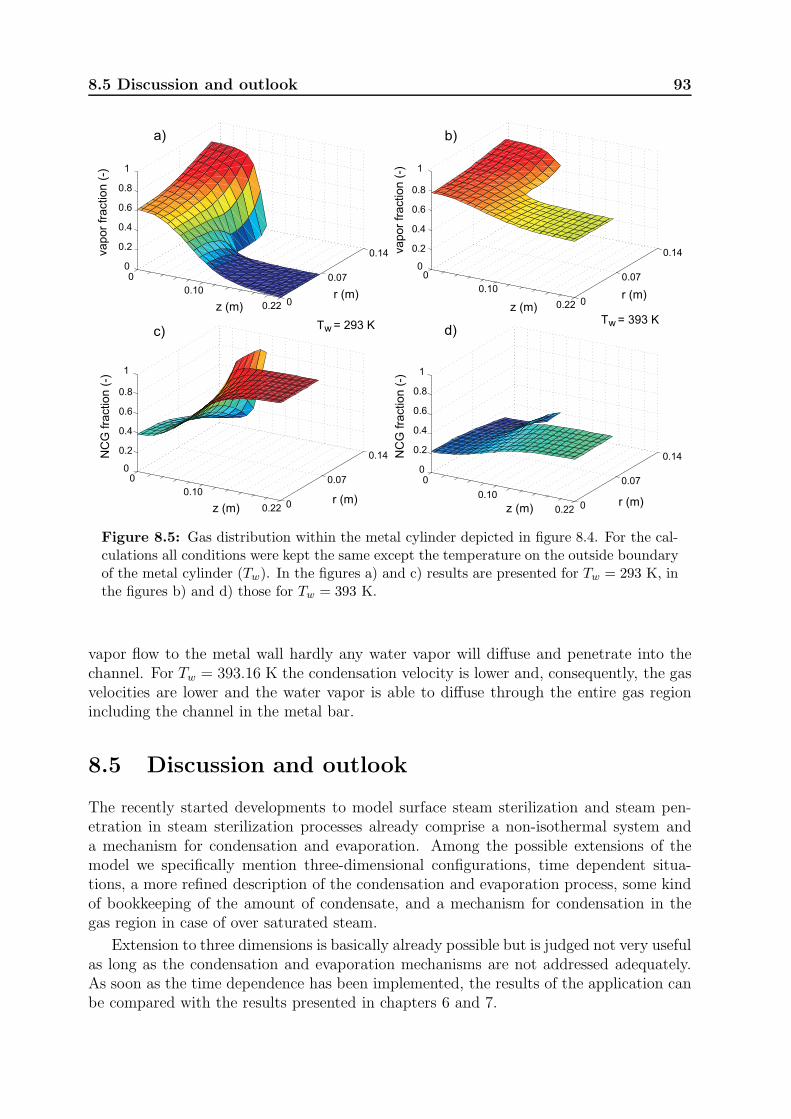
8.5 Discussion and outlook 93
0
0.10
0.22 0
0.07
0.14
0
0.2
0.4
0.6
0.8
1
r (m)
Tw = 293 K
z (m)
vapor
fraction (
-)
a)
0
0.10
0.22 0
0.07
0.14
0
0.2
0.4
0.6
0.8
1
r (m)z (m)
vapor
fraction (
-)
b)
0.10
0.22 0
0.07
0.14
0
0.2
0.4
0.6
0.8
1
r (m)z (m)
NC
G fra
ction (
-)
c)
0
0.10
0.22 0
0.07
0.14
0
0.2
0.4
0.6
0.8
1
r (m)z (m)
NC
G fra
ction (
-)
d)
0
Tw = 393 K
Figure 8.5: Gas distribution within the metal cylinder depicted in figure 8.4. For the cal-culations all conditions were kept the same except the temperature on the outside boundaryof the metal cylinder (Tw). In the figures a) and c) results are presented for Tw = 293 K, inthe figures b) and d) those for Tw = 393 K.
vapor flow to the metal wall hardly any water vapor will diffuse and penetrate into thechannel. For Tw = 393.16 K the condensation velocity is lower and, consequently, the gasvelocities are lower and the water vapor is able to diffuse through the entire gas regionincluding the channel in the metal bar.
8.5 Discussion and outlook
The recently started developments to model surface steam sterilization and steam pen-etration in steam sterilization processes already comprise a non-isothermal system anda mechanism for condensation and evaporation. Among the possible extensions of themodel we specifically mention three-dimensional configurations, time dependent situa-tions, a more refined description of the condensation and evaporation process, some kindof bookkeeping of the amount of condensate, and a mechanism for condensation in thegas region in case of over saturated steam.
Extension to three dimensions is basically already possible but is judged not very usefulas long as the condensation and evaporation mechanisms are not addressed adequately.As soon as the time dependence has been implemented, the results of the application canbe compared with the results presented in chapters 6 and 7.
94 FVM modeling of steam penetration
Presently, the condensation and evaporation of water is described by the Hertz-Knudsen equation. As already indicated above, a next step might be to refine the modelby using the Hertz-Knudsen-Schrage relation [148]. However, the estimates for the coeffi-cients in this equation reported in the literature differ by about two orders of magnitude.In our opinion, computations and experiments on simple, carefully chosen model systemscan be used to obtain appropriate values for these coefficients. Next, it might be usefulto include the properties and dynamics of the liquid film itself in an empirical way.
If the suggested improvements would be implemented, the model and application couldbe used to describe steam conditions on surfaces of items in steam sterilization processes.This includes surfaces of channels in items such as medical devices. The results can becompared with values reported in the literature to judge if steam sterilization conditionsare actually met (section 2.1 and 2.2).
The software application has a fully modular structure, which gives the possibility toextend the application to other sterilization methods, like ethylene oxide, formaldehyde,hydrogen peroxide, and even plasma sterilization. On the other hand, if an adequate modelfor condensation and evaporation would be implemented the model could, for example,also be used to model energy transport by steam in heat exchangers used in power plants.
Chapter 9
Discussion and outlook
Sterilization is recognized as an essential part of infection prevention (chapter 1 and 2).In the future, it may become even more essential, because more resistant microorgan-isms are developing and medicines may not be effective to cure contaminations anymore[151–153]. To develop adequate methods for infection prevention, a fundamental under-standing of infection prevention is essential. Because surface steam sterilization is a partof infection prevention and is the most frequently applied sterilization method worldwide,a fundamental understanding of surface steam sterilization is a necessity. Chapter 3 showsthat standards for steam sterilization defining the minimum requirements are not alwaysappreciated by hospitals. This raises the question whether the professionals in the fieldhave sufficient knowledge about the steam sterilization process.
Steam sterilization involves two main disciplines; microbiology and physics. Concern-ing the microbiology, the only useful data set found for steam sterilization is alreadymore than half a century old [31]. The specified time-temperature relations derived fromthis data set assume that saturated steam is present and contain safety margins that arenot justified by experimental data (table 2.1). With the present microbiological knowl-edge and equipment it may be possible to find a more complete and reliable relation forkilling viable organisms based on the degree of humidity, temperature and time. Untilthe moment that such an improved relation is established the current temperature-timecombinations with saturated steam (100% absolute humidity) have to be respected.
Concerning the physics, the chapters 4 and 5 conclusively show that the current knowl-edge of surface steam sterilization needs some adjustments. In chapter 4 it is shown thatwith the currently accepted inaccuracies of the measurements [51] it cannot be ensuredthat sterilization conditions are satisfied. Various improvements of the relevant proceduresand standards are suggested. Chapter 5 shows the limitations of the current F -value the-ory and contains a suggestion to adjust this theory in a way that extends its applicabilityto a larger temperature domain. For disinfection processes a similar theory is currentlyapplied, the so called A0-theory. Also the limitations of this theory can be investigatedin a similar way.
In the chapters 6, 7 and 8 it is demonstrated that steam penetration in narrow channelsduring steam sterilization processes is not trivial. Before roughly 1990 this was no seriousproblem, because loads to be sterilized consisted mainly of textiles and non-hollow in-struments. Since that time, however, complex instruments for Minimal Invasive Surgery,which may contain narrow channels, and other systems with narrow channels are morefrequently present. A detailed understanding of steam penetration in these instrumentsbecomes important. The studies presented in these chapters may contribute to such adevelopment. These chapters also show that direct measurements of temperature andpressure alone are not sufficient to ensure that steam sterilization conditions are actually
96 Discussion and outlook
present in case of complex loads. It appears that also the degree of steam saturation (orthe amount of non-condensible gases) has to be determined.
Given the fact that direct measurements of the steam penetration in narrow channelsare very complicated, physical models which are able to predict the sterilization conditionsin such systems are very useful. Two models presented in this thesis can already be usedin developments of channeled surgical instruments, process challenge devices, and steamsterilization processes. Further development of these models can extend their applicabil-ity to, for example, other sterilization processes and washing and cleaning processes inhealth care and food industry. Also in the designing phase of medical instruments anddecontamination equipment these models can be used to predict whether the specifiedsterilization criteria can be reached with a given process or in which way the processshould be adapted.
Overall it may concluded that the results of the studies described in this thesis can beused to improve the safety of decontamination processes of medical instruments, whichreduces patient discomfort and, at the same time, costs.
Appendices
A.1 Impact of studies
Shortly before the study reported in chapter 3 became available in the public domain areporter from a daily newspaper picked up this paper [104]. This resulted in a front pagearticle with the head line ‘unnecessary danger for infection’ [154]1 on Saturday, January 8,2005. The inspection body in the Netherlands reacted in this newspaper article as follows:‘It is quite possible that 60 % of the sterilizers do not meet the European standards. Butthat does not mean that the cleaned instruments swarm of pathogens that have survivedthe whole process. Usually they do not, not even with a sterilizer that does not fullymeet the standards’.2 This publication unleashed a series of publications in virtually allDutch daily newspapers and many in Belgium. Also national and regional radio stationsreported on this topic. A letter [155] referring to this paper was sent to the editor, pointingout that standards [95, 97, 98] are subject to interpretation and are sensitive to changesover time. This stresses the fact that standards are not necessarily state-of-the-art andcan or will be outdated by evidence from research (section 2.5). The amount of attentionalso shows that a broad public is interested in the subject of decontamination of medicaldevices, because it may affect them or their loved ones.
Also the studies reported in the chapters 4, 5 and 6 have received much interest in- andoutside of the field of infection prevention and decontamination. Spin-off studies [49, 50,134, 156] addressing more directly the daily practice in sterilization initiated discussionsand written responses [157–159] in the field of decontamination. An explanation for thislarge amount of interest could be that people involved, such as staff of CSSDs, or salespersons felt responsible, addressed or sometimes even provoked.
As the aim of this thesis is ‘to contribute to the fundamental understanding of surfacesteam sterilization, steam sterilization processes, and the penetration of steam in medicalinstruments with narrow channels’ (section 1.3), our published work so far has at leaststarted various discussions and reconsiderations of common surface steam sterilizationtopics. These discussions can be conclusively closed if evidence based information is usedto write standards, pharmacopoeias, and legislation, and when such information prevailsabove opinions and marketing considerations.
A.2 Steam penetration test
In standards steam penetration tests are tests that have to be performed daily before asteam sterilizer is used for production [52, 53, 70, 71, 80, 100]. The intention of such a
1Original Dutch title: ‘Onnodig gevaar infecties’.2Original Dutch text: ‘Het is goed mogelijk dat 60 procent van de sterilisatoren niet aan de Europese
normen voldoet. Maar dat betekent nog niet dat de schoongemaakte instrumenten krioelen van de ziekteverwekkers. Die overleven het hele proces meestal niet, ook niet bij een sterilisator die misschien niethelemaal aan de normen voldoet’.
98 Appendices
test is to verify if the steam penetration capacity of a sterilization process is similar asbefore. The original steam penetration test was developed by Bowie and Dick [32] inthe early 1960s. It was meant as an easy to build and use test for steam sterilizers inhospitals. It makes use of a defined stack of Huckaback towels. These towels were chosenbecause they were commonly available in hospitals. In the middle of the stack of towelsan unglazed 10 x 8 inch sheet of paper with a St. Andrews cross of chemical indicatortape is positioned. The stack of towels with indicator sheet is placed in the sterilizer anda process is started. After the process the sheet with indicator tape has to be taken outof the textile stack and the color change of the indicator tape has to be judged. Whenthe indicator tape shows an uniform color change the test is considered to be a good or‘pass’ result: The sterilizer can be used for production. If not, the sterilizer is not readyfor use and adequate action has to be taken.
Basically the purpose of the test is to detect if all non condensible gases (NCGs) areremoved from the steam sterilizer chamber before starting the actual sterilization phaseand to keep this condition at the aimed temperature until the end of the sterilizationphase (see figure 2.2). Common causes of NCGs in a steam sterilizer are:
1. Leaks in the sterilizer. This includes the appendages or ductwork, such as the valvesand gaskets (see figure 2.1).
2. Insufficient deep air removal in the conditioning phase of the steam sterilizationprocess (see figure 2.2).
3. NCGs introduced with the steam.
Current steam penetration tests are based on ink [50, 160] or on physical measurements[134] and have to comply with the standards [70, 71, 80, 100]. Such a test does not haveto be representative for a load or apecific medical devices.
A.3 Packing of Medical Devices
To ensure sterility of sterilized Medical Devices these either have to be used immediatelyafter opening the sterilizer or have to be protected from re-contamination. In this contextimmediately means that after opening the sterilizer the sterilized items are instantaneouslyused in the same room. Most often that is not possible; the item is not immediately usedor the sterilizer is located in a different room or even in a different building. In thesesituations the sterilized items have to be protected to avoid re-contamination with amicrobiological barrier but should also be protected against damage during transportation.For Medical Devices such as medicines in glass ampules or bottles the glass forms boththe microbiological barrier and the protection against damaging.
Re-usable Medical Devices can be packed individually or in sets. Sets are a combi-nation of medical Devices, such as instruments that are used together in a procedure insurgery. To protect the devices against re-contamination and damage packaging systemsare used [161, 162]. It is important to realize that a sterilization agent is only effectivewhen it is in contact with the organism. Therefore the microbiological barrier has to bepenetrable for the sterilization agent used. However, the microbiological barrier has to be
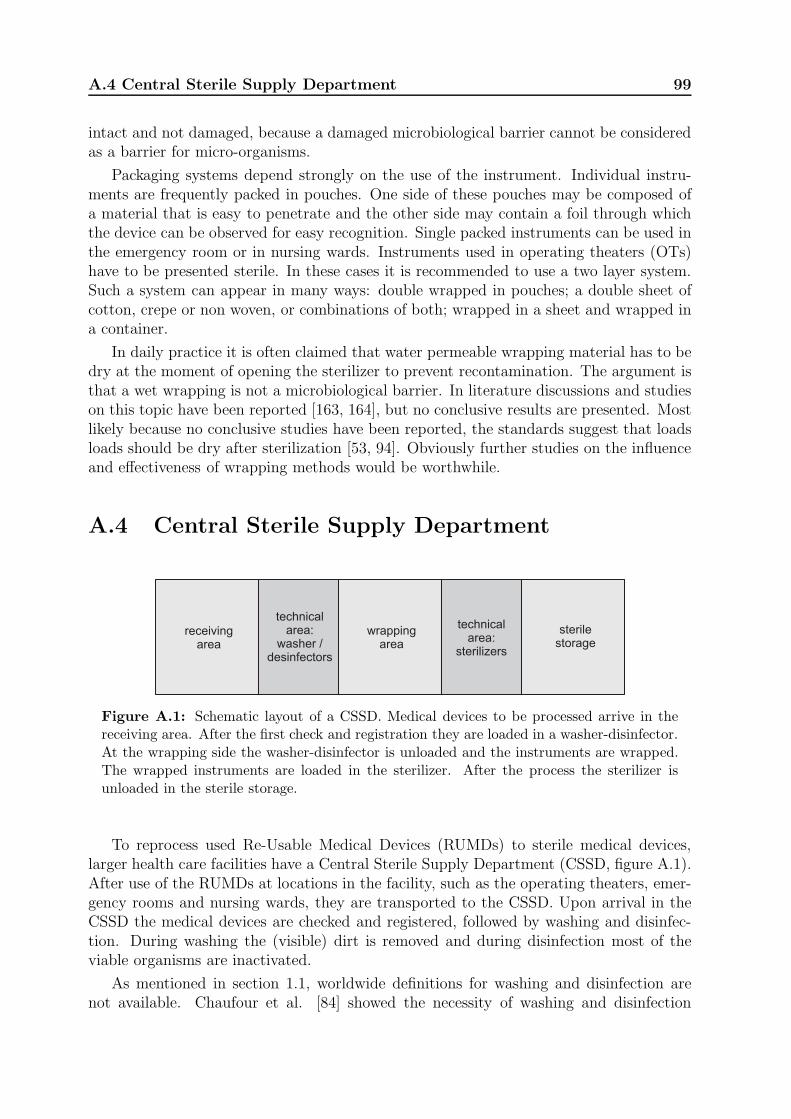
A.4 Central Sterile Supply Department 99
intact and not damaged, because a damaged microbiological barrier cannot be consideredas a barrier for micro-organisms.
Packaging systems depend strongly on the use of the instrument. Individual instru-ments are frequently packed in pouches. One side of these pouches may be composed ofa material that is easy to penetrate and the other side may contain a foil through whichthe device can be observed for easy recognition. Single packed instruments can be used inthe emergency room or in nursing wards. Instruments used in operating theaters (OTs)have to be presented sterile. In these cases it is recommended to use a two layer system.Such a system can appear in many ways: double wrapped in pouches; a double sheet ofcotton, crepe or non woven, or combinations of both; wrapped in a sheet and wrapped ina container.
In daily practice it is often claimed that water permeable wrapping material has to bedry at the moment of opening the sterilizer to prevent recontamination. The argument isthat a wet wrapping is not a microbiological barrier. In literature discussions and studieson this topic have been reported [163, 164], but no conclusive results are presented. Mostlikely because no conclusive studies have been reported, the standards suggest that loadsloads should be dry after sterilization [53, 94]. Obviously further studies on the influenceand effectiveness of wrapping methods would be worthwhile.
A.4 Central Sterile Supply Department
receivingarea
technicalarea:
washer /desinfectors
technicalarea:
sterilizers
wrappingarea
sterilestorage
Figure A.1: Schematic layout of a CSSD. Medical devices to be processed arrive in thereceiving area. After the first check and registration they are loaded in a washer-disinfector.At the wrapping side the washer-disinfector is unloaded and the instruments are wrapped.The wrapped instruments are loaded in the sterilizer. After the process the sterilizer isunloaded in the sterile storage.
To reprocess used Re-Usable Medical Devices (RUMDs) to sterile medical devices,larger health care facilities have a Central Sterile Supply Department (CSSD, figure A.1).After use of the RUMDs at locations in the facility, such as the operating theaters, emer-gency rooms and nursing wards, they are transported to the CSSD. Upon arrival in theCSSD the medical devices are checked and registered, followed by washing and disinfec-tion. During washing the (visible) dirt is removed and during disinfection most of theviable organisms are inactivated.
As mentioned in section 1.1, worldwide definitions for washing and disinfection arenot available. Chaufour et al. [84] showed the necessity of washing and disinfection
100 Appendices
before sterilization. It is also a safety measure to protect the CSSD staff from beingcontaminated during the handling of the devices, e.g., wrapping of the devices. Generally,automated washing and disinfection is considered to be more reproducible than manualprocedures [165, 166]. Most often washing and disinfection is performed in one machine.After washing and disinfection the devices are wrapped in microbiological barrier anda protection against damaging (appendix A.3). After that the devices are sterilized.Once sterilized the wrapped RUMDs are stored in a sterile storage from where they aredistributed to locations where they will be used.
To prevent re-contamination and to avoid mixing of processed and not processedmedical devices, Good Manufacturing Practicing (GMP3) is applied for the processingof medical devices. The GMP institute4 specifies how to design, specify and practiceprocedures to minimize errors in production. Applying GMP in a CSSD often impliesa one way routing for the medical devices. A medical device goes from stage to stagewithout going back and without intersecting, or returning to, a former stage. Double-door washer-disinfectors and sterilizers conform to the GMP routing. These machines canbe loaded at one (‘dirty’) side and unloaded at the other (‘clean’) side.
Many microorganisms that are infectious for living creatures need a carrier to betransported (section 1.1) [15, 16]. This can be an instrument, a liquid or a person,but also an airborne particle. Airborne particles will flow in the direction of the lowestpressure. By applying a pressure hierarchy in a CSSD the air flow can be controlledand with that the flow of potentially contaminated airborne particles. RUMDs arrivein the receiving area of the CSSD. Obviously this area has to be classified as dirty andcontaminated. By keeping this area at a lower pressure than the pressure in a facility,airborne particles will flow into this area. Only trained staff with protective clothingis present in this area. Additional potentially contaminated particles entering this areawill not increase the risk for the staff. A typical pressure for this area is 5 Pa belowenvironmental or facility pressure. By keeping the wrapping area at a higher pressurethan the facility pressure, particles will flow from this area into the receiving area (figureA.1). This helps to prevent re-contamination of the instruments after washing-disinfectionand before sterilizing. It can be argued that the sterile storage should be the cleanest areabecause the sterilized items are stored in there. An overpressure of 10 Pa compared tothe facility pressure might be applied. However, it can also be argued that in the sterilestorage the instruments are protected against recontamination and that during wrappingthe probability of recontamination is the highest. In that case the wrapping area shouldbe at a higher pressure than the storage area; the sterile storage can have an overpressureof 5 Pa and the wrapping area an overpressure of 10 Pa. In the technical areas (figure A.1)the washer-disinfectors and sterilizers are situated, with the loading door in the ‘dirty’area and the unloading door in ‘clean’ area. These technical areas are often considered
3GMP refers to the Good Manufacturing Practice Regulations promulgated by the US Food and DrugAdministration under the authority of the Federal Food, Drug, and Cosmetic Act. Their regulations,which have the status of a law, require that manufacturers, processors, and packagers of drugs, medicaldevices, some food, and blood, take proactive steps to ensure that their products are safe, pure, andeffective. GMP regulations require a quality approach to manufacturing, enabling companies to minimizeor eliminate instances of contamination, mix-ups, and errors.
4The GMP institute is a division of the ISPE, the International Society for Pharmaceutical Engineer-ing. http://www.gmp1st.com/ and http://www.ispe.org/, last accessed 31 August 2013.
A.4 Central Sterile Supply Department 101
to be the most dirty areas of the CSSD. These two technical areas might be kept at thelowest level pressure, e.g., 10 Pa below the facility pressure.
To maintain the pressure hierarchy in a CSSD airlocks have to be present betweenthe facility and the receiving area, between the receiving area and the wrapping area,between the wrapping area and the sterile storage, and between the sterile storage andthe facility. In practice also the movement of staff has to be implemented in the CSSDlayout. Staff members working in a CSSD are wearing special clothing. In the receivingarea often protective clothing is used to reduce the risk to contaminate the instrumentsand the risk of getting contaminated. Because of this special clothing, staff cannot exitthe CSSD and enter the hospital without precautions. Therefore areas such as dressingrooms and a coffee room have to be included in the total layout of a CSSD.

102 Appendices
Bibliography
[1] Soto LE, Bobadilla M, Villalobos Y, Sifuentes J, Avelar J, Arrieta M, and Poncede Leon S. Post-surgical nasal cellulitis outbreak due to Mycobacterium chelonae.Journal of Hospital Infection, 19:99–106, 1991.
[2] Grange JM. Mycobacterial infections following heart valve replacement. The Jour-nal of Heart Valve Disease, 1:102–109, 1992.
[3] Chadha R, Grover M, Sharma A, Lakshmy A, Deb M, Kumar A, and Mehta G.An outbreak of post-surgical wound infections due to Mycobacterium abscessus.Pediatric Surgery International, 13:406–410, 1998.
[4] Meyers H, Brown-Elliott BA, Moore D M, Curry J, Truong C, Zhang Y, and WallaceRJ. An outbreak of Mycobacterium chelonae infection following liposuction. ClinicalInfectious Diseases, 34:1500–1507, 2002.
[5] Ding Y, Lin M, Liu H, Zhang W, and Li Y. Wang L. Outcomes of post-cataractsurgery endophthalmitis referred to a tertiary center from local hospitals in thesouth of China. Infection, 39:451–460, 2011.
[6] Shapiro H edited by Selin H. Medicine Across Cultures. Kluwer Academic Publish-ers, Dordrecht, the Netherlands, 2003.
[7] Alt KW, Jeunesse C, Buitrago-Tellez CH, Wachter R, Boes E, and Pichler SL.Evidence for stone age cranial surgery. Nature, 22:360, 1997.
[8] Adamson PB. Surgery in ancient Mesopotamia. Medical History, 35:428–435, 1991.
[9] Nunn JF. Ancient Egyptian Medicine. University of Oklahoma Press, Oklahoma,2002.
[10] Egertom FN. Leeuwenhoek as a founder of animal demography. Journal of theHistory of Biology, 1:1–22, 1968.
[11] Debre P. Louis Pasteur. Baltimore (MD), John Hopkins University Press, 2000.Translated by Foster E.
[12] Brock TD. Robbert Koch: A life in Medicine and Bacteriology. Springer Verlag,Berlin, 1999.
[13] Semmelweis translation by K Codell Carter. The etiology, concept, and prophylaxisof childbed fever. The University of Wisconsin Press, Madison (WI), 1983.
[14] Lister J. On the antiseptic principle in the practice of surgery. The Lancet, 90:353–356, 1867.
[15] Mangram AJ, Horan TC, , Pearson ML, Silver LC, and Jarvis WR; The HospitalInfection Control Practices Advisory Committee. Special Report: Guideline for Pre-vention of Surgical Site Infection, 1999. Biomedical Instrumentation & Technology,20:247–278, 2012.
[16] APIC Bioterrorism Task Force: English JF, Cundiff MY, Malone JD, and PfeifferJA. Bioterrorism Readiness Plan: A Template for Healthcare Facilities Document.Report, 1999.
104 BIBLIOGRAPHY
[17] Unnevehr LJ and Jensen HH. The economic implications of using HACCP as a foodsafety regulatory standard. Food Policy, 24:625–635, 1999.
[18] Russell AD, Hugo WB, and Ayliffe GAJ. Preservation and Sterilization. BlackwellScientific Publications, Oxford, 2nd edition, 1992.
[19] Joslyn JL. Sterilization by heat, pages 495–526. Disinfection, Sterilization andPreservation, edited by Block SS. Lea and Febiger, Philadelphia, 4th edition, 1991.
[20] Sykes G. Disinfection & Sterilization. E & FN Spon Ltd, London, 2nd edition, 1967.
[21] Bassett DC, Stokes KJ, and Thomas WR. Pseudomonas multivorans: a water-bornecontaminant of disinfectant solutions. The Lancet, 295:1188–1191, 1970.
[22] International Organization for Standardization. ISO 15883Washer-disinfectors Part1: General requirements, terms and definitions and tests. ISO standard, 2006.
[23] European Committee for Standardiation. EN 556 sterilization of medical devices- Requirements for medical devices to be designated ‘sterile’. European standard,2001.
[24] International Organization for Standardization. ISO 11139 sterilization of healthcare products - Vocabulary. ISO standard, 2006.
[25] European Committee for Standardization. Bundel Steriliseren en Steriliteit. MedicalDevice Directive 93/42/EEG, 1993.
[26] Savage RM. Experiments on the sterilising effects of mixtures of air and steam, andof superheated steam. Pharmacy and Pharmacology, 1:451–462, 1937.
[27] Bigelow WD. The logarithmic nature of thermal death time curves. Journal ofInfectious Diseases, 29:528–536, 1921.
[28] Rahn O. The problem of the logarithm order of death in bacteria. Biodynamica,4:82–130, 1943.
[29] Brooks DC and Harlyn H. Dependence of the heat resistance of bacterial endosporeson their dipicolinic acid contents. Nature, 183:124–125, 1959.
[30] Korczynski MS. Concepts and issues-container/closure microbial validation. Journalof Parenteral Drug Association, 34:277–285, 1980.
[31] Working Party on Pressure Steam Sterilizers of the Medical Research Council. Ster-ilisation by steam under increased pressure. The Lancet, 273:425–435, 1959.
[32] Bowie JH, Kelsey JC, and Thompson GR. The Bowie and Dick autoclave tape test.The Lancet, 281:568–569, 1963.
[33] Working Party on Pressure Steam Sterilizers of the Medical Research Council. Ster-ilisation by steam under increased pressure. The Lancet, 276:1243–1244, 1960.
[34] Working Party on Pressure Steam Sterilizers of the Medical Research Council. Ster-ilisation by steam under increased pressure. The Lancet, 284:193–195, 1964.
[35] Knox MD and Pickerill JK. Efficient air removal from steam sterilizers without theuse of high vacuum. The Lancet, 283:1218–1321, 1964.
[36] Knox MD and Penikett MB. Influence of initial vacuum on steam sterilization ofdressings. British Medical Journal, 1:680–682, 1958.
BIBLIOGRAPHY 105
[37] Penikett EJK, Rowie TW, and Robson E. Vacuum drying of steam sterilized dress-ings. Journal of Applied Microbiology, 21:282–290, 1958.
[38] Miccoli P, Berti P, Raffaelli M, Materazzi G, Baldacci S, and Rossi G. Compari-son between minimally invasive video-assisted thyroidectomy and conventional thy-roidectomy: A prospective randomized study. Surgery, 130:1039–1043, 2001.
[39] Kepler CK, Yu AL, Gruskay JA, Delasotta LA, Radcliff KE, Rihn JA, Hilibrand AS,Anderson DG, and Vaccaro AR. Comparison of open and minimally invasive tech-niques for posterior lumbar instrumentation and fusion after open anterior lumbarinterbody fusion. The Spine Journal, 13:489–497, 2013.
[40] Meehan JJ and Sandler A. Pediatric robotic surgery: A single-institutional re-view of the first 100 consecutive cases. Surgical endoscopy and other interventionaltechniques, 22:177–182, 2008.
[41] McGirt MJ, Parker SC, Lerner J, Engelhart L, Knight T, and Wang MY. Compar-ative analysis of perioperative surgical site infection after minimally invasive versusopen posterior/transforaminal lumbar interbody fusion: analysis of hospital billingand discharge data from 5170 patients. Journal of Neurosurgery: Spine, 14:771–778,2011.
[42] Fullum TM, Ladapo JA, Borah BJ, and Gunnarsson CL. Comparison of the clinicaland economic outcomes between open and minimally invasive appendectomy andcolectomy: evidence from a large commercial payer database. Surgical endoscopyand other interventional techniques, 24:845–853, 2010.
[43] Straumann D, Valderrabano V, Eckstein M, Dick W, and Dora C. Cost-benefitanalysis of MIS THA: Model-based analysis of the consequences for Switzerland.Hip International, 16:54–57, 2006.
[44] Agalloco JP, Akers JE, and Madsen RE. Moist heat sterilization, Myths and Real-ities. Journal of Pharmaceutical Science & Technology, 52:346–350, 1998.
[45] Agalloco JP, Akers JE, and Madsen RE. Revisiting the moist heat sterilizationmyths. Journal of Pharmaceutical Science & Technology, 63:89–102, 2009.
[46] Woedtke T von and Kramer A. The limits of sterility assurance. Krankenhaushy-giene Interdisziplinar, 3(3):1–10, 2008.
[47] Srun SW, Nissen BJ, Bryans TD, and Bonjean M. Medical devices SALS andsurgical site infection: A mathematical model. Infection Control and Hospital Epi-demiology, 46:230–237, 2012.
[48] Kremmel M and Laudner W. The performance of process challenge devices (PCDs)used to check air removal from hollow instruments and effectiveness of sterilisationin steam sterilisation process. Central Service, 2:101–104, 2011.
[49] Esen S, Willner A, and Doornmalen JPCM van. One set of requirements for steampenetration tests is enough. Central Service, 5:365–367, 2011.
[50] Esen S, Tessarolo F, Hermsen RJ, and Doornmalen JPCM van. Current referencedevices for hollow instrument loads as defined in standards are not a valid steampenetration test. Central Service, 4:256–260, 2012.
[51] European Committee for Standardization. EN 285 Sterilization - Steam sterilizers- Large sterilizers (includes Amendment A2:2009). European standard, 2009.
106 BIBLIOGRAPHY
[52] European Committee for Standardization. EN 13060, Small Steam Sterilizers. Eu-ropean standard, 2004.
[53] International Organization for Standardization. ISO 17665-1 Sterilization of healthcare products - Moist heat - Part 1: Requirements for the development, validationand routine control of a sterilization process for medical devices. ISO standard,2006.
[54] Ray CG and Ryan KJ. Sherris Medical Microbiology. McGraw-Hill, London, 5th
edition, 2010.
[55] Rutala WA and Weber DJ. Guideline for disinfection and sterilization of prion-contaminated medical instruments. Infection control and hospital epidemiology,31:107–117, 2010.
[56] Jarry C, Chaput C, Chenite A, Renaud MA, Buschmann M, and Leroux JC. Effectsof steam sterilization on thermogelling Chitosan-based gels. Journal of biomedicalmaterial research, 58:127–135, 2001.
[57] Chansiri G, Lyons RT, Patel MV, and Hem SL. Effect of surface charge on thestability of oil/water emulsions during steam sterilization. Journal of pharmaceuticalsciences, 88:454–458, 1999.
[58] Schmutz CW and Muhlebach SF. Stability of succinylcholine chloride injection.American Journal of Hospital Pharmacy, 48:501–506, 1991.
[59] Asten JAAM van and Dorpema JW. A new approach to sterilization conditions:The IMO concept. Pharmaceutisch Weekblad, 4:49–56, 1982.
[60] International Organization for Standardization. ISO 15883Washer-disinfectors Part2: Requirements and tests for washer-disinfectors employing thermal disinfectionfor surgical instruments, anesthetic equipment, bowls, dishes, receivers, utensils,glassware, etc. ISO standard, 2006.
[61] International Organization for Standardization. ISO 15883Washer-disinfectors Part4: Requirements and tests for washer-disinfectors employing chemical disinfectionfor thermolabile endoscopes. ISO standard, 2008.
[62] Sessler DI, McGuire J, Hynson J, Moayeri, and Heier T. Thermoregulatory vaso-constriction during isoflurane anesthesia minimally decreases cutaneous heat loss.Anesthesiology, 76:670–675, 1992.
[63] Singh J, Bhatia R, Gandhi JC, Kaswekar AP, Khare S, Patel SB, Oza VB, JainDC, and Sokhey J. Outbreak of viral hepatitis B in a rural community in Indialinked to inadequately sterilized needles and syringes. Bulletin of the World HealthOrganization, 76:93–98, 1998.
[64] Esel D, Doganay M, Bozdemir N, Yildiz O, Tezcaner T, Sumerkan B, Aygen B, andSelcuklu A. Polymicrobial ventriculitis and evaluation of an outbreak in a surgicalintensive care unit due to inadequate sterilization. Journal of Hospital Infection,50:170–174, 2002.
[65] Lo Passo C, Pernice I, Celeste A, Perdichizzi G, and Todaro-Luck F. Transmission ofTrichosporon Asahii Oesophagitis by a contaminated endoscope. Mycoses, 44:13–21,2001.
[66] Roy K, Ahmed S, Cameron S, Shaw L, Yirrell D, and Goldberg D. Patient no-tification exercise following a dentist admission of the periodic use of unsterilizedequipment. Journal of Hospital Infection, 60:163–168, 2005.
BIBLIOGRAPHY 107
[67] Hellinger WC, Hasan SA, Bacalis LP, Thornblom DM, Beckmann SC, BlackmoreC, Forster TS, Tirey JF, Ross MJ, Nilson CD, Mamalis N, Crook JE, Bendel RE,Shetty R, Stewart MW, Bolling JP, and Edelhauser HF. Outbreak of toxic anteriorsegment syndrome following cataract surgery associated with impurities in autoclavesteam moisture. Infection Control and Hospital Epidemiology, 27:294–298, 2006.
[68] Dancer SJ, Stewart M, Coulombe C, Gregori A, and Virdic M. Surgical site infec-tions linked to contaminated surgical instruments. Journal of Hospital Infection,81:231–238, 2012.
[69] Doornmalen JPCM van, Verschueren M, Rietmeijer AGM, and Dankert J. Hetsteriliseren van tandheelkundige instrumenten. Nederlands Tijdschrift voor Tand-heelkunde, 108:269–272, 2001.
[70] International Organization for Standardization. ISO 11140-4 Sterilization of healthcare products - Chemical indicators - Part 4: Class 2 indicators as an alternativeto the Bowie and Dick-type test for detection of steam penetration. ISO standard,2007.
[71] International Organization for Standardization. ISO 11140-5 Sterilization of healthcare products - Chemical indicators - Part 5: Class 2 indicators for Bowie andDick-type air removal tests. ISO standard, 2007.
[72] Wagner W, Cooper JR, Dittmann A, Kijima J, Kretzschmar HJ, Kruse A, MaresR, Oguchi K, Sato H, Stocker I, Sifner O, Takaishi Y, Tanishita I, and TrubenbachIJ. The IAWPS industrial formulation 1997 for the thermodynamic properties ofwater and steam. Transactions of the ASME, 122:150–182, 2000.
[73] Favero M. Concepts for Patient Safety, pages 110–119. Disinfection, Sterilizationand Antisepsis: Principles and Practices in Healthcare Facilities, edited by Ru-tala W. Association for Professionals in Infection Control and Epidemiology, Inc.,Washington, DC, 2001.
[74] World Health Organisation. IARC classifies formaldehyde as carcinogenicto humans. Press release Number 153, 2004. http://www.iarc.fr/en/media-centre/pr/2004/pr153.html (last assessed 31 August 2013).
[75] US Department of health and human Services. Occupational safety andhealth guideline for ethylene oxide potential human carcinogen. Report, 1994.http://www.cdc.gov/niosh/docs/81-123/pdfs/0275.pdf, (last assessed 31 August2013).
[76] International Atomic Energy Agency. Trends in radiation sterilization in healthcare products. Report, 2008. http://www-pub.iaea.org/MTCD/publications/PDF/Pub1313 web.pdf (last assessed 31 August 2013).
[77] International Organization for Standardization. ISO 11138-1 Sterilization of healthcare products - Biological indicators - Part 1: General requirements. ISO standard,2006.
[78] International Organization for Standardization. ISO 11138-3 Sterilization of healthcare products - Biological indicators - Part 3: Biological indicators for moist heatsterilization processes. ISO standard, 2006.
[79] International Organization for Standardization. ISO 11140-1 Sterilization of healthcare products - Chemical indicators - Part 1: General requirements. ISO standard,2005.
108 BIBLIOGRAPHY
[80] International Organization for Standardization. ISO 11140-3 sterilization of healthcare products - chemical indicators - Part 3: Class 2 indicator systems for use inthe Bowie and Dick-type steam penetration test. ISO standard, 2007.
[81] Precht JCH. Tempertur und Leben. Springer Verlag, Berlin, 1955.
[82] Hansen HH and Rieman H. Factors affecting the heat resistance of non-sporingorganisms. Journal of Applied Bacteriology, 26:314–333, 1963.
[83] Friedman CA and Henry BS. Bound water contents of vegetative and spore formsof bacteria. Journal of bacteriology, 36:99–105, 1938.
[84] Chaufour X, Deva AK, Vickery K, Zou J, Kumaradeva P, White GH, and CossartYE. Evaluation of disinfection and sterilization of reusable angioscopes with theduck hepatitis B model. Journal of Vascular Surgery, 30:277–282, 1999.
[85] Alfa MJ, Fatima I, and Olson N. Validation of adenosine triphosphate to audit man-ual cleaning of flexible endoscope channels. American Journal of Infection Control,41:245–248, 2013.
[86] Alfa MJ, Fatima I, and Olson N. The adenosine triphosphate test is a rapid andreliable audit tool to assess manual cleaning adequacy of flexible endoscope channels.American Journal of Infection Control, 41:249–253, 2013.
[87] Fushimi RMT, Takashina M, Yoshikawa H, Kobayashi H, Takashi Okubo T, NakataS, and Kaku M. Comparison of adenosine triphosphate, microbiological load, andresidual protein as indicators for assessing the cleanliness of flexible gastrointestinalendoscopes. American Journal of Infection Control, 41:161–164, 2013.
[88] Perkins JJ. Principles and Methods of Sterilization. Charles C Thomas, Springfield(IL), 1956.
[89] Slegers L and Seban RA. Laminar film condensation of steam containing smallconcentrations of air. International Journal of Heat and Mass Transfer, 13:1941–1947, 1970.
[90] Seungmin O and Shripad TR. Experimental and theoretical investigation of filmcondensation with noncondensable gas. International Journal of Heat and MassTransfer, 46:2523–2534, 2006.
[91] American National Standards Institute and Association for the Advancement ofMedical Instrumentation. ANSI/AAMI ST79:2010 & a1:2010 & a2:2011 & a3:2012Comprehensive guide to steam sterilization and sterility assurance in health carefacilities. 2012.
[92] Graham R. Sterilisation of instruments and dressings in general practice. TheLancet, 285:1109–1110, 1965.
[93] Muis B, de Bruijn ACP, Drongelen AW van, and Huys JFMM. Optimisation ofthe process for manually operated jacket steam sterilizers. RIVM report 318902011,2001.
[94] International Organization for Standardization. ISO 17665-2 Sterilization of healthcare products - Moist heat - Part 2: Guidance on the application of ISO 17665-1.ISO standard, 2009.
[95] European Committee for Standardization. EN 285 Sterilization - Steam sterilizers- large sterilizers. European standard, 1997.
BIBLIOGRAPHY 109
[96] European Committee for Standardization. EN 285 Sterilization - Steam sterilizers -Large sterilizers (includes Amendment A1:2008) english version of EN 285:2008-06.European standard, 2008.
[97] European Committee for Standardization. EN 554 sterilization of medical devices- Validation and routine control of sterilization by moist heat. European standard,1994.
[98] European Committee for Standardization. prEN 13060-1 to -4, Small Steam Ster-ilizers. European standard, 1997.
[99] Keene JH. Sterilization and pasteurization, pages 1189–1199. Hospital Epidemiologyand Infection Control, edited by Mayhall CG. Lippincott, Williams and Wilkins,Philadelphia, 2nd edition, 1999.
[100] European Committee for Standardization. EN 867-1 to -5, Non biological indicatorsfor use in sterilizers. European standard, 1997.
[101] Kueler RR and Smith H. Statistics, pages 243–256. New York, John Wiley & Sons,Inc., 1976.
[102] Schneider PM, Reich RR, Kirckhof SS, and Foltz WG. Performance of varioussteam sterilization indicators under optimum and sub-optimum exposure conditions.American Journal of Infection Control, 33:S55–67, 2005.
[103] Kelkar U, Bal MA, and Kilkarni S. Monitoring of steam sterilization process bybiologic indicators - a necessary surveillance tool. American Journal of InfectionControl, 32:512–513, 2004.
[104] Doornmalen JPCM van and Dankert J. A validation survey of 197 hospital steamsterilizers in The Netherlands in 2001 and 2002. Journal of Hospital Infection,59:126–130, 2005.
[105] US Pharmacopeia. United States Pharmacopeia Convention Inc, Rockville, MD,USA, 2000.
[106] European Pharmacopeia. Council of Europe, Strasbourg, France, 4th edition, 2002.
[107] Irvine TF Jr and Liley PE. Steam and gas tables with computer equations. Academicpress, Inc., Boca Raton (FL), 1984.
[108] Nyquist H. Certain topics in telegraph transmission theory. Transactions of theAIEE, 47:614–644, 1928.
[109] Shannon CE. Communication in the presence of noise. Proceedings of the Instituteof Radio Engineers, 37:10–21, 1949.
[110] American National Standards Institute and Association for the Advancement ofMedical Instrumentation. ANSI/AAMI ST 8 Hospital steam sterilizers. 2001.
[111] American National Standards Institute and Association for the Advancement ofMedical Instrumentation. ANSI/AAMI ST 44 Performance requirements for resis-tometers. 2002.
[112] American National Standards Institute and Association for the Advancement ofMedical Instrumentation. ANSI/AAMI ST 55 Table-top steam sterilizers. 2003.
[113] European Committee for Standardization. EN 866-1, -3 and -5, Biological indicatorsfor testing sterilizers and sterilization processes. European standard, 1997.
110 BIBLIOGRAPHY
[114] Allison DG. A review:Taking the sterile out of sterility. Journal of Applied Micro-biology, 87:789–793, 1999.
[115] American National Standards Institute and Association for the Advancement ofMedical Instrumentation. ANSI/AAMI ST 67 Sterilization of Health Care Products;Requirements for Products; requirements for Products Labeled ‘STERILE’. 2003.
[116] McKee S and Gould GW. A simple mathematical model of the thermal death ofmicroorganisms. Bulletin of Mathematical Biology, 50:493–501, 1988.
[117] Reichart O. Modelling and destruction of Escherichia Coli on the base of reactionkinetics. International Journal of Food Microbiology, 23:449–465, 1994.
[118] Doornmalen JPCM van and Kopinga K. Review of surface steam sterilization forvalidation purposes. American Journal of Infection Control, 36:86–92, 2008.
[119] Young JH. Sterilization of various diameter dead-end tubes. Biotechnology andBioengineering, 42:125–132, 1993.
[120] Lane CR, Cool GT, Kelsey JC, and Beeby MM. High-temperature sterilisation forsurgical instruments. The Lancet, 283:358–360, 1964.
[121] Moats WA. Kinetics of thermal death of Bacteria. The Journal of Bacteriology,105:165–171, 1971.
[122] Briggs A. The resistances of spores of the genus Bacillus to phenol, heat andradiation. Journal of Applied Bacteriology, 29:490–504, 1966.
[123] Boom FA, Paalman ACA, and Stout-Zonneveld A. A method for the determinationof the effectiveness of a sterilization process using bioburden and the bioburden heatresistance. Pharmaceutisch Weekblad, 6:209–216, 1984.
[124] Lambert RJW. A model for the thermal inactivation of microorganisms. Journalof Applied Microbiology, 95:500–507, 2003.
[125] Peleg M. Advanced Quantitative Microbiology for Food and Biosystems: Models forPredicting Growth and Inactivation. CRC Press, Boca Raton (FL), 2006.
[126] Doornmalen JPCM van and Kopinga K. Temperature dependence of F-, D- andz-values used in steam sterilization processes. Journal of Applied Microbiology,107:1054–1060, 2009.
[127] Young JH, Lasher WC, and Gaber R. Transport processes during sterilization ofvertical and 5 degree horizontal dead-leg. Bioprocess Engineering, 12:293–304, 1995.
[128] Bird RB, Stewart WE, and Lightfoot EN. Transport Phenomena. John Wiley &Sons Inc, New York, 2nd edition, 2007.
[129] Taylor G. Dispersion of soluble matter in solvent flowing slowly through a tube.Proceeding of the Royal Society (London), 219:186–203, 1953.
[130] Taylor G. Conditions under which dispersion of a solute in a stream of a solvent canbe used to measure molecular diffusion. Proceeding of the Royal Society (London),225:473–477, 1954.
[131] Ananthakrishnan V, Gill WN, and Barduhn J. Laminar Dispersion in Capillaries,Part i: Mathematical Analysis. American Institute of Chemical Engineers Journal,11:1063–1072, 1965.
BIBLIOGRAPHY 111
[132] Aris R. On the dispersion of a solute in a fluid flowing through a tube. Proceedingof the Royal Society, 235:67–77, 1956.
[133] Reid RC, Prausnitz JM, and Poling BE. The Properties of Gases and Liquids.McGraw-Hill, New York, 1987.
[134] Benoit F, Merger D, Hermsen RJ, and Doornmalen JPCM van. A comparisonof four commercially available electronic steam penetration tests according to ISO11140 part 4. Central Service, 3:180–185, 2011.
[135] Kaiser U and Gomann. Investigation of air removal from hollow devices in steamsterilisation processes. Central Service, 6:401–413, 1998.
[136] Doornmalen JPCM van, Verschueren M, and Kopinga K. Penetration of watervapour into narrow channels during steam sterilization processes. Journal of PhysicsD: Applied Physics, 46:065201, 2013.
[137] Minkowycz WJ and Sparrow EM. Condensation heat transfer in the presence ofnoncondensables, interfacial resistance, superheating, variable properties, and dif-fusion. International Journal of Heat and Mass Transfer, 9:1125–1144, 1966.
[138] Rose JW. Condensation of a vapour in the presence of a non-condensing gas.International Journal of Heat and Mass Transfer, 12:233–237, 1969.
[139] Al-Diwani HK and Rose JW. Free convection film condensation of steam in thepresence of non-condensing gases. International Journal of Heat and Mass Transfer,16:1359–1369, 1973.
[140] Oh S and Revankar ST. Experimental and theoretical investigation of film conden-sation with noncondensable gas. International Journal of Heat and Mass Transfer,49:2523–2534, 2006.
[141] Beks-Peerenboom K. Modeling of magnetized expanding plasmas. PhD thesis, Eind-hoven University of Technology, 2012.
[142] Dijk J van, Peerenboom K, Jimenez J, Mihailova D, and Mullen J van der. Theplasma modelling toolkit Plasimo. Journal of Physics D: Applied Physics, 42:194012,2009.
[143] Peerenboom KSC, Dijk J van, Goedheer WJ, Degrez G, and Mullen JJAM vander. A finite volume model for multi-component diffusion in magnetically confinedplasmas. Journal of Physics D: Applied Physics, 44:194006, 2011.
[144] Peerenboom KSC, Dijk J van, ten Thije Boonkkamp JHM ten, Liu L, GoedheerWJ, and Mullen JJAM van der. Mass conservative finite volume discretization ofthe continuity equations in multi-component mixtures. Journal of ComputationalPhysics, 230:3525–3537, 2011.
[145] Peerenboom KSC, Dijk J van, Goedheer WJ, and Mullen JJAM van der. On theambipolar constraint in multi-component diffusion problems. Journal of Computa-tional Physics, 230:3651–3655, 2011.
[146] Baehr HD and Stephan K. Heat and Mass Transfer. Springer, Berlin, 2nd edition,2006.
[147] Badam VK, Kumar V, Durst F, and Danov K. Experimental and theoretical in-vestigations on interfacial temperature jumps during evaporation. ExperimentalThermal and Fluid Science, 32:276–292, 2007.
112 BIBLIOGRAPHY
[148] Schrage R. A Theoretical Study of Interphase Mass Transfer. Columbia UniversityPress, New York, 1953.
[149] Ward CA and Fang G. Expression for predicting liquid evaporation flux: Statisticalrate theory approach. Physical Review E, 59:429–440, 1999.
[150] Patankar SV. Numerical Heat Transfer and Fluid Flow. McGraw-Hill, New York(NY), 1980.
[151] Bruchmann J, Kirchen S, and Schwartz T. Sub-inhibitory concentrations of antibi-otics and wastewater influencing biofilm formation and gene expression of multi-resistant Pseudomonas Aeruginosa wastewater isolates. Environmental Science andPollution Research, 20:3539–3549, 2013.
[152] Haill C, Fletcher S, Archer R, Jones G, Jayarajah M, Frame J, Williams A, KearnsAM, and Jenks PJ. Prolonged outbreak of meticillin-resistant Staphylococcus Au-reus in a cardiac surgery unit linked to a single colonized healthcare worker. Journalof Hospical Infection, 83:219–225, 2013.
[153] Ibrahim M, Bilal N, and Hamid M. Increased multi-drug resistant Escherichia colifrom hospitals in Khartoum state, Sudan. African Health Sciences, 12:368–375,2012.
[154] Geenen R van. Onnodig gevaar infecties. Algemeen Dagblad, 217:1, 3, 2005.
[155] Belgraver P. Steam sterilization in The Netherlands. Journal of Hospital Infection,61:177–178, 2005.
[156] Doornmalen JPCM van, Hermsen RJ, and Kopinga K. Six commercially availableClass 6 Chemical Indicators tested against their stated values. Central Service,6:400–404, 2012.
[157] Kaiser U and Kaiser D. Letter to the editor referring to the publication ‘Currentreference devices for hollow instrument loads as defined in standards are not a validsteam penetration test’ from Esen et al. Central Sterilization, 5:340–341, 2012.
[158] Roth K. Letter to ‘A comparison of four commercially available electronic steampenetration tests according to ISO 11140 part 4’. Central Service, 4:273–274, 2011.
[159] Fengler T. Letter to ‘A comparison of four commercially available electronic steampenetration tests according to ISO 11140 part 4’. Central Service, 4:274–275, 2011.
[160] Kirk B. An evaluation of nine Bowie and Dick test products available in the UnitedKingdom. Medical Device Decontamination, 17:1–11, 2012.
[161] International Organization for Standardization. ISO 11607-1 Packaging for termi-nally sterilized medical devices - Part 1: Requirements for materials, sterile barriersystems and packaging systems. ISO standard, 2006.
[162] International Organization for Standardization. ISO 11607-2 Packaging for termi-nally sterilized medical devices - Part 2: Validation requirements for forming, sealingand assembly processes. ISO standard, 2006.
[163] Moriya GA and Graziano KU. Sterility maintenance assessment of moist/wet ma-terial after steam sterilization and 30-day storage. Revista Latino-Americana deEnfermagem, 18:786–791, 2010.

BIBLIOGRAPHY 113
[164] Bruna CQ and Graziano KU. Temperature and humidity in the storage area ofsterile materials: a literature review. Revista Latino-Americana de Enfermagem,46:1215–1220, 2012.
[165] Babb JR. Methods of cleaning and disinfection. Britisch Journal of Theatre Nursing,3:12–14, 27–29, 1994.
[166] Babb JR. Comparison of automated systems for the cleaning and disinfection offlexible fibreoptic endoscopes. Journal of Hospital Infection, 5:213–226, 1984.

114 BIBLIOGRAPHY
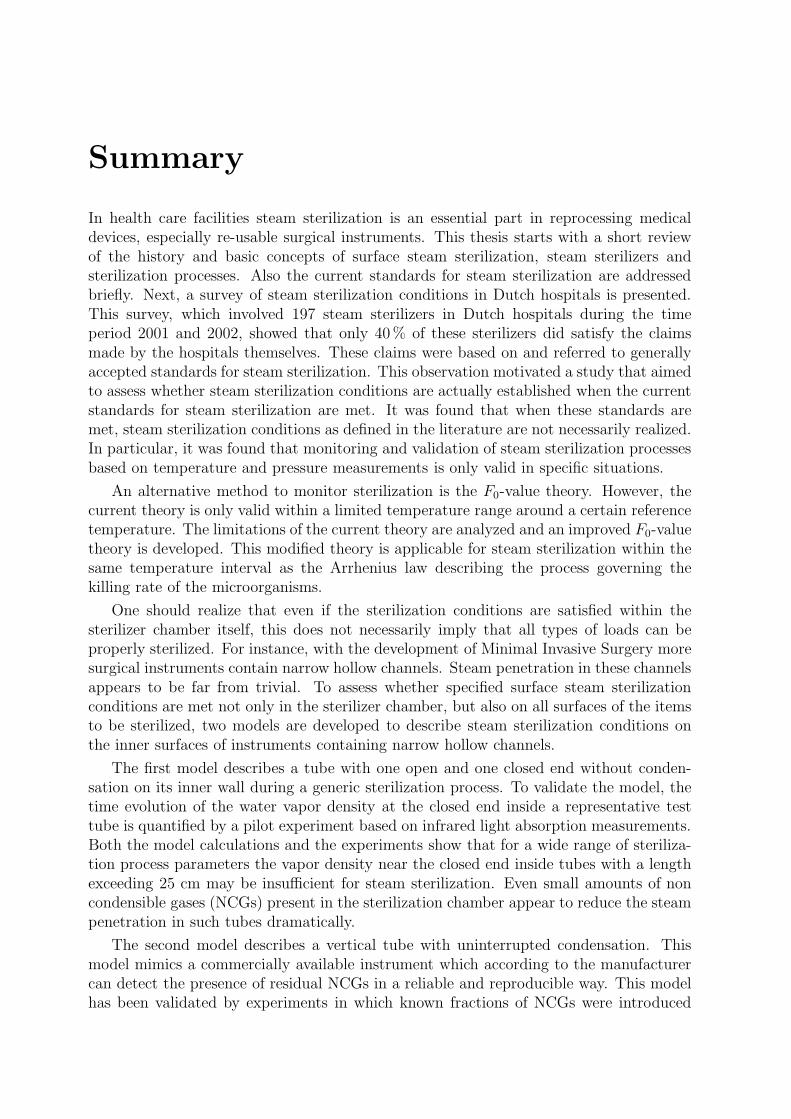
Summary
In health care facilities steam sterilization is an essential part in reprocessing medicaldevices, especially re-usable surgical instruments. This thesis starts with a short reviewof the history and basic concepts of surface steam sterilization, steam sterilizers andsterilization processes. Also the current standards for steam sterilization are addressedbriefly. Next, a survey of steam sterilization conditions in Dutch hospitals is presented.This survey, which involved 197 steam sterilizers in Dutch hospitals during the timeperiod 2001 and 2002, showed that only 40% of these sterilizers did satisfy the claimsmade by the hospitals themselves. These claims were based on and referred to generallyaccepted standards for steam sterilization. This observation motivated a study that aimedto assess whether steam sterilization conditions are actually established when the currentstandards for steam sterilization are met. It was found that when these standards aremet, steam sterilization conditions as defined in the literature are not necessarily realized.In particular, it was found that monitoring and validation of steam sterilization processesbased on temperature and pressure measurements is only valid in specific situations.
An alternative method to monitor sterilization is the F0-value theory. However, thecurrent theory is only valid within a limited temperature range around a certain referencetemperature. The limitations of the current theory are analyzed and an improved F0-valuetheory is developed. This modified theory is applicable for steam sterilization within thesame temperature interval as the Arrhenius law describing the process governing thekilling rate of the microorganisms.
One should realize that even if the sterilization conditions are satisfied within thesterilizer chamber itself, this does not necessarily imply that all types of loads can beproperly sterilized. For instance, with the development of Minimal Invasive Surgery moresurgical instruments contain narrow hollow channels. Steam penetration in these channelsappears to be far from trivial. To assess whether specified surface steam sterilizationconditions are met not only in the sterilizer chamber, but also on all surfaces of the itemsto be sterilized, two models are developed to describe steam sterilization conditions onthe inner surfaces of instruments containing narrow hollow channels.
The first model describes a tube with one open and one closed end without conden-sation on its inner wall during a generic sterilization process. To validate the model, thetime evolution of the water vapor density at the closed end inside a representative testtube is quantified by a pilot experiment based on infrared light absorption measurements.Both the model calculations and the experiments show that for a wide range of steriliza-tion process parameters the vapor density near the closed end inside tubes with a lengthexceeding 25 cm may be insufficient for steam sterilization. Even small amounts of noncondensible gases (NCGs) present in the sterilization chamber appear to reduce the steampenetration in such tubes dramatically.
The second model describes a vertical tube with uninterrupted condensation. Thismodel mimics a commercially available instrument which according to the manufacturercan detect the presence of residual NCGs in a reliable and reproducible way. This modelhas been validated by experiments in which known fractions of NCGs were introduced
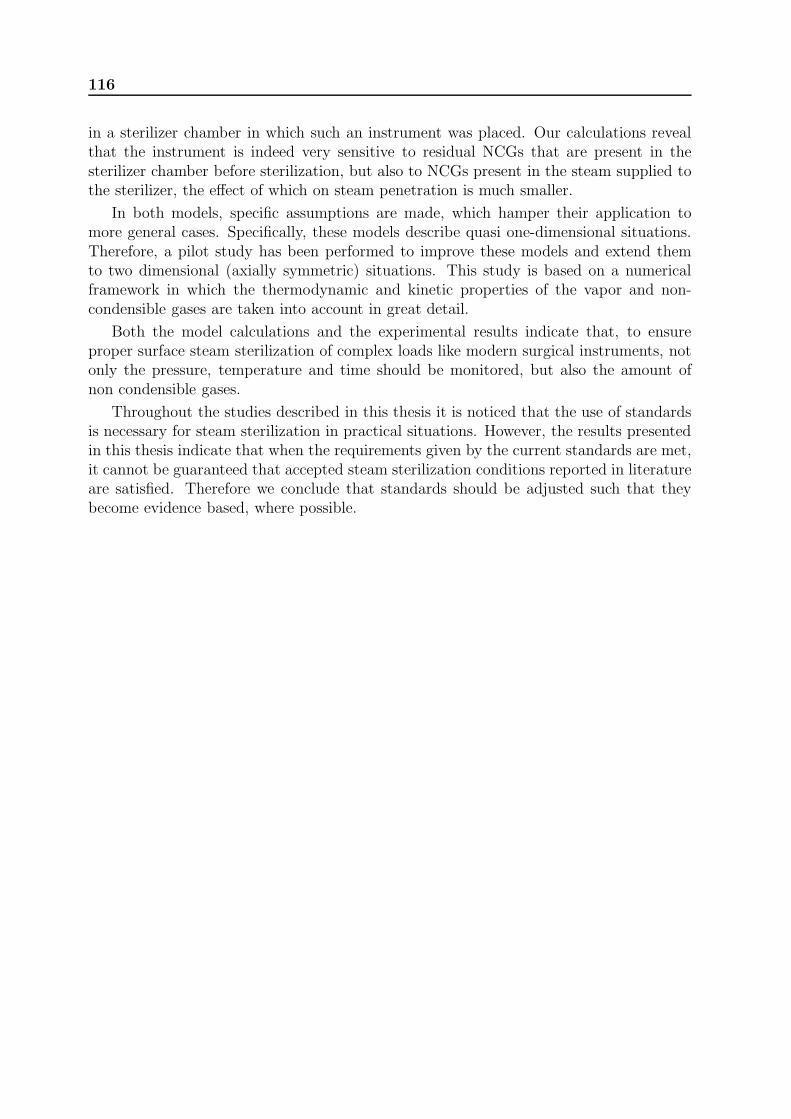
116
in a sterilizer chamber in which such an instrument was placed. Our calculations revealthat the instrument is indeed very sensitive to residual NCGs that are present in thesterilizer chamber before sterilization, but also to NCGs present in the steam supplied tothe sterilizer, the effect of which on steam penetration is much smaller.
In both models, specific assumptions are made, which hamper their application tomore general cases. Specifically, these models describe quasi one-dimensional situations.Therefore, a pilot study has been performed to improve these models and extend themto two dimensional (axially symmetric) situations. This study is based on a numericalframework in which the thermodynamic and kinetic properties of the vapor and non-condensible gases are taken into account in great detail.
Both the model calculations and the experimental results indicate that, to ensureproper surface steam sterilization of complex loads like modern surgical instruments, notonly the pressure, temperature and time should be monitored, but also the amount ofnon condensible gases.
Throughout the studies described in this thesis it is noticed that the use of standardsis necessary for steam sterilization in practical situations. However, the results presentedin this thesis indicate that when the requirements given by the current standards are met,it cannot be guaranteed that accepted steam sterilization conditions reported in literatureare satisfied. Therefore we conclude that standards should be adjusted such that theybecome evidence based, where possible.
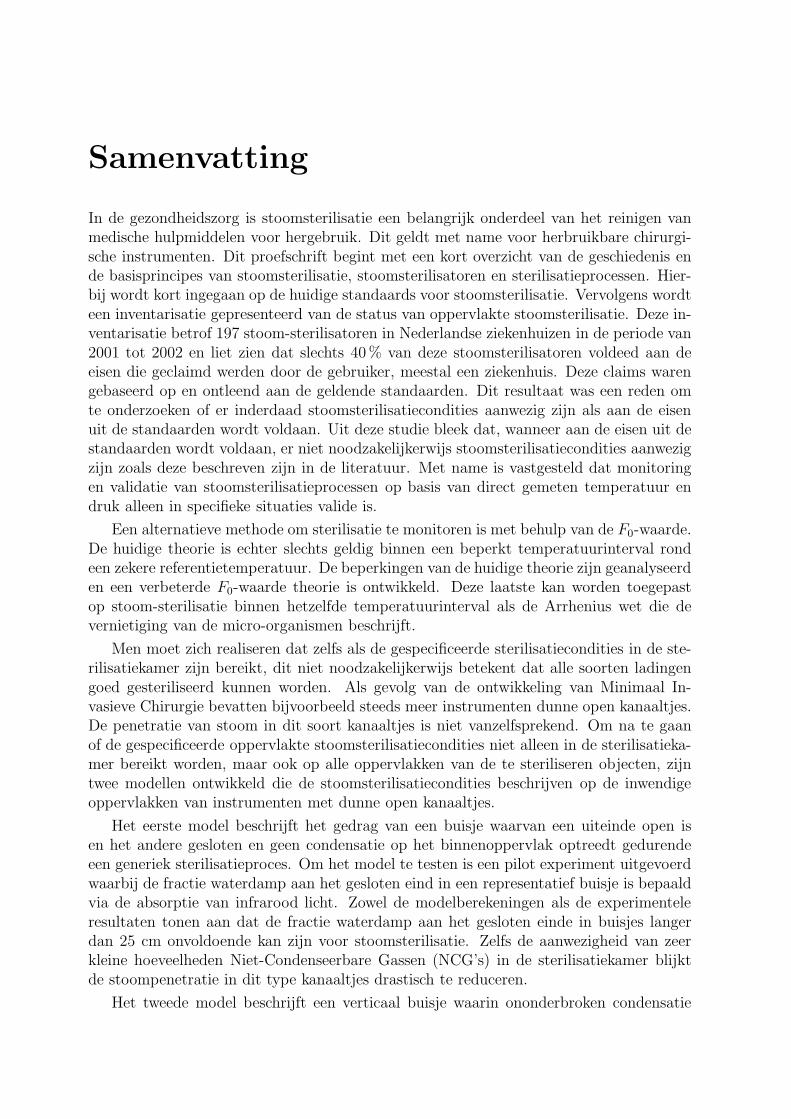
Samenvatting
In de gezondheidszorg is stoomsterilisatie een belangrijk onderdeel van het reinigen vanmedische hulpmiddelen voor hergebruik. Dit geldt met name voor herbruikbare chirurgi-sche instrumenten. Dit proefschrift begint met een kort overzicht van de geschiedenis ende basisprincipes van stoomsterilisatie, stoomsterilisatoren en sterilisatieprocessen. Hier-bij wordt kort ingegaan op de huidige standaards voor stoomsterilisatie. Vervolgens wordteen inventarisatie gepresenteerd van de status van oppervlakte stoomsterilisatie. Deze in-ventarisatie betrof 197 stoom-sterilisatoren in Nederlandse ziekenhuizen in de periode van2001 tot 2002 en liet zien dat slechts 40% van deze stoomsterilisatoren voldeed aan deeisen die geclaimd werden door de gebruiker, meestal een ziekenhuis. Deze claims warengebaseerd op en ontleend aan de geldende standaarden. Dit resultaat was een reden omte onderzoeken of er inderdaad stoomsterilisatiecondities aanwezig zijn als aan de eisenuit de standaarden wordt voldaan. Uit deze studie bleek dat, wanneer aan de eisen uit destandaarden wordt voldaan, er niet noodzakelijkerwijs stoomsterilisatiecondities aanwezigzijn zoals deze beschreven zijn in de literatuur. Met name is vastgesteld dat monitoringen validatie van stoomsterilisatieprocessen op basis van direct gemeten temperatuur endruk alleen in specifieke situaties valide is.
Een alternatieve methode om sterilisatie te monitoren is met behulp van de F0-waarde.De huidige theorie is echter slechts geldig binnen een beperkt temperatuurinterval rondeen zekere referentietemperatuur. De beperkingen van de huidige theorie zijn geanalyseerden een verbeterde F0-waarde theorie is ontwikkeld. Deze laatste kan worden toegepastop stoom-sterilisatie binnen hetzelfde temperatuurinterval als de Arrhenius wet die devernietiging van de micro-organismen beschrijft.
Men moet zich realiseren dat zelfs als de gespecificeerde sterilisatiecondities in de ste-rilisatiekamer zijn bereikt, dit niet noodzakelijkerwijs betekent dat alle soorten ladingengoed gesteriliseerd kunnen worden. Als gevolg van de ontwikkeling van Minimaal In-vasieve Chirurgie bevatten bijvoorbeeld steeds meer instrumenten dunne open kanaaltjes.De penetratie van stoom in dit soort kanaaltjes is niet vanzelfsprekend. Om na te gaanof de gespecificeerde oppervlakte stoomsterilisatiecondities niet alleen in de sterilisatieka-mer bereikt worden, maar ook op alle oppervlakken van de te steriliseren objecten, zijntwee modellen ontwikkeld die de stoomsterilisatiecondities beschrijven op de inwendigeoppervlakken van instrumenten met dunne open kanaaltjes.
Het eerste model beschrijft het gedrag van een buisje waarvan een uiteinde open isen het andere gesloten en geen condensatie op het binnenoppervlak optreedt gedurendeeen generiek sterilisatieproces. Om het model te testen is een pilot experiment uitgevoerdwaarbij de fractie waterdamp aan het gesloten eind in een representatief buisje is bepaaldvia de absorptie van infrarood licht. Zowel de modelberekeningen als de experimenteleresultaten tonen aan dat de fractie waterdamp aan het gesloten einde in buisjes langerdan 25 cm onvoldoende kan zijn voor stoomsterilisatie. Zelfs de aanwezigheid van zeerkleine hoeveelheden Niet-Condenseerbare Gassen (NCG’s) in de sterilisatiekamer blijktde stoompenetratie in dit type kanaaltjes drastisch te reduceren.
Het tweede model beschrijft een verticaal buisje waarin ononderbroken condensatie
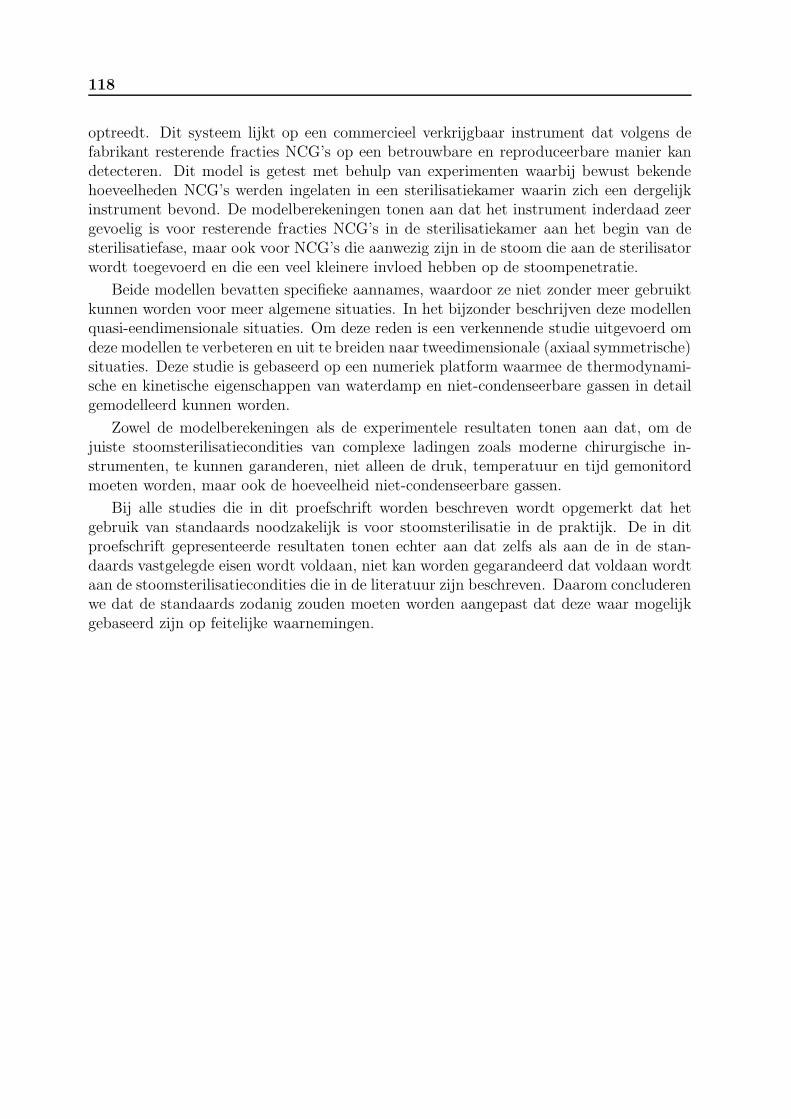
118
optreedt. Dit systeem lijkt op een commercieel verkrijgbaar instrument dat volgens defabrikant resterende fracties NCG’s op een betrouwbare en reproduceerbare manier kandetecteren. Dit model is getest met behulp van experimenten waarbij bewust bekendehoeveelheden NCG’s werden ingelaten in een sterilisatiekamer waarin zich een dergelijkinstrument bevond. De modelberekeningen tonen aan dat het instrument inderdaad zeergevoelig is voor resterende fracties NCG’s in de sterilisatiekamer aan het begin van desterilisatiefase, maar ook voor NCG’s die aanwezig zijn in de stoom die aan de sterilisatorwordt toegevoerd en die een veel kleinere invloed hebben op de stoompenetratie.
Beide modellen bevatten specifieke aannames, waardoor ze niet zonder meer gebruiktkunnen worden voor meer algemene situaties. In het bijzonder beschrijven deze modellenquasi-eendimensionale situaties. Om deze reden is een verkennende studie uitgevoerd omdeze modellen te verbeteren en uit te breiden naar tweedimensionale (axiaal symmetrische)situaties. Deze studie is gebaseerd op een numeriek platform waarmee de thermodynami-sche en kinetische eigenschappen van waterdamp en niet-condenseerbare gassen in detailgemodelleerd kunnen worden.
Zowel de modelberekeningen als de experimentele resultaten tonen aan dat, om dejuiste stoomsterilisatiecondities van complexe ladingen zoals moderne chirurgische in-strumenten, te kunnen garanderen, niet alleen de druk, temperatuur en tijd gemonitordmoeten worden, maar ook de hoeveelheid niet-condenseerbare gassen.
Bij alle studies die in dit proefschrift worden beschreven wordt opgemerkt dat hetgebruik van standaards noodzakelijk is voor stoomsterilisatie in de praktijk. De in ditproefschrift gepresenteerde resultaten tonen echter aan dat zelfs als aan de in de stan-daards vastgelegde eisen wordt voldaan, niet kan worden gegarandeerd dat voldaan wordtaan de stoomsterilisatiecondities die in de literatuur zijn beschreven. Daarom concluderenwe dat de standaards zodanig zouden moeten worden aangepast dat deze waar mogelijkgebaseerd zijn op feitelijke waarnemingen.
Publications
Publications as first author
Het steriliseren van tandheelkundige instrumentenvan Doornmalen JPCM, Verschueren M, Rietmeijer AGM, and Dankert J.Nederlands Tijdschrift voor Tandheelkunde 108, 269 - 272, 2001.
A validation survey of 197 hospital steam sterilizers in the Netherlandsin 2001 and 2002van Doornmalen JPCM and Dankert J.Journal of Hospital Infection, 59, 126 - 130, 2005.
Review of surface steam sterilization for validation purposesvan Doornmalen JPCM and Kopinga K.American Journal of Infection Control, 36, 86 - 92, 2008.
Temperature dependence of F-, D- and z-values used insteam sterilization processesvan Doornmalen JPCM and Kopinga K.Journal of Applied Microbiology, 107, 1054-1060, 2009.
Six commercially available Class 6 Chemical Indicators testedagainst their stated valuesvan Doornmalen JPCM and Kopinga K.Central Service 6, 400-404, 2012.
Penetration of water vapour into narrow channels duringsteam sterilization processesvan Doornmalen JPCM, Verschueren M and Kopinga K.Journal of Physics D: Applied Physics, 46, 065201, 2013.

Acknowledgment
In this thesis studies are reported that have been performed over a long period of time. Inthat time I had the pleasure to meet many people from whom I learned a lot in many ways.There are too many to mention all in this acknowledgment. Nevertheless some peoplehave had an extraordinary impact on this research and on me. First of all Prof.dr. JaapB. Dankert (Academical Medical Center of Amsterdam). He initiated this research byinviting me to become a PhD candidate of him. Unfortunately he passed away on January24, 2004 and basically the research came to a stand still. After inspiring discussions andchanging the research approach from a more microbiological to a more physics orientedapproach Prof.dr.ir. Klaas Kopinga became my promoter. Although most of the work, ifnot all, had to be done over, the many meetings, discussions and work with Klaas weremotivating, educational and inspiring.
During much of my PhD study Ing. Jan Jacob Patijn has been a colleague. Hispractical approach and detailed knowledge in the field of validation of decontaminationmachines appeared to be valuable in several of the reported studies. On the modeling andtheoretical side of the research I have great gratitude towards Dr.ir. Maykel Verschueren,Prof.dr.ir. Rini (M.E.H.) van Dongen, Dr.ir. Jan van Dijk and obviously Klaas. Maykeland Rini have been involved in and have contributed to these studies from the start.Jan has been involved for the last two to three years and became my co-promoter. Hisenthusiastic support, for instance, with Plasimo, resulted in further ideas and led tocontinue to work together in future research. My gratitude goes also to 3M DeutschlandGmbH and especially Oliver Wiegand. They made it possible to perform the essentialexperiments with the test sterilizers in the 3M Neuss lab. In many of the performedexperiments the knowledge, experience and patience of Ing. Jef (J.J.P.A.W.) Noijen (oneof the few people with more given names than I have) and again Klaas appeared to be ofgreat importance to design reproducible experiments.
Doing a PhD study next to a full time job appears to consume a lot of spare time andsometimes night rest. Therefore I would like and have to thank my family. My utmostgratitude and admiration are for my lovely and caring wife, Patrica, for her understanding,her patience, and her never ending support. My special thoughts go to my mother andfather. I think especially pa would be proud of this work.
Finally to all who contributed to this work but are not mentioned by name, andmany names come up while writing this, please accept my apologies but know that I doappreciate your help, support, contributions and efforts.
Joost

Curriculum Vitae
Education
1985 Diploma VWO Rijkscholen Gemeenschap, Breda1985-1990 Nieuwe Leraren Opleiding, Tilburg
Physics (major), mathematics (minor), computer sciences (extra)1990-1994 University of Technology Eindhoven, Applied Physics1999-2004 Academical Medical Centre of Amsterdam (University Hospital)
Department of Bacteriology and Virology, Prof.dr. J. DankertGuest researcher decontamination
2008-2013 Eindhoven University of Technology, Department of Applied Physics,Section Transport in Permeable Media, Prof.dr.ir. K. KopingaPhD candidate
Professional
1995-1998 Cooperatief Adviesbureau Vereniging Krachtwerktuigen u.a.Amersfoort, Team leader Validation & Monitoring
1998-2005 KW2 B.V., Amersfoort (Management buy-out)Manager Validations & Monitoring, Vice president
2005-2008 Bureau Veritas, Amersfoort (acquired KW2 B.V.)Manager of the department In Service Verification
2008-present 3M Deutschland GmbH, Neuss (D), Infection Prevention DivisionManager scientific affairs and education sterilization EMEA
Standardization committees
- Member of Dutch Standardization Committee‘Steriliseren en Steriliteit’ (NC 308.081)
- Member CEN Technical Committee 102‘Sterilizers for medical purposes’
- Member CEN Technical Committee 204‘Sterilization of medical devices’
- Member of ISO Technical Committee 198‘Sterilization of health care products’
- Member ISO Technical Committee 210‘Quality management and corresponding general aspects for medical devices’