Embed Size (px)
Citation preview
Supra-Threshold Fiber Cluster Statisticsfor Data-Driven Whole Brain
Tractography Analysis
Fan Zhang1(B), Weining Wu1,2, Lipeng Ning1, Gloria McAnulty3,Deborah Waber3, Borjan Gagoski3, Kiera Sarill3, Hesham M. Hamoda3,Yang Song4, Weidong Cai4, Yogesh Rathi1, and Lauren J. O’Donnell1
1 Brigham and Women’s Hospital, Harvard Medical School, Boston, [email protected]
2 College of Computer Science and Technology,Harbin Engineering University, Harbin, China
3 Boston Children’s Hospital, Harvard Medical School, Boston, USA4 School of Information Technologies, The University of Sydney, Sydney, Australia
Abstract. This work presents a supra-threshold fiber cluster (STFC)analysis that leverages the whole brain fiber geometry to enhance sta-tistical group difference analysis. The proposed method consists of (1)a study-specific data-driven tractography parcellation to obtain whitematter (WM) tract parcels according to the WM anatomy and (2) anonparametric permutation-based STFC test to identify significant dif-ferences between study populations (e.g. disease and healthy). The basicidea of our method is that a WM parcel’s neighborhood (parcels withsimilar WM anatomy) can support the parcel’s statistical significancewhen correcting for multiple comparisons. The method is demonstratedby application to a multi-shell diffusion MRI dataset from 59 individuals,including 30 attention deficit hyperactivity disorder (ADHD) patientsand 29 healthy controls (HCs). Evaluations are conducted using bothsynthetic and real data. The results indicate that our STFC methodgives greater sensitivity in finding group differences in WM tract parcelscompared to several traditional multiple comparison correction methods.
1 Introduction
Computational neuroimaging methods have aroused interest in identifying groupdifferences in white matter (WM) via diffusion magnetic resonance imaging(dMRI). Traditional methods rely on techniques such as voxel-based morphom-etry (VBM) [2] and tract-based spatial statistics (TBSS) [24] for voxel-basedanalyses. Tractography-based analysis, on the other hand, has enabled measure-ment of macrostructural WM properties of specific subpopulations of fibers [5].In this work, we focus on identifying WM group differences using whole braintractography.
This work was supported by ARC, NSF of China No.61502117, NSF of HeilongjiangQC2016084, P41EB015902, R01MH074794, R01MH097979 and U01CA199459.
c© Springer International Publishing AG 2017M. Descoteaux et al. (Eds.): MICCAI 2017, Part I, LNCS 10433, pp. 556–565, 2017.DOI: 10.1007/978-3-319-66182-7 64

Supra-Threshold Fiber Cluster Statistics for Data-Driven 557
A standard tractography-based group difference analysis includes first select-ing a tract of interest (e.g. the corpus callosum) and then comparing groupsto find statistical differences in WM diffusion features (e.g. anisotropy), eitherusing feature mean values [1] or along-tract measures [6,7,9]. These studies sug-gest that fibers with similar WM anatomy (fiber geometric trajectory) in gen-eral share similar diffusion properties. However, they are generally limited to asmall number of selected tracts. Another strategy, which can efficiently identifymultiple tracts, is to establish the tract correspondence directly based on fibergeometry [17]. One recent work has applied this strategy to identify 30 tracts (asubset of the WM, e.g. only corticospinal tract but not full corona radiata) andperformed statistical analysis in the whole brain [28]. Our method is based ona study-specific whole brain WM parcellation into more regions (a total of 1416WM parcels from all input tractography) and hence can allow identification ofpotential group differences more specific to local WM anatomy.
For group comparison, a hypothesis test (e.g. Student’s t-test) is normallyused to identify group differences, followed by multiple comparison correction(e.g. false discovery rate (FDR) [4] and Bonferroni [10] methods) for correctedstatistical significance. Since these commonly-used correction methods can beless sensitive in finding significance, voxel-based multiple comparison correctionhas been conducted in a cluster-thresholding manner that utilizes spatial neigh-borhoods to boost belief in extended cluster areas [12]. Studies using voxel-cluster-thresholding methods have found WM group differences [19,23]. Onework also applied the cluster-thresholding method to identify group differencesin fiber segments [26]. However, we found no related work has been conductedto identify tractography-based group differences for whole brain analysis.
In light of the above, we propose a supra-threshold fiber cluster (STFC)method to identify WM group differences using whole brain tractography. Thenovelty is that, for the first time, the proposed method leverages the whole brainfiber geometry during the statistical analysis of tractography. Specifically, wedefine a WM parcel neighborhood according to the WM anatomy and we proposea novel method that uses these WM neighborhoods for determining statisticalsignificance. The method uses a study-specific data-driven WM parcellation forparcel neighborhood construction (Sect. 2.2). The STFC test then leverages theneighborhoods to identify fiber clusters of multiple WM tract parcels for statisti-cal significance with multiple comparison correction (Sect. 2.4). We demonstrateour method by application to a multi-shell dMRI dataset from attention deficithyperactivity disorder (ADHD) patients and healthy controls (HCs).
2 Methods
2.1 Dataset
We used a multi-shell (b values of 1000/2000/3000 s/mm2) diffusion weightedimaging (DWI) dataset from 59 individuals (30 ADHD, 7 females and 23 males,age: 10.6 ± 1.7 years; 29 HC, 10 females and 19 males, age: 10.7 ± 1.7 years).The two groups were matched for age and socioeconomic status (SES). DWI

558 F. Zhang et al.
data were acquired using a multi-slice acquisition (x2) at spatial resolution of2 × 2 × 2 mm3 with 70 gradient directions, and then processed using a semi-automated quality control to remove gradients with signal drop and to correcthead motion.
We conducted whole brain tractography using the unscented Kalman fil-ter method [21,22]. Tractography was seeded 5 times per voxel and return-to-the-origin probability (RTOP) was measured with a two tensor biexponentialmodel [20] at each point while tracking. The RTOP estimates the net dis-placement of water molecules between the application of two diffusion gradi-ents and it is known to be sensitive to the anisotropy of WM tissue [13]. Wechose RTOP because it is known to be sensitive to the anisotropy of WM tissueand may increase pathophysiological specificity compared to traditional diffusionanisotropy measures, e.g. fractional anisotropy (FA) [3,18]. Therefore, we usedthis measurement to explore potential changes in WM anisotropy in ADHD. Weperformed diffusion MRI tractography visualization in 3D Slicer (www.slicer.org)via the SlicerDMRI project (dmri.slicer.org).
2.2 Data-Driven WM Parcellation and WM Parcel Neighborhood
Whole brain WM parcellation was conducted using a data-driven pipelineaccording to the common WM anatomy from the whole population. In brief,the parcellation started with a simultaneous joint alignment of tractographyacross all subjects (using affine then b-spline transforms) (Fig. 1a) [15]. Next,we learned a study-specific data-driven groupwise WM parcellation (atlas) usinga spectral clustering of pairwise fiber trajectory distances across all subjects(Fig. 1b) [16]. Then, we applied the study-specific parcellation to each individ-ual subject (Fig. 1c) [16]. Valid parcels were identified as those that passed anonparametric one-tailed sign test in the population, based on fiber numbersin each parcel, as in [8]. We obtained a total of 1416 valid hemispheric andcommissural parcels.
Parcel neighborhoods (Fig. 1d) were constructed according to the mean ofthe pairwise fiber distances between parcels in the atlas, i.e. Dp =
∑I
∑J dij
IJ ,where dij is the fiber pair distance and I and J are the total numbers of fibersin the two parcels. A pair of parcels that had Dp smaller than a user-givendistance threshold Td were considered to be neighbors. We applied the meanclosest point fiber distance [16] to measure dij , the same distance used in thespectral clustering. In this way, the neighborhood could capture the anatomicalsimilarity between the parcels.

Supra-Threshold Fiber Cluster Statistics for Data-Driven 559
Fig. 1. Study-specific data-driven WM parcellation. (a) Tractography alignment usinggroupwise tractography registration, where color indicates subject. (b) Study-specificgroupwise WM parcellation (atlas) (left) and example subject-specific tractographyparcellation (right). Fibers from different parcels are colored differently, where simi-lar colors represent white-matter-anatomy-similar fibers. (c) Example atlas WM tractparcels (left) and the corresponding subject-specific WM tract parcels (right). (d)Example neighbors of the red tract parcel include the yellow and the blue parcelsbut not the more distant green one.
2.3 Group Difference at Individual Parcel Level
We performed a null hypothesis test for each individual parcel to find the parcel-level WM difference. Specifically, we measured the median of the RTOP valuesof all points in each parcel, i.e. MRTOP . An one-tailed Student’s t-test was thenperformed under null hypothesis H0 : μHC(MRTOP ) ≤ μADHD(MRTOP ), asstudies in ADHD widely suggest decreased diffusion anisotropy [11]. We consid-ered the parcels with p-value <0.05 as the ones with parcel-level differences.
2.4 Supra-Threshold Fiber Cluster Test
Then, the parcel-level differences were tested for significance in a multiple com-parison correction using a permutation-based STFC test. This is similar to theprocess in a voxel-image-based supra-threshold cluster test [12]. However, ourmethod leverages the fiber spatial relationships from the whole brain fiber geom-etry to build the parcel neighborhoods, while a voxel-image-based method relieson voxel spatial neighborhoods. In detail, an STFC was defined as a clusterof multiple parcels with parcel-level differences, where each parcel neighboredat least one other parcel(s) in the cluster (under the distance threshold Td).The STFC test performed a nonparametric permutation test using a summarystatistic of maximal STFC size (maxSTFCS). N = 10000 permutations wereperformed in all experiments, resulting in a distribution of maxSTFCS (thenull distribution) that enabled computation of corrected STFC significance.Algorithm 1 shows the pseudocode of the method. Specifically, we first com-puted a histogram of maxSTFCS across multiple permutation runs (lines 1 to 5).Then, for each STFC from the correctly labeled groups, its corrected significancevalue was computed by comparing its STFC size (STFCS ) to the maxSTFCShistogram (lines 6 to 11).

560 F. Zhang et al.
Algorithm 1. Supra-threshold Fiber Cluster Test1: for each permutation run in [1, N ] do2: Randomly permute group labels of all subjects (0 for ADHD, 1 for HC).3: Identify parcels with group difference at parcel-level in the permuted data.4: Extract all STFCs and record the maxSTFCS .5: Calculate the histogram of maxSTFCS to produce the null distribution.6: Identify parcels with group difference at parcel-level in the correctly labeled data.7: Extract all STFCs and compute STFCS for each parcel.8: for each STFC do9: Locate its STFCS in the maxSTFCS histogram.
10: Obtain the number of permutations with maxSTFCS ≥ STFCS(p) as N(p).11: Compute the corrected significance value as (N(p) + 1)/(N + 1).
3 Experimental Results
3.1 Synthetic Data
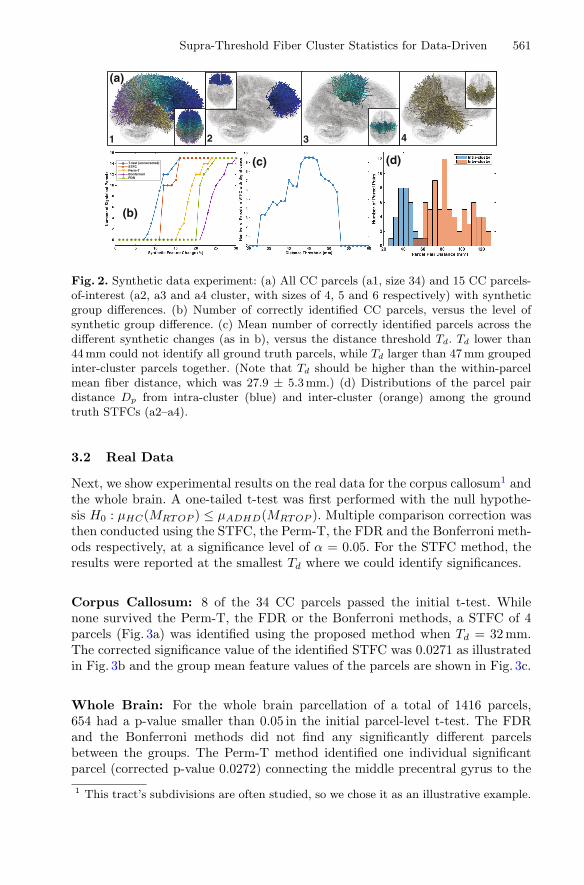
We first illustrate our method on synthetic data. To simplify the assessmentand tractography visualization, we created a realistic synthetic dataset with truegroup difference in the corpus callosum (CC), generated as follows. We identifieda total of 34 CC parcels from the whole brain parcellation, as shown in Fig. 2a.For each CC parcel, we added white Gaussian noise (signal-to-noise ratio at 1[25]) to the actual measured features of all HC subjects. Repeating this processtwice generated two synthetic groups of G1 and G2, each with 29 subjects. Wethen modified 15 CC parcels-of-interest to have true group difference by addingsynthetic feature changes to the G2 subjects. For each of the 15 parcels, wedecreased its group mean MRTOP values in G2 (as a percent of its original featuremean) for a null hypothesis test: H0 : μG1(MRTOP ) ≤ μG2(MRTOP ). These 15parcels were selected to form 3 different synthetic ground truth clusters (withsizes of 4, 5 and 6, as shown in Figs. 2b–d). Larger synthetic feature changes ledto the parcels-of-interest showing more significant group differences. Then, theevaluation goal was to test if a method could correctly identify the parcels withtrue significance, even when the added change was small.
Comparisons were conducted among the uncorrected t-test, the proposedSTFC method, a standard permutation test (Perm-T, N = 10000) that used theminimal t-test-based p-value of all parcels for the summary statistic (as appliedin [28]), and two traditional FDR and Bonferroni multiple comparison correctionmethods. The same significance level of α = 0.05 was used for all comparedmethods. Figure 2b displays the number of significantly different parcels thatwere correctly identified in each method. For the STFC method, we displayedthe result with Td = 44 mm. As shown in Fig. 2c, the reasonable range for Td
in the synthetic data testing was 44 to 47 mm. This range corresponded to thesettings that could identify the 3 ground truth clusters, as illustrated in Fig. 2d.We note that in the STFC experiment we considered a parcel as misidentifiedif it belonged to a STFC including parcels from more than one ground truthcluster.
Supra-Threshold Fiber Cluster Statistics for Data-Driven 561
(a)
(b)
(c)
1 2 3 4
(d) T-test (uncorrected)STFCPerm-TBonferroniFDR
Fig. 2. Synthetic data experiment: (a) All CC parcels (a1, size 34) and 15 CC parcels-of-interest (a2, a3 and a4 cluster, with sizes of 4, 5 and 6 respectively) with syntheticgroup differences. (b) Number of correctly identified CC parcels, versus the level ofsynthetic group difference. (c) Mean number of correctly identified parcels across thedifferent synthetic changes (as in b), versus the distance threshold Td. Td lower than44mm could not identify all ground truth parcels, while Td larger than 47 mm groupedinter-cluster parcels together. (Note that Td should be higher than the within-parcelmean fiber distance, which was 27.9 ± 5.3 mm.) (d) Distributions of the parcel pairdistance Dp from intra-cluster (blue) and inter-cluster (orange) among the groundtruth STFCs (a2–a4).
3.2 Real Data
Next, we show experimental results on the real data for the corpus callosum1 andthe whole brain. A one-tailed t-test was first performed with the null hypothe-sis H0 : μHC(MRTOP ) ≤ μADHD(MRTOP ). Multiple comparison correction wasthen conducted using the STFC, the Perm-T, the FDR and the Bonferroni meth-ods respectively, at a significance level of α = 0.05. For the STFC method, theresults were reported at the smallest Td where we could identify significances.
Corpus Callosum: 8 of the 34 CC parcels passed the initial t-test. Whilenone survived the Perm-T, the FDR or the Bonferroni methods, a STFC of 4parcels (Fig. 3a) was identified using the proposed method when Td = 32 mm.The corrected significance value of the identified STFC was 0.0271 as illustratedin Fig. 3b and the group mean feature values of the parcels are shown in Fig. 3c.
Whole Brain: For the whole brain parcellation of a total of 1416 parcels,654 had a p-value smaller than 0.05 in the initial parcel-level t-test. The FDRand the Bonferroni methods did not find any significantly different parcelsbetween the groups. The Perm-T method identified one individual significantparcel (corrected p-value 0.0272) connecting the middle precentral gyrus to the1 This tract’s subdivisions are often studied, so we chose it as an illustrative example.

562 F. Zhang et al.
(a) (b) (c)
Fig. 3. Real data experiment for the corpus callosum: (a) The STFC consisting of 4CC parcels identified with significant group difference. (b) 270 permutation tests hadmaxSTFCS ≥ 4, leading to the corrected significance value of 271/10001 = 0.0271.(c) Comparison of MRTOP values per identified parcel, plotted in sorted order.
(c) (b) (a)
Fig. 4. Real data experiment for the whole brain WM: (a) The STFC consisting of15 parcels identified with significant group difference. (b) 455 permutation tests hadmaxSTFCS ≥ 15, leading to the corrected significance value of the identified STFC456/10001=0.0456. (c) Comparison of MRTOP values per identified parcel, plotted insorted order.
supra-marginal and the superior-parietal gyri in the right hemisphere. Ourmethod identified one significant STFC of 15 WM parcels when Td = 24 mm,which located in the temporal and occipital lobes (Fig. 4a). The corrected sig-nificance value of the identified STFC was 0.0456 as illustrated in Fig. 4b. Acomparison of the group mean feature values is given in Fig. 4c.
4 Discussion and Conclusion
We tested our method on a synthetic dataset with known group differences. Theresults showed that the STFC method was more sensitive to detect the groundtruth group differences, while the Perm-T, FDR and the Bonferroni methodscould only find the significance when there were large differences (over 15%change of the group mean feature value). As for the experiments on the real data,in CC we found a significantly different STFC of 4 WM parcels connecting to thesuperior-parietal gyri and the precuneus, with decreased median RTOP valuesin the ADHD group. For the whole brain WM analysis, our method identified 15parcels from a STFC with significant group difference in the right temporal andoccipital lobes, which have been previously reported to be affected in ADHD[14,27]. These parcels had lower median RTOP values in the ADHD group whencompared to the HC group, suggesting potentially reduced WM anisotropy in
Supra-Threshold Fiber Cluster Statistics for Data-Driven 563
ADHD. We did not find any significance using the FDR or Bonferroni methods intwo real data tests. One parcel that potentially belonged to the anterior segmentof right arcuate fasciculus was identified from the whole brain using the Perm-Tmethod, but no parcel survived in the CC Perm-T analysis.
The STFC method had a parameter of distance threshold Td that was usedto form the WM parcel neighborhood. Our experiments using the synthetic datashowed that too large or too small Td values found fewer true significant parcels(Fig. 2c). Given the synthetic ground truth clusters, small Td values (e.g. Td < 25mm, Fig. 2d) were not able to form any neighborhoods within a cluster, whilelarger values tended to group ground truth clusters together (e.g. Td > 65 mm,Fig. 2d). For our real data tests, we applied the minimal setting of Td that couldfind a significance. This allowed us to identify the parcels that were most similarto each other in terms of their WM anatomy. On the other hand, increasingTd could help to find more WM structures. For example, in the whole brainanalysis given Td = 25 mm, we identified a larger significant STFC of 24 parcelsthat included the parcels from Td = 24 mm and extended to the inferior parietallobe.
In this paper, we have presented a novel STFC analysis to identify WMgroup differences using whole brain tractography. Experimental results suggestthat our method in general is more sensitive for identifying WM group differenceswhen compared to several traditional multiple comparison correction methods.Similar to voxel-cluster-thresholding analyses, the proposed method aims to findlarge clusters of WM parcels with significance; thus it could potentially misssome significantly different parcels located in small neighborhoods, e.g. the oneindividual significant parcel identified in the standard permutation test.
References
1. Alexander, A.L., Lee, J.E., et al.: Diffusion tensor imaging of the corpus callosumin autism. Neuroimage 34(1), 61–73 (2007)
2. Ashburner, J., Friston, K.J.: Voxel-based morphometry-the methods. Neuroimage11(6), 805–821 (2000)
3. Avram, A.V., et al.: Clinical feasibility of using mean apparent propagator (MAP)MRI to characterize brain tissue microstructure. NeuroImage 127, 422–434 (2016)
4. Benjamini, Y., Hochberg, Y.: Controlling the false discovery rate: a practical andpowerful approach to multiple testing. J. Roy. Stat. Soc. Ser. B (Methodological)57, 289–300 (1995)
5. Ciccarelli, O., Catani, M., et al.: Diffusion-based tractography in neurological dis-orders: concepts, applications, and future developments. Lancet Neurol. 7(8), 715–727 (2008)
6. Colby, J.B., Soderberg, L., et al.: Along-tract statistics allow for enhanced trac-tography analysis. Neuroimage 59(4), 3227–3242 (2012)
7. Corouge, I., Fletcher, P.T., et al.: Fiber tract-oriented statistics for quantitativediffusion tensor MRI analysis. Med. Img. Ana. 10(5), 786–798 (2006)
8. Gong, G., He, Y., et al.: Mapping anatomical connectivity patterns of humancerebral cortex using in vivo diffusion tensor imaging tractography. Cereb. Cortex19(3), 524–536 (2009)
564 F. Zhang et al.
9. Goodlett, C.B., Fletcher, P.T., et al.: Group analysis of DTI fiber tract statisticswith application to neurodevelopment. Neuroimage 45(1), S133–S142 (2009)
10. Holm, S.: A simple sequentially rejective multiple test procedure. Scandinavian J.Stat. 6, 65–70 (1979)
11. Nagel, B.J., et al.: Altered white matter microstructure in children with attention-deficit/hyperactivity disorder. J. Am. Acad. Child Adoles. Psychiatry 50(3), 283–292 (2011)
12. Nichols, T.E., Holmes, A.P.: Nonparametric permutation tests for functional neu-roimaging: a primer with examples. Hum. Brain Mapp. 15(1), 1–25 (2002)
13. Ning, L., et al.: Estimating diffusion propagator and its moments using directionalradial basis functions. IEEE Trans. Med. Img. 34(10), 2058–2078 (2015)
14. O’Conaill, C.R., Malisza, K.L., et al.: Visual search for feature conjunctions: anfMRI study comparing alcohol-related neurodevelopmental disorder (ARND) toADHD. J. Neurodevelopmental Dis. 7(1), 10 (2015)
15. O’Donnell, L.J., Wells, W.M., Golby, A.J., Westin, C.-F.: Unbiased groupwise reg-istration of white matter tractography. In: Ayache, N., Delingette, H., Golland, P.,Mori, K. (eds.) MICCAI 2012. LNCS, vol. 7512, pp. 123–130. Springer, Heidelberg(2012). doi:10.1007/978-3-642-33454-2 16
16. O’Donnell, L., Westin, C.: Automatic tractography segmentation using a high-dimensional white matter atlas. IEEE Trans. Med. Img. 26(11), 1562–1575 (2007)
17. O’Donnell, L., Westin, C.F., Golby, A.J.: Tract-based morphometry for white mat-ter group analysis. Neuroimage 45(3), 832–844 (2009)
18. Ozarslan, E., et al.: Mean apparent ator (MAP) MRI: a novel diffusion imagingmethod for mapping tissue microstructure. NeuroImage 78, 16–32 (2013)
19. Perez-Iglesias, R., et al.: White matter defects in first episode psychosis patients: avoxelwise analysis of diffusion tensor imaging. Neuroimage 49(1), 199–204 (2010)
20. Rathi, Y., Michailovich, O., Setsompop, K., Bouix, S., Shenton, M.E., Westin, C.-F.: Sparse multi-shell diffusion imaging. In: Fichtinger, G., Martel, A., Peters, T.(eds.) MICCAI 2011. LNCS, vol. 6892, pp. 58–65. Springer, Heidelberg (2011).doi:10.1007/978-3-642-23629-7 8
21. Rathi, Y., Gagoski, B., Setsompop, K., Michailovich, O., Grant, P.E., Westin, C.-F.: Diffusion propagator estimation from sparse measurements in a tractographyframework. In: Mori, K., Sakuma, I., Sato, Y., Barillot, C., Navab, N. (eds.) MIC-CAI 2013. LNCS, vol. 8151, pp. 510–517. Springer, Heidelberg (2013). doi:10.1007/978-3-642-40760-4 64
22. Reddy, C.P., Rathi, Y.: Joint multi-fiber noddi parameter estimation and tractog-raphy using the unscented information filter. Front. Neurosci. 10, 166 (2016)
23. Rotarska-Jagiela, A., Oertel-Knoechel, V., et al.: Anatomical brain connectivityand positive symptoms of schizophrenia: a diffusion tensor imaging study. Psychi-atry Res. Neuroimaging 174(1), 9–16 (2009)
24. Smith, S.M., Jenkinson, M., et al.: Tract-based spatial statistics: voxelwise analysisof multi-subject diffusion data. Neuroimage 31(4), 1487–1505 (2006)
25. Smith, S.M., Nichols, T.E.: Threshold-free cluster enhancement: addressing prob-lems of smoothing, threshold dependence and localisation in cluster inference. Neu-roimage 44(1), 83–98 (2009)
26. Taquet, M., Scherrer, B., Commowick, O., Peters, J., Sahin, M., Macq, B., Warfield,S.K.: Registration and analysis of white matter group differences with a multi-fiber model. In: Ayache, N., Delingette, H., Golland, P., Mori, K. (eds.) MICCAI2012. LNCS, vol. 7512, pp. 313–320. Springer, Heidelberg (2012). doi:10.1007/978-3-642-33454-2 39
Supra-Threshold Fiber Cluster Statistics for Data-Driven 565
27. Vance, A., Silk, T., et al.: Right parietal dysfunction in children with attentiondeficit hyperactivity disorder, combined type: a functional MRI study. Mol. Psy-chiatry 12(9), 826–832 (2007)
28. Wang, D., et al.: Tractography atlas-based spatial statistics: statistical analysis ofdiffusion tensor image along fiber pathways. NeuroImage 125, 301–310 (2016)


![[PPT]Plant Tissues - Kirkwood Community College · Web viewSimplified Plant Tissues Lesson Plan 4 00hblp4v1 Fibers A cluster of many fiber cells make up a fiber Fibers Cortex Xylem](https://img.pdfslide.us/doc/110x75/5b36a16c7f8b9a7e4b8e9fd3/pptplant-tissues-kirkwood-community-web-viewsimplified-plant-tissues-lesson.jpg)