Embed Size (px)
Citation preview

www.sciencemag.org/cgi/content/full/322/5899/246/DC1
Supporting Online Material for
Implications of Magma Transfer Between Multiple Reservoirs on Eruption Cycling
Derek Elsworth,* Glen Mattioli, Joshua Taron, Barry Voight, Richard Herd
*To whom correspondence should be addressed. E-mail: [email protected]
Published 10 October 2008, Science 322, 246 (2008) DOI: 10.1126/science.1161297
This PDF file includes:
Methods Figs. S1 to S3 Tables S1 and S2 References

SUPPLEMENTARY ONLINE MATERIALS
Implications of Magma Transfer between Multiple Reservoirs on Eruption Cycling
Derek Elsworth,1 Glen Mattioli,2 Joshua Taron,1 Barry Voight1 and Richard Herd3
METHODS
The history of magma exchange within the deep subsurface plumbing of volcanic systems may
be recovered if both the surface efflux of magma and measured deformation of the surface are
available over the same epochs. The response of the fluid-transport and mechanical systems
must be represented in a coherent manner to enable co-inversion of the efflux and geodetic data.
As shown in Fig. S1, we consider an idealized magmatic system for SHV, which is arguably
typical of many other andesitic volcanoes worldwide. The system contains separate deep and
shallow magmatic chambers, arrayed vertically, and connected by intervening conduits.
Fluid-transport system: Vertical conduits connect the two reservoirs, and link the system to
both the mantle and the surface. The magma charges the upper ( I ) and lower ( ) reservoirs
at mass rates
II
( )Id
Vdt
ρ and ( )IId
Vdt
ρ , respectively, via the adjoining conduits where ρ is
average magma density and is the volume of chamber i . The conduits have little capacity
for magma storage, relative to the reservoirs, and storage within the conduits is neglected. The
linking conduits are of small diameter (~30 m); at this dimension the surface geodetic response
is insensitive to their effect at the wide aperture (>3 km) considered here. Mass is conserved
within the flowing system where the mass rate of change of chamber i may be linked to the
magma mass influx ( ) and efflux ( ), where is the volume rate, as
iV
iinqρ i
outqρ iinq
( )i i iin out
dV q q
dtρ ρ ρ= − .
The independent effect of magma expansion by decompression ( ), and the volume change of
the chamber (V ), apparent in the geodetic signal may be separated as,
ρ
1 College of Earth and Mineral Sciences, Penn State University, University Park, PA 16802, USA.
+1.814.865.2225 (Vx); +1.814.865.3248 (Fx); [email protected]
2 Department of Geosciences, University of Arkansas, Fayetteville, AR 72701, USA
3 School of Environmental Sciences, University of East Anglia, Norwich, NR4 7TJ, UK
1

( )i i i i iin out
dV V V q q
dtρ ρ ρ ρ ρ= + = − . (1)
The rate of change in magma density ( ρ ) is related to the bulk modulus of the magma ( )
as, MK
M
pKρ
ρ = (2)
through the rate of change in pressure ( ) and may be related to the volume change of a
spherical chamber of radius a embedded in an elastic medium of shear modulus as
p
RG
3 3
4
ii
R R
a VV p
G Gπ
= = p . (3)
Substituting the magma-pressure to chamber-volume relation of (3) to be congruent with the
density change in the magma of equation (2), and the result into eqiation (1) yields
4
( 1)3
i i iRin out
M
GV q q
Kρ ρ+ = − ρ . (4)
Further defining outputs from the system in terms of volume rates, q , defined at mean chamber
density yields
4
( 1)3
i
i i i i iRin out
M
C
GV C V q q
K+ = = − (5)
with the influence of magma compressibility represented in the multiplier, and with volume
fluxes defined in terms of dense rock equivalents (DRE). When the geodetically observed volume
change of the chamber is equivalent to the volume change in the magma, when , and
the magma can be considered incompressible. Conversely, when , the volume change of
the magma is greater than the volume change in the chamber alone, due to the finite
compressibility of the magma. Therefore, the influence of magma compressibility on the
resulting efflux is indexed relative to the ratios of the relative stiffnesses of the rock and magma
( ) as embodied in the parameter .
iC
1iC →
1iC >
/RG KM
I
iC
Assuming that there is no storage in the linking conduits, then for the twin chamber system
considered here, , enabling the relations I Iin outq q=
(6) I I I I
in outII II II II
in out
C V q q
C V q q
= −
= −
2

to be combined as
(7) I I II II II Iin outC V C V q q+ = −
where is the observable surface efflux from the system recorded in DRE. Ioutq
Mechanical system: Deformations result at the surface from the superposed inflation, or
deflation, of both reservoirs. For an elastic system, with an inflating source at I , the radial ( )
and vertical ( ) surface velocities measured at some location ( : ir
iz ;I Ii ir R Fig. S1) are proportional
to the reservoir inflation rate as or . The terms and are coefficients
relating to the disposition of the measuring point ( elative to the source. The effect of
multiple reservoirs may be accommodated by superposition of velocities. For the two-reservoir
system considered here, the resulting radial velocities measured at locations are,
I Ii ir a V= I I
i iz b V=
;I Ii ir R
Iia I
ib
1,=
) r
IiR
2
2i
(8) 1 1 1
2 2 2 .
I I II II
I I II II
r a V a V
r a V a V
= +
= +
where the coefficients linking the surface velocities to inflation rates are recovered from the Mogi
solutions for a strain nucleus as (1, 2). This represents the effect of an
inflating chamber collapsed to a point within a homogeneous elastic half-space bounded by a
horizontal surface, and for a Poisson ratio of . These assumptions have proved adequate
for more restrictive analyses on the same system (3), and are used directly here.
3(3 / 4 )( / ( ) )I Ii ia rπ=
0.25υ =
The resulting surface radial velocities may be determined for a second reservoir ( ) by
permuting the coordinates ( ). Alternately, if vertical displacement rates are available
then the equivalent of equation
IIia
I IV
;II IIi ir R
IiR
(8) may be constructed with and
. 3(3 / 4 )( / ( ) )I Ii ib zπ= −
i iz b=
Co-Inversion: Velocities measured at two different radial distances (say radial velocities
) together with the surface efflux ( ) enable equations 1r and r (7) and (8) to be solved
simultaneously for the two reservoir inflation rates and , and the supply to the deep
crust/mantle flux . From these, the full suite of flux terms defining exchange between the
various reservoirs may be determined. Importantly, measured velocities must be available at two
different radial locations – radial and vertical velocities measured at a single location are not
independent – although, vertical and radial velocities from different locations may be mixed. In
this discussion, the depths and locations of the reservoirs are assumed known, but are based on
inversions of the entire surface deformation field at specific epochs (4, 5). If additional reservoirs
IV IIVIIinq
Ioutq
3
are present, the number of displacement measurements required increments for each additional
reservoir.
Analysis of cGPS Data: The idealized geometry of the magmatic plumbing system is shown
in Fig. S1. Magma efflux rate and episodic removal by dome failure has been recorded
continuously since the inception of the eruption in 1995 (6-8). Similarly, long-term surface
displacements have been recorded since 1995 by cGPS stations 3-8 km from the conduit and at
a full range of azimuths, as shown in Fig. 1 (4, 5). All GPS data were processed as absolute
point positions using procedures similar to those reported elsewhere (9). Of these stations, only
four have continuous records of displacements throughout the entire period of the eruption, and
are thus suitable in this analysis to determine long-term trends in magma supply and exchange
within storage volumes the crust. In order of increasing distance from the conduit, these stations
are WYTD (2.8 km), SOUF (3.2 km), HARR (3.4 km), MVO1 (7.4 km) (Fig. S1) with histories
of magma efflux (DRE) and station velocities reported in Table S1 and plotted in Fig. 2. Data
are divided into three separate cycles, each containing an eruptive episode followed by a pause.
These eruptive episodes and pauses are later used to categorize characteristic features of the
magma transport history.
To maximize the sensitivity of the analysis to processes at depth, the Caribbean-fixed velocity
(10) (radial) and vertical velocity relative to the Earth’s barycenter of the widest aperture
station (MVO1) is combined with the velocity of each of the closer stations in three paired
combinations. The average of these three independent evaluations of magma transfer rate is
shown in Fig. 3, together with error bars, where the magma is assumed incompressible (
). Apparent from these are: (1) the relatively small variation in calculated
magnitudes of magma supply between the geodetic data from the three paired stations; and (2)
the relative consistency between inflation-deflation and magma exchange in each eruptive
episode, and pause. These observations allow us to infer that the three separate episodes are
products of a nearly invariant plumbing system.
1I IIC C= =
Influence of Magma Compressibility: Where the magma is slightly compressible ( ), the
volume change of magma within the chamber will be larger than the geodetically recorded
volume-change signal. This severity of this effect is indexed relative to the ratios of wall-rock to
magma stiffness (reciprocal compressibility) ( ).
1iC >
/R MG K
The shear modulus of the wall rock may be indexed relative to p-wave magnitudes which vary
between ~3 km/s at sea level beneath the volcano to ~6 km/s at 6-12 km. The small strain
shear moduli estimated from these (Poisson ratio of 0.25) range between 5 and 10 GPa. Large
4

strain moduli may be an order of magnitude lower in representing the larger displacements
accommodated in the long-term inflationary and deflationary response(3, 11). Shallow to
intermediate depth shear moduli are estimated in the range 1-5 GPa from surface tilt data (3).
The lower end of this range is congruent with stress drops anticipated during deflation, expected
to be of the order of 1-10 MPa. From [Equation ( / )RdV V G dp∼ (3)] the pressure drop for the
evacuation of ~150 Mm3 from the lower chamber (Fig. 4) is in the range 250-25 MPa for
chamber volumes in the range 1-10 km3 for a shear modulus of . A shear modulus
of 5 GPa is considered the upper limit of the applicable range for SHV.
5 MPaRG =
The compressibility of the magma, and its reciprocal bulk modulus ( ) varies significantly
with exsolved gas fraction (12). For water contents of the primitive magmas of the order of 6
wt% (13, 14) and for an upper limit of crystals above the percolation threshold (15) of the order
of 40%, this results in bulk moduli of the order of 1.9 GPa at 6 km and 42.6 GPa at 12 km (
and bulk modulus of the melt and crystals of 10 GPa). Thus, for wall rock shear moduli
in the range , the compressibility factors, are in the ranges 1.7-4.5 at 6 km
and 1.03-1.16 at 12 km. The influence of these magnitudes on the resulting distribution of
magma transfer is shown in
MK
800 C°
0,RG =
1 5 GPaRG = −
GPa
iC
Fig. S1 for incompressible through compressible magmas with
. The corresponding influence of magma compressibility on the volumetric
inflation rates in the upper and the lower chamber are shown in
1, 5
Fig. S3. Apparent from the
response is that for the depths selected here, the magma may be considered incompressible
relative to the surrounding host rock.
Temporal Volume Change for a Deflating Spherical Reservoir: Cumulative volume change with
time , for a spherical reservoir discharging through a constant diameter conduit may be
defined in terms of the total volume change , the compliance of the combined magma and
chamber system, C , and the Poisseiulle resistance of discharge along the conduit as
( )dV t
TdV
B
( ) ( )exp( ) ( )exp( )T T
Bt BtdV t C dP dV
C C
− −= = . (9)
The compliance of the chamber is given as 3
3 1 4 1
3i i
R M R
aC a C
G K G
ππ
⎛ ⎞⎟⎜ ⎟⎜= + =⎟⎜ ⎟⎜ ⎟⎝ ⎠ where behavior is
modulated by the shear modulus of the rock surrounding the chamber , the bulk modulus of
the magma and the radius of the chamber a . Magma of viscosity discharges through a
conduit of radius , length as
RG
MμMK
(15 )b m (12 )h km4
8M
dB =
h
πμ
. Parameter magnitudes are applied as
5

given in Table S2, enabling the change in chamber volume to be followed with time, as shown in
Fig. 4.
6

REFERENCES
1. D. F. McTigue, Journal of Geophysical Research-Solid Earth and Planets 92, 12931 (Nov
10, 1987).
2. K. Mogi, Bull. of the Earthquake Research Institute 36, 99 (1958).
3. C. Widiwijayanti, A. Clarke, D. Elsworth, B. Voight, Geophysical Research Letters 32
(Jun 15, 2005).
4. G. S. Mattioli et al., Geophysical Research Letters 25, 3417 (Sep 15, 1998).
5. G. S. Mattioli, R. Herd, Seismological Research Letters 74, 230 (2003).
6. Montserrat Volcano Observatory. Unpublished Data. (1995-2008).
7. J. D. Devine et al., Geophysical Research Letters 25, 3669 (Oct 1, 1998).
8. R. S. J. Sparks et al., Geophysical Research Letters 25, 3421 (Sep 15, 1998).
9. P. E. Jansma, G. S. Mattioli, Geological Society of America Special Paper 385, 13
(2005).
10. C. DeMets et al., Geological Society of America Special Paper 428, 21 (2007).
11. B. Voight et al., Geophysical Research Letters 33 (Feb 10, 2006).
12. H. E. Huppert, A. W. Woods, Nature 420, 493 (Dec 5, 2002).
13. I. S. E. Carmichael, American Mineralogist 89, 1438 (Oct, 2004).
14. M. Pichavant, R. Macdonald, Contributions to Mineralogy and Petrology 154, 535 (Nov,
2007).
15. N. Petford, Annual Review of Earth and Planetary Sciences 31, 399 (2003).
7

List of Tables
Table S1: Dense rock equivalent (DRE) efflux rates and average radial and vertical station
velocities measured over the three episodes of activity-followed-by-repose for the four
stations used in the analysis. Velocities in mm/y. Calculations are for chambers centered at
depths of 6 km and 12 km. .................................................................................................... 9
Table S2: Parameters used to represent cavity deflation for chambers at 6 km and 12 km. ...... 10
8

MVO1 HARR SOUF WYTD
7.38 km 3.38 km 3.22 km 2.85 km
Period Dates r z r z Efflux
(m3/s)
Episode 1 15 Nov 1995 – 10 Mar 1998 N/A* N/A -6.51 -57.00 N/A N/A 8.30 -68.50 4.1
Pause 1 10 Mar 1998 – 28 Nov 1999 12.06 10.10 6.33 30.90 7.06 -7.20 11.85 27.80 0.06
Episode 2 28 Nov 1999 – 31 July 2003 -19.92 -32.10 -14.71 -27.30 -10.59 -29.50 3.05 -45.30 2.25
Pause 2 31 July 2003 – 1 Aug 2005 16.33 23.00 11.01 28.80 8.98 17.70 6.39 29.60 0.02
Episode 3 1 Aug 2005 – 4 April 2007 -41.60 -47.70 -33.04 -89.00 -23.35 -31.50 -28.91 -81.10 6.0
Pause 3 4 April 2007 – Dec 2008 19.15 6.40 0.922 46.00 10.06 16.00 -8.71 53.20 0.0
r z r z
LKYN RDIO STGH REID ROCH
8.81 km 3.91 km 3.52 km 3.46 km 2.81 km
Period Dates r r r Efflux
(m3/s)
Episode 1 15 Nov 1995 – 10 Mar 1998 -30.5 -33.4 -15.9 -55.2 -19.4 -43.1 -8.3 -44.4 -3.8 -71.8 4.1
z r z r z z z
*N/A=Not Available
Table S1: Dense rock equivalent (DRE) efflux rates and average radial and vertical station velocities
measured over the three episodes of activity-followed-by-repose for the four stations used in the analysis.
Velocities in mm/y. Calculations are for chambers centered at depths of 6 km and 12 km.
9

Parameter Symbol Assigned Value
Chamber Radius a 1000 m
Conduit Radius R 15 m
Chamber Depth h 12,000 m
Shear Modulus of Host Rock GR 3 GPa
Bulk Modulus of Magma KM 1.1 GPa
Magma Viscosity M
μ 5.5 107 Pa s
Total Chamber Volume Changea dVT 338 Mm3
Three values of final volume change are used to generate the range (shadow) of exponential curves in Error! Reference
source not found.4. 308, 338, and 368 Mm3 aTotal chamber volume change is for the completing eruptive cycle, until pressure
drive stalls.
Table S2: Parameters used to represent cavity deflation for chambers at 6 km and 12 km.
10

LIST OF FIGURES
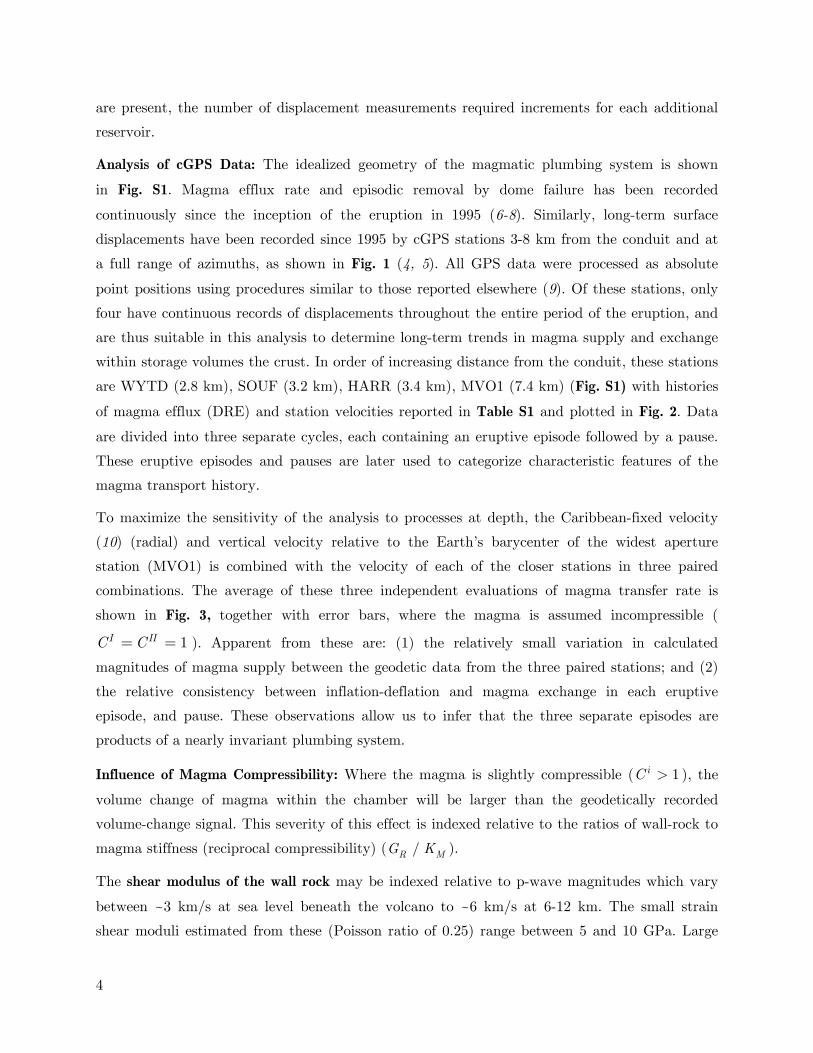
Fig. S1: Schematic of the magmatic plumbing system considered here. Adjacent reservoirs
and are linked by conduits with little magma volume or storage. Inflating reservoir
at volumetric rate results in surface displacement rates in the radial d vertical
asured at location ( ....................................................................................... 12
V 1Ir 1
Iz
;Iir R
I
I
III
an
me . ......
Pa
a s
I )i
Fig. S2: Average inter-chamber, basement supply, and chamber inflation rates recovered from
co-inversion of surface efflux and geodetic data for dual chamber geometry as in Figure 3.
Results are for shear modulus of wall rock of (A)
(incompressible as shown in
Figure 3(A), (B) and (C) . Flux rates are in of dense
rock equivalent (DRE) with surface efflux measured and all others calculated. .................. 13
0RG G=
GPa1RG GP= 5RG = 3 /m
Fig. S3: Volumetric deflation (positive) and inflation (negative) rates of the deep (lower) and
shallow (upper) chambers for shear moduli of the host rock of 1 (solid) and 5 GPa
(transparent). ....................................................................................................................... 14 RG
11
Fig. S1: Schematic of the magmatic plumbing system considered here. Adjacent reservoirs and are
linked by conduits with little magma volume or storage. Inflating reservoir at volumetric rate
results in surface displacement rates in the radial and vertical measured at location ( ).
I I
r R
I
I IV
1Ir 1
Iz ;I Ii i
12

(A)
(B)
(C)
Fig. S2: Average inter-chamber, basement supply, and chamber inflation rates recovered from co-inversion
of surface efflux and geodetic data for dual chamber geometry as in Figure 3. Results are for shear
modulus of wall rock of (A)
(incompressible as shown in Figure 3(A), (B)
and (C) . Flux rates are in of dense rock equivalent (DRE) with surface efflux
measured and all others calculated.
0RG G= Pa a
Pa s
1RG GP=
5RG G= 3 /m
13

Fig. S3: Volumetric deflation (positive) and inflation (negative) rates of the deep (lower) and shallow
(upper) chambers for shear moduli of the host rock of 1 (solid) and 5 GPa (transparent). RG
14