Embed Size (px)
Citation preview

1
Supporting Information
Switchable iron-based coordination polymer toward reversible acetonitrile electro-optical readout
Esther Resines-Urien,a Enrique Burzurí,*a Estefania Fernandez-Bartolome,a Miguel Ángel García García-Tuñón,b Patricia de la Presa,c Roberta Poloni,d Simon J. Teat,e and Jose Sanchez Costa*a
1) Experimental Section 22) Synthesis of ∞{[Fe(H2O)2(CH3CN)2(pyrazine)](BF4)2·(CH3CN)2} (1·2CH3CN) and ∞{[Fe(H2O)2(CH3CN)2(pyrazine)](BF4)2} (1)
3
3) Crystal data, structural refinement and selected distances and angles
4
4) Crystal color variation. Reversibility under acetonitrile absorption/desorption
6
5) Additional infrared absorption spectra 7
6) X-ray Powder Diffraction (XRD) study 107) DFT modelling 118) Size change of one crystal (1·2CH3CN to 1) 149) 1∙2CH3CN thermogravimetric analysis 1410) Additional electron transport measurements. Reproducibility and reversibility
15
11) Magnetic characterization of 1∙2CH3CN crystals. 16
12) Measurements on the complex admittance 18
Electronic Supplementary Material (ESI) for Chemical Science.This journal is © The Royal Society of Chemistry 2019

2
1) Experimental Section
Materials. Chemicals and reagents were purchased from commercial suppliers and used as received. Physical measurements. Crystal Structure Determination: The data were collected in a yellow needle crystal of 1·2CH3CN with a MD2M – Maatel diffractometer at the XALOC beamline (BL13) at ALBA Synchrotron with the collaboration of ALBA staff, from a Silicon (111) mono- chromator (T = 100 K, λ = 0.71073 Å).[1] The crystal was taken directly from its solution, mounted with a drop of Paratone-N oil and immediately put into the cold stream of dry N2 on the goniometer. The data was also collected with a Bruker APEX II CCD diffractometer at the Advanced Light Source beamline 11.3.1 at Lawrence Berkeley National Laboratory from a silicon (111) monochromator (T = 100, K, λ = 0.7749 Å). The structure was solved by direct methods and the refinement on F2 and all further calculations were carried out with the SHELX-TL suite and OLEX2 program.[2]
Optical reflectivity measurements between 288 and 373 K were performed using a MOTIC SMZ-171 optical stereoscope coupled with a MOTICAM 3. Images were collected in BMP format without any filter using the Motic Images Plus 3.0 software, with the mean value from each region of interest (ROI) analyzed under the ImageJ program. The temperature was controlled using a Linkam T95 system controller and a LNP 95 Liquid Nitrogen Cooling System. TGA was performed using a TA Instrument TGAQ500 with a ramp of 1 ºC min-1 under air from 303 to 873 K. FT-IR spectra were recorded as neat samples in the range 400-4000 cm-1 on a Bruker Tensor 27 (ATR device) Spectrometer. The temperature dependence experiments were performed in the same instrument, using a thermometer and a heat gun. Elemental analyses (C, H and N) were performed on a LECO CHNS-932 Analyzer at the “Servicio Interdepartamental de Investigación (SIdI)” at Autónoma University of Madrid. Differential Scanning Calorimetry (DSC) measurements were performed in a TA Instruments Discovery MDSC 25 between 273 K and 393 K under a N2 atmosphere with a ramp of 1°C min-1. The sample was secured in a hermetically sealed aluminum sample pan. Magnetic susceptibility measurements between 10 K and 380 K were carried out in a Quantum Design MPMS-5S SQUID magnetometer under a 2000 Oe field. Each sample was secured inside a plastic capsule with cotton. Pascal constants were used to correct for the diamagnetic contribution. Electrical conductivity measurements were carried out on single crystals of 1·2CH3CN by a two-probe method using a Keithley 2450 SourceMeter under light and in a nitrogen atmosphere. Electrical contact to individual 1·2CH3CN crystals is made directly via the conducting tips of the electrical probe station. Charge transport is probed along the long axis of the crystals that coincides with the orientation of the molecular chains. The length of the crystals and the separation between the tips is typically a few hundred micrometers (200-500µm). The temperature was controlled using a Linkam T95 system with a LNP 95 Liquid Nitrogen Cooling System. Powder X ray diffraction data was collected in a Rigaku Smartlab SE diffractometer with a Bragg-Brentano configuration, using Cu-Kα radiation (λ = 0.1541 nm). The sample was measured between 5 and 50° with a speed of 1.8° min-1 under an X ray fluorescence reduction mode, at room temperature. Treatment of data and estimation of the unit cell were performed using the software HighScore Plus.

3
2) Synthesis of ∞{[Fe(H2O)2(CH3CN)2(pyrazine)](BF4)2·(CH3CN)2} (1·2CH3CN) and ∞{[Fe(H2O)2(CH3CN)2(pyrazine)](BF4)2} (1)
Compound 1∙2CH3CN was synthetized at room temperature, dissolving 0.64 mmol of Fe(BF4)2·6H2O in 2.5 ml of acetonitrile and adding it drop by drop to a solution of 1.2 mmol of pyrazine in 2.5 mL of acetonitrile. The resulting solution was stirred for 15 minutes and filtered. After one day, yellow crystals appeared.
Anal. calcd for 1∙2CH3CN·0.6H2O: C 27.69, H 4.10, N 16.14; found C 27.85, H 3.72, N 15.77.
FTIR 1·2CH3CN (cm-1): ν = 3481 (w; ν(OH)), 2309 (w; ν(C≡N)), 2281 (w; ν(C≡N)), 1642 (m; ν(CC)), 1488 (w), 1423 (s; δ(CH)), 1366 (w), 1289 (w), 1058 (s), 1002 (s, ν(BF4)), 817 (s; δ(ring)), 766 (m; δ(CCN)), 589 (w), 518 (w), 466 (m).
Sample 1∙2CH3CN powder was heated in the Linkam T95 system controller at 50°C for 5 hours to eliminate the uncoordinated acetonitrile (1). In the case of a single crystal, acetonitrile is eliminated after 2 minutes.
Anal calcd for 1·0.6H2O: C 21.91, H 3.49, N 12.77; found C 21.73 , H 3.31, N 12.6.
FTIR 1 (cm-1): ν = 3481 (w; ν(OH)), 2306 (w; ν(C≡N)), 2277 (w; ν(C≡N)), 1641 (m; ν(CC)), 1490 (w), 1423 (s; δ(CH)), 1369 (w), 1288 (w), 1059 (s), 998 (s, ν(BF4)), 815 (s; δ(ring)), 573 (w), 518 (w), 455 (m).
Reversibility was attained adding a few drops of acetonitrile to the 1 powder and drying it using filter paper. In the case of a single crystal, only one drop of acetonitrile is necessary.
Anal calcd for 1·2CH3CN·0.35H2O: C 27.93, H 4.04, N 16.28; found C 28.26, H 3.76, N 15.95.
4
3) Crystal Data and Structural Refinement and selected distances and angles
Table S1. Selected bond and interaction lengths [Å] for compound 1·2CH3CN.
Fe1-N1 2.225(6)
Fe1-N2 2.163(6)
Fe1-O1 2.058(5)
F1-O1 2.655
F1-H2W 1.795
F3-C1 3.276
F3-H1A 2.657
N3-O1 2.744
N3-H1W 1.862
F2-C3 3.066
F2-H3C 2.270
F1-C5 3.193
F1-H5A 2.667
N3-centroid(N1C1) 3.226
5
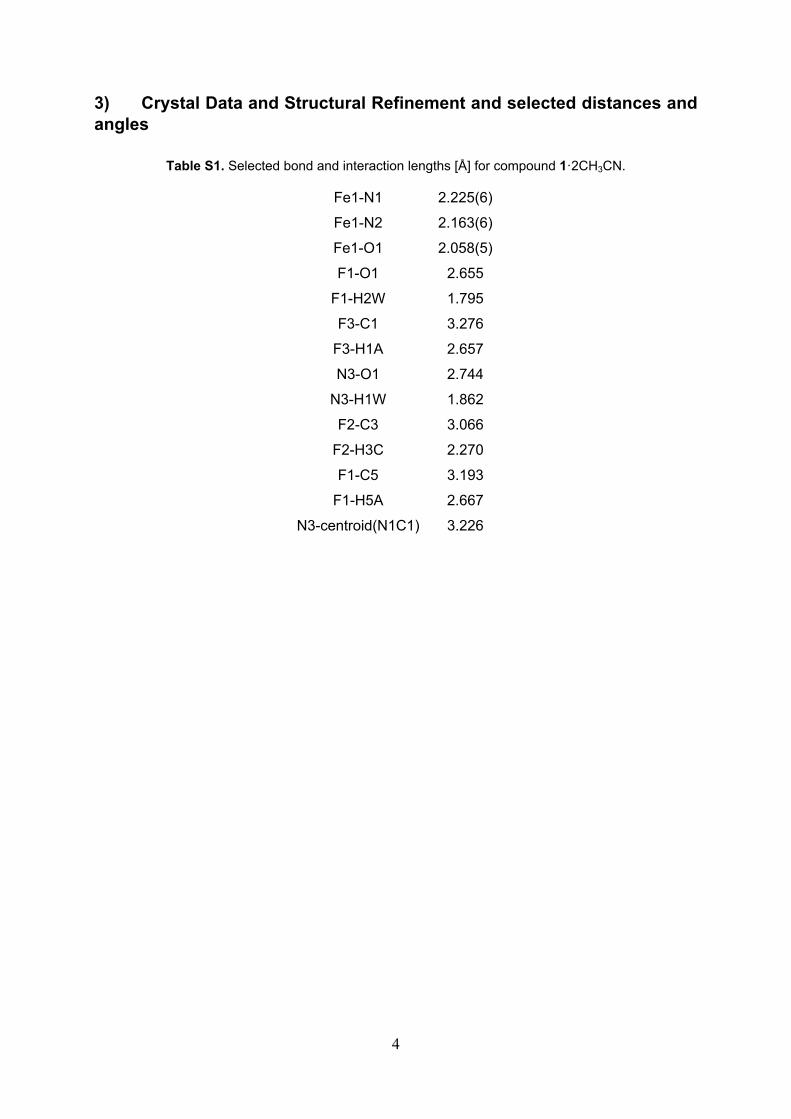
Table S2. Crystallographic data of 1·2CH3CN.Compound 1·2CH3CN
CCDC 1895056
Chemical formula C12 H20 B2 F8 Fe N6 O2
Formula mass 510.11 g/mol
Temperature (K) 250.0
Crystal system Orthorhombic
Space group Cmca
a/Å 7.2430(17)
b/Å 12.882(2)
c/Å 23.908(6)
α/◦ 90
β/◦ 90
γ/◦ 90
V(Å3) 2230.8(9)
Z 4
Radiation type Synchrotron
Density (calculated mg m-3) 1.518
Absorption coefficient (mm-1) 0.76
F(000) 1032.0
Crystal size (mm3) 0.000576
Goodness of fit on F2 1.112
R1, wR2 [I>2σ(I)] 0.0719, 0.2069
R1, wR2 (all data) 0.0930, 0.2330

6
4) Crystal color variation. Reversibility under acetonitrile absorption/desorption
Figure S1 shows the color variation of a 1∙2CH3CN crystal as the temperature is increased. The color changes from a pale yellow (298 K) to a dark orange (353 K) as the temperature is increased and interstitial acetonitrile is released. Strikingly, the crystal color turns back to its original pale yellow once it is exposed to acetonitrile vapor at room temperature (bottom panel). The optical properties are therefore reversible under acetonitrile absorption/desorption.
Figure S1. Color variation of a 1∙2CH3CN crystal under increasing temperature. The color is recovered after a drop of acetonitrile is added at room temperature.
Figure S2 shows the color of a 1∙2CH3CN crystal at three specific temperatures of special relevance in the OR and conductance measurements: a) before the first OR transition, b) at the first OR and conductance transition and c) at the second OR and conductance transition. At the first resonance (~310 K) a sharp change from a matte yellow to a shiny bright shade of yellow is observed. After that transition and coinciding with the progressive loss of acetonitrile observed in the IR and the TGA, the crystal color turns into darker orange.

7
Figure S2. Color change in three different 1·2CH3CN crystals at three relevant temperatures for the OR and electron transport measurements.
5) Additional infrared spectra
Figures S3 to S6 show the infrared absorption spectra of a 1·2CH3CN crystal at different temperatures. Figure S7 shows the room temperature infrared spectrum of the analogue compound pyrazine-ClO4. Finally, Figure S8 shows the infrared spectrum of the 1·2CH3CN crystal shown in Figures S3-S6 after exposition to acetonitrile in ambient conditions.
Figure S3. IR spectrum of 1·2CH3CN between 4000 cm-1 and 400 cm-1. The band corresponding with ν(BF4) at 1022 cm-1 is represented in red, while the C-C≡N bend overtone of acetonitrile, at 766 cm-

8
1, is colored in blue.
Figure S4. IR spectrum of 1·2CH3CN between 4000 cm-1 and 400 cm-1 at 317 K.
Figure S5. IR spectrum of 1·2CH3CN between 4000 cm-1 and 400 cm-1 at 333 K.

9
Figure S6. IR spectrum of 1·2CH3CN between 4000 cm-1 and 400 cm-1 at 353 K.
Figure S7. IR spectrum of pyrazine-ClO4 between 4000 cm-1 and 400 cm-1.

10
Figure S8. IR spectrum of 1·2CH3CN between 4000 cm-1 and 400 cm-1 at room temperature after a drop of acetonitrile was added to the “dry” crystal. The 766 cm-1 band is recovered.
6) X-ray Powder Diffraction (XRPD) study
The XRPD studies have been done for the three phases by adjusting the following parameters to be capable of obtaining the best setting conditions: i) the grinding process and ii) the speed of measurement. Both have been addressed.Specifically, the grinding process, which is important for the homogenization of the sample could provoke a color change in 1·2CH3CN (from green-yellow to a yellow) and also, the appearance of more diffraction peaks than those expected from the single X-ray pattern simulated from the CIF file. These evidences are in agreement with the formation of novel independent crystalline phases either by an internal rearranging of the polymer or by the loss of acetonitrile during the milling. To rectify this problem we have made the data acquisition from crystals without the milling process. The result is plotted in diffractogram 1·2CH3CN (see Figure 3 in the main manuscript). The pattern is in good fit with those obtained by the simulation. To confirm this agreement, from these peaks we have calculated the unit-cell parameters by using HighScore Plus as refinement software, obtaining an excellent result (see Table S3). Therefore, we have decided not to grind the starting material.
Sample 1·2CH3CN was then heated for 5 hours at 50°C to ensure that the interstitial acetonitrile was completely out of the material. First, we observe that the collected spectrum is different than 1·2CH3CN. The appearance of new peaks suggests a new crystalline phase associated with the loss of acetonitrile. Also, the cell parameters obtained from these peaks are in agreement with the decrease of volume predicted by DFT and with the decrease of the macroscopic size of the crystals (see table S3).
Finally, with the aim of recovering the initial phase, previous crystalline sample 1 was exposed for 10 hours to acetonitrile vapors. After confirmation by FT-IR and by monitoring the clear color change (from orange to yellow), the material was measured by powder X-ray diffraction. The acquired spectrum reflects a pure phase of 1·2CH3CN. It is important to mention that to obtain a pure phase, the material was repeated several times and the data collection performed at the fastest acquisition speed (16 minutes). Additionally, the unit cell was calculated and those parameters are in agreement with the single crystal unit cell (see Table S3).

11
Table S3. Cell parameters obtained after fitting the diffraction peaks obtained from the three phases by using the HighScore Plus Software.
7) DFT modelling
DFT calculations are performed using PWscf utility of QUANTUM ESPRESSO.[5] Exchange and correlation is treated using the PBE (Perdew-Burke-Ernzerhof) functional and a Hubbard U correction of 5 eV applied to d electrons is employed. Ultrasoft Rappe Rabe Kaxiras Joannopoulos pseudopotentials are used, and we set wave-function with charge density cutoffs of 60 Ry and 600 Ry, respectively. Geometrical optimizations are performed for 1 and 1·2CH3CN compounds (without and with interstitial acetonitrile) until the forces on atoms are less than 0.003 eV Å-1 and the stress is less than 0.015 kbar.
A unit cell containing 156 and 204 atoms is used for 1 and 1·2CH3CN, respectively. This implies a ferromagnetic alignment of the Fe ions along the chains (x direction). A Monkhorst-Pack grid of 5x1x1 is used for geometrical optimization while a 7x3x1 is employed for calculation of the density of states. After removal of interstitial CH3CN molecules, the a, b, and c lattice parameters are shortened by 0.8 %, 1.8 % and 5.5%, respectively. The final structure without acetonitrile molecules is shown in Figure S11. This prediction is in good agreement with the experimental decrease in crystal size observed above the transition, as seen in Figure S12
For the 1·2CH3CN complex, we compute the following bond lengths around the each Fe ion: Fe-O=2.14 Å, Fe-N(CH3CN)=2.18 Å and Fe-N(pz)=2.30 Å. For 1 we compute: Fe-O=2.18 Å, Fe-N(CH3CN)=2.15 Å and Fe-N(pz)=2.27 Å. We compute a binding energy of 65 kJ mol-1 for acetonitrile.
We also computed an antiferromagnetic ordering along the chain by employing a 2x1x1 supercell. In this case, due to the computation cost of fully optimizing a 408 atoms cell, we employed the fully optimized geometry of the ferromagnetic alignment for both the full material and the polymer without acetonitrile.
The projected density of states computed for both the ferromagnetic and antiferromagnetic orderings along the 1D chains and shown in Figure S9-S10 for 1·2CH3CN shows, in both cases, a large gap (~3 eV) which is negligibly affected by removal of acetonitrile, consistent with states located far from the conduction and valence bands.
a (Å) b (Å) c (Å) α (°) β (°) γ (°) V (Å3) FOM1·2CH3CN
(single crystal)7.2430 12.862 23.908 90 90 90 2230.7 -
1·2CH3CN 7.516 12.82 24.01 90 90 90 2313.36 101 7.92 12.40 18.1 90 97.98 90 1760.56 3.51
1 after exposure to acetonitrile
6.893 11.389 23.92 90 90 90 1877.82 7

12
Figure S9. Projected density of states of 1·2CH3CN (upper panel) and 1 (lower panel) computed for a ferromagnetic ordering along the chains. The valence band maxima are set to -2 eV. The states of uncoordinated acetonitrile are far from valence and conduction bands.
Figure S10. Projected density of states of 1·2CH3CN (upper panel) and 1 (lower panel) computed for an antiferromagnetic ordering along the chains. The valence band maxima are set to -2 eV.

13
Figure S11. Simulated structure of 1.

14
8) Size change of one crystal ( 1·2CH3CN to 1)
9) 1∙2CH3CN thermogravimetric analysis
Thermogravimetric analysis extended to higher temperatures. It shows the peak corresponding to the loss of acetonitrile (see main text). The polymer decomposes completely above 440 K approximately.
Figure S13. Thermogravimetric analysis of 1·2CH3CN between 303 K and 873 K.
Figure S12. Change on the size and length (2.5%) from 1·2CH3CN to 1 solid-state transformation.

15
10) Additional electron transport measurements. Reproducibility and reversibility
Figure S14 shows the current as a function of the temperature measured in two additional 1·2CH3CN crystals. The order of magnitude and position of the conductance resonances are roughly consistent with those shown in Figure 4 of the main manuscript.
Figure S14. Electrical current measured at V = 1 V between 288 K and 330 K. Two resonances in current show up at roughly the same temperature than in the crystal in the main text.
Figure S15 shows the current measured as a function of increasing temperature in the same 1·2CH3CN crystal shown in the main text. The black line corresponds to the first thermal cycle on the sample. The resonance disappears in subsequent thermal cycles since the loss of acetonitrile is irreversible as explained in the main text. Strikingly, the resonance reappears at roughly the same temperature after the crystal has been exposed to liquid acetonitrile at room temperature.
Figure S15. Electrical conductivity measurements between 288 K and 330 K. The black line corresponds to the original 1·2CH3CN (first thermal cycle) and the red one to the same crystal after a drop of acetonitrile was added in a subsequent thermal cycle.
Figure S16 shows an additional proof-of-concept acetonitrile sensor measurement. The current I is measured across a 1·2CH3CN crystal while cycling the temperature between 288

16
K and 318 K. As shown in the main paper, a resonance in the current appears at a well-defined temperature only in those cycles where the crystal has been exposed to acetonitrile vapor. For this, a 10 µl droplet of acetonitrile is deposited in ambient conditions with a micro pipette at approximately 4 cm distance from the “dried” crystal. The crystal (also in the main manuscript) is therefore only exposed to the vapor pressure generated by the micro-droplet.
Figure S16. Current I trace measured across a 1·2CH3CN crystal while cycling the temperature between 288 and 318 K. A resonance in the current (red circle) appears in the cycle where the 1·2CH3CN is exposed to acetonitrile vapor (green crosses).
11) Magnetic characterization of 1·2CH3CN crystals
The magnetic susceptibility (χM) is measured in a set of 1∙2CH3CN crystals between 10 K and 380 K. The high-temperature χMT product is represented in Figure S17. The saturation value remains constant at 3.04 cm3 K mol-1 from low temperatures up to 310 K. This value is characteristic of non-interacting high-spin iron (II) ions.[3,4] A small kink in the slope can be observed at 312 K and thereafter χMT decreases to 3.02 cm3 K mol-1. The transition temperature matches with the first structural, optical and conductance transitions observed in the 1∙2CH3CN crystal. According to Curie’s law for a paramagnet, a change in χMT could be induced by a change in the spin value S or a change in the g factor. A high-spin to low-spin switch would have a more dramatic consequence in χMT. The most probable scenario is therefore a change in g due to a structural change around the Fe, as suggested by the DSC measurements and the DFT calculations.
17
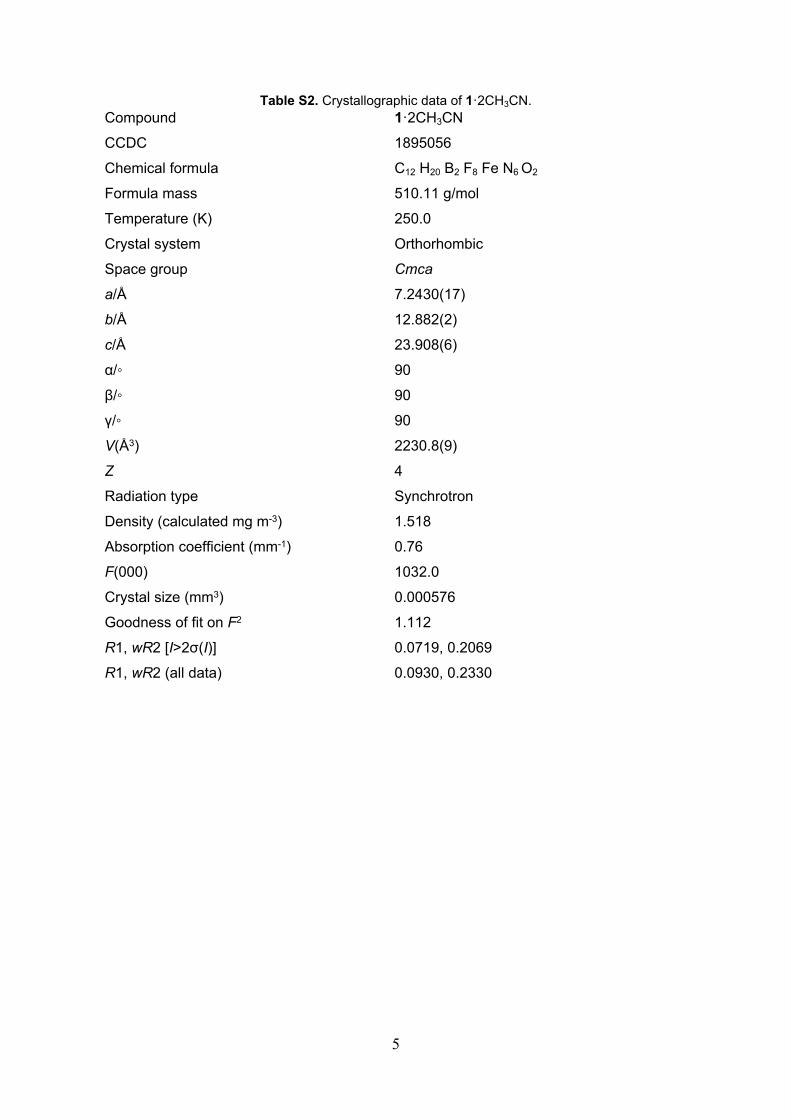
Figure S17. High temperature χMT measured as a function of the temperature in a set of 1∙2CH3CN crystals. A small kink and a large drop in χMT are observed at 310 K and 350 K respectively.
After the first transition, an abrupt change in the slope shows up at 350 K; the second transition temperature in the conductance and the OR. The χMT value decreases down to 2.57 cm3 K mol-1 at the highest measured temperature. Note that the limitations in the set-up do not allow measuring above this temperature and therefore is difficult to determine whether χMT continues dropping to zero or stabilizes at a finite value. A sharp drop of χMT in these kind of materials is typically associated to a spin crossover transition to a low-spin state (S = 0). [3] However, this transition typically occurs while decreasing the temperature and the bond lengths around the Fe ions decrease. In 1·2CH3CN crystals, such decrease in the bond length could be induced by the structural distortions caused by the release of acetonitrile, as suggested by DFT calculation (see below). The in-depth analysis of this effect is an interesting topic in itself that will be subject of a further study.
Figure S18 shows χMT measured in the same set of 1·2CH3CN crystals at low temperatures. The value of χMT remains approximately constant down to 25 K. The sharp drop in χMT below 25 K may be indicative of antiferromagnetic correlations in the chains or the depopulation of excited magnetic levels.

18
Figure S18. Low temperature χMT measured on a set of 1·2CH3CN crystals.
12) Measurements on the complex admittance
The real and imaginary components of the complex current I* = I’+ jI’’ measured with an AC voltage excitation are proportional to the conductance G and susceptance B respectively of the complex admittance Y. The admittance is the reciprocal value of the impedance Z* so that:
𝑌 ∗ =1
𝑍 ∗= 𝐺 + 𝑗𝐵
Figure S19 shows G and B measured with a lock-in amplifier while sweeping the frequency f between 100 Hz and 510 kHz. The excitation AC voltage is set to VAC = 100 mV (Vrms = 70.71 mV). A simple resistor R or set of resistors would show no susceptance, i.e. there would be no
imaginary out-of-phase component B and no dependence with the frequency ( ). 𝐺 =
1𝑅
, 𝐵 = 0
A finite and positive value of the susceptance, together with its increment with frequency, is in turn indicative of the presence of a capacitor , where . The susceptance 𝐵 = 𝑗𝜔𝐶 𝜔 = 2𝜋𝑓measured in our solid-state devices reveals therefore the presence of a capacitor.

19
Figure S19. Conductance G and susceptance B of the complex admittance Y* measured as a function of frequency with VAC = 100 mV. The inset shows a log-log plot of G and B with fits to a RC series circuit. G and B follow a ω2 and ω dependence as expected for a RC series circuit when ω < (1/RC). The low frequency region is below the noise level of the electronics.
In a real system with the geometry of our device (crystal plus interface with the electrodes, see Figure S19), it is more realistic to model the sample by a combination of resistances and capacitors in parallel and/or perpendicular configuration to account for the material, the contacts, the probes and cables, etc. The expressions for G and B involve in this case a more elaborated combination of R and C depending on the specific configuration. The G and B curves in Figure S19 can be qualitatively reproduced (blue solid lines) for example with a simple RC circuit in series where[6]:
(2) ; (3)𝐺 =
𝑅𝜔2𝐶2
1 + (𝜔𝑅𝐶)2𝐵 =
𝜔𝐶
1 + (𝜔𝑅𝐶)2
The deviations and noise observed at low-frequencies are caused by the low signal-to-noise ratio, i.e., the measured current is below the noise level of the electronics. The small deviations at very high frequencies may be indicative of the presence of additional components (cables, etc) not captured by the simple RC series circuit.
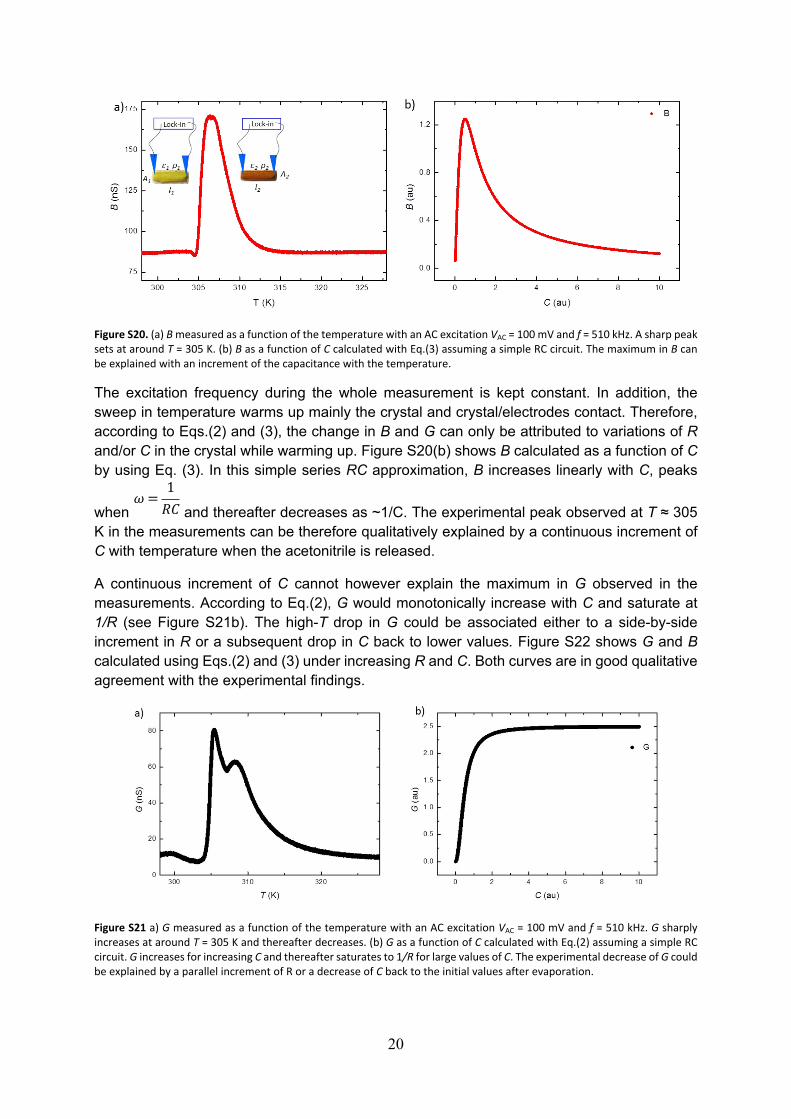
In the following, we have explored the evolution of G and B with varying temperature. Figures S20a and S21a shows B and G respectively measured while sweeping the temperature from 298 K up to 328 K. That is, covering the temperature region where the critical transition is observed in the pyrazine crystals. The AC excitation is fixed to VAC = 100 mV (Vrms = 70.71 mV) and f = 510 kHz. At low temperatures, both G and B remain constant in temperature. Interestingly, as observed in DC measurements, a sharp peak sets on at around T = 305 K, for both G and B. Thereafter it decays back to the initial values with a softer dependence with T.
20
Figure S20. (a) B measured as a function of the temperature with an AC excitation VAC = 100 mV and f = 510 kHz. A sharp peak sets at around T = 305 K. (b) B as a function of C calculated with Eq.(3) assuming a simple RC circuit. The maximum in B can be explained with an increment of the capacitance with the temperature.
The excitation frequency during the whole measurement is kept constant. In addition, the sweep in temperature warms up mainly the crystal and crystal/electrodes contact. Therefore, according to Eqs.(2) and (3), the change in B and G can only be attributed to variations of R and/or C in the crystal while warming up. Figure S20(b) shows B calculated as a function of C by using Eq. (3). In this simple series RC approximation, B increases linearly with C, peaks
when and thereafter decreases as ~1/C. The experimental peak observed at T ≈ 305 𝜔 =
1𝑅𝐶
K in the measurements can be therefore qualitatively explained by a continuous increment of C with temperature when the acetonitrile is released.
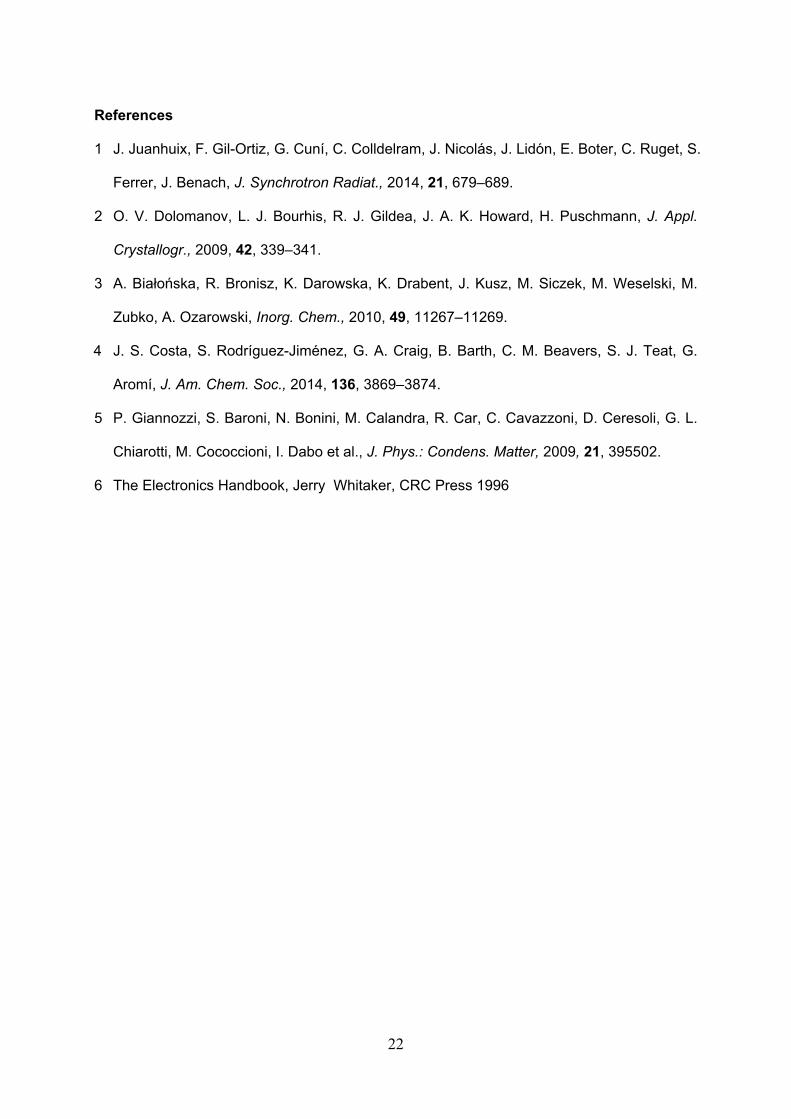
A continuous increment of C cannot however explain the maximum in G observed in the measurements. According to Eq.(2), G would monotonically increase with C and saturate at 1/R (see Figure S21b). The high-T drop in G could be associated either to a side-by-side increment in R or a subsequent drop in C back to lower values. Figure S22 shows G and B calculated using Eqs.(2) and (3) under increasing R and C. Both curves are in good qualitative agreement with the experimental findings.
Figure S21 a) G measured as a function of the temperature with an AC excitation VAC = 100 mV and f = 510 kHz. G sharply increases at around T = 305 K and thereafter decreases. (b) G as a function of C calculated with Eq.(2) assuming a simple RC circuit. G increases for increasing C and thereafter saturates to 1/R for large values of C. The experimental decrease of G could be explained by a parallel increment of R or a decrease of C back to the initial values after evaporation.

21
Figure S22. G and B calculated with Eqs.(2) and (3) under increasing C and R. Both curves are in good agreement with the experimental findings in Figure 20a and Figure 21a.
We now discuss the possible physical mechanisms behind a change in C or R with temperature
in our crystals. Capacitance and resistors are defined as and where A and are 𝐶 = 𝜀
𝐴𝑙
𝑅 = 𝜌𝑙𝐴 𝑙
the transversal area and longitudinal dimension respectively and ε and ρ are the dielectric constant and resistivity of the material respectively. A change in C or R can be therefore associated to changes in the intrinsic properties of the material (ε, ρ) or to changes in the dimensions ( , A). 𝑙
Intrinsic changes in ε or ρ of the crystal/contacts set could be originated by the reorganization or loss of the acetonitrile triggered by temperature, as demonstrated in the main manuscript. Acetonitrile has one of the largest dielectric constant of common organic solvents what could explain the sharp rise in the capacitance. On the other hand, changes in the dimensions of the material can be experienced by the crystal when the acetonitrile is released. DFT calculations in section 7 predict a shortening 0.8 %, 1.8 % and 5.5% of a, b, and c lattice parameters with a total decrease of volume of 8.1%. We have indeed observed changes in the crystal dimensions while increasing temperature, as seen in Figure S12 and video S1.
22
References
1 J. Juanhuix, F. Gil-Ortiz, G. Cuní, C. Colldelram, J. Nicolás, J. Lidón, E. Boter, C. Ruget, S.
Ferrer, J. Benach, J. Synchrotron Radiat., 2014, 21, 679–689.
2 O. V. Dolomanov, L. J. Bourhis, R. J. Gildea, J. A. K. Howard, H. Puschmann, J. Appl.
Crystallogr., 2009, 42, 339–341.
3 A. Białońska, R. Bronisz, K. Darowska, K. Drabent, J. Kusz, M. Siczek, M. Weselski, M.
Zubko, A. Ozarowski, Inorg. Chem., 2010, 49, 11267–11269.
4 J. S. Costa, S. Rodríguez-Jiménez, G. A. Craig, B. Barth, C. M. Beavers, S. J. Teat, G.
Aromí, J. Am. Chem. Soc., 2014, 136, 3869–3874.
5 P. Giannozzi, S. Baroni, N. Bonini, M. Calandra, R. Car, C. Cavazzoni, D. Ceresoli, G. L.
Chiarotti, M. Cococcioni, I. Dabo et al., J. Phys.: Condens. Matter, 2009, 21, 395502.
6 The Electronics Handbook, Jerry Whitaker, CRC Press 1996


![Bulk and Piecemeal Auction...And Moticam 2000 Digital Microscopy Camera] [(Qty-2) Signatone #750 probe Micropositioners] [Keithley 2440 5A SourceMeter ; Keithley 2000 Multimeter ;](https://img.pdfslide.us/doc/110x75/5fe198a654fd8c08180feac0/bulk-and-piecemeal-auction-and-moticam-2000-digital-microscopy-camera-qty-2.jpg)