Embed Size (px)
Citation preview

S-1
Deferitazole, a New Orally Active Iron Chelator
Supporting Information
Robert C. Hider,† Xiaole Kong,† Vincenzo Abbate,† Rachel Harland,‡ Kelly Conlon,‡ and Tim Luker‡
†Institute of Pharmaceutical Science, King’s College, London, UK
†Shire Pharmaceutical Development Ltd, Basingstoke, UK
1. Determination of Log D7.4 Values for Deferitazole Ligand and [(Deferitazole)2Fe]–
2. Fe/edta Competition Study
3. Determination of the Redox Potential for the Iron Complex of Deferitazole using Cyclic Voltammetry
4. Determination of Log K Values for Divalent Metals: Ca2+, Mg2+,Mn2+, Pb2+, Co2+, Ni2+, Cu2+ and Zn2+
5. MS Study of Deferitazole Divalent Metal Complexes
6. MALDI TOF MS of Zinc(II).Deferasirox Complex
Electronic Supplementary Material (ESI) for Dalton Transactions.This journal is © The Royal Society of Chemistry 2015

S-2
7. Determination of Log K Values for Trivalent Metals: Al3+ and La3+
1. Determination of Log D7.4 Values for Deferitazole Ligand and [(Deferitazole)2Fe]–
Table S1. Log D7.4 values for replicate measurements of deferitazole species
A0 A1 Vaqu Voct D7.4 log D Mean SDDeferitazole 0.354 22 0.287 61 1.000 6.000 0.039 –1.413 –1.29 ± 0.13 Deferitazole 0.354 22 0.293 56 1.000 4.000 0.052 –1.287 Deferitazole 0.354 22 0.310 81 1.000 2.000 0.070 –1.156
Deferitazole iron(III) complex 0.954 76 0.943 77 1.000 4.000 0.003 –2.536 –2.68 ± 0.17 Deferitazole iron(III) complex 0.954 76 0.946 08 1.000 4.000 0.002 –2.639 Deferitazole iron(III) complex 0.954 76 0.953 47 1.000 1.000 0.001 –2.869 Deferitazole iron(III) complex 0.953 47 0.901 08 1.000 6.000 0.010 –2.014
SD, standard deviation.
Octanol-saturated MOPS buffer Vaq mL containing deferitazole or deferitazole iron(III) complex was mixed with Voct mL water-saturated octanol. Solutions were shaken vigorously for 10 min at room temperature; the absorbance of the aqueous phase was then monitored at peak λmax. The following formula was adopted for log D calculation:
P = (A0 – A1)Vw/A1Vo
where A0 = initial absorbance of the octanol phase; A1 = absorbance at equilibrium of octanol phase after the addition of aqueous phase; Vw = volume of the octanol; and Vo = total volume of aqueous phase. For deferitazole n = 3 and for the deferitazole iron(III) complex n = 4.
S-3
2. Fe/edta Competition Study
Time(s)1000 2000 3000 4000 5000
Abs
orba
nce
(AU
)
0.25
0.26
0.27
0.28
0.29
0.3
0.31
0.32
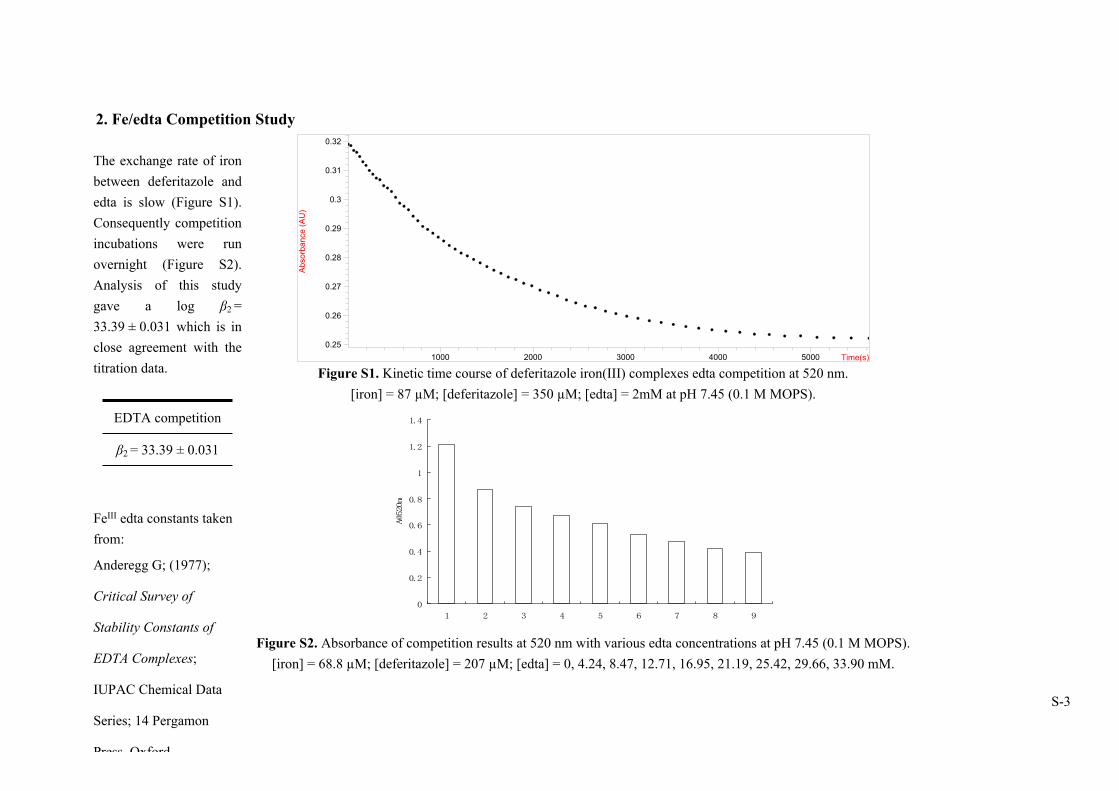
Figure S1. Kinetic time course of deferitazole iron(III) complexes edta competition at 520 nm. [iron] = 87 µM; [deferitazole] = 350 µM; [edta] = 2mM at pH 7.45 (0.1 M MOPS).
0
0.2
0.4
0.6
0.8
1
1.2
1.4
1 2 3 4 5 6 7 8 9
A@520nm
Figure S2. Absorbance of competition results at 520 nm with various edta concentrations at pH 7.45 (0.1 M MOPS). [iron] = 68.8 µM; [deferitazole] = 207 µM; [edta] = 0, 4.24, 8.47, 12.71, 16.95, 21.19, 25.42, 29.66, 33.90 mM.
The exchange rate of iron between deferitazole and edta is slow (Figure S1). Consequently competition incubations were run overnight (Figure S2). Analysis of this study gave a log β2 = 33.39 ± 0.031 which is in close agreement with the titration data.
EDTA competition
β2 = 33.39 ± 0.031
FeIII edta constants taken from:
Anderegg G; (1977);
Critical Survey of
Stability Constants of
EDTA Complexes;
IUPAC Chemical Data
Series; 14 Pergamon
Press, Oxford

S-4
3. Determination of the Redox Potential for the Iron Complex of Deferitazole using Cyclic Voltammetry
Cyclic voltammetry measurements were performed with a CS-120 device (Corrtest). A concentrated solution of deferitazole (5 mM) and iron(III) chloride (2 mM) at pH 7.42
(0.2 M MOPS buffer) were prepared. All measurements were conducted under nitrogen in a jacketed, one-compartment cell with a platinum disk working electrode
(geometric area: 0.07 cm2) (Corrtest), a platinum wire counter electrode (Corrtest) and an Ag/AgCl reference electrode. The working electrode surface was polished,
sonicated in water, and air-dried immediately before use. The sweep rate was 100 mV/s. Oxygen was removed from the electrolyte solution by bubbling nitrogen through the
solvent for several minutes prior to making the measurement.
Figure S3. Cyclic voltammetry of deferitazole.iron complexes.Cathodic and anodic peaks were located at –0.567 V and –0.472 V vs Ag/AgCl (n = 2). The redox potential of deferitazole iron complexes is calculated as E1/2 = (Ecathodic – Eanodic) = –519.5 mV, therefore a normal hydrogen electrode potential will be –322 mV at pH 7.45. Using these data together with the stability constant acquired from spectrophotometric titration, the affinity constant for iron(II) was calculated from Equation S1, which is

S-5
derived from the Nernst equation:
59.16(log β[Fe3+] – log β[Fe2+]) = E(Fe3+/Fe2+) – Ecomplex(Fe3+/Fe2+) Equation S1
where E(Fe3+/Fe2+) is the redox potential of the iron pair in the absence of the ligand and Ecomplex(Fe3+/Fe2+) is the redox potential in the presence of the ligand. The calculated value log β2 = 14.8 for iron(II).

S-6
4. Determination of log K Values for Divalent Metals: Ca2+, Mg2+,Mn2+, Pb2+, Co2+, Ni2+, Cu2+ and Zn2+.
Log K for Ca2+
Wavelength (nm)
Abs
orba
nce
250 300 350 400 450 500
0.10
0.30
0.50
0.70
0.90
Wavelength (nm)
Abs
orba
nce
250 300 350 400 450 5000.0
0.20
0.40
0.60
0.80
1.00
1.20
pH
Con
cent
ratio
n (M
)
4.0 5.0 6.0 7.0 8.0 9.0 10.0
1.0E-4
3.0E-4
5.0E-4
7.0E-4
9.0E-4
1 0 0
0 1 0
1 1 0
1 2 0
0 1 1
0 1 2
0 1 3
Figure S4 (A). Experiment with [deferitazole] = 1102.8 µM; [Ca2+] = 551.3 µM; ratio of L:M = 2; start in 20.315 mL 0.1 M potassium chloride at 25 °C.
pH from 3.572 to 10.836; total points 34. (B) Experiment with [deferitazole ] = 986 µM; [Ca2+] = 986.3 µM; ratio of L:M = 1; start in 20.277 mL 0.1 M potassium chloride
at 25 °C. pH from 3.598 to 10.918; total points 45. (C) Speciation plot corresponding to conditions in (A).
Comment: complexes start to form only at pH higher than 9.
Table S2. Calculated affinity constants for Zn(II).deferitazole complexes
For 1:1 experiment For 1:2 experiment
A B C(M)
(L)
(ML)
(ML2)
(LH)
(LH2)
(LH3)
B
C

S-7
Log K1 = 4.47 ± 0.018 Log β2 = 7.86 ± 0.044

S-8
Log K for Mg2+
Wavelength (nm)
Abs
orba
nce
370 390 410 430 450 470 4900.0
0.100
0.200
0.300
0.400
pH
Con
cent
ratio
n (M
)
2.5 3.5 4.5 5.5 6.5 7.5 8.5 9.5 10.5
1.0E-4
3.0E-4
5.0E-4
7.0E-4
9.0E-4
1 0 0
0 1 0
1 1 0
1 2 0
0 1 1
0 1 2
0 1 3
Figure S5 (A). Experiment with [deferitazole] = 1230.9 µM; [Mg2+] = 615.5 µM; ratio of L:M = 2; start in 20.414 mL 0.1 M potassium chloride at 25 °C.
pH from 2.053 to 11.003; total points 67. (B) Speciation plot corresponding to conditions in (A).
Table S3. Structures of Mg(II).deferitazole complexes and calculated affinity constants
ML2 ML Affinity (log)
MgN
SO
OO
OOO
O
NS
O
OO
OO
OO
Exact Mass: 818.22
MgNS
O
OO
OOO
O
Exact Mass: 421.10
K1 = 5.951 ± 0.056
β2 = 10.198 ± 0.066
A B
(M)
(L)
(ML)
(ML2)
(LH)
(LH2)
(LH3)
B
C

S-9

S-10
Log K for Mn2+
Wavelength (nm)
Abs
orba
nce
370 390 410 430 450 470 4900.0
0.050
0.100
0.150
0.200
0.250
0.300
0.350
0.400
pH
Con
cent
ratio
n (M
)
2.00 3.00 4.00 5.00 6.00 7.00 8.00 9.00
1.0E-4
3.0E-4
5.0E-4
7.0E-4
1 0 0
0 1 0
1 1 0
1 2 0
0 1 1
0 1 2
0 1 3
Figure S6 (A). Experiment with [deferitazole] = 1073.6 µM; [Mn2+] = 536.3 µM; ratio of L:M = 2, start in 20.771 mL 0.1 M potassium chloride at 25 °C.
pH from 1.878 to 10.802; total points 69. (B) Speciation plot corresponding to conditions in (A).
Table S4. Structures of Mn(II).deferitazole complexes and calculated affinity constants
ML2 ML Affinity (log)
MnN
SO
OO
OOO
O
NS
O
OO
OO
OO
Exact Mass: 849.18
MnNS
O
OO
OOO
O
Exact Mass: 452.06
K1 = 7.269 ± 0.057
β2 = 13.73 ± 0.089
A B (M)
(L)
(ML)
(ML2)
(LH)
(LH2)
(LH3)
B
C

S-11
Log K for Pb2+
Wavelength (nm)
Abs
orba
nce
250 300 350 400 450 500
0.25
0.75
1.25
1.75
2.25
pH
Con
cent
ratio
n (M
)
2.00 3.00 4.00 5.00 6.00 7.00 8.00 9.00
1.0E-4
3.0E-4
5.0E-4
7.0E-4
9.0E-4
1.1E-3 1 0 0
0 1 0
1 1 0
1 2 0
0 1 1
0 1 2
0 1 3
Figure S7 (A). Experiment with [deferitazole] = 1624.3 µM; [Pb2+] = 802.1 µM; ratio of L:M = 2; start in 20.174 mL 0.1 M potassium chloride at 25 °C.
pH from 1.913 to 9.855; total points 56. (B) Speciation plot corresponding to conditions in (A).
Comment: β2:K1 ratio is much lower than that observed with other metals.
A B(M)
(L)
(ML)
(ML2)
(LH)
(LH2)
(LH3)
B
C

S-12
Table S5. Structures of Pb(II).deferitazole complexes and calculated affinity constants
ML2 ML Affinity (log)
PbN
SO
OO
OOO
O
NS
O
OO
OO
OO
Exact Mass: 1002.22
PbNS
O
OO
OOO
O
Exact Mass: 605.10
K1= 9.318 ± 0.010
β2 = 13.551 ± 0.077

S-13
Log K for Co2+
Wavelength (nm)
Abs
orba
nce
390 410 430 450 470 4900.0
0.100
0.200
0.300
0.400
0.500
0.600
pH
Con
cent
ratio
n (M
)
2.50 3.50 4.50 5.50 6.50 7.50 8.50
2.0E-4
6.0E-4
1.0E-3
1.4E-3
1.8E-3 1 1 0
1 2 0
0 1 1
0 1 2
0 1 3
Figure S8 (A). Experiment with [deferitazole] = 2543.9 µM; [Co2+] = 1269.5 µM; ratio of L:M = 2; start in 21.814 mL 0.1 M potassium chloride at 25 °C.
pH from 2.040 to 9.053; total points 53. (B). Speciation plot corresponding to conditions in (A).
Table S6. Structures of Co(II).deferitazole complexes and calculated affinity constants
ML2 ML Affinity (log)
A B (ML)
(ML2)
(LH)
(LH2)
(LH3)
B
C

S-14
CoN
SO
OO
OOO
O
NS
O
OO
OO
OO
Exact Mass: 853.17
CoNS
O
OO
OOO
O
Exact Mass: 456.05
K1 = 9.27 ± 0.028
β2 = 17.12 ± 0.037
Log K for Ni2+
Wavelength (nm)
Abs
orba
nce
250 300 350 400 450 500
0.10
0.30
0.50
0.70
0.90
1.10
1.30
pH
Con
cent
ratio
n (M
)2.50 3.50 4.50 5.50 6.50 7.50 8.50
2.0E-4
6.0E-4
1.0E-3
1.4E-3
1.8E-3 1 1 0
1 2 0
0 1 1
0 1 2
0 1 3
Figure S9 (A). Experiment with [deferitazole] = 1018.2 µM; [Ni2+] = 495.1 µM; ratio of L:M = 2.1; start in 20.690 mL 0.1 M potassium chloride at 25 °C.
pH from 2.055 to 10.895; total points 72. (B) Speciation plot corresponding to conditions in (A).
Table S7. Structures of Ni(II).deferitazole complexes and calculated affinity constants
A B(ML)
(ML2)
(LH)
(LH2)
(LH3)
B
C
S-15
ML2 ML Affinity (log)
NiN
SO
OO
OOO
O
NS
O
OO
OO
OO
Exact Mass: 852.17
Ni NS
O
OO
OOO
O
Exact Mass: 455.05
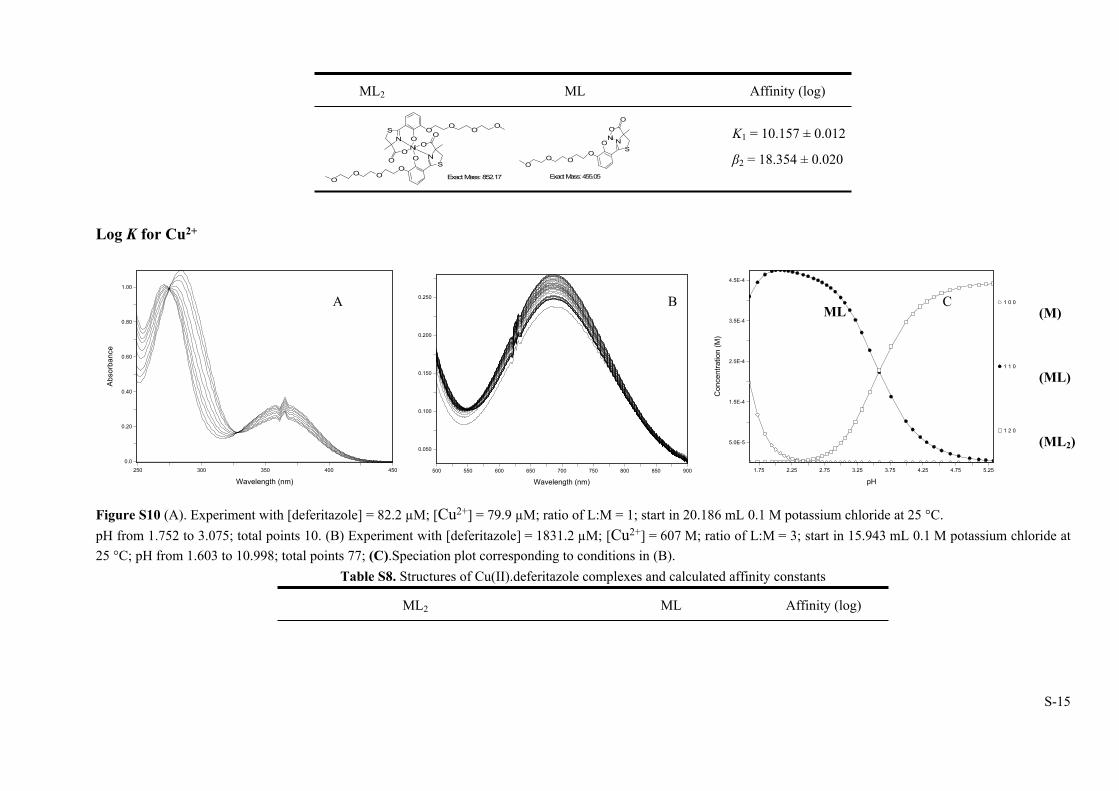
K1 = 10.157 ± 0.012
β2 = 18.354 ± 0.020
Log K for Cu2+
Wavelength (nm)
Abs
orba
nce
250 300 350 400 4500.0
0.20
0.40
0.60
0.80
1.00
Wavelength (nm)
Abs
orba
nce
500 550 600 650 700 750 800 850 900
0.050
0.100
0.150
0.200
0.250
pH
Con
cent
ratio
n (M
)
1.75 2.25 2.75 3.25 3.75 4.25 4.75 5.25
5.0E-5
1.5E-4
2.5E-4
3.5E-4
4.5E-4
1 0 0
1 1 0
1 2 0
Figure S10 (A). Experiment with [deferitazole] = 82.2 µM; [Cu2+] = 79.9 µM; ratio of L:M = 1; start in 20.186 mL 0.1 M potassium chloride at 25 °C. pH from 1.752 to 3.075; total points 10. (B) Experiment with [deferitazole] = 1831.2 µM; [Cu2+] = 607 M; ratio of L:M = 3; start in 15.943 mL 0.1 M potassium chloride at 25 °C; pH from 1.603 to 10.998; total points 77; (C).Speciation plot corresponding to conditions in (B).
Table S8. Structures of Cu(II).deferitazole complexes and calculated affinity constants
ML2 ML Affinity (log)
A B CML
B
C
(M)
(ML)
(ML2)
B
C

S-16
CuN
SO
OO
OOO
O
NS
O
OO
OO
OO
Exact Mass: 857.2
Cu NS
O
OO
OOO
OExact Mass: 460
K1 = 14.799 ± 0.037
β2 = 25.5 ± 0.062

S-17
Log K for Zn2+
Wavelength (nm)
Abs
orba
nce
250 300 350 400 450
0.0
0.50
1.00
1.50
2.00
pH
Con
cent
ratio
n (M
)
2.25 2.75 3.25 3.75 4.25 4.75 5.25 5.75
1.0E-4
3.0E-4
5.0E-4
7.0E-4
9.0E-4
1.1E-3
1 0 0
0 1 0
1 1 0
1 2 0
0 1 1
0 1 2
0 1 3
Figure S11 (A). Experiment with [deferitazole] = 1447.4 µM; [Zn2+] = 723.6 µM; ratio of L:M = 2; start in 21.133 mL 0.1 M potassium chloride at 25 °C.
pH from 2.071 to 10.213; total points 50. (B) Speciation plot corresponding to conditions in (A)
Table S9. Structures of Zn(II).deferitazole complexes and calculated affinity constants
ML2 ML Affinity (log)
ZnN
SO
OO
OOO
O
NS
O
OO
OO
OO
Exact Mass: 858.17
ZnNS
O
OO
OOO
O
Exact Mass: 461.05
K1 = 9.593 ± 0.045
β2 = 18.574 ± 0.079
A B
(M)
(L)
(ML)
(ML2)
(LH)
(LH2)
(LH3)
B
C

S-18
5. MS Study of Deferitazole Divalent Metal Complexes
We investigated both positive and negative mode ESI MS for Ca2+, Mg2+,Mn2+, Pb2+, Co2+, Ni2+, Cu2+ and Zn2+. and in all cases we were able to identify the presence of both
the ML and ML2 species. Because Ca2+ has an extremely low affinity for deferitazole, much higher concentrations of the ligand would be required than for the other studies.
This was not undertaken to avoid potential damage to the instrument.
With Mn2+ we detected only peaks corresponding to Mn3+; this was caused by the oxidation of Mn2+ during the MS ionization process.
Generally in positive mode we identified proton adducts of ML that have one positive charge.
Samples prepared for MS were: MeOH 400 µL + deferitazole (380 µM in DMSO) 38 µL + corresponding metal chloride salt solution in the molar ratio M:L = 1:2; 200 µL
were taken and added to 30 µL 0.1 M aqueous ammonia to raise the pH.
Table S10. Summary of MS data for deferitazole–metal complexes
Mg2+ Mn2+ Pb2+ Co2+ Ni2+ Cu2+ Zn2+
MS studyML ML2 ML ML2 ML ML2 ML ML2 ML ML2 ML ML2 ML ML2
Theory 421 818.2 452 849.2 605.1 1002.2 456.0 853.2 455.0 852.2 460 857.2 461.05 858.17
Observed 422.1(+)820.9(+)796.3(–)
452.9(+)850.9(+)848.9(–)
606(+) 1004.8(+) 456.9(+)852.0(+)854.0(–)
456.1(+)854.9(+)853.1(–)
459.9(+) 857.9(–) 462(+) 858.8(–)
M NS
O
OO
OOO
O
MN
SO
OO
OOO
O
NS
O
OO
OO
OO

S-19
6. MALDI TOF MS of Zinc(II).Deferasirox Complex
Figure S12. Zinc(II).deferasirox complex (1:1, 220 µM pH 7.4) by MALDI TOF MS withα-cyano-4-hydroxycinnamic acid as matrices in linear mode.
7000
3500
1700
Bruker Daltonics Autoflex automated high-throughput MALDI
TOF MS system with a 337 nm nitrogen laser was used. α-cyano-
4-hydroxycinnamic acid MALDI matrix (20 mg/mL) (0.3 µL) was
added to zinc(II).deferasirox complex (1:1 220 µM pH 7.4) and the
mixture was allowed to dry in air. Laser energy was set to
threshold power; only a single MALDI spectrum resulting from
one laser shot was acquired at each location. In total, the MALDI
spectra from 30 laser shots were accumulated.
Cur
rent
m/z

S-20
7. Determination of log K Values for Trivalent Metals: Al3+ and La3+
Log K for Al3+
Wavelength (nm)
Abs
orba
nce
400 420 440 460 480 5000.0
0.20
0.40
0.60
0.80
1.00
1.20
1.40
pH
Con
cent
ratio
n (M
)
2.00 2.50 3.00 3.50 4.00 4.50 5.00
1.0E-5
3.0E-5
5.0E-5
7.0E-5
1 1 0
1 2 0
0 1 1
0 1 2
Figure S13 (A). Experiment with [L] = 180.1 µM [Al3+] = 87.9 M; ratio of L:M = 2; start in 20.153 mL 0.1 M potassium chloride at 25 °C.
pH from 1.910 to 10.956; total points 57. (B) Speciation plot corresponding to conditions in (A).
A B(ML)
(ML2)
(LH)
(LH2)
B
C

S-21
Table S11. Structures of Al(III).deferitazole complexes, MS data and calculated affinity constants
ML2 ML Mass spectrometry Affinity (log)
AlN
SO
OO
OOO
O
NS
O
OO
OO
OO
Exact Mass: 821.22
Al NS
O
OO
OOO
O
Exact Mass: 424.10
Theory: 424, 821
Observed: 424.1(+); 823.1(+); 821.1(–
)
K1 = 14.587 ± 0.041
β2 = 26.678 ± 0.080
S-22
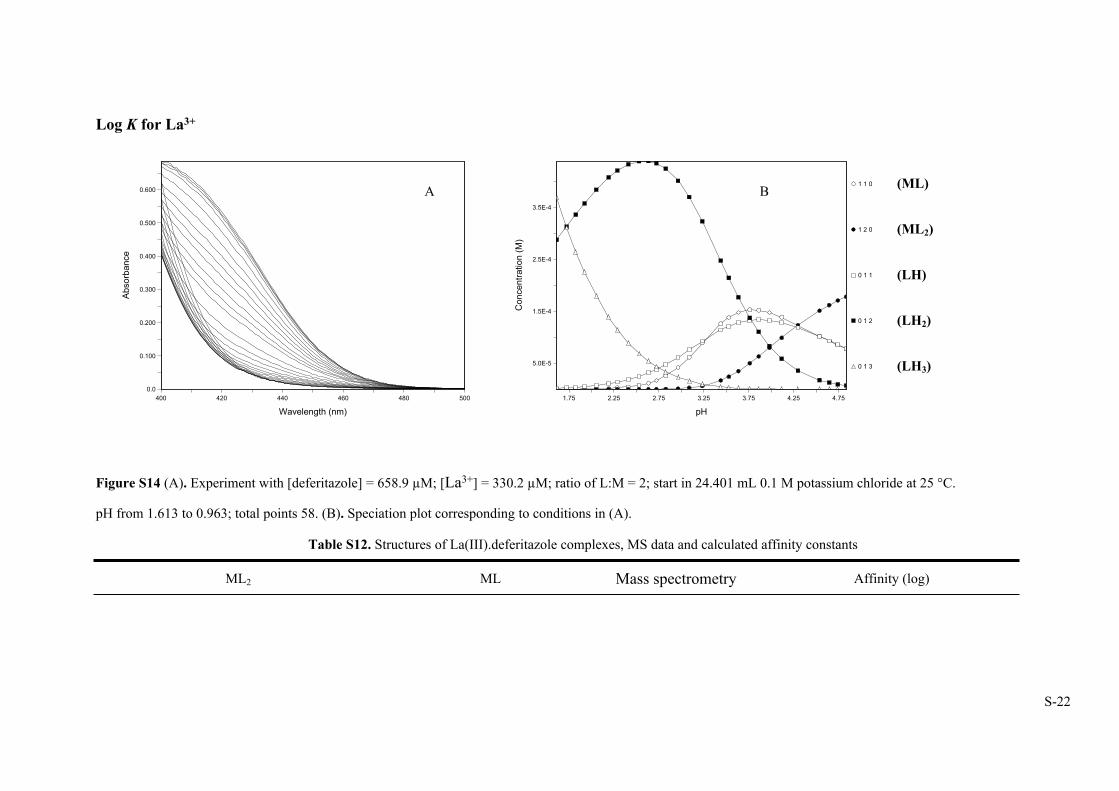
Log K for La3+
Wavelength (nm)
Abs
orba
nce
400 420 440 460 480 5000.0
0.100
0.200
0.300
0.400
0.500
0.600
pH
Con
cent
ratio
n (M
)
1.75 2.25 2.75 3.25 3.75 4.25 4.75
5.0E-5
1.5E-4
2.5E-4
3.5E-4
1 1 0
1 2 0
0 1 1
0 1 2
0 1 3
Figure S14 (A). Experiment with [deferitazole] = 658.9 µM; [La3+] = 330.2 µM; ratio of L:M = 2; start in 24.401 mL 0.1 M potassium chloride at 25 °C.
pH from 1.613 to 0.963; total points 58. (B). Speciation plot corresponding to conditions in (A).
Table S12. Structures of La(III).deferitazole complexes, MS data and calculated affinity constants
ML2 ML Mass spectrometry Affinity (log)
A B (ML)
(ML2)
(LH)
(LH2)
(LH3)
B
C

S-23
LaN
SO
OO
OOO
O
NS
O
OO
OO
OO
Exact Mass: 933.15
La NS
O
OO
OOO
O
Exact Mass: 536.03
Theory: 536; 933
Observed: 935.0(+); 933.1(–)
(ML not observed)
K1 = 11.221 ± 0.063
β2 = 21.550 ± 0.074