Embed Size (px)
Citation preview
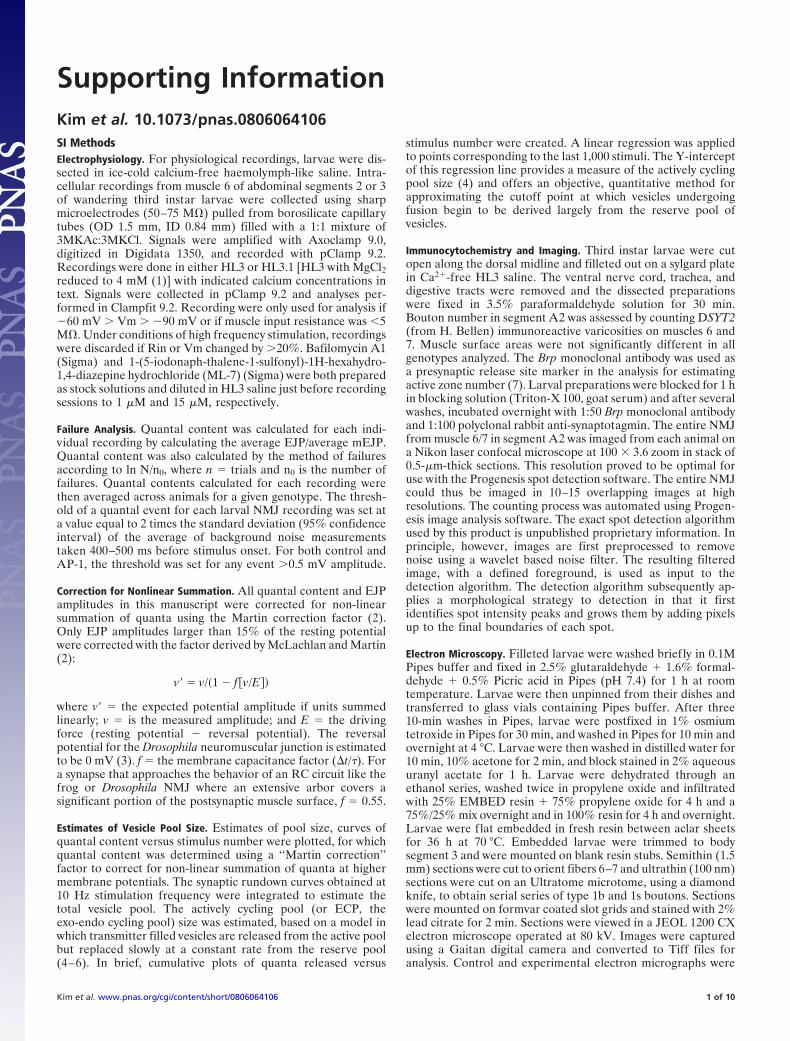
Supporting InformationKim et al. 10.1073/pnas.0806064106SI MethodsElectrophysiology. For physiological recordings, larvae were dis-sected in ice-cold calcium-free haemolymph-like saline. Intra-cellular recordings from muscle 6 of abdominal segments 2 or 3of wandering third instar larvae were collected using sharpmicroelectrodes (50–75 M�) pulled from borosilicate capillarytubes (OD 1.5 mm, ID 0.84 mm) filled with a 1:1 mixture of3MKAc:3MKCl. Signals were amplified with Axoclamp 9.0,digitized in Digidata 1350, and recorded with pClamp 9.2.Recordings were done in either HL3 or HL3.1 [HL3 with MgCl2reduced to 4 mM (1)] with indicated calcium concentrations intext. Signals were collected in pClamp 9.2 and analyses per-formed in Clampfit 9.2. Recording were only used for analysis if�60 mV � Vm � �90 mV or if muscle input resistance was �5M�. Under conditions of high frequency stimulation, recordingswere discarded if Rin or Vm changed by �20%. Bafilomycin A1(Sigma) and 1-(5-iodonaph-thalene-1-sulfonyl)-1H-hexahydro-1,4-diazepine hydrochloride (ML-7) (Sigma) were both preparedas stock solutions and diluted in HL3 saline just before recordingsessions to 1 �M and 15 �M, respectively.
Failure Analysis. Quantal content was calculated for each indi-vidual recording by calculating the average EJP/average mEJP.Quantal content was also calculated by the method of failuresaccording to ln N/n0, where n � trials and n0 is the number offailures. Quantal contents calculated for each recording werethen averaged across animals for a given genotype. The thresh-old of a quantal event for each larval NMJ recording was set ata value equal to 2 times the standard deviation (95% confidenceinterval) of the average of background noise measurementstaken 400–500 ms before stimulus onset. For both control andAP-1, the threshold was set for any event �0.5 mV amplitude.
Correction for Nonlinear Summation. All quantal content and EJPamplitudes in this manuscript were corrected for non-linearsummation of quanta using the Martin correction factor (2).Only EJP amplitudes larger than 15% of the resting potentialwere corrected with the factor derived by McLachlan and Martin(2):
v� � v/�1 � f�v/E
where v� � the expected potential amplitude if units summedlinearly; v � is the measured amplitude; and E � the drivingforce (resting potential � reversal potential). The reversalpotential for the Drosophila neuromuscular junction is estimatedto be 0 mV (3). f � the membrane capacitance factor (�t/�). Fora synapse that approaches the behavior of an RC circuit like thefrog or Drosophila NMJ where an extensive arbor covers asignificant portion of the postsynaptic muscle surface, f � 0.55.
Estimates of Vesicle Pool Size. Estimates of pool size, curves ofquantal content versus stimulus number were plotted, for whichquantal content was determined using a ‘‘Martin correction’’factor to correct for non-linear summation of quanta at highermembrane potentials. The synaptic rundown curves obtained at10 Hz stimulation frequency were integrated to estimate thetotal vesicle pool. The actively cycling pool (or ECP, theexo-endo cycling pool) size was estimated, based on a model inwhich transmitter filled vesicles are released from the active poolbut replaced slowly at a constant rate from the reserve pool(4–6). In brief, cumulative plots of quanta released versus
stimulus number were created. A linear regression was appliedto points corresponding to the last 1,000 stimuli. The Y-interceptof this regression line provides a measure of the actively cyclingpool size (4) and offers an objective, quantitative method forapproximating the cutoff point at which vesicles undergoingfusion begin to be derived largely from the reserve pool ofvesicles.
Immunocytochemistry and Imaging. Third instar larvae were cutopen along the dorsal midline and filleted out on a sylgard platein Ca2�-free HL3 saline. The ventral nerve cord, trachea, anddigestive tracts were removed and the dissected preparationswere fixed in 3.5% paraformaldehyde solution for 30 min.Bouton number in segment A2 was assessed by counting DSYT2(from H. Bellen) immunoreactive varicosities on muscles 6 and7. Muscle surface areas were not significantly different in allgenotypes analyzed. The Brp monoclonal antibody was used asa presynaptic release site marker in the analysis for estimatingactive zone number (7). Larval preparations were blocked for 1 hin blocking solution (Triton-X 100, goat serum) and after severalwashes, incubated overnight with 1:50 Brp monoclonal antibodyand 1:100 polyclonal rabbit anti-synaptotagmin. The entire NMJfrom muscle 6/7 in segment A2 was imaged from each animal ona Nikon laser confocal microscope at 100 3.6 zoom in stack of0.5-�m-thick sections. This resolution proved to be optimal foruse with the Progenesis spot detection software. The entire NMJcould thus be imaged in 10–15 overlapping images at highresolutions. The counting process was automated using Progen-esis image analysis software. The exact spot detection algorithmused by this product is unpublished proprietary information. Inprinciple, however, images are first preprocessed to removenoise using a wavelet based noise filter. The resulting filteredimage, with a defined foreground, is used as input to thedetection algorithm. The detection algorithm subsequently ap-plies a morphological strategy to detection in that it firstidentifies spot intensity peaks and grows them by adding pixelsup to the final boundaries of each spot.
Electron Microscopy. Filleted larvae were washed briefly in 0.1MPipes buffer and fixed in 2.5% glutaraldehyde � 1.6% formal-dehyde � 0.5% Picric acid in Pipes (pH 7.4) for 1 h at roomtemperature. Larvae were then unpinned from their dishes andtransferred to glass vials containing Pipes buffer. After three10-min washes in Pipes, larvae were postfixed in 1% osmiumtetroxide in Pipes for 30 min, and washed in Pipes for 10 min andovernight at 4 °C. Larvae were then washed in distilled water for10 min, 10% acetone for 2 min, and block stained in 2% aqueousuranyl acetate for 1 h. Larvae were dehydrated through anethanol series, washed twice in propylene oxide and infiltratedwith 25% EMBED resin � 75% propylene oxide for 4 h and a75%/25% mix overnight and in 100% resin for 4 h and overnight.Larvae were flat embedded in fresh resin between aclar sheetsfor 36 h at 70 °C. Embedded larvae were trimmed to bodysegment 3 and were mounted on blank resin stubs. Semithin (1.5mm) sections were cut to orient fibers 6–7 and ultrathin (100 nm)sections were cut on an Ultratome microtome, using a diamondknife, to obtain serial series of type 1b and 1s boutons. Sectionswere mounted on formvar coated slot grids and stained with 2%lead citrate for 2 min. Sections were viewed in a JEOL 1200 CXelectron microscope operated at 80 kV. Images were capturedusing a Gaitan digital camera and converted to Tiff files foranalysis. Control and experimental electron micrographs were
Kim et al. www.pnas.org/cgi/content/short/0806064106 1 of 10
coded and randomized by a third party for blind analysis. Onlythose cross sections with at least one clearly defined T-bar wereselected for analysis. Lengths of electron dense regions and areasof presynaptic terminals were measured with Image J software.
Calcium Imaging. All Ca2� imaging experiments were conductedat room temperature (20–22 °C), in 1 mM Ca2 HL6 solution (8).Wandering third instar larvae were dissected in Schneider’sinsect medium, then thoroughly rinsed with HL6 solution con-taining 1 mM Ca2� and 7 mM glutamate. The preparation wasthen incubated in the latter solution for at least 10 min to reducemuscle contractility before image acquisition. The segmentalnerve innervating either A3 or A4 was gently sucked into a glasscapillary electrode (internal diameter, �10 mm) for nervestimulation. Stimulus pulses (0.3-ms duration) were generated bya Master-8 stimulator (A.M.P.I.). The applied voltage was 20%larger than that required to recruit both 1b and 1s neuronsinnervating muscles 6 and 7. Ca2� signals were acquired fromnerve terminals innervating muscle 6/7. Preparations were stim-ulated at 40 Hz for 2s.
Preparations were viewed using an Olympus BX51WI uprightmicroscope using a 60 /0.9 NA water-immersion objective(Olympus LUMPlanB FL). A Polychrome V monochromator(T.I.L.L. Photonics) was used to excite preps at a wavelength of488 nm. Emission was monitored through a low-pass filter.Images are acquired using a 12-bit Andor DV-885 EMCCDcamera (ANDOR Technology, Ireland), whose EMCCD chip iscooled to �63 °C. The camera’s image acquisition was controlledby TILLvisION 4.0 software (T.I.L.L. Photonics). Individualimage sizes of 512 512 pixels (2 2 pixel binning) are acquiredat a rate of 10 Hz, using 50-ms exposure times. Five images arecollected before stimulation to calculate the background inten-sity. Images were also collected for 1s and 2 s before and afterstimulation, respectively.
Images were analyzed using ImageJ using a custom-writtenmacro. Image pixel intensity values are corrected for photo-bleaching and normalized to the baseline. �F is calculated usingthe equation:
�F � 100 � �F � Fo /Fo
Where, Fo is the base intensity of fluorescence and F is thechange in fluorescence intensity during and after 40Hz stimu-lation. The rising phases of the GCaMP signal was fitted with a
sigmoidal function. Fitted curve functions were solved usingMathematica software for time points during the rising phase,corresponding to 10% and 90% of peak fluorescence, forcalculating rise times.
FM1–43 Imaging. Normal saline composition was as follows: 130mM NaCl, 36 mM sucrose; 5 mM KCl, 2 mM MgCl2, 2 mMCaCl2, and 5 mM Hepes. Glutamate (8 mM) was added to thesolution to prevent muscle contraction at high frequency stim-ulation. The pH of the solution was adjusted to 7.2. ForCa2�-free saline, CaCl2 was replaced by 2 mM MgCl2 and 0.5mM EGTA was added in normal saline. The high K� containingsolution contained 90 mM KCl in which NaCl was reduced toequivalent amount. The nerve innervating muscle 6/7 of A2 orA3 hemisegment was stimulated (3-ms pulse duration, 6 V) innormal saline containing glutamate (8 mM) and FM1–43 (5 �M)at 3 Hz or 30 Hz for 7 min using a glass suction electrode. Thepreparations were washed for 15 min in calcium-free saline andthen imaged. For unloading FM1–43 nerves were restimulatedin high potassium solution for 5 min or at 3 Hz for 7 min innormal saline without FM1–43. FM1–43 loaded and unloadedpreparations were visualized and imaged on an upright fluores-cence microscope (Axioscope 2 FS Plus, Zeiss) equipped withcooled charged- couple device array (Cascade:512B camera;Roper scientific) and 40 , 0.80 NA water-immersion objectivelens (Carl Zeiss). Samples were excited at 480 nm using a 175Watt xenon arc lamp (Lambda DG-4, Sutter Instruments) andthe wavelength between 506 and 565 nm was collected (filter set41001, chroma technology). Images were acquired, stored andprocessed using Metamorph software (Meta Imaging seriessoftware, Molecular Devices). The average fluorescence inten-sity around individual bouton was calculated by subtracting thebackground fluorescence of a region close to the bouton fromthe total average fluorescence around the bouton. Four to 10type I boutons were selected for analysis in each preparation.
Drosophila Strains and Genetic Controls. The following strains wereused in our analyses: control (Oregon R; D. Brower); Gal4-responsive UAS-fos, UAS-jun, transgenes (M. Bienz); neuralGal4 line, elavC155 (C. Goodman); UAS-GCaMP 1.6 (D.Reiff).Experimental female larvae were selected from crosses betweenvirgin females homozygous for UAS transgenes and maleshomozygous for the Gal4 driver; controls consisted of the Gal4driver outcrossed to the Oregon-R line.
1. Feng Y, Ueda A, Wu CF (2004) A modified minimal hemolymph-like solution, HL3.1, forphysiological recordings at the neuromuscular junctions of normal and mutant Dro-sophila larvae. J Neurogenet 18:377–402.
2. McLachlan EM, Martin AR (1981) Non-linear summation of end-plate potentials in thefrog and mouse. J Physiol 311:307–24.
3. Jan LY, Jan YN (1976) Properties of the larval neuromuscular junction in Drosophilamelanogaster. J Physiol 262:189–214.
4. Schneggenburger R, Meyer AC, Neher E (1999) Released fraction and total size of apool of immediately available transmitter quanta at a calyx synapse. Neuron 23:399–409.
5. Kuromi H, Kidokoro Y (2000) Tetanic stimulation recruits vesicles from reserve pool viaa cAMP-mediated process in Drosophila synapses. Neuron 27:133–43.
6. Delgado R, et al. (2000) Size of vesicle pools, rates of mobilization, and recycling atneuromuscular synapses of a Drosophila mutant, shibire. Neuron 28:941–53.
7. Kittel RJ, et al. (2006) Bruchpilot promotes active zone assembly, Ca2� channelclustering, and vesicle release. Science 312:1051–4.
8. Macleod GT, et al. (2002) Fast calcium signals in Drosophila motor neuron terminals.J Neurophysiol 88:2659–63.
9. Stewart BA, et al. (1996) Homeostasis of synaptic transmission in Drosophila withgenetically altered nerve terminal morphology. J Neurosci 16:3877–86.
Kim et al. www.pnas.org/cgi/content/short/0806064106 2 of 10
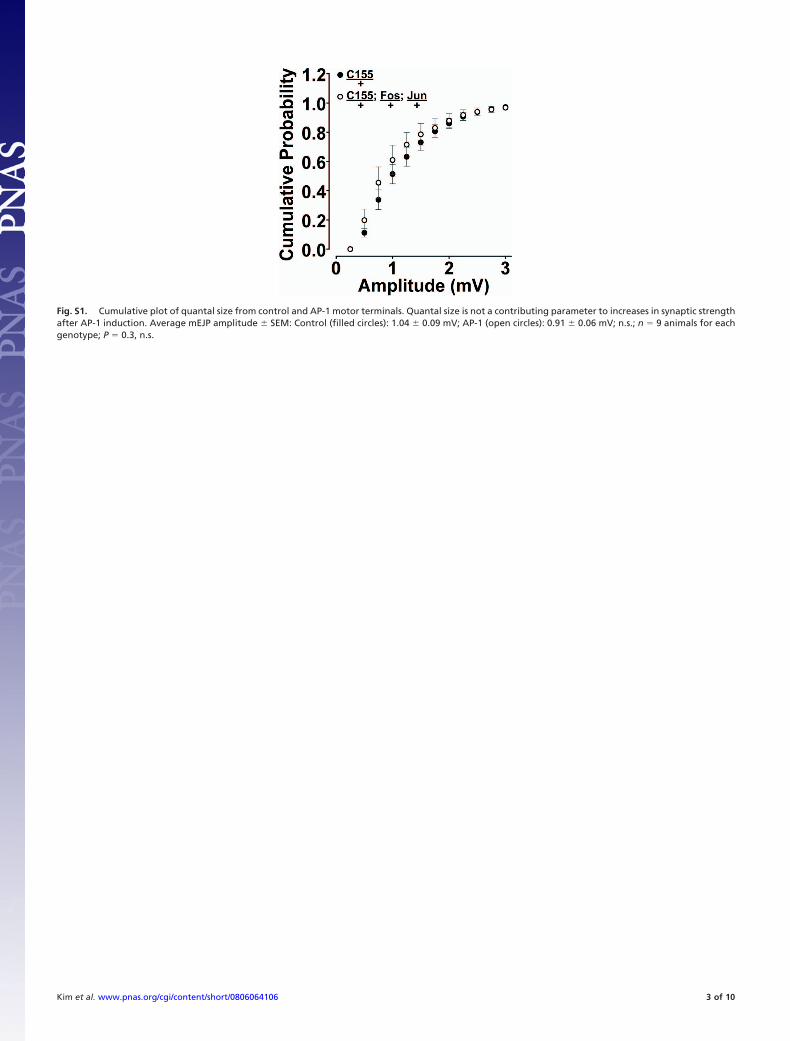
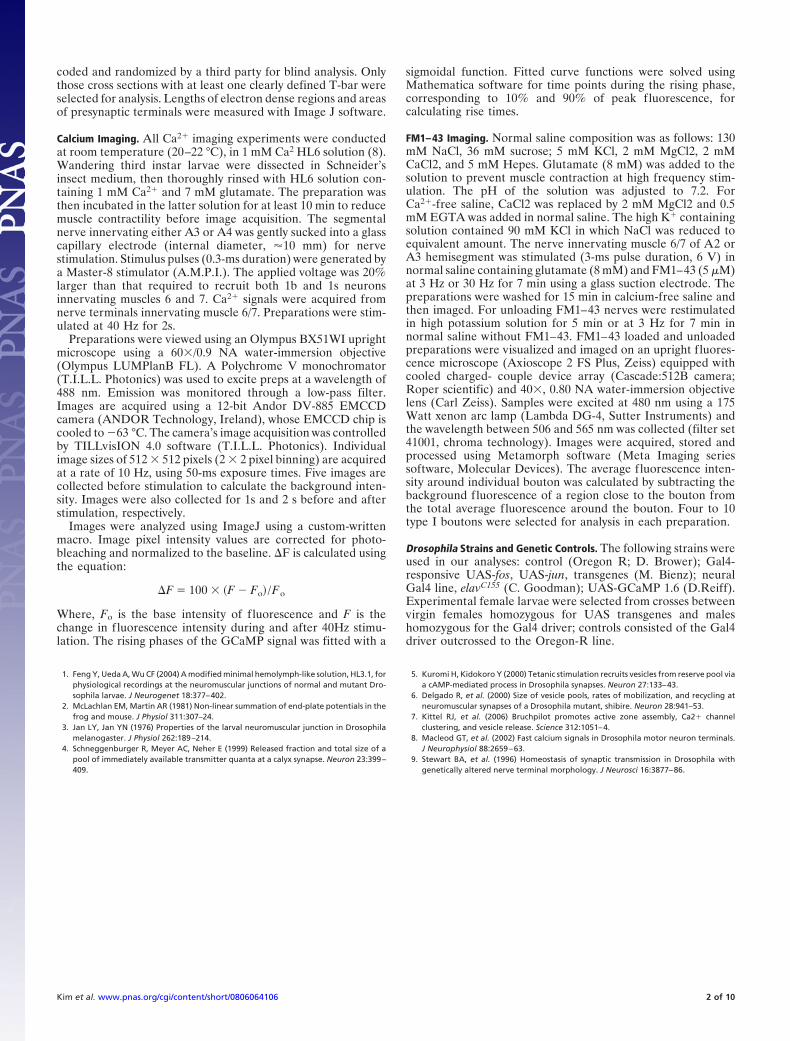
Fig. S1. Cumulative plot of quantal size from control and AP-1 motor terminals. Quantal size is not a contributing parameter to increases in synaptic strengthafter AP-1 induction. Average mEJP amplitude � SEM: Control (filled circles): 1.04 � 0.09 mV; AP-1 (open circles): 0.91 � 0.06 mV; n.s.; n � 9 animals for eachgenotype; P � 0.3, n.s.
Kim et al. www.pnas.org/cgi/content/short/0806064106 3 of 10
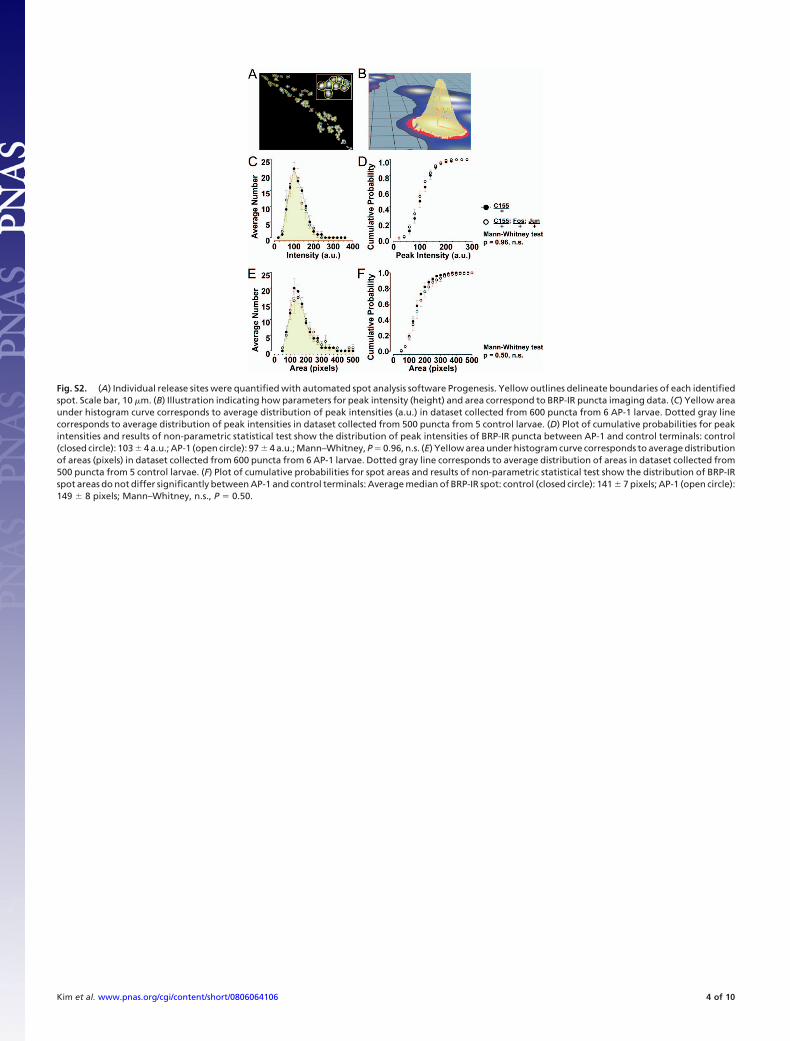
Fig. S2. (A) Individual release sites were quantified with automated spot analysis software Progenesis. Yellow outlines delineate boundaries of each identifiedspot. Scale bar, 10 �m. (B) Illustration indicating how parameters for peak intensity (height) and area correspond to BRP-IR puncta imaging data. (C) Yellow areaunder histogram curve corresponds to average distribution of peak intensities (a.u.) in dataset collected from 600 puncta from 6 AP-1 larvae. Dotted gray linecorresponds to average distribution of peak intensities in dataset collected from 500 puncta from 5 control larvae. (D) Plot of cumulative probabilities for peakintensities and results of non-parametric statistical test show the distribution of peak intensities of BRP-IR puncta between AP-1 and control terminals: control(closed circle): 103 � 4 a.u.; AP-1 (open circle): 97 � 4 a.u.; Mann–Whitney, P � 0.96, n.s. (E) Yellow area under histogram curve corresponds to average distributionof areas (pixels) in dataset collected from 600 puncta from 6 AP-1 larvae. Dotted gray line corresponds to average distribution of areas in dataset collected from500 puncta from 5 control larvae. (F) Plot of cumulative probabilities for spot areas and results of non-parametric statistical test show the distribution of BRP-IRspot areas do not differ significantly between AP-1 and control terminals: Average median of BRP-IR spot: control (closed circle): 141 � 7 pixels; AP-1 (open circle):149 � 8 pixels; Mann–Whitney, n.s., P � 0.50.
Kim et al. www.pnas.org/cgi/content/short/0806064106 4 of 10
Fig. S3. (A) Lengths of electron dense membrane were measured from electron micrographs of synapses in the larval NMJ. (B) Average synapse size (i.e., thelength of electron-dense membrane accompanying each T-bar) is not significantly different between AP-1 and control motor synapses: control: 873 � 22 nm,n � 90 synapses from 4 larvae; AP-1: 843 � 24 nm, n � 120 synapses from 4 larvae).
Kim et al. www.pnas.org/cgi/content/short/0806064106 5 of 10
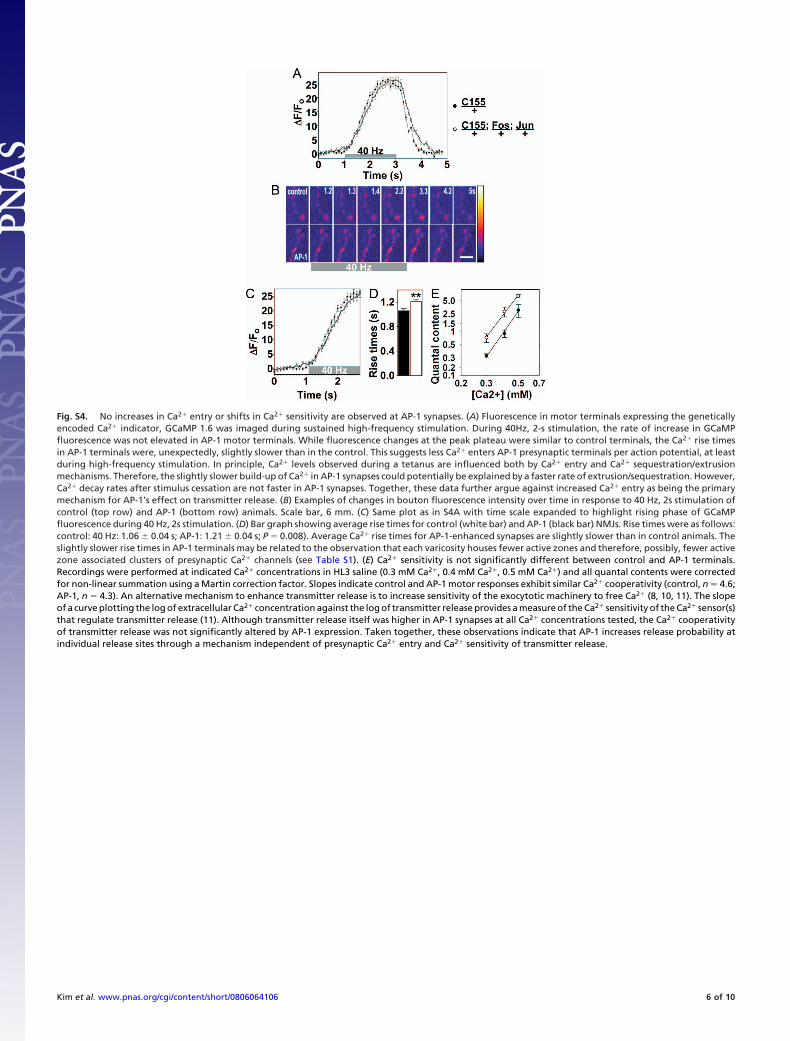
Fig. S4. No increases in Ca2� entry or shifts in Ca2� sensitivity are observed at AP-1 synapses. (A) Fluorescence in motor terminals expressing the geneticallyencoded Ca2� indicator, GCaMP 1.6 was imaged during sustained high-frequency stimulation. During 40Hz, 2-s stimulation, the rate of increase in GCaMPfluorescence was not elevated in AP-1 motor terminals. While fluorescence changes at the peak plateau were similar to control terminals, the Ca2� rise timesin AP-1 terminals were, unexpectedly, slightly slower than in the control. This suggests less Ca2� enters AP-1 presynaptic terminals per action potential, at leastduring high-frequency stimulation. In principle, Ca2� levels observed during a tetanus are influenced both by Ca2� entry and Ca2� sequestration/extrusionmechanisms. Therefore, the slightly slower build-up of Ca2� in AP-1 synapses could potentially be explained by a faster rate of extrusion/sequestration. However,Ca2� decay rates after stimulus cessation are not faster in AP-1 synapses. Together, these data further argue against increased Ca2� entry as being the primarymechanism for AP-1’s effect on transmitter release. (B) Examples of changes in bouton fluorescence intensity over time in response to 40 Hz, 2s stimulation ofcontrol (top row) and AP-1 (bottom row) animals. Scale bar, 6 mm. (C) Same plot as in S4A with time scale expanded to highlight rising phase of GCaMPfluorescence during 40 Hz, 2s stimulation. (D) Bar graph showing average rise times for control (white bar) and AP-1 (black bar) NMJs. Rise times were as follows:control: 40 Hz: 1.06 � 0.04 s; AP-1: 1.21 � 0.04 s; P � 0.008). Average Ca2� rise times for AP-1-enhanced synapses are slightly slower than in control animals. Theslightly slower rise times in AP-1 terminals may be related to the observation that each varicosity houses fewer active zones and therefore, possibly, fewer activezone associated clusters of presynaptic Ca2� channels (see Table S1). (E) Ca2� sensitivity is not significantly different between control and AP-1 terminals.Recordings were performed at indicated Ca2� concentrations in HL3 saline (0.3 mM Ca2�, 0.4 mM Ca2�, 0.5 mM Ca2�) and all quantal contents were correctedfor non-linear summation using a Martin correction factor. Slopes indicate control and AP-1 motor responses exhibit similar Ca2� cooperativity (control, n � 4.6;AP-1, n � 4.3). An alternative mechanism to enhance transmitter release is to increase sensitivity of the exocytotic machinery to free Ca2� (8, 10, 11). The slopeof a curve plotting the log of extracellular Ca2� concentration against the log of transmitter release provides a measure of the Ca2� sensitivity of the Ca2� sensor(s)that regulate transmitter release (11). Although transmitter release itself was higher in AP-1 synapses at all Ca2� concentrations tested, the Ca2� cooperativityof transmitter release was not significantly altered by AP-1 expression. Taken together, these observations indicate that AP-1 increases release probability atindividual release sites through a mechanism independent of presynaptic Ca2� entry and Ca2� sensitivity of transmitter release.
Kim et al. www.pnas.org/cgi/content/short/0806064106 6 of 10
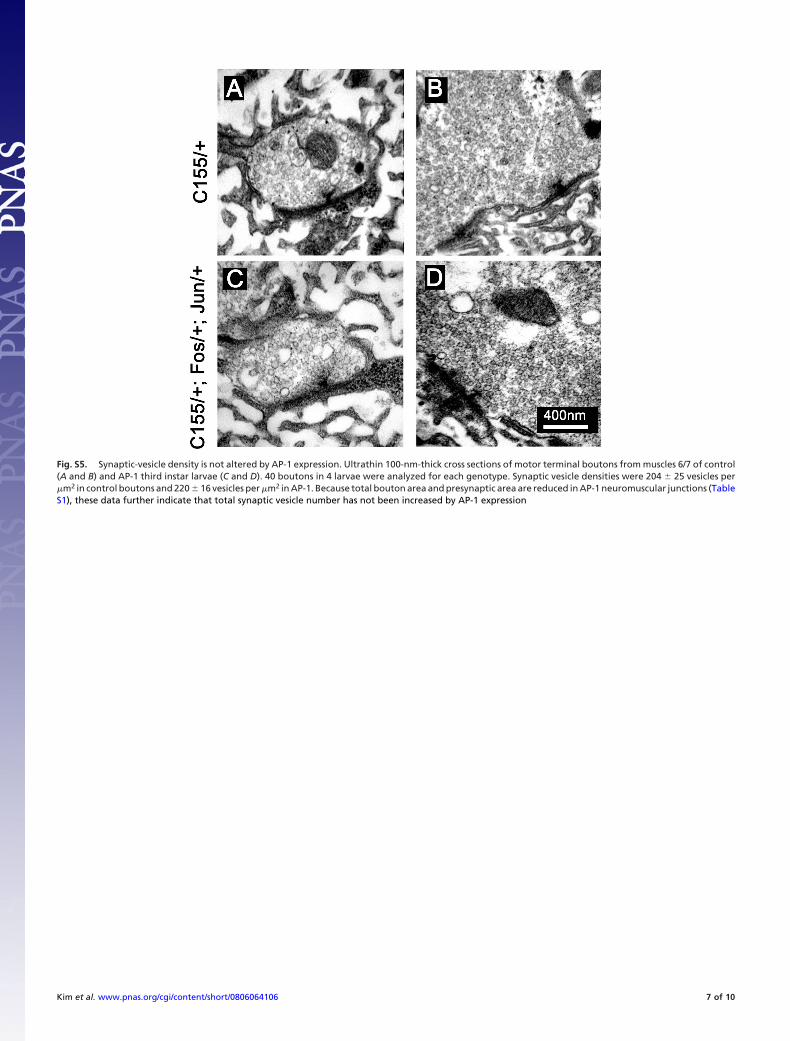
Fig. S5. Synaptic-vesicle density is not altered by AP-1 expression. Ultrathin 100-nm-thick cross sections of motor terminal boutons from muscles 6/7 of control(A and B) and AP-1 third instar larvae (C and D). 40 boutons in 4 larvae were analyzed for each genotype. Synaptic vesicle densities were 204 � 25 vesicles per�m2 in control boutons and 220 � 16 vesicles per �m2 in AP-1. Because total bouton area and presynaptic area are reduced in AP-1 neuromuscular junctions (TableS1), these data further indicate that total synaptic vesicle number has not been increased by AP-1 expression
Kim et al. www.pnas.org/cgi/content/short/0806064106 7 of 10
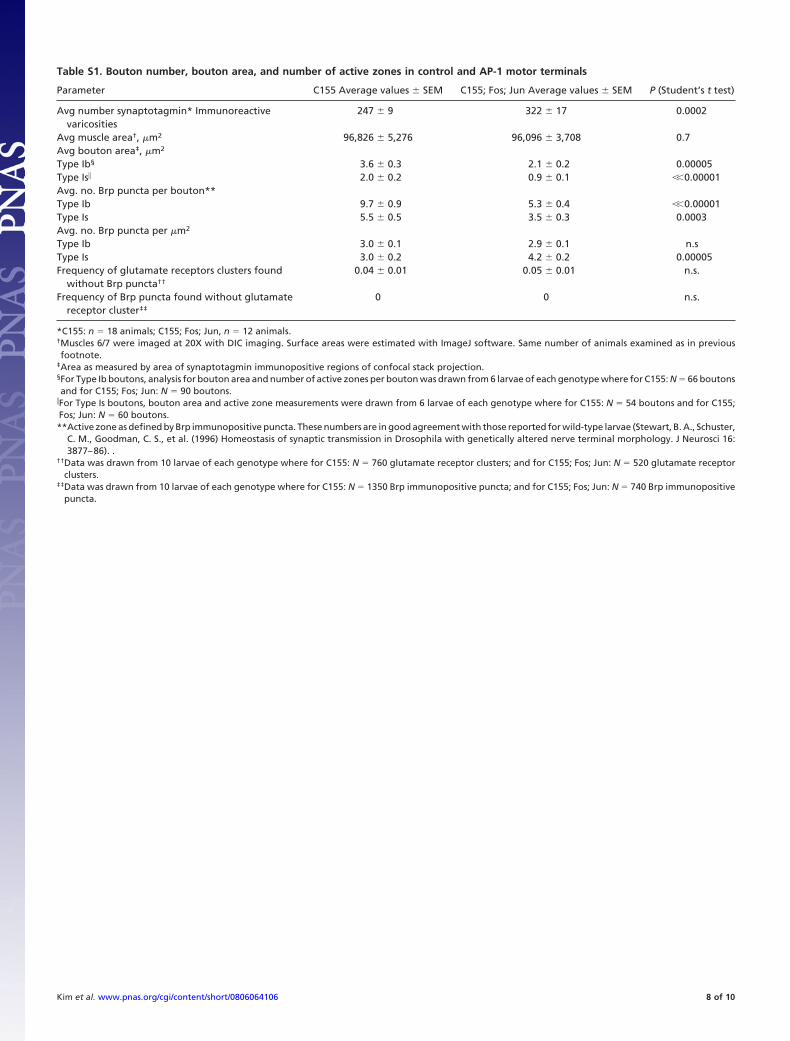
Table S1. Bouton number, bouton area, and number of active zones in control and AP-1 motor terminals
Parameter C155 Average values � SEM C155; Fos; Jun Average values � SEM P (Student’s t test)
Avg number synaptotagmin* Immunoreactivevaricosities
247 � 9 322 � 17 0.0002
Avg muscle area†, �m2 96,826 � 5,276 96,096 � 3,708 0.7Avg bouton area‡, �m2
Type Ib§ 3.6 � 0.3 2.1 � 0.2 0.00005Type Is� 2.0 � 0.2 0.9 � 0.1 ��0.00001Avg. no. Brp puncta per bouton**Type Ib 9.7 � 0.9 5.3 � 0.4 ��0.00001Type Is 5.5 � 0.5 3.5 � 0.3 0.0003Avg. no. Brp puncta per �m2
Type Ib 3.0 � 0.1 2.9 � 0.1 n.sType Is 3.0 � 0.2 4.2 � 0.2 0.00005Frequency of glutamate receptors clusters found
without Brp puncta††
0.04 � 0.01 0.05 � 0.01 n.s.
Frequency of Brp puncta found without glutamatereceptor cluster‡‡
0 0 n.s.
*C155: n � 18 animals; C155; Fos; Jun, n � 12 animals.†Muscles 6/7 were imaged at 20X with DIC imaging. Surface areas were estimated with ImageJ software. Same number of animals examined as in previousfootnote.
‡Area as measured by area of synaptotagmin immunopositive regions of confocal stack projection.§For Type Ib boutons, analysis for bouton area and number of active zones per bouton was drawn from 6 larvae of each genotype where for C155: N � 66 boutonsand for C155; Fos; Jun: N � 90 boutons.
�For Type Is boutons, bouton area and active zone measurements were drawn from 6 larvae of each genotype where for C155: N � 54 boutons and for C155;Fos; Jun: N � 60 boutons.**Active zone as defined by Brp immunopositive puncta. These numbers are in good agreement with those reported for wild-type larvae (Stewart, B. A., Schuster,
C. M., Goodman, C. S., et al. (1996) Homeostasis of synaptic transmission in Drosophila with genetically altered nerve terminal morphology. J Neurosci 16:3877–86). .
††Data was drawn from 10 larvae of each genotype where for C155: N � 760 glutamate receptor clusters; and for C155; Fos; Jun: N � 520 glutamate receptorclusters.
‡‡Data was drawn from 10 larvae of each genotype where for C155: N � 1350 Brp immunopositive puncta; and for C155; Fos; Jun: N � 740 Brp immunopositivepuncta.
Kim et al. www.pnas.org/cgi/content/short/0806064106 8 of 10
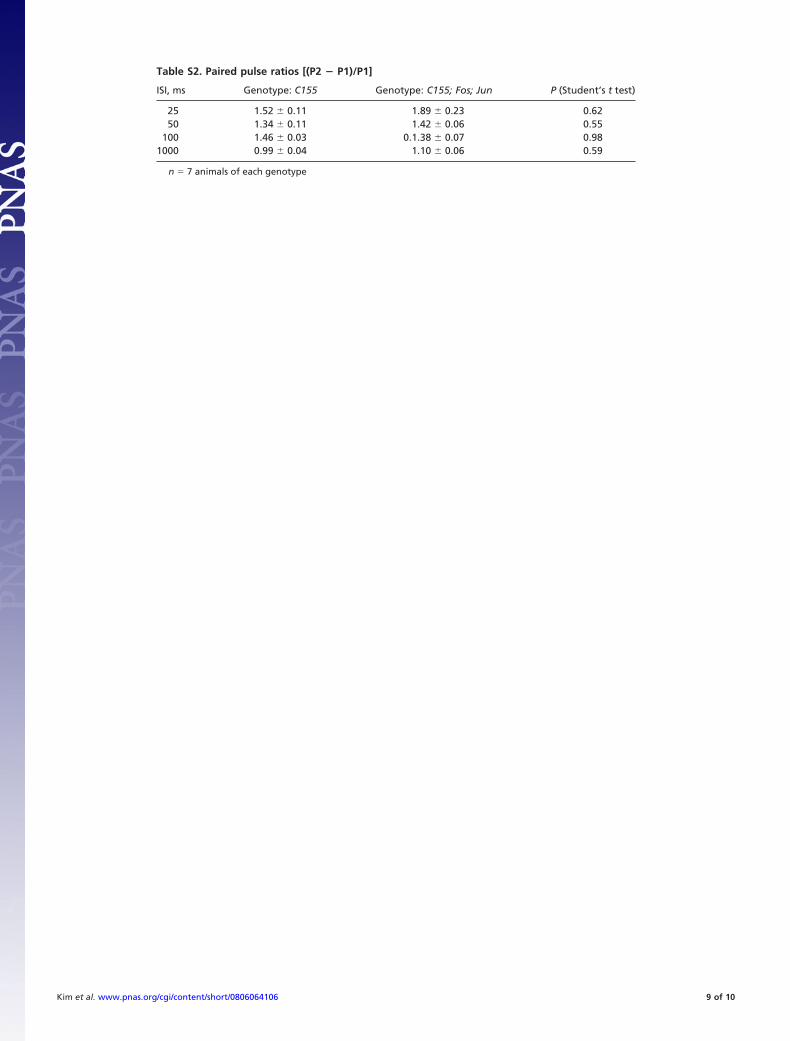
Table S2. Paired pulse ratios [(P2 � P1)/P1]
ISI, ms Genotype: C155 Genotype: C155; Fos; Jun P (Student’s t test)
25 1.52 � 0.11 1.89 � 0.23 0.6250 1.34 � 0.11 1.42 � 0.06 0.55
100 1.46 � 0.03 0.1.38 � 0.07 0.981000 0.99 � 0.04 1.10 � 0.06 0.59
n � 7 animals of each genotype
Kim et al. www.pnas.org/cgi/content/short/0806064106 9 of 10
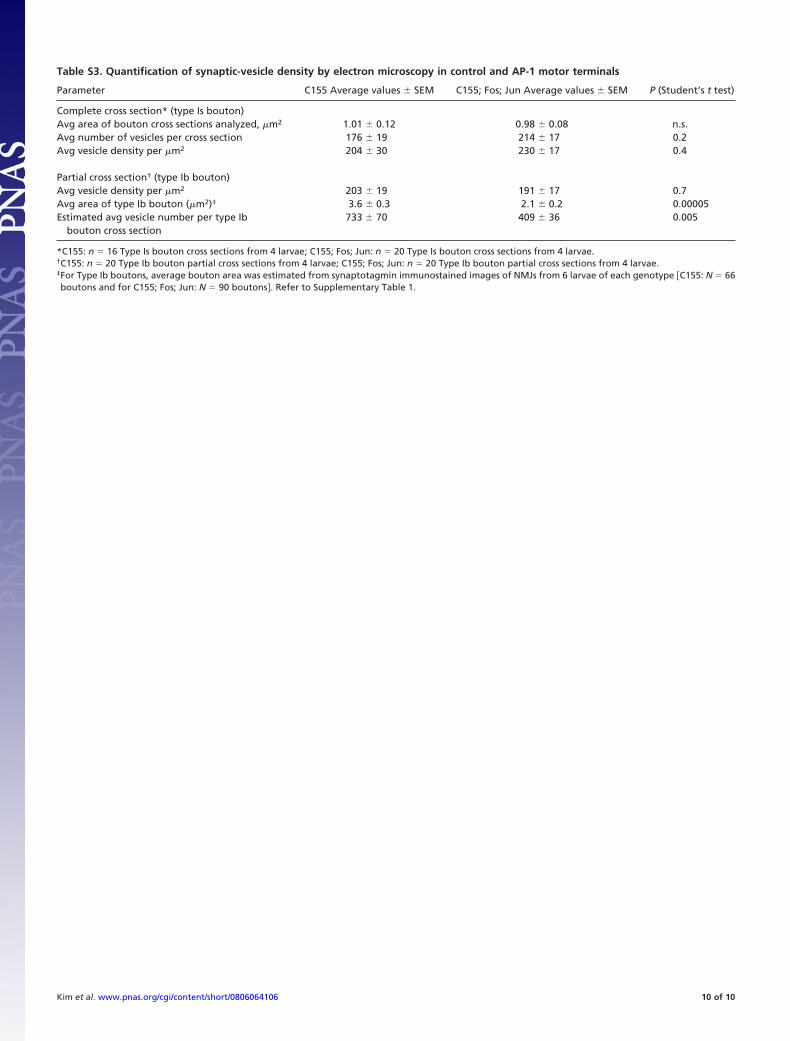
Table S3. Quantification of synaptic-vesicle density by electron microscopy in control and AP-1 motor terminals
Parameter C155 Average values � SEM C155; Fos; Jun Average values � SEM P (Student’s t test)
Complete cross section* (type Is bouton)Avg area of bouton cross sections analyzed, �m2 1.01 � 0.12 0.98 � 0.08 n.s.Avg number of vesicles per cross section 176 � 19 214 � 17 0.2Avg vesicle density per �m2 204 � 30 230 � 17 0.4
Partial cross section† (type Ib bouton)Avg vesicle density per �m2 203 � 19 191 � 17 0.7Avg area of type Ib bouton (�m2)‡ 3.6 � 0.3 2.1 � 0.2 0.00005Estimated avg vesicle number per type Ib
bouton cross section733 � 70 409 � 36 0.005
*C155: n � 16 Type Is bouton cross sections from 4 larvae; C155; Fos; Jun: n � 20 Type Is bouton cross sections from 4 larvae.†C155: n � 20 Type Ib bouton partial cross sections from 4 larvae; C155; Fos; Jun: n � 20 Type Ib bouton partial cross sections from 4 larvae.‡For Type Ib boutons, average bouton area was estimated from synaptotagmin immunostained images of NMJs from 6 larvae of each genotype �C155: N � 66boutons and for C155; Fos; Jun: N � 90 boutons. Refer to Supplementary Table 1.
Kim et al. www.pnas.org/cgi/content/short/0806064106 10 of 10