Embed Size (px)
Citation preview
Supporting InformationKim et al. 10.1073/pnas.0807935105SI TextCultivation of Microorganisms and Culture Media. Bacterial speciesof Azotobacter vinelandii (Av, ATCC 12837), Bacillus lichenifor-mis (Bl, ATCC 25972), and Paenibacillus curdlanolyticus (Pc,ATCC 51899) were purchased from the American Type CultureCollection. Av cells were enriched in sterilized Azotobacter 1771medium (ATCC; 10.0 g/L D-(�)-glucose, 1.2 g/L CH3COONH4,0.583 g/L K2HPO4, 0.224 g/L KH2PO4, 0.1 g/L CaSO4�2H2O,0.098 g/L MgSO4, 0.058 g/L NaCl, 0.005 g/L FeSO4�7H2O, and0.0002 g/L Na2MoO4�2H2O, pH 6.8). Both Bl and Pc cells wereenriched in 30 g/L of sterilized trypticase soy broth (TSB)medium (BD Company). During the cultivation of Pc species,cellulolytic enzymes were induced by adding filter-sterilized(0.45 �m, Whatman) carboxymethyl-cellulose (CM-cellulose;sodium salt, 0.7 degree of substitution, Sigma-Aldrich) at 1 g/Lfinal concentration. Seed cultures of each species were culturedin a rotary shaking incubator (SI-600 Lab Companion, JeioTech) at 30°C and 180 rpm in a Laurell Model WS-400A-GNPP/LITE rotor. Species were subcultured every 3 days on fresh agarmedium and were preserved at 4°C by using 40 g/L of sterilizedDifco tryptic soy agar (TSA) medium (BD Company) for Bl andPc species and 1771 agar medium containing 2% (wt/vol) agar(Fisher Scientific) for Av species. The minimal buffer wascomposed of 0.5 g/L KH2PO4, 0.2 g/L K2HPO4, 0.1 g/L NaCl, 0.1g/L MgSO4�7H2O, 0.05 g/L FeSO4�7H2O, and 0.001 g/LNa2MoO4�2H2O (pH 6.9). The cellulose/penicillin (CP) mediumconsisted of carboxymethyl cellulose (1 g/L) and penicillin G(100 mg/L) in minimal buffer solution.
In Fig. 1B, mixed culture was performed in a test tube (14 ml,Falcon) containing 2 ml of either nutrient-rich medium (TSB/1771 mixture, 4:1, vol/vol) or nutrient-poor medium (CP mediumincluding 100 �g/L D-glucose) at 30°C and 160 rpm for 36 h.Live-cell numbers of Av, Bl, and Pc were adjusted to similarlevels via live/dead staining and cell counting (Live/Dead Ba-cLight Bacterial Viability kit, Molecular Probes) before inocu-lation. The number of viable cells in macroscale cultures wasestimated by agar plate counting. We confirmed that all threespecies grew on both TSB and 1771 agar media (data not shown).Differences in colony morphology on the agar plate enableddifferentiation and simultaneous counting of cell numbers.
Inoculation and Cultivation of Species in the Microfluidic Device.After seed cultures of Av, Bl, and Pc species at exponential phasewere harvested and washed twice with minimal buffer solution,the live-cell number of each species was adjusted to a similarlevel by staining with live/dead dye and counting cells under anepi-f luorescence microscope (DMI 6000 B, Leica), resulting ina live-cell density of � 106 CFU/ml. The cell suspension of eachspecies was transferred aseptically to sterilized Gastight syringes(1805 RN, Hamilton) with 30-gauge Teflon tubing (Weico)sealed to Teflon tubing (i.d./o.d. � 100/150 �m, polytetrafluo-roethylene [PTFE], Zeus) with wax. The cell suspension in thesyringes was inoculated accurately into an individual culture wellin the microfluidic device at a density of � 500-1000 livecells/well via a microaspirator (Stoelting) under a stereomicro-scope (SMZ-2E, Nikon). The number of live cells loaded intoeach well varied by � 10%. The inoculated device was placedover a droplet of appropriate medium on a siliconized glass coverslide, and the medium filled the communication channel belowthe wells. The device setup was fixed inside the Petri dish usingsilicone vacuum grease (Dow Corning), and the Petri dishcontaining the device setup then was incubated in an inverted
position at 30°C. Water droplets were added on the bottom of theinside of a Petri dish to maintain humidity. Three replicates ofthe microfluidic devices were performed at each time point forthe experiments shown in Figs. 2 and 3. The low-nutrient/antibiotic medium (CP medium) contained carboxymethyl cel-lulose (1 g/L) as a sole carbon source, no nitrogen source, andpenicillin G (100 mg/L). The nutrient-rich medium was a mixtureof TSB and 1771 media in a 4:1 (vol/vol) ratio. The number oflive cells in a microfluidic device was counted manually after thelive/dead staining with solutions of SYTO9 (live, green) andpropidium iodide (dead, red) (Molecular Probes).
Data Acquisition and Analysis of Microscopic Images. Bacterial spe-cies of Av, Bl, and Pc were stained with a fluorescent dye(Molecular Probes) to indicate live (green; SYTO9) and dead(red; propidium iodide) cells. After loading the live/dead dyeinto culture wells using the microaspirator (Stoelting), a coverglass (48 � 65 mm, Gold Seal, Thermo Scientific) was placedover the culture wells, and the microfluidic device was invertedto take images. Cells were imaged using an epi-f luorescencemicroscope (DMI 6000 B, Leica) equipped with a 5� (0.15 N.A.)or a 20� (0.40 N.A.) objective and either an L5 or a TX2 filterset (Leica), which were coupled with a cooled CCD camera(12-bit, 1344 � 1024 resolution; Hamamatsu Photonics) with a1.0� coupler.
The exposure time of fluorescent images in Figs. 2 and 3 was100 ms. Among the three replicates of microfluidic devices,images from one of the devices were selected randomly as therepresentative setup of fluorescent images. In Fig. 2 A (Top), thefluorescent images taken with both filters at 0 h were processedwith the low scale value of 250 and the high scale value of 3000(e.g., L250 H3000) for Av, L250 H3000 for Bl, and L250 H1000for Pc. In Fig. 2 A (Bottom), the fluorescent images of theconnected community, taken at 36 h, were processed with scalesof L250 H800 for Av, 250 H800 for Bl, and L250 H600 for Pc.In Fig. 2B, the fluorescent images of isolated species, taken at36 h, were processed with scales of L250 H800 for Av, L250 H800for Bl, and L220 H400 for Pc. In Fig. 3A, the fluorescent imagesof the mixed culture taken with both filters were processed withscales of L250 H3000 at 0 h and L250 H800 at 36 h, respectively.Images taken with both filters, L5 and TX2, were overlaid usingMetaMorph image software (Molecular Devices). The intensityprofile of fluorescent images in Figs. 2 and 3 is provided in Fig.S9. The number of live cells in an overlaid fluorescent image wascounted manually in a digitally enlarged image. Replicate countsof the same image showed variations within 3%. For the graphsin Figs. 2 and 3, at least three replicates of each device werecounted and quantified. To quantify live cells in a mixed culturein Fig. 3, the total number of live cells was estimated withoutdiscrimination of species.
Survival Ratio of Av, Bl, and Pc Species. In Fig. S1 A, the survivalratio of each species was calculated from the number of viablecells in different media conditions over time. After each specieswas enriched in liquid cultures of either TSB medium (for Bl andPc) or 1771 medium (for Av), cells were washed twice withminimal buffer solution, then adjusted to have a similar celldensity of � 107 CFU/ml. For the culture, three different mediawere prepared; no-nutrient (minimal buffer solution; see Cul-tivation of Microorganisms and Culture Media), low-nutrient(minimal buffer solution supplemented with 500 �M glucose and500 �M ammonium phosphate), and no-nutrient with antibiotics
Kim et al. www.pnas.org/cgi/content/short/0807935105 1 of 15
(minimal buffer solution with 100 mg/L penicillin G). After cellswere inoculated onto each medium, cultures were carried out at30°C, 150 rpm, for 36 h. The number of viable cells was estimatedby using the agar plate counting of cfus.
Measurement of Specific Growth Rate in Monoculture of Av and Bl. InFig. S1B, cultivation of individual species of Av or Bl wasperformed in 14-ml test tubes (Falcon, Becton Dickinson Lab-ware) with a 3-ml working volume of medium at 30°C and 180rpm in a rotary shaker for 3 h. Media with different concentra-tions were prepared by the serial dilution of a mixture of TSB and1771 media (4:1, vol/vol). The initial concentration of themixture TSB/1771 medium was 30 g/L; it then was diluted tovarious concentrations: 0.05, 0.1, 0.3, 0.6, 1.0, 10, and 50 mg/L.During the cultivation, aliquots of culture broth of both Av andBl were taken intermittently and used for measuring opticaldensity at 600 nm (8453 UV-Visible Spectrophotometer, AgilentTechnologies). The dry cell weight of both Av and Bl species wasobtained from the respective calibration curve of optical densityunits versus the dry cell weight of each species. The specificgrowth rate (�) of both Av and Bl cells was calculated by theequation � � 1/X(dX/dt), where � is the specific growth rate(h�1), X is the dry cell weight (g/L), and t is the cultivation time.
Effect of Heat-Killed Bl Cell Debris on the Viability of Av and Pc Cells.Fig. S1C shows the results of an experiment to test the effect ofcell debris of the Bl species on the viability of cells of either theAv or Pc species. Heat-killed Bl cell debris was prepared bytaking a Bl cell suspension, enriched in TSB medium and witha cell density of � 106 CFU/ml, washing the suspension inminimal buffer, and then autoclaving the suspension at 121°C for15 min. After Av and Pc cells were enriched, washed twice, andre-suspended in CP medium supplemented with 100 �g/L glu-cose at � 105 CFU/ml, the heat-killed Bl cell suspension (0.1 ml)was added to either the Av or Pc cell suspension (0.9 ml), and theresulting suspension was incubated at 30°C, 150 rpm, for 36 h.Samples from the Av or Pc cultures were harvested intermit-tently and used for the viable cell counting.
Effect of Penicillin and Its Degradation Products on the Viability of Avand Pc Cells. Fig. S1D shows the results of an experiment to testthe effect of degradation products of penicillin G on the viabilityof Av and Pc cells. Each species was cultured in four differentmedia: the control medium (minimal buffer containing 1 g/LCM-cellulose and 100 �g/L glucose), the control medium con-taining 100 mg/L penicillin G (w/PEN), the control mediumcontaining degradation products of penicillin G (w/PEN degrad-ants), and the control medium containing 0.5 mg/L �-lactamase(w/�-Lactamase). To obtain the degradation products of peni-cillin G, 0.5 mg/L �-lactamase (Penicillinase from Bacilluscereus, Sigma) was incubated in the minimal buffer containing100 mg/L penicillin G (Fisher Scientific) for 1.5 h at roomtemperature. Thin-layer chromatography (TLC) was performedto monitor qualitatively the conversion of penicillin G into itsdegradation products. Silica gel TLC plates (PE SIL G/UV,250-�m layer, polyester, Whatman) with sample spottings wereeluted with mobile phase of ethyl acetate: acetone: water (1:2:1,vol/vol/vol), then developed by using iodine. It was confirmedthat the commercial �-lactamase fully degraded the penicillin Gin � 3 min. The degradation products were added to cultures ofeither Pc or Av and incubated at 30°C, 160 rpm. Aliquots weretaken intermittently and used for monitoring the number ofviable cells by plate counting in TSA (for Pc) or 1771 agar media(for Av).
Confirmation of Localized Growth of Bacterial Species in the Microflu-idic Culture Well. In Fig. S2, the fluorescence-labeled bacterialstrains used were (i) GFP-labeled Escherichia coli containing
PUCP24/EGFP plasmids in E. coli K12 YMel-1 host and (ii)RFP-labeled E. coli containing DsRed-encoding plasmids in E.coli DH10B host. The RFP-labeled E. coli strain was provided byProfessor Benjamin Glick of the University of Chicago. GFP-labeled E. coli was cultured in TSA medium (BD Company) thatincluded 100 mg/L kanamycin and 20 mg/L gentamicin. RFP-labeled E. coli was cultured in TSA medium that included 100mg/L ampicillin. After both strains were suspended in the salinesolution (0.9% of sterilized NaCl solution, wt/vol), the numbersof fluorescent cells of each strain were adjusted by dilution to besimilar using an epi-f luorescence microscope (DMI 6000 B,Leica). Then, each strain was transferred into a glass syringe andwas inoculated accurately into a separate, individual culture wellof a microfluidic device by using a microaspirator (Stoelting)under a stereomicroscope (SMZ-2E, Nikon). One of the threeculture wells was loaded with GFP-labeled E. coli, one of theculture wells was loaded with RFP-labeled E. coli, and one of theculture wells was left vacant. Three replicates of the microfluidicdevices were performed in the experiment for each time point.After the wells were loaded, the microfluidic device was placedon the surface of a siliconized glass cover slide (22 � 22 mm,Hampton Research), and the communication channel was filledwith TSB medium (BD Diagnostics) without any antibioticpressure. The inoculated microfluidic device setup was fixedinside a Petri dish by using silicone vacuum grease (DowCorning); then the Petri dish containing the device setup wasincubated in an inverted position at 30°C for 12 h. Water dropletswere added on the bottom of the inside of the Petri dish tomaintain humidity.
For the fluorescent images at 0 h in Fig. S2B, images of theGFP-labeled E. coli strain and the RFP-labeled E. coli strainwere taken by an epi-f luorescence microscope equipped with a20� objective (0.40 N.A.) and an L5 filter (for the GFP-labeledE. coli strain) or a TX2 filter (for the RFP-labeled E. coli strain)at 150 ms exposure time. After fluorescent images were pro-cessed at the low scale value of 200 and the high scale value of270, a rectangle shape was collected from the center of a culturewell inoculated with either the GFP-labeled E. coli strain or theRFP-labeled E. coli strain. For the fluorescent images at 12 h inFig. S2B, images of the GFP-labeled E. coli strain and theRFP-labeled E. coli strain were taken by an epi-f luorescencemicroscope equipped with a 5� objective (0.15 N.A.) and an L5filter (for GFP-labeled E. coli) or a TX2 filter (for RFP-labeledE. coli) at 10 ms of exposure time. The reproducibility amongthree replicates of microfluidic devices was confirmed in allcases, and one of the devices was collected randomly as therepresentative setup of fluorescent images for all replicates at 0 hand at 12 h. The fluorescent image taken by an L5 filter wasprocessed at the low scale value of 205 and the high scale valueof 270, and the fluorescent image taken by a TX2 filter wasprocessed at the low scale value of 220 and the high scale valueof 290. Then the images were overlaid using MetaMorph imagesoftware (Version 6.3r1, Molecular Devices). The bright field(BF) image taken at 10 ms was processed at the low scale valueof 1200 and the high scale value of 4500. The intensity profile ofthe fluorescent images in Fig. S2B is shown in Fig. S2C.
In Fig. S2E, f luorescein solution was used for the diffusion testof the communication channel. After a device containing deion-ized water in the communication channel was placed on thesurface of the cover glass (24 � 40 mm, Corning), the two culturewells were filled with deionized water using a microaspirator,and then the other culture well was filled accurately withcarboxy-fluorescein solution (200 �M) under a stereomicro-scope (SMZ-2E, Nikon). The device setup was inverted imme-diately, and fluorescent images of fluorescein diffusion weretaken at 1, 5, and 15 min by an epi-f luorescence microscope(DMI 6000 B, Leica) equipped with a 5� objective (0.15 N.A.,Leica) and an L5 filter (Leica) at 100 ms of exposure time, which
Kim et al. www.pnas.org/cgi/content/short/0807935105 2 of 15
were coupled with a cooled CCD camera (12-bit, 1344 � 1024resolution; Hamamatsu Photonics) with a 1.0� coupler. Fluo-rescent images were processed at the low scale value of 200 andthe high scale value of 1300 by using MetaMorph image software(Molecular Devices). The BF image taken at 50 ms was pro-cessed at the low scale value of 700 and the high scale value of4000. The intensity profile of fluorescent images in Fig. S2E isshown in Fig. S2F.
Confirmation of Chemical Gradient and Diffusion in the MicrofluidicDevice. In Fig. S3, the chemical gradient in the microfluidicdevice was demonstrated by using resorufin cellobioside (Mark-erGene Fluorescent Cellulase Assay Kit, MGT Inc.), a fluoro-genic substrate for the cellulases of Pc cells. Pc cells wereenriched in TSB medium supplemented with 1 g/L CM-celluloseat 30°C, 180 rpm for 6 h, then washed twice with minimal buffersolution (see SI Text, Cultivation of Microorganisms and CultureMedia), then resuspended in minimal buffer solution with a finalcell density of � 106 CFU/ml. After the Pc cell suspension wasinoculated aseptically into either one or two culture wells in amicrofluidic device using the microaspirator under a stereomi-croscope (SMZ-2E, Nikon), the culture wells without Pc cellswere filled with minimal buffer. Then, the microfluidic devicewas loaded onto the surface of a cover glass (24 � 40 mm,Corning) containing resorufin cellobioside solution in the com-munication channel. The device setup, supported by 5-mm highpolymethylsiloxane (PDMS) pieces on the cover glass (48 � 65mm, Gold Seal), was incubated in an inverted position using themicroscope incubator (Incubator BL, Pecon) at 30°C (Fig. S3 Aand D). Fluorescent images were taken intermittently for 3 husing an epi-f luorescence microscope (DMI 6000 B, Leica)equipped with a 5� objective (0.15 N.A., Leica) and a TX2 filter(Leica) coupled with a cooled CCD camera (12-bit, 1344 � 1024resolution; Hamamatsu Photonics) with a 1.0� coupler (Fig. S3B and E). Red fluorescence in the culture well inoculated withPc cells shows the fluorescence of resorufin, indicating thecleavage of resorufin cellobioside over time by Pc cells. Imageacquisitions and analyses were performed as described above.After the fluorescent images in Fig. S3 B and E were taken at 1,5, 15, 60, 90, and 180 min with a TX2 filter (Leica) at 100 msexposure time, the fluorescent images were processed at the lowscale value of 210 and the high scale value of 400 by usingMetaMorph image software (Molecular Devices). The intensityprofile of fluorescent images in Fig. S3 B and E is shown in Fig.S3 C and F.
In Fig. S3 G and H, the diffusion of resorufin dye wasdemonstrated in the microfluidic device. After Pc cells wereinoculated in one of the culture wells of a device, the device wasloaded onto a cover glass (24 � 40 mm, Corning) containingminimal buffer solution in the communication channel. Aftertwo culture wells without Pc cells were filled with � 5 nL ofminimal buffer solution, � 5 nL of resorufin solution (50 �M,10% DMSO solution in sodium acetate buffer, MGT Inc.) wasadded to the culture well containing Pc cells (Fig. S3G) using amicroaspirator under a stereomicroscope (SMZ-2E, Nikon).This device setup, supported by PDMS pieces 5 mm high placedon top of the cover glass (48 � 65 mm, Gold Seal), was invertedimmediately and was incubated (30°C) for 30 min. Fluorescentimages then were taken intermittently for 30 min using anepi-f luorescence microscope (DMI 6000 B, Leica) equippedwith a 5� objective (0.15 N.A., Leica) and a TX2 filter (Leica)coupled with a cooled CCD camera (12-bit, 1344 � 1024resolution; Hamamatsu Photonics) with a 1.0� coupler (Fig.S3H). After the fluorescent images in Fig. S3H were taken at 1,5, 15, 20, 25, and 30 min with a TX2 filter (Leica) at 100 msexposure time, the images were processed at the low scale valueof 200 and the high scale value of 500 by using MetaMorph image
software (Molecular Devices). The intensity profile of fluores-cent images in Fig. S3H is shown in Fig. S3I.
Cultivation of Three Species in a Device at High-Nutrient Medium. InFig. S4, each species, Av, Bl, and Pc, was enriched in TSBmedium (Bl and Pc) or 1771 medium (Av). After live-cellnumbers of Av, Bl, and Pc species were adjusted similarly vialive/dead staining (Molecular Probes), a washed cell suspensionof each species was inoculated accurately into the microfluidicdevice using a microaspirator under a stereomicroscope (SMZ-2E, Nikon). The device containing each species in the respectiveculture well was loaded onto the cover glass (22 � 22 mm, FisherScientific), and the communication channel was filled withTSB/1771 media (4:1, vol/vol) as a high-nutrient medium. Thedevice setup was fixed inside a Petri dish by using siliconevacuum grease (Dow Corning), and then the Petri dish contain-ing the device setup was incubated in an inverted position at 30°Cfor 8 h. Water droplets were added on the bottom inside the Petridish to maintain humidity. Three replicates of the microfluidicdevices were performed in the experiment for each time point.The viability of each species in a device was confirmed by usinglive/dead staining (Molecular Probes). After the live/dead dyewas loaded into culture wells by using the microaspirator, a coverglass (48 � 65 mm, Gold Seal) was placed over the culture wells,and the microfluidic device was inverted.
After the incubation and the live/dead staining, image acqui-sitions and analyses were performed in the manner describedabove. In Fig. S4A, f luorescent images of stained Av, Bl, and Pcspecies at 0 h were taken by an epi-f luorescence microscope(DMI 6000 B, Leica) equipped with a 20� objective (0.40 N.A.)and an L5 filter or a TX2 filter (Leica), at 100 ms exposure time,and coupled with a cooled CCD camera (12-bit, 1344 � 1024resolution; Hamamatsu Photonics) with a 1.0� coupler. Thereproducibility among three replicates of microfluidic deviceswas confirmed in all cases, and images of one of the devices wereselected randomly as representative fluorescent images. Theimages taken with both filters were processed at the low scalevalue of 250 and the high scale value of 800, and the images takenwith both filters then were overlaid using MetaMorph imagesoftware (Molecular Devices). In Fig. S4B, f luorescent images ofstained Av, Bl, and Pc species at 8 h were taken by an epi-f luorescence microscope (DMI 6000 B, Leica) equipped with a20� objective (0.40 N.A.) and an L5 filter or a TX2 filter (Leica)at 100 ms of exposure time. The reproducibility among threereplicates of microfluidic devices was confirmed in all cases, andimages of one of the devices were collected randomly as repre-sentative fluorescent images. Fluorescent images taken withboth L5 and TX2 filters were processed at the low scale value of250 and the high scale value of 1000 (Av), the low scale value of250 and the high scale value of 4000 (Bl), and the low scale valueof 250 and the high scale value of 1500 (Pc). Then, images takenwith both filters were overlaid using MetaMorph image software(Molecular Devices). The intensity profiles of fluorescent im-ages in Fig. S4 A and B are shown in Fig. S4 C and D, respectively.
Cultivation of a Two-Species Community in a Microfluidic Device. InFig. S5, the stabilities of two-species and three-species commu-nities in microfluidic devices are compared. In this figure, fourexperimental setups were performed simultaneously with thesame seed cultures of Av, Bl, and Pc as follows: three-speciescommunity (ABC) and two-species communities (AB, AC, andBC). After seed cultures of Av, Bl, and Pc species were harvestedand washed twice with minimal buffer solution (see SI Text,Cultivation of Microorganisms and Culture Media), the live-celldensities of each species were adjusted to a similar level of � 106
CFU/ml. Densities were quantified by staining with live/dead dyeand then counting the cells under an epi-f luorescence micro-scope (DMI 6000 B, Leica). The cell suspension of each species
Kim et al. www.pnas.org/cgi/content/short/0807935105 3 of 15
was transferred aseptically to sterilized Gastight syringes (1805RN, Hamilton) with 30-gauge Teflon tubing (Weico) sealed toTeflon tubing (i.d./o.d. � 100/150 �m, PTFE, Zeus) by wax.Then, the cell suspension in the syringes was inoculated accu-rately into an appropriate culture well by using a microaspiratorunder a stereomicroscope (SMZ-2E, Nikon). In the three-species connected community, each species, Av, Bl, or Pc, wasinoculated into a different culture well in a device. In thetwo-species connected communities, only two different specieswere inoculated into two different culture wells; the otherculture well was left vacant. After inoculations, the device wasloaded onto the surface of a siliconized glass cover slide con-taining CP media supplemented with 100 �g/L glucose in thecommunication channel. This device setup was fixed inside aPetri dish by using silicone vacuum grease (Dow Corning), thenwater droplets were added on the bottom of the inside of thePetri dish for maintaining humidity, and finally the Petri dishcontaining the device setup was incubated in an inverted positionat 30 oC. Three replicates of microfluidic devices were per-formed for every experiment at each time point. After theincubation, image acquisitions and analyses were performed inthe same way as described above. Normalized live cell numberswere obtained by dividing the live numbers of each species ateach time point by those numbers at 0 h.
Full Mathematical Model Including Colony Growth. In Fig. 4, math-ematical analysis of a model community was used to explain howspatial structure influences the coupling of microbial commu-nities. In that model it was assumed that colony size did notchange over time. Below is a full model that includes terms forthe growth of colonies. The full model demonstrates that themodel system has a global steady state (colony sizes and nutrientconcentrations are simultaneously stable and non-zero) only fora range of intermediate distances.
To analyze the stability of the model in Fig. 4 to separationdistance (L), concentration of A ([A]�), concentration of B ([B]b), size of colony alpha (N�) and size of colony beta (N�), alogistic growth equation for colonies � and � was used:
�N�
�t� �� � N� � �1 � N�/K� �1 [1]
�N�
�t� �� � N� � �1 � N�/K� [2]
K� is the carrying capacity for colony �. In the model system,carrying capacity is a function of nutrients A and B, therefore wemodeled the carrying capacity as:
K� �k� � A�� � B�� �L
�k�,A A�� � �k�,B B���L[3]
K� �k� � A���L � B��
�k�,A A���L � �k�,B B��[4]
Equations for the change over time of [A]� and [B] b are:
�A��
�t�
k1 � A��3 � �B���L3
�k2 A��3 � �k3 �B���L3
� N� � k4 � A�� � N�
� k9 � A���L � N� [5]
�B��
�t�
k5 � �A���L3 � B��3
�k6 �A���L3 � �k7 B��3
� N� � k8 � B���L
� N� � k10 � B�� � N� [6]
For this analysis, the variable d was used to simplify the terms[A]�(L) to [A]� � (1�d) and [B]�(L) to [B]� � (1�d). The valueof d is between 0 and 1, and d is a function of the transportproperties of the system. For example, (1�d) represents thefraction of nutrient A at colony � that arrived at colony �. Whend � 1, the separation distance is infinite, and colony � receivesno nutrient A. When d � 0, the separation distance is 0, and bothcolony � and colony � receive the same amount of nutrient A.
It should be noted that the Damkohler number (Da) should belarge for spatial effects to be important in coupled systems suchas the two-species model used in Fig. 4. The Damkohler numberis a dimensionless parameter that defines the relative rates oftransport and reaction. If Da is large, spatial gradients of releasedproducts will form, and therefore the coupling of the system willbe a function of space. In our system, we defined the Da as(L2 �kconsumption)/D, where L is the separation distance (m),kconsumption is the consumption rate (s�1), and D is the diffusionconstant (m2s�1). Based on experimentally measured values, wepredicted that the community and devices used in the experi-ments should be in the regime in which released products forma gradient, as observed in Fig. S3.
These equations give rise to communities of Class I, II, or IIIas described in the main text. The class of a given communitydepends on the values of the rate constants in the equations ina manner consistent with the metabolic analysis presented in themain text. To illustrate the stability of a Class II community toperturbations in concentrations, populations, and distance, wechose at random values of the rate constants (listed in Table S1)which corresponded to a Class II community. To analyze thestability of these steady states, we used Equations 1-6 to evolvethe system over time at different values of d to examine thestability of [A]�, [B]�, N�, and N�. Mathematica (Mathematic 6.0,Wolfram Research Inc.) was used for these simulations, withinitial conditions of [A]� � 6.5, [B]� � 3.0, N� � 0.35 and �b �0.13, which are near a global steady state of the system.
As shown in Fig. S6, the system was able to establish a steadystate for any distance 0.21 [lteq] d [lteq] 0.72. If the colonies wereseparated by intermediate distances and given suitable initialconditions, the system was able to establish a global steady state,indicating that the model system is Class II.
Next, the stability of the global steady state to fluctuations ofeach variable was demonstrated. The system with d � 0.5 wasperturbed every 250 time points starting at time point 250. Theperturbation consisted of changing the value of one of thevariables by � 20% (as indicated in Fig. S7 A–D). All systemvariables returned to the steady-state value after each pertur-bation, indicating that the system has a non-zero steady state thatis stable.
The global steady state of the system was determined over therange of d. The initial conditions of the system were [A]� � 6.5,[B]� � 3.0, N� � 0.35, and Nb � 0.13, which are near a globalsteady state. The steady state was calculated for d between 0 and0.95 in increments of 0.01 by simulating 50,000 time steps foreach d value. Values of d near 1 experienced numerical errorsbecause of dividing by numbers near zero. The results of thesimulation are shown in Fig. S7 E–H. The system was not stableat close distances (low values of d), because the steady state iszero for all variables. At intermediate distances, non-zero steadystates were reached. As d increases in the intermediate regime,steady-state concentrations of [A]� and [B]� increased because ofdecreased nutrient competition as predicted by the model in Fig.4. At large values of d (i.e., when the colonies were far apart),the steady states again evolved to zero for all variables.
Analysis of the full model which includes growth terms forcolonies � and � was in agreement with the simplified analysispresented in main text. The full model demonstrated thatincluding growth terms for the colonies did not destabilize aClass II community. In addition, the full model was used to
Kim et al. www.pnas.org/cgi/content/short/0807935105 4 of 15
calculate the range of d over which the community has non-zerosteady states.
Measurements of Cellulase Activity. In Fig. S8, the enzymaticactivity of cellulase was measured by using the fluorogenicsubstrate 4-methylumbelliferyl �-D-cellobioside (4-MUFC,Sigma-Aldrich). To measure the cellulase activity of Pc cells atdifferent concentrations of glucose, Pc cells enriched in TSBmedium were washed twice and resuspended in the incubationmedia containing different concentrations of glucose (0, 0.01,0.03, 0.1, 0.3, 0.6, 1, 2.5, 5, 7.5, 10, 25, 50, and 100 �M) and acorresponding concentration of casamino acid in the minimalbuffer solution (see SI Text, Cultivation of Microorganisms andCulture Media) at 30°C for 6 h. In these incubation media, thecarbon/nitrogen (C/N) ratio of glucose to casamino acid was heldconstant at 10 (wt/wt). During the 6-h preincubation, freshincubation medium supplemented with glucose and casaminoacid was supplied to the culture by spinning down the cells,removing old medium, and adding fresh medium every 2 h. After6 h, carboxymethyl-cellulose (1 g/L, final concentration) wasadded to the minimal buffer/glucose/casamino acid solution, andthe cell suspension then was incubated for 2 h to induce cellulaseactivity. Next, this cell suspension was concentrated to a 1/10volume ratio and was used to measure cellulase activity. After 50�l of the Pc cell suspension was mixed with 50 �l of the 4-MUFCsolution (500 �M) in a sterilized 96-well plate (Costar 3603,Corning Inc.), the plate was incubated at 30°C for 1 h. Then, 100�l of glycine buffer (0.2 M, pH 10.0) was added, and thefluorescence intensity (ex/em � 365/455 nm) of 4-methylum-belliferone (4-MUF), a cleaved product, was measured imme-diately using a microplate reader (Safire2, Tecan Group Ltd). Acalibration curve was obtained for 4-MUF (Sigma-Aldrich), andthis curve was used to estimate the concentration of productscleaved from 4-MUFC by Pc cells.
Measurements of Glucose Concentration. In Fig. S8, glucose con-centrations were measured by using enzymatic reactions ofglucose oxidase (Amplex red glucose/glucose oxidase assay kit,Molecular Probes, Invitrogen). Av and Pc cells were enriched in1771 and TSB media, respectively, were washed twice withminimal buffer solution (see SI Text, Cultivation of Microor-ganisms and Culture Media), and then were resuspended at 106
cfu/ml in 14-ml test tubes (Falcon, Becton Dickinson Labware)with a 5-ml working volume of incubation medium. The incu-
bation media contained various concentrations of glucose (0, 1,5, 10, 50, and 100 �M) and corresponding levels of casamino acid(Acros) in the minimal buffer solution. The C/N ratio of glucoseto casamino acid was held constant at 10 (wt/wt). Both Av andPc cells were preincubated in incubation media with differentlevels of glucose and casamino acid for 6 h. During the 6-hpreincubation, fresh incubation medium supplemented withglucose and casamino acid was supplied to the culture byspinning down the Av or Pc cells, removing old medium, andadding fresh incubation medium every 2 h. After preincubation,old incubation media were replaced with the fresh incubationmedia containing different levels of glucose and casamino acidin the minimal buffer solution, and cells then were reincubatedfor 3 h. Samples of 1 ml were taken every 1 h and used formeasuring optical density at 600 nm (8453 UV-Visible Spectro-photometer, Agilent Technologies). Immediately after cells wereremoved from the sample solution by filtration (0.45 �m,Whatman), the culture filtrate was stored in a deep freezer at�70°C until the enzymatic assay was performed. To perform theassay, samples were thawed by incubating at room temperaturefor 30 min. Next, an aliquot was mixed with an equal volume ofglucose oxidase reagent containing Amplex Red reagent (10-acetyl-3,7-dihydroxyphenoxazine), horseradish peroxidase, andglucose oxidase in a sterilized 96-well plate (Costar 3603,Corning Inc. ). The plate then was incubated at 30°C for 30 min.The glucose concentration was estimated by the fluorescenceintensity (ex/em � 571/585 nm) of resorufin, a reaction product,using a microplate reader (Safire2, Tecan Group Ltd). Thecalibration curve was obtained for various concentrations ofglucose solution, and the curve then was used to estimate glucoseconcentration in the culture broth.
Acquisition of Fluorescence Intensity of Fluorescent Images. Theintensity profile of fluorescent images was obtained from linescans of each fluorescent image by using MetaMorph imagesoftware (Molecular Devices). In the overlaid fluorescent im-ages taken by an L5 filter and a TX2 filter, the fluorescenceintensity was obtained from each image, and then the intensityprofile was plotted in the same graph. The width of the line scanwas set to 10 pixels in all cases. The dark current of the camerawas subtracted from all f luorescent images. The dark current wasobtained by taking images without any specimen on the stage inan epi-f luorescence microscope (DMI 6000 B) using either an L5filter or a TX2 filter (Leica). The dark current was 201 for bothfilters.
Kim et al. www.pnas.org/cgi/content/short/0807935105 5 of 15
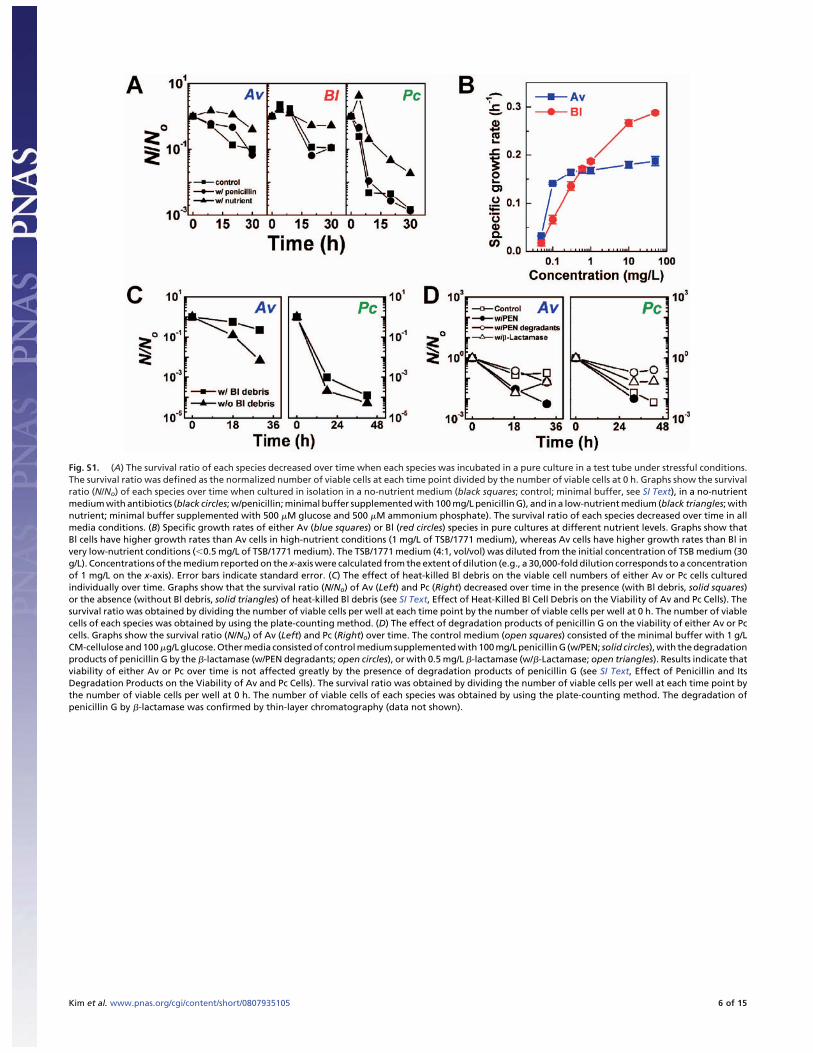
Fig. S1. (A) The survival ratio of each species decreased over time when each species was incubated in a pure culture in a test tube under stressful conditions.The survival ratio was defined as the normalized number of viable cells at each time point divided by the number of viable cells at 0 h. Graphs show the survivalratio (N/No) of each species over time when cultured in isolation in a no-nutrient medium (black squares; control; minimal buffer, see SI Text), in a no-nutrientmedium with antibiotics (black circles; w/penicillin; minimal buffer supplemented with 100 mg/L penicillin G), and in a low-nutrient medium (black triangles; withnutrient; minimal buffer supplemented with 500 �M glucose and 500 �M ammonium phosphate). The survival ratio of each species decreased over time in allmedia conditions. (B) Specific growth rates of either Av (blue squares) or Bl (red circles) species in pure cultures at different nutrient levels. Graphs show thatBl cells have higher growth rates than Av cells in high-nutrient conditions (1 mg/L of TSB/1771 medium), whereas Av cells have higher growth rates than Bl invery low-nutrient conditions ( 0.5 mg/L of TSB/1771 medium). The TSB/1771 medium (4:1, vol/vol) was diluted from the initial concentration of TSB medium (30g/L). Concentrations of the medium reported on the x-axis were calculated from the extent of dilution (e.g., a 30,000-fold dilution corresponds to a concentrationof 1 mg/L on the x-axis). Error bars indicate standard error. (C) The effect of heat-killed Bl debris on the viable cell numbers of either Av or Pc cells culturedindividually over time. Graphs show that the survival ratio (N/No) of Av (Left) and Pc (Right) decreased over time in the presence (with Bl debris, solid squares)or the absence (without Bl debris, solid triangles) of heat-killed Bl debris (see SI Text, Effect of Heat-Killed Bl Cell Debris on the Viability of Av and Pc Cells). Thesurvival ratio was obtained by dividing the number of viable cells per well at each time point by the number of viable cells per well at 0 h. The number of viablecells of each species was obtained by using the plate-counting method. (D) The effect of degradation products of penicillin G on the viability of either Av or Pccells. Graphs show the survival ratio (N/No) of Av (Left) and Pc (Right) over time. The control medium (open squares) consisted of the minimal buffer with 1 g/LCM-cellulose and 100 �g/L glucose. Other media consisted of control medium supplemented with 100 mg/L penicillin G (w/PEN; solid circles), with the degradationproducts of penicillin G by the �-lactamase (w/PEN degradants; open circles), or with 0.5 mg/L �-lactamase (w/�-Lactamase; open triangles). Results indicate thatviability of either Av or Pc over time is not affected greatly by the presence of degradation products of penicillin G (see SI Text, Effect of Penicillin and ItsDegradation Products on the Viability of Av and Pc Cells). The survival ratio was obtained by dividing the number of viable cells per well at each time point bythe number of viable cells per well at 0 h. The number of viable cells of each species was obtained by using the plate-counting method. The degradation ofpenicillin G by �-lactamase was confirmed by thin-layer chromatography (data not shown).
Kim et al. www.pnas.org/cgi/content/short/0807935105 6 of 15
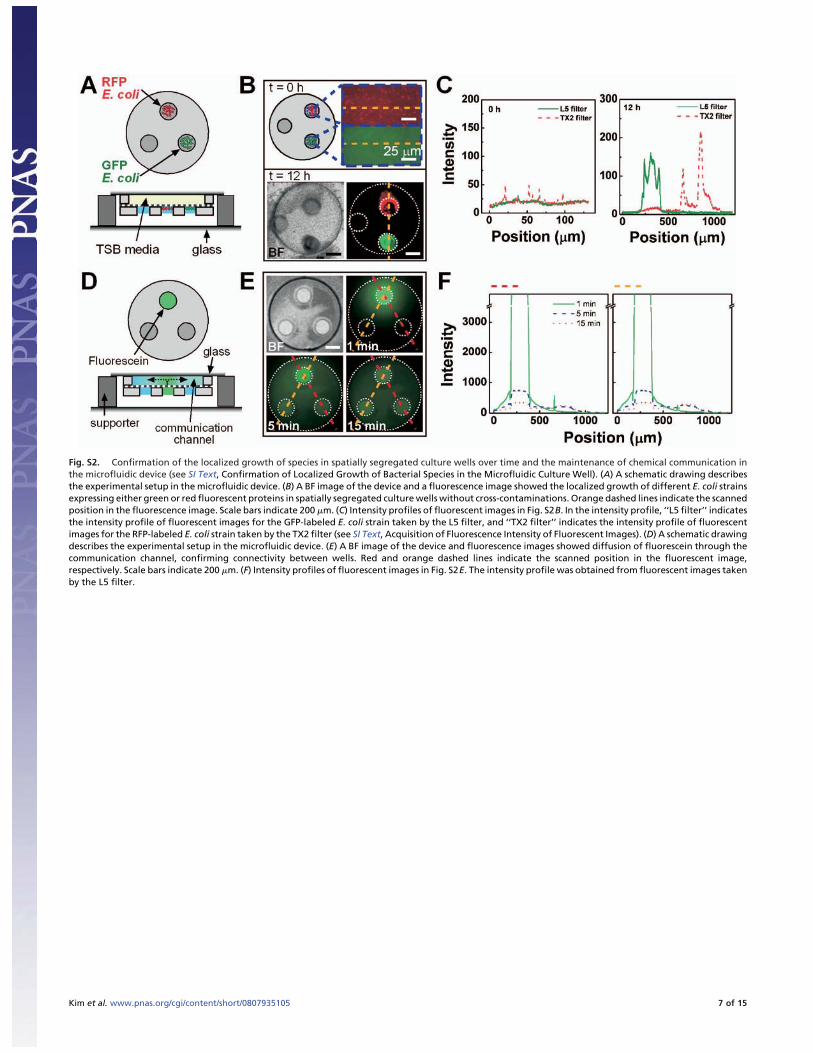
Fig. S2. Confirmation of the localized growth of species in spatially segregated culture wells over time and the maintenance of chemical communication inthe microfluidic device (see SI Text, Confirmation of Localized Growth of Bacterial Species in the Microfluidic Culture Well). (A) A schematic drawing describesthe experimental setup in the microfluidic device. (B) A BF image of the device and a fluorescence image showed the localized growth of different E. coli strainsexpressing either green or red fluorescent proteins in spatially segregated culture wells without cross-contaminations. Orange dashed lines indicate the scannedposition in the fluorescence image. Scale bars indicate 200 �m. (C) Intensity profiles of fluorescent images in Fig. S2B. In the intensity profile, ‘‘L5 filter’’ indicatesthe intensity profile of fluorescent images for the GFP-labeled E. coli strain taken by the L5 filter, and ‘‘TX2 filter’’ indicates the intensity profile of fluorescentimages for the RFP-labeled E. coli strain taken by the TX2 filter (see SI Text, Acquisition of Fluorescence Intensity of Fluorescent Images). (D) A schematic drawingdescribes the experimental setup in the microfluidic device. (E) A BF image of the device and fluorescence images showed diffusion of fluorescein through thecommunication channel, confirming connectivity between wells. Red and orange dashed lines indicate the scanned position in the fluorescent image,respectively. Scale bars indicate 200 �m. (F) Intensity profiles of fluorescent images in Fig. S2E. The intensity profile was obtained from fluorescent images takenby the L5 filter.
Kim et al. www.pnas.org/cgi/content/short/0807935105 7 of 15
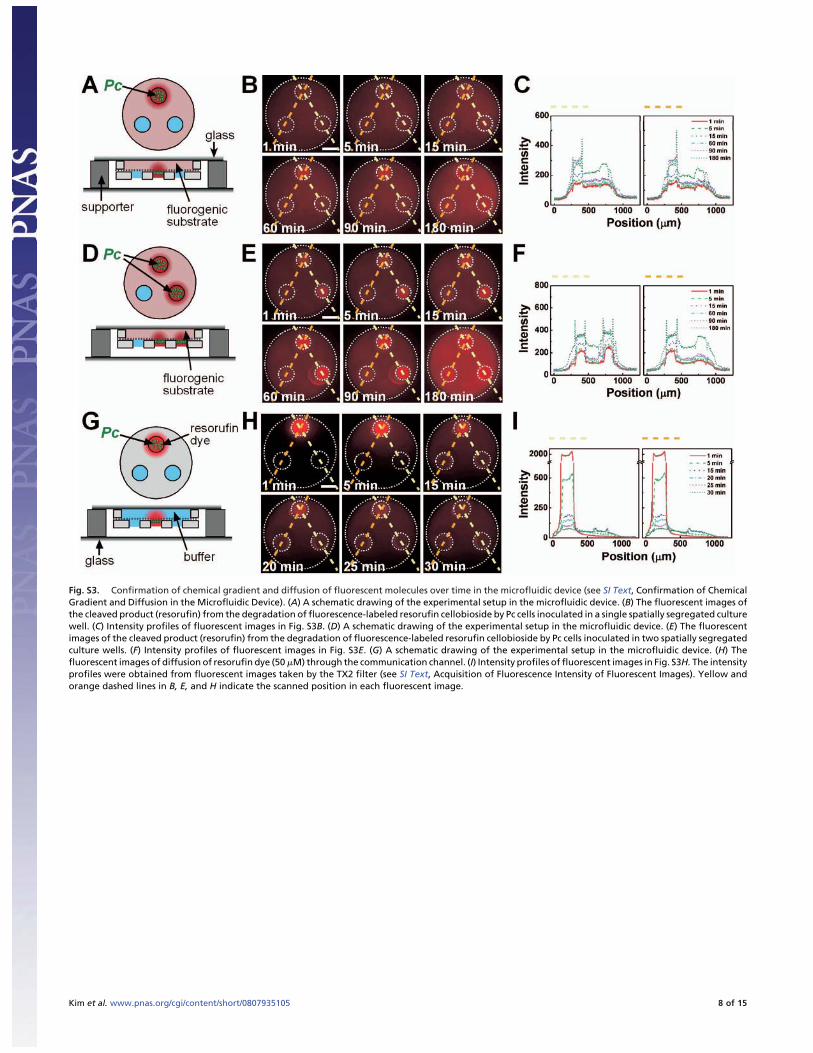
Fig. S3. Confirmation of chemical gradient and diffusion of fluorescent molecules over time in the microfluidic device (see SI Text, Confirmation of ChemicalGradient and Diffusion in the Microfluidic Device). (A) A schematic drawing of the experimental setup in the microfluidic device. (B) The fluorescent images ofthe cleaved product (resorufin) from the degradation of fluorescence-labeled resorufin cellobioside by Pc cells inoculated in a single spatially segregated culturewell. (C) Intensity profiles of fluorescent images in Fig. S3B. (D) A schematic drawing of the experimental setup in the microfluidic device. (E) The fluorescentimages of the cleaved product (resorufin) from the degradation of fluorescence-labeled resorufin cellobioside by Pc cells inoculated in two spatially segregatedculture wells. (F) Intensity profiles of fluorescent images in Fig. S3E. (G) A schematic drawing of the experimental setup in the microfluidic device. (H) Thefluorescent images of diffusion of resorufin dye (50 �M) through the communication channel. (I) Intensity profiles of fluorescent images in Fig. S3H. The intensityprofiles were obtained from fluorescent images taken by the TX2 filter (see SI Text, Acquisition of Fluorescence Intensity of Fluorescent Images). Yellow andorange dashed lines in B, E, and H indicate the scanned position in each fluorescent image.
Kim et al. www.pnas.org/cgi/content/short/0807935105 8 of 15
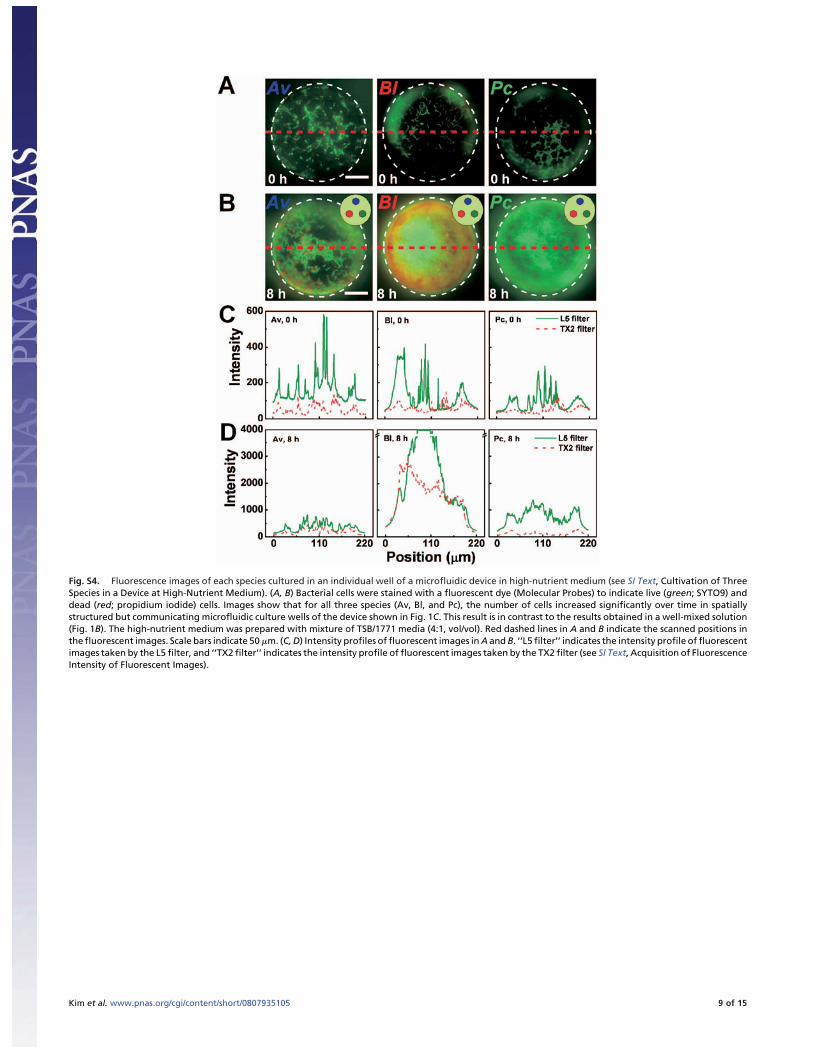
Fig. S4. Fluorescence images of each species cultured in an individual well of a microfluidic device in high-nutrient medium (see SI Text, Cultivation of ThreeSpecies in a Device at High-Nutrient Medium). (A, B) Bacterial cells were stained with a fluorescent dye (Molecular Probes) to indicate live (green; SYTO9) anddead (red; propidium iodide) cells. Images show that for all three species (Av, Bl, and Pc), the number of cells increased significantly over time in spatiallystructured but communicating microfluidic culture wells of the device shown in Fig. 1C. This result is in contrast to the results obtained in a well-mixed solution(Fig. 1B). The high-nutrient medium was prepared with mixture of TSB/1771 media (4:1, vol/vol). Red dashed lines in A and B indicate the scanned positions inthe fluorescent images. Scale bars indicate 50 �m. (C, D) Intensity profiles of fluorescent images in A and B. ‘‘L5 filter’’ indicates the intensity profile of fluorescentimages taken by the L5 filter, and ‘‘TX2 filter’’ indicates the intensity profile of fluorescent images taken by the TX2 filter (see SI Text, Acquisition of FluorescenceIntensity of Fluorescent Images).
Kim et al. www.pnas.org/cgi/content/short/0807935105 9 of 15
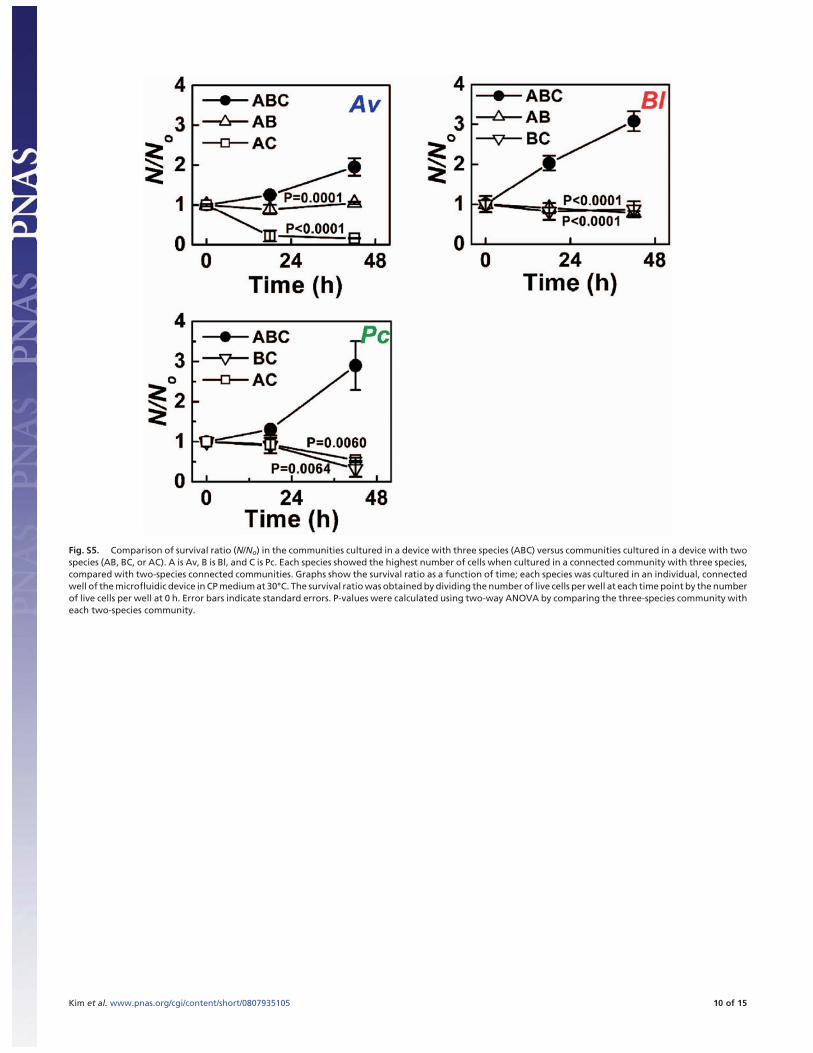
Fig. S5. Comparison of survival ratio (N/No) in the communities cultured in a device with three species (ABC) versus communities cultured in a device with twospecies (AB, BC, or AC). A is Av, B is Bl, and C is Pc. Each species showed the highest number of cells when cultured in a connected community with three species,compared with two-species connected communities. Graphs show the survival ratio as a function of time; each species was cultured in an individual, connectedwell of the microfluidic device in CP medium at 30°C. The survival ratio was obtained by dividing the number of live cells per well at each time point by the numberof live cells per well at 0 h. Error bars indicate standard errors. P-values were calculated using two-way ANOVA by comparing the three-species community witheach two-species community.
Kim et al. www.pnas.org/cgi/content/short/0807935105 10 of 15
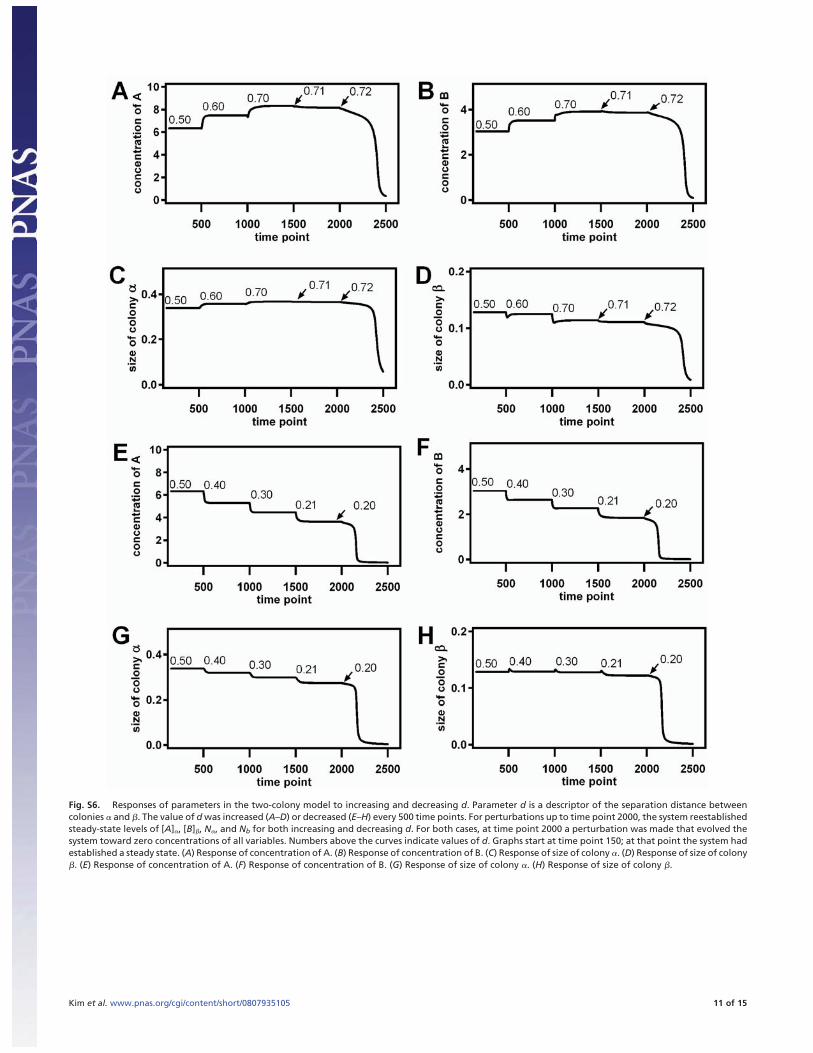
Fig. S6. Responses of parameters in the two-colony model to increasing and decreasing d. Parameter d is a descriptor of the separation distance betweencolonies � and �. The value of d was increased (A–D) or decreased (E–H) every 500 time points. For perturbations up to time point 2000, the system reestablishedsteady-state levels of [A]�, [B]�, N�, and Nb for both increasing and decreasing d. For both cases, at time point 2000 a perturbation was made that evolved thesystem toward zero concentrations of all variables. Numbers above the curves indicate values of d. Graphs start at time point 150; at that point the system hadestablished a steady state. (A) Response of concentration of A. (B) Response of concentration of B. (C) Response of size of colony �. (D) Response of size of colony�. (E) Response of concentration of A. (F) Response of concentration of B. (G) Response of size of colony �. (H) Response of size of colony �.
Kim et al. www.pnas.org/cgi/content/short/0807935105 11 of 15
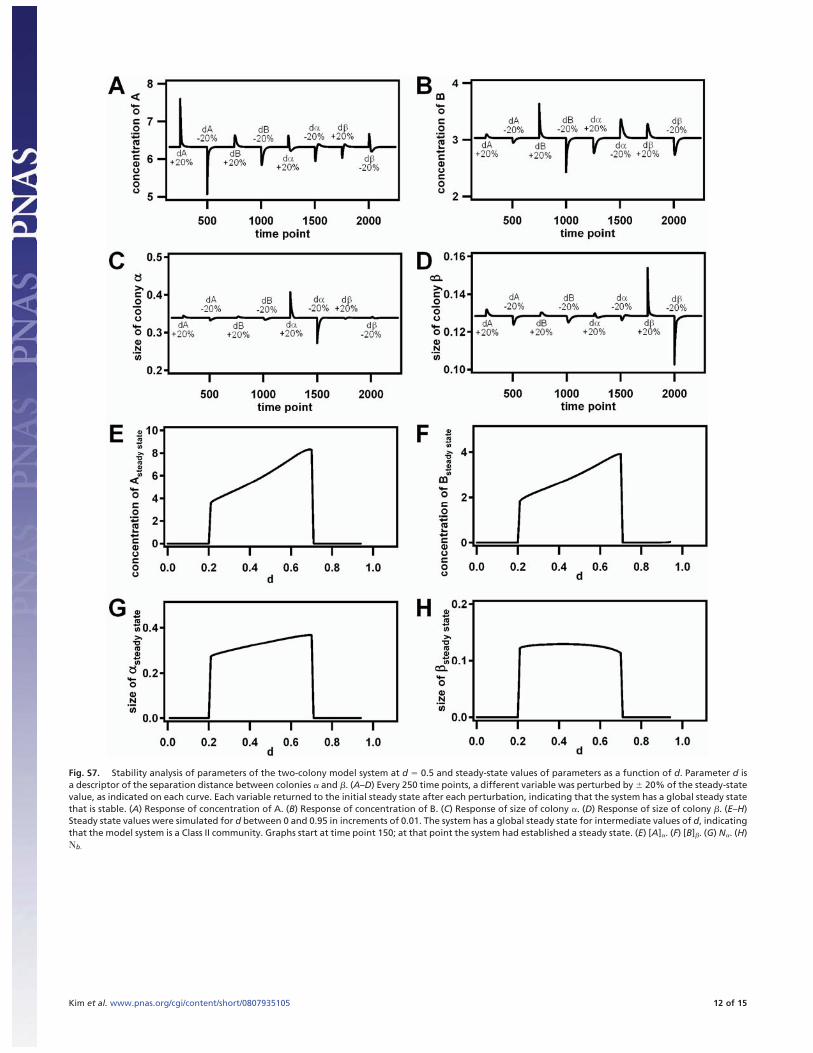
Fig. S7. Stability analysis of parameters of the two-colony model system at d � 0.5 and steady-state values of parameters as a function of d. Parameter d isa descriptor of the separation distance between colonies � and �. (A–D) Every 250 time points, a different variable was perturbed by � 20% of the steady-statevalue, as indicated on each curve. Each variable returned to the initial steady state after each perturbation, indicating that the system has a global steady statethat is stable. (A) Response of concentration of A. (B) Response of concentration of B. (C) Response of size of colony �. (D) Response of size of colony �. (E–H)Steady state values were simulated for d between 0 and 0.95 in increments of 0.01. The system has a global steady state for intermediate values of d, indicatingthat the model system is a Class II community. Graphs start at time point 150; at that point the system had established a steady state. (E) [A]�. (F) [B]�. (G) N�. (H)�b.
Kim et al. www.pnas.org/cgi/content/short/0807935105 12 of 15
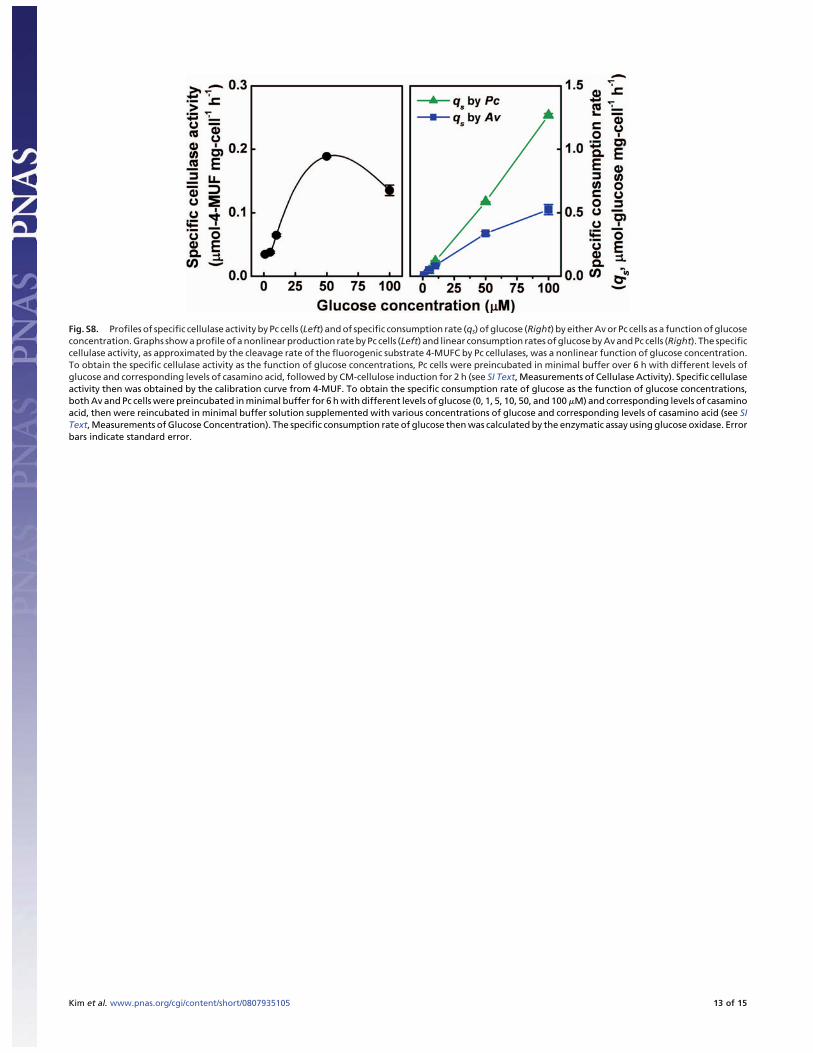
Fig. S8. Profiles of specific cellulase activity by Pc cells (Left) and of specific consumption rate (qs) of glucose (Right) by either Av or Pc cells as a function of glucoseconcentration. Graphs show a profile of a nonlinear production rate by Pc cells (Left) and linear consumption rates of glucose by Av and Pc cells (Right). The specificcellulase activity, as approximated by the cleavage rate of the fluorogenic substrate 4-MUFC by Pc cellulases, was a nonlinear function of glucose concentration.To obtain the specific cellulase activity as the function of glucose concentrations, Pc cells were preincubated in minimal buffer over 6 h with different levels ofglucose and corresponding levels of casamino acid, followed by CM-cellulose induction for 2 h (see SI Text, Measurements of Cellulase Activity). Specific cellulaseactivity then was obtained by the calibration curve from 4-MUF. To obtain the specific consumption rate of glucose as the function of glucose concentrations,both Av and Pc cells were preincubated in minimal buffer for 6 h with different levels of glucose (0, 1, 5, 10, 50, and 100 �M) and corresponding levels of casaminoacid, then were reincubated in minimal buffer solution supplemented with various concentrations of glucose and corresponding levels of casamino acid (see SIText, Measurements of Glucose Concentration). The specific consumption rate of glucose then was calculated by the enzymatic assay using glucose oxidase. Errorbars indicate standard error.
Kim et al. www.pnas.org/cgi/content/short/0807935105 13 of 15
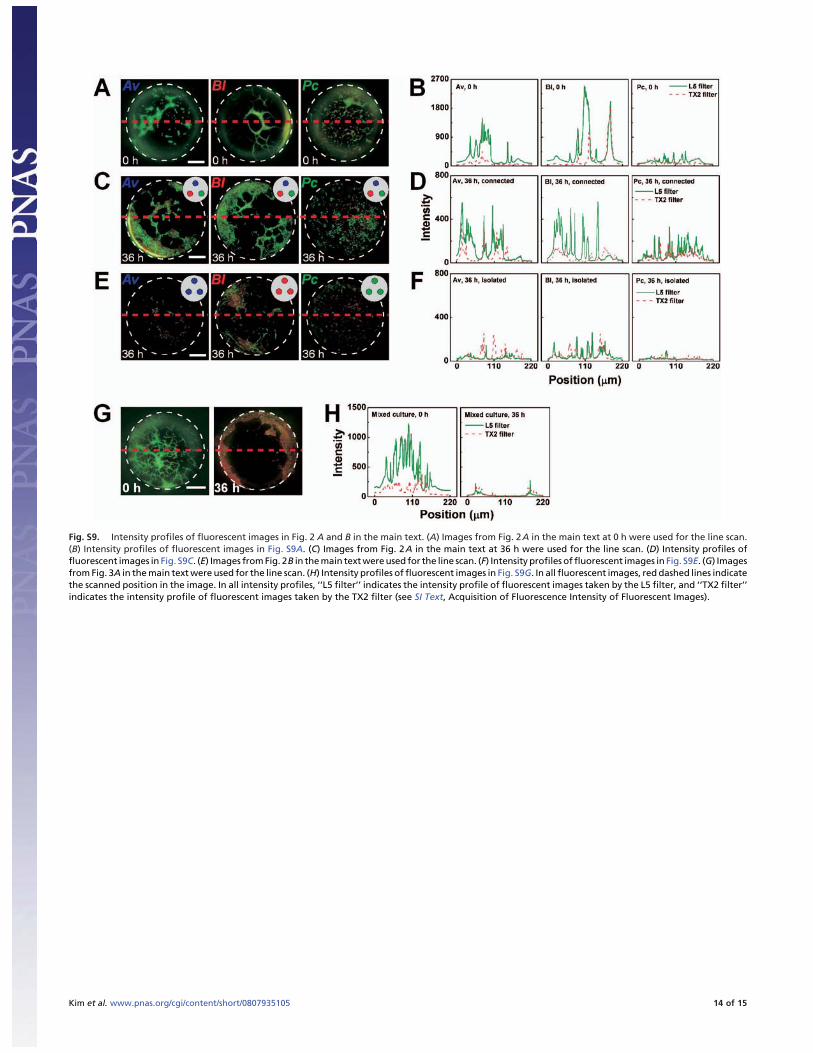
Fig. S9. Intensity profiles of fluorescent images in Fig. 2 A and B in the main text. (A) Images from Fig. 2A in the main text at 0 h were used for the line scan.(B) Intensity profiles of fluorescent images in Fig. S9A. (C) Images from Fig. 2A in the main text at 36 h were used for the line scan. (D) Intensity profiles offluorescent images in Fig. S9C. (E) Images from Fig. 2B in the main text were used for the line scan. (F) Intensity profiles of fluorescent images in Fig. S9E. (G) Imagesfrom Fig. 3A in the main text were used for the line scan. (H) Intensity profiles of fluorescent images in Fig. S9G. In all fluorescent images, red dashed lines indicatethe scanned position in the image. In all intensity profiles, ‘‘L5 filter’’ indicates the intensity profile of fluorescent images taken by the L5 filter, and ‘‘TX2 filter’’indicates the intensity profile of fluorescent images taken by the TX2 filter (see SI Text, Acquisition of Fluorescence Intensity of Fluorescent Images).
Kim et al. www.pnas.org/cgi/content/short/0807935105 14 of 15

Table S1. Values and general units of the constants used for simulations
Constant Value General Unit Constant Value General Unit
k1 18 (s � colony size)�1 k10 4 (s � colony size)�1
k2 1 M3 k� 1 colony sizek3 1 M3 k� 1 colony sizek4 0.5 (s � colony size)�1 k�,A 3 Mk5 20 (s � colony size)�1 k�,B 2 Mk6 2 M3 k�,A 3 Mk7 2 M3 k�,B 4 Mk8 0.5 (s � colony size)�1 ma 0.4 s�1
k9 9 (s � colony size)�1 mb 0.5 s�1
Kim et al. www.pnas.org/cgi/content/short/0807935105 15 of 15