Embed Size (px)
Citation preview
Supporting InformationAlbayram et al. 10.1073/pnas.1016442108SI Materials and MethodsTissue Preparation.Male and female animals (2–3 each) from eachage group and genotype were killed by CO2 inhalation, de-capitated, and their brains were isolated. Brains were snap fro-zen in dry ice-cooled isopentane and stored in −80 °C untilfurther processing. Next, frozen brain was serially sliced in 18-μmcoronal slices in a cryostat (Leica CM 3050; Leica Microsystems)and mounted onto silanized glass slides.
Immunofluorescence Staining. For immunofluorescence staining,the tissue sections were fixed after drying in 4% formaldehydedissolved in 0.1 M (pH 7.3) PBS. After rinsing, the slides wereincubated in PBS containing 0.5% Triton X-100 for 1 h and nextin PBS containing 3%BSA for 2 h. The slides were washed in PBSthree times for 5 min between each incubation phase. Afterblocking nonspecific binding sites with incubation in the BSAsolution, the slices were first kept in 4 °C for 48 h in rabbit anti-Iba1 antibody solution (Wako Chemicals; 1:100 diluted in 3%BSA containing PBS), or 24 h in mouse anti-GFAP antibodysolution (Sigma-Aldrich; 1:200 diluted in 3% BSA/PBS). After-ward, slides were washed three times for 10 min in PBS and alsobetween the following incubations. After washing, the slides wereincubated in the respective secondary antibody solution for 1 h inroom temperature, which was Alexa 488-conjugated donkeyantigoat (Jackson; 1:500 diluted) or Alexa 488-conjugated don-key antirabbit IgG (Invitrogen; 1:500 diluted). Neurons were vi-sualized using Alexa Fluor 488-conjugated mouse anti-NeuN,antibody solution (Invitrogen; 1:250 diluted in 3% BSA contain-ing PBS). The incubation time was 24 h. After staining, the sliceswere washed and mounted with Fluoromount G (Southern Bio-tech) and covered. For quantitative analysis of astrocytes density,fluorescence images were acquired using a Zeiss Axiovert 200 Mfluorescent microscope (Carl Zeiss Microimaging) with 40×, 1.3NA oil-immersion lens. GFAP-immunoreactive astrocytes wereanalyzed (Image J software; 1.42q) using the area fraction tech-nique (1).
Stereological Quantification. Regions of interest (striatum, retro-splenial granular cortex, cingulate cortex, and hippocampus) wereidentifiedby theanatomical boundariesusing themousebrainatlas(2) as described (3–5). For stereological quantification, every 10thslice of the region of interest was selected and stained. We ana-lyzed in this way 10–15 sections per region of interest. Analysiswas performed with Stereo Investigator software (MBF Bio-science) using a motorized x-y-z stage coupled to a Zeiss Axiovert200 M fluorescent microscope equipped with a Zeiss ApoTome(Carl Zeiss Microimaging) over the concerned brain regions (6,7). The total number of Iba1-immunoreactive microglia andNeuN-positive neurons were estimated by using the optical frac-tionator technique as described previously (8, 9).
Quantitative Morphological Analyses of Microglial Cells. The mor-phology of Iba1-immunopositive microglial cells was assessedunder high magnification using 63×, 1.4 NA oil-immersion lens.Resting form of microglial cells were identified as Iba1-immu-noreactive cells with small rod-shape cell bodies (5–7 μm in di-ameter) and long ramified proximal processes (0.5–1 μm thick atthe most proximal portion of the process) (Fig. S2A). Activatedforms of microglial cells were determined as Iba1-immunoreac-tive cells with larger cell bodies (11–16 μm in diameter) andshorter and thicker proximal processes (Fig. S2A) (10, 11).
Counting of the number of microglia with different morphologywas done using the optical fractionator method in randomlyselected counting frames (12–14).
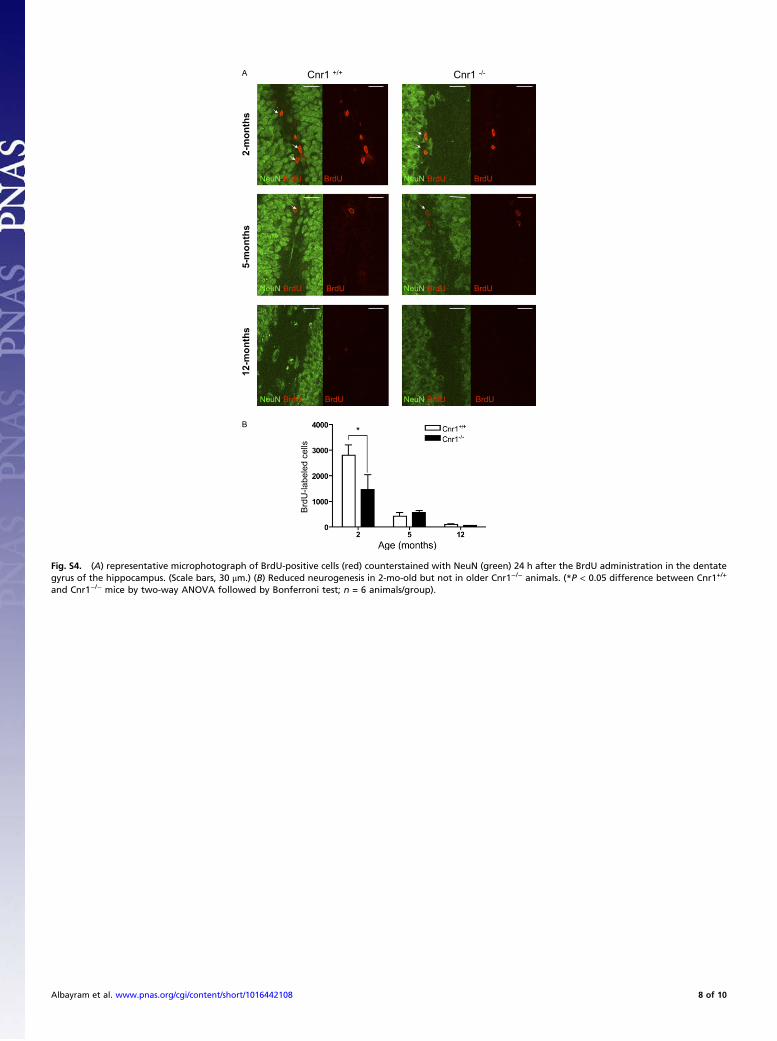
BrdU Treatment and Immunofluorescence Staining. To label dividingcells, the mitotic marker 5-bromo-2′-deoxyuridine (BrdU, 50 mg/kg; Sigma) was administered four times with 2-h intervals to theanimals (2-, 5-, and 12-mo-old Cnr1+/+ and Cnr1−/− littermates;n = 6 each). Mice were killed with CO2 24 h after the last in-jection and transcardially perfused with 4% paraformaldehyde inPBS to fix the brain tissue for further processing. The brains werethen cryoprotected with 10% sucrose for 24 h and frozen in dryice cooled isopentane. The brains were then embedded in TissueTek, and serial coronal free-floating sections (40 μm) were cutthrough the rostrocaudal axis of the hippocampus according tothe mouse brain atlas (2) between the coordinates: bregma −0.94to −3.34 mm using a cryostat and embedded in cryoprotectionsolution (15). Every sixth slide was stained with anti-BrdU ratIgG monoclonal antibody (1:500; Abcam) and Alexa Fluor 594-conjugated secondary antibody (goat antirat IgG, 1:500; In-vitrogen). The sections were counterstained with a mousemonoclonal antibody against NeuN (Alexa Fluor 488 conju-gated, 1:250; Invitrogen). The dentate gyrus area was determinedwith 10× objective, and BrdU-positive cells were counted in thesubgranular zone of the dentate gyrus in six sections per hip-pocampus using a 40× objective. The number of positive cellswas then multiplied by the factor of 6, because every sixth sectionwas used for the analysis.
Timm Staining. Twelve-month-old Cnr1+/+ and Cnr1−/− litter-mates (n = 3 each) were killed by CO2 inhalation, decapitated,and their brains were rapidly isolated. Brains were cut witha Vibratom, and 400-μm coronal slices containing the hippo-campus were collected in ice-cold Ringer solution. The sliceswere soaked for 10 min in a solution containing 1.19% NaH2PO4and 1.17% Na2S, fixed in glutaraldehyde solution and keptovernight at 4 °C in 30% sucrose solution. Twenty-micrometerslices were cut in a cryostat in the next day and mounted ontosilanized glass slides. After washing in 0.15 M PBS (pH 7.4)slides were placed in a developing solution (2.55% citric acid,3.55% sodium citrate, 1.7% hidrochinon, 0.095% AgNO3 30%gum arabic in distilled water) for 1 h in a dark container (16).Next, slides were washed in water and the reaction was stopped,placing the slices into a 1% Na2S2O3 solution. After washing, theslices were counterstained with toluidin blue, dehydrated withincreasing concentration of ethanol, mounted, and covered.Images with 50× magnification were created using an Axioplan2microscope (Zeiss) and 3-CCD (JVC) camera and the ratio ofstained area within the hippocampus was measured in six sec-tions per mouse (Image J; 1.42q). Genotypes were comparedusing unpaired Student’s t test.
Monitoring of Cortical EEG Activity and Behavior. We recordedcortical EEG from freely moving animals using a telemetric EEG/video monitoring system (DSI). In EEG experiments, we com-pared Cnr1+/+ with Cnr1−/− (n = 6 each) littermates at 2–3 moof age. Behavior of the animals and EEG activities were moni-tored continuously over 19 d.The EEG transmitter and connections between electrodes and
transmitter were placed on the right abdominal side s.c. underdeep anesthesia [5.8 mg/kg xylazine intramuscular (i.m.) (Rom-pun; Bayer) plus 113 mg/kg ketamine i.m. (Ketavet; Pfizer)]. The
Albayram et al. www.pnas.org/cgi/content/short/1016442108 1 of 10
electrodes are positioned at the stereotaxic coordinates ante-rioposterior −1.5/+1.5 and lateral −1.5 in millimeters relative tobregma (17, 18) contacting the cerebral cortex without injuringthe dura and then fixed with dental cement. After implantation,all mice were placed in individual cages and their behavior wasrecorded by a video system continuously. The animals receivedanalgetic treatment for 2 d (5 mg/kg carprofen, s.c. twice per day;rimadyl; Pfizer) after the surgery as well as antibiotic treatmentthroughout the monitoring period (5 mg/kg, per os; enrofloxacin,baytril oral; Bayer). EEG recording with a sampling rate of 1kHz was performed for 19 d, when mice have been recoveredfrom the surgery and stable EEG signals are obtained. The EEGdata were analyzed using custom-programmed EEG analysissoftware (Neuroscore; DSI). Seizure detection was definedthrough specific parameters. We used the dynamic spike de-tection with the minimum value of 100 μV and the maximum ratioof 2 and a threshold ratio of 1.4. The spikes were defined as fol-lows: spike duration from 1ms to 500ms, spike interval from 0.005s to 0.5 s with train duration of at least 15 s. These parameters areknown to detect pathologically epileptiform activity (19). Smallspike trains were defined in shorter discharges between 5 and 15 s.These events were characterized in spindle-shaped activity with-out any phenotypic alteration in video observation. To analyze theinfluence of stress on the appearance of epileptic-like events weput two mice of the same sex together for 10 min on days 7 and14 after implantation. Small spike trains were defined in shorterdischarges between 5 and 15 s as event. These events were char-acterized in spindle-shaped activity without any phenotypic al-teration in video observation. Mean and SD of the duration, dailyfrequency, and spikes in these events were calculated, and geno-types were compared using unpaired Student’s t test.
CNS Mononuclear Cell Isolation. Mice were anesthetized, perfusedwith 20 mL of ice-cold PBS, and killed before brain tissue sampleswere collected. Tissue samples were homogenized by two steps ofdigestion with collagenase/dispase (Roche) and DNase I (Roche)at 37 °C for 45 min each, and mononuclear cells were isolatedfrom the 30%/70% interface of a Percoll gradient after centri-fugation at 900 g for 25 min at room temperature (19). Followingcollection, cells were stored on ice for further use.
Flow Cytometry. Fluorescence staining of cell samples was per-formed as described before (20). FITC-, PE-, or Alexa 647-labeled monoclonal antibodies were used for surface staining ofhematopoietic cells (anti-mCD45), of macrophages/microglialcells (anti-mCD11b), or costimulatory molecules (anti-mCD40).Fc receptors were blocked with antibodies against mCD16/CD32(all purchased from BD Biosciences). Samples were acquired us-ing a Canto II flow cytometer and acquired data analyzed usingthe flow cytometry software, FlowJo (TreeStarTM). For deter-mination of cell surface expression of the costimulatory moleculeCD40 onmacrophages/microglial cells, isolatedmononuclear cellswere pregated by a life gate for living cells and subsequently for theexpression of CD45high/CD11b+ or CD45low/CD11b+, categorizedas myeloid lineage-derived macrophages or microglial cells, re-spectively. Mean and SE of the percentage of CD40 expressingmicroglia was calculated and genotypes were compared withunpaired Student’s t test.
Hippocampal Expression of IL-1β, IL-6, and TNF. Hippocampus wasisolated from the brain of 2- and 12-mo-old mice from each ge-notype (n = 4–8). Total RNA was extracted from tissues usingRNeasy micro kit from Qiagen. Purity and RNA concentrationwas evaluated by optical density (OD) measurements at 260 and280 nm with ND-1,000 spectrometer (Thermo Scientific). cDNAswere synthesized using the SuperScript First-Strand synthesissystem for RT-PCR kit (Invitrogen) with random hexamer pri-mers. Total RNA (0.6 μg) was used as starting material for cDNA
synthesis. To remove any genomic DNA contamination, the RNAwas digested with RNase-free DNase I. Differences in mRNAexpression were determined in triplicate by customTaqManGeneExpression assays (Applied Biosystems; interleukin-6 (IL-6):Mm00446190_m1; interleukin 1β (IL-1β): Mm01336189_m1; andtumor necrosis factor (TNF):Mm00443258_m1. The 3-phosphatedehydrogenase (GAPDH): Mm01334042_m1 was used as anendogenous housekeeping control to standardize the amount oftarget cDNA. Each 20-μL reaction consisted of 1× TaqMan uni-versal PCR Master Mix (Applied Biosystems), 2-μL cDNA, and1× Custom TaqMan Gene Expression assay. Samples were pro-cessed in a 7500 Real-Time PCR Detection system (Applied Bi-osystems) with the following cycling parameters: 95 °C for 10 min(hot start), 40 cycles at 95 °C for 15 s (melting), and 60 °C for 1min(annealing and extension). Analysis was performed using the 7500Sequence Detection software version 2.2.2 (Applied Biosystems)and data were obtained as function of threshold cycle (CT). Rel-ative quantitative gene expression was calculated with the 2−ΔΔCTmethod (21). Briefly: ΔCT was calculated for each assayed sampleby subtracting CT of the housekeeping gene from the CT of thegene of interest. Mean 2−ΔCT values of 2-mo-old wild-type ani-mals were chosen as reference sample and subtracted from 2−ΔCT
of the other groups (Δ ΔCT). Experimental mRNA abundancerelative to control mRNA abundance was finally calculated.
Morris Water Maze (MWM). The spatial learning and memoryabilities of mice were assessed in the MWM task (22, 23). Acircular pool (1.2 m in diameter and 0.6 m in height) made ofblack PVC was used. The tank was filled with water (depth, 30cm; temperature, 24 °C), which was made opaque with whitepaint. A platform of transparent Plexiglas cylinder (15 cm talland 8 cm in diameter) covered with a white aluminum perforatedplate (14 cm in diameter) was placed inside the tank ∼1.5 cmunder the water level and served as an escape platform. The poolwas located in a closed room containing numerous extramazevisual cues. Additionally, plastic items with different shape andcolor were attached to the wall of the tank and served as addi-tional cues. A camera was fixed on the ceiling above the watermaze and the video signal was transmitted to a cassette recorderand to a computer. An automatic tracking system (Videomot2;TSE-Systems) analyzed the swim path and calculated escapelatencies, total path length, and swim speed.In the first phase of the Morris water maze test, the place
learning ability was compared between age groups and genotypes.Animals were tested for four consecutive sessions daily over 6 d.The hidden platform remained at a fixed spatial location for theentire acquisition period. The mice were released facing the wallof the maze at each session of the trial. Four points equallydistributed along the wall served as starting points (designated asN, S, E, and W) and divided the area into four quadrants. In thefirst 2 d, the animals were started from the same point (W) foreach session. From day 3, the animals were released from the W,E, S, and W points in the consecutive sessions. A trial endedwhen the mouse reached the hidden platform and managed toremain there for 5 s. If the animals failed to locate the platformwithin 70 s, the mouse was guided gently by hand to the platformand the trial was recorded as an escape failure with an arbitrarylatency of 70 s. Mice were allowed to remain on the platform for30 s before removing them from the tank. The mouse was left for2 min in a dark dry container between the sessions. In the secondphase, between days 7 and 9, the flexibility of the spatial memorywas tested placing the escape platform in a new location. Testingwas performed as at day 3–6 in phase 1. Experiments took placeduring the active phase for the animals between 10:00 AM and2:00 PM. Data were analyzed using three-way ANOVA (geno-type and sex as between and trials as within factor) separately forthe age groups, followed by Bonferroni’s t test.
Albayram et al. www.pnas.org/cgi/content/short/1016442108 2 of 10
Y-Maze. The apparatus consisted of three 60-cm-long white armsforming a Y-shape. The illumination was set to 20 lx at the floorlevel. Mice were placed in one of the arms and allowed to ex-plore for 10 min. The path was recorded by a video camera, thenumber and sequence of arm entries was analyzed by an auto-matic system (Videomot2; TSE-Systems). Working memory wasassessed as the percentage of spontaneous alternations, calcu-lated as the number of alternations (entering into three differentarms consecutively) divided by the total possible alternations(number of arm entries minus 2) and multiplied by 100.
SI ResultsNumber of Resting and Activated Forms of Iba1-ImmunoreactiveMicroglial Cells in Cnr1−/− and Cnr1+/+ Animals. Iba1-immunoreac-tive cells with different morphology were observed throughout thehippocampus of 2-, 5-, and 12-mo-old Cnr1 receptor-null mutants(Cnr1−/−) and their control (Cnr1+/+) littermates (24). Iba1-immunoreactive cells with both resting and activated morphol-ogy were detected in both strains and age groups.Detailed stereological analysis within the hippocampus revealed
that in the CA1 region, estimated numbers of activated microglialcells were influencedby age (F2,20= 24.57;P< 0.001) and genotype(F1,20 = 41.81; P < 0.001) of the animals. The age-related increasein the number of activated form of microglia was significantlyenhanced in Cnr1−/− animals (genotype × age interaction, F2,20 =28.43; P < 0.001). In the CA3 region and in the dentate gyrus, wefound a similarly exacerbated increase in the number of activatedmicroglia in Cnr1−/− mice. For the CA3 region: genotype effect,F1,20 = 28.00; P < 0.001; age effect, F2,20 = 33.34; P < 0.001; andinteraction, F2,20 = 21.45; P < 0.001. For the dentate gyrus: ge-notype effect, F1,20 = 13.42; P < 0.001; age effect, F2,20 = 23.32;P < 0.001; interaction, F2,20 = 9.67; P < 0.001 (Fig. S2C).The resting form of microglia did not differ between the
genotypes and did not show an age-dependent change. CA1region: age effect, F2,20 = 0.26; not significant (NS); genotypeeffect, F1,20 = 0.03; NS; and interaction, F2,20 = 1.48; NS. CA3region: age effect, F2,20 = 0.05; NS; genotype effect, F1,20 = 4.16;NS; and interaction, F2,20 = 1.08; NS. Dentate gyrus: age effect,F2,20 = 0.33; NS; genotype effect, F1,20 = 0.21; NS; and in-teraction, F2,20 = 0.12; NS.
Number of Resting and Activated Forms of Iba1-ImmunoreactiveMicroglial Cells in GABA-Cnr1−/− and Glu-Cnr1−/− Animals. Iba1-im-munoreactive cells with different morphology were observedthroughout the hippocampus of 12-mo-old conditional knockoutanimals lacking Cnr1 receptors either in forebrain glutamatergic(Glu-Cnr1−/−) or GABA-ergic (GABA-Cnr1−/−) neurons (25).Iba1-immunoreactive cells with both resting and activated mor-phology were detected in both strains and age groups.Detailed stereological analysis within the three hippocampal
regions revealed that the numbers of activated microglial cellswere significantly elevated in CA1: t4 = 8.21, P < 0.01; CA3: t4 =4.65, P < 0.01; and DG: t4 = 7.41, P < 0.01 regions in GABA-Cnr1−/− but not in Glu-Cnr1−/− animals (CA1: t4 = 0.25, NS;CA3: t4 = 1.36, NS; and DG: t4 = 1.08, NS) compared with wild-type littermates. However, quantitative stereological estimationof resting microglial densities was comparable in both genotypescompared with their wild-type littermates.
GABA-Cnr1−/− (CA1: t4 = 0.56, NS; CA3: t4 = 2.27, NS; andDG: t4 = 0.68, NS).Glu-Cnr1−/− (CA1: t4 = 0.92, NS; CA3: t4 = 0.05, NS; andDG: t4 = 0.08, NS).
Detailed Statistical Analysis of Astrocyte in the Constitutive Cnr1Knockout Mice. Astrocytes were present in very low density out-side the hippocampus; therefore, we restricted the numericalanalysis to this brain area. In the CA1 region, astrocyte densitywas significantly influenced by the genotype (F1,165 = 46.29; P <0.001) and age (F2,165 = 277.1; P < 0.001) of the animals. Theage-related increase in astrocyte densities was significantly ex-acerbated in Cnr1−/− animals (genotype × age interaction, F2,165 =24.53; P < 0.001).In the CA3 region, astrocyte densities were influenced by the
genotype (F1,164 = 25.32; P < 0.001) and age (F2,164 = 25.27; P <0.001) of the animals. The age-dependent increase in astrocytenumbers was more intensive in the Cnr1−/− animals (genotype ×age interaction, F2,164 = 12.03; P < 0.001).In the dentate gyrus the astrocyte densities significantly differed
between the genotypes (F1,166 = 5.164; P < 0.05) and age groups(F2,166 = 38.38; P < 0.001) of the animals. The age-dependentincrease in astrocyte numbers was similar between the genotypes(genotype × age interaction, F2,166 = 1.507; NS).
Morris Water Maze. In the first phase of the test, the time necessaryto find the hidden platform, i.e., the escape latencies were sig-nificantly lower in young Cnr1−/− animals than in age-matchedwild-types (genotype effect, F1,15 = 7.798; P < 0.05) and they alsolearned the task quicker (genotype × trial interaction, F5,85 =4.315; P < 0.01). In mature animals, however, genotype had noeffect on the performance of the animals (genotype effect, F1,15 =2.361; NS and genotype × trial interaction, F5,85 = 0.651; NS). OldCnr1−/− mice on the other hand needed more time to find theplatform than Cnr1+/+ animals (genotype effect, F1,15 = 12.36;P < 0.01) and they also learned the task slower (genotype × trialinteraction, F5,85 = 2.398; P < 0.05). The inferior performance ofold Cnr1−/− animals is not the result of a motor deficit, becausethe swim speed was even higher in the null mutants than in thewild-type animals (genotype effect, F1,17 = 5.840; P < 0.05). Inother age groups, the swim speed did not differ between thegenotypes (mature, genotype effect, F1,17 = 0.360; NS and ge-notype effect in young animals, F1,15 = 1.220; NS). Analysis of thelength of the path the animal swam until finding the platform gavesimilar results as the analysis of the escape latencies. Youngnull mutants had to swim less distance (genotype effect, F1,17 =7.614; P < 0.05) and learned quicker (genotype × trial interaction,F5,85 = 4.039; P< 0.01) than their wild-type littermates. There wasno difference between the performance of mature Cnr1−/− andCnr1+/+ mice (genotype effect, F1,17 = 3.267; NS and genotype ×trial interaction, F5,85 = 1.293; NS). Old Cnr1−/− animals on theother hand had to swim longer to find the platform (genotypeeffect, F1,17 = 11.64; P < 0.01) and learned slower than the wild-type mice (genotype × trial interaction, F5,85 = 4.798; P < 0.001).In the second, reversal phase of the test the animals had to learn
a new position of the platform. This phase generally providedsimilar results to the first phase, but here even mature Cnr1−/−
animals showed learning deficits. Young Cnr1−/− animals neededless time and mature and old more time to find the relocatedplatform than their wild-type littermates (genotype effect young,F1,17 = 5.087; P < 0.05; mature, F1,15 = 8.034; P < 0.05; and old,F1,18 = 35. 67; P < 0.001). The swim speed did not differ betweenthe genotypes in this phase of the test (genotype effect young,F1,17 = 0.150; NS; mature, F1,15 = 0.860; NS; and old, F1,18 =0.020; NS). The length of the path the animal swam until findingthe platform was significantly longer in old null mutants (geno-type effect, F1,18 = 58. 21; P < 0.001) but was not different be-tween the genotypes in young or mature animals (genotypeeffect young, F1,16 = 2.798; NS; and mature, F1,13 = 3.794; NS).
1. Abdel-Rahman A, Rao MS, Shetty AK (2004) Nestin expression in hippocampalastrocytes after injury depends on the age of the hippocampus. Glia 47:299–313.
2. Paxinos G, Franklin KBJ (2001) The Mouse Brain in Stereotaxic Coordinates (Academic,London).
Albayram et al. www.pnas.org/cgi/content/short/1016442108 3 of 10
3. Mouton PR, et al. (2002) Age and gender effects on microglia and astrocyte numbersin brains of mice. Brain Res 956:30–35.
4. Ongür D, Drevets WC, Price JL (1998) Glial reduction in the subgenual prefrontalcortex in mood disorders. Proc Natl Acad Sci USA 95:13290–13295.
5. Woodruff-Pak DS, et al. (2010) Differential effects and rates of normal aging incerebellum and hippocampus. Proc Natl Acad Sci USA 107:1624–1629.
6. Long JM, et al. (1998) Stereological estimation of total microglia number in mousehippocampus. J Neurosci Methods 84:101–108.
7. West MJ, Ostergaard K, Andreassen OA, Finsen B (1996) Estimation of the number ofsomatostatin neurons in the striatum: An in situ hybridization study using the opticalfractionator method. J Comp Neurol 370:11–22.
8. Bondolfi L, et al. (2002) Amyloid-associated neuron loss and gliogenesis in theneocortex of amyloid precursor protein transgenic mice. J Neurosci 22:515–522.
9. Grathwohl SA, et al. (2009) Formation and maintenance of Alzheimer’s disease beta-amyloid plaques in the absence of microglia. Nat Neurosci 12:1361–1363.
10. Ladeby R, et al. (2005) Microglial cell population dynamics in the injured adult centralnervous system. Brain Res Brain Res Rev 48:196–206.
11. Nimmerjahn A, Kirchhoff F, Helmchen F (2005) Resting microglial cells are highlydynamic surveillants of brain parenchyma in vivo. Science 308:1314–1318.
12. Damani MR, et al. (2011) Age-related alterations in the dynamic behavior ofmicroglia. Aging Cell 10:263–276.
13. Hasegawa-IshiiS, etal. (2011)Morphological impairments inmicrogliaprecedeage-relatedneuronal degeneration in senescence-accelerated mice. Neuropathology 31:20–28.
14. Kadowaki T, Nakadate K, Sakakibara S, Hirata K, Ueda S (2007) Expression of Iba1protein in microglial cells of zitter mutant rat. Neurosci Lett 411:26–31.
15. Mineur YS, Belzung C, Crusio WE (2007) Functional implications of decreases inneurogenesis following chronic mild stress in mice. Neuroscience 150:251–259.
16. Cobos I, et al. (2005) Mice lacking Dlx1 show subtype-specific loss of interneurons,reduced inhibition and epilepsy. Nat Neurosci 8:1059–1068.
17. Pitsch J, et al. (2007) Functional role of mGluR1 and mGluR4 in pilocarpine-inducedtemporal lobe epilepsy. Neurobiol Dis 26:623–633.
18. Becker AJ, et al. (2008) Transcriptional upregulation of Cav3.2 mediatesepileptogenesis in the pilocarpine model of epilepsy. J Neurosci 28:13341–13353.
19. Bernard C, et al. (2004) Acquired dendritic channelopathy in temporal lobe epilepsy.Science 305:532–535.
20. Alferink J, et al. (2003) Compartmentalized production of CCL17 in vivo: Stronginducibility in peripheral dendritic cells contrasts selective absence from the spleen.J Exp Med 197:585–599.
21. Livak KJ, Schmittgen TD (2001) Analysis of relative gene expression data usingreal-time quantitative PCR and the 2(-Delta Delta C(T)) Method. Methods 25:402–408.
22. Barnes CA, Suster MS, Shen J, McNaughton BL (1997) Multistability of cognitive mapsin the hippocampus of old rats. Nature 388:272–275.
23. Sanchez-Mejia RO, et al. (2008) Phospholipase A2 reduction ameliorates cognitivedeficits in a mouse model of Alzheimer’s disease. Nat Neurosci 11:1311–1318.
24. Zimmer A, Zimmer AM, Hohmann AG, Herkenham M, Bonner TI (1999) Increasedmortality, hypoactivity, and hypoalgesia in cannabinoid CB1 receptor knockout mice.Proc Natl Acad Sci USA 96:5780–5785.
25. Monory K, et al. (2006) The endocannabinoid system controls key epileptogeniccircuits in the hippocampus. Neuron 51:455–466.
Albayram et al. www.pnas.org/cgi/content/short/1016442108 4 of 10
A
Iba1
-pos
itive
imm
unor
eact
ivity
12-months old Cnr1+/+ 12-months old Cnr1-/-
RSG RSG
B
Cg Cg GFA
P-po
sitiv
e im
mun
orea
ctiv
ity
Iba1
-pos
itive
imm
unor
eact
ivity
12-months old Cnr1+/+ 12-months old Cnr1-/- 12-months old Cnr1+/+ 12-months old Cnr1-/-
12-months old Cnr1+/+ 12-months old Cnr1-/-
GFA
P-po
sitiv
e im
mun
orea
ctiv
ity
12-months old Cnr1+/+ 12-months old Cnr1-/-
Cg Cg
Iba1
-pos
itive
imm
unor
eact
ivity
CPu CPu CPu CPu
C D
c1 c2 c3 c4
b1 b2 b3 b4
d1 d2 d3 d4
e1 e2 e3 e4 f1 f2 f3 f4
E F
12-months old Cnr1+/+ 12-months old Cnr1-/-
GFA
P-po
sitiv
e im
mun
orea
ctiv
ity
RSG RSG
a1 a3 a2 a4
I II
III IV
V VI
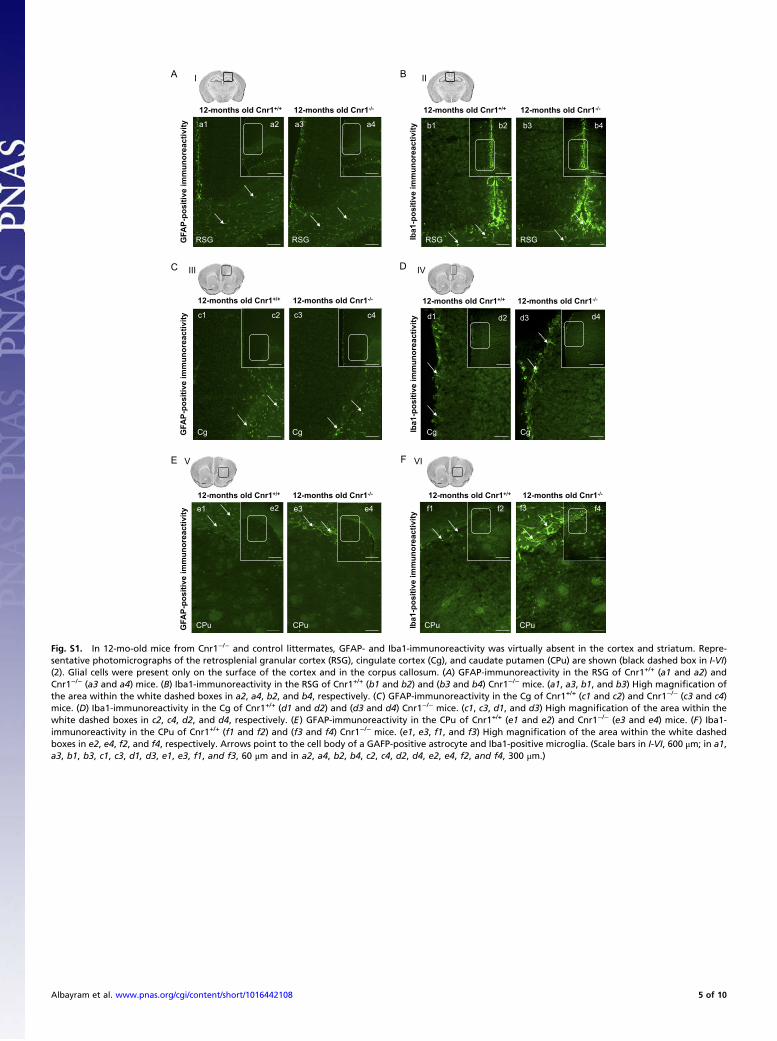
Fig. S1. In 12-mo-old mice from Cnr1−/− and control littermates, GFAP- and Iba1-immunoreactivity was virtually absent in the cortex and striatum. Repre-sentative photomicrographs of the retrosplenial granular cortex (RSG), cingulate cortex (Cg), and caudate putamen (CPu) are shown (black dashed box in I-VI)(2). Glial cells were present only on the surface of the cortex and in the corpus callosum. (A) GFAP-immunoreactivity in the RSG of Cnr1+/+ (a1 and a2) andCnr1−/− (a3 and a4) mice. (B) Iba1-immunoreactivity in the RSG of Cnr1+/+ (b1 and b2) and (b3 and b4) Cnr1−/− mice. (a1, a3, b1, and b3) High magnification ofthe area within the white dashed boxes in a2, a4, b2, and b4, respectively. (C) GFAP-immunoreactivity in the Cg of Cnr1+/+ (c1 and c2) and Cnr1−/− (c3 and c4)mice. (D) Iba1-immunoreactivity in the Cg of Cnr1+/+ (d1 and d2) and (d3 and d4) Cnr1−/− mice. (c1, c3, d1, and d3) High magnification of the area within thewhite dashed boxes in c2, c4, d2, and d4, respectively. (E) GFAP-immunoreactivity in the CPu of Cnr1+/+ (e1 and e2) and Cnr1−/− (e3 and e4) mice. (F) Iba1-immunoreactivity in the CPu of Cnr1+/+ (f1 and f2) and (f3 and f4) Cnr1−/− mice. (e1, e3, f1, and f3) High magnification of the area within the white dashedboxes in e2, e4, f2, and f4, respectively. Arrows point to the cell body of a GAFP-positive astrocyte and Iba1-positive microglia. (Scale bars in I-VI, 600 μm; in a1,a3, b1, b3, c1, c3, d1, d3, e1, e3, f1, and f3, 60 μm and in a2, a4, b2, b4, c2, c4, d2, d4, e2, e4, f2, and f4, 300 μm.)
Albayram et al. www.pnas.org/cgi/content/short/1016442108 5 of 10
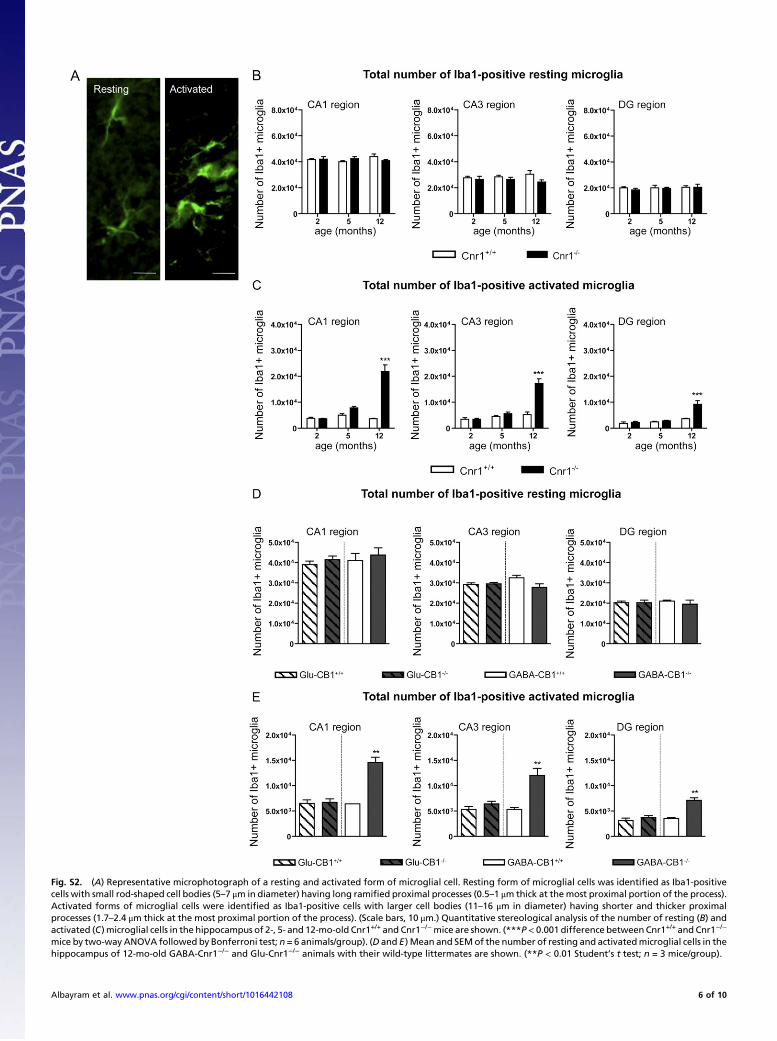
Fig. S2. (A) Representative microphotograph of a resting and activated form of microglial cell. Resting form of microglial cells was identified as Iba1-positivecells with small rod-shaped cell bodies (5–7 μm in diameter) having long ramified proximal processes (0.5–1 μm thick at themost proximal portion of the process).Activated forms of microglial cells were identified as Iba1-positive cells with larger cell bodies (11–16 μm in diameter) having shorter and thicker proximalprocesses (1.7–2.4 μm thick at the most proximal portion of the process). (Scale bars, 10 μm.) Quantitative stereological analysis of the number of resting (B) andactivated (C) microglial cells in the hippocampus of 2-, 5- and 12-mo-old Cnr1+/+ and Cnr1−/−mice are shown. (***P< 0.001 difference betweenCnr1+/+ and Cnr1−/−
mice by two-way ANOVA followed by Bonferroni test; n = 6 animals/group). (D and E) Mean and SEMof the number of resting and activatedmicroglial cells in thehippocampus of 12-mo-old GABA-Cnr1−/− and Glu-Cnr1−/− animals with their wild-type littermates are shown. (**P < 0.01 Student’s t test; n = 3 mice/group).
Albayram et al. www.pnas.org/cgi/content/short/1016442108 6 of 10
B CA1 region
Num
ber o
f Neu
N+
neur
ons
Cnr1+/+ Cnr1-/-
12-m
onth
s 5-
mon
ths
2-m
onth
s 2 5 12
0
5.0x10⁴
1.0x10⁵
1.5x10⁵
2.0x10⁵
2.5x10⁵
3.0x10⁵
3.5x10⁵
**
2 5 120
5.0x10⁴
1.0x10⁵
1.5x10⁵
2.0x10⁵
2.5x10⁵
3.0x10⁵
3.5x10⁵
* * **
2 5 120
2.0x10⁵
4.0x10⁵
6.0x10⁵
8.0x10⁵
1.0x10⁶
***
Num
ber o
f Neu
N+
neur
ons
Num
ber o
f Neu
N+
neur
ons
CA3 region
DG region
age (months)
age (months)
age (months)
2 5 120
5.0x10⁵
1.0x10⁶
1.5x10⁶
2.0x10⁶RSG
Num
ber o
f Neu
N+
neur
ons
2 5 120
5.0x10⁵
1.0x10⁶
1.5x10⁶
2.0x10⁶
Num
ber o
f Neu
N+
neur
ons
Cg
2 5 120
5.0x10⁵
1.0x10⁶
1.5x10⁶
2.0x10⁶
Num
ber o
f Neu
N+
neur
ons
CPu C
age (months) age (months) age (months)
A
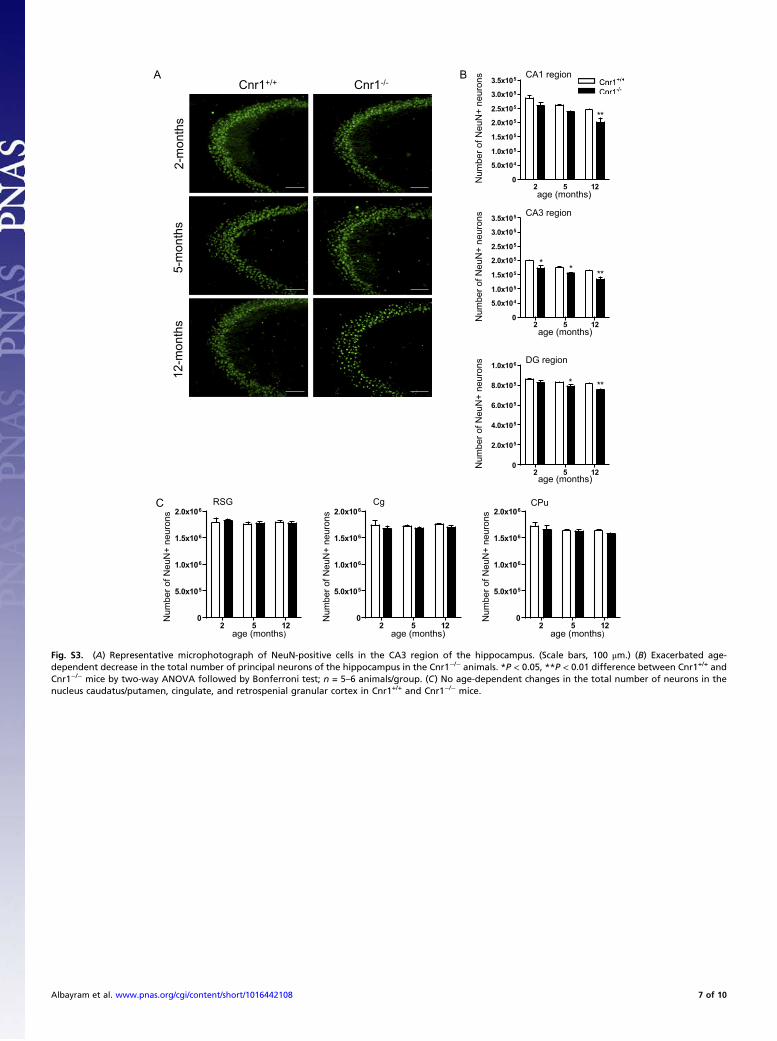
Fig. S3. (A) Representative microphotograph of NeuN-positive cells in the CA3 region of the hippocampus. (Scale bars, 100 μm.) (B) Exacerbated age-dependent decrease in the total number of principal neurons of the hippocampus in the Cnr1−/− animals. *P < 0.05, **P < 0.01 difference between Cnr1+/+ andCnr1−/− mice by two-way ANOVA followed by Bonferroni test; n = 5–6 animals/group. (C) No age-dependent changes in the total number of neurons in thenucleus caudatus/putamen, cingulate, and retrospenial granular cortex in Cnr1+/+ and Cnr1−/− mice.
Albayram et al. www.pnas.org/cgi/content/short/1016442108 7 of 10
2-m
onth
s 5
-mon
ths
12-
mon
ths
Cnr1 -/-
B
Cnr1 +/+
BrdU NeuN-BrdU
NeuN-BrdU BrdU
BrdUNeuN-BrdU
NeuN-BrdU BrdU
NeuN-BrdU BrdU BrdUNeuN-BrdU
Brd
U-la
bele
d ce
lls
A
Fig. S4. (A) representative microphotograph of BrdU-positive cells (red) counterstained with NeuN (green) 24 h after the BrdU administration in the dentategyrus of the hippocampus. (Scale bars, 30 μm.) (B) Reduced neurogenesis in 2-mo-old but not in older Cnr1−/− animals. (*P < 0.05 difference between Cnr1+/+
and Cnr1−/− mice by two-way ANOVA followed by Bonferroni test; n = 6 animals/group).
Albayram et al. www.pnas.org/cgi/content/short/1016442108 8 of 10
Training days
12 month old
Spe
ed (c
m/s
)
Acquisition Reversal
Spe
ed (c
m/s
)
2 month old
Acquisition Reversal
Training days
5 month old S
peed
(cm
/s)
Acquisition Reversal
Training days
A B
C
% s
pont
aneo
us a
ltera
tion
1 2 3 4 5 6
Acquisition trial
Reversal trial
N
E
W
S
N
E
W
S
7 8 9
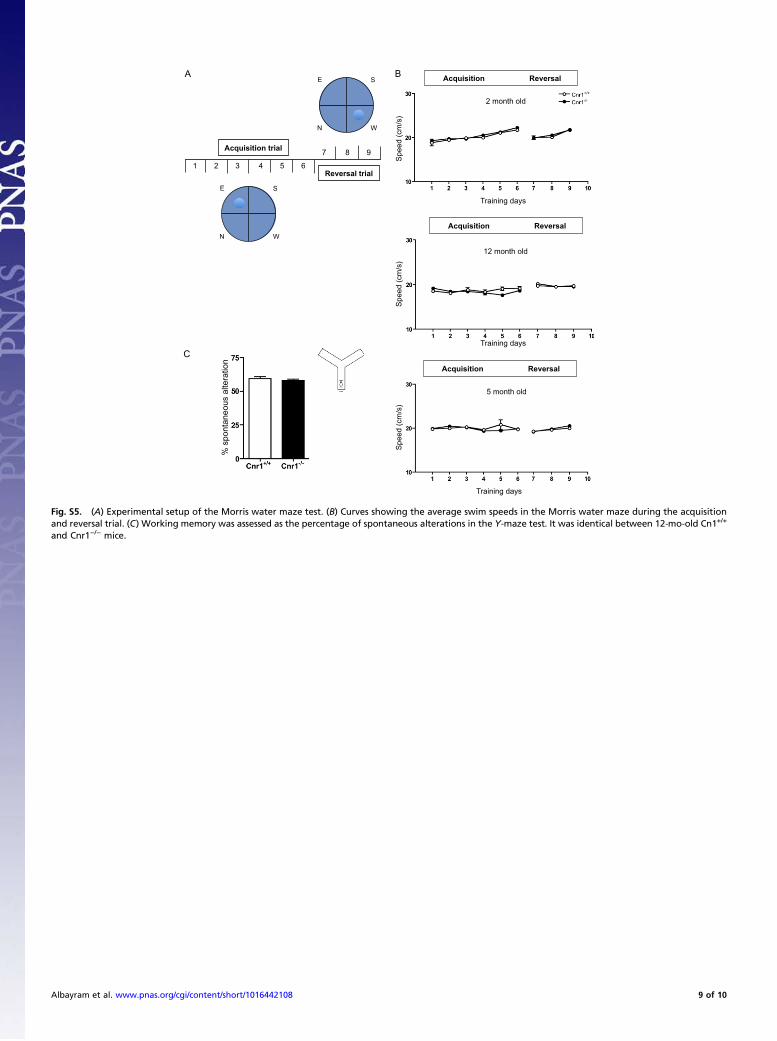
Fig. S5. (A) Experimental setup of the Morris water maze test. (B) Curves showing the average swim speeds in the Morris water maze during the acquisitionand reversal trial. (C) Working memory was assessed as the percentage of spontaneous alterations in the Y-maze test. It was identical between 12-mo-old Cn1+/+
and Cnr1−/− mice.
Albayram et al. www.pnas.org/cgi/content/short/1016442108 9 of 10
% T
imm
-pos
itive
Cnr1 -/- Cnr1 +/+
Num
ber o
f ave
rage
fr
eque
ncy
Num
ber o
f spi
kes
per t
rain
Dur
atio
n of
the
even
ts
B
C D E
Cnr1 +/+ Cnr1 -/-
G F
Cnr1 +/+ Cnr1 -/-
Tim
m s
tain
ing
A
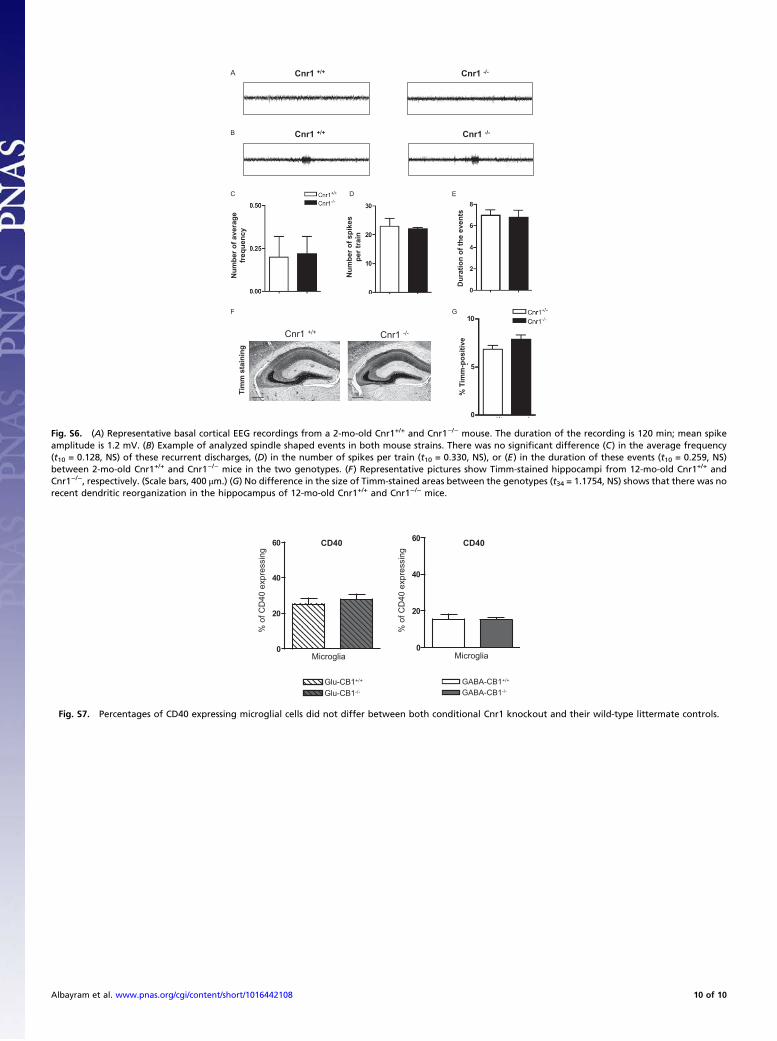
Fig. S6. (A) Representative basal cortical EEG recordings from a 2-mo-old Cnr1+/+ and Cnr1−/− mouse. The duration of the recording is 120 min; mean spikeamplitude is 1.2 mV. (B) Example of analyzed spindle shaped events in both mouse strains. There was no significant difference (C) in the average frequency(t10 = 0.128, NS) of these recurrent discharges, (D) in the number of spikes per train (t10 = 0.330, NS), or (E) in the duration of these events (t10 = 0.259, NS)between 2-mo-old Cnr1+/+ and Cnr1−/− mice in the two genotypes. (F) Representative pictures show Timm-stained hippocampi from 12-mo-old Cnr1+/+ andCnr1−/−, respectively. (Scale bars, 400 μm.) (G) No difference in the size of Timm-stained areas between the genotypes (t34 = 1.1754, NS) shows that there was norecent dendritic reorganization in the hippocampus of 12-mo-old Cnr1+/+ and Cnr1−/− mice.
CD40
GABA-CB1-/-
GABA-CB1+/+Glu-CB1+/+
Glu-CB1-/-
0
20
40
60
0
20
40
60
% o
f CD
40 e
xpre
ssin
g
Microglia
% o
f CD
40 e
xpre
ssin
g
CD40
Microglia
Fig. S7. Percentages of CD40 expressing microglial cells did not differ between both conditional Cnr1 knockout and their wild-type littermate controls.
Albayram et al. www.pnas.org/cgi/content/short/1016442108 10 of 10