Embed Size (px)
Citation preview
S1
Supporting Information For:
Surfactant-Free Electrochemical Synthesis of Metallic Nanoparticles
via Stochastic Collisions of Aqueous Nanodroplet Reactors
Young Eun Jeun, Bongkwan Baek, Myoung Won Lee, and Hyun S. Ahn*
Contribution from Department of Chemistry, Yonsei University, 50 Yonsei-ro, Seodaemun-gu, Seoul,
03722 Republic of Korea
Email: [email protected]
Table of Contents Page
Experimental S2
Aqueous Nanodroplet Electrochemistry with a Nernstian Redox Agent (Figure S1) S3
Chronoamperogram of Cu AnD Collisions at -0.35 V (Figure S2) S4
Chronoamperogram of Cu AnD Collisions at -0.7 V (Figure S3) S5
Chronoamperogram of Cu AnD Collisions at -0.9 V (Figure S4) S6
Chronoamperogram of Cu AnD Collisions at -1.1 V (Figure S5) S7
Histogram of AnD Size determined by electrochemistry at -0.5 V (Figure S6) S8
Histogram of AnD Size determined by electrochemistry at -1.1 V (Figure S7) S9
Energy Dispersive X-ray Spectrum of Copper Nanoparticles (Figure S8) S10
Calculation of Expected Collision Frequency of AnDs S11
Calculation of Projected Average Diameter of the Synthesized Nanoparticles S12
TEM Image of AnD Synthesized Ag Nanoparticles (Figure S9) S13
Elemental Map of AnD Synthesized Ag Nanoparticles (Figure S10) S14
Elemental Map of AnD Synthesized Co Oxyhydroxide Nanoparticles (Figure S11) S15
Histogram of Cu Nanoparticle Sizes at Various Potentials (Figure S12-S16) S16-S20
References S21
Electronic Supplementary Material (ESI) for ChemComm.This journal is © The Royal Society of Chemistry 2018
S2
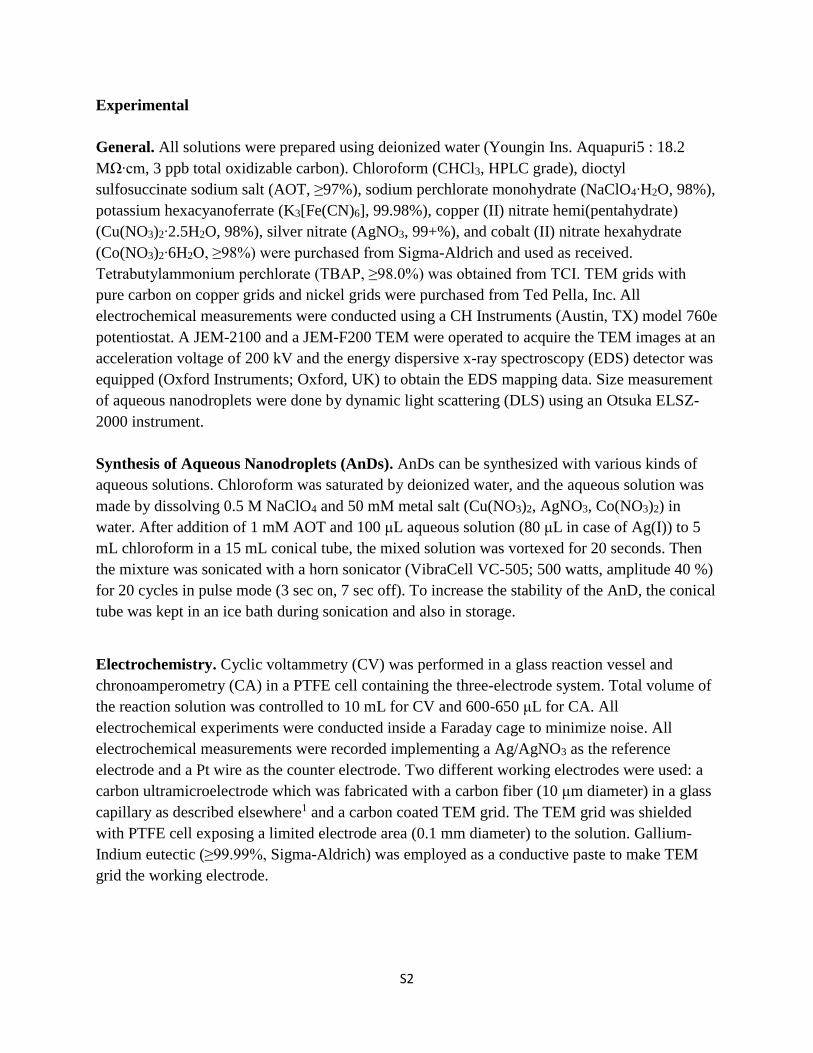
Experimental
General. All solutions were prepared using deionized water (Youngin Ins. Aquapuri5 : 18.2
MΩ∙cm, 3 ppb total oxidizable carbon). Chloroform (CHCl3, HPLC grade), dioctyl
sulfosuccinate sodium salt (AOT, ≥97%), sodium perchlorate monohydrate (NaClO4∙H2O, 98%),
potassium hexacyanoferrate (K3[Fe(CN)6], 99.98%), copper (II) nitrate hemi(pentahydrate)
(Cu(NO3)2∙2.5H2O, 98%), silver nitrate (AgNO3, 99+%), and cobalt (II) nitrate hexahydrate
(Co(NO3)2∙6H2O, ≥98%) were purchased from Sigma-Aldrich and used as received.
Tetrabutylammonium perchlorate (TBAP, ≥98.0%) was obtained from TCI. TEM grids with
pure carbon on copper grids and nickel grids were purchased from Ted Pella, Inc. All
electrochemical measurements were conducted using a CH Instruments (Austin, TX) model 760e
potentiostat. A JEM-2100 and a JEM-F200 TEM were operated to acquire the TEM images at an
acceleration voltage of 200 kV and the energy dispersive x-ray spectroscopy (EDS) detector was
equipped (Oxford Instruments; Oxford, UK) to obtain the EDS mapping data. Size measurement
of aqueous nanodroplets were done by dynamic light scattering (DLS) using an Otsuka ELSZ-
2000 instrument.
Synthesis of Aqueous Nanodroplets (AnDs). AnDs can be synthesized with various kinds of
aqueous solutions. Chloroform was saturated by deionized water, and the aqueous solution was
made by dissolving 0.5 M NaClO4 and 50 mM metal salt (Cu(NO3)2, AgNO3, Co(NO3)2) in
water. After addition of 1 mM AOT and 100 μL aqueous solution (80 μL in case of Ag(I)) to 5
mL chloroform in a 15 mL conical tube, the mixed solution was vortexed for 20 seconds. Then
the mixture was sonicated with a horn sonicator (VibraCell VC-505; 500 watts, amplitude 40 %)
for 20 cycles in pulse mode (3 sec on, 7 sec off). To increase the stability of the AnD, the conical
tube was kept in an ice bath during sonication and also in storage.
Electrochemistry. Cyclic voltammetry (CV) was performed in a glass reaction vessel and
chronoamperometry (CA) in a PTFE cell containing the three-electrode system. Total volume of
the reaction solution was controlled to 10 mL for CV and 600-650 μL for CA. All
electrochemical experiments were conducted inside a Faraday cage to minimize noise. All
electrochemical measurements were recorded implementing a Ag/AgNO3 as the reference
electrode and a Pt wire as the counter electrode. Two different working electrodes were used: a
carbon ultramicroelectrode which was fabricated with a carbon fiber (10 μm diameter) in a glass
capillary as described elsewhere1 and a carbon coated TEM grid. The TEM grid was shielded
with PTFE cell exposing a limited electrode area (0.1 mm diameter) to the solution. Gallium-
Indium eutectic (≥99.99%, Sigma-Aldrich) was employed as a conductive paste to make TEM
grid the working electrode.
S3
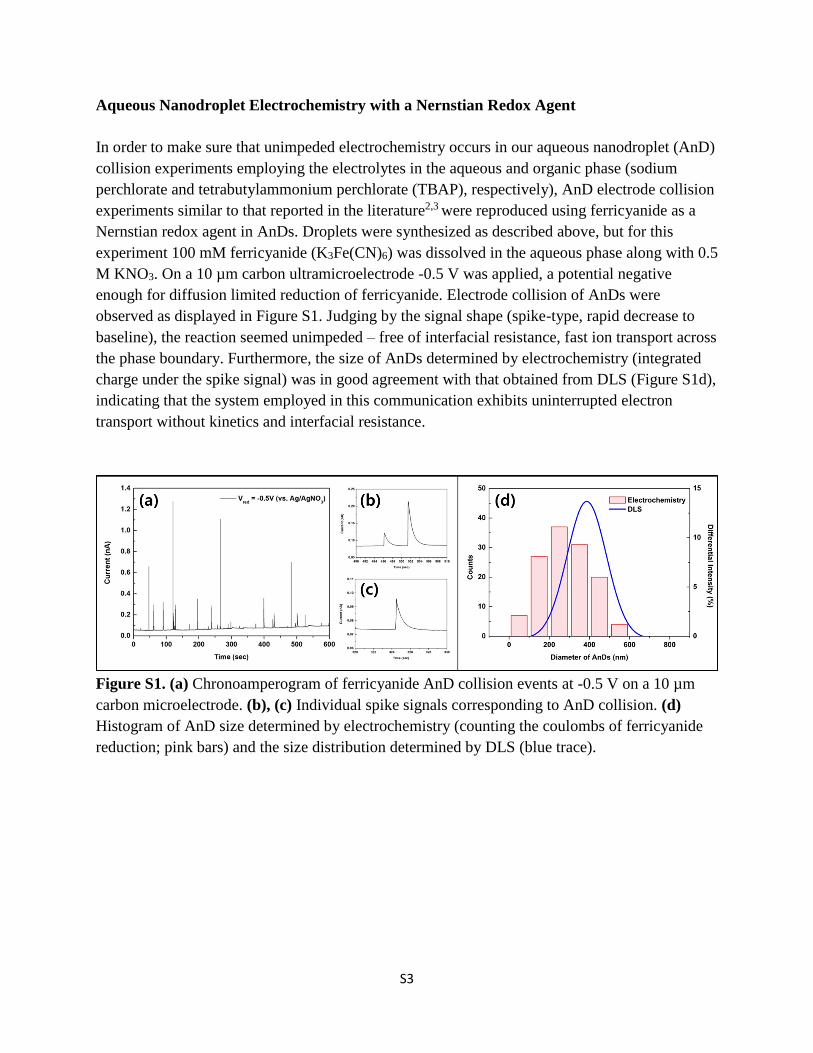
Aqueous Nanodroplet Electrochemistry with a Nernstian Redox Agent
In order to make sure that unimpeded electrochemistry occurs in our aqueous nanodroplet (AnD)
collision experiments employing the electrolytes in the aqueous and organic phase (sodium
perchlorate and tetrabutylammonium perchlorate (TBAP), respectively), AnD electrode collision
experiments similar to that reported in the literature2,3 were reproduced using ferricyanide as a
Nernstian redox agent in AnDs. Droplets were synthesized as described above, but for this
experiment 100 mM ferricyanide (K3Fe(CN)6) was dissolved in the aqueous phase along with 0.5
M KNO3. On a 10 µm carbon ultramicroelectrode -0.5 V was applied, a potential negative
enough for diffusion limited reduction of ferricyanide. Electrode collision of AnDs were
observed as displayed in Figure S1. Judging by the signal shape (spike-type, rapid decrease to
baseline), the reaction seemed unimpeded – free of interfacial resistance, fast ion transport across
the phase boundary. Furthermore, the size of AnDs determined by electrochemistry (integrated
charge under the spike signal) was in good agreement with that obtained from DLS (Figure S1d),
indicating that the system employed in this communication exhibits uninterrupted electron
transport without kinetics and interfacial resistance.
Figure S1. (a) Chronoamperogram of ferricyanide AnD collision events at -0.5 V on a 10 µm
carbon microelectrode. (b), (c) Individual spike signals corresponding to AnD collision. (d)
Histogram of AnD size determined by electrochemistry (counting the coulombs of ferricyanide
reduction; pink bars) and the size distribution determined by DLS (blue trace).
S4
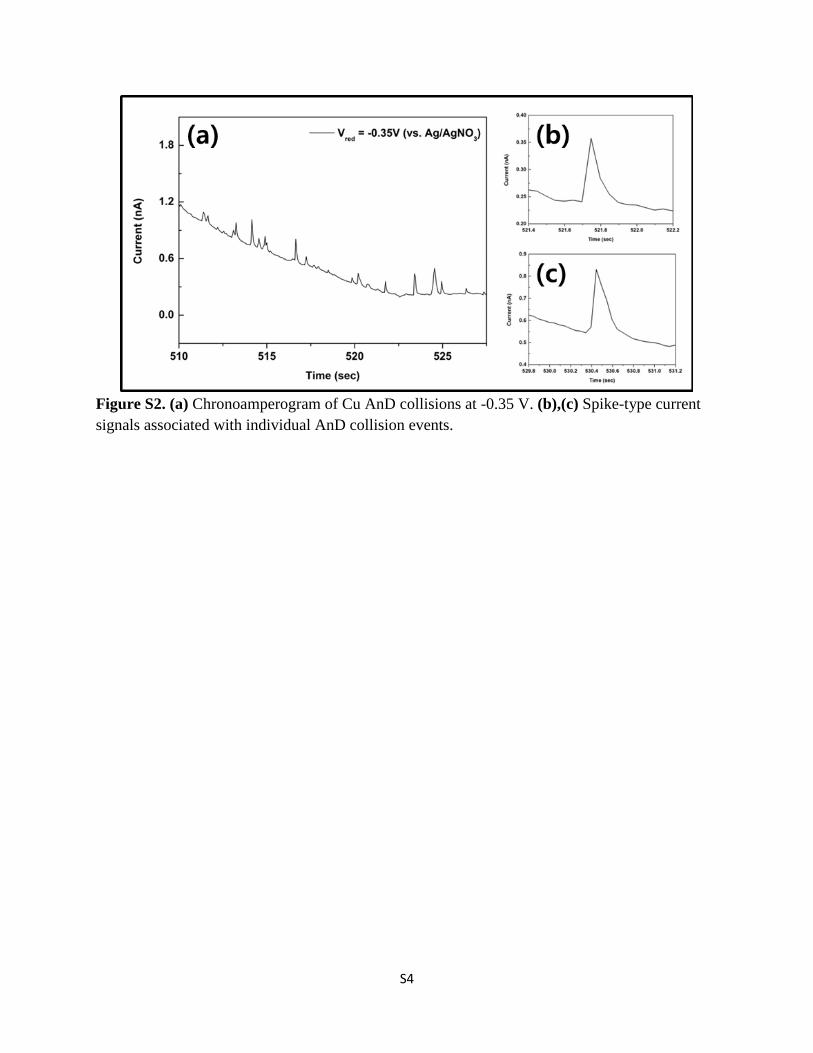
Figure S2. (a) Chronoamperogram of Cu AnD collisions at -0.35 V. (b),(c) Spike-type current
signals associated with individual AnD collision events.
S5
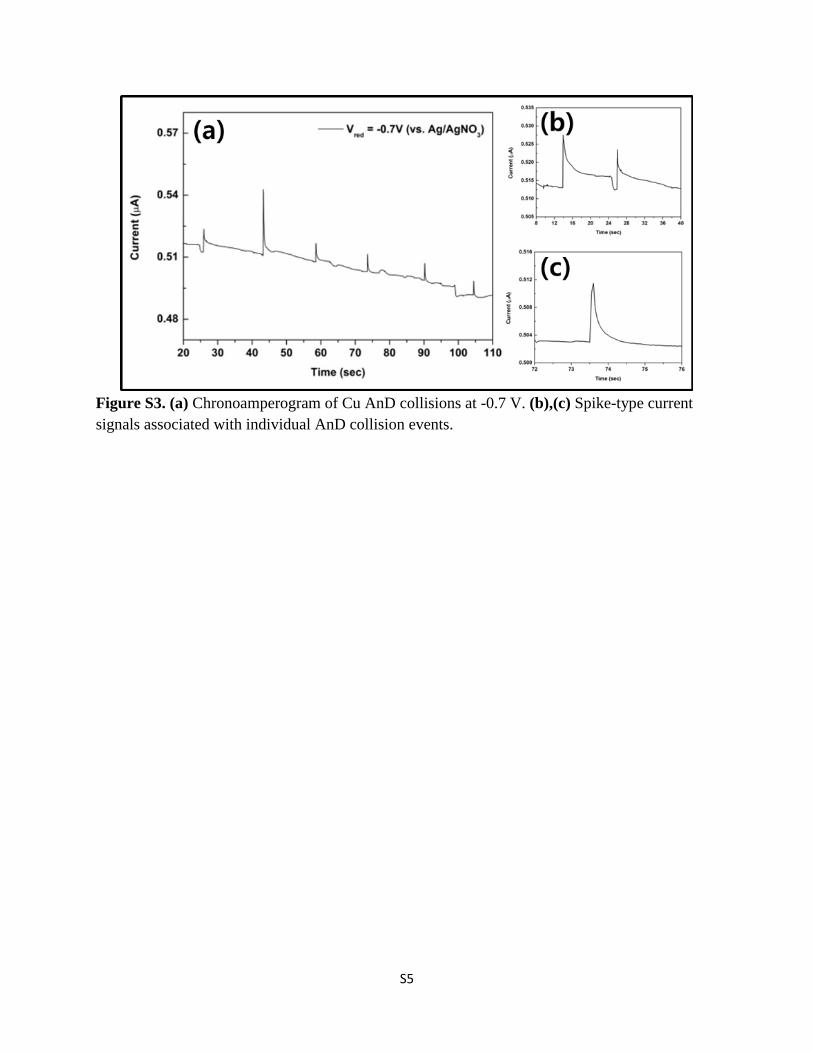
Figure S3. (a) Chronoamperogram of Cu AnD collisions at -0.7 V. (b),(c) Spike-type current
signals associated with individual AnD collision events.
S6
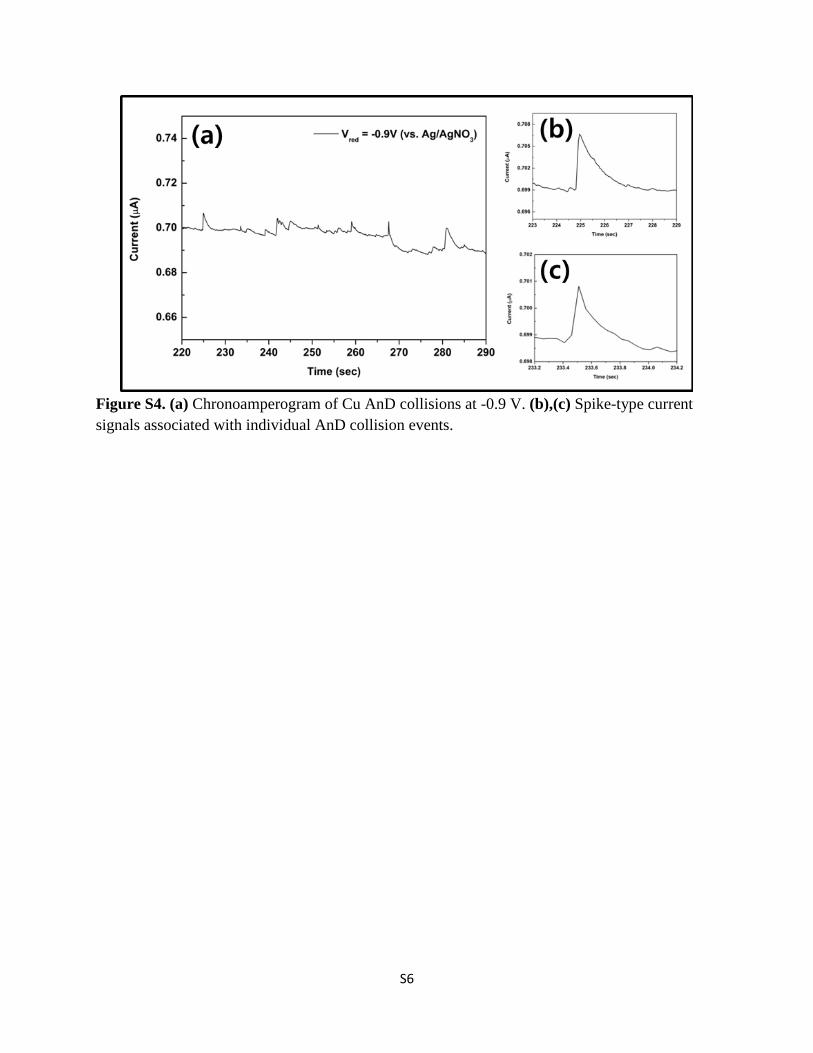
Figure S4. (a) Chronoamperogram of Cu AnD collisions at -0.9 V. (b),(c) Spike-type current
signals associated with individual AnD collision events.
S7
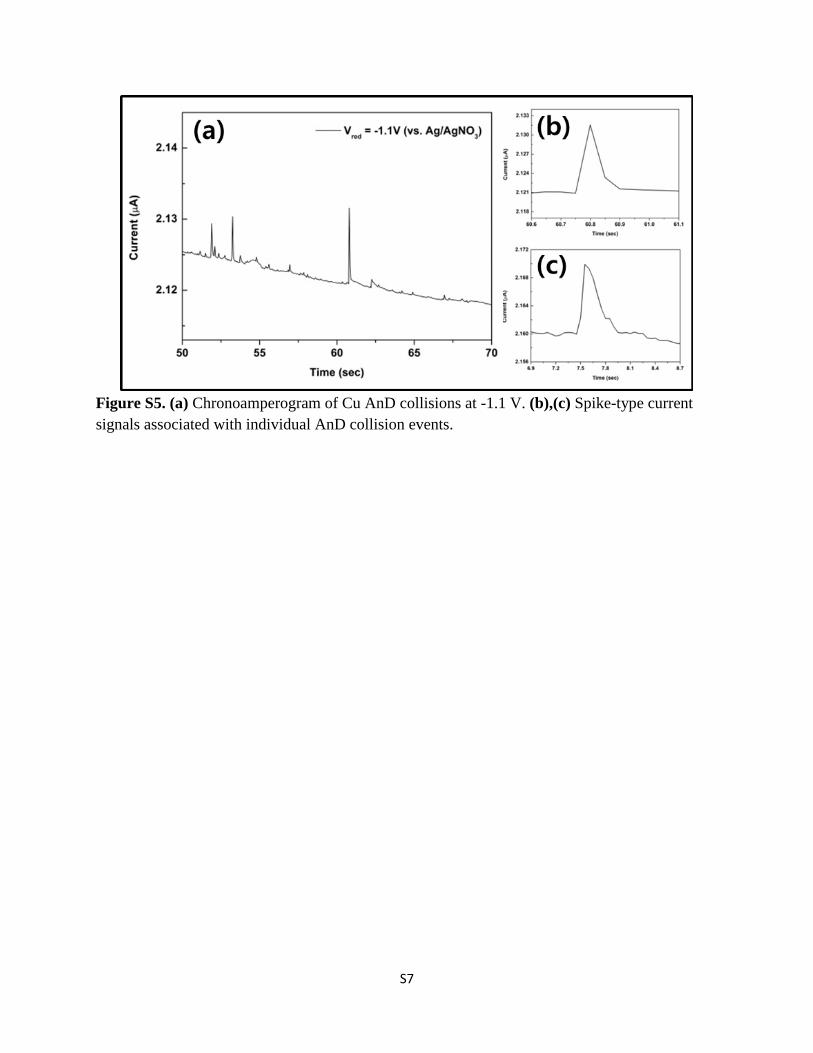
Figure S5. (a) Chronoamperogram of Cu AnD collisions at -1.1 V. (b),(c) Spike-type current
signals associated with individual AnD collision events.
S8
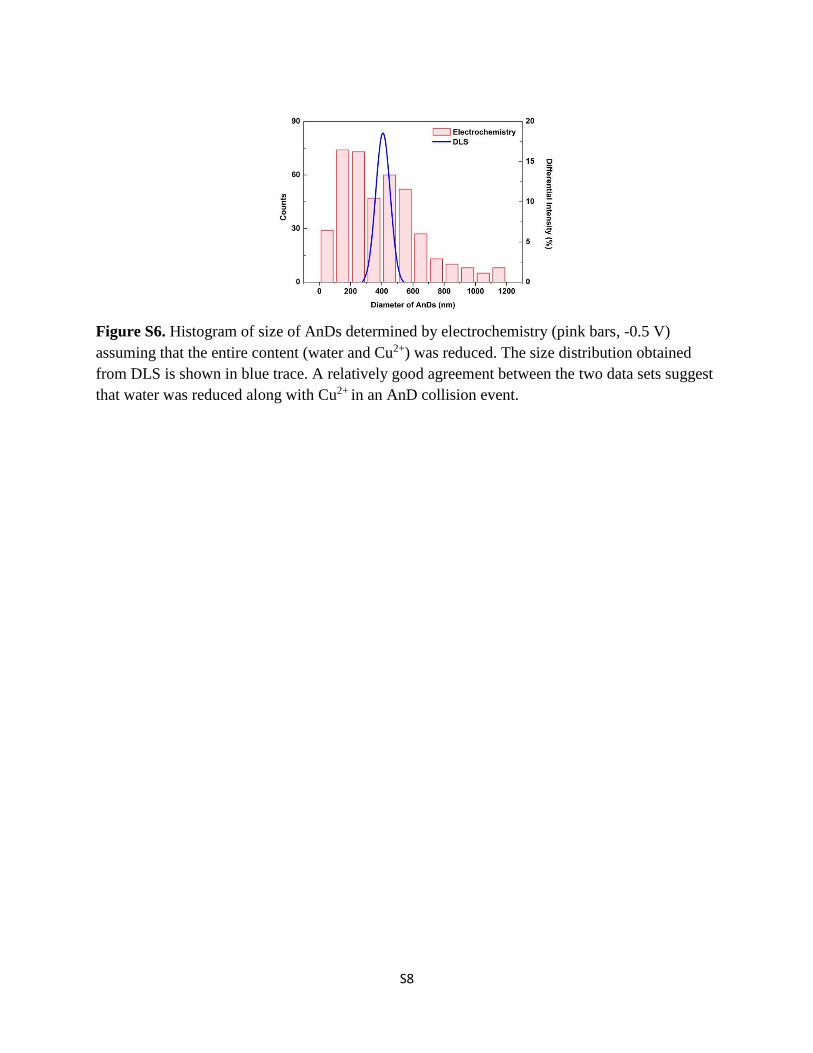
Figure S6. Histogram of size of AnDs determined by electrochemistry (pink bars, -0.5 V)
assuming that the entire content (water and Cu2+) was reduced. The size distribution obtained
from DLS is shown in blue trace. A relatively good agreement between the two data sets suggest
that water was reduced along with Cu2+ in an AnD collision event.
S9
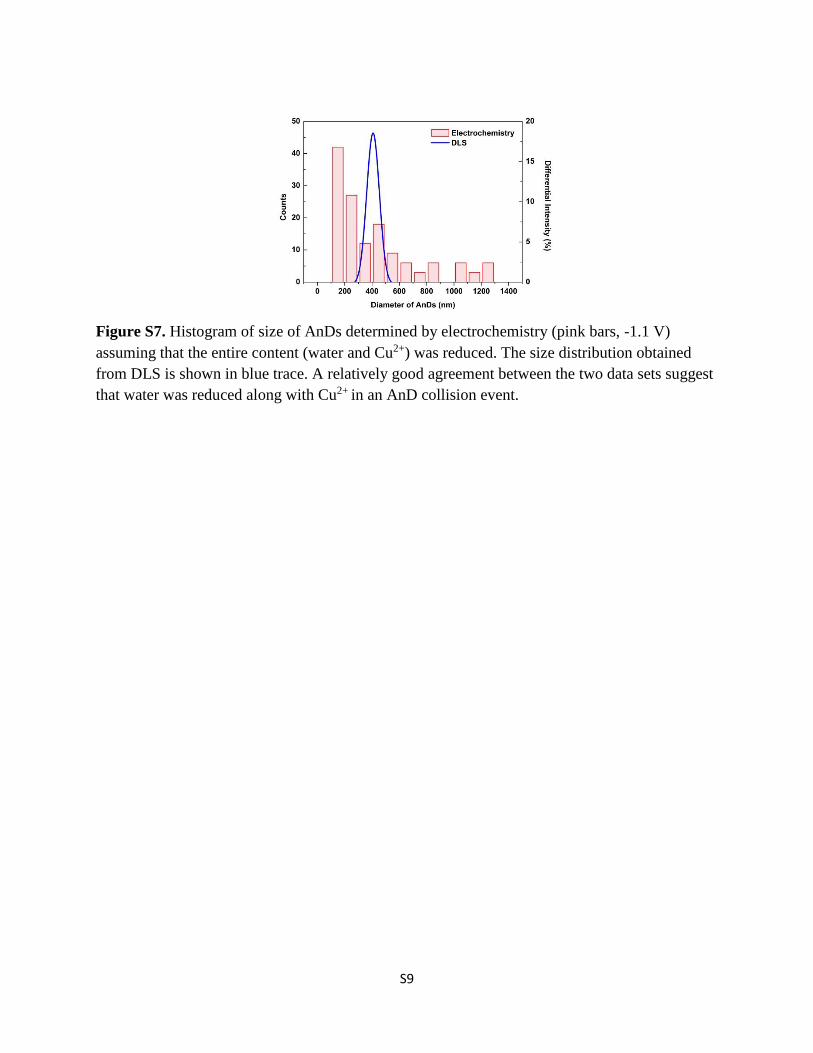
Figure S7. Histogram of size of AnDs determined by electrochemistry (pink bars, -1.1 V)
assuming that the entire content (water and Cu2+) was reduced. The size distribution obtained
from DLS is shown in blue trace. A relatively good agreement between the two data sets suggest
that water was reduced along with Cu2+ in an AnD collision event.
S10
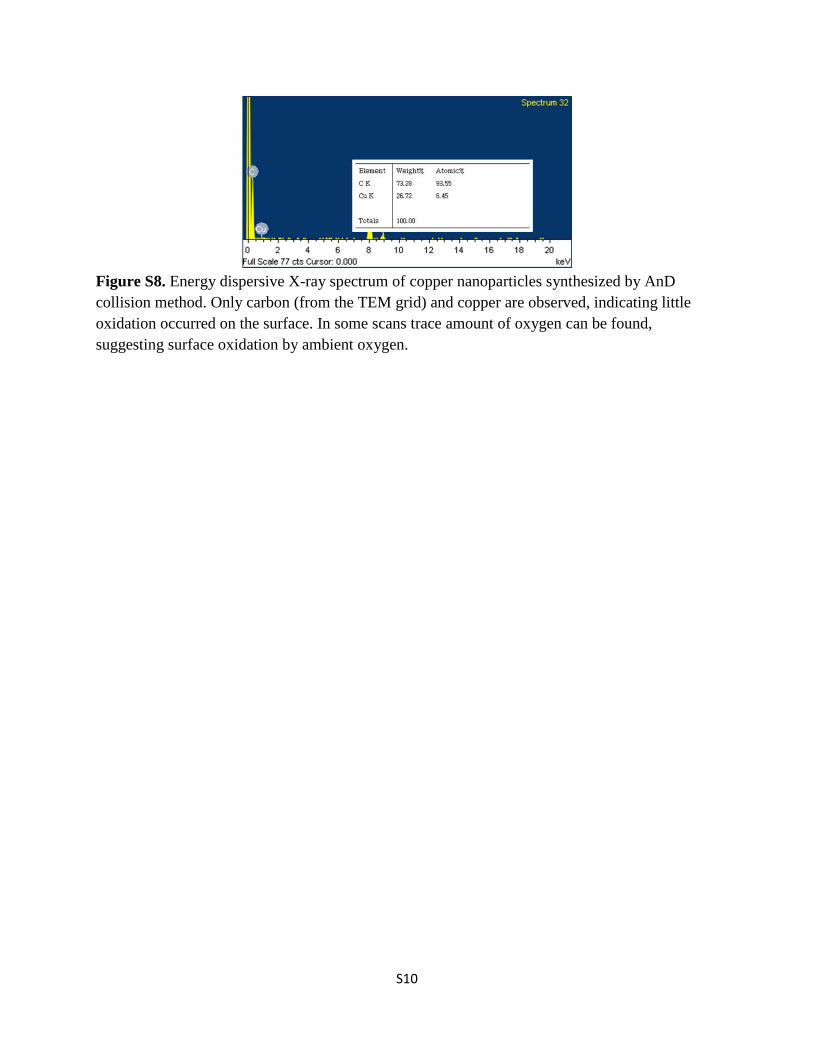
Figure S8. Energy dispersive X-ray spectrum of copper nanoparticles synthesized by AnD
collision method. Only carbon (from the TEM grid) and copper are observed, indicating little
oxidation occurred on the surface. In some scans trace amount of oxygen can be found,
suggesting surface oxidation by ambient oxygen.
S11
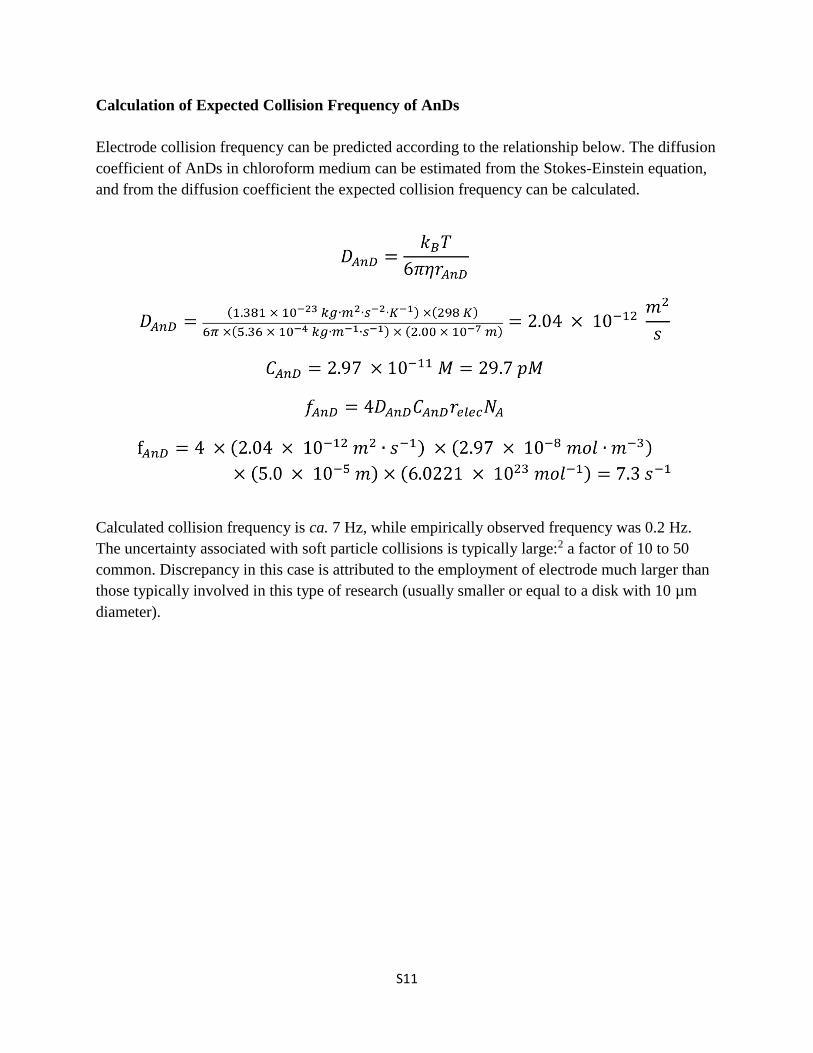
Calculation of Expected Collision Frequency of AnDs
Electrode collision frequency can be predicted according to the relationship below. The diffusion
coefficient of AnDs in chloroform medium can be estimated from the Stokes-Einstein equation,
and from the diffusion coefficient the expected collision frequency can be calculated.
Calculated collision frequency is ca. 7 Hz, while empirically observed frequency was 0.2 Hz.
The uncertainty associated with soft particle collisions is typically large:2 a factor of 10 to 50
common. Discrepancy in this case is attributed to the employment of electrode much larger than
those typically involved in this type of research (usually smaller or equal to a disk with 10 µm
diameter).

S12
Calculation of Projected Average Diameter of the Synthesized Nanoparticles
The average projected diameter of the nanoparticles synthesized as a result of AnD collisions
was calculated according to the equation below. First, from the known number of copper atoms
inside an AnD, volume of the synthesized particle was calculated. Then, assuming spherical
geometry, a projected diameter was deduced. An average projected diameter of 28 nm was
calculated for nanoparticles synthesized from copper AnDs, and from similar calculations that of
Ag (350 nm AnD diameter and 50 mM Ag+) was estimated to be 30 nm.
S13
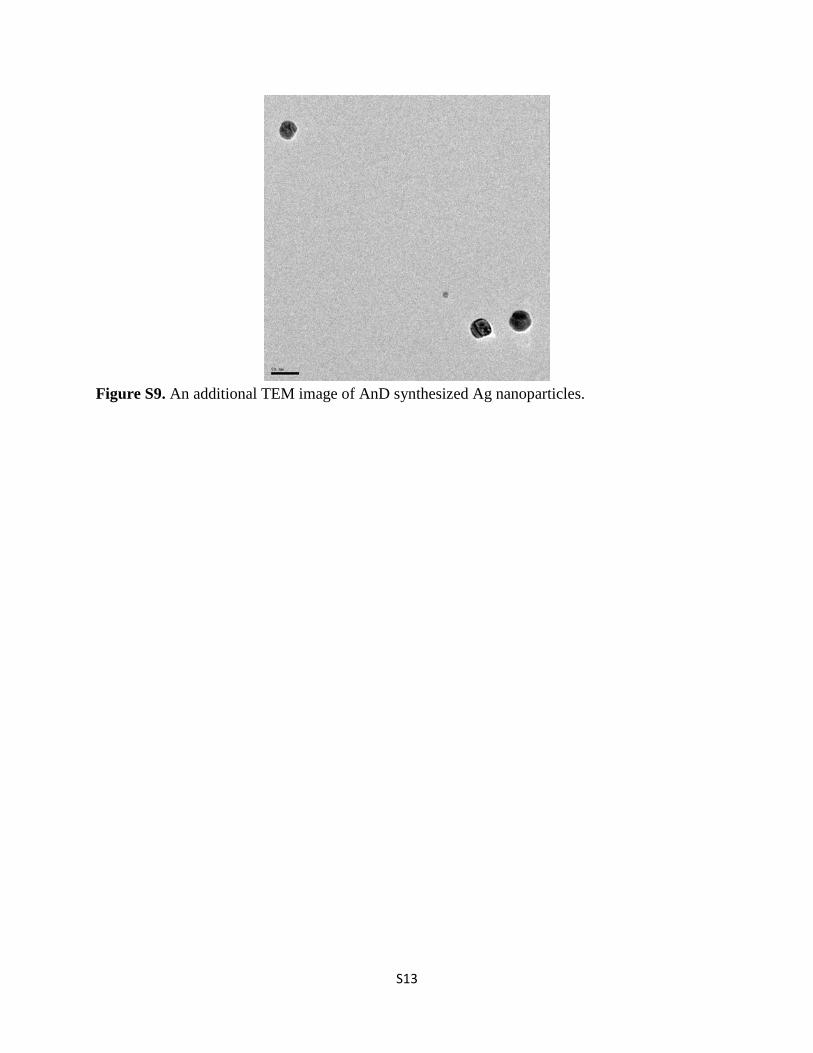
Figure S9. An additional TEM image of AnD synthesized Ag nanoparticles.
S14
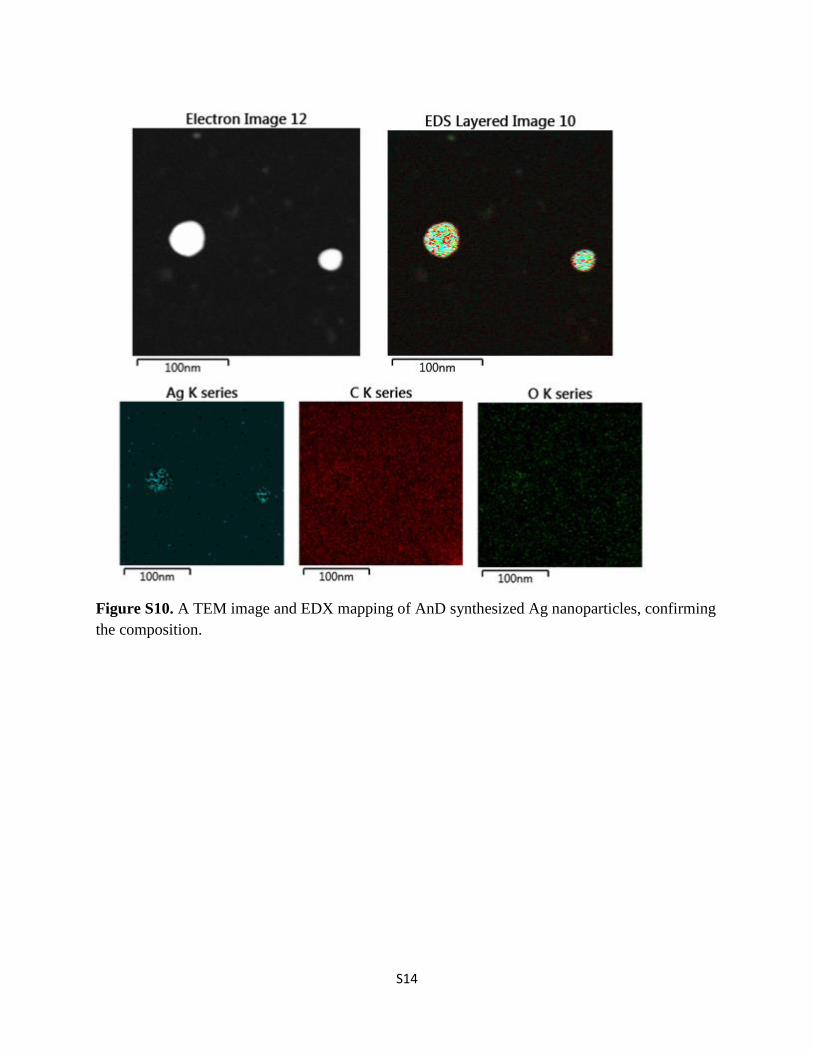
Figure S10. A TEM image and EDX mapping of AnD synthesized Ag nanoparticles, confirming
the composition.
S15
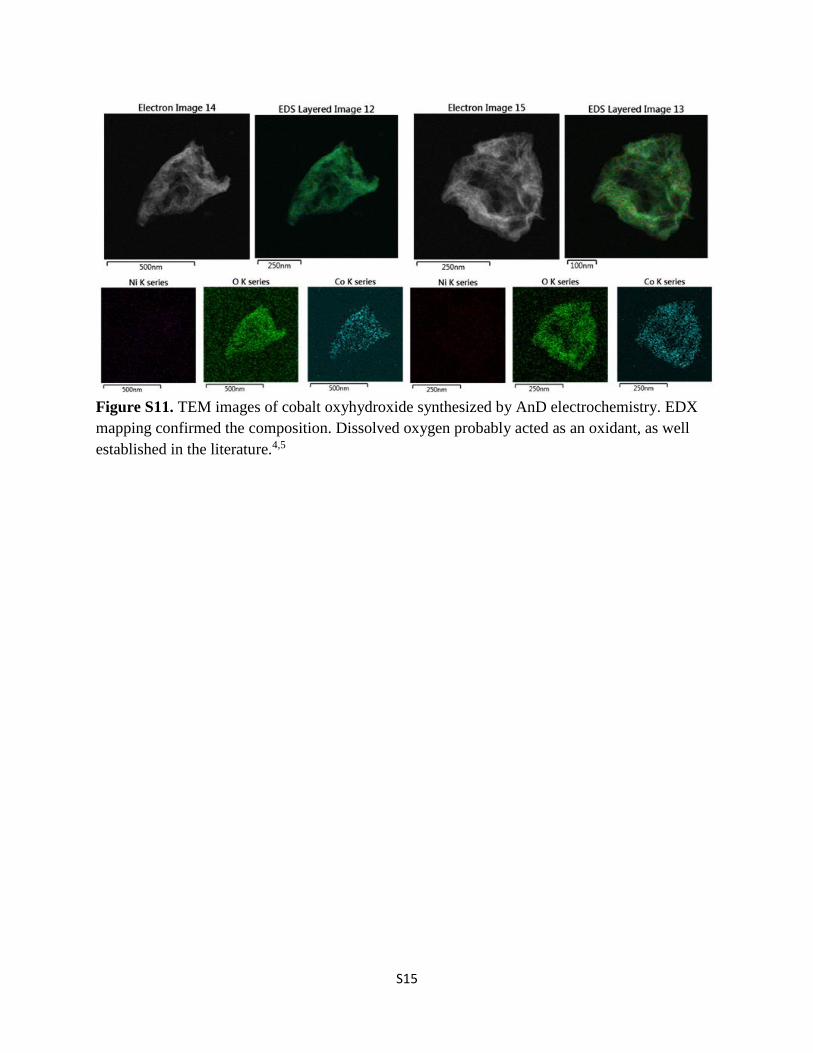
Figure S11. TEM images of cobalt oxyhydroxide synthesized by AnD electrochemistry. EDX
mapping confirmed the composition. Dissolved oxygen probably acted as an oxidant, as well
established in the literature.4,5
S16
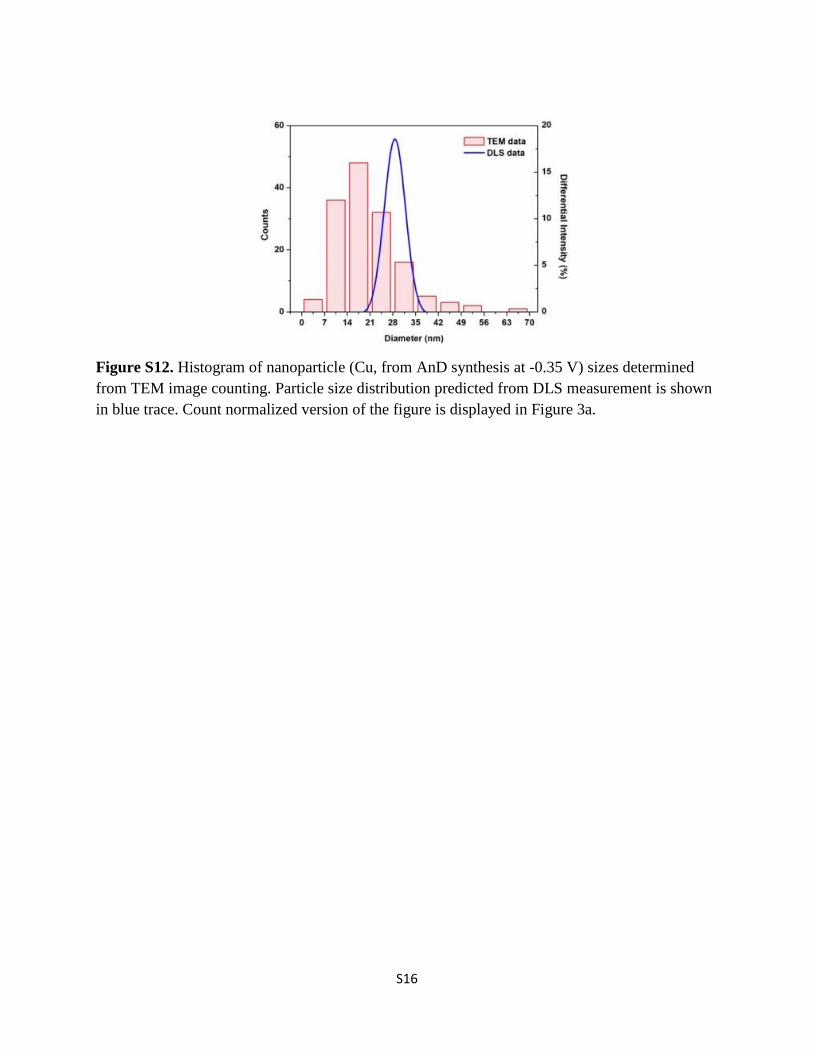
Figure S12. Histogram of nanoparticle (Cu, from AnD synthesis at -0.35 V) sizes determined
from TEM image counting. Particle size distribution predicted from DLS measurement is shown
in blue trace. Count normalized version of the figure is displayed in Figure 3a.
S17
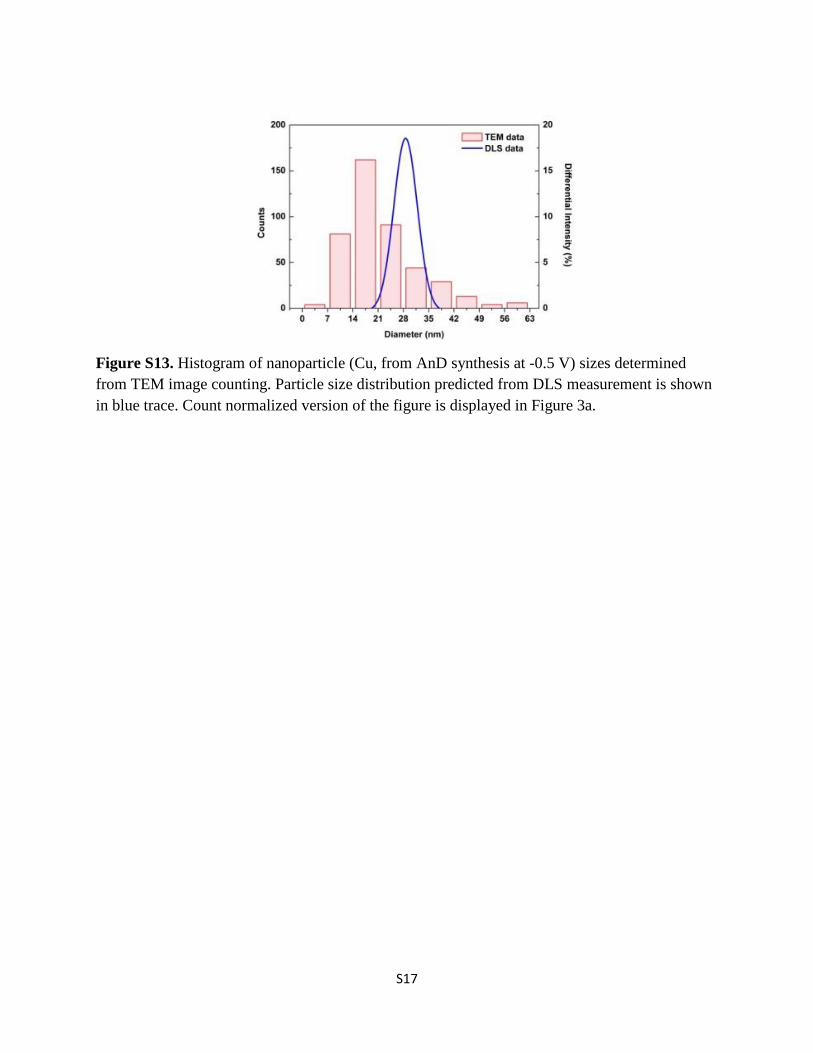
Figure S13. Histogram of nanoparticle (Cu, from AnD synthesis at -0.5 V) sizes determined
from TEM image counting. Particle size distribution predicted from DLS measurement is shown
in blue trace. Count normalized version of the figure is displayed in Figure 3a.
S18
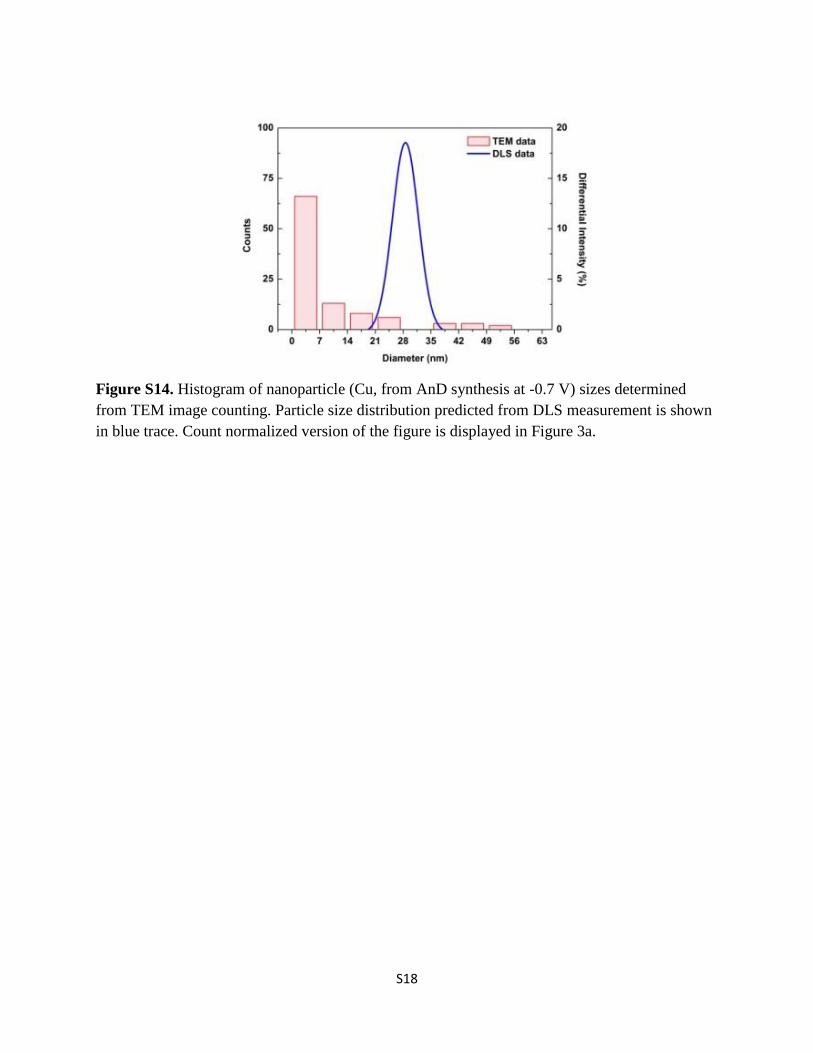
Figure S14. Histogram of nanoparticle (Cu, from AnD synthesis at -0.7 V) sizes determined
from TEM image counting. Particle size distribution predicted from DLS measurement is shown
in blue trace. Count normalized version of the figure is displayed in Figure 3a.
S19
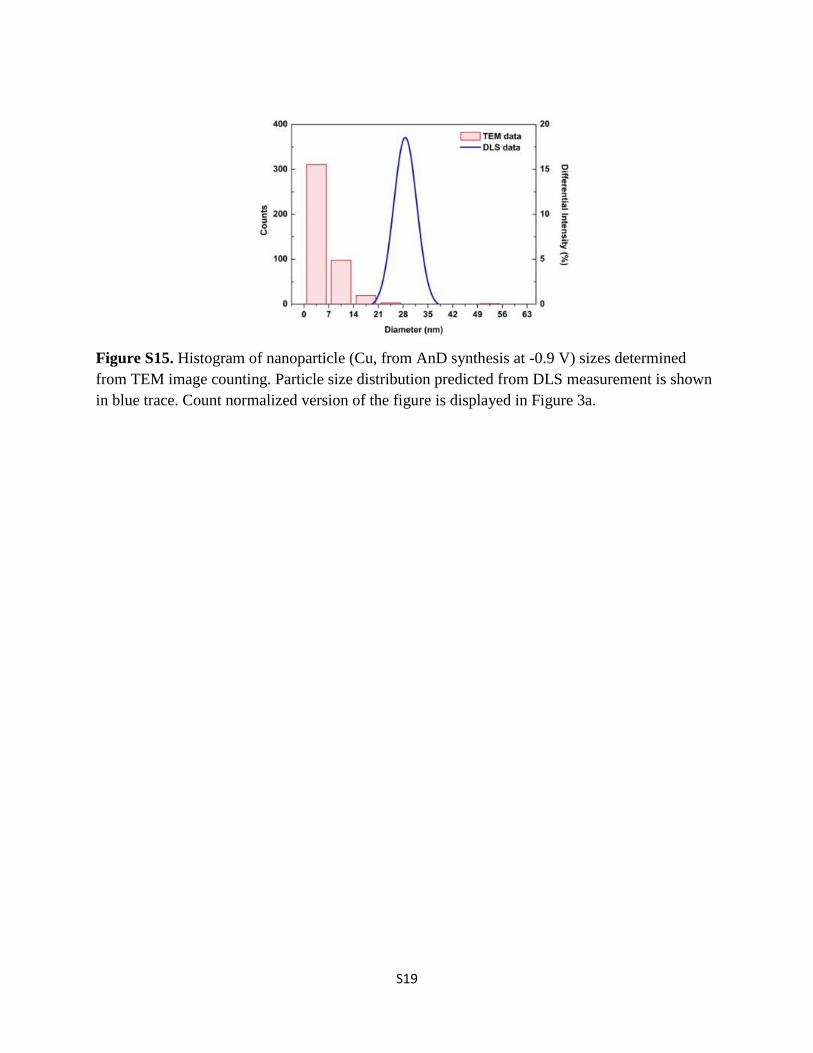
Figure S15. Histogram of nanoparticle (Cu, from AnD synthesis at -0.9 V) sizes determined
from TEM image counting. Particle size distribution predicted from DLS measurement is shown
in blue trace. Count normalized version of the figure is displayed in Figure 3a.
S20
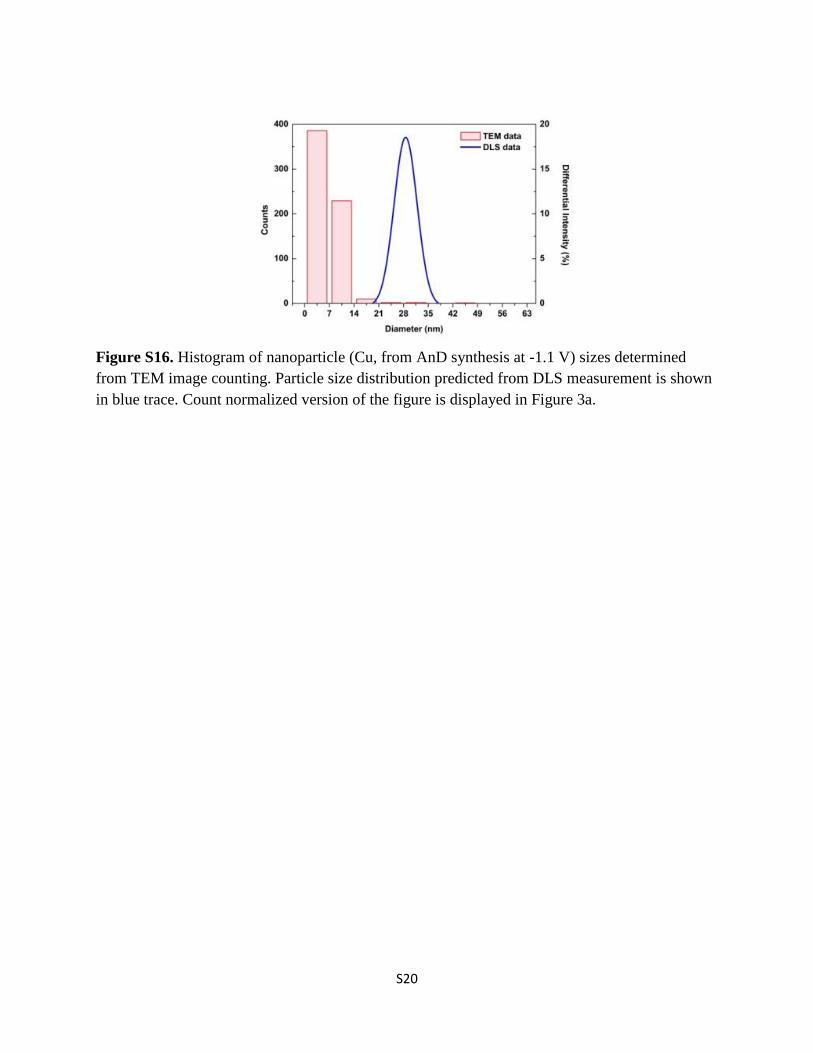
Figure S16. Histogram of nanoparticle (Cu, from AnD synthesis at -1.1 V) sizes determined
from TEM image counting. Particle size distribution predicted from DLS measurement is shown
in blue trace. Count normalized version of the figure is displayed in Figure 3a.
S21
References
1. Bard, A. J.; Mirkin, M. V. Scanning Electrochemical Microscopy, Second Edition; 2 edition.;
CRC Press: Boca Raton, 2012.
2. Hoang, N. T. T.; Ho, T. L. T.; Park, J. H.; Kim, B.-K., Electrochim. Acta 2017, 245, 128-
132.
3. Zhang, H.; Sepunaru, L.; Sokolov, S. V.; Laborda, E.; Batchelor-McAuley, C.; Compton,
R. G., Phys. Chem. Chem. Phys. 2017, 19, 15662-15666.
4. Louie, M. W.; Bell, A. T. J. Am. Chem. Soc. 2013, 135, 12329−12337.
5. Ahn, H. S.; Bard, A. J. J. Am. Chem. Soc. 2016, 138, 313−318.