Embed Size (px)
Citation preview
Supporting InformationSagiv-Barfi et al. 10.1073/pnas.1500712112SI Materials and MethodsWestern Blots for Btk Expression. Western blots were prepared onnitrocellulose using standard techniques. Briefly, cell lysates wereseparated on 4–12% SDS–polyacrylamide gel electrophoresis(SDS/PAGE) under reducing conditions and were transferred tonitrocellulose (Schleicher and Schuell). The blot was thenstained with antiBtk antibody (Cell Signaling) followed by rabbitanti-mouse IgG-HRP (Southern Biotech) or with GAPDH(14C10) Rabbit mAb (HRP Conjugate, Cell Signaling) and wasdeveloped using the enhanced chemiluminescence reagent(Amersham Pharmacia Biotech).
BTK and ITK Occupancy in Mouse Frozen Spleen and Thymus. Spleenand thymus tissues were removed, flash frozen in liquid nitrogen andstored at −80 °C until analysis. Frozen tissues were homogenized inlysis buffer (Cell Lytic M, Sigma C2978) supplemented with proteaseinhibitor mixture (Pierce Protease and phosphatase inhibitor,Thermo Scientific #88669) in a high-speed electronic homogenizer(Polytron). Lysates were incubated for 15–20 min on ice andcentrifuged at 10,600 × g for 15 min at 4 °C. 100 μg of total proteinwas incubated with either the BODIPY-labeled BTK (spleen sam-ple) or ITK (thymus sample) probes (synthesized by Principia Bio-pharma) at 1 μM and incubated for 1 h at room temperature.Lysates were evaluated by SDS/PAGE, on a Typhoon image scanner(GE Healthcare) using the Fluorescein 526 Emission Filter,PMT:800, and Green Laser for probe binding. Gels were transferredto nitrocellulose for total BTK and ITK, membranes were probedovernight with anti-BTK for spleen (BD Biosciences 611117, 1:500)or anti-ITK for thymus (BD Biosciences 51–6979 1N) and blottedwith goat anti-mouse Ab conjugated to Alexafluor 647 (InvitrogenA21236, 1:1,000) for 1 h, and evaluated using the typhoon scannerwith an emission filter of Cy5 670 BP30, and Red Laser. Band in-tensities were quantified using Imagequant software (GE Health-care). For each sample, the fluorescent signal was normalized fortotal protein (either BTK or ITK) and the percent occupancy wascalculated by subtracting the normalized ratio from 100%.
In Vitro Assays. Growth and viability of cells was measured usingPrestoblue Cell Viability reagent (Life Technologies) accordingto the manufacturer’s protocol.
Flow Cytometry. Gr1-FITC, CD11b-PE, CD8-FITC, CD-4 APC,CD25-Pe, FITC-rat IgG2a, and PE-rat IgG2a were from BDPharmingen. Cells were surface stained in PBS, 1% FBS, and 0.01%sodium azide, fixed in 2% (wt/vol) paraformaldehyde, and analyzedby flow cytometry on an FACSCalibur (BD Biosciences). Data werestored and analyzed using Cytobank (www.cytobank.org).
Ibrutinib and Anti–PD-L1 in J558 Tumor Mouse Model.Cell line. J558, a BALB/c plasmacytoma line, was obtained fromATCC. J558 cells were cultured in complete Roswell Park Me-morial Institute 1640 medium (cRPMI; Invitrogen) containing10% (vol/vol) FBS (FBS; Thermo Scientific), 100 U/mL penicillin,100 μg/mL streptomycin (both from Invitrogen).Tumor transplantation and treatment. Tumor cells in exponentialgrowth phase were washed three times and resuspended in RPMImedium without serum. Six- to 8-week-old female BALB/c(jaxmice.jax.org) were inoculated with 5 × 10⁶ J558 cells by s.c.injection to the right hind thigh. Tumor growth was monitoredwith a caliper every 2–3 d and expressed as volume (D × d2 ×0.4). Mice were euthanized when s.c. tumor size reached1,000 mm3. Therapy was started when tumors reached a volumeof 80 mm3. Anti–PD-L1 (10F.9G2, Bio X cell) or rat IgG2bisotype control (LTF-2, Bio X cell) (200 μg per injection) weregiven intraperitoneally (IP) every other day. Ibrutinib dissolvedin vehicle (0.5% methylcellulose, 0.1% sodium lauryl sulfate) orvehicle alone was given by oral gavage daily on day 12–20 aftertumor inoculation at a dose of 24 mg/kg body weight. Mice werehoused in the vivarium of Pharmacyclics. All experiments wereapproved by the Pharmacyclics IACUC committee and con-ducted in accordance with IACUC protocols.
A20
DoH
H2
4T1
CT26
GAPDH
Btk
Fig. S1. BTK expression. Detection of BTK protein expression in A20 cells. Western blotting was performed using an anti-BTK antibody. Anti-Glyceraldehyde-3-phosphate dehydrogenase (GAPDH) was used as a loading control. The molecular weights (in kDa) are shown on the left.
Sagiv-Barfi et al. www.pnas.org/cgi/content/short/1500712112 1 of 5
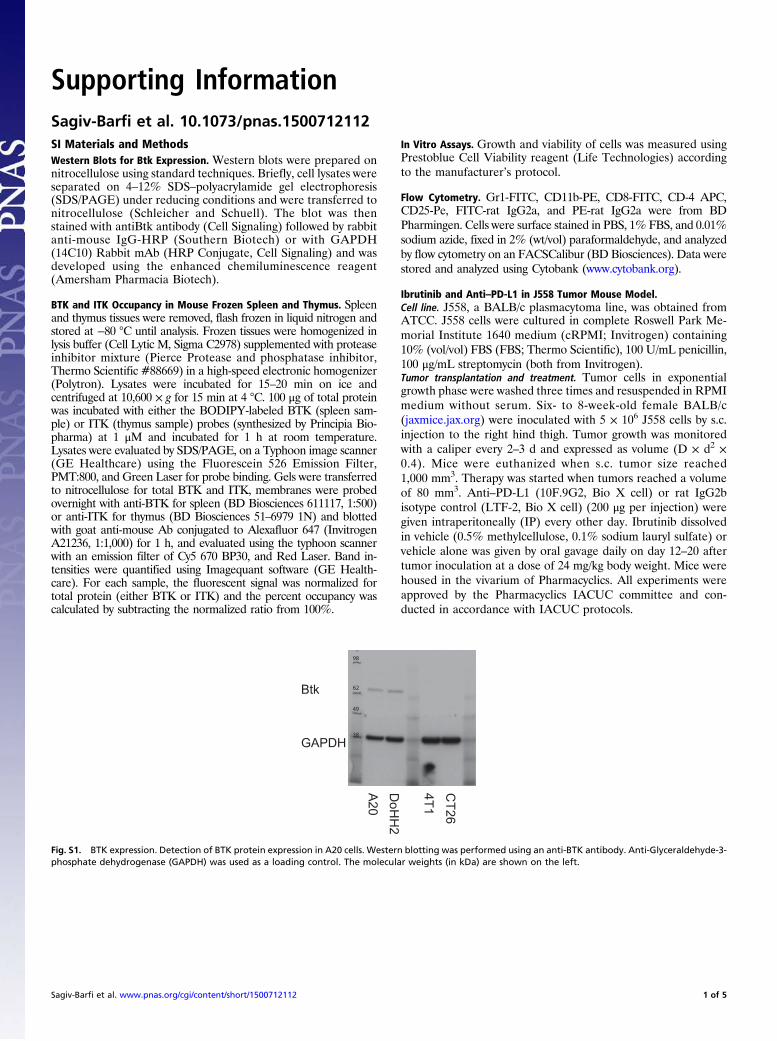
Btk ItkProbe binding
Total protein
Ibrutinib Vehicle Ibrutinib Vehicle
Btk Itk0
50
100
%oc
cupa
ncy
Fig. S2. Ibrutinib occupies both BTK and ITK. Mice splenocytes and thymocytes were collected 1 h following ibrutinib IP dosing. Tissues were incubated withBODIPY-labeled probes and evaluated by SDS/PAGE. (Left) BTK occupancy in the spleen. (Right) ITK occupancy in the thymus. (Lower) Results demonstratingthe percent occupancy of BTK and ITK.
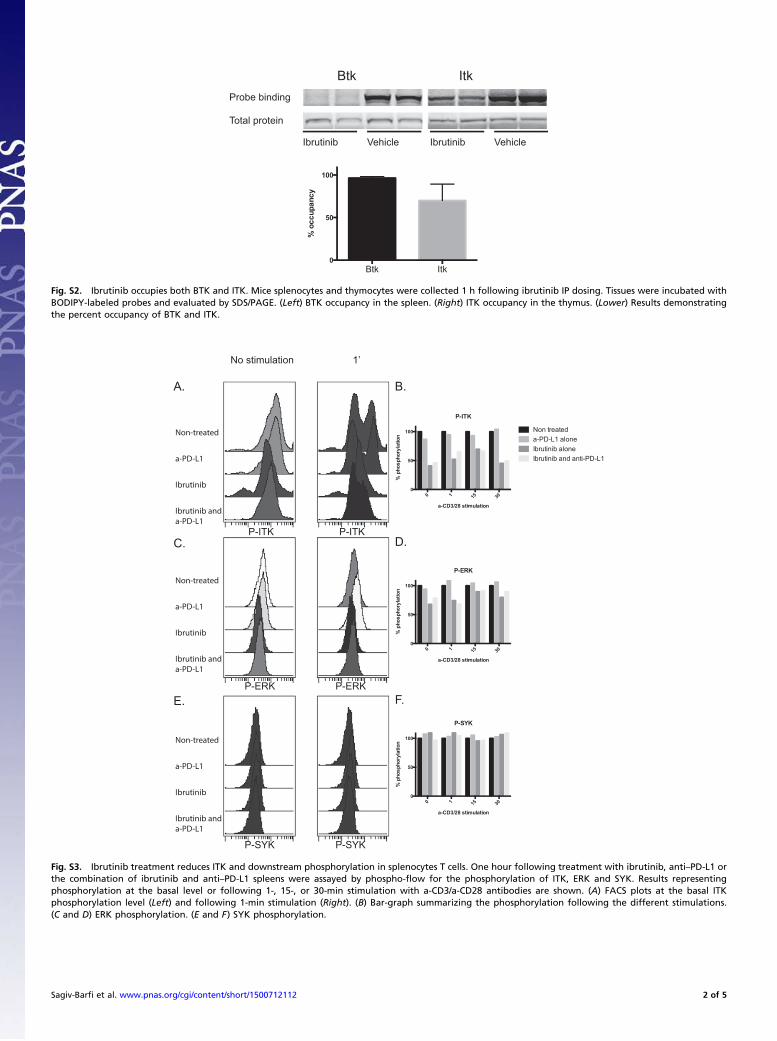
No stimulation 1’
0 1 15 300
50
100
a-CD3/28 stimulation
%phosphorylation
P-ITK
0 1 15 300
50
100
a-CD3/28 stimulation
%phosphorylation
P-SYK
Non treateda-PD-L1 aloneIbrutinib aloneIbrutinib and anti-PD-L1
0 1 15 300
50
100
a-CD3/28 stimulation
%phosphorylation
P-ERK
P-ITK P-ITK
P-ERK P-ERK
P-SYK P-SYK
A.
C.
E.
B.
D.
F.
Fig. S3. Ibrutinib treatment reduces ITK and downstream phosphorylation in splenocytes T cells. One hour following treatment with ibrutinib, anti–PD-L1 orthe combination of ibrutinib and anti–PD-L1 spleens were assayed by phospho-flow for the phosphorylation of ITK, ERK and SYK. Results representingphosphorylation at the basal level or following 1-, 15-, or 30-min stimulation with a-CD3/a-CD28 antibodies are shown. (A) FACS plots at the basal ITKphosphorylation level (Left) and following 1-min stimulation (Right). (B) Bar-graph summarizing the phosphorylation following the different stimulations.(C and D) ERK phosphorylation. (E and F) SYK phosphorylation.
Sagiv-Barfi et al. www.pnas.org/cgi/content/short/1500712112 2 of 5
A20 H11 4T1
CT260
50
100
150
PD-L1 antibody
%Vi
abile
cells
A20H114T1CT26
10.00 5.0
02.5
01.2
50.6
30.3
10.1
60.0
80.0
40.0
00
50
100
Ibrutinb ( M)
%Vi
able
cells
10.00 5.0
02.5
01.2
50.6
30.3
10.1
60.0
80.0
40.0
00
50
100
Ibrutinb ( M)
%Vi
able
cells
A.
B. C.
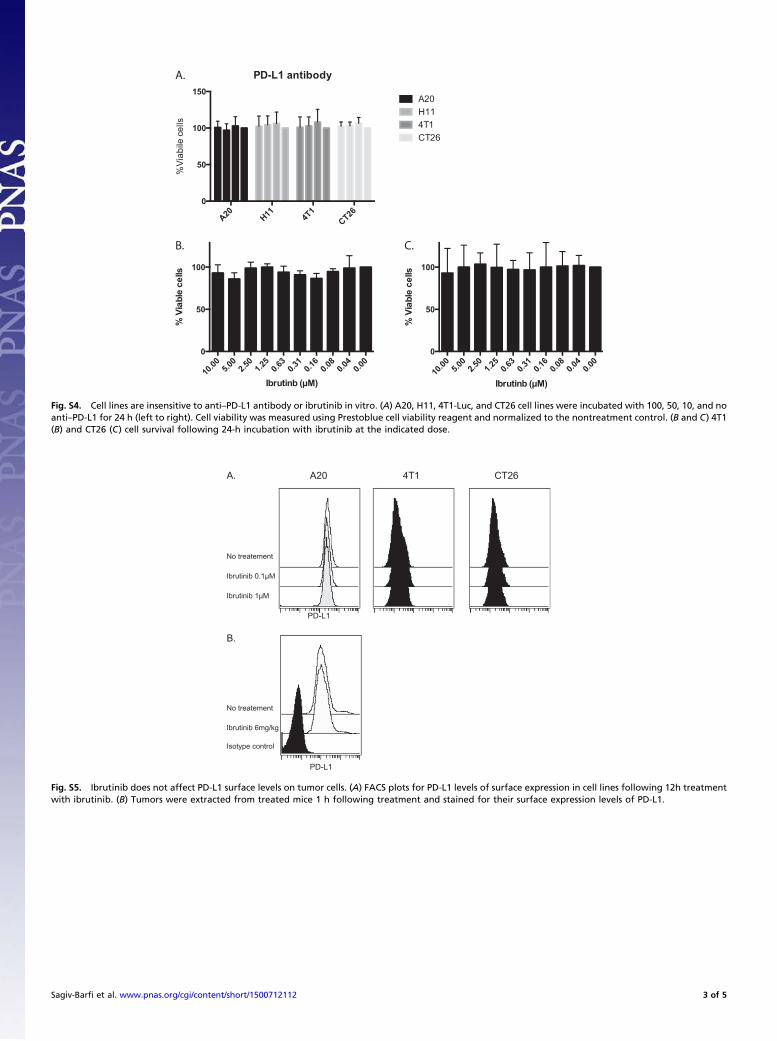
Fig. S4. Cell lines are insensitive to anti–PD-L1 antibody or ibrutinib in vitro. (A) A20, H11, 4T1-Luc, and CT26 cell lines were incubated with 100, 50, 10, and noanti–PD-L1 for 24 h (left to right). Cell viability was measured using Prestoblue cell viability reagent and normalized to the nontreatment control. (B and C) 4T1(B) and CT26 (C) cell survival following 24-h incubation with ibrutinib at the indicated dose.
A20 4T1 CT26
No treatement
Ibrutinib 0.1µM
Ibrutinib 1µM
PD-L1
A.
B.
No treatement
Isotype control
Ibrutinib 6mg/kg
PD-L1
Fig. S5. Ibrutinib does not affect PD-L1 surface levels on tumor cells. (A) FACS plots for PD-L1 levels of surface expression in cell lines following 12h treatmentwith ibrutinib. (B) Tumors were extracted from treated mice 1 h following treatment and stained for their surface expression levels of PD-L1.
Sagiv-Barfi et al. www.pnas.org/cgi/content/short/1500712112 3 of 5
A.
B.
0 10 20 30 400
1000
2000
3000
Tum
orVo
lum
e(m
m)3
Non treated
0 10 20 30 400
1000
2000
3000
Days after inoculation
Tum
orVo
lum
e(m
m)3
Ibrutinib
0 10 20 30 400
1000
2000
3000
Days after inoculation
Tum
orVo
lum
e(m
m)3
anti-PD-L1
0 10 20 30 400
1000
2000
3000
Ibrutinib and anti-PD-L1
Days after inoculationTu
mor
Volu
me
(mm
)3
0 10 20 30 400
50
100
Days after tumor inoculation
Perc
ents
urvi
val Non treated
Ibrutinibanti-PD-L1Ibrutinib and a-PD-L1
* ***
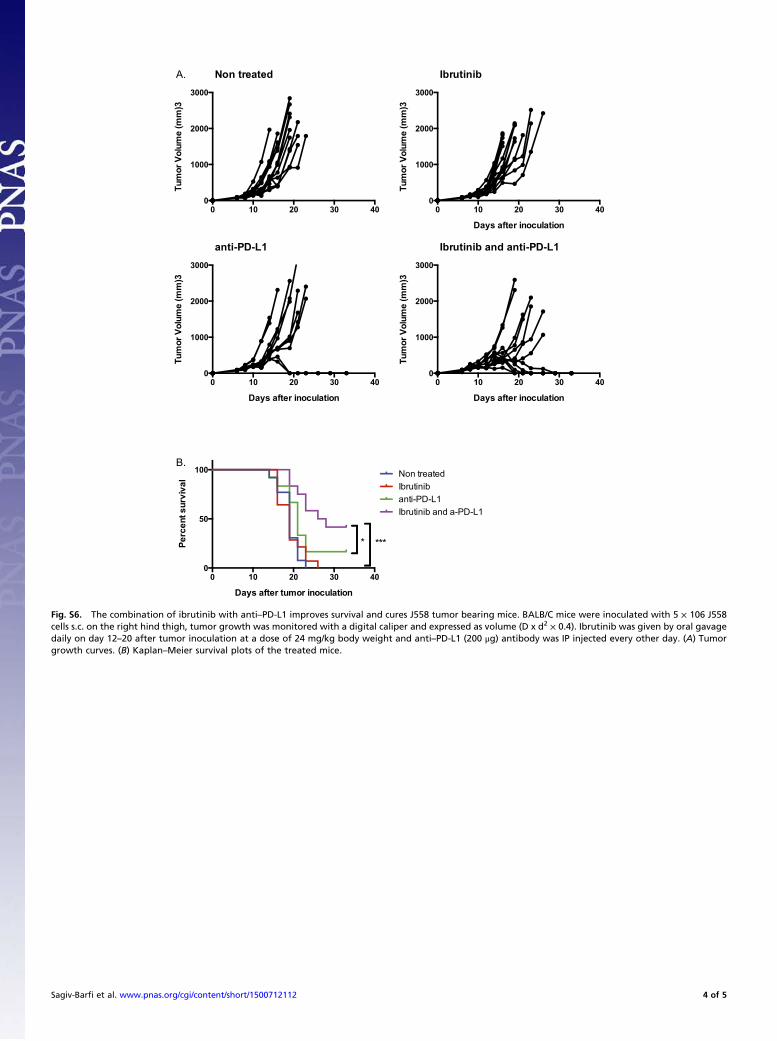
Fig. S6. The combination of ibrutinib with anti–PD-L1 improves survival and cures J558 tumor bearing mice. BALB/C mice were inoculated with 5 × 10⁶ J558cells s.c. on the right hind thigh, tumor growth was monitored with a digital caliper and expressed as volume (D x d2 × 0.4). Ibrutinib was given by oral gavagedaily on day 12–20 after tumor inoculation at a dose of 24 mg/kg body weight and anti–PD-L1 (200 μg) antibody was IP injected every other day. (A) Tumorgrowth curves. (B) Kaplan–Meier survival plots of the treated mice.
Sagiv-Barfi et al. www.pnas.org/cgi/content/short/1500712112 4 of 5
Spleen
Blood
Tumor0
20
40
60
80
100
GR1+CD11b+
%of
live
cells
Non treatedIbrutinibanti-PD-L1Ibrutinb and anti-PD-L1
Spleen
Blood
Tumor0
10
20
30
40
CD4+
%of
lym
phoc
ytes
Spleen
Blood
Tumor0
10
20
30
40
50
CD8+
%of
lym
phoc
ytes
Spleen
Blood
Tumor0
20
40
60
CD4+CD25hi
%of
lym
phoc
ytes
A.
B.
C. D.
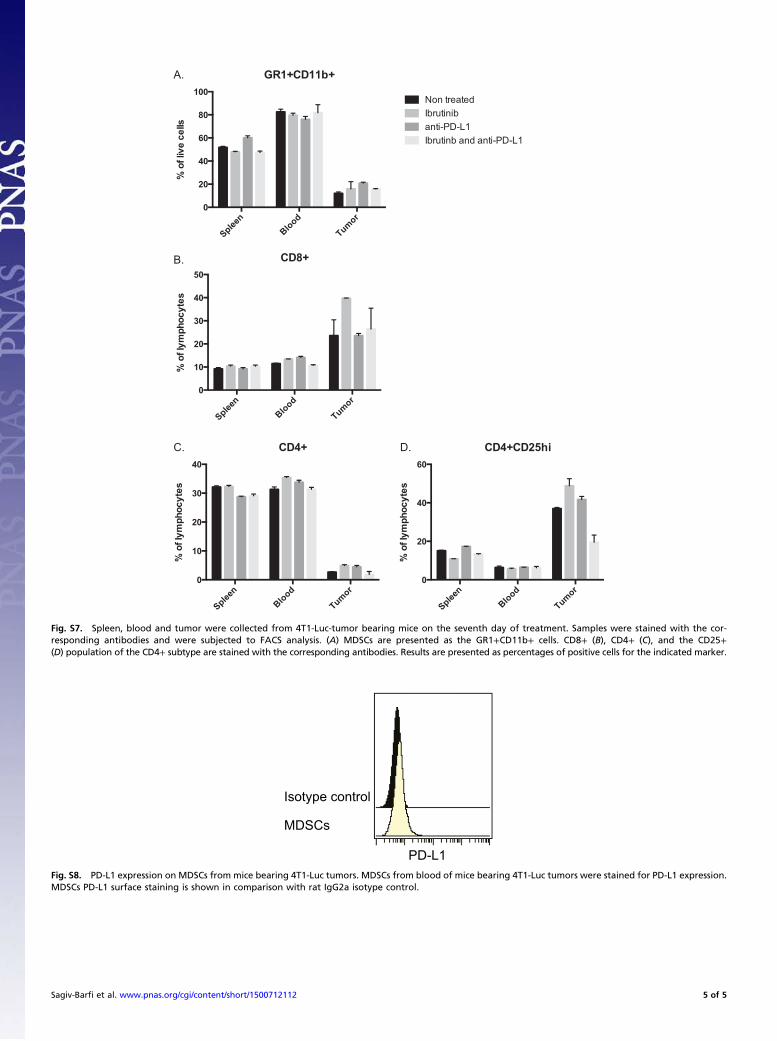
Fig. S7. Spleen, blood and tumor were collected from 4T1-Luc-tumor bearing mice on the seventh day of treatment. Samples were stained with the cor-responding antibodies and were subjected to FACS analysis. (A) MDSCs are presented as the GR1+CD11b+ cells. CD8+ (B), CD4+ (C), and the CD25+(D) population of the CD4+ subtype are stained with the corresponding antibodies. Results are presented as percentages of positive cells for the indicated marker.
MDSCs
Isotype control
PD-L1Fig. S8. PD-L1 expression on MDSCs from mice bearing 4T1-Luc tumors. MDSCs from blood of mice bearing 4T1-Luc tumors were stained for PD-L1 expression.MDSCs PD-L1 surface staining is shown in comparison with rat IgG2a isotype control.
Sagiv-Barfi et al. www.pnas.org/cgi/content/short/1500712112 5 of 5