Embed Size (px)
Citation preview

1
Supporting Information Appendix Text S1. Methods for DNA analysis of fecal samples. Collecting and processing samples. Mpala Research Centre and Conservancy is situated in semi-arid Laikipia, Kenya. Rainfall averages ~600 mm yr-1 in a weakly tri-modal annual pattern with peaks in April-May (long rains), July-August (continental rains), and November (short rains), and a dry season in December-March. Samples were collected in June-July 2013.
We grab-sampled and thoroughly mixed fresh dung in unused zipper bags, avoiding the parts of dung touching soil or vegetation. Fecal samples were stored at ~4° C for 1 – 4 h, mixed thoroughly, and sampled (~0.2 mg) for DNA extraction with a Zymo Xpedition Soil/Fecal DNA mini kit. Prior to freezing, samples were treated with proteinase K, heated to 95°C for 15 min, and treated with RNase A, as a precaution against the transport of foot-and-mouth disease (USDA APHIS permit #122489). Lysate was frozen and transported to Princeton University for DNA extraction and analysis. Samples were processed in small batches (3 – 23; typically 15) with an extraction blank to monitor for potential cross-contamination in a laboratory designed to conduct molecular diet analyses, including separate pre- and post-PCR rooms, with separate equipment for DNA extraction, PCR (including a laminar flow hood), and post-PCR processing. Confirming the identity of buffalo samples. Buffalo are the scarcest large mammalian herbivore (LMH) species in our study (1) and are active nocturnally, which required us to collect fresh buffalo dung in the morning without observing defecation. Because cattle are corralled overnight, sampling fresh buffalo dung in the morning reduced the chances of inadvertently collecting cattle dung, which is morphologically similar to buffalo dung, although the latter is typically larger and less-well defined (2). To further ensure accuracy, we used DNA minibarcodes to confirm identifications of all putative buffalo samples. We amplified and sequenced a portion of the mitochondrial COI gene from buffalo samples using primers Uni-MinibarF1/C1-N-1777 (Table S1). Reaction mixtures comprised 2.5 mM MgCl2, 200 µM each dNTP, 0.1 mg/mL BSA, 4% DMSO, 0.2 µM each primer, Amplitaq Gold polymerase, and 2 µL DNA (10% dilution) in 12.5 µL. Thermocycling included denaturing at 95°C for 10 min, followed by 5 cycles of 95°C for 1 min, 46°C for 1 min, and 72°C for 30 s, then by 35 cycles with an annealing temperature of 53°C, and ending with a 2 min extension at 72°C. Sequences that overlap this COI region were amplified from cattle samples using primers LCO1490/C1-N-1777 and the same reaction conditions, except that annealing was at 46°C for all 40 cycles (Table S1; the primer Uni-MinibarF1 was unsuccessful on cattle samples while the primer LCO1490 was unsuccessful on buffalo samples). When PCR failed on a putative buffalo sample, we sought to determine if it was instead a cattle sample by repeating PCR using primers LCO1490/C1-N-1777. Amplicons were cleaned using ExoSapIT (Affymetrix) and sequencing was conducted at GeneWiz (South Plainfield, NJ) on an ABI 3730. We obtained DNA minibarcodes from >95% (39 of 41) of putative buffalo samples, confirming their identities and the accuracy of our visual identification. Two incorrectly identified samples (collected together) were reassigned to cattle. Laboratory protocols for plant DNA metabarcoding. We utilized the P6 loop of the chloroplast trnL(UAA) region, which can identify a broad array of plant taxa (3). For three plant families that were expected to be frequent in these diets, but for which species-level identifications can be problematic using the trnL-P6 marker (Poaceae, Asteraceae, and Cyperaceae), we also sequenced family-specific internal transcribed spacer 1 (ITS) ribosomal DNA markers (4, 5). For the trnL-P6 marker, we performed 20 µL reactions comprising 2.5 mM MgCl2, 200 µM each dNTP, 0.1 mg/mL BSA, 4% DMSO, 0.2 µM each primer [trnL(UAA)g/trnL(UAA)h], Amplitaq Gold polymerase, and 2 µL of DNA extract.

2
Thermocycling followed a program of initial denaturing at 95°C for 10 min, followed by 35 cycles of 95°C for 30 s, 55°C for 30 s, and 72°C for 30 s, with a 2-min final extension at 72°C. We used the same reaction mixtures for ITS, except that we also performed a multiplex reaction to amplify each of the three ITS targets by mixing 0.3 µM of the forward primer (ITS1-F) with 0.1 µM of each of the three family-specific reverse primers (ITS1Poa-R = Poaceae, ITS1Ast-R = Asteraceae, and ITS1Cyp-R = Cyperaceae; Table S1)(4). Thermocycling followed a program of initial denaturing at 95°C for 10 min, followed by 35 cycles of 94°C for 30 s, 58°C for 30 s, and 72°C for 45 s, with a 2-min final extension at 72°C. We tagged the 5’ end of each DNA metabarcoding primer with an 8-nt multiplex identification (MID) tag that differed by 4-nt from any other tag, thus enabling pooling of up to 96 uniquely identifiable PCR products for sequencing. We used SequalPrep 96-well plates to normalize uniquely tagged PCR products. We then pooled PCR products and concentrated them with Zymo Clean and Concentrator kits. At Princeton University’s Lewis Sigler Institute, ~100 ng of DNA from each pool was converted to an Illumina sequencing library using the Apollo 324TM NGS Library Prep System and PrepX DNA kit (Wafergen, CA), which included DNA end-repairing, A-tailing, adapter ligation, and limited amplification. Different Illumina barcodes were ligated to each pool to enable demultiplexing. Library size distributions were quality-checked (Bioanalyzer DNA HS chips, Agilent, CA), quantified (Qubit fluorometer, Invitrogen, CA), pooled at equal amounts, and sequenced on the Illumina HiSeq 2500 Rapid Flowcell as single-end 170 nt reads along with 7 nt index reads (Illumina, CA). The resulting metabarcode sequences were demultiplexed for use in diet analysis (see Text S3, below). Text S2. Constructing a plant DNA reference library for Mpala Research Centre, Kenya.
Reference plant collections and vouchers. To identify dietary plant sequences obtained from fecal samples, we constructed an extensive DNA reference library of plants occurring throughout Mpala Research Centre and Conservancy. Fertile plant material was collected and voucher specimens were deposited at the National Museums of Kenya and Smithsonian Institution for identification and storage. As part of our ongoing effort to comprehensively catalog and DNA barcode the plant species of Mpala, we have archived these collections and associated DNA data in the Barcode of Life Datasystem (BOLD)(6). To date, the collection includes 1,369 specimens representing ≥291 species (of ~480 species recorded from this region: http://www.mpala.org/documents/Flora_and_Fauna_2_2185861024.pdf). We will continue to update our BOLD database with newly vouchered specimens and expert determinations of provisionally identified specimens. To date, we have identified >99% specimens to family-level, 95% to genus-level, and 80% to species-level. In our analysis, we included all specimens identified to family-level or better, noting that DNA metabarcodes may match specimens that are pending identification.
Laboratory protocols for plant DNA barcoding. To facilitate plant identification, we extracted DNA and sequenced three standard plant DNA barcode loci (matK, rbcL, and psbA-trnH) using established primers and protocols (Table S1)(7, 8). We further sequenced chloroplast trnL(UAA) and nuclear ITS1, which are gene regions that contain the smaller DNA metabarcode gene regions utilized in this study: trnL-P6 and ITS, respectively (Table S1). We sequenced trnL(UAA) and ITS1 in separate 12.5 uL PCR reactions that included 2.5 mM MgCl2, 200 µM of each dNTP, 0.1 mg/mL BSA, 4% DMSO, 0.2 µM of each primer [trnL(UAA)c/trnL(UAA)d and ITS-A/ITS-C, respectively], NEB Taq polymerase, and 2 µL DNA extract. Thermocycling for ITS1 included initial denaturing at 95°C for 2 min, followed by 35 cycles of 95°C for 30 s, 55°C

3
for 30 s, and 72°C for 45 s, with a 5-min final extension at 72°C, whereas the trnL(UAA) protocol proceeded at 95°C for 4 min, 35 cycles of 94°C for 30 s, 50°C for 30 s, and 72°C for 1 min, with a 5-min final extension at 72°C. Amplicons were cleaned using ExoSapIT and sequenced using an ABI 3730 at GeneWiz. Text S3. DNA metabarcode demultiplexing, quality control, and species identification.
Sequence demultiplexing, quality control, and preliminary identifications were performed using obitools (http://metabarcoding.org/obitools). We used the ngsfilter command to identify sequences by locus and sample, based on two criteria: (a) 100% matches to MID tags and (b) no more than two mismatches with primers. Sequences with nucleotide ambiguities or mean Illumina fastq quality scores <30 across the head, tail, or total length of the sequence were dropped. We used the obiuniq command to group identical sequences and tally them within samples, enabling us to quantify the relative read abundance (RRA) of each sequence (Text S4). Sequences that occurred ≤1000 times overall, or that were ≤10 bp for trnL-P6 or ≤30 bp for ITS, were discarded. We considered sequences to be likely PCR artifacts if they were highly similar to another sequence (1 bp difference) and had a much lower abundance (0.05%) in the majority of samples in which they occurred; we discarded these using the obiclean command. We further eliminated potential chimeras, PCR and sequencing errors, and low-template-quality samples by sequentially removing sequences with poor matches to reference DNA data (≤95% or 99% identity for trnL-P6 or ITS markers, respectively) and low per-sample read frequency (≤0.01). Finally, we excluded fecal samples with a low final sequence count (<1,000).
We constructed reference plant DNA libraries using the ecoPCR command to extract trnL-P6 and ITS sequences from (a) our plant DNA database from Mpala (Text S2) and (b) the global European Molecular Biology Laboratories (EMBL) database (release 118). The locally collected reference database yielded 197 unique trnL-P6 sequences from the 1,136 plant specimens from which we successfully sequenced trnL(UAA); 77% of the sequences in this subset represented single species/morphospecies, indicating that our metabarcode data can yield fine-scale identifications for most plant taxa in the community. We likewise constructed local reference libraries for each of the three family-specific ITS markers: from 184 Poaceae specimens, we obtained 50 unique sequences, only seven of which could match multiple species or morphospecies; from 80 Asteraceae specimens, we obtained 22 unique sequences, only three of which matched multiple species or morphospecies; from eight Cyperaceae specimens, we obtained three unique sequences, only one of which had been identified to species-level.
We identified dietary sequences using the ecoTag command, inspecting and revising taxonomic assignments to ensure validity (Table S3 for trnL-P6; Table S7 for ITS). First, we assigned species identities to DNA metabarcode sequences with exact matches (100% identity) to reference sequences; when a dietary sequence exactly matched multiple reference sequences, we revised assignments to the finest taxonomic level that encompassed all matching sequences. Second, we used ecoTag to identify the finest taxonomic level that encompassed all DNA sequences when no exact match was made. All sequences were identified at least to family-level; some could not be identified to genus, resulting in matches to sub-familial clades (e.g., the PACMAD clade of Poaceae that contains all C4 grasses; Tables S3,S7). Third, if percent identity was identical to different taxa in the local and EMBL databases, we gave preference to the local database (13 instances for trnL-P6 and 6 for ITS; Tables S3 and S7, respectively). In some cases a sequence matched a taxon in EMBL with a native range that is not known to include Kenya;

4
we noted such instances (Table S3,S7). Finally, we discarded sequences from ITS datasets that were assigned to a plant family other than the one targeted by the family-specific marker.
Text S4. Quantification of DNA metabarcode relative read abundance (RRA).
Sequence read relative abundance (RRA) is defined as the proportion of unique Illumina sequence reads in a sample divided by the final number of sequence reads (i.e., post-quality control) in that sample. We quantified RRA of dietary sequences to (a) provide insight into the relative amount of different plant types in diets and (b) assess whether RRA-based inferences differed qualitatively from those obtained using occurrence-based (i.e., presence/absence) data.
Cross-validating plant family-level RRA comparisons with stable isotopes. Evidence suggests that RRA can reflect the quantitative consumption patterns of LMH, at least for coarsely circumscribed plant groups (9), but this has not yet been extensively validated. We assessed the robustness of RRA for comparisons of grass:browse consumption by comparing proportional grass (family Poaceae) representation in samples (mean RRA) with estimates of proportional C4-plant representation inferred from fecal stable carbon isotopes. Numerous studies have used stable carbon isotopes to quantify proportional intake of grasses by LMH in African savannas, where the C4 photosynthetic pathway used by Afro-tropical grasses produces a distinct isotopic signature from that of other plants (e.g., 10, 11, 12). (There are some exceptions to this rule, such as non-grasses with C4 photosynthesis, but none of the known exceptions in our study area occurred frequently in LMH diets.) We compared mean Poaceae RRA for each LMH species with isotopic estimates of proportional C4 consumption drawn from (a) a subset of the same fecal samples used for DNA metabarcoding and (b) prior studies from sub-Saharan Africa. When collecting fecal DNA samples, we simultaneously saved fecal samples for stable-isotope analysis. We also collected leaf tissue from five individuals of four common plant species (C4 grasses Cynodon plectostachyus and Digitaria milanjiana, C3 forb Solanum campylacanthum, and C3 tree Acacia brevispica) to serve as end-members in a two-source isotopic mixing model. Samples were dried to constant weight at 72ºC (as stipulated by USDA APHIS permit #122489), stored with desiccant, and transported to Princeton University. Prior to fecal sample preparation, we applied an additional 1-hour heat-shock treatment in a 130ºC oven as a precaution against the Q fever bacterium Coxiella burnetii, which is endemic at our study site. To test for potential effects of this treatment on isotopic results, we collected five fecal samples from each of three domestic LMH on New Jersey farms (horse, Equus ferus; sheep, Ovis aries; and cattle, Bos taurus), as analogs for our study species; because Q fever is not endemic in New Jersey, a portion of each of these samples could be dried at 72ºC only, while the remainder were dried and heat-shocked as for the Kenyan samples. Samples from each species (N = 4-5) were homogenized with a mortar and pestle in liquid N2, weighed into tin boats (~3 mg), and analyzed for δ13C and δ15N at the University of California Santa Cruz Stable Isotope Facility (Dumas combustion in a Carlo Erba 1108 elemental analyzer coupled to a ThermoFinnigan Delta Plus XP isotope ratio mass spectrometer).
After applying the paired heat treatments to LMH dung from New Jersey farms, δ13C values did not differ between treatment groups (paired t-test: t = -1.39, df = 14, P = 0.19), so we proceeded with analysis of our heat-treated Kenyan samples. We ran one duplicate sample for each LMH and plant species, which demonstrated low instrumental error (δ13C differed by <0.1‰ for duplicate plant samples and <0.5‰ for duplicate LMH samples). The dung of LMH species differed significantly in δ13C signatures (Table S4). We excluded one Grevy’s zebra sample from this and subsequent isotopic analyses because it came from a foal and had radically

5
outlying δ13C and δ15N values, perhaps due to a largely milk-based diet. We used a two-source carbon-isotope mixing model to estimate the proportion C4 in samples with the Stable Isotope Analysis in R (SIAR) software (13). We parameterized C3- and C4-source end members based on the local plant samples (δ13C = -27.63‰ ± 0.36 SD and -14.14‰ ± 0.10 SD for C3 and C4 end points, respectively), which closely matched values used in prior analyses (11, 14). We assumed tissue-enrichment factors based on the mean diet-to-feces fractionations measured in six mammalian herbivores fed fixed C3/C4 diets in a prior study (15)(0.6 ± 0.3 and 1.4 ± 0.3 for C3 and C4 sources, respectively), which closely correspond to values used in prior fecal analyses of African LMH (11, 12, 14).
We tested for correlations between (a) the RRA of grasses and corresponding δ13C values measured from the same samples and (b) the mean grass RRA from the subset of samples from each LMH species used in the SIAR analysis of proportional C4 consumption. We concluded that family-level inferences of proportional grass consumption based on RRA of our trnL-P6 metabarcode data are likely to be reliable because they were consistent with stable isotope values.
Comparing sequence-level occurrence- and RRA-based metrics. We found a positive correlation between occurrence- and RRA-based metrics of species-level niche breadth (t = 2.52, df = 5, R2 = 0.53, P = 0.05; Table 1). Likewise, we found a strong correlation between occurrence- and RRA-based measures of interspecific niche overlap (Mantel r = 0.911, P = 0.001; Table 1). Occurrence-based measures of interspecific dietary dissimilarities were lower than RRA-based dissimilarity measures, suggesting that occurrence provides the more conservative measure with regard to dietary niche partitioning (Table 1). Bipartite networks based on mean RRA show that plant taxa with a high relative frequency of occurrence (FOO) also exhibited high RRA (compare Table S3 and Fig. S6A,B).
Diet composition varied as a function of LMH body mass when compared using RRA-based dissimilarity metrics (adonis: pseudo-F1,290 = 27.0, R2 = 0.09, P ≤0.0001; compare Fig. S6C with Fig. 3). This relationship between body mass and diet remained statistically significant (adonis: pseudo-F1,288=33.3, R2 = 0.09; P ≤0.0001) when considering feeding guild (adonis: pseudo-F1,288=47.5, R2 = 0.12, P ≤0.0001) and the body mass*guild interaction (adonis: pseudo-F1,288= 21.7, R2 = 0.06, P ≤0.0001). Considerable dietary niche partitioning among LMH species was also evident using RRA (adonis: pseudo-F6,285 = 33.8, R2 = 0.42, P ≤0.0001; Fig. S6D). Collectively, these analyses show that our conclusions are qualitatively consistent using both RRA and occurrence-based metrics. Text S5. Daily movements of GPS-collared zebra.
We quantified daily movements of six zebra (four Equus grevyi and two E. quagga) using GPS telemetry. Zebras were collared using custom-made GPS-GSM Savannah Tracking Collars as part of a different study by D.I.R. We analyzed movement data from a period close to sample collection (March 31 – May 31, 2014), with animal locations recorded at 15-minute intervals, to determine the mean daily area over which zebra foraged. The mean gastrointestinal retention time (from consumption to defecation) for Grevy’s zebra is approximately one day [25 h ± 8.5 SD for solutes, 28 h ± 7.2 SD for particles (16)]. Thus, the area covered by an individual over one day roughly encompasses the range of potential food plants that could be contained in a fecal sample, and samples collected from within an area of that size are likely to have been deposited by individuals foraging within similar plant communities. Zebras of both species ranged over similar distances during the course of our study, moving an average of 11.2 km per
6
day (range = 8.2 – 14.8 for Grevy’s; 9.7 – 10.6 for plains), encompassing minimum convex polygons with average area of 545 ha (range = 247 – 1,121 for Grevy’s; 478 – 489 for plains) and approximate circular diameters of 2.3 km (Table S5). We therefore used a distance threshold of 2.3 km to analyze subsets of samples from individuals that likely had foraged in similar habitats and encountered similar relative availability of different plant species (see Main Text). We also used this value for buffalo and cattle, for which no movement data were available. Text S6. Assessing the robustness of the trnL-P6 marker using family-specific ITS markers.
To evaluate the reliability of our conclusions based on trnL-P6, we used family-specific ITS metabarcode markers (Text S3), which should provide greater species-level taxonomic resolution of plant sequences within the Poaceae, Asteraceae, and Cyperaceae (5, 17). It is necessary to analyze data separately for ITS and trnL-P6 markers because each has different coverage (i.e., breadth of taxa that can be amplified), specificity (i.e., ability to identify sequences above or below the species-level), and biases (e.g., amplification bias due to primer mismatching). Thus, we used the ITS data to independently validate conclusions based on trnL-P6 about the relative dietary importance of species within each of the three plant families. To do this, we analyzed bipartite networks and dietary dissimilarity using occurrence-based metrics.
The grasses most frequently detected by ITS, including Pennisetum spp., were also frequently detected by trnL-P6 (Tables S3,S7). However, some grasses frequently detected by trnL-P6 (e.g., Cynodon plectostachyus; Table S3) were not detected by ITS (Table S7; Fig. S7A). Surprisingly, ITS revealed high FOO of some grasses in dik-dik diets: at least one grass sequence was detected in 100% of samples (Table S1), with >90% FOO of the top two grass sequences (Table S7). This might be a result of (a) biased PCR amplification of higher-abundance templates using trnL-P6 (i.e., grasses have relatively low abundance in dik-dik diets), (b) differences in nuclear vs. chloroplast grass DNA abundance, and/or (c) greater read depth of Poaceae-specific ITS than trnL-P6 (Table S2). The grasses in dik-dik diets had greater overlap with those in mixed-feeder (impala, elephant) diets than those in grazer diets (Fig. S7A). Although the extent of the dietary niche partitioning of grasses inferred from the Poaceae-specific ITS marker was lower than that observed for all taxa using the trnL-P6 marker, we found significant differences among LMH species using ITS, which were qualitatively similar to those obtained using trnL-P6 (adonis: pseudo-F6,286 = 28.3, R2 = 0.37, P ≤0.0001; Fig. S7B).
In this grass-specific ITS-based analysis, intraspecific sequence diversity may occur for several plant taxa (Table S7) and artificially increase the dissimilarity measured among samples within LMH species. For example, Eragrostis papposa and Brachiaria deflexa both yielded 100% matches to >1 dietary sequences, which differed in FOO among LMH species (Table S7). Merging unique sequences that matched a single plant taxon within LMH samples resulted in a minor increase in the effect size of dietary niche partitioning (adonis: pseudo-F6,286 = 28.8, R2 = 0.38, P ≤0.0001). To a lesser extent, similar intraspecific diversity may also occur within the trnL-P6 dataset (e.g., Pennisetum spp.; Tables S3,S7). However, as observed in this grass-specific ITS analysis, such variation should only diminish the niche-partitioning signal. Species-level botanical determinations of grass specimens from our Mpala reference collection that are currently awaiting review by experts will further improve the precision of this analysis.
The Asteraceae-specific ITS marker also yielded results consistent with those found using trnL-P6. The most frequently detected asters, including Hirpicium diffusum and Gutenbergia spp., were relatively frequent in the diets of elephants, impala, dik-dik, and cattle, whereas no aster was detected with high frequency in the diets of either zebra or buffalo (Fig.

7
S7C). The ITS analysis indicated substantial overlap in use of plants from this family between cattle and the three non-grazers (Fig. S7C), paralleling the indication from trnL-P6 that cattle diets overlap as much with traditionally defined grazer species as they do with traditionally defined non-grazer species (Table 1). The asters detected using the ITS marker differed significantly among LMH species (adonis: pseudo-F6,130 = 8.38, R2 = 0.28, P ≤0.0001). Aster sequences were more frequently detected in dik-dik samples than in samples of any other LMH species, and inter-individual variation was considerable among them (Table S2; Fig. S7D).
The Cyperaceae-specific ITS marker yielded no exact match to Cyperaceae sequences in the reference database, although an abundance of sequences from non-target plant families suggests the fidelity of these primers for Cyperaceae DNA templates may be low. With a >95% identity threshold, only two sequences from nine samples were obtained using the Cyperaceae-specific ITS markers (Table 2). Thus, differences between the ITS and trnL-P6 markers in the detectability of plants in this family would not significantly alter our results (Tables S3,S7).
In summary, the three ITS markers provide independent evidence that suggests our results are not highly sensitive to the limited specificity and/or potential amplification biases of the broad-spectrum trnL-P6 marker, and thus that our conclusions are robust. Dietary profiles were qualitatively consistent across both markers, despite technical limitations inherent to each. References in Supporting Information 1. Augustine DJ (2010) Response of native ungulates to drought in semi-arid Kenyan
rangeland. African Journal of Ecology 48:1009-1020. 2. Stuart C & Stuart T (2003) A field guide to the tracks and signs of southern and east
African wildlife (Struik Publishers, Cape Town). 3. Taberlet P, Coissac E, & Pompanon F (2007) Power and limitations of the chloroplast
trnL (UAA) intron for plant DNA barcoding. Nucleic Acids Research 35:e14. 4. De Barba M, et al. (2013) DNA metabarcoding multiplexing and validation of data
accuracy for diet assessment: application to omnivorous diet. Molecular Ecology Resources doi: :10.1111/1755-0998.12188.
5. Baamrane MAA, et al. (2012) Assessment of the food habits of the Moroccan Dorcas Gazelle in M'Sabih Talaa, West Central Morocco, using the trnL approach. PLoS ONE 7(4):e35643.
6. Ratnasingham S & Hebert PDN (2007) BOLD: The barcode of life datasystem (http://www.barcodinglife.org). Molecular Ecology Notes 7:355-364.
7. Ivanova NV, Fazekas AJ, & Hebert PDN (2008) Semi-automated, membrane-based protocol for DNA isolation from plants. Plant Molecular Biology Reporter 26:186-198.
8. Fazekas AJ, Kuzmina ML, Newmaster SG, & Hollingsworth PM (2012) DNA barcoding methods for land plants. DNA barcodes: methods and protocols, eds Kress WJ & Erickson DL (Springer Science+Business Media).
9. Willerslev E, et al. (2014) Fifty thousand years of Arctic vegetation and megafaunal diet. Nature 506:47–51.
10. Cerling TE, Harris JM, & Passey BH (2003) Diets of east African Bovidae based on stable isotope analysis. Journal of Mammalogy 84(2):456-470.
11. Codron D, et al. (2007) Diets of savanna ungulates from stable carbon isotope composition of feces. J Zool 273:21-29.
12. Codron D, et al. (2005) Assessing diet in savanna herbivores using stable carbon isotope ratio of faeces. Koedoe 48(1):115-124.
8
13. Parnell A & Jackson A (2013) siar: Stable Isotope Analysis in R), v. 4.2. 14. Radloff FGT, Van der Waal C, & Bond AL (2013) Extensive browsing by a conventional
grazer? Stable carbon isotope analysis reveals extraordinary dietary flexibility among Sanga cattle of North Central Namibia. Isotopes in Environmental and Health Studies 49(3):318-324.
15. Sponheimer M, et al. (2003) An experimental study of carbon-isotope fractionation between diet, hair, and faeces of mammalian herbivores. Canadian Journal of Zoology 71:871-876.
16. Steuer P, et al. (2011) Is there an influence of body mass on digesta mean retention time in herbivores? A comparative study on ungulates. Comparative Biochemistry and Physiology 160(3):355-364.
17. De Barba M, et al. (2014) DNA metabarcoding multiplexing and validation of data accuracy for diet assessment: application to omnivorous diet. Molecular Ecology Resources 14(2):306-323.
18. Brown DS (2011) Molecular analysis of the diet of British reptiles. PhD (Cardiff University, UK).
19. Blattner FR (1999) Direct amplification of the entire ITS region from poorly preserved plant material using recombinant PCR. BioTechniques 27:1180-1186.
20. Levin RA, et al. (2003) Family-level relationships of Onagraceae based on chloroplast rbcL and ndhF data. American Journal of Botany 90:107-115.
21. Kress WJ, et al. (2009) Plant DNA barcodes and a community phylogeny of a tropical forest dynamics plot in Panama. Proceedings of the National Academy of Sciences of the United States of America 106:18621-18626.
22. Ford CS, et al. (2009) Selection of candidate DNA barcoding regions for use on land plants. Botanical Journal of the Linnean Society 159:1-11.
23. Dunning LT & Savolainen V (2010) Broad-scale amplification of matK for DNA barcoding land plants, a technical note. Botanical Journal of the Linnean Society 164:1-9.
24. Sang T, Crawford DJ, & Stuessy TF (1997) Chloroplast DNA phylogeny, reticulate evolution and biogeography of Paeonia (Paeoniaceae). American Journal of Botany 84:1120-1136.
25. Taberlet P, Gielly L, Pautou G, & Bouvet J (1991) Universal primers for amplification of three non-coding regions of chloroplast DNA. Plant Molecular Biology 17:1105-1109.
26. Folmer O, Black M, Hoeh W, Lutz R, & Vrijenhoek R (1994) DNA primers for amplification of mitochondrial cytochrome c oxidase subunit I from diverse metazoan invertebrates. Molecular Marine Biology and Biotechnology 3:294-299.
27. Meusnier I, et al. (2008) A universal DNA mini-barcode for biodiversity analysis. BMC Genomics 9:214.

9
Table S1. Primers utilized in this study. Primer Sequence Reference
C1-N-1777 ACTTATATTGTTTATACGAGGGAA (18) ITS-A GGAAGGAGAAGTCGTAACAAGG (19) ITS-C GCAATTCACACCAAGTATCGC (19) ITS1-F GATATCCGTTGCCGAGAGTC (5)
ITS1Ast-R CGGCACGGCATGTGCCAAGG (5) ITS1Cyp-R GGATGACGCCAAGGAACAC (17) ITS1Poa-R CCGAAGGCGTCAAGGAACAC (5)
rbcLa-F ATGTCACCACAAACAGAGACTAAAGC (20) rbcLa-R ATGTCACCACAAACAGAGACTAAAGC (21) matK-xf TAATTTACGATCAATTCATTC (22)
matK-MALP ACAAGAAAGTCGAAGTAT (23) matK-1RKIM-f ACCCAGTCCATCTGGAAATCTTGGTTC Ki-Joong Kim, pers. comm.
matK-3FKIM-r CGTACAGTACTTTTGTGTTTACGAG Ki-Joong Kim, pers. comm.
psbA3-f GTTATGCATGAACGTAATGCTC (24) trnL(UAA)c CGAAATCGGTAGACGCTACG (25) trnL(UAA)d GGGGATAGAGGGACTTGAAC (25) trnL(UAA)g GGGCAATCCTGAGCCAA (3) trnL(UAA)h CCATTGAGTCTCTGCACCTATC (3)
trnHR GAACGACGGGAATTGAAC (24) LCO1490 GGTCAACAAATCATAAAGATATTGG (26)
Uni-MinibarF1 TCCACTAATCACAARGATATTGGTAC (27)

10
Table S2. Sample sizes and numbers of sequences at key stages in the analysis. Family-specific ITS markers are signified by the first three letters of each family (Asteraceae = ITS-Ast; Cyperaceae = ITS-Cyp; Poaceae = ITS-Poa).
Marker Buffalo Cattle Dik-‐Dik Elephant Grevy’s Impala Plains Fecal samples analyzed Both 39 52 47 27 39 48 41
High quality sequence reads trnL-‐P6 904,058 734,943 845,875 446,558 387,893 566,179 436,981 ITS-Ast 18,968 262,236 2,351,560 556,694 13,843 1,096,130 14,348 ITS-Cyp 70,498 82,231 75,150 384,666 137,160 38,884 73,536 ITS-Poa 2,663,441 3,354,647 2,308,587 1,917,662 2,324,895 3,417,551 3,452,295
Final # samples trnL-‐P6 39 52 46 27 39 48 41 ITS-Ast 1 29 39 20 1 45 2 ITS-Cyp 2 0 0 5 1 0 1 ITS-Poa 39 52 47 27 39 48 41
Final # unique sequences trnL-‐P6 62 54 45 46 40 60 32 ITS-Ast 3 6 12 9 4 7 2 ITS-Cyp 1 0 0 2 1 0 1 ITS-Poa 29 28 24 21 26 21 28

11
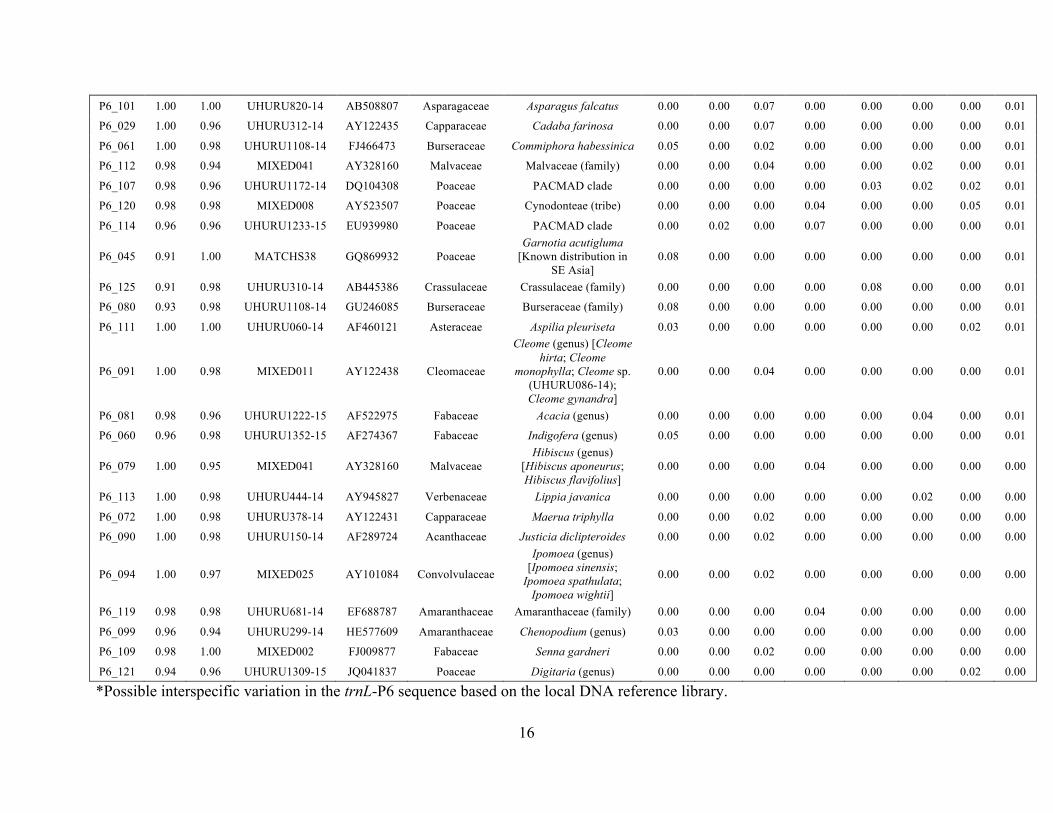
Table S3. Identification of trnL-P6 dietary sequences and their relative frequency of occurrence (FOO) in samples from each LMH species. Sequence information for each trnL-P6 metabarcode sequence includes the best match (% identity expressed as a proportion) to a reference sequence in the local Mpala or EMBL database (including references to BOLD Process IDs in the archived local reference library and EMBL accession numbers, respectively). Sequences are identified to family or better. When exact matches were made to multiple taxa, assignments were adjusted to the next-highest taxonomic level (shown in parentheses) and each matching species is listed in brackets. Representative BOLD Process ID numbers are given in parentheses for exact matches to morphospecies that have not been identified to species-level. In cases where exact matches in the EMBL database were to species that may not occur in Kenya, we provide that species’ known distribution in brackets. When no exact match was made to either database, the finest taxonomic level including all best-matching taxa is given in parentheses.
Sequence Information Sequence Identification Frequency of Occurrence
Seq. Local EMBL Local EMBL Family Best Identity Buffalo Cattle Dik-Dik Elephant Grevy's Impala Plains Total
P6_020 1.00 0.98 UHURU575-14 EF196918 Poaceae Cynodon plectostachyus 0.90 0.98 0.00 1.00 0.95 0.96 0.66 0.76
P6_024 1.00 0.98 MIXED016 EU056305 Poaceae
Digitaria (genus) [Digitaria milanjiana;
Digitaria velutina; Digitaria spp.
(UHURU429-14; UHURU1262-15)]
0.97 1.00 0.02 0.33 0.77 0.90 0.76 0.70
P6_025 0.96 0.94 UHURU575-14 EF196918 Poaceae Cynodonteae (tribe) 0.46 0.96 0.04 0.78 1.00 0.98 0.66 0.70
P6_017 1.00 0.98 MIXED044 AF274360 Fabaceae Indigofera (genus)
[Indigofera circinella; Indigofera hochstetteri]
0.85 1.00 0.87 0.30 0.33 0.98 0.02 0.66
P6_021 1.00 0.98 UHURU978-14 DQ890472 Poaceae Pennisetum stramineum* 1.00 0.50 0.00 0.59 0.97 0.44 0.98 0.62
P6_008 1.00 0.98 UHURU602-14 EU939989 Poaceae Pennisetum mezianum* 0.56 0.69 0.00 0.19 0.87 0.04 0.95 0.47
P6_026 1.00 0.98 UHURU026-14 JX870569 Fabaceae Acacia brevispica 0.59 0.23 0.70 1.00 0.03 0.81 0.00 0.46
P6_022 1.00 0.98 MIXED004 EF156683 Poaceae
Andropogonea (tribe) [Bothriochloa insculpta;
Cymbopogon commutatus;
Hyparrhenia anamesa; Hyparrhenia sp. aff.
Nubica]
0.69 0.65 0.00 0.07 0.56 0.08 1.00 0.45
P6_007 0.98 0.96 UHURU1337-15 AF274360 Fabaceae Indigofera (genus) 0.46 0.85 0.37 0.04 0.08 0.69 0.00 0.40
P6_003 1.00 0.98 MIXED001 FJ009898 Fabaceae
Acacia (genus) [Acacia drepanolobium; Acacia
etbaica; Acacia gerrardii; Acacia tortilis]
0.15 0.08 0.93 0.93 0.00 0.71 0.00 0.38

12
P6_042 0.96 0.94 UHURU602-14 AY769175 Poaceae PACMAD clade 0.36 0.75 0.00 0.19 0.72 0.08 0.46 0.37
P6_035 1.00 0.98 MIXED017 AY769175 Poaceae
PACMAD clade [Dinebra retroflexa;
Enteropogon macrostachyus; Melinis
repens; Microchloa kunthii]
0.38 0.65 0.00 0.48 0.69 0.13 0.24 0.36
P6_011 1.00 1.00 MIXED021 HQ696727 Malvaceae Malvaceae (family)
[Hibiscus calyphyllus; Malva parviflora]
0.62 0.29 0.61 0.07 0.00 0.65 0.05 0.35
P6_051 1.00 0.98 MATCHS38 AY116259 Poaceae
PACMAD clade [Brachiaria eruciformis;
Setaria sphacelata; Setaria verticillata;
Sporobolus africanus; Sporobolus festivus;
Sporobolus pyramidalis; Sporobolus stapfianus;
Chrysopogon plumosus; Setaria sp. (UHURU639-
14); Sporobolus sp. (UHURU593-14)]
0.36 0.12 0.00 0.33 0.64 0.15 0.90 0.34
P6_001 1.00 0.98 MIXED005 GU594587 Poaceae
Paniceae (tribe) [Brachiaria lachnantha;
Panicum maximum; Urochloa brachyura]
0.87 0.31 0.00 0.52 0.15 0.10 0.44 0.32
P6_006 1.00 0.98 UHURU1222-15 AF522975 Fabaceae Acacia mellifera 0.03 0.00 0.63 0.59 0.00 0.85 0.02 0.30
P6_033 1.00 0.96 UHURU890-14 EF156683 Poaceae Themeda triandra 0.62 0.19 0.00 0.00 0.31 0.00 0.98 0.29
P6_058 1.00 0.96 UHURU470-14 AM266936 Rubiaceae Pentanisia ouranogyne 0.36 0.58 0.20 0.00 0.03 0.48 0.02 0.27
P6_049 1.00 0.98 UHURU1242-15 AY116262 Poaceae PACMAD clade
[Poaceae sp. (UHURU1242-15)]
0.28 0.19 0.00 0.04 0.33 0.04 0.73 0.23
P6_014 1.00 0.98 MIXED019 DQ655886 Poaceae
Chloridoideae (subfamily) [Eragrostis
papposa; Eragrostis racemosa; Sporobolus
ioclados]
0.00 0.31 0.00 0.00 0.59 0.17 0.34 0.21
P6_034 1.00 0.96 MATCHS10 FJ847837 Phyllanthaceae
Phyllanthus (genus) [Phyllanthus sepialis;
Phyllanthus sp. (UHURU699-14)]
0.31 0.38 0.22 0.00 0.03 0.31 0.00 0.20
P6_064 1.00 0.98 UHURU556-14 DQ655884 Poaceae Harpachne schimperi 0.00 0.48 0.00 0.04 0.44 0.06 0.24 0.19

13
P6_037 0.98 0.96 MIXED016 EF156733 Poaceae Panicoideae (subfamily) 0.92 0.08 0.00 0.11 0.21 0.02 0.10 0.19
P6_043 1.00 0.99 MIXED043 KC479279 Malvaceae Grewia (genus) [Grewia
kakothamnos; Grewia similis]
0.21 0.04 0.22 0.26 0.03 0.35 0.05 0.16
P6_012 1.00 0.92 MIXED022 AY328160 Malvaceae Hibiscus (genus)
[Hibiscus micranthus; Hibiscus meyeri]
0.13 0.02 0.43 0.22 0.00 0.21 0.00 0.14
P6_019 1.00 0.89 UHURU014-14 AY328160 Malvaceae Abutilon mauritianum 0.49 0.08 0.00 0.44 0.00 0.02 0.00 0.12
P6_040 1.00 0.98 MIXED036 AY216061 Asteraceae
Asteraceae (family) [Vernonia galamensis;
Gutenbergia boranensis; Gutenbergia cordifolia;
Kleinia squarrosa; Solanecio angulatus;
Solanecio cydoniifolius; Asteraceae sp.
(UHURU417-14); Vernonia sp.
(UHURU129-14)]
0.05 0.44 0.11 0.00 0.00 0.13 0.00 0.12
P6_073 1.00 0.98 MIXED034 DQ180475 Solanaceae
Solanum (genus) [Solanum
campylacanthum; Solanum coagulans; Solanum indicum; Solanum lanzae;
Solanum sp. (UHURU270-14)]
0.00 0.00 0.02 0.81 0.00 0.23 0.00 0.12
P6_016 1.00 0.98 UHURU605-14 JN249677 Euphorbiaceae Euphorbia inaequilatera 0.00 0.13 0.26 0.00 0.00 0.27 0.00 0.11
P6_083 1.00 0.90 MIXED029 EU929058 Poaceae
Pennisetum (genus) [Pennisetum mezianum;
Pennisetum stramineum]*
0.13 0.00 0.00 0.00 0.23 0.15 0.27 0.11
P6_023 1.00 0.87 UHURU596-14 AY328160 Malvaceae Melhania ovata 0.49 0.13 0.07 0.00 0.00 0.04 0.00 0.11
P6_004 0.96 0.98 UHURU030-14 EF688731 Amaranthaceae Amaranthaceae (family) 0.00 0.00 0.48 0.00 0.00 0.13 0.00 0.10
P6_059 1.00 0.96 UHURU405-14 DQ172209 Poaceae Aristida kenyensis 0.03 0.04 0.00 0.00 0.44 0.00 0.15 0.09
P6_078 1.00 0.96 UHURU232-14 DQ655884 Poaceae Eragrostis sp. (UHURU232-14) 0.00 0.23 0.00 0.04 0.33 0.00 0.00 0.09
P6_053 0.93 0.98 MATCHS38 GQ869932 Poaceae PACMAD clade 0.26 0.08 0.00 0.00 0.08 0.17 0.02 0.09
P6_015 0.95 1.00 MATCHS38 GQ869934 Poaceae Garnotia tenella [Known distribution in SE Asia] 0.23 0.04 0.00 0.07 0.03 0.19 0.02 0.08
P6_036 0.98 0.94 UHURU470-14 AM266936 Rubiaceae Pentanisia (genus) 0.00 0.23 0.15 0.00 0.00 0.06 0.00 0.08

14
P6_057 1.00 0.96 UHURU118-14 AY328142 Malvaceae Sida sp. (UHURU118-14) 0.10 0.17 0.00 0.00 0.05 0.10 0.00 0.07
P6_086 1.00 0.98 MIXED008 EF156732 Poaceae Chloris (genus) [Chloris virgata; Chloris gayana] 0.00 0.12 0.00 0.00 0.28 0.02 0.00 0.06
P6_038 0.99 1.00 MIXED043 KC479279 Malvaceae Grewia sp. 0.31 0.08 0.02 0.04 0.00 0.00 0.00 0.06
P6_041 0.90 0.98 MATCHS38 GQ869932 Poaceae Garnotia (genus) 0.44 0.00 0.00 0.00 0.00 0.00 0.00 0.06
P6_013 0.94 0.96 UHURU030-14 EF688731 Amaranthaceae Achyranthes (genus) 0.00 0.00 0.33 0.00 0.00 0.04 0.00 0.06
P6_048 1.00 1.00 UHURU309-14 DQ655880 Poaceae Eragrostis superba 0.13 0.12 0.00 0.00 0.08 0.00 0.02 0.05
P6_065 1.00 0.98 UHURU407-14 DQ924225 Ebenaceae Euclea divinorum 0.08 0.04 0.00 0.07 0.00 0.15 0.00 0.05
P6_077 1.00 0.94 UHURU1288-15 AJ558038 Aizoaceae Zaleya pentandra 0.00 0.10 0.04 0.15 0.00 0.06 0.00 0.05
P6_066 1.00 0.95 UHURU174-14 EU497701 Euphorbiaceae Croton dichogamous 0.21 0.04 0.00 0.04 0.00 0.00 0.00 0.04
P6_067 1.00 0.98 UHURU1312-15 AJ875117 Rutaceae Teclea nobilis 0.03 0.00 0.17 0.00 0.00 0.04 0.00 0.04
P6_027 0.99 0.88 UHURU596-14 AY328160 Malvaceae Melhania (genus) 0.26 0.00 0.02 0.00 0.00 0.00 0.00 0.04
P6_106 1.00 0.96 UHURU422-14 DQ172209 Poaceae Aristida congesta 0.00 0.00 0.00 0.00 0.23 0.00 0.02 0.03
P6_115 0.98 0.98 UHURU1233-15 EU939980 Poaceae PACMAD clade 0.00 0.00 0.00 0.00 0.03 0.08 0.12 0.03
P6_105 0.98 0.98 UHURU1084-14 DQ655886 Poaceae PACMAD clade 0.03 0.02 0.00 0.11 0.03 0.08 0.00 0.03
P6_056 0.95 0.98 UHURU1312-15 EU326059 Rubiaceae Rubiaceae (family) 0.00 0.00 0.09 0.00 0.00 0.13 0.00 0.03
P6_089 1.00 0.98 UHURU1309-15 AF127058 Poaceae Echinochloa pyramidalis 0.13 0.00 0.00 0.15 0.00 0.00 0.00 0.03
P6_005 1.00 0.98 MIXED027 AY266260 Solanaceae
Solanaceae (family) [Lycium europaeum;
Solanum nigrum; Withania somnifera]
0.00 0.00 0.07 0.04 0.00 0.10 0.00 0.03
P6_087 1.00 0.98 MIXED033 AB162025 Acanthaceae Ruellia (genus) [Ruellia patula; Ruellia prostrata] 0.00 0.13 0.00 0.00 0.00 0.04 0.00 0.03
P6_098 0.91 1.00 UHURU1115-14 AY794776 Euphorbiaceae Acalypha californica
[Known distribution in California, USA]
0.15 0.06 0.00 0.00 0.00 0.00 0.00 0.03
P6_010 1.00 0.70 UHURU815-14 HM488394 Malvaceae Hermannia uhligii 0.10 0.06 0.00 0.00 0.00 0.02 0.00 0.03
P6_068 1.00 0.95 UHURU588-14 AF289724 Acanthaceae Monechma debile 0.00 0.00 0.09 0.00 0.00 0.08 0.00 0.03
P6_110 1.00 0.98 UHURU1013-14 EF688787 Amaranthaceae Psilotrichum elliotii 0.05 0.00 0.00 0.19 0.03 0.00 0.00 0.03
P6_039 1.00 0.98 UHURU054-14 AF309858 Fabaceae Rhynchosia minima 0.13 0.04 0.00 0.00 0.03 0.00 0.00 0.03
P6_084 0.91 0.98 MATCHS38 GQ869932 Poaceae PACMAD clade 0.21 0.00 0.00 0.00 0.00 0.00 0.00 0.03
P6_054 1.00 1.00 UHURU852-14 AY122435 Capparaceae Boscia angustifolia 0.00 0.06 0.09 0.00 0.00 0.00 0.00 0.02
P6_104 1.00 1.00 UHURU681-14 EF688787 Amaranthaceae Cyathula cylindrica 0.00 0.00 0.00 0.26 0.00 0.00 0.00 0.02

15
P6_032 1.00 0.98 UHURU439-14 AF141712 Asteraceae Helichrysum glumaceum 0.00 0.12 0.00 0.00 0.00 0.02 0.00 0.02
P6_117 1.00 0.96 UHURU386-14 AJ387946 Zygophyllaceae Balanites aegyptica 0.00 0.00 0.00 0.26 0.00 0.00 0.00 0.02
P6_076 0.96 0.96 UHURU026-14 AF278531 Fabaceae Acacia (genus) 0.00 0.00 0.00 0.26 0.00 0.00 0.00 0.02
P6_074 0.98 1.00 UHURU030-14 EF688731 Amaranthaceae Achyropsis avicularis [Known distribution in
South Africa] 0.00 0.00 0.15 0.00 0.00 0.00 0.00 0.02
P6_018 0.78 0.98 UHURU1078-14 AY594496 Anacardiaceae Anacardiaceae (family) 0.08 0.02 0.00 0.07 0.00 0.02 0.00 0.02
P6_095 1.00 0.98 UHURU1352-15 AF274367 Fabaceae Indigofera sp. (UHURU1352-15) 0.00 0.02 0.04 0.00 0.00 0.06 0.00 0.02
P6_028 1.00 1.00 UHURU721-14 HE795473 Geraniaceae Monsonia angustifolia 0.00 0.02 0.04 0.00 0.00 0.06 0.00 0.02
P6_070 1.00 0.98 MIXED002 AF309478 Fabaceae Acacia (genus) [Acacia nilotica; Acacia seyal; Acacia xanthophloea]
0.00 0.00 0.07 0.11 0.00 0.00 0.00 0.02
P6_063 0.98 0.96 UHURU054-14 AF309858 Fabaceae Rhynchosia (genus) 0.08 0.04 0.00 0.00 0.03 0.00 0.00 0.02
P6_009 0.91 1.00 UHURU1217-15 AY792527 Poaceae Leersia hexandra 0.13 0.00 0.00 0.04 0.00 0.00 0.00 0.02
P6_082 0.98 0.98 UHURU1222-15 AY944539 Fabaceae Acacia (genus) 0.00 0.00 0.07 0.00 0.00 0.06 0.00 0.02
P6_050 1.00 0.96 MIXED042 EU528915 Acanthaceae
Barleria (genus) [Barleria eranthemoides;
Barleria ramulosa; Barleria trispinosa]
0.00 0.00 0.11 0.00 0.00 0.00 0.00 0.02
P6_118 1.00 0.96 UHURU1293-15 GQ869998 Poaceae Lintonia nutans 0.05 0.00 0.00 0.00 0.03 0.00 0.05 0.02
P6_116 1.00 0.98 UHURU1233-15 GU594587 Poaceae Brachiaria deflexa 0.00 0.02 0.00 0.00 0.05 0.04 0.00 0.02
P6_044 1.00 0.98 UHURU1078-14 AY905472 Onagraceae Ludwigia stolonifera 0.03 0.02 0.00 0.07 0.03 0.00 0.00 0.02
P6_030 1.00 0.98 UHURU030-14 EF688731 Amaranthaceae Achyranthes aspera 0.13 0.00 0.00 0.00 0.00 0.00 0.00 0.02
P6_055 1.00 0.96 UHURU778-14 EU528915 Acanthaceae Barleria spinisepala 0.00 0.00 0.00 0.00 0.00 0.08 0.00 0.01
P6_122 1.00 0.95 UHURU1204-15 AJ225792 Rhamnaceae Scutia myrtina 0.03 0.00 0.02 0.04 0.00 0.02 0.00 0.01
P6_103 1.00 0.98 MIXED039 AF098854 Asteraceae
Asteraceae (family) [Melanthera scandens;
Sphaeranthus suaveolens; Sonchus sp.
(UHURU268-14)]
0.00 0.00 0.00 0.07 0.00 0.04 0.00 0.01
P6_096 0.98 0.96 UHURU030-14 EF688734 Amaranthaceae Achyranthes (genus) 0.10 0.00 0.00 0.00 0.00 0.00 0.00 0.01
P6_108 0.98 0.96 UHURU030-14 EF688731 Amaranthaceae Achyranthes (genus) 0.10 0.00 0.00 0.00 0.00 0.00 0.00 0.01
P6_093 0.88 0.97 MATCHS38 GQ869932 Poaceae PACMAD clade 0.10 0.00 0.00 0.00 0.00 0.00 0.00 0.01
P6_046 0.89 0.96 UHURU1115-14 JN207679 Euphorbiaceae Euphorbia (genus) 0.03 0.00 0.07 0.00 0.00 0.00 0.00 0.01
P6_002 1.00 0.93 UHURU921-14 KC420617 Acanthaceae Dyschoriste radicans 0.00 0.00 0.07 0.00 0.00 0.00 0.00 0.01
16
P6_101 1.00 1.00 UHURU820-14 AB508807 Asparagaceae Asparagus falcatus 0.00 0.00 0.07 0.00 0.00 0.00 0.00 0.01
P6_029 1.00 0.96 UHURU312-14 AY122435 Capparaceae Cadaba farinosa 0.00 0.00 0.07 0.00 0.00 0.00 0.00 0.01
P6_061 1.00 0.98 UHURU1108-14 FJ466473 Burseraceae Commiphora habessinica 0.05 0.00 0.02 0.00 0.00 0.00 0.00 0.01
P6_112 0.98 0.94 MIXED041 AY328160 Malvaceae Malvaceae (family) 0.00 0.00 0.04 0.00 0.00 0.02 0.00 0.01
P6_107 0.98 0.96 UHURU1172-14 DQ104308 Poaceae PACMAD clade 0.00 0.00 0.00 0.00 0.03 0.02 0.02 0.01
P6_120 0.98 0.98 MIXED008 AY523507 Poaceae Cynodonteae (tribe) 0.00 0.00 0.00 0.04 0.00 0.00 0.05 0.01
P6_114 0.96 0.96 UHURU1233-15 EU939980 Poaceae PACMAD clade 0.00 0.02 0.00 0.07 0.00 0.00 0.00 0.01
P6_045 0.91 1.00 MATCHS38 GQ869932 Poaceae Garnotia acutigluma
[Known distribution in SE Asia]
0.08 0.00 0.00 0.00 0.00 0.00 0.00 0.01
P6_125 0.91 0.98 UHURU310-14 AB445386 Crassulaceae Crassulaceae (family) 0.00 0.00 0.00 0.00 0.08 0.00 0.00 0.01
P6_080 0.93 0.98 UHURU1108-14 GU246085 Burseraceae Burseraceae (family) 0.08 0.00 0.00 0.00 0.00 0.00 0.00 0.01
P6_111 1.00 1.00 UHURU060-14 AF460121 Asteraceae Aspilia pleuriseta 0.03 0.00 0.00 0.00 0.00 0.00 0.02 0.01
P6_091 1.00 0.98 MIXED011 AY122438 Cleomaceae
Cleome (genus) [Cleome hirta; Cleome
monophylla; Cleome sp. (UHURU086-14); Cleome gynandra]
0.00 0.00 0.04 0.00 0.00 0.00 0.00 0.01
P6_081 0.98 0.96 UHURU1222-15 AF522975 Fabaceae Acacia (genus) 0.00 0.00 0.00 0.00 0.00 0.04 0.00 0.01
P6_060 0.96 0.98 UHURU1352-15 AF274367 Fabaceae Indigofera (genus) 0.05 0.00 0.00 0.00 0.00 0.00 0.00 0.01
P6_079 1.00 0.95 MIXED041 AY328160 Malvaceae Hibiscus (genus)
[Hibiscus aponeurus; Hibiscus flavifolius]
0.00 0.00 0.00 0.04 0.00 0.00 0.00 0.00
P6_113 1.00 0.98 UHURU444-14 AY945827 Verbenaceae Lippia javanica 0.00 0.00 0.00 0.00 0.00 0.02 0.00 0.00
P6_072 1.00 0.98 UHURU378-14 AY122431 Capparaceae Maerua triphylla 0.00 0.00 0.02 0.00 0.00 0.00 0.00 0.00
P6_090 1.00 0.98 UHURU150-14 AF289724 Acanthaceae Justicia diclipteroides 0.00 0.00 0.02 0.00 0.00 0.00 0.00 0.00
P6_094 1.00 0.97 MIXED025 AY101084 Convolvulaceae
Ipomoea (genus) [Ipomoea sinensis;
Ipomoea spathulata; Ipomoea wightii]
0.00 0.00 0.02 0.00 0.00 0.00 0.00 0.00
P6_119 0.98 0.98 UHURU681-14 EF688787 Amaranthaceae Amaranthaceae (family) 0.00 0.00 0.00 0.04 0.00 0.00 0.00 0.00
P6_099 0.96 0.94 UHURU299-14 HE577609 Amaranthaceae Chenopodium (genus) 0.03 0.00 0.00 0.00 0.00 0.00 0.00 0.00
P6_109 0.98 1.00 MIXED002 FJ009877 Fabaceae Senna gardneri 0.00 0.00 0.02 0.00 0.00 0.00 0.00 0.00
P6_121 0.94 0.96 UHURU1309-15 JQ041837 Poaceae Digitaria (genus) 0.00 0.00 0.00 0.00 0.00 0.00 0.02 0.00
*Possible interspecific variation in the trnL-P6 sequence based on the local DNA reference library.

17
Table S4. Measured δ13C values and estimated proportional C4 intake by each species from stable isotope analysis of fecal samples collected at Mpala Research Centre in 2013 (a subset of the samples used for DNA metabarcoding). Tukey’s HSD indicates significant pairwise differences between species in δ13C values (ANOVA: F6,26 = 33.7, P <0.001). Mean residual error values reflect intraspecific variation in the outputs of the SIAR model.
Samples δ13C Proportion C4
Species N Mean SD Tukey HSD Mean SD Mean residual error
Plains zebra 5 -13.83 0.52 A 0.92 0.04 0.67 Grevy’s zebra 3 -14.50 0.10 A 0.86 0.08 1.64
Buffalo 5 -14.57 0.45 A 0.87 0.04 0.63 Cattle 5 -14.61 0.45 A 0.87 0.04 0.63 Impala 5 -21.91 4.59 B 0.41 0.15 6.60
Elephant 5 -23.26 2.94 B 0.31 0.12 4.32 Dik-Dik 5 -28.26 0.49 C 0.04 0.06 2.52

18
Table S5. Daily movement patterns of GPS-collared zebra at Mpala Research Centre.
Focal zebra Distance moved (km)
Minimum convex polygon (ha)
Circle diameter (km)
Species Days Mean Min Max Mean Min Max Mean Min Max Grevy’s 93 14.8 7.3 25.4 609.3 108.4 2,037.9 2.7 1.2 5.1 Grevy’s 93 9.7 3.7 19.8 323.9 27.2 167.0 1.9 0.6 4.6 Grevy’s 93 8.2 2.1 20.1 247.2 11.0 1,862.0 1.6 0.4 4.9 Grevy’s 93 13.9 2.3 32.5 1,121.4 28.7 8,617.5 3.2 0.6 10.5 Plains 80 10.6 1.1 22.2 488.8 6.1 2,557.6 2.3 0.3 5.7 Plains 32 9.7 1.0 18.9 477.8 4.6 1,236.9 2.3 0.2 4.0 Mean 80.7 11.2 2.9 23.2 544.7 31.0 2,996.9 2.3 0.6 5.8

19
Table S6. Indicator species analysis for the diets of equids (plains vs. Grevy’s zebras) and bovines (buffalo vs. cattle). The table is organized with the zebra-zebra comparison presented first and the buffalo-cattle comparison presented last. For plant taxa occurring in the diets of each species pair (sequence information and taxon identification described as in Table S3), comparisons indicate differences in frequency of occurrence (FOO) between the two focal species. P-values indicate significant differences, with “NS” signifying P >0.05.
Sequence Information Taxon Identification Comparison
Seq. Local EMBL Family Best Identity Grevy's FOO Plains FOO P-value
P6_021 UHURU978-14 DQ890472 Poaceae Pennisetum stramineum 0.97 0.98 NS
P6_008 UHURU602-14 EU939989 Poaceae Pennisetum mezianum 0.87 0.95 NS
P6_025 UHURU575-14 EF196918 Poaceae Cynodonteae (tribe) 1.00 0.66 0.00
P6_020 UHURU575-14 EF196918 Poaceae Cynodon plectostachyus 0.95 0.66 0.00
P6_022 MIXED004 EF156683 Poaceae Andropogonea (tribe) [Bothriochloa insculpta; Cymbopogon commutatus; Hyparrhenia anamesa; Hyparrhenia sp. aff. Nubica] 0.56 1.00 0.00
P6_051 MATCHS38 AY116259 Poaceae
PACMAD clade [Brachiaria eruciformis; Setaria sphacelata; Setaria verticillata; Sporobolus africanus; Sporobolus festivus; Sporobolus pyramidalis; Sporobolus
stapfianus; Chrysopogon plumosus; Setaria sp. (UHURU639-14); Sporobolus sp. (UHURU593-14)]
0.64 0.90 0.02
P6_024 MIXED016 EU056305 Poaceae Digitaria (genus) [Digitaria milanjiana; Digitaria velutina; Digitaria spp. (UHURU429-14; UHURU1262-15)] 0.77 0.76 NS
P6_033 UHURU890-14 EF156683 Poaceae Themeda triandra 0.31 0.98 0.00
P6_042 UHURU602-14 AY769175 Poaceae PACMAD clade 0.72 0.46 0.04
P6_049 UHURU1242-15 AY116262 Poaceae PACMAD clade [Poaceae sp. (UHURU1242-15)] 0.33 0.73 0.00
P6_035 MIXED017 AY769175 Poaceae PACMAD clade [Dinebra retroflexa; Enteropogon macrostachyus; Melinis repens; Microchloa kunthii] 0.69 0.24 0.00
P6_014 MIXED019 DQ655886 Poaceae Chloridoideae (subfamily) [Eragrostis papposa; Eragrostis racemosa; Sporobolus ioclados] 0.59 0.34 0.04
P6_064 UHURU556-14 DQ655884 Poaceae Harpachne schimperi 0.44 0.24 NS
P6_001 MIXED005 GU594587 Poaceae Paniceae (tribe) [Brachiaria lachnantha; Panicum maximum; Urochloa brachyura] 0.15 0.44 0.01
P6_059 UHURU405-14 DQ172209 Poaceae Aristida kenyensis 0.44 0.15 0.01
P6_083 MIXED029 EU929058 Poaceae Pennisetum (genus) [Pennisetum mezianum; Pennisetum stramineum] 0.23 0.27 NS
P6_017 MIXED044 AF274360 Fabaceae Indigofera (genus) [Indigofera circinella; Indigofera hochstetteri] 0.33 0.02 0.00
P6_078 UHURU232-14 DQ655884 Poaceae Eragrostis sp. (UHURU232-14) 0.33 0.00 0.00
P6_037 MIXED016 EF156733 Poaceae Panicoideae (subfamily) 0.21 0.10 NS
P6_086 MIXED008 EF156732 Poaceae Chloris (genus) [Chloris virgata; Chloris gayana] 0.28 0.00 0.00
P6_106 UHURU422-14 DQ172209 Poaceae Aristida congesta 0.23 0.02 0.02

20
P6_115 UHURU1233-15 EU939980 Poaceae PACMAD clade 0.03 0.12 NS
P6_053 MATCHS38 GQ869932 Poaceae PACMAD clade 0.08 0.02 NS
P6_048 UHURU309-14 DQ655880 Poaceae Eragrostis superba 0.08 0.02 NS
P6_125 UHURU310-14 AB445386 Crassulaceae Crassulaceae (family) 0.08 0.00 NS
P6_007 UHURU1337-15 AF274360 Fabaceae Indigofera (genus) 0.08 0.00 NS
P6_118 UHURU1293-15 GQ869998 Poaceae Lintonia nutans 0.03 0.05 NS
P6_043 MIXED043 KC479279 Malvaceae Grewia (genus) [Grewia kakothamnos; Grewia similis] 0.03 0.05 NS
P6_057 UHURU118-14 AY328142 Malvaceae Sida sp. (UHURU118-14) 0.05 0.00 NS
P6_116 UHURU1233-15 GU594587 Poaceae Brachiaria deflexa 0.05 0.00 NS
P6_015 MATCHS38 GQ869934 Poaceae Garnotia tenella 0.03 0.02 NS
P6_107 UHURU1172-14 DQ104308 Poaceae PACMAD clade 0.03 0.02 NS
P6_058 UHURU470-14 AM266936 Rubiaceae Pentanisia ouranogyne 0.03 0.02 NS
P6_120 MIXED008 AY523507 Poaceae Cynodonteae (tribe) 0.00 0.05 NS
P6_011 MIXED021 HQ696727 Malvaceae Malvaceae (family) [Hibiscus calyphyllus; Malva parviflora] 0.00 0.05 NS
P6_063 UHURU054-14 AF309858 Fabaceae Rhynchosia (genus) 0.03 0.00 NS
P6_105 UHURU1084-14 DQ655886 Poaceae PACMAD clade 0.03 0.00 NS
P6_034 MATCHS10 FJ847837 Phyllanthaceae Phyllanthus (genus) [Phyllanthus sepialis; Phyllanthus sp. (UHURU699-14)] 0.03 0.00 NS
P6_026 UHURU026-14 JX870569 Fabaceae Acacia brevispica 0.03 0.00 NS
P6_039 UHURU054-14 AF309858 Fabaceae Rhynchosia minima 0.03 0.00 NS
P6_110 UHURU1013-14 EF688787 Amaranthaceae Psilotrichum elliotii 0.03 0.00 NS
P6_044 UHURU1078-14 AY905472 Onagraceae Ludwigia stolonifera 0.03 0.00 NS
P6_121 UHURU1309-15 JQ041837 Poaceae Digitaria (genus) 0.00 0.02 NS
P6_111 UHURU060-14 AF460121 Asteraceae Aspilia pleuriseta 0.00 0.02 NS
P6_006 UHURU1222-15 AF522975 Fabaceae Acacia mellifera 0.00 0.02 NS
Buffalo FOO Cattle FOO P6_024 MIXED016 EU056305 Poaceae Digitaria (genus) [Digitaria milanjiana; Digitaria velutina; Digitaria spp.
(UHURU429-14; UHURU1262-15)] 0.97 1.00 NS
P6_020 UHURU575-14 EF196918 Poaceae Cynodon plectostachyus 0.90 0.98 NS
P6_017 MIXED044 AF274360 Fabaceae Indigofera (genus) [Indigofera circinella; Indigofera hochstetteri] 0.85 1.00 0.01
P6_021 UHURU978-14 DQ890472 Poaceae Pennisetum stramineum 1.00 0.50 0.00
P6_025 UHURU575-14 EF196918 Poaceae Cynodonteae (tribe) 0.46 0.96 0.00

21
P6_022 MIXED004 EF156683 Poaceae Andropogonea (tribe) [Bothriochloa insculpta; Cymbopogon commutatus; Hyparrhenia anamesa; Hyparrhenia sp. aff. Nubica] 0.69 0.65 NS
P6_007 UHURU1337-15 AF274360 Fabaceae Indigofera (genus) 0.46 0.85 0.00
P6_008 UHURU602-14 EU939989 Poaceae Pennisetum mezianum 0.56 0.69 NS
P6_001 MIXED005 GU594587 Poaceae Paniceae (tribe) [Brachiaria lachnantha; Panicum maximum; Urochloa brachyura] 0.87 0.31 0.00
P6_042 UHURU602-14 AY769175 Poaceae PACMAD clade 0.36 0.75 0.00
P6_035 MIXED017 AY769175 Poaceae PACMAD clade [Dinebra retroflexa; Enteropogon macrostachyus; Melinis repens; Microchloa kunthii] 0.38 0.65 0.02
P6_037 MIXED016 EF156733 Poaceae Panicoideae (subfamily) 0.92 0.08 0.00
P6_058 UHURU470-14 AM266936 Rubiaceae Pentanisia ouranogyne 0.36 0.58 NS
P6_011 MIXED021 HQ696727 Malvaceae Malvaceae (family) [Hibiscus calyphyllus; Malva parviflora] 0.62 0.29 0.01
P6_026 UHURU026-14 JX870569 Fabaceae Acacia brevispica 0.59 0.23 0.00
P6_033 UHURU890-14 EF156683 Poaceae Themeda triandra 0.62 0.19 0.00
P6_034 MATCHS10 FJ847837 Phyllanthaceae Phyllanthus (genus) [Phyllanthus sepialis; Phyllanthus sp. (UHURU699-14)] 0.31 0.38 NS
P6_023 UHURU596-14 AY328160 Malvaceae Melhania ovata 0.49 0.13 0.00
P6_019 UHURU014-14 AY328160 Malvaceae Abutilon mauritianum 0.49 0.08 0.00
P6_040 MIXED036 AY216061 Asteraceae Asteraceae (family) [Vernonia galamensis; Gutenbergia boranensis; Gutenbergia
cordifolia; Kleinia squarrosa; Solanecio angulatus; Solanecio cydoniifolius; Asteraceae sp. (UHURU417-14); Vernonia sp. (UHURU129-14)]
0.05 0.44 0.00
P6_064 UHURU556-14 DQ655884 Poaceae Harpachne schimperi 0.00 0.48 0.00
P6_051 MATCHS38 AY116259 Poaceae
PACMAD clade [Brachiaria eruciformis; Setaria sphacelata; Setaria verticillata; Sporobolus africanus; Sporobolus festivus; Sporobolus pyramidalis; Sporobolus
stapfianus; Chrysopogon plumosus; Setaria sp. (UHURU639-14); Sporobolus sp. (UHURU593-14)]
0.36 0.12 0.01
P6_049 UHURU1242-15 AY116262 Poaceae PACMAD clade [Poaceae sp. (UHURU1242-15)] 0.28 0.19 NS
P6_041 MATCHS38 GQ869932 Poaceae Garnotia (genus) 0.44 0.00 0.00
P6_038 MIXED043 KC479279 Malvaceae Grewia sp. 0.31 0.08 0.01
P6_053 MATCHS38 GQ869932 Poaceae PACMAD clade 0.26 0.08 0.05
P6_014 MIXED019 DQ655886 Poaceae Chloridoideae (subfamily) [Eragrostis papposa; Eragrostis racemosa; Sporobolus ioclados] 0.00 0.31 0.00
P6_057 UHURU118-14 AY328142 Malvaceae Sida sp. (UHURU118-14) 0.10 0.17 NS
P6_015 MATCHS38 GQ869934 Poaceae Garnotia tenella 0.23 0.04 0.01
P6_027 UHURU596-14 AY328160 Malvaceae Melhania (genus) 0.26 0.00 0.00
P6_066 UHURU174-14 EU497701 Euphorbiaceae Croton dichogamous 0.21 0.04 0.04
P6_048 UHURU309-14 DQ655880 Poaceae Eragrostis superba 0.13 0.12 NS
P6_043 MIXED043 KC479279 Malvaceae Grewia (genus) [Grewia kakothamnos; Grewia similis] 0.21 0.04 0.04

22
P6_036 UHURU470-14 AM266936 Rubiaceae Pentanisia (genus) 0.00 0.23 0.00
P6_003 MIXED001 FJ009898 Fabaceae Acacia (genus) [Acacia drepanolobium; Acacia etbaica; Acacia gerrardii; Acacia tortilis] 0.15 0.08 NS
P6_078 UHURU232-14 DQ655884 Poaceae Eragrostis sp. (UHURU232-14) 0.00 0.23 0.00
P6_098 UHURU1115-14 AY794776 Euphorbiaceae Acalypha californica 0.15 0.06 NS
P6_084 MATCHS38 GQ869932 Poaceae PACMAD clade 0.21 0.00 0.00
P6_039 UHURU054-14 AF309858 Fabaceae Rhynchosia minima 0.13 0.04 NS
P6_010 UHURU815-14 HM488394 Malvaceae Hermannia uhligii 0.10 0.06 NS
P6_012 MIXED022 AY328160 Malvaceae Hibiscus (genus) [Hibiscus micranthus; Hibiscus meyeri] 0.13 0.02 NS
P6_087 MIXED033 AB162025 Acanthaceae Ruellia (genus) [Ruellia patula; Ruellia prostrata] 0.00 0.13 0.02
P6_016 UHURU605-14 JN249677 Euphorbiaceae Euphorbia inaequilatera 0.00 0.13 0.04
P6_009 UHURU1217-15 AY792527 Poaceae Leersia hexandra 0.13 0.00 0.02
P6_083 MIXED029 EU929058 Poaceae Pennisetum (genus) [Pennisetum mezianum; Pennisetum stramineum] 0.13 0.00 0.02
P6_030 UHURU030-14 EF688731 Amaranthaceae Achyranthes aspera 0.13 0.00 0.04
P6_089 UHURU1309-15 AF127058 Poaceae Echinochloa pyramidalis 0.13 0.00 0.03
P6_063 UHURU054-14 AF309858 Fabaceae Rhynchosia (genus) 0.08 0.04 NS
P6_065 UHURU407-14 DQ924225 Ebenaceae Euclea divinorum 0.08 0.04 NS
P6_086 MIXED008 EF156732 Poaceae Chloris (genus) [Chloris virgata; Chloris gayana] 0.00 0.12 0.05
P6_032 UHURU439-14 AF141712 Asteraceae Helichrysum glumaceum 0.00 0.12 NS
P6_093 MATCHS38 GQ869932 Poaceae PACMAD clade 0.10 0.00 NS
P6_108 UHURU030-14 EF688731 Amaranthaceae Achyranthes (genus) 0.10 0.00 NS
P6_096 UHURU030-14 EF688734 Amaranthaceae Achyranthes (genus) 0.10 0.00 0.04
P6_018 UHURU1078-14 AY594496 Anacardiaceae Anacardiaceae (family) 0.08 0.02 NS
P6_077 UHURU1288-15 AJ558038 Aizoaceae Zaleya pentandra 0.00 0.10 NS
P6_080 UHURU1108-14 GU246085 Burseraceae Burseraceae (family) 0.08 0.00 NS
P6_045 MATCHS38 GQ869932 Poaceae Garnotia acutigluma 0.08 0.00 NS
P6_059 UHURU405-14 DQ172209 Poaceae Aristida kenyensis 0.03 0.04 NS
P6_054 UHURU852-14 AY122435 Capparaceae Boscia angustifolia 0.00 0.06 NS
P6_060 UHURU1352-15 AF274367 Fabaceae Indigofera (genus) 0.05 0.00 NS
P6_110 UHURU1013-14 EF688787 Amaranthaceae Psilotrichum elliotii 0.05 0.00 NS
P6_061 UHURU1108-14 FJ466473 Burseraceae Commiphora habessinica 0.05 0.00 NS

23
P6_118 UHURU1293-15 GQ869998 Poaceae Lintonia nutans 0.05 0.00 NS
P6_105 UHURU1084-14 DQ655886 Poaceae PACMAD clade 0.03 0.02 NS
P6_044 UHURU1078-14 AY905472 Onagraceae Ludwigia stolonifera 0.03 0.02 NS
P6_046 UHURU1115-14 JN207679 Euphorbiaceae Euphorbia (genus) 0.03 0.00 NS
P6_099 UHURU299-14 HE577609 Amaranthaceae Chenopodium (genus) 0.03 0.00 NS
P6_111 UHURU060-14 AF460121 Asteraceae Aspilia pleuriseta 0.03 0.00 NS
P6_122 UHURU1204-15 AJ225792 Rhamnaceae Scutia myrtina 0.03 0.00 NS
P6_006 UHURU1222-15 AF522975 Fabaceae Acacia mellifera 0.03 0.00 NS
P6_067 UHURU1312-15 AJ875117 Rutaceae Teclea nobilis 0.03 0.00 NS
P6_114 UHURU1233-15 EU939980 Poaceae PACMAD clade 0.00 0.02 NS
P6_028 UHURU721-14 HE795473 Geraniaceae Monsonia angustifolia 0.00 0.02 NS
P6_116 UHURU1233-15 GU594587 Poaceae Brachiaria deflexa 0.00 0.02 NS
P6_095 UHURU1352-15 AF274367 Fabaceae Indigofera sp. (UHURU1352-15) 0.00 0.02 NS

24
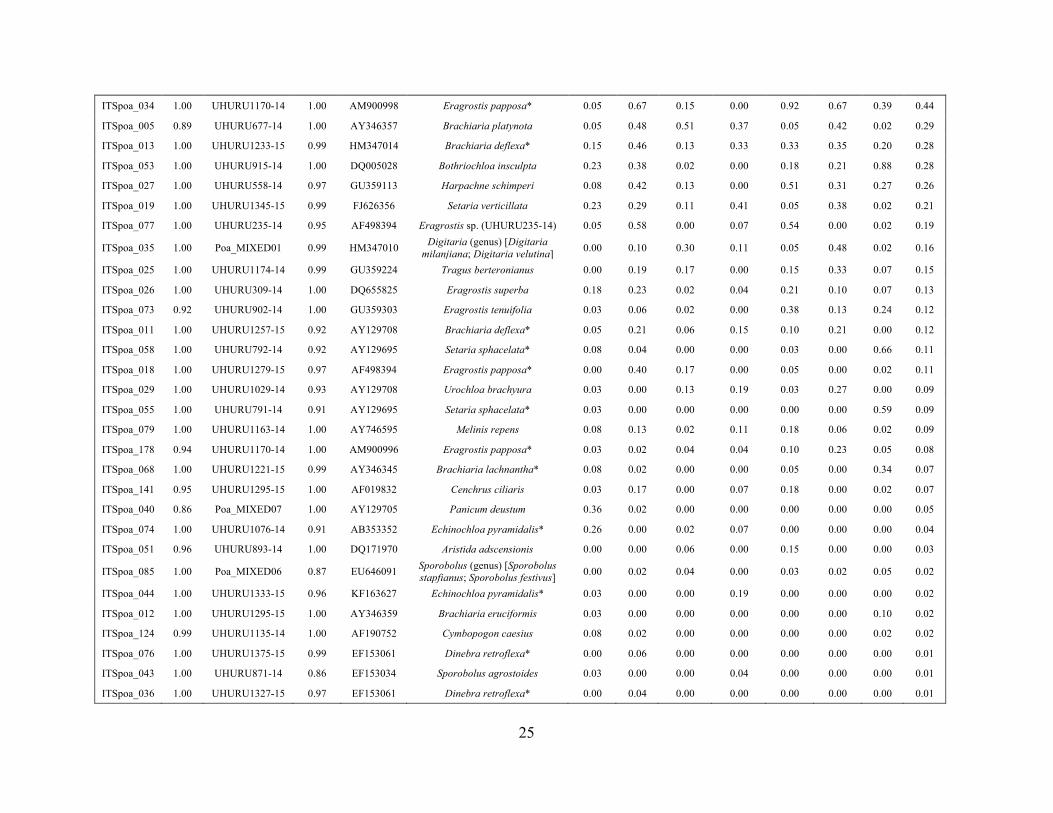
Table S7. Identification of dietary sequences based on family-specific ITS markers. The relative frequency of occurrence (FOO) of each sequence is reported as a proportion of subset of samples that yielded sequences from each respective marker (Table S2). The sequence identifier prefix indicates the relevant plant family and marker (Poa = Poaceae; Ast = Asteraceae; Cyp = Cyperaceae). Sequence information for each ITS metabarcode sequence includes the best match (% identity expressed as a proportion) to a reference sequence in the local Mpala or EMBL database (including references to BOLD Process IDs in the archived local reference library and EMBL accession numbers, respectively). When exact matches were made to multiple taxa, assignments were adjusted to the next-highest taxonomic level (shown in parentheses) and each matching species is listed in brackets. Representative BOLD Process ID numbers are given in parentheses for exact matches to morphospecies that have not been identified to species-level. When no exact match was made to either database, the finest taxonomic level including all best-matching taxa is given in parentheses.
Sequence Information Frequency of Occurrence
Seq. Local Local EMBL EMBL Best Identity Buffalo Cattle Dik-Dik Elephant Grevy's Impala Plains Total
ITSast_010 0.82 UHURU581-14 1.00 EU527241 Hirpicium diffusum 1.00 1.00 0.44 0.95 1.00 0.98 0.00 0.81
ITSast_004 1.00 Ast_MIXED03 0.76 EF155793 Gutenbergia (genus)
[Gutenbergia boranensis; Gutenbergia cordifolia]
1.00 0.86 0.87 0.55 1.00 0.76 0.00 0.77
ITSast_005 1.00 UHURU457-14 0.95 AY953930 Emilia discifolia 1.00 0.14 0.54 0.65 1.00 0.73 1.00 0.55
ITSast_007 1.00 UHURU581-14 0.96 FJ861498 Osteospermum vaillantii 0.00 0.14 0.38 0.65 1.00 0.38 0.00 0.36
ITSast_011 1.00 UHURU673-14 0.97 AY445223 Helichrysum glumaceum 0.00 0.55 0.18 0.15 0.00 0.36 0.00 0.31
ITSast_020 1.00 UHURU418-14 0.99 AF374885 Asteraceae sp. (UHURU418-14) 0.00 0.03 0.08 0.25 0.00 0.07 0.00 0.09
ITSast_022 1.00 UHURU091-14 0.98 GU818570 Kleinia squarrosa 0.00 0.00 0.05 0.10 0.00 0.00 0.00 0.03
ITSast_049 1.00 UHURU1143-14 0.98 GU818711 Solanecio angulatus 0.00 0.00 0.03 0.10 0.00 0.00 0.00 0.02
ITSast_040 1.00 UHURU1199-15 0.98 AB435132 Helichrysum sp. (UHURU1199-15) 0.00 0.00 0.03 0.05 0.00 0.00 0.00 0.01
ITSast_002 1.00 Ast_MIXED02 0.99 AB435132 Asteraceae (family) [Psiadia punctulata, Conyza stricta,
Asteraceae sp. (UHURU396-14)] 0.00 0.00 0.03 0.00 0.00 0.02 0.00 0.01
ITSast_050 1.00 UHURU268-14 0.99 AY458004 Sonchus sp. (UHURU268-14) 0.00 0.00 0.03 0.00 0.00 0.00 0.00 0.01
ITSast_053 1.00 UHURU058-14 0.94 AY303437 Aspilia pleuriseta 0.00 0.00 0.00 0.00 0.00 0.00 0.50 0.01
ITSast_009 0.90 UHURU1143-14 1.00 KC311155 Senecio hadiensis 0.00 0.00 0.03 0.00 0.00 0.00 0.00 0.01
ITSpoa_004 1.00 Poa_MIXED07 0.97 U46649 Pennisetum (genus) [Pennisetum
mezianum; Pennisetum stramineum]*
1.00 1.00 0.94 1.00 1.00 0.98 0.98 0.98
ITSpoa_001 1.00 UHURU1262-15 0.97 AF019826 Digitaria sp. (UHURU1262-15) 0.97 1.00 0.98 0.81 0.90 1.00 0.80 0.94
ITSpoa_003 1.00 UHURU603-14 0.92 AF019832 Pennisetum mezianum* 0.79 0.77 0.15 0.67 0.97 0.21 0.98 0.63
ITSpoa_015 1.00 UHURU677-14 0.93 HM347028 Panicum maximum 0.92 0.60 0.49 0.96 0.38 0.23 0.02 0.49
ITSpoa_002 1.00 UHURU888-14 0.95 FJ766165 Themeda triandra 0.85 0.63 0.11 0.07 0.46 0.23 0.95 0.48
25
ITSpoa_034 1.00 UHURU1170-14 1.00 AM900998 Eragrostis papposa* 0.05 0.67 0.15 0.00 0.92 0.67 0.39 0.44
ITSpoa_005 0.89 UHURU677-14 1.00 AY346357 Brachiaria platynota 0.05 0.48 0.51 0.37 0.05 0.42 0.02 0.29
ITSpoa_013 1.00 UHURU1233-15 0.99 HM347014 Brachiaria deflexa* 0.15 0.46 0.13 0.33 0.33 0.35 0.20 0.28
ITSpoa_053 1.00 UHURU915-14 1.00 DQ005028 Bothriochloa insculpta 0.23 0.38 0.02 0.00 0.18 0.21 0.88 0.28
ITSpoa_027 1.00 UHURU558-14 0.97 GU359113 Harpachne schimperi 0.08 0.42 0.13 0.00 0.51 0.31 0.27 0.26
ITSpoa_019 1.00 UHURU1345-15 0.99 FJ626356 Setaria verticillata 0.23 0.29 0.11 0.41 0.05 0.38 0.02 0.21
ITSpoa_077 1.00 UHURU235-14 0.95 AF498394 Eragrostis sp. (UHURU235-14) 0.05 0.58 0.00 0.07 0.54 0.00 0.02 0.19
ITSpoa_035 1.00 Poa_MIXED01 0.99 HM347010 Digitaria (genus) [Digitaria milanjiana; Digitaria velutina] 0.00 0.10 0.30 0.11 0.05 0.48 0.02 0.16
ITSpoa_025 1.00 UHURU1174-14 0.99 GU359224 Tragus berteronianus 0.00 0.19 0.17 0.00 0.15 0.33 0.07 0.15
ITSpoa_026 1.00 UHURU309-14 1.00 DQ655825 Eragrostis superba 0.18 0.23 0.02 0.04 0.21 0.10 0.07 0.13
ITSpoa_073 0.92 UHURU902-14 1.00 GU359303 Eragrostis tenuifolia 0.03 0.06 0.02 0.00 0.38 0.13 0.24 0.12
ITSpoa_011 1.00 UHURU1257-15 0.92 AY129708 Brachiaria deflexa* 0.05 0.21 0.06 0.15 0.10 0.21 0.00 0.12
ITSpoa_058 1.00 UHURU792-14 0.92 AY129695 Setaria sphacelata* 0.08 0.04 0.00 0.00 0.03 0.00 0.66 0.11
ITSpoa_018 1.00 UHURU1279-15 0.97 AF498394 Eragrostis papposa* 0.00 0.40 0.17 0.00 0.05 0.00 0.02 0.11
ITSpoa_029 1.00 UHURU1029-14 0.93 AY129708 Urochloa brachyura 0.03 0.00 0.13 0.19 0.03 0.27 0.00 0.09
ITSpoa_055 1.00 UHURU791-14 0.91 AY129695 Setaria sphacelata* 0.03 0.00 0.00 0.00 0.00 0.00 0.59 0.09
ITSpoa_079 1.00 UHURU1163-14 1.00 AY746595 Melinis repens 0.08 0.13 0.02 0.11 0.18 0.06 0.02 0.09
ITSpoa_178 0.94 UHURU1170-14 1.00 AM900996 Eragrostis papposa* 0.03 0.02 0.04 0.04 0.10 0.23 0.05 0.08
ITSpoa_068 1.00 UHURU1221-15 0.99 AY346345 Brachiaria lachnantha* 0.08 0.02 0.00 0.00 0.05 0.00 0.34 0.07
ITSpoa_141 0.95 UHURU1295-15 1.00 AF019832 Cenchrus ciliaris 0.03 0.17 0.00 0.07 0.18 0.00 0.02 0.07
ITSpoa_040 0.86 Poa_MIXED07 1.00 AY129705 Panicum deustum 0.36 0.02 0.00 0.00 0.00 0.00 0.00 0.05
ITSpoa_074 1.00 UHURU1076-14 0.91 AB353352 Echinochloa pyramidalis* 0.26 0.00 0.02 0.07 0.00 0.00 0.00 0.04
ITSpoa_051 0.96 UHURU893-14 1.00 DQ171970 Aristida adscensionis 0.00 0.00 0.06 0.00 0.15 0.00 0.00 0.03
ITSpoa_085 1.00 Poa_MIXED06 0.87 EU646091 Sporobolus (genus) [Sporobolus stapfianus; Sporobolus festivus] 0.00 0.02 0.04 0.00 0.03 0.02 0.05 0.02
ITSpoa_044 1.00 UHURU1333-15 0.96 KF163627 Echinochloa pyramidalis* 0.03 0.00 0.00 0.19 0.00 0.00 0.00 0.02
ITSpoa_012 1.00 UHURU1295-15 1.00 AY346359 Brachiaria eruciformis 0.03 0.00 0.00 0.00 0.00 0.00 0.10 0.02
ITSpoa_124 0.99 UHURU1135-14 1.00 AF190752 Cymbopogon caesius 0.08 0.02 0.00 0.00 0.00 0.00 0.02 0.02
ITSpoa_076 1.00 UHURU1375-15 0.99 EF153061 Dinebra retroflexa* 0.00 0.06 0.00 0.00 0.00 0.00 0.00 0.01
ITSpoa_043 1.00 UHURU871-14 0.86 EF153034 Sporobolus agrostoides 0.03 0.00 0.00 0.04 0.00 0.00 0.00 0.01
ITSpoa_036 1.00 UHURU1327-15 0.97 EF153061 Dinebra retroflexa* 0.00 0.04 0.00 0.00 0.00 0.00 0.00 0.01

26
ITSpoa_020 1.00 UHURU1094-14 0.96 EU528606 Pennisetum hohenackeri 0.03 0.00 0.00 0.04 0.00 0.00 0.00 0.01
ITSpoa_228 1.00 UHURU595-14 0.85 AY129721 Sporobolus sp. (UHURU595-14) 0.00 0.00 0.02 0.00 0.00 0.00 0.00 0.00
ITSpoa_258 1.00 UHURU1353-15 0.91 GU359303 Sporobolus ioclados 0.00 0.00 0.00 0.00 0.00 0.02 0.00 0.00
ITSpoa_266 1.00 UHURU1373-15 1.00 DQ655840 Enneapogon cenchroides 0.00 0.00 0.00 0.04 0.00 0.00 0.00 0.00
ITSpoa_237 0.99 UHURU1221-15 1.00 AY346345 Brachiaria lachnantha* 0.00 0.00 0.00 0.00 0.00 0.00 0.02 0.00
ITSpoa_082 0.91 UHURU1290-15 1.00 AF190759 Heteropogon contortus 0.00 0.00 0.00 0.00 0.00 0.00 0.02 0.00
ITScyp_007 0.64 UHURU1041-14 0.96 AB206265 Schoenoplectiella sp. 1.00 0.00 0.00 0.80 1.00 1.00 0.00 0.89
ITScyp_058 0.88 UHURU167-14 0.97 JX644854 Cyperus sp. 0.00 0.00 0.00 0.20 0.00 0.00 0.00 0.11
*Possible intraspecific variation in ITS sequences.

27
Figure S1. Map of sample collection locations across Mpala Research Centre, Laikipia, Kenya.
36.75 36.80 36.85 36.90 36.95 37.00
0.25
0.30
0.35
0.40
0.45
0.50
0.55
Longitude
Latitude
BuffaloCattleDik-DikElephantGrevy's ZebraImpalaPlains Zebra0 5 10 km

28
Figure S2. Comparisons of dietary richness (i.e., niche breadth), among LMH species. (A) Species-accumulation curves based on rarefaction and extrapolation of unique trnL-P6 sequences (±95% CI) approach an asymptote for each LMH species (points on each curve indicate the observed richness and sample size for that species). (B) Comparisons of richness at the maximum sample size (N = 52) show that buffalo diets were richer than most (95% CI overlaps only with impala) and plains zebra diets were poorer than most (95% CI overlaps only with Grevy’s zebra and dik-dik). The body mass (kg) of each LMH species appears along the X-axis; dietary richness did not monotonically vary with log-transformed body mass (F1,5 = 0.06, R2 = 0.01, P >0.8).
A
B
Buffalo450
Impala40
Cattle322
Elephant1725
Dik-Dik5
Grevy's zebra 375
Plains zebra 200
Ric
hnes
s0
2040
6080
0 10 20 30 40 50
020
4060
Number of Samples
Num
ber o
f tax
a
BuffaloCattleDik-DikElephantGrevy's zebraImpalaPlains zebra
a a,b b,c b,c c c,d d

29
Figure S3. Correlation between DNA metabarcode RRA of grasses (Y axes) and carbon stable isotope values (X axes). The correlation between grass RRA and the measured δ13C values in the subset of samples selected for stable isotope analysis was significant (F1,31 = 128.1, R2 = 0.81, P <0.01). These data correspond to main text Fig. 2E, but show δ13C and RRA of each sample instead of the modeled population-level C4 consumption and mean RRA.
A
B
0.0 0.2 0.4 0.6 0.8 1.0
0.0
0.2
0.4
0.6
0.8
1.0
Literature C4 values
Poa
ceae
DN
A re
lativ
e re
ad a
bund
ance
(RR
A)
BuffaloCattleDik-DikElephantImpalaPlains Zebra
-30 -25 -20 -15
0.0
0.2
0.4
0.6
0.8
1.0
į13C
Poa
ceae
DN
A re
lativ
e re
ad a
bund
ance
(RR
A)
BuffaloCattleDik-DikElephantGrevy's ZebraImpalaPlains Zebra

30
Figure S4. Correlations between dietary dissimilarity and geographic distance (km) between sample locations. Cattle samples have a more spatially discrete distribution because they were collected from different individuals within herds sharing a corral.
0 5 10 15 20 25
0.00
0.50
1.00
Plains zebraN = 32 r = 0.055 P = 0.223
A.
0 5 10 15 20 25
0.00
0.50
1.00
Grevy's zebraN = 31 r = 0.153 P = 0.066
B.
0 5 10 15 20 25
0.00
0.50
1.00
CattleN = 52 r = 0.571 P = 0.001
C.
0 5 10 15 20 250.
000.
501.
00
BuffaloN = 37 r = 0.183 P = 0.022
D.
0 5 10 15 20 25
0.00
0.50
1.00
ImpalaN = 48 r = 0.134 P = 0.004
E.
0 5 10 15 20 25
0.00
000.
7125
ElephantN = 27 r = 0.174 P = 0.012
F.
0 5 10 15 20 25
0.00
0.50
1.00
Dik-DikN = 46 r = 0.421 P = 0.001
G.
Pairwise distance (km)
Bra
y di
ssim
ilarit
y

31
Figure S5. Tests for pairwise similarity of intra- and interspecific samples collected close (0 – 2.3 km) and far (>2.3 km) from each other for (A) zebra and (B) bovine species. Comparisons were standardized by the mean dietary dissimilarity of all samples in each focal pair (i.e., the null expectation = 0), such that positive values indicate comparisons that are more similar than expected and negative values indicate comparisons that are less similar than expected (±95% CI based on 1000 bootstrap samples). The number of samples included in each comparison is listed above the bars, along with asterisks indicating the results of permutation tests (*P ≤0.05; **P ≤0.01; ***P ≤0.001; “ns” indicates P >0.05).
A
B
0 - 2.3 km 2.3 - 17.8 km
Within speciesAcross species
Zebra
Diff
eren
ce fr
om M
ean
-0.1
0.0
0.1
0.2
0.3
0.4
0.5
*** ns ** ***293 668 193 799
Number of comparisons:
0 - 2.3 km 2.3 - 21.3 km
Within speciesAcross species
Bovines
Diff
eren
ce fr
om M
ean
-0.1
0.0
0.1
0.2
0.3
0.4
0.5
*** *** *** ***438 1554 160 1764
Number of comparisons:

32
Figure S6. Results of RRA-based analyses of trnL-P6. Bipartite networks show sequences occurring in the diets of (A) grazers and (B) non-grazers, as in Fig. 1 of the main text, but with the sizes of the lower boxes scaled to reflect their mean RRA in samples from each LMH species. Sequence identifiers are beneath lower boxes (Table S3). (C) Correlations between mean pairwise dietary dissimilarities. As in Fig. 3 of the main text, intraspecific comparisons are indicated by colors (body-mass difference = 0), while interspecific comparisons are distinguished by shapes (body mass difference > 0); lines show regressions fit for all comparisons (solid line: F1,26 = 18.19, R2 = 0.41, P <0.001) and for interspecific comparisons only (dashed line: F1,19 = 4.75, R2 = 0.20, P < 0.05). (D) Dietary dissimilarity among species visualized using NMDS.
Elephant
Impala
Dik-Dik
P6_009
P6_120
P6_119
P6_089
P6_066
P6_078
P6_079
P6_114
P6_076
P6_110
P6_044
P6_117
P6_104
P6_019
P6_037
P6_001
P6_008
P6_035
P6_018
P6_073
P6_051
P6_042
P6_103
P6_021
P6_105
P6_020
P6_022
P6_049
P6_025
P6_064
P6_077
P6_065
P6_015
P6_024
P6_070
P6_038
P6_122
P6_107
P6_115
P6_086
P6_057
P6_032
P6_113
P6_055
P6_010
P6_053
P6_081
P6_087
P6_014
P6_116
P6_083
P6_026
P6_043
P6_006
P6_003
P6_005
P6_058
P6_007
P6_017
P6_012
P6_034
P6_056
P6_028
P6_095
P6_011
P6_040
P6_016
P6_082
P6_068
P6_023
P6_112
P6_036
P6_004
P6_067
P6_013
P6_109
P6_027
P6_094
P6_061
P6_090
P6_072
P6_054
P6_074
P6_091
P6_046
P6_029
P6_050
P6_101
P6_002
PoaceaeAsteraceaeMalvaceaeSolanaceaeFabaceaeAcanthaceaeAmaranthaceaeRubiaceaeBurseraceaeEuphorbiaceaeCapparaceaeother
-1 0 1 2
-1.5
-1.0
-0.5
0.0
0.5
1.0
1.5
NMDS1
NMDS2
BuffaloCattleDik-DikElephantGrevy's ZebraImpalaPlains Zebra
0 1 2 3 4 5 6 7
0.0
0.2
0.4
0.6
0.8
1.0
Difference in body mass log(kg)
Mea
n di
etar
y di
ssim
ilarit
y (B
ray-
Cur
tis)
Within GrazersWithin BrowsersAcross GuildsBuffaloCattleDik-DikElephantGrevy's ZebraImpalaPlains ZebraOverall correlationInterspecific correlation
Grevy’s
Zebra
Plains
Zebra
Cattle
Buffalo
P6_125
P6_106
P6_107
P6_115
P6_121
P6_120
P6_059
P6_014
P6_116
P6_086
P6_083
P6_051
P6_078
P6_064
P6_049
P6_008
P6_025
P6_042
P6_033
P6_022
P6_035
P6_021
P6_020
P6_118
P6_024
P6_077
P6_114
P6_036
P6_028
P6_095
P6_054
P6_032
P6_087
P6_016
P6_105
P6_044
P6_111
P6_006
P6_040
P6_048
P6_057
P6_001
P6_017
P6_007
P6_058
P6_034
P6_063
P6_053
P6_110
P6_043
P6_037
P6_039
P6_011
P6_015
P6_010
P6_065
P6_003
P6_026
P6_098
P6_023
P6_018
P6_038
P6_066
P6_019
P6_012
P6_046
P6_093
P6_080
P6_045
P6_060
P6_084
P6_041
P6_009
P6_030
P6_061
P6_089
P6_099
P6_108
P6_096
P6_027
P6_122
P6_067
PoaceaeAsteraceaeMalvaceaeSolanaceaeFabaceaeAcanthaceaeAmaranthaceaeRubiaceaeBurseraceaeEuphorbiaceaeCapparaceaeother
A
B
C D

33
Figure S7. Results of analyses of family-specific Poaceae (A-B) and Asteraceae (C-D) ITS markers. Bipartite networks (A,C) show plant species detected in LMH diets. Sequence identifiers are beneath the lower boxes (Table S7). Dietary niche overlap is visualized using NMDS (B,D).
Cat
tle
Ele
phan
t
Dik
-Dik
Impa
la
Gre
vy’s
zeb
ra
Buf
falo
Pla
ins
zebr
a
ITS
ast_
049
ITS
ast_
010
ITS
ast_
002
ITS
ast_
050
ITS
ast_
009
ITS
ast_
011
ITS
ast_
053
ITS
ast_
005
ITS
ast_
022
ITS
ast_
004
ITS
ast_
020
ITS
ast_
007
ITS
ast_
040
-1.0 -0.5 0.0 0.5 1.0
-1.0
-0.5
0.0
0.5
1.0
NMDS1
NMDS2
BuffaloCattleDik-DikElephantGrevy's ZebraImpalaPlains Zebra
-1.0 -0.5 0.0 0.5 1.0
-1.0
-0.5
0.0
0.5
1.0
NMDS1
NMDS2
BuffaloCattleDik-DikElephantGrevy's ZebraImpalaPlains Zebra
Pla
ins
zebr
a
Buf
falo
Gre
vy’s
ze
bra
Cat
tle
Impa
la
Ele
phan
t
Dik
-Dik
ITS
poa_
019
ITS
poa_
027
ITS
poa_
026
ITS
poa_
015
ITS
poa_
002
ITS
poa_
013
ITS
poa_
068
ITS
poa_
258
ITS
poa_
020
ITS
poa_
025
ITS
poa_
266
ITS
poa_
141
ITS
poa_
040
ITS
poa_
082
ITS
poa_
001
ITS
poa_
076
ITS
poa_
124
ITS
poa_
004
ITS
poa_
055
ITS
poa_
237
ITS
poa_
058
ITS
poa_
043
ITS
poa_
011
ITS
poa_
178
ITS
poa_
003
ITS
poa_
074
ITS
poa_
051
ITS
poa_
044
ITS
poa_
085
ITS
poa_
073
ITS
poa_
034
ITS
poa_
018
ITS
poa_
036
ITS
poa_
029
ITS
poa_
005
ITS
poa_
012
ITS
poa_
077
ITS
poa_
035
ITS
poa_
053
ITS
poa_
079
ITS
poa_
228
A
C
B
D