Embed Size (px)
Citation preview
RENEWABLE ENERGY AND DEEP-SEA MINING: SUPPLY, DEMAND AND SCENARIOS
2016
Sven Teske
Nick Florin
Elsa Dominish
Damien Giurco
JULY 2016
RENEWABLE ENERGY AND DEEP SEA MINING: SUPPLY, DEMAND AND SCENARIOS i
ABOUT THE AUTHORS The Institute for Sustainable Futures (ISF) was established by the University of Technology Sydney (Australia) in 1996 to work with industry, government and the community to develop sustainable futures through research and consultancy. Our mission is to create change toward sustainable futures that protect and enhance the environment, human well-being and social equity. We seek to adopt an inter-disciplinary approach to our work and engage our partner organisations in a collaborative process that emphasises strategic decision-making.
For further information visit: www.isf.uts.edu.au
Research team: Sven Teske, Nick Florin, Elsa Dominish and Damien Giurco
CITATION Teske, S., Florin, N., Dominish, E. and Giurco, D. (2016) Renewable Energy and Deep Sea Mining: Supply, Demand and Scenarios. Report prepared by ISF for J.M.Kaplan Fund, Oceans 5 and Synchronicity Earth, July 2016.
ACKNOWLEDGEMENTS The research aims to investigate the impact of a global energy transition towards 100% renewable energy on the demand and supply of copper, cobalt, nickel, lithium, silver and specialty metals (tellurium) as well as rare earths (neodymium, dysprosium). This research was funded by J.M.Kaplan Fund, Oceans 5 and Synchronicity Earth. The report was reviewed by the Deep Sea Conservation Coalition.
Front cover image by CSIRO, CC BY 3.0 https://commons.wikimedia.org/w/index.php?curid=35460612
DISCLAIMER The authors have used all due care and skill to ensure the material is accurate as at the date of this report. UTS and the authors do not accept any responsibility for any loss that may arise by anyone relying upon its contents.
INSTITUTE FOR SUSTAINABLE FUTURES
University of Technology Sydney PO Box 123 Broadway, NSW, 2007 Australia Tel: +61 2 9514 4950
www.isf.edu.au
© UTS July 2016
JULY 2016
RENEWABLE ENERGY AND DEEP SEA MINING: SUPPLY, DEMAND AND SCENARIOS ii
TABLE OF CONTENTS 1 Executive summary ....................................................................................................................... 1
1.1 Rationale .............................................................................................................................. 1
1.2 Research method ................................................................................................................. 1
1.3 Key results ........................................................................................................................... 3
2 Global Market for resources potentially mined in deep-sea operations .................................. 6
2.1 Deep-sea mining – the new frontier of the resource industry ............................................... 7
2.2 Global metal resources and current market trends .............................................................. 8
2.3 A brief note on metals recycling and recycling efficiencies ................................................ 11
3 Overview of global material requirements for the main renewable energy technologies .... 13
3.1 Renewable technology and market trends ......................................................................... 14
3.2 Wind power technology and trends .................................................................................... 15
3.3 Photovoltaic technology and trends ................................................................................... 17
3.4 Concentrated Solar Power (CSP) technology and trends .................................................. 20
3.5 Hydro power technologies and trends ................................................................................ 22
3.6 Electric vehicle technology and trends ............................................................................... 23
4 Projected metal demand under future energy scenarios ........................................................ 27
4.1 Overview of energy scenario modeling approach .............................................................. 27
4.2 Key results of material demand assessed against the three global energy scenarios ....... 29
4.3 Projected annual metal demand by energy technology ..................................................... 33
5 Conclusions ................................................................................................................................. 37
Appendix: Supplementary data ...................................................................................................... 38
FIGURES
Figure 1: Projected cumulative demand for metals by 2050 relative to global terrestrial resources based on the three energy scenarios, assuming current recycling rates remain static. ............................................................... 3
Figure 2: Projected cumulative demand for metals by 2050 relative to currently known reserves based on the three energy scenarios and assuming current recycling rates remain static .......................................................... 4
Figure 3: Projected annual demand in 2050 relative to current production volumes (in 2014) .............................. 5
Figure 4: Global average recycled content (RC) for sixty metals10 ....................................................................... 12
Figure 5: Different configurations of solar power systems reproduced with permission from Greenpeace/SolarPowerEurope (2011) ................................................................................................................ 18
Figure 6: CSP Technologies: Parabolic trough, solar tower and parabolic dish reproduced with permission from Greenpeace/SolarPowerEurope (2011)26 ............................................................................................................. 21
Figure 7: Predicted rise in demand for lithium owing to rise in use of lithium-ion batteries, modelled by Mohr et al 2012)46 ................................................................................................................................................................... 26
Figure 8: Future global energy scenarios by generation type, three scenarios REF, ER and ADV ER ............... 27
JULY 2016
RENEWABLE ENERGY AND DEEP SEA MINING: SUPPLY, DEMAND AND SCENARIOS iii
Figure 10: Projected annual demand in 2030 relative to current production volumes (in 2014) for copper, cobalt, nickel and silver. .................................................................................................................................................... 29
Figure 11: Projected annual demand in 2050 relative to current production volumes (in 2014) for copper, cobalt, nickel and silver. .................................................................................................................................................... 30
Figure 12: Projected annual demand in 2030 relative to current production volumes (in 2014) for lithium, tellurium, neodymium and dysprosium. ................................................................................................................. 31
Figure 13: Projected annual demand in 2050 relative to current production volumes (in 2014) for lithium, tellurium, neodymium and dysprosium. ................................................................................................................. 31
Figure 14: Cumulative resources required relative to current reserves, with and without recycling under the advanced scenario ................................................................................................................................................ 32
Figure 15: Projected annual demand for copper for selected renewable power and storage technologies. ........ 33
Figure 16: Projected annual demands for cobalt, nickel and lithium (tonnes/a) for five different Li-battery chemistries. ........................................................................................................................................................... 34
Figure 17: Projected annual demand for silver for solar technologies. ................................................................. 35
Figure 18: Projected annual demand for tellurium for solar technologies ............................................................. 36
TABLES
Table 1: Major metals used in renewable energy technologies .............................................................................. 7
Table 2: Global copper resources and market trends ............................................................................................. 8
Table 3: Global cobalt resources and market trends .............................................................................................. 8
Table 4: Global nickel resources and current market trends .................................................................................. 9
Table 5 Global lithium resources and current market trends .................................................................................. 9
Table 6 Global silver resources and current market trends .................................................................................... 9
Table 7: Global specialty metals and rare earth resources and market trends .................................................... 10
Table 8: Summary of assumed material requirements for renewable energy technologies ................................. 13
Table 9: Materials used in wind turbines ............................................................................................................... 16
Table 10: Average metal demand for wind turbines ............................................................................................. 16
Table 11: Average metal demand in Solar Photovoltaic systems ......................................................................... 19
Table 12: Silver content of solar mirror (silver coating) based on an analysis published by the Fraunhofer Institute (2009)39 .................................................................................................................................................... 22
Table 13: Material requirement for hydroelectric plant (40.8 MW) ........................................................................ 23
Table 14: Material demand for Lithium ion batteries ............................................................................................. 24
Table 15: Assumed relative share of five Li-ion battery types for different years ................................................. 24
Table 16: Neodymium and dysprosium use in permanent magnets in electric vehicles ...................................... 25
Table 17: Future energy capacity for the Advanced Energy [R]evolution scenario .............................................. 38
Table 18: Average annual market for renewable energy for the Advanced Energy [R]evolution scenario .......... 39
Table 19: Average annual Copper demand between 2014 and 2050 .................................................................. 39
Table 20: Average annual Cobalt demand between 2014 and 2030 .................................................................... 39
Table 21: Average annual Nickel demand between 2014 and 2030 .................................................................... 40
Table 22: Average annual Lithium demand between 2014 and 2050 .................................................................. 40
Table 23: Average annual Silver demand between 2014 and 2050 ..................................................................... 40
Table 24: Average annual Tellurium demand between 2014 and 2050 ............................................................... 40
JULY 2016
RENEWABLE ENERGY AND DEEP SEA MINING: SUPPLY, DEMAND AND SCENARIOS 1
1 EXECUTIVE SUMMARY
1.1 RATIONALE This report examines the intersection of future demand for metals and available supply in the context of a renewable energy future. Metals that might be subject to future deep-sea-mining operations have been considered in this analysis to understand the likely increase in demand and possible implications for deep-sea mining. These insights can also inform consideration of the ways to reduce the demand by increasing the intensity of use and recycling. The different metals considered include:
• copper
• cobalt
• nickel
• lithium
• silver
• specialty metals (tellurium)
• rare earths (neodymium, dysprosium)
The report focuses on copper, cobalt, nickel, lithium and silver as these are all needed in the renewable energy technologies likely to be important and potentially mined in deep-sea operations. Rare earths and specialty metals are also important in the development of renewable energy technologies; whilst they are not currently the key driver behind proposed deep-sea mining projects the likely future demand for these materials is expected to be significant. Renewable energy technologies need other additional resources, such as steel and cement, which are not subject of this analysis. This report does not review in detail the technologies and impacts of deep-sea mining itself.
1.2 RESEARCH METHOD The modelling approach developed for this study to evaluate future metal demand and supply involved three main steps:
(1) Compiling data for metal resources listed above in terms of current global mine production rates, global reserves and resources, and estimated recycling rates (Chapter 2)
(2) Estimating the metal resource use intensity by technology and application based on published data (Chapter 3)
(3) Applying resource intensity to published future global energy supply and demand scenarios considering different renewable energy technologies and storage devices (Chapter 4)
A limitation with this approach is that for some metals the development of renewable energy technology is not the principal driver of future demand, and actual future demand will also depend on various other factors.
JULY 2016
RENEWABLE ENERGY AND DEEP SEA MINING: SUPPLY, DEMAND AND SCENARIOS 2
Based on future renewable energy scenarios the annual and cumulative demand for the targeted metals have been calculated using up-to-date, publically available resource intensity data by technology and application. Resource intensity estimates were taken from academic literature, consulting reports, technology roadmaps, and industry and technology reports. The potential to offset demand by recycling is also considered based on current recycling rates. Three future global energy scenarios were used: a reference case (REF) from the International Energy Agency (IEA), and two renewable energy scenarios (ER and ADV ER). The renewable energy scenarios target 100% renewable energy by 2050 – a requirement to reduce energy-related carbon emissions and stay under the overall carbon budget in order to stay under +2 °C (according to IPCC). Both ER scenarios were developed for the 2015 Greenpeace Energy [R]evolution analysis 0F
1, which is part of an ongoing series of reports that have been updated since 2005. The IEA REF scenario was selected as a benchmark. This scenario has been used as a guide for OECD governments in developing their energy policies, and we suggest that it represents a conservative estimate of renewable energy and battery storage market development over the next decades.
The “Advanced Energy [R]evolution” was selected as the extreme scenario for this work because it is one of the most ambitious global scenarios for the uptake of renewable energy. Therefore, in considering the material requirements for renewable energy technologies under this scenario, we obtain an upper limit for material demand. We note that because this scenario is highly ambitious, unless there is serious policy change at a global scale, the actual uptake of renewable energy may be lower and the corresponding material requirements would be lower. The analysis of the resource requirements of the infrastructure – mainly copper and aluminium for transmission grids – are not part of this survey and further research is required as to whether or not a renewable or fossil fuel based energy system is more resource intensive.
The Reference scenario (REF) is based on the Current Policies scenarios published by the International Energy Agency (IEA) in World Energy Outlook 2014 (WEO 2014) 1F
2. It only takes into account existing international energy and environmental policies.
The Energy [R]evolution scenario (ER) has the key target to reduce worldwide carbon dioxide emissions from energy use down to a level of around 4 giga-tonnes per year by 2050 in order to hold the increase in global temperature under +2°C. A second objective is the global phasing out of nuclear energy. The general framework parameters for population and GDP growth remain unchanged from the Reference Scenario.
The new Advanced Energy [R]evolution scenario (ADV ER) assumes much stronger efforts to transform the energy systems of all world regions towards a 100% renewable energy supply. The consumption pathways remain basically the same as in the ER; however, a much faster introduction of new technologies leads to a complete decarbonisation of the power, heat and especially the transportation sector. The ADV ER has a significantly higher possibility that global mean temperature will remain between 1.5°C to 2°C than the basic ER.
1 See the full publication at http://www.greenpeace.org/international/Global/international/publications/climate/2015/Energy-Revolution-2015-
Full.pdf 2 International Energy Agency, ‘World Energy Outlook 2014’, 2014
JULY 2016
RENEWABLE ENERGY AND DEEP SEA MINING: SUPPLY, DEMAND AND SCENARIOS 3
1.3 KEY RESULTS
Cumulative demand for metals relative to known terrestrial resources
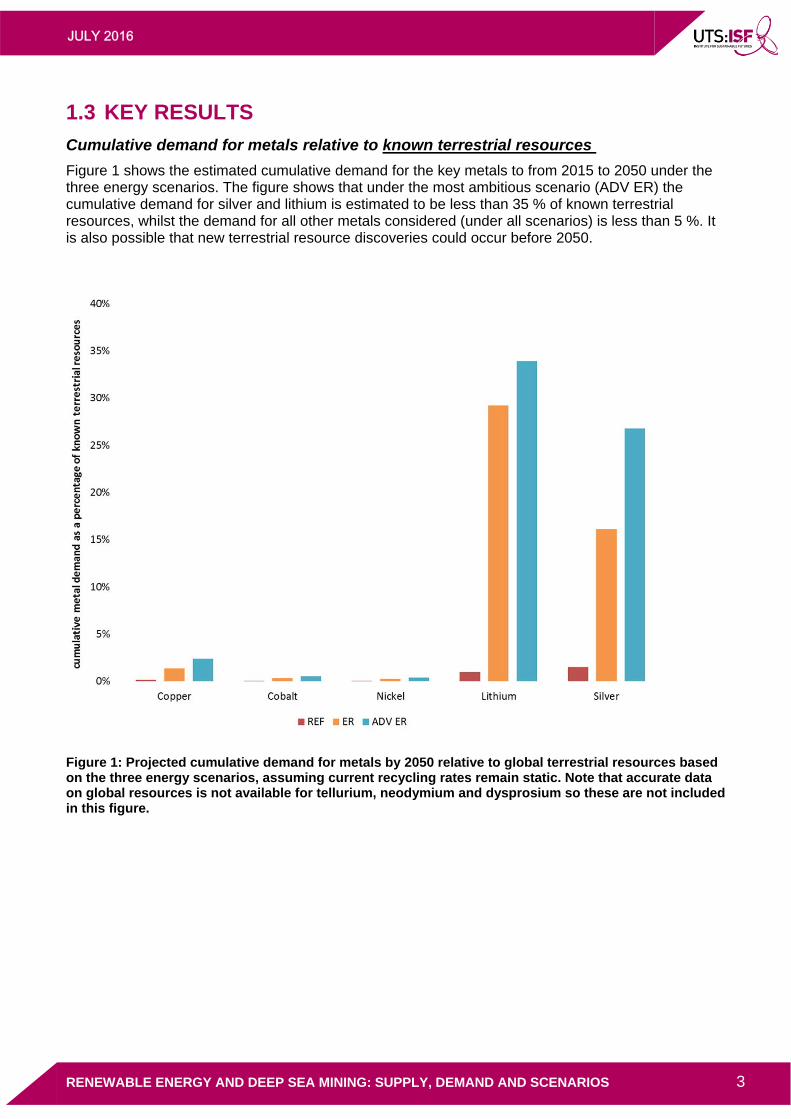
Figure 1 shows the estimated cumulative demand for the key metals to from 2015 to 2050 under the three energy scenarios. The figure shows that under the most ambitious scenario (ADV ER) the cumulative demand for silver and lithium is estimated to be less than 35 % of known terrestrial resources, whilst the demand for all other metals considered (under all scenarios) is less than 5 %. It is also possible that new terrestrial resource discoveries could occur before 2050.
Figure 1: Projected cumulative demand for metals by 2050 relative to global terrestrial resources based on the three energy scenarios, assuming current recycling rates remain static. Note that accurate data on global resources is not available for tellurium, neodymium and dysprosium so these are not included in this figure.
JULY 2016
RENEWABLE ENERGY AND DEEP SEA MINING: SUPPLY, DEMAND AND SCENARIOS 4
Cumulative demand for metals relative to known reserves
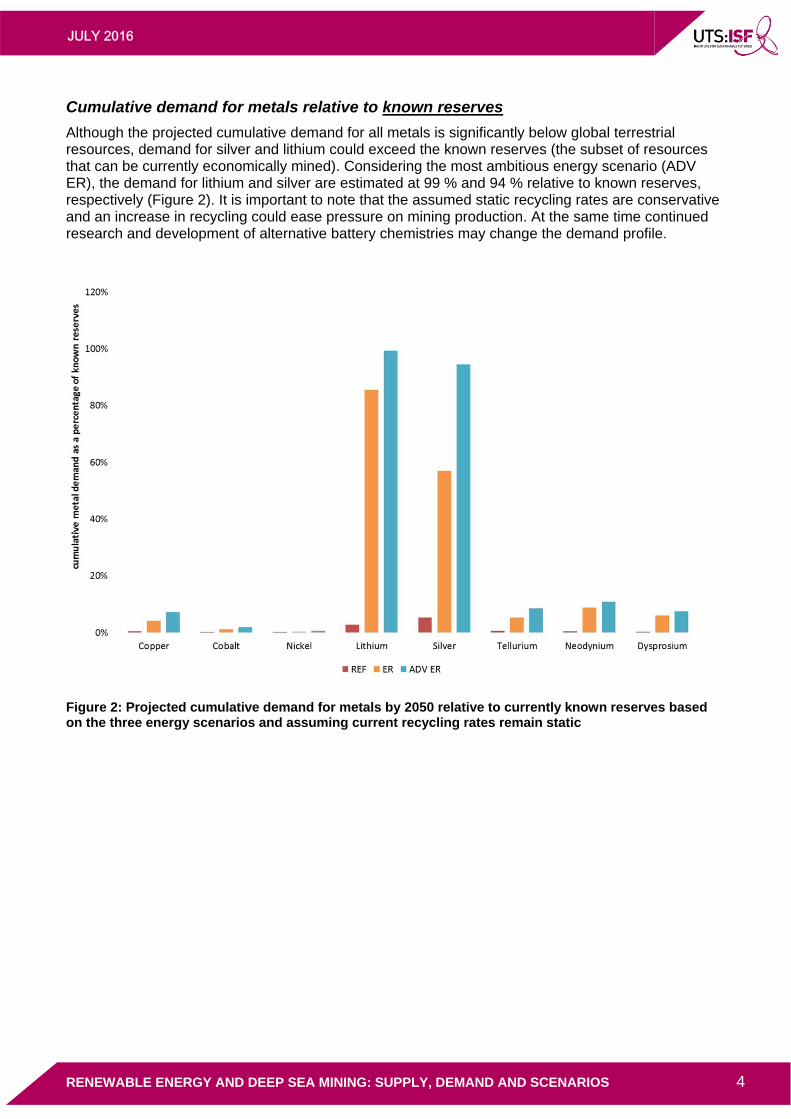
Although the projected cumulative demand for all metals is significantly below global terrestrial resources, demand for silver and lithium could exceed the known reserves (the subset of resources that can be currently economically mined). Considering the most ambitious energy scenario (ADV ER), the demand for lithium and silver are estimated at 99 % and 94 % relative to known reserves, respectively (Figure 2). It is important to note that the assumed static recycling rates are conservative and an increase in recycling could ease pressure on mining production. At the same time continued research and development of alternative battery chemistries may change the demand profile.
Figure 2: Projected cumulative demand for metals by 2050 relative to currently known reserves based on the three energy scenarios and assuming current recycling rates remain static
JULY 2016
RENEWABLE ENERGY AND DEEP SEA MINING: SUPPLY, DEMAND AND SCENARIOS 5
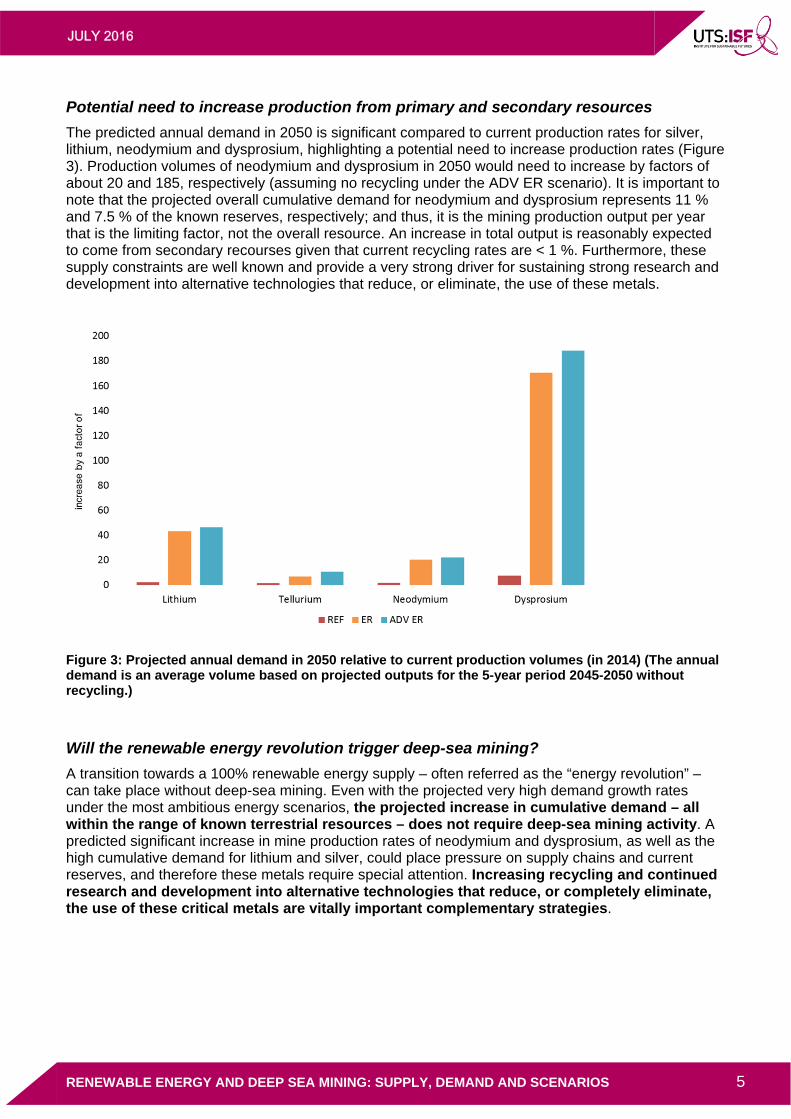
Potential need to increase production from primary and secondary resources
The predicted annual demand in 2050 is significant compared to current production rates for silver, lithium, neodymium and dysprosium, highlighting a potential need to increase production rates (Figure 3). Production volumes of neodymium and dysprosium in 2050 would need to increase by factors of about 20 and 185, respectively (assuming no recycling under the ADV ER scenario). It is important to note that the projected overall cumulative demand for neodymium and dysprosium represents 11 % and 7.5 % of the known reserves, respectively; and thus, it is the mining production output per year that is the limiting factor, not the overall resource. An increase in total output is reasonably expected to come from secondary recourses given that current recycling rates are < 1 %. Furthermore, these supply constraints are well known and provide a very strong driver for sustaining strong research and development into alternative technologies that reduce, or eliminate, the use of these metals.
Figure 3: Projected annual demand in 2050 relative to current production volumes (in 2014) (The annual demand is an average volume based on projected outputs for the 5-year period 2045-2050 without recycling.)
Will the renewable energy revolution trigger deep-sea mining?
A transition towards a 100% renewable energy supply – often referred as the “energy revolution” – can take place without deep-sea mining. Even with the projected very high demand growth rates under the most ambitious energy scenarios, the projected increase in cumulative demand – all within the range of known terrestrial resources – does not require deep-sea mining activity. A predicted significant increase in mine production rates of neodymium and dysprosium, as well as the high cumulative demand for lithium and silver, could place pressure on supply chains and current reserves, and therefore these metals require special attention. Increasing recycling and continued research and development into alternative technologies that reduce, or completely eliminate, the use of these critical metals are vitally important complementary strategies.
JULY 2016
RENEWABLE ENERGY AND DEEP SEA MINING: SUPPLY, DEMAND AND SCENARIOS 6
2 GLOBAL MARKET FOR RESOURCES POTENTIALLY MINED IN DEEP-SEA OPERATIONS
The low-carbon energy revolution, underpinned by new renewable infrastructure, will give rise to a new demand for minerals and metals to be used in new ways. This section describes the status quo for available terrestrial resources and production for commodities important in supporting the development of renewable energy technologies. It also identifies, where information is available, the potential resources available from deep-sea mining, and ultimately whether accessing these resources is likely to be necessary to underpin the energy transition.
A brief note is given here to clarify important terms used in relation to estimating future availability of materials. ‘Resources’ and ‘Reservess’ are key terms used in relation to geological deposits of metal-containing ores, yet they can be used in varying ways with quite different meanings 2F
3. Globally, the US Geological Survey (USGS) notes that reserves, which can be economically mined, are a subset of known resources3F
4. Over time, particular resources in different locations can be reclassified as reserves, for example if higher prices and strong demand justify the mining of lower grade deposits present in that location or if new technological advancements makes such extraction viable. Conversely, lower prices, weaker demand, or socio-political instability, community and environmental constraints can lead to resources being inaccessible.
For the purposes of this report, both the reserve and resource figures are quoted from available US Geological Survey data. We present estimated future demand relative to reserves as this likely reflects the drive to exploit more costly and energy intensive ores.
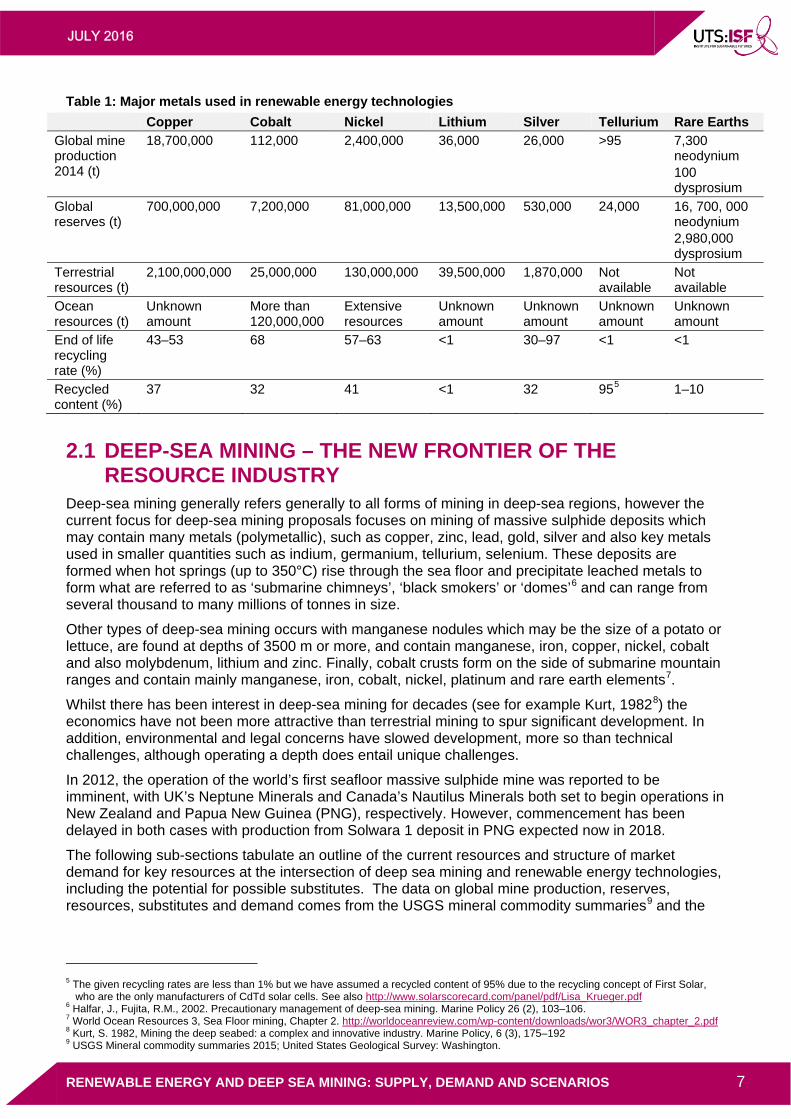
Whilst a suite of metals are needed for renewable energy, Table 1 highlights the relevant data for those metals where there is overlap between their significant use in renewable energy technologies and their potential to be sourced from deep sea mining. Following a brief introduction to deep sea mining, the remainder of this chapter details the available metal resources, key uses and demand profiles for the targeted metals presented in Tables 2–7.
3 By way of example, the Australian term “Economically Demonstrated Resources’ is closer in meaning to the US term ‘Reserves’ than
‘Resources’ 4 US Geological Survey Mineral Commodity Summary Appendix C Resources and Reserves 2012,
http://minerals.usgs.gov/minerals/pubs/mcs/2012/mcsapp2012.pdf
JULY 2016
RENEWABLE ENERGY AND DEEP SEA MINING: SUPPLY, DEMAND AND SCENARIOS 7
Table 1: Major metals used in renewable energy technologies
Copper Cobalt Nickel Lithium Silver Tellurium Rare Earths
Global mine production 2014 (t)
18,700,000 112,000 2,400,000 36,000 26,000 >95 7,300 neodynium 100 dysprosium
Global reserves (t)
700,000,000 7,200,000 81,000,000 13,500,000 530,000 24,000 16, 700, 000 neodynium 2,980,000 dysprosium
Terrestrial resources (t)
2,100,000,000 25,000,000 130,000,000 39,500,000 1,870,000 Not available
Not available
Ocean resources (t)
Unknown amount
More than 120,000,000
Extensive resources
Unknown amount
Unknown amount
Unknown amount
Unknown amount
End of life recycling rate (%)
43–53 68 57–63 <1 30–97 <1 <1
Recycled content (%)
37 32 41 <1 32 954F
5 1–10
2.1 DEEP-SEA MINING – THE NEW FRONTIER OF THE RESOURCE INDUSTRY
Deep-sea mining generally refers generally to all forms of mining in deep-sea regions, however the current focus for deep-sea mining proposals focuses on mining of massive sulphide deposits which may contain many metals (polymetallic), such as copper, zinc, lead, gold, silver and also key metals used in smaller quantities such as indium, germanium, tellurium, selenium. These deposits are formed when hot springs (up to 350°C) rise through the sea floor and precipitate leached metals to form what are referred to as ‘submarine chimneys’, ‘black smokers’ or ‘domes’ 5F
6 and can range from several thousand to many millions of tonnes in size.
Other types of deep-sea mining occurs with manganese nodules which may be the size of a potato or lettuce, are found at depths of 3500 m or more, and contain manganese, iron, copper, nickel, cobalt and also molybdenum, lithium and zinc. Finally, cobalt crusts form on the side of submarine mountain ranges and contain mainly manganese, iron, cobalt, nickel, platinum and rare earth elements6F
7.
Whilst there has been interest in deep-sea mining for decades (see for example Kurt, 1982 7F
8) the economics have not been more attractive than terrestrial mining to spur significant development. In addition, environmental and legal concerns have slowed development, more so than technical challenges, although operating a depth does entail unique challenges.
In 2012, the operation of the world’s first seafloor massive sulphide mine was reported to be imminent, with UK’s Neptune Minerals and Canada’s Nautilus Minerals both set to begin operations in New Zealand and Papua New Guinea (PNG), respectively. However, commencement has been delayed in both cases with production from Solwara 1 deposit in PNG expected now in 2018.
The following sub-sections tabulate an outline of the current resources and structure of market demand for key resources at the intersection of deep sea mining and renewable energy technologies, including the potential for possible substitutes. The data on global mine production, reserves, resources, substitutes and demand comes from the USGS mineral commodity summaries8F
9 and the
5 The given recycling rates are less than 1% but we have assumed a recycled content of 95% due to the recycling concept of First Solar,
who are the only manufacturers of CdTd solar cells. See also http://www.solarscorecard.com/panel/pdf/Lisa_Krueger.pdf 6 Halfar, J., Fujita, R.M., 2002. Precautionary management of deep-sea mining. Marine Policy 26 (2), 103–106. 7 World Ocean Resources 3, Sea Floor mining, Chapter 2. http://worldoceanreview.com/wp-content/downloads/wor3/WOR3_chapter_2.pdf 8 Kurt, S. 1982, Mining the deep seabed: a complex and innovative industry. Marine Policy, 6 (3), 175–192 9 USGS Mineral commodity summaries 2015; United States Geological Survey: Washington.
JULY 2016
RENEWABLE ENERGY AND DEEP SEA MINING: SUPPLY, DEMAND AND SCENARIOS 8
data on recycling rates from a 2011 UNEP report. 9F
10
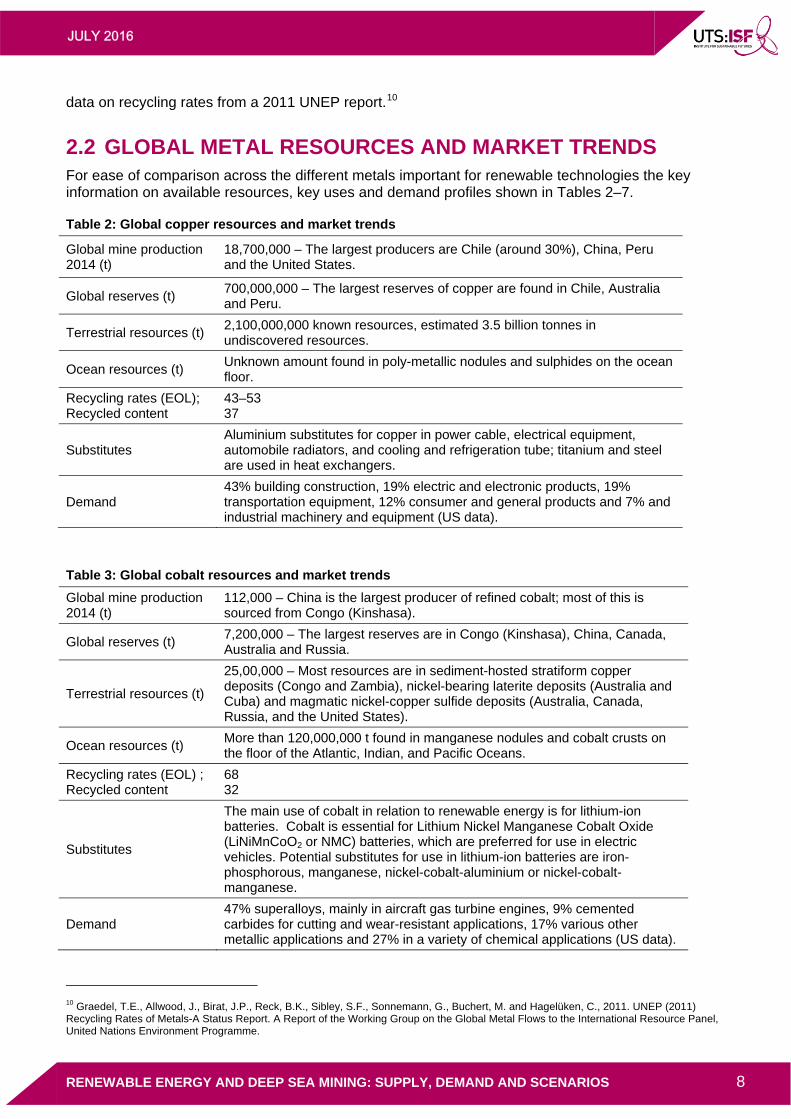
2.2 GLOBAL METAL RESOURCES AND MARKET TRENDS For ease of comparison across the different metals important for renewable technologies the key information on available resources, key uses and demand profiles shown in Tables 2–7.
Table 2: Global copper resources and market trends
Global mine production 2014 (t)
18,700,000 – The largest producers are Chile (around 30%), China, Peru and the United States.
Global reserves (t) 700,000,000 – The largest reserves of copper are found in Chile, Australia and Peru.
Terrestrial resources (t) 2,100,000,000 known resources, estimated 3.5 billion tonnes in undiscovered resources.
Ocean resources (t) Unknown amount found in poly-metallic nodules and sulphides on the ocean floor.
Recycling rates (EOL); Recycled content
43–53 37
Substitutes Aluminium substitutes for copper in power cable, electrical equipment, automobile radiators, and cooling and refrigeration tube; titanium and steel are used in heat exchangers.
Demand 43% building construction, 19% electric and electronic products, 19% transportation equipment, 12% consumer and general products and 7% and industrial machinery and equipment (US data).
Table 3: Global cobalt resources and market trends
Global mine production 2014 (t)
112,000 – China is the largest producer of refined cobalt; most of this is sourced from Congo (Kinshasa).
Global reserves (t) 7,200,000 – The largest reserves are in Congo (Kinshasa), China, Canada, Australia and Russia.
Terrestrial resources (t)
25,00,000 – Most resources are in sediment-hosted stratiform copper deposits (Congo and Zambia), nickel-bearing laterite deposits (Australia and Cuba) and magmatic nickel-copper sulfide deposits (Australia, Canada, Russia, and the United States).
Ocean resources (t) More than 120,000,000 t found in manganese nodules and cobalt crusts on the floor of the Atlantic, Indian, and Pacific Oceans.
Recycling rates (EOL) ; Recycled content
68 32
Substitutes
The main use of cobalt in relation to renewable energy is for lithium-ion batteries. Cobalt is essential for Lithium Nickel Manganese Cobalt Oxide (LiNiMnCoO2 or NMC) batteries, which are preferred for use in electric vehicles. Potential substitutes for use in lithium-ion batteries are iron-phosphorous, manganese, nickel-cobalt-aluminium or nickel-cobalt-manganese.
Demand 47% superalloys, mainly in aircraft gas turbine engines, 9% cemented carbides for cutting and wear-resistant applications, 17% various other metallic applications and 27% in a variety of chemical applications (US data).
10 Graedel, T.E., Allwood, J., Birat, J.P., Reck, B.K., Sibley, S.F., Sonnemann, G., Buchert, M. and Hagelüken, C., 2011. UNEP (2011) Recycling Rates of Metals-A Status Report. A Report of the Working Group on the Global Metal Flows to the International Resource Panel, United Nations Environment Programme.
JULY 2016
RENEWABLE ENERGY AND DEEP SEA MINING: SUPPLY, DEMAND AND SCENARIOS 9
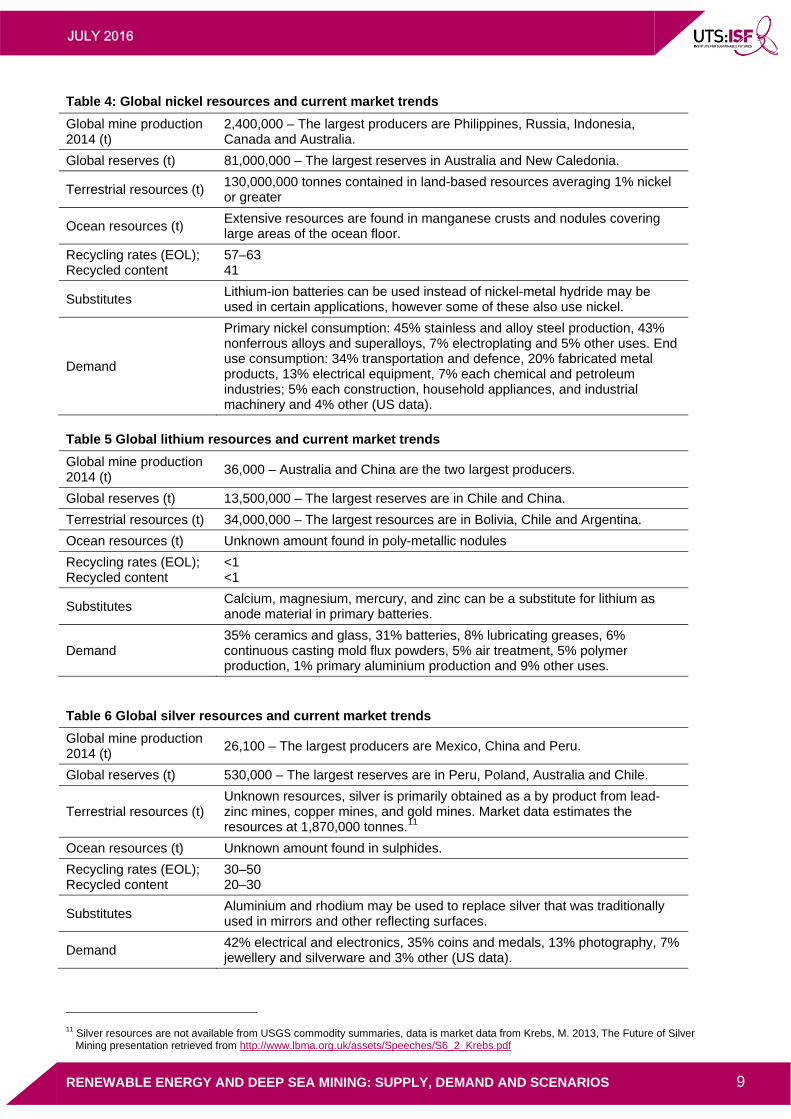
Table 4: Global nickel resources and current market trends
Global mine production 2014 (t)
2,400,000 – The largest producers are Philippines, Russia, Indonesia, Canada and Australia.
Global reserves (t) 81,000,000 – The largest reserves in Australia and New Caledonia.
Terrestrial resources (t) 130,000,000 tonnes contained in land-based resources averaging 1% nickel or greater
Ocean resources (t) Extensive resources are found in manganese crusts and nodules covering large areas of the ocean floor.
Recycling rates (EOL); Recycled content
57–63 41
Substitutes Lithium-ion batteries can be used instead of nickel-metal hydride may be used in certain applications, however some of these also use nickel.
Demand
Primary nickel consumption: 45% stainless and alloy steel production, 43% nonferrous alloys and superalloys, 7% electroplating and 5% other uses. End use consumption: 34% transportation and defence, 20% fabricated metal products, 13% electrical equipment, 7% each chemical and petroleum industries; 5% each construction, household appliances, and industrial machinery and 4% other (US data).
Table 5 Global lithium resources and current market trends
Global mine production 2014 (t)
36,000 – Australia and China are the two largest producers.
Global reserves (t) 13,500,000 – The largest reserves are in Chile and China.
Terrestrial resources (t) 34,000,000 – The largest resources are in Bolivia, Chile and Argentina.
Ocean resources (t) Unknown amount found in poly-metallic nodules
Recycling rates (EOL); Recycled content
<1 <1
Substitutes Calcium, magnesium, mercury, and zinc can be a substitute for lithium as anode material in primary batteries.
Demand 35% ceramics and glass, 31% batteries, 8% lubricating greases, 6% continuous casting mold flux powders, 5% air treatment, 5% polymer production, 1% primary aluminium production and 9% other uses.
Table 6 Global silver resources and current market trends
Global mine production 2014 (t)
26,100 – The largest producers are Mexico, China and Peru.
Global reserves (t) 530,000 – The largest reserves are in Peru, Poland, Australia and Chile.
Terrestrial resources (t) Unknown resources, silver is primarily obtained as a by product from lead-zinc mines, copper mines, and gold mines. Market data estimates the resources at 1,870,000 tonnes.10F
11
Ocean resources (t) Unknown amount found in sulphides.
Recycling rates (EOL); Recycled content
30–50 20–30
Substitutes Aluminium and rhodium may be used to replace silver that was traditionally used in mirrors and other reflecting surfaces.
Demand 42% electrical and electronics, 35% coins and medals, 13% photography, 7% jewellery and silverware and 3% other (US data).
11 Silver resources are not available from USGS commodity summaries, data is market data from Krebs, M. 2013, The Future of Silver
Mining presentation retrieved from http://www.lbma.org.uk/assets/Speeches/S6_2_Krebs.pdf
JULY 2016
RENEWABLE ENERGY AND DEEP SEA MINING: SUPPLY, DEMAND AND SCENARIOS 10
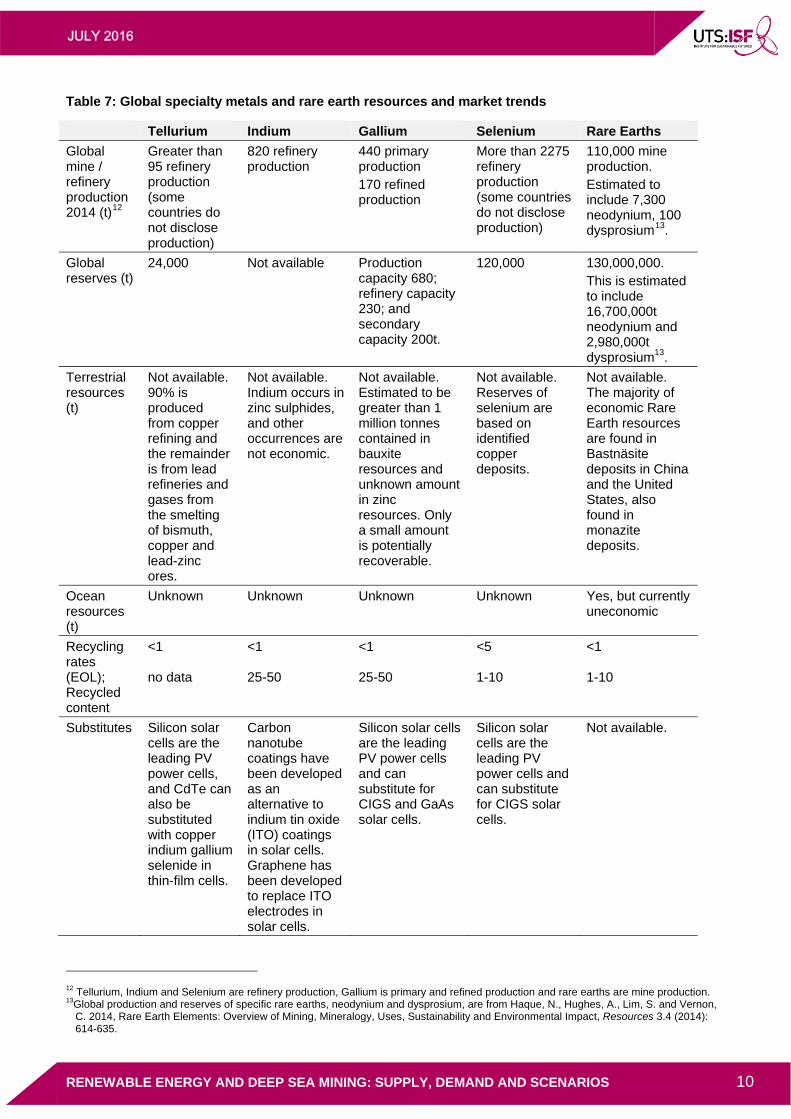
Table 7: Global specialty metals and rare earth resources and market trends
Tellurium Indium Gallium Selenium Rare Earths
Global mine / refinery production 2014 (t)11F
12
Greater than 95 refinery production (some countries do not disclose production)
820 refinery production
440 primary production 170 refined production
More than 2275 refinery production (some countries do not disclose production)
110,000 mine production. Estimated to include 7,300 neodynium, 100 dysprosium12F
13.
Global reserves (t)
24,000 Not available Production capacity 680; refinery capacity 230; and secondary capacity 200t.
120,000
130,000,000. This is estimated to include 16,700,000t neodynium and 2,980,000t dysprosium13.
Terrestrial resources (t)
Not available. 90% is produced from copper refining and the remainder is from lead refineries and gases from the smelting of bismuth, copper and lead-zinc ores.
Not available. Indium occurs in zinc sulphides, and other occurrences are not economic.
Not available. Estimated to be greater than 1 million tonnes contained in bauxite resources and unknown amount in zinc resources. Only a small amount is potentially recoverable.
Not available. Reserves of selenium are based on identified copper deposits.
Not available. The majority of economic Rare Earth resources are found in Bastnäsite deposits in China and the United States, also found in monazite deposits.
Ocean resources (t)
Unknown Unknown Unknown Unknown Yes, but currently uneconomic
Recycling rates (EOL); Recycled content
<1 no data
<1 25-50
<1 25-50
<5 1-10
<1 1-10
Substitutes Silicon solar cells are the leading PV power cells, and CdTe can also be substituted with copper indium gallium selenide in thin-film cells.
Carbon nanotube coatings have been developed as an alternative to indium tin oxide (ITO) coatings in solar cells. Graphene has been developed to replace ITO electrodes in solar cells.
Silicon solar cells are the leading PV power cells and can substitute for CIGS and GaAs solar cells.
Silicon solar cells are the leading PV power cells and can substitute for CIGS solar cells.
Not available.
12 Tellurium, Indium and Selenium are refinery production, Gallium is primary and refined production and rare earths are mine production. 13Global production and reserves of specific rare earths, neodynium and dysprosium, are from Haque, N., Hughes, A., Lim, S. and Vernon,
C. 2014, Rare Earth Elements: Overview of Mining, Mineralogy, Uses, Sustainability and Environmental Impact, Resources 3.4 (2014): 614-635.
JULY 2016
RENEWABLE ENERGY AND DEEP SEA MINING: SUPPLY, DEMAND AND SCENARIOS 11
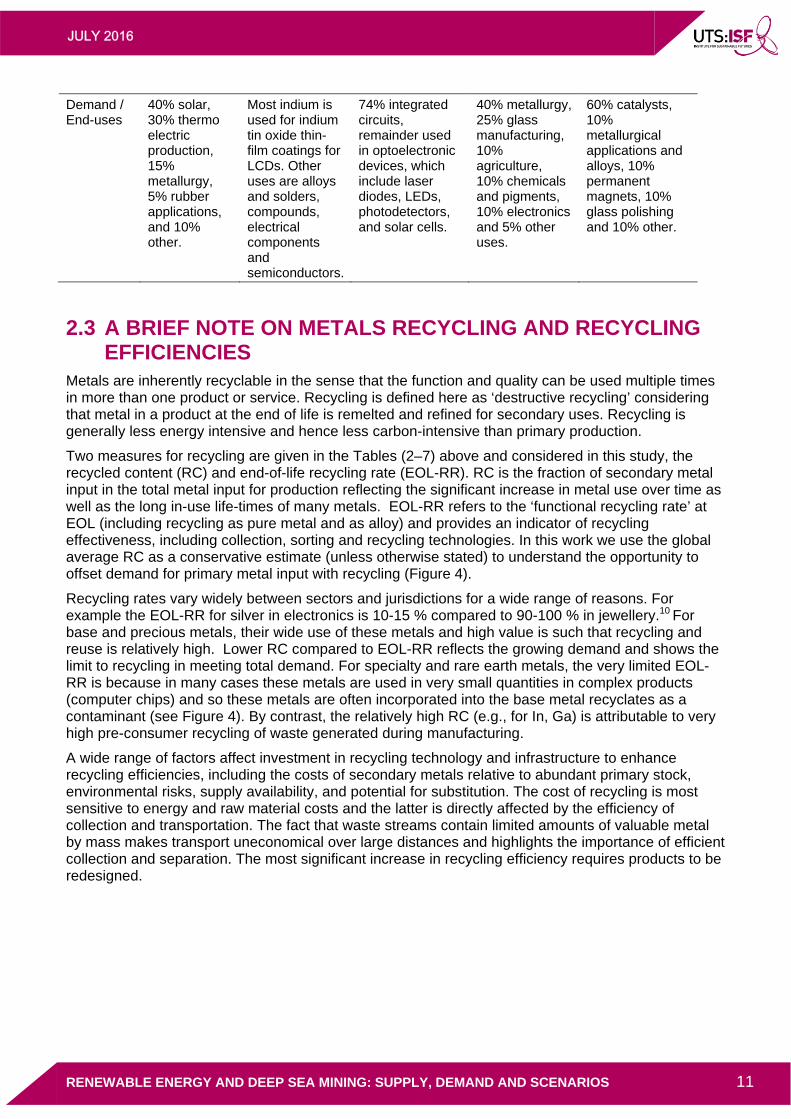
Demand / End-uses
40% solar, 30% thermo electric production, 15% metallurgy, 5% rubber applications, and 10% other.
Most indium is used for indium tin oxide thin-film coatings for LCDs. Other uses are alloys and solders, compounds, electrical components and semiconductors.
74% integrated circuits, remainder used in optoelectronic devices, which include laser diodes, LEDs, photodetectors, and solar cells.
40% metallurgy, 25% glass manufacturing, 10% agriculture, 10% chemicals and pigments, 10% electronics and 5% other uses.
60% catalysts, 10% metallurgical applications and alloys, 10% permanent magnets, 10% glass polishing and 10% other.
2.3 A BRIEF NOTE ON METALS RECYCLING AND RECYCLING EFFICIENCIES
Metals are inherently recyclable in the sense that the function and quality can be used multiple times in more than one product or service. Recycling is defined here as ‘destructive recycling’ considering that metal in a product at the end of life is remelted and refined for secondary uses. Recycling is generally less energy intensive and hence less carbon-intensive than primary production.
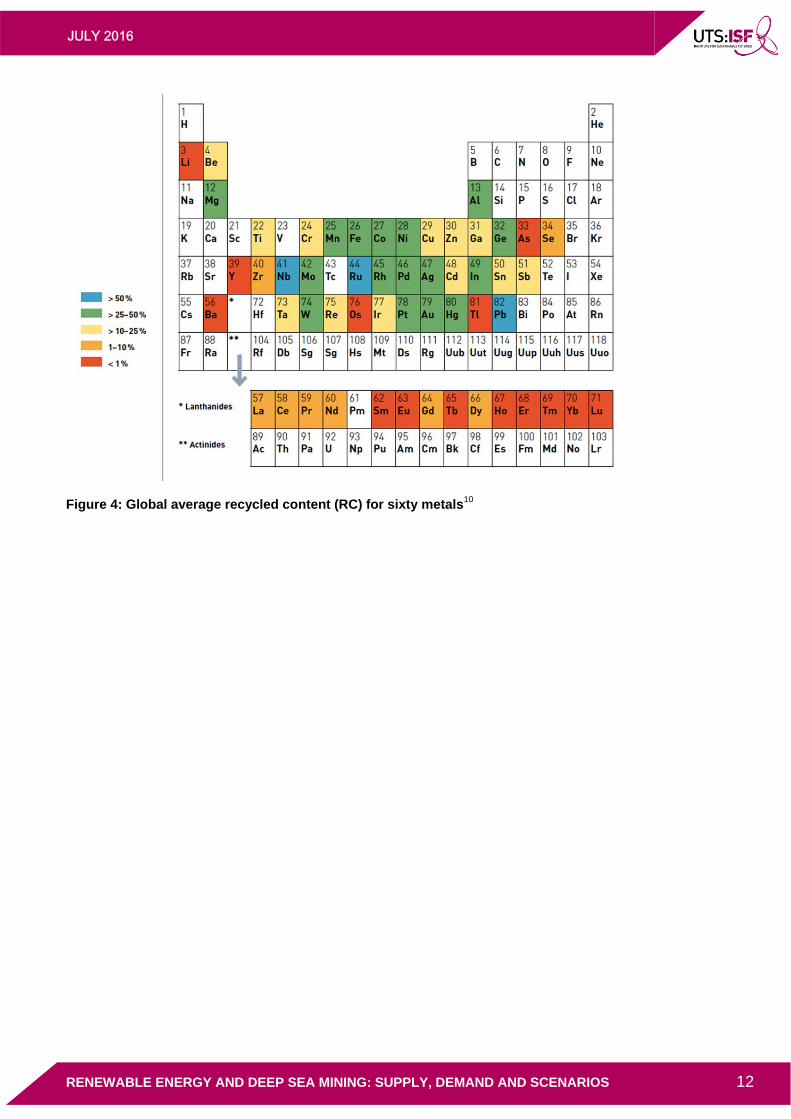
Two measures for recycling are given in the Tables (2–7) above and considered in this study, the recycled content (RC) and end-of-life recycling rate (EOL-RR). RC is the fraction of secondary metal input in the total metal input for production reflecting the significant increase in metal use over time as well as the long in-use life-times of many metals. EOL-RR refers to the ‘functional recycling rate’ at EOL (including recycling as pure metal and as alloy) and provides an indicator of recycling effectiveness, including collection, sorting and recycling technologies. In this work we use the global average RC as a conservative estimate (unless otherwise stated) to understand the opportunity to offset demand for primary metal input with recycling (Figure 4).
Recycling rates vary widely between sectors and jurisdictions for a wide range of reasons. For example the EOL-RR for silver in electronics is 10-15 % compared to 90-100 % in jewellery.10 For base and precious metals, their wide use of these metals and high value is such that recycling and reuse is relatively high. Lower RC compared to EOL-RR reflects the growing demand and shows the limit to recycling in meeting total demand. For specialty and rare earth metals, the very limited EOL-RR is because in many cases these metals are used in very small quantities in complex products (computer chips) and so these metals are often incorporated into the base metal recyclates as a contaminant (see Figure 4). By contrast, the relatively high RC (e.g., for In, Ga) is attributable to very high pre-consumer recycling of waste generated during manufacturing.
A wide range of factors affect investment in recycling technology and infrastructure to enhance recycling efficiencies, including the costs of secondary metals relative to abundant primary stock, environmental risks, supply availability, and potential for substitution. The cost of recycling is most sensitive to energy and raw material costs and the latter is directly affected by the efficiency of collection and transportation. The fact that waste streams contain limited amounts of valuable metal by mass makes transport uneconomical over large distances and highlights the importance of efficient collection and separation. The most significant increase in recycling efficiency requires products to be redesigned.
JULY 2016
RENEWABLE ENERGY AND DEEP SEA MINING: SUPPLY, DEMAND AND SCENARIOS 12
Figure 4: Global average recycled content (RC) for sixty metals10
JULY 2016
RENEWABLE ENERGY AND DEEP SEA MINING: SUPPLY, DEMAND AND SCENARIOS 13
3 OVERVIEW OF GLOBAL MATERIAL REQUIREMENTS FOR THE MAIN RENEWABLE ENERGY TECHNOLOGIES
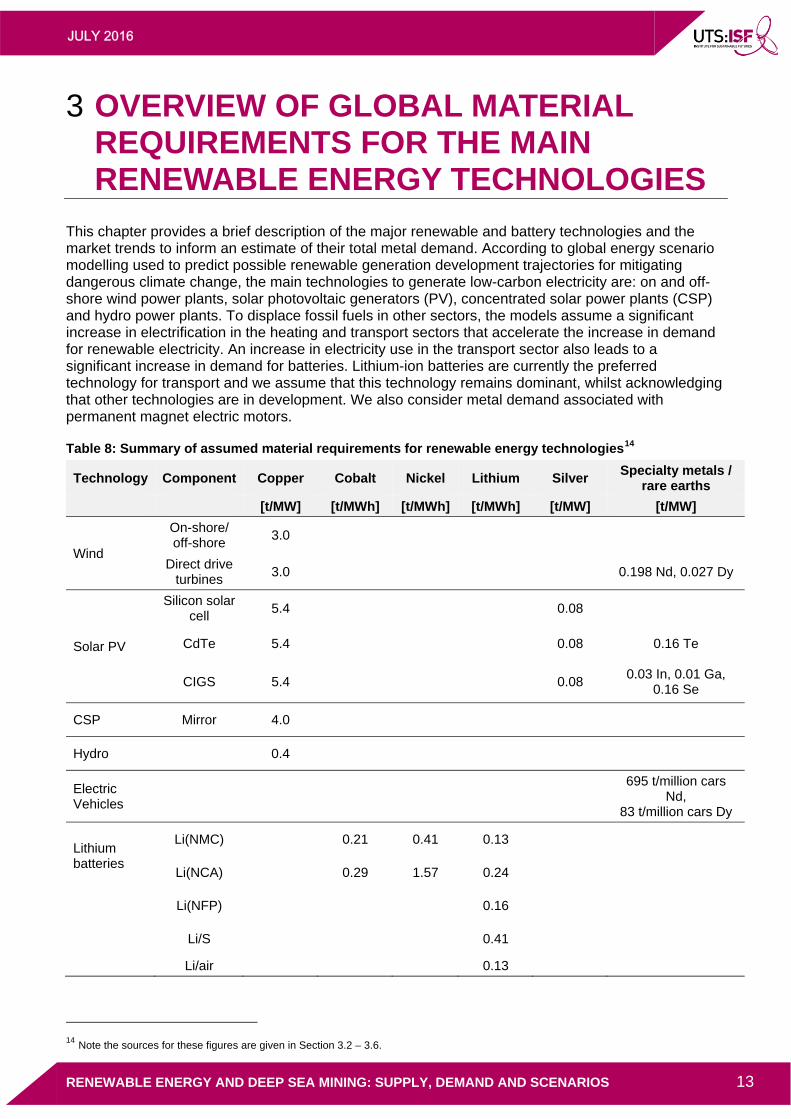
This chapter provides a brief description of the major renewable and battery technologies and the market trends to inform an estimate of their total metal demand. According to global energy scenario modelling used to predict possible renewable generation development trajectories for mitigating dangerous climate change, the main technologies to generate low-carbon electricity are: on and off-shore wind power plants, solar photovoltaic generators (PV), concentrated solar power plants (CSP) and hydro power plants. To displace fossil fuels in other sectors, the models assume a significant increase in electrification in the heating and transport sectors that accelerate the increase in demand for renewable electricity. An increase in electricity use in the transport sector also leads to a significant increase in demand for batteries. Lithium-ion batteries are currently the preferred technology for transport and we assume that this technology remains dominant, whilst acknowledging that other technologies are in development. We also consider metal demand associated with permanent magnet electric motors.
Table 8: Summary of assumed material requirements for renewable energy technologies13F
14
Technology Component Copper Cobalt Nickel Lithium Silver Specialty metals /
rare earths
[t/MW] [t/MWh] [t/MWh] [t/MWh] [t/MW] [t/MW]
Wind
On-shore/ off-shore
3.0
Direct drive turbines
3.0 0.198 Nd, 0.027 Dy
Solar PV
Silicon solar cell
5.4 0.08
CdTe 5.4 0.08 0.16 Te
CIGS 5.4 0.08 0.03 In, 0.01 Ga,
0.16 Se
CSP Mirror 4.0
Hydro 0.4
Electric Vehicles
695 t/million cars
Nd, 83 t/million cars Dy
Lithium batteries
Li(NMC) 0.21 0.41 0.13
Li(NCA) 0.29 1.57 0.24
Li(NFP)
0.16
Li/S
0.41
Li/air 0.13
14 Note the sources for these figures are given in Section 3.2 – 3.6.
JULY 2016
RENEWABLE ENERGY AND DEEP SEA MINING: SUPPLY, DEMAND AND SCENARIOS 14
A summary of the assumed material intensities for the renewable energy technologies considered in this study is given in Table 8. We note that there is significant uncertainty in these numbers as published data may be out-of-date by the time it is publically available owing to the rapid pace of technology development; and, many of the intensities are averaged based on estimates for technologies from different providers and sources. It is a simplification to assume that material intensities for specific technologies are static over the timeframe evaluated; however, we have assumed that there will be changes in terms of which technologies are dominant at different points in the future. Specific assumptions by technology and applications are detailed in the discussion below.
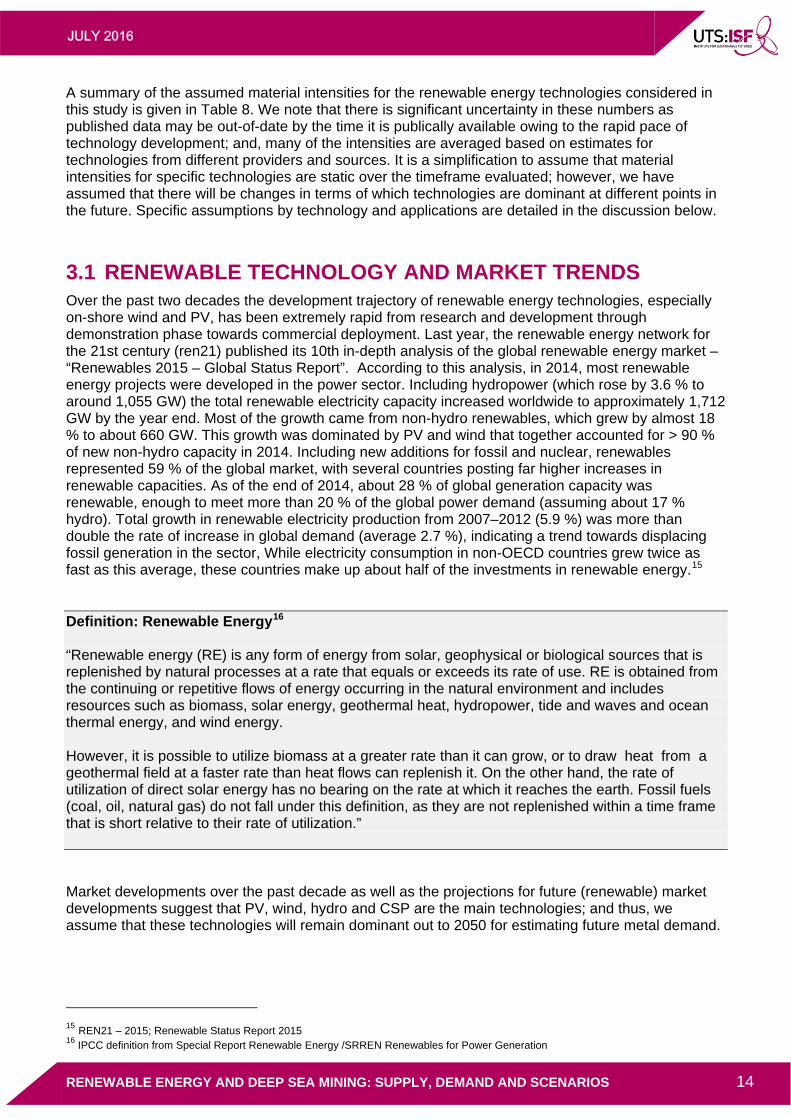
3.1 RENEWABLE TECHNOLOGY AND MARKET TRENDS Over the past two decades the development trajectory of renewable energy technologies, especially on-shore wind and PV, has been extremely rapid from research and development through demonstration phase towards commercial deployment. Last year, the renewable energy network for the 21st century (ren21) published its 10th in-depth analysis of the global renewable energy market – “Renewables 2015 – Global Status Report”. According to this analysis, in 2014, most renewable energy projects were developed in the power sector. Including hydropower (which rose by 3.6 % to around 1,055 GW) the total renewable electricity capacity increased worldwide to approximately 1,712 GW by the year end. Most of the growth came from non-hydro renewables, which grew by almost 18 % to about 660 GW. This growth was dominated by PV and wind that together accounted for > 90 % of new non-hydro capacity in 2014. Including new additions for fossil and nuclear, renewables represented 59 % of the global market, with several countries posting far higher increases in renewable capacities. As of the end of 2014, about 28 % of global generation capacity was renewable, enough to meet more than 20 % of the global power demand (assuming about 17 % hydro). Total growth in renewable electricity production from 2007–2012 (5.9 %) was more than double the rate of increase in global demand (average 2.7 %), indicating a trend towards displacing fossil generation in the sector, While electricity consumption in non-OECD countries grew twice as fast as this average, these countries make up about half of the investments in renewable energy. 14F
15
Definition: Renewable Energy15F
16 “Renewable energy (RE) is any form of energy from solar, geophysical or biological sources that is replenished by natural processes at a rate that equals or exceeds its rate of use. RE is obtained from the continuing or repetitive flows of energy occurring in the natural environment and includes resources such as biomass, solar energy, geothermal heat, hydropower, tide and waves and ocean thermal energy, and wind energy. However, it is possible to utilize biomass at a greater rate than it can grow, or to draw heat from a geothermal field at a faster rate than heat flows can replenish it. On the other hand, the rate of utilization of direct solar energy has no bearing on the rate at which it reaches the earth. Fossil fuels (coal, oil, natural gas) do not fall under this definition, as they are not replenished within a time frame that is short relative to their rate of utilization.”
Market developments over the past decade as well as the projections for future (renewable) market developments suggest that PV, wind, hydro and CSP are the main technologies; and thus, we assume that these technologies will remain dominant out to 2050 for estimating future metal demand.
15 REN21 – 2015; Renewable Status Report 2015 16
IPCC definition from Special Report Renewable Energy /SRREN Renewables for Power Generation
JULY 2016
RENEWABLE ENERGY AND DEEP SEA MINING: SUPPLY, DEMAND AND SCENARIOS 15
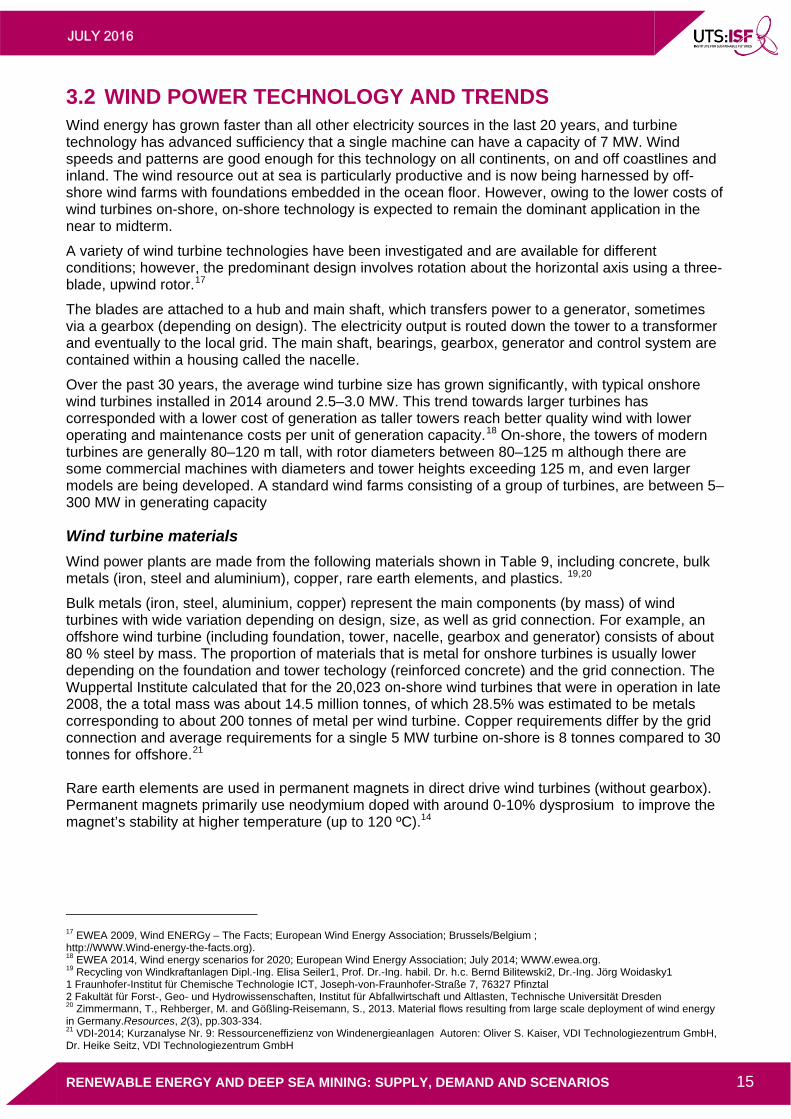
3.2 WIND POWER TECHNOLOGY AND TRENDS Wind energy has grown faster than all other electricity sources in the last 20 years, and turbine technology has advanced sufficiency that a single machine can have a capacity of 7 MW. Wind speeds and patterns are good enough for this technology on all continents, on and off coastlines and inland. The wind resource out at sea is particularly productive and is now being harnessed by off-shore wind farms with foundations embedded in the ocean floor. However, owing to the lower costs of wind turbines on-shore, on-shore technology is expected to remain the dominant application in the near to midterm.
A variety of wind turbine technologies have been investigated and are available for different conditions; however, the predominant design involves rotation about the horizontal axis using a three-blade, upwind rotor. 16F
17
The blades are attached to a hub and main shaft, which transfers power to a generator, sometimes via a gearbox (depending on design). The electricity output is routed down the tower to a transformer and eventually to the local grid. The main shaft, bearings, gearbox, generator and control system are contained within a housing called the nacelle.
Over the past 30 years, the average wind turbine size has grown significantly, with typical onshore wind turbines installed in 2014 around 2.5–3.0 MW. This trend towards larger turbines has corresponded with a lower cost of generation as taller towers reach better quality wind with lower operating and maintenance costs per unit of generation capacity. 17F
18 On-shore, the towers of modern turbines are generally 80–120 m tall, with rotor diameters between 80–125 m although there are some commercial machines with diameters and tower heights exceeding 125 m, and even larger models are being developed. A standard wind farms consisting of a group of turbines, are between 5–300 MW in generating capacity
Wind turbine materials
Wind power plants are made from the following materials shown in Table 9, including concrete, bulk metals (iron, steel and aluminium), copper, rare earth elements, and plastics. 18F
19,19F
20
Bulk metals (iron, steel, aluminium, copper) represent the main components (by mass) of wind turbines with wide variation depending on design, size, as well as grid connection. For example, an offshore wind turbine (including foundation, tower, nacelle, gearbox and generator) consists of about 80 % steel by mass. The proportion of materials that is metal for onshore turbines is usually lower depending on the foundation and tower techology (reinforced concrete) and the grid connection. The Wuppertal Institute calculated that for the 20,023 on-shore wind turbines that were in operation in late 2008, the a total mass was about 14.5 million tonnes, of which 28.5% was estimated to be metals corresponding to about 200 tonnes of metal per wind turbine. Copper requirements differ by the grid connection and average requirements for a single 5 MW turbine on-shore is 8 tonnes compared to 30 tonnes for offshore.20F
21 Rare earth elements are used in permanent magnets in direct drive wind turbines (without gearbox). Permanent magnets primarily use neodymium doped with around 0-10% dysprosium to improve the magnet’s stability at higher temperature (up to 120 ºC).14
17 EWEA 2009, Wind ENERGy – The Facts; European Wind Energy Association; Brussels/Belgium ; http://WWW.Wind-energy-the-facts.org). 18 EWEA 2014, Wind energy scenarios for 2020; European Wind Energy Association; July 2014; WWW.ewea.org. 19 Recycling von Windkraftanlagen Dipl.-Ing. Elisa Seiler1, Prof. Dr.-Ing. habil. Dr. h.c. Bernd Bilitewski2, Dr.-Ing. Jörg Woidasky1 1 Fraunhofer-Institut für Chemische Technologie ICT, Joseph-von-Fraunhofer-Straße 7, 76327 Pfinztal 2 Fakultät für Forst-, Geo- und Hydrowissenschaften, Institut für Abfallwirtschaft und Altlasten, Technische Universität Dresden 20 Zimmermann, T., Rehberger, M. and Gößling-Reisemann, S., 2013. Material flows resulting from large scale deployment of wind energy in Germany.Resources, 2(3), pp.303-334. 21 VDI-2014; Kurzanalyse Nr. 9: Ressourceneffizienz von Windenergieanlagen Autoren: Oliver S. Kaiser, VDI Technologiezentrum GmbH, Dr. Heike Seitz, VDI Technologiezentrum GmbH
JULY 2016
RENEWABLE ENERGY AND DEEP SEA MINING: SUPPLY, DEMAND AND SCENARIOS 16
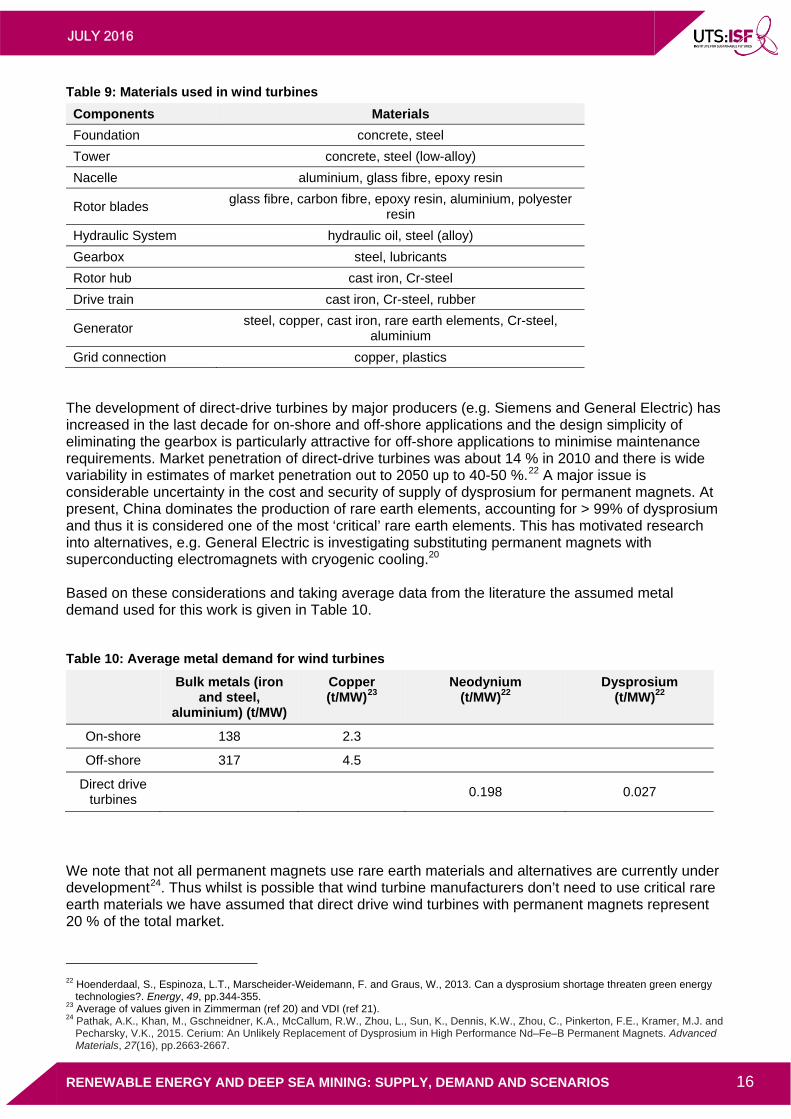
Table 9: Materials used in wind turbines
Components Materials
Foundation concrete, steel
Tower concrete, steel (low-alloy)
Nacelle aluminium, glass fibre, epoxy resin
Rotor blades glass fibre, carbon fibre, epoxy resin, aluminium, polyester
resin
Hydraulic System hydraulic oil, steel (alloy)
Gearbox steel, lubricants
Rotor hub cast iron, Cr-steel
Drive train cast iron, Cr-steel, rubber
Generator steel, copper, cast iron, rare earth elements, Cr-steel,
aluminium
Grid connection copper, plastics
The development of direct-drive turbines by major producers (e.g. Siemens and General Electric) has increased in the last decade for on-shore and off-shore applications and the design simplicity of eliminating the gearbox is particularly attractive for off-shore applications to minimise maintenance requirements. Market penetration of direct-drive turbines was about 14 % in 2010 and there is wide variability in estimates of market penetration out to 2050 up to 40-50 %. 21F
22 A major issue is considerable uncertainty in the cost and security of supply of dysprosium for permanent magnets. At present, China dominates the production of rare earth elements, accounting for > 99% of dysprosium and thus it is considered one of the most ‘critical’ rare earth elements. This has motivated research into alternatives, e.g. General Electric is investigating substituting permanent magnets with superconducting electromagnets with cryogenic cooling.20 Based on these considerations and taking average data from the literature the assumed metal demand used for this work is given in Table 10.
Table 10: Average metal demand for wind turbines
Bulk metals (iron and steel,
aluminium) (t/MW)
Copper (t/MW)22F
23 Neodynium
(t/MW)22 Dysprosium
(t/MW)22
On-shore 138 2.3
Off-shore 317 4.5
Direct drive turbines
0.198 0.027
We note that not all permanent magnets use rare earth materials and alternatives are currently under development 23F
24. Thus whilst is possible that wind turbine manufacturers don’t need to use critical rare earth materials we have assumed that direct drive wind turbines with permanent magnets represent 20 % of the total market.
22 Hoenderdaal, S., Espinoza, L.T., Marscheider-Weidemann, F. and Graus, W., 2013. Can a dysprosium shortage threaten green energy
technologies?. Energy, 49, pp.344-355. 23 Average of values given in Zimmerman (ref 20) and VDI (ref 21). 24 Pathak, A.K., Khan, M., Gschneidner, K.A., McCallum, R.W., Zhou, L., Sun, K., Dennis, K.W., Zhou, C., Pinkerton, F.E., Kramer, M.J. and
Pecharsky, V.K., 2015. Cerium: An Unlikely Replacement of Dysprosium in High Performance Nd–Fe–B Permanent Magnets. Advanced Materials, 27(16), pp.2663-2667.
JULY 2016
RENEWABLE ENERGY AND DEEP SEA MINING: SUPPLY, DEMAND AND SCENARIOS 17
Stainless steel is used for some parts of the wind turbines, mainly within the gearbox and for parts of the nacelle to help achieve protection again corrosion. The amount of nickel required for stainless steel used in wind turbines was not considered in this analysis
Recycling of wind turbine materials
It is technically possible to recycle a significant proportion (average recycling rate for bulk metals about 80-95%) of the materials used in wind turbines (down-cycling in the case of concrete). However, recycling of the composite materials used for rotor blades remains problematic19. Understanding how recycling practise might impact demand is complex owing to the fact that metals may be recycled for use in different products and the lag in terms of when material becomes available to build new turbines20.
3.3 PHOTOVOLTAIC TECHNOLOGY AND TRENDS Photovoltaic (PV) systems use a variety of cell technologies to convert sunlight into electricity. The cells consist of layers of semi-conducting materials. Light falling on the cells creates an electric field across the layers with the flow of electricity dependent on the intensity of the light.36
There are several different solar cell technologies currently on the market and/or under development and these are discussed below. Currently, solar crystalline silicon cell technology dominates the global market with a share of 92% in 2014. 24F
25
Cells are connected to form larger units called modules. Thin sheets of ethyl vinyl acetate (EVA) or polyvinyl butyral (PVB) are used to bind cells together and provide protection against the elements. The modules are normally enclosed between a transparent cover (usually glass) and a weatherproof backing sheet (typically made from a thin polymer). Modules can be framed for extra mechanical strength and durability. Thin film modules are usually encapsulated between two sheets of glass, so a frame is not needed. 25F
26
Crystalline silicon technology
Crystalline silicon cells are made from thin slices cut from a single crystal of silicon (mono crystalline), or from a block of silicon crystals (polycrystalline or multi crystalline). The latter is the most common, representing about 80 % of the market today. 26F
27
Thin film technology
Thin film modules are constructed by depositing extremely thin layers of photosensitive materials onto a substrate such as glass, stainless steel or flexible plastic. This technology opens up a range of new applications, e.g., for building integration as roof tiles. Four types of thin film modules are commercially available: amorphous silicon, cadmium telluride, copper indium/gallium di-selenide /di-sulphide and multi-junction cells.
Emerging cell technologies
Other emerging cell technologies (at the development or early commercial stage) are concentrated photovoltaic, consisting of cells built into concentrating collectors that use a lens to focus the concentrated sunlight onto the cells, organic or polymer solar cells. Owing to the limited market penetration these technologies are not considered in this project.
In addition to the modules, other system components include an inverter to transform direct current (DC) to alternate current (AC), batteries for stand-alone PV systems, and support structures to orient
25 Fraunhofer-ISE 2015; Photovoltaics Report, Fraunhofer Institute for Solar Energy Systems, ISE and PSE AG, 17 November 2015 Freiburg/Germany 26 EPIA 2011 27 Hoffmann and Teske 2012 – SolarGeneration VI – Global Solar PV Outlook, EPIA / Greenpeace International
JULY 2016
RENEWABLE ENERGY AND DEEP SEA MINING: SUPPLY, DEMAND AND SCENARIOS 18
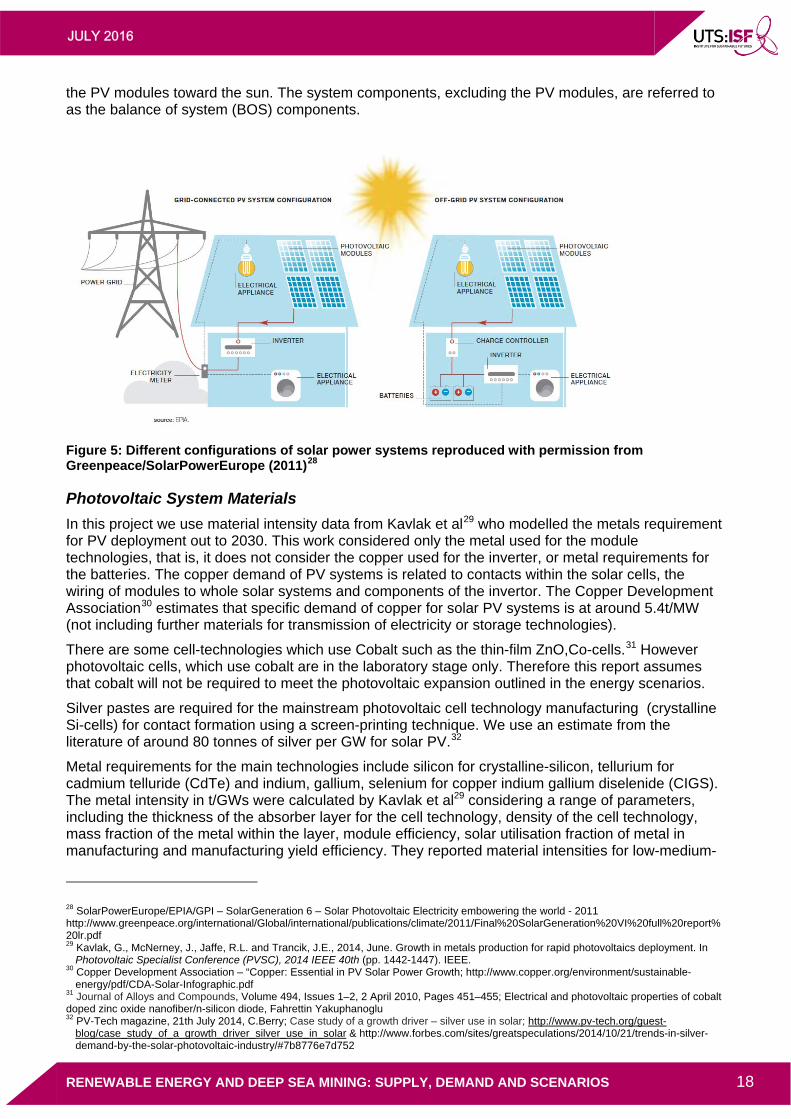
the PV modules toward the sun. The system components, excluding the PV modules, are referred to as the balance of system (BOS) components.
Figure 5: Different configurations of solar power systems reproduced with permission from Greenpeace/SolarPowerEurope (2011)27F
28
Photovoltaic System Materials
In this project we use material intensity data from Kavlak et al 28F
29 who modelled the metals requirement for PV deployment out to 2030. This work considered only the metal used for the module technologies, that is, it does not consider the copper used for the inverter, or metal requirements for the batteries. The copper demand of PV systems is related to contacts within the solar cells, the wiring of modules to whole solar systems and components of the invertor. The Copper Development Association29F
30 estimates that specific demand of copper for solar PV systems is at around 5.4t/MW (not including further materials for transmission of electricity or storage technologies).
There are some cell-technologies which use Cobalt such as the thin-film ZnO,Co-cells.30F
31 However photovoltaic cells, which use cobalt are in the laboratory stage only. Therefore this report assumes that cobalt will not be required to meet the photovoltaic expansion outlined in the energy scenarios.
Silver pastes are required for the mainstream photovoltaic cell technology manufacturing (crystalline Si-cells) for contact formation using a screen-printing technique. We use an estimate from the literature of around 80 tonnes of silver per GW for solar PV. 31F
32
Metal requirements for the main technologies include silicon for crystalline-silicon, tellurium for cadmium telluride (CdTe) and indium, gallium, selenium for copper indium gallium diselenide (CIGS). The metal intensity in t/GWs were calculated by Kavlak et al29 considering a range of parameters, including the thickness of the absorber layer for the cell technology, density of the cell technology, mass fraction of the metal within the layer, module efficiency, solar utilisation fraction of metal in manufacturing and manufacturing yield efficiency. They reported material intensities for low-medium-
28 SolarPowerEurope/EPIA/GPI – SolarGeneration 6 – Solar Photovoltaic Electricity embowering the world - 2011 http://www.greenpeace.org/international/Global/international/publications/climate/2011/Final%20SolarGeneration%20VI%20full%20report%20lr.pdf 29 Kavlak, G., McNerney, J., Jaffe, R.L. and Trancik, J.E., 2014, June. Growth in metals production for rapid photovoltaics deployment. In
Photovoltaic Specialist Conference (PVSC), 2014 IEEE 40th (pp. 1442-1447). IEEE. 30 Copper Development Association – “Copper: Essential in PV Solar Power Growth; http://www.copper.org/environment/sustainable-
energy/pdf/CDA-Solar-Infographic.pdf 31 Journal of Alloys and Compounds, Volume 494, Issues 1–2, 2 April 2010, Pages 451–455; Electrical and photovoltaic properties of cobalt doped zinc oxide nanofiber/n-silicon diode, Fahrettin Yakuphanoglu 32 PV-Tech magazine, 21th July 2014, C.Berry; Case study of a growth driver – silver use in solar; http://www.pv-tech.org/guest-
blog/case_study_of_a_growth_driver_silver_use_in_solar & http://www.forbes.com/sites/greatspeculations/2014/10/21/trends-in-silver-demand-by-the-solar-photovoltaic-industry/#7b8776e7d752
JULY 2016
RENEWABLE ENERGY AND DEEP SEA MINING: SUPPLY, DEMAND AND SCENARIOS 19
high scenarios in 2030 and to be conservative we have used the high material intensities from this work, that is assuming thicker cells, relatively low efficiencies and relatively high material losses in manufacturing (Table 11). We also assume material intensity to be static. Future work might consider energy and material efficiency improvements throughout the modelled time period.
Whilst Kavlak’s analysis does not explicitly assume which technologies might dominate the future market it does show that the supply of Te, In, Ga, Se would require unprecedented increases in production rates relative to historical rates even with modest uptakes of CdTe or CIGS technologies.
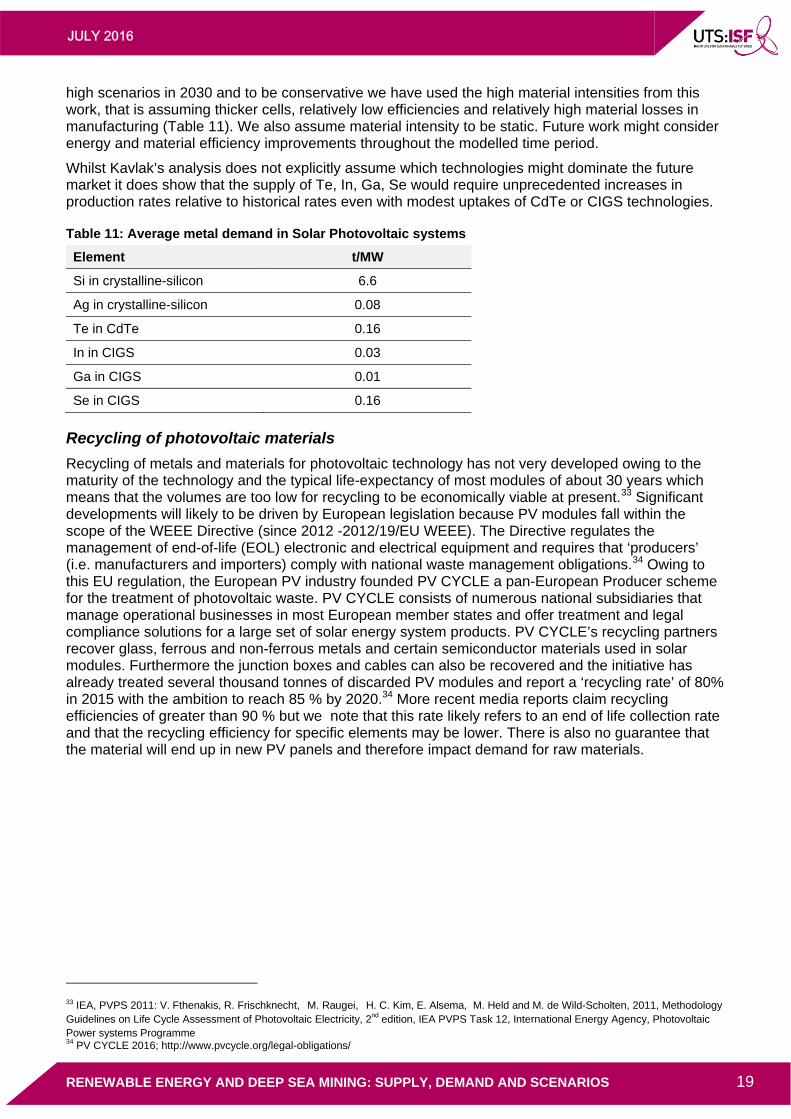
Table 11: Average metal demand in Solar Photovoltaic systems
Element t/MW
Si in crystalline-silicon 6.6
Ag in crystalline-silicon 0.08
Te in CdTe 0.16
In in CIGS 0.03
Ga in CIGS 0.01
Se in CIGS 0.16
Recycling of photovoltaic materials
Recycling of metals and materials for photovoltaic technology has not very developed owing to the maturity of the technology and the typical life-expectancy of most modules of about 30 years which means that the volumes are too low for recycling to be economically viable at present.32F
33 Significant developments will likely to be driven by European legislation because PV modules fall within the scope of the WEEE Directive (since 2012 -2012/19/EU WEEE). The Directive regulates the management of end-of-life (EOL) electronic and electrical equipment and requires that ‘producers’ (i.e. manufacturers and importers) comply with national waste management obligations. 33F
34 Owing to this EU regulation, the European PV industry founded PV CYCLE a pan-European Producer scheme for the treatment of photovoltaic waste. PV CYCLE consists of numerous national subsidiaries that manage operational businesses in most European member states and offer treatment and legal compliance solutions for a large set of solar energy system products. PV CYCLE’s recycling partners recover glass, ferrous and non-ferrous metals and certain semiconductor materials used in solar modules. Furthermore the junction boxes and cables can also be recovered and the initiative has already treated several thousand tonnes of discarded PV modules and report a ‘recycling rate’ of 80% in 2015 with the ambition to reach 85 % by 2020.34 More recent media reports claim recycling efficiencies of greater than 90 % but we note that this rate likely refers to an end of life collection rate and that the recycling efficiency for specific elements may be lower. There is also no guarantee that the material will end up in new PV panels and therefore impact demand for raw materials.
33 IEA, PVPS 2011: V. Fthenakis, R. Frischknecht, M. Raugei, H. C. Kim, E. Alsema, M. Held and M. de Wild-Scholten, 2011, Methodology Guidelines on Life Cycle Assessment of Photovoltaic Electricity, 2nd edition, IEA PVPS Task 12, International Energy Agency, Photovoltaic Power systems Programme 34 PV CYCLE 2016; http://www.pvcycle.org/legal-obligations/
JULY 2016
RENEWABLE ENERGY AND DEEP SEA MINING: SUPPLY, DEMAND AND SCENARIOS 20
3.4 CONCENTRATED SOLAR POWER (CSP) TECHNOLOGY AND TRENDS
Concentrating solar power (CSP) or Solar Thermal Electricity, produces heat using mirrors to concentrate the sun’s rays to a temperatures typically between 400–1000 oC. The heat can be used to generate electricity through integration with a heat engine, usually a steam turbine. There are a variety of mirror shapes, sun-tracking methods and methods of heat exchange for electricity generation. The capacity of solar thermal power plants in operation today ranges between several 1–400 MWs with potential for larger capacities. A unique characteristic of CSP is the relatively easy hybridisation new or existing plant and integration with thermal storage systems to deliver power on demand.
CSP has expanded rapidly in the last decade with 5 GW of solar thermal electricity projects operational worldwide as of the end of 2015 and about 1 GW of additional capacity under construction. According to a recent market analysis conducted by the European Solar Thermal Electricity Association (ESTELA) and Greenpeace 34F
35 CSP could meet up to 12 % of the world’s projected power needs in 2050, suggesting significant potential.
There are three different technology types described in brief below. A more comprehensive review is available in the literature, e.g., 35F
36. The main technologies are discussed below.
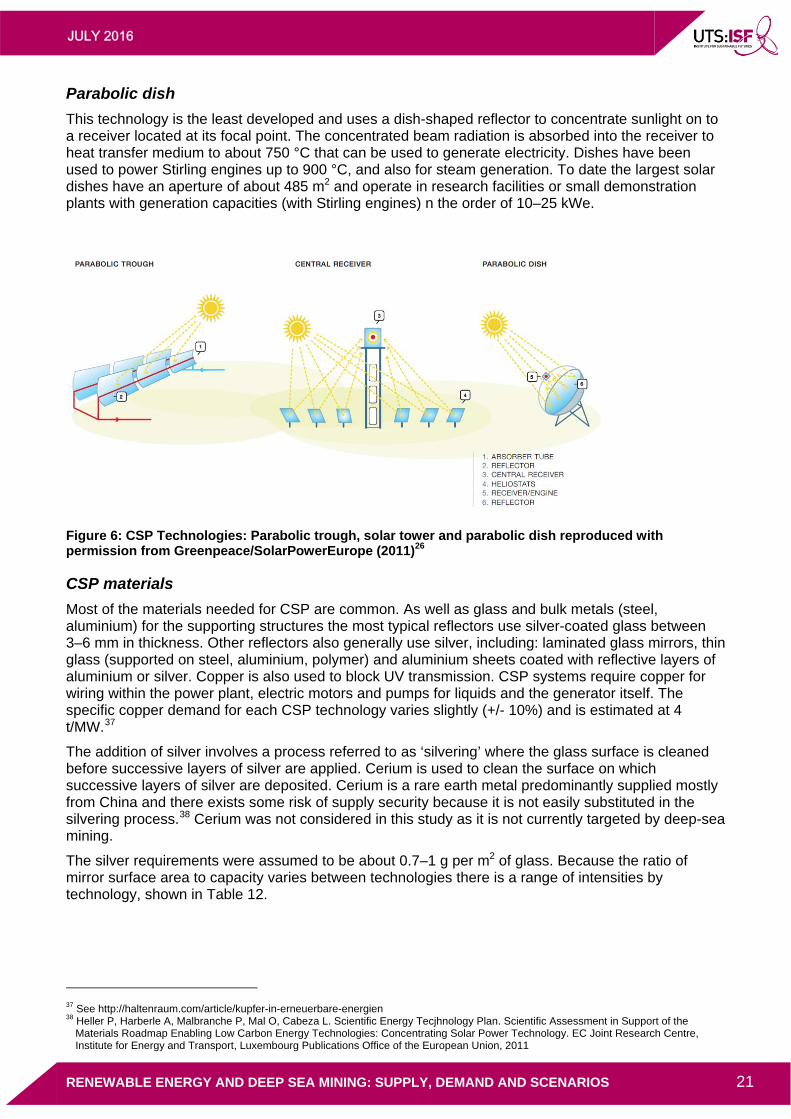
Parabolic trough
Parabolic trough plants use rows of parabolic trough collectors that reflect the solar radiation into an absorber tube. The troughs track the sun around a single axis, with the axis typically being oriented north south. Synthetic oil circulates through the absorber tubes, heating up to approximately 400°C and used to raise steam and generate electricity using a conventional steam turbine-generator system. Some of the plants under construction have been designed to store energy using molten salt technology.
Linear Fresnel systems
These systems use long lines of near flat Fresnel reflectors to form a field of horizontally mounted flat mirror strips that collectively, or individually, track the sun. The heat exchange and power generation equipment is similar to that described above. These systems are cheaper to install than trough systems but less efficient and there is only one plant currently in operation in Europe (Puerto Errado, 2 MW).
Central receiver or solar tower
Central receivers (or ‘power towers’) focus the light in a single point and are able to generate much higher temperatures than troughs and linear Fresnel reflectors. This technology uses a circular array of mirrors (heliostats) where each mirror tracks the sun, reflecting the light onto a fixed receiver on top of a tower. Temperatures > 1000 °C can be reached. A heat-transfer medium (e.g., water/steam, molten salts, sodium, air) is used to absorb the highly concentrated radiation and converts it into thermal energy that can be used to raise superheated steam for power operation using advanced generation technology, including combined cycle technology to achieve efficiencies greater than 60%.
The technology has been demonstrated up to 30 MW and technology developers suggest that grid-connected tower power plants could be built up to a capacity of 200 MWe. Although solar tower plants are considered to be further from commercialisation than parabolic trough systems, they have good longer-term prospects owing to the higher efficiencies and several projects are being developed in Spain, South Africa and Australia.
35 ESTELA-GPI 2016 36Teske et.al 2015, Energy [R]evolution – A sustainable World Energy Outlook 2015, September 2015, Chapter 10; Ottho Heldringstraat 5, 1066 AZ Amsterdam, The Netherlands.
JULY 2016
RENEWABLE ENERGY AND DEEP SEA MINING: SUPPLY, DEMAND AND SCENARIOS 21
Parabolic dish
This technology is the least developed and uses a dish-shaped reflector to concentrate sunlight on to a receiver located at its focal point. The concentrated beam radiation is absorbed into the receiver to heat transfer medium to about 750 °C that can be used to generate electricity. Dishes have been used to power Stirling engines up to 900 °C, and also for steam generation. To date the largest solar dishes have an aperture of about 485 m2 and operate in research facilities or small demonstration plants with generation capacities (with Stirling engines) n the order of 10–25 kWe.
Figure 6: CSP Technologies: Parabolic trough, solar tower and parabolic dish reproduced with permission from Greenpeace/SolarPowerEurope (2011)26
CSP materials
Most of the materials needed for CSP are common. As well as glass and bulk metals (steel, aluminium) for the supporting structures the most typical reflectors use silver-coated glass between 3–6 mm in thickness. Other reflectors also generally use silver, including: laminated glass mirrors, thin glass (supported on steel, aluminium, polymer) and aluminium sheets coated with reflective layers of aluminium or silver. Copper is also used to block UV transmission. CSP systems require copper for wiring within the power plant, electric motors and pumps for liquids and the generator itself. The specific copper demand for each CSP technology varies slightly (+/- 10%) and is estimated at 4 t/MW.36F
37
The addition of silver involves a process referred to as ‘silvering’ where the glass surface is cleaned before successive layers of silver are applied. Cerium is used to clean the surface on which successive layers of silver are deposited. Cerium is a rare earth metal predominantly supplied mostly from China and there exists some risk of supply security because it is not easily substituted in the silvering process.37F
38 Cerium was not considered in this study as it is not currently targeted by deep-sea mining.
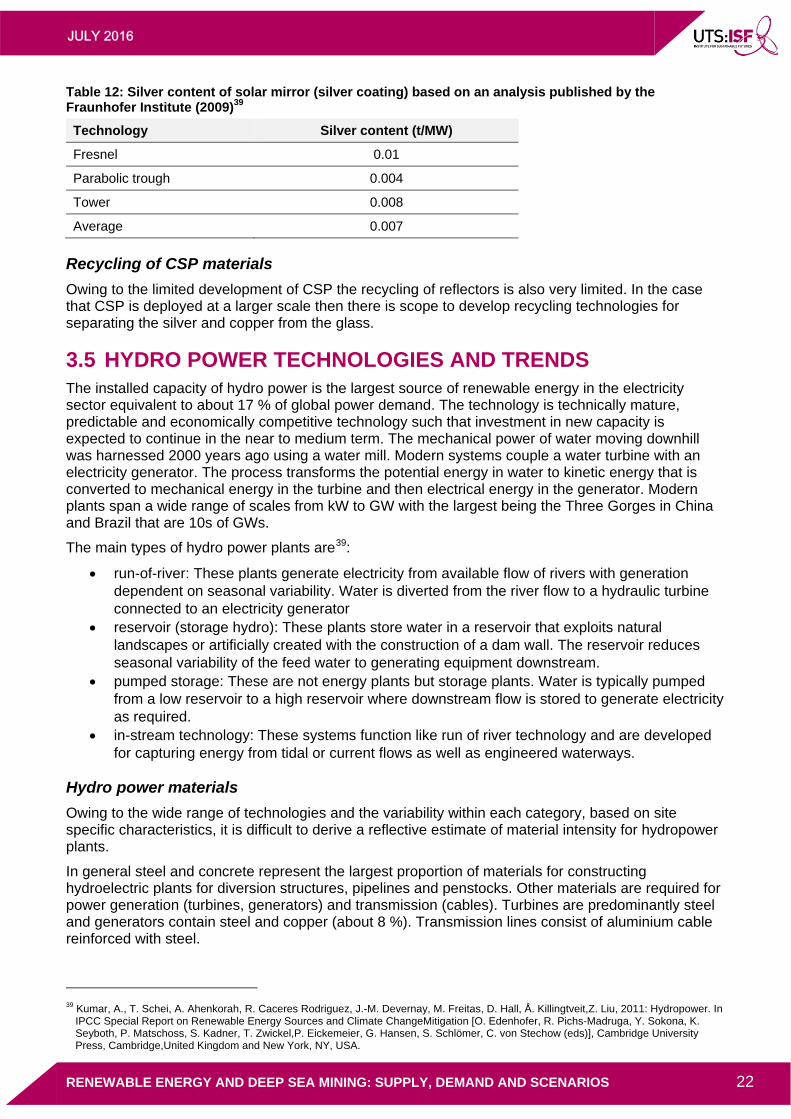
The silver requirements were assumed to be about 0.7–1 g per m2 of glass. Because the ratio of mirror surface area to capacity varies between technologies there is a range of intensities by technology, shown in Table 12.
37 See http://haltenraum.com/article/kupfer-in-erneuerbare-energien 38 Heller P, Harberle A, Malbranche P, Mal O, Cabeza L. Scientific Energy Tecjhnology Plan. Scientific Assessment in Support of the
Materials Roadmap Enabling Low Carbon Energy Technologies: Concentrating Solar Power Technology. EC Joint Research Centre, Institute for Energy and Transport, Luxembourg Publications Office of the European Union, 2011
JULY 2016
RENEWABLE ENERGY AND DEEP SEA MINING: SUPPLY, DEMAND AND SCENARIOS 22
Table 12: Silver content of solar mirror (silver coating) based on an analysis published by the Fraunhofer Institute (2009)39
Technology Silver content (t/MW)
Fresnel 0.01
Parabolic trough 0.004
Tower 0.008
Average 0.007
Recycling of CSP materials
Owing to the limited development of CSP the recycling of reflectors is also very limited. In the case that CSP is deployed at a larger scale then there is scope to develop recycling technologies for separating the silver and copper from the glass.
3.5 HYDRO POWER TECHNOLOGIES AND TRENDS The installed capacity of hydro power is the largest source of renewable energy in the electricity sector equivalent to about 17 % of global power demand. The technology is technically mature, predictable and economically competitive technology such that investment in new capacity is expected to continue in the near to medium term. The mechanical power of water moving downhill was harnessed 2000 years ago using a water mill. Modern systems couple a water turbine with an electricity generator. The process transforms the potential energy in water to kinetic energy that is converted to mechanical energy in the turbine and then electrical energy in the generator. Modern plants span a wide range of scales from kW to GW with the largest being the Three Gorges in China and Brazil that are 10s of GWs.
The main types of hydro power plants are 38F
39:
run-of-river: These plants generate electricity from available flow of rivers with generation dependent on seasonal variability. Water is diverted from the river flow to a hydraulic turbine connected to an electricity generator
reservoir (storage hydro): These plants store water in a reservoir that exploits natural landscapes or artificially created with the construction of a dam wall. The reservoir reduces seasonal variability of the feed water to generating equipment downstream.
pumped storage: These are not energy plants but storage plants. Water is typically pumped from a low reservoir to a high reservoir where downstream flow is stored to generate electricity as required.
in-stream technology: These systems function like run of river technology and are developed for capturing energy from tidal or current flows as well as engineered waterways.
Hydro power materials
Owing to the wide range of technologies and the variability within each category, based on site specific characteristics, it is difficult to derive a reflective estimate of material intensity for hydropower plants.
In general steel and concrete represent the largest proportion of materials for constructing hydroelectric plants for diversion structures, pipelines and penstocks. Other materials are required for power generation (turbines, generators) and transmission (cables). Turbines are predominantly steel and generators contain steel and copper (about 8 %). Transmission lines consist of aluminium cable reinforced with steel.
39 Kumar, A., T. Schei, A. Ahenkorah, R. Caceres Rodriguez, J.-M. Devernay, M. Freitas, D. Hall, Å. Killingtveit,Z. Liu, 2011: Hydropower. In
IPCC Special Report on Renewable Energy Sources and Climate ChangeMitigation [O. Edenhofer, R. Pichs-Madruga, Y. Sokona, K. Seyboth, P. Matschoss, S. Kadner, T. Zwickel,P. Eickemeier, G. Hansen, S. Schlömer, C. von Stechow (eds)], Cambridge University Press, Cambridge,United Kingdom and New York, NY, USA.
JULY 2016
RENEWABLE ENERGY AND DEEP SEA MINING: SUPPLY, DEMAND AND SCENARIOS 23
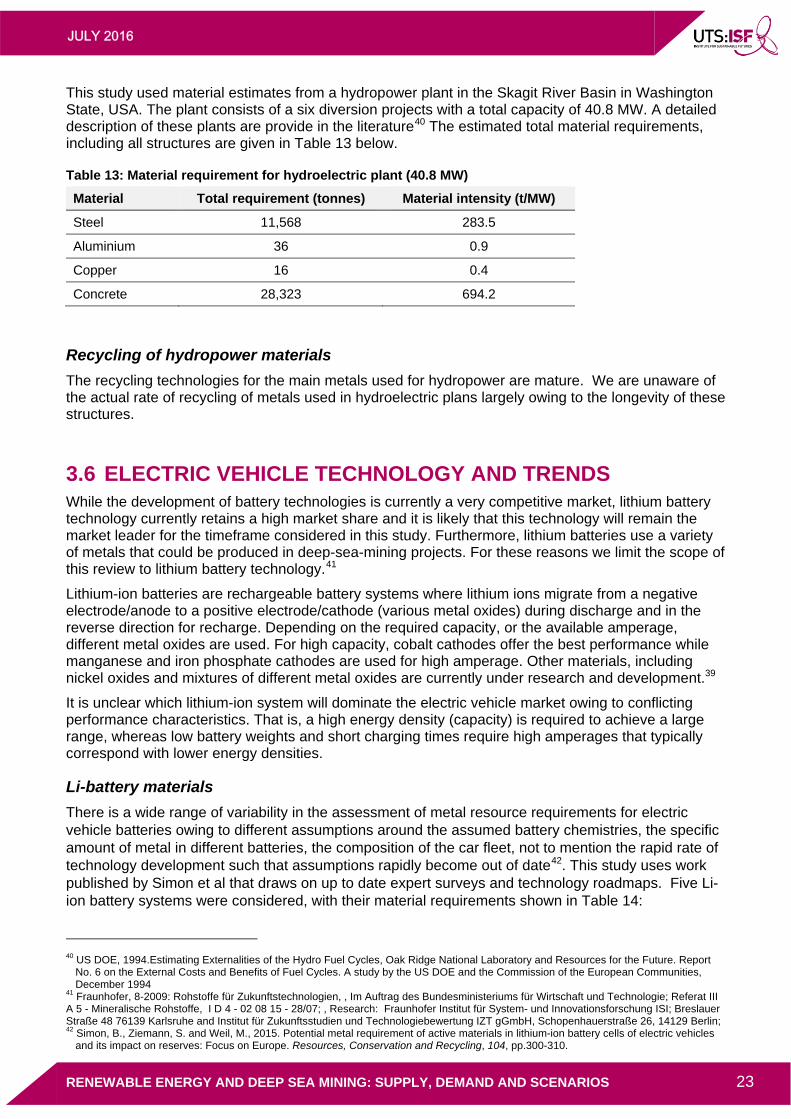
This study used material estimates from a hydropower plant in the Skagit River Basin in Washington State, USA. The plant consists of a six diversion projects with a total capacity of 40.8 MW. A detailed description of these plants are provide in the literature 39F
40 The estimated total material requirements, including all structures are given in Table 13 below.
Table 13: Material requirement for hydroelectric plant (40.8 MW)
Material Total requirement (tonnes) Material intensity (t/MW)
Steel 11,568 283.5
Aluminium 36 0.9
Copper 16 0.4
Concrete 28,323 694.2
Recycling of hydropower materials
The recycling technologies for the main metals used for hydropower are mature. We are unaware of the actual rate of recycling of metals used in hydroelectric plans largely owing to the longevity of these structures.
3.6 ELECTRIC VEHICLE TECHNOLOGY AND TRENDS While the development of battery technologies is currently a very competitive market, lithium battery technology currently retains a high market share and it is likely that this technology will remain the market leader for the timeframe considered in this study. Furthermore, lithium batteries use a variety of metals that could be produced in deep-sea-mining projects. For these reasons we limit the scope of this review to lithium battery technology. 40F
41
Lithium-ion batteries are rechargeable battery systems where lithium ions migrate from a negative electrode/anode to a positive electrode/cathode (various metal oxides) during discharge and in the reverse direction for recharge. Depending on the required capacity, or the available amperage, different metal oxides are used. For high capacity, cobalt cathodes offer the best performance while manganese and iron phosphate cathodes are used for high amperage. Other materials, including nickel oxides and mixtures of different metal oxides are currently under research and development.39
It is unclear which lithium-ion system will dominate the electric vehicle market owing to conflicting performance characteristics. That is, a high energy density (capacity) is required to achieve a large range, whereas low battery weights and short charging times require high amperages that typically correspond with lower energy densities.
Li-battery materials
There is a wide range of variability in the assessment of metal resource requirements for electric vehicle batteries owing to different assumptions around the assumed battery chemistries, the specific amount of metal in different batteries, the composition of the car fleet, not to mention the rapid rate of technology development such that assumptions rapidly become out of date 41F
42. This study uses work published by Simon et al that draws on up to date expert surveys and technology roadmaps. Five Li-ion battery systems were considered, with their material requirements shown in Table 14:
40 US DOE, 1994.Estimating Externalities of the Hydro Fuel Cycles, Oak Ridge National Laboratory and Resources for the Future. Report
No. 6 on the External Costs and Benefits of Fuel Cycles. A study by the US DOE and the Commission of the European Communities, December 1994
41 Fraunhofer, 8-2009: Rohstoffe für Zukunftstechnologien, , Im Auftrag des Bundesministeriums für Wirtschaft und Technologie; Referat III A 5 - Mineralische Rohstoffe, I D 4 - 02 08 15 - 28/07; , Research: Fraunhofer Institut für System- und Innovationsforschung ISI; Breslauer Straße 48 76139 Karlsruhe and Institut für Zukunftsstudien und Technologiebewertung IZT gGmbH, Schopenhauerstraße 26, 14129 Berlin; 42 Simon, B., Ziemann, S. and Weil, M., 2015. Potential metal requirement of active materials in lithium-ion battery cells of electric vehicles
and its impact on reserves: Focus on Europe. Resources, Conservation and Recycling, 104, pp.300-310.
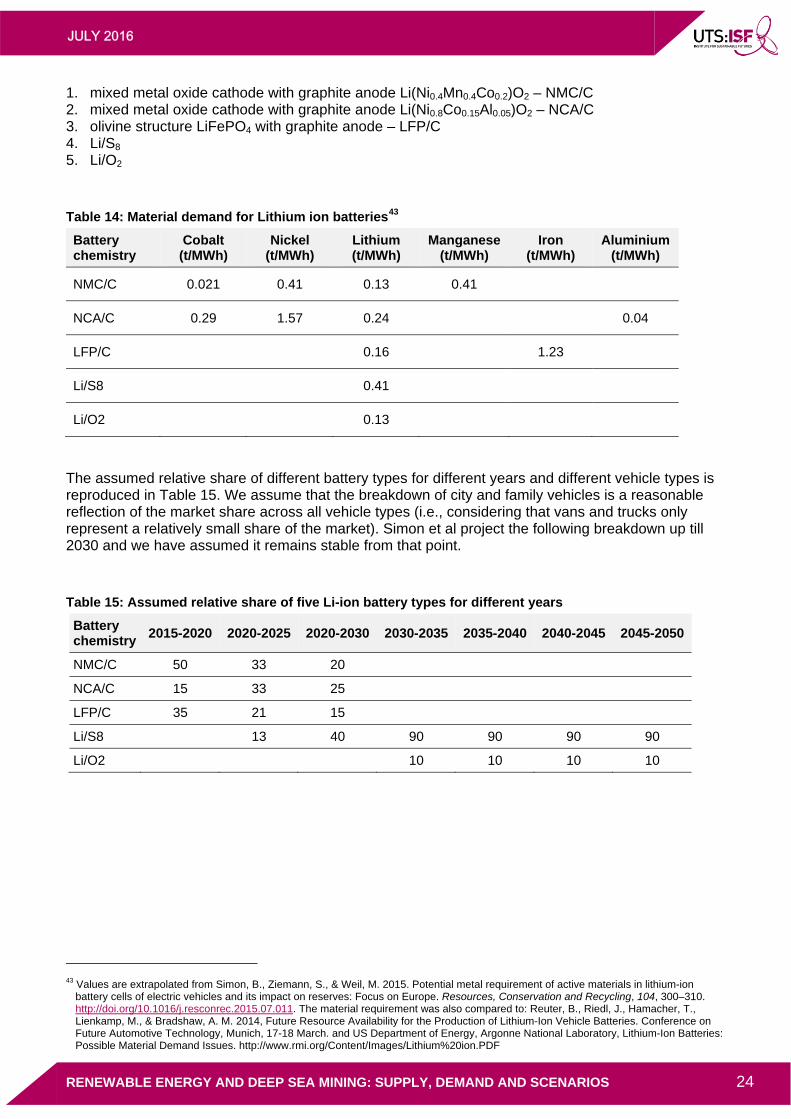
JULY 2016
RENEWABLE ENERGY AND DEEP SEA MINING: SUPPLY, DEMAND AND SCENARIOS 24
1. mixed metal oxide cathode with graphite anode Li(Ni0.4Mn0.4Co0.2)O2 – NMC/C 2. mixed metal oxide cathode with graphite anode Li(Ni0.8Co0.15Al0.05)O2 – NCA/C 3. olivine structure LiFePO4 with graphite anode – LFP/C 4. Li/S8 5. Li/O2
Table 14: Material demand for Lithium ion batteries42F
43
Battery chemistry
Cobalt (t/MWh)
Nickel (t/MWh)
Lithium (t/MWh)
Manganese (t/MWh)
Iron (t/MWh)
Aluminium (t/MWh)
NMC/C 0.021 0.41 0.13 0.41
NCA/C 0.29 1.57 0.24 0.04
LFP/C
0.16 1.23
Li/S8
0.41
Li/O2
0.13
The assumed relative share of different battery types for different years and different vehicle types is reproduced in Table 15. We assume that the breakdown of city and family vehicles is a reasonable reflection of the market share across all vehicle types (i.e., considering that vans and trucks only represent a relatively small share of the market). Simon et al project the following breakdown up till 2030 and we have assumed it remains stable from that point.
Table 15: Assumed relative share of five Li-ion battery types for different years
Battery chemistry
2015-2020 2020-2025 2020-2030 2030-2035 2035-2040 2040-2045 2045-2050
NMC/C 50 33 20
NCA/C 15 33 25
LFP/C 35 21 15
Li/S8 13 40 90 90 90 90
Li/O2 10 10 10 10
43 Values are extrapolated from Simon, B., Ziemann, S., & Weil, M. 2015. Potential metal requirement of active materials in lithium-ion
battery cells of electric vehicles and its impact on reserves: Focus on Europe. Resources, Conservation and Recycling, 104, 300–310. http://doi.org/10.1016/j.resconrec.2015.07.011. The material requirement was also compared to: Reuter, B., Riedl, J., Hamacher, T., Lienkamp, M., & Bradshaw, A. M. 2014, Future Resource Availability for the Production of Lithium-Ion Vehicle Batteries. Conference on Future Automotive Technology, Munich, 17-18 March. and US Department of Energy, Argonne National Laboratory, Lithium-Ion Batteries: Possible Material Demand Issues. http://www.rmi.org/Content/Images/Lithium%20ion.PDF
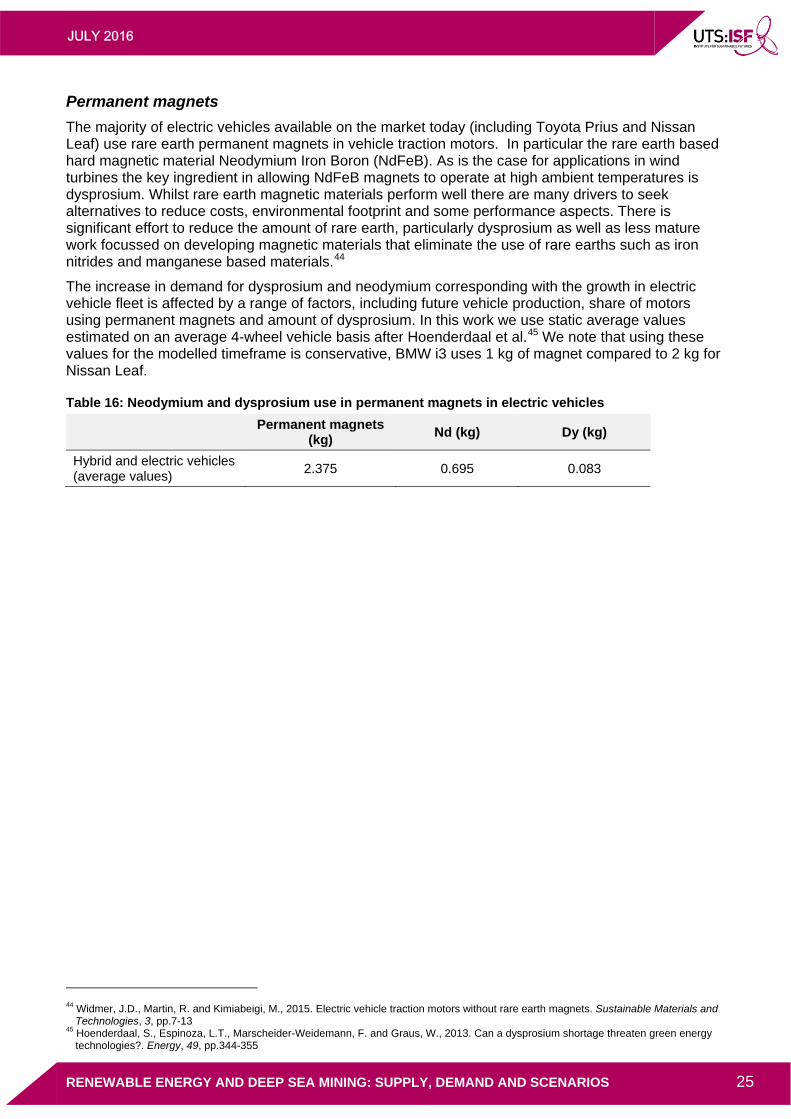
JULY 2016
RENEWABLE ENERGY AND DEEP SEA MINING: SUPPLY, DEMAND AND SCENARIOS 25
Permanent magnets
The majority of electric vehicles available on the market today (including Toyota Prius and Nissan Leaf) use rare earth permanent magnets in vehicle traction motors. In particular the rare earth based hard magnetic material Neodymium Iron Boron (NdFeB). As is the case for applications in wind turbines the key ingredient in allowing NdFeB magnets to operate at high ambient temperatures is dysprosium. Whilst rare earth magnetic materials perform well there are many drivers to seek alternatives to reduce costs, environmental footprint and some performance aspects. There is significant effort to reduce the amount of rare earth, particularly dysprosium as well as less mature work focussed on developing magnetic materials that eliminate the use of rare earths such as iron nitrides and manganese based materials.43F
44
The increase in demand for dysprosium and neodymium corresponding with the growth in electric vehicle fleet is affected by a range of factors, including future vehicle production, share of motors using permanent magnets and amount of dysprosium. In this work we use static average values estimated on an average 4-wheel vehicle basis after Hoenderdaal et al.44F
45 We note that using these values for the modelled timeframe is conservative, BMW i3 uses 1 kg of magnet compared to 2 kg for Nissan Leaf.
Table 16: Neodymium and dysprosium use in permanent magnets in electric vehicles
Permanent magnets
(kg) Nd (kg) Dy (kg)
Hybrid and electric vehicles (average values)
2.375 0.695 0.083
44 Widmer, J.D., Martin, R. and Kimiabeigi, M., 2015. Electric vehicle traction motors without rare earth magnets. Sustainable Materials and
Technologies, 3, pp.7-13 45 Hoenderdaal, S., Espinoza, L.T., Marscheider-Weidemann, F. and Graus, W., 2013. Can a dysprosium shortage threaten green energy
technologies?. Energy, 49, pp.344-355
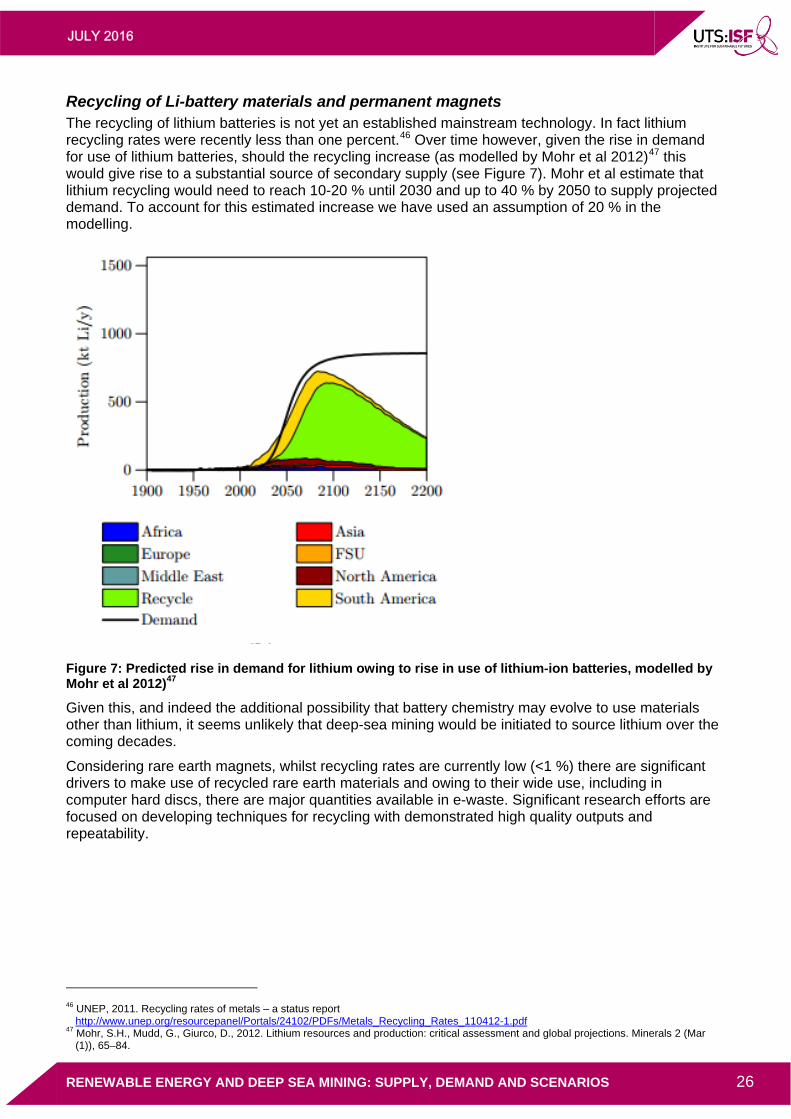
JULY 2016
RENEWABLE ENERGY AND DEEP SEA MINING: SUPPLY, DEMAND AND SCENARIOS 26
Recycling of Li-battery materials and permanent magnets The recycling of lithium batteries is not yet an established mainstream technology. In fact lithium recycling rates were recently less than one percent.45F
46 Over time however, given the rise in demand for use of lithium batteries, should the recycling increase (as modelled by Mohr et al 2012) 46F
47 this would give rise to a substantial source of secondary supply (see Figure 7). Mohr et al estimate that lithium recycling would need to reach 10-20 % until 2030 and up to 40 % by 2050 to supply projected demand. To account for this estimated increase we have used an assumption of 20 % in the modelling.
Figure 7: Predicted rise in demand for lithium owing to rise in use of lithium-ion batteries, modelled by Mohr et al 2012)47
Given this, and indeed the additional possibility that battery chemistry may evolve to use materials other than lithium, it seems unlikely that deep-sea mining would be initiated to source lithium over the coming decades.
Considering rare earth magnets, whilst recycling rates are currently low (<1 %) there are significant drivers to make use of recycled rare earth materials and owing to their wide use, including in computer hard discs, there are major quantities available in e-waste. Significant research efforts are focused on developing techniques for recycling with demonstrated high quality outputs and repeatability.
46 UNEP, 2011. Recycling rates of metals – a status report
http://www.unep.org/resourcepanel/Portals/24102/PDFs/Metals_Recycling_Rates_110412-1.pdf 47 Mohr, S.H., Mudd, G., Giurco, D., 2012. Lithium resources and production: critical assessment and global projections. Minerals 2 (Mar
(1)), 65–84.
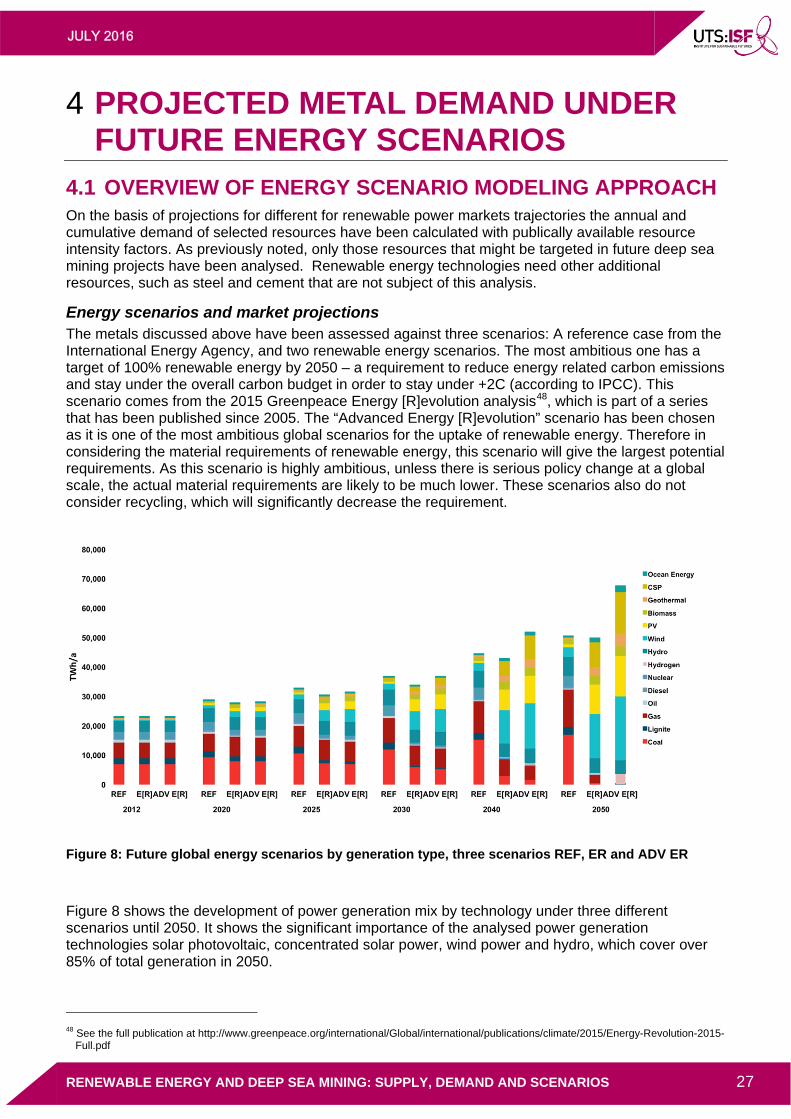
JULY 2016
RENEWABLE ENERGY AND DEEP SEA MINING: SUPPLY, DEMAND AND SCENARIOS 27
4 PROJECTED METAL DEMAND UNDER FUTURE ENERGY SCENARIOS
4.1 OVERVIEW OF ENERGY SCENARIO MODELING APPROACH On the basis of projections for different for renewable power markets trajectories the annual and cumulative demand of selected resources have been calculated with publically available resource intensity factors. As previously noted, only those resources that might be targeted in future deep sea mining projects have been analysed. Renewable energy technologies need other additional resources, such as steel and cement that are not subject of this analysis.
Energy scenarios and market projections The metals discussed above have been assessed against three scenarios: A reference case from the International Energy Agency, and two renewable energy scenarios. The most ambitious one has a target of 100% renewable energy by 2050 – a requirement to reduce energy related carbon emissions and stay under the overall carbon budget in order to stay under +2C (according to IPCC). This scenario comes from the 2015 Greenpeace Energy [R]evolution analysis47F
48, which is part of a series that has been published since 2005. The “Advanced Energy [R]evolution” scenario has been chosen as it is one of the most ambitious global scenarios for the uptake of renewable energy. Therefore in considering the material requirements of renewable energy, this scenario will give the largest potential requirements. As this scenario is highly ambitious, unless there is serious policy change at a global scale, the actual material requirements are likely to be much lower. These scenarios also do not consider recycling, which will significantly decrease the requirement.
Figure 8: Future global energy scenarios by generation type, three scenarios REF, ER and ADV ER
Figure 8 shows the development of power generation mix by technology under three different scenarios until 2050. It shows the significant importance of the analysed power generation technologies solar photovoltaic, concentrated solar power, wind power and hydro, which cover over 85% of total generation in 2050.
48 See the full publication at http://www.greenpeace.org/international/Global/international/publications/climate/2015/Energy-Revolution-2015-
Full.pdf
JULY 2016
RENEWABLE ENERGY AND DEEP SEA MINING: SUPPLY, DEMAND AND SCENARIOS 28
Scenario Definitions
The Reference scenario (REF) is based on the Current Policies scenarios published by the International Energy Agency (IEA) in World Energy Outlook 2014 (WEO 2014)48F
49. It only takes into account existing international energy and environmental policies. Its assumptions include, for example, continuing progress in electricity and gas market reforms, the liberalisation of cross-border energy trade and recent policies designed to combat environmental pollution. The Reference scenario does not include additional policies to reduce greenhouse gas emissions. As the IEA’s projections only extend to 2040, extrapolating their key macroeconomic and energy indicators forward to 2050 extends them and provides a baseline for comparison with Energy [R]evolution scenarios.
The Energy [R]evolution scenario (ER) has the key target to reduce worldwide carbon dioxide emissions from energy use down to a level of around 4 giga-tonnes per year by 2050 in order to hold the increase in global temperature under +2°C. A second objective is the global phasing out of nuclear energy. The general framework parameters for population and GDP growth remain unchanged from the Reference Scenario.
The new Advanced Energy [R]evolution scenario (ADV ER) assumes much stronger efforts to transform the energy systems of all world regions towards a 100% renewable energy supply. The consumption pathways remain basically the same as in the ER; however, a much faster introduction of new technologies leads to a complete decarbonisation of the power, heat and especially the transportation sector. The latter requires a strong role of hydrogen and other synthetic fuels complementary to battery electric vehicle concepts and (limited) biofuels. Due to higher efficiencies of new vehicle concepts and the assumption of much higher modal split changes compared to the basic ER resulting final energy demand for transportation is lower. However, this scenario requires more fundamental changes of mobility patterns, behaviour, and infrastructural needs to compensate for the high energy losses associated to the production of synthetic fuels based on renewable electricity. Also in the heating sector, electricity and hydrogen play a larger role substituting remaining fossil fuels. In the power sector, natural gas is replaced by hydrogen as well. Therefore, electricity generation increases significantly in this scenario, assuming power from renewable energy sources to be the main “primary energy” of the future.
49 International Energy Agency, ‘World Energy Outlook 2014’, 2014
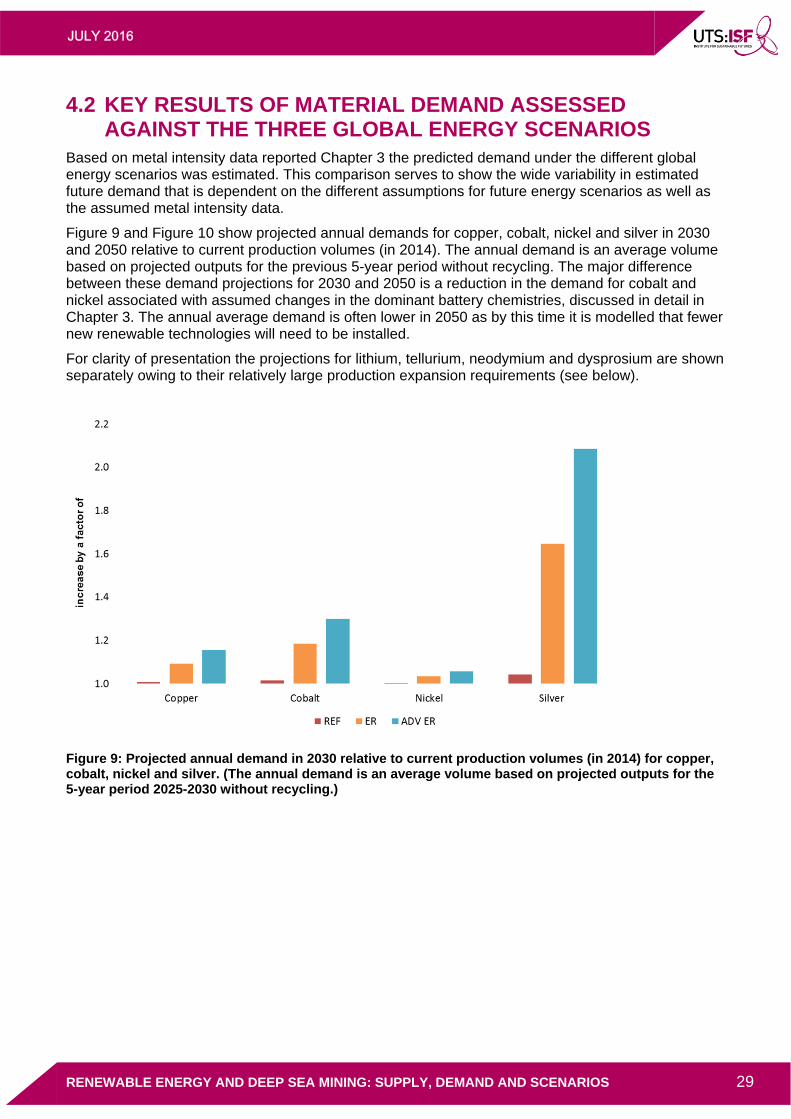
JULY 2016
RENEWABLE ENERGY AND DEEP SEA MINING: SUPPLY, DEMAND AND SCENARIOS 29
4.2 KEY RESULTS OF MATERIAL DEMAND ASSESSED AGAINST THE THREE GLOBAL ENERGY SCENARIOS
Based on metal intensity data reported Chapter 3 the predicted demand under the different global energy scenarios was estimated. This comparison serves to show the wide variability in estimated future demand that is dependent on the different assumptions for future energy scenarios as well as the assumed metal intensity data.
Figure 9 and Figure 10 show projected annual demands for copper, cobalt, nickel and silver in 2030 and 2050 relative to current production volumes (in 2014). The annual demand is an average volume based on projected outputs for the previous 5-year period without recycling. The major difference between these demand projections for 2030 and 2050 is a reduction in the demand for cobalt and nickel associated with assumed changes in the dominant battery chemistries, discussed in detail in Chapter 3. The annual average demand is often lower in 2050 as by this time it is modelled that fewer new renewable technologies will need to be installed.
For clarity of presentation the projections for lithium, tellurium, neodymium and dysprosium are shown separately owing to their relatively large production expansion requirements (see below).
Figure 9: Projected annual demand in 2030 relative to current production volumes (in 2014) for copper, cobalt, nickel and silver. (The annual demand is an average volume based on projected outputs for the 5-year period 2025-2030 without recycling.)
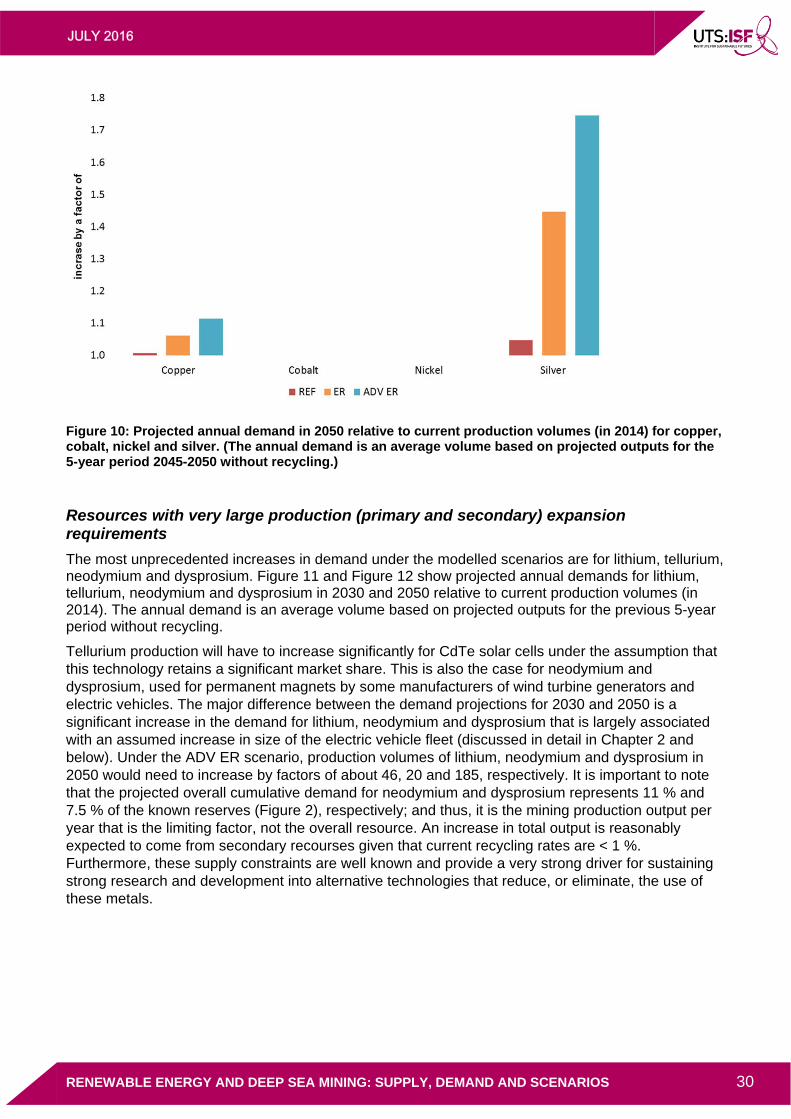
JULY 2016
RENEWABLE ENERGY AND DEEP SEA MINING: SUPPLY, DEMAND AND SCENARIOS 30
Figure 10: Projected annual demand in 2050 relative to current production volumes (in 2014) for copper, cobalt, nickel and silver. (The annual demand is an average volume based on projected outputs for the 5-year period 2045-2050 without recycling.)
Resources with very large production (primary and secondary) expansion requirements
The most unprecedented increases in demand under the modelled scenarios are for lithium, tellurium, neodymium and dysprosium. Figure 11 and Figure 12 show projected annual demands for lithium, tellurium, neodymium and dysprosium in 2030 and 2050 relative to current production volumes (in 2014). The annual demand is an average volume based on projected outputs for the previous 5-year period without recycling.
Tellurium production will have to increase significantly for CdTe solar cells under the assumption that this technology retains a significant market share. This is also the case for neodymium and dysprosium, used for permanent magnets by some manufacturers of wind turbine generators and electric vehicles. The major difference between the demand projections for 2030 and 2050 is a significant increase in the demand for lithium, neodymium and dysprosium that is largely associated with an assumed increase in size of the electric vehicle fleet (discussed in detail in Chapter 2 and below). Under the ADV ER scenario, production volumes of lithium, neodymium and dysprosium in 2050 would need to increase by factors of about 46, 20 and 185, respectively. It is important to note that the projected overall cumulative demand for neodymium and dysprosium represents 11 % and 7.5 % of the known reserves (Figure 2), respectively; and thus, it is the mining production output per year that is the limiting factor, not the overall resource. An increase in total output is reasonably expected to come from secondary recourses given that current recycling rates are < 1 %. Furthermore, these supply constraints are well known and provide a very strong driver for sustaining strong research and development into alternative technologies that reduce, or eliminate, the use of these metals.
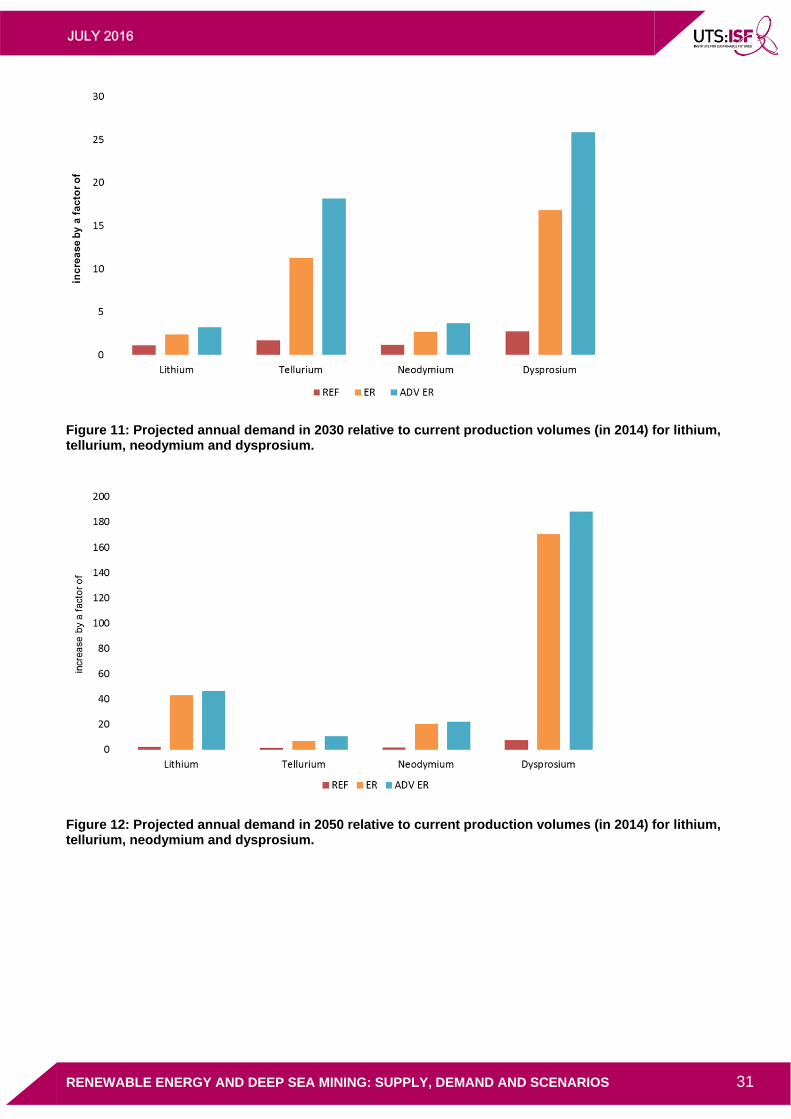
JULY 2016
RENEWABLE ENERGY AND DEEP SEA MINING: SUPPLY, DEMAND AND SCENARIOS 31
Figure 11: Projected annual demand in 2030 relative to current production volumes (in 2014) for lithium, tellurium, neodymium and dysprosium.
Figure 12: Projected annual demand in 2050 relative to current production volumes (in 2014) for lithium, tellurium, neodymium and dysprosium.
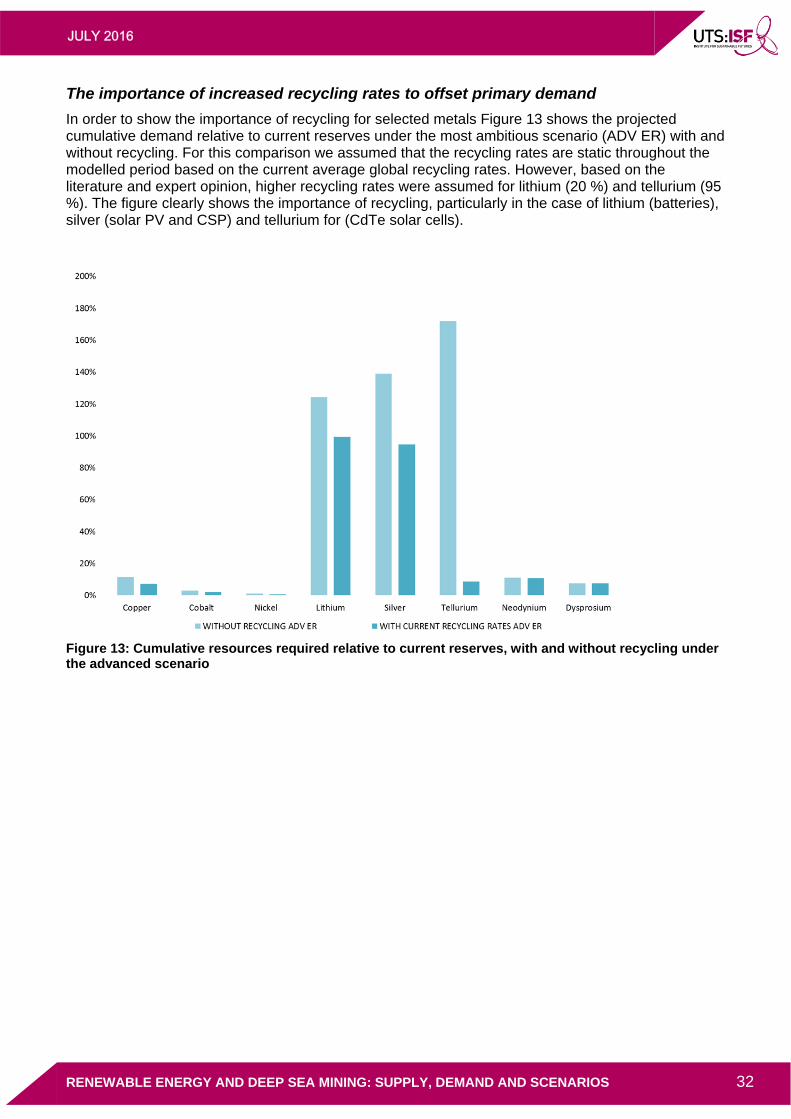
JULY 2016
RENEWABLE ENERGY AND DEEP SEA MINING: SUPPLY, DEMAND AND SCENARIOS 32
The importance of increased recycling rates to offset primary demand
In order to show the importance of recycling for selected metals Figure 13 shows the projected cumulative demand relative to current reserves under the most ambitious scenario (ADV ER) with and without recycling. For this comparison we assumed that the recycling rates are static throughout the modelled period based on the current average global recycling rates. However, based on the literature and expert opinion, higher recycling rates were assumed for lithium (20 %) and tellurium (95 %). The figure clearly shows the importance of recycling, particularly in the case of lithium (batteries), silver (solar PV and CSP) and tellurium for (CdTe solar cells).
Figure 13: Cumulative resources required relative to current reserves, with and without recycling under the advanced scenario
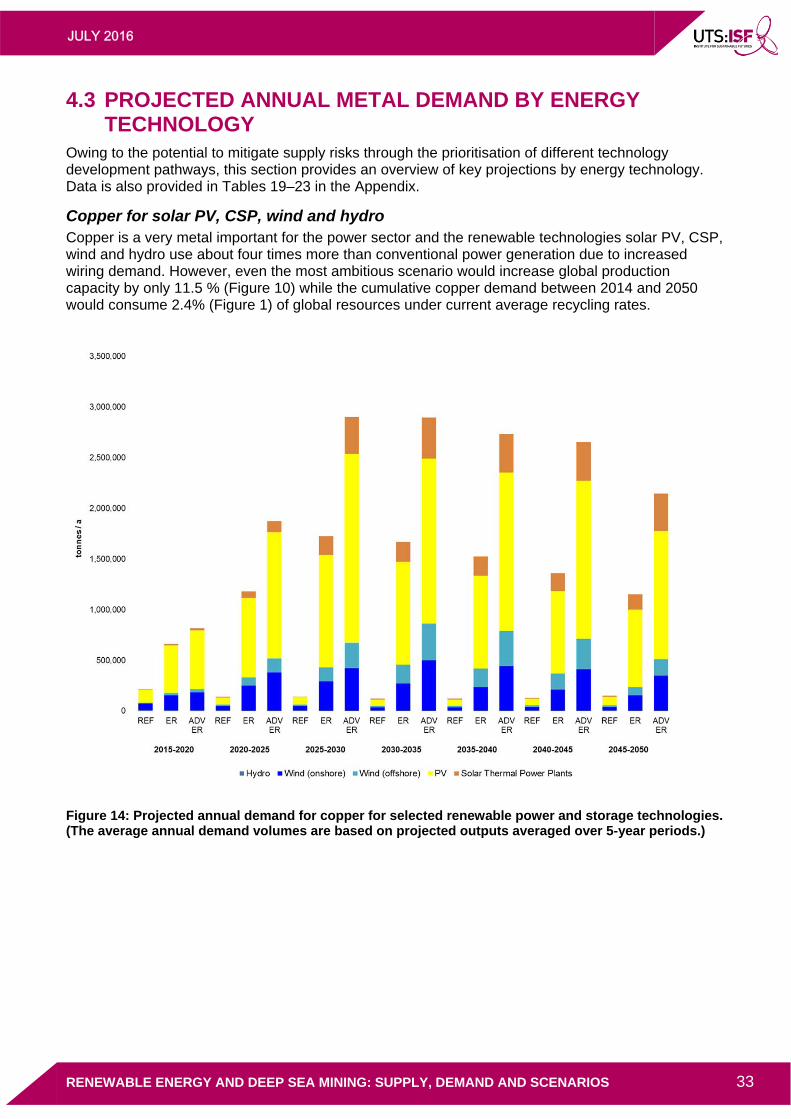
JULY 2016
RENEWABLE ENERGY AND DEEP SEA MINING: SUPPLY, DEMAND AND SCENARIOS 33
4.3 PROJECTED ANNUAL METAL DEMAND BY ENERGY TECHNOLOGY
Owing to the potential to mitigate supply risks through the prioritisation of different technology development pathways, this section provides an overview of key projections by energy technology. Data is also provided in Tables 19–23 in the Appendix.
Copper for solar PV, CSP, wind and hydro Copper is a very metal important for the power sector and the renewable technologies solar PV, CSP, wind and hydro use about four times more than conventional power generation due to increased wiring demand. However, even the most ambitious scenario would increase global production capacity by only 11.5 % (Figure 10) while the cumulative copper demand between 2014 and 2050 would consume 2.4% (Figure 1) of global resources under current average recycling rates.
Figure 14: Projected annual demand for copper for selected renewable power and storage technologies. (The average annual demand volumes are based on projected outputs averaged over 5-year periods.)
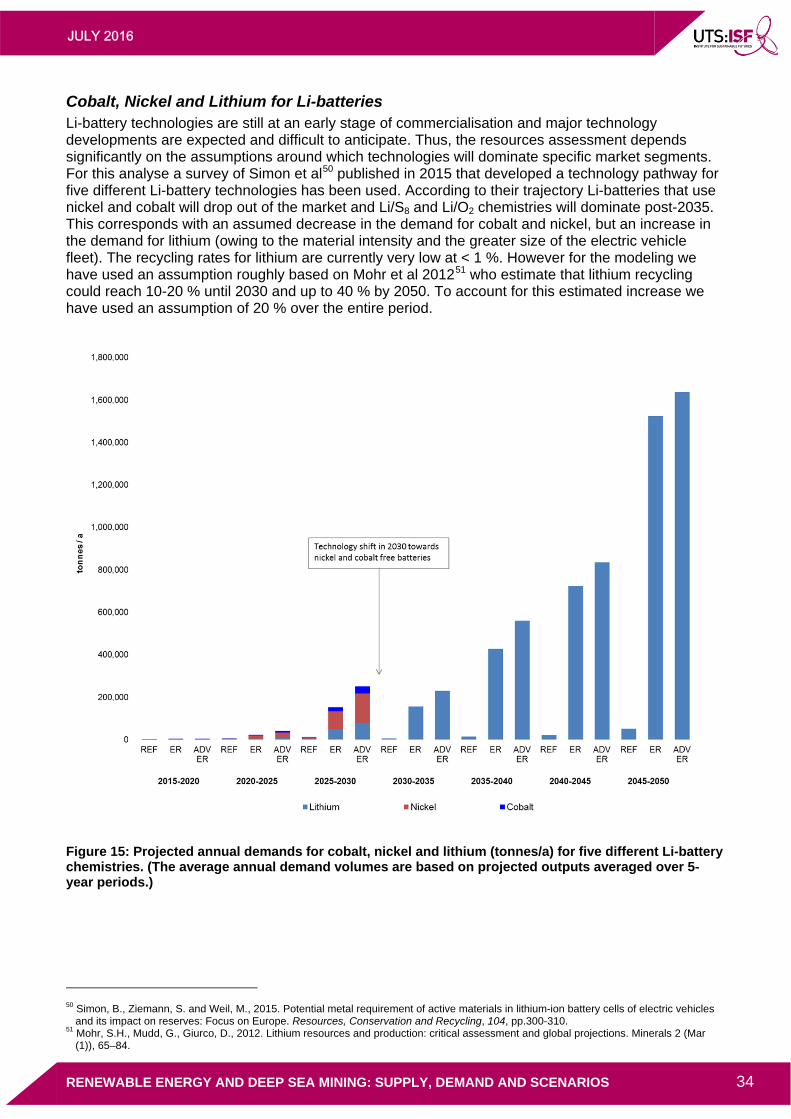
JULY 2016
RENEWABLE ENERGY AND DEEP SEA MINING: SUPPLY, DEMAND AND SCENARIOS 34
Cobalt, Nickel and Lithium for Li-batteries Li-battery technologies are still at an early stage of commercialisation and major technology developments are expected and difficult to anticipate. Thus, the resources assessment depends significantly on the assumptions around which technologies will dominate specific market segments. For this analyse a survey of Simon et al49F
50 published in 2015 that developed a technology pathway for five different Li-battery technologies has been used. According to their trajectory Li-batteries that use nickel and cobalt will drop out of the market and Li/S8 and Li/O2 chemistries will dominate post-2035. This corresponds with an assumed decrease in the demand for cobalt and nickel, but an increase in the demand for lithium (owing to the material intensity and the greater size of the electric vehicle fleet). The recycling rates for lithium are currently very low at < 1 %. However for the modeling we have used an assumption roughly based on Mohr et al 2012 50F
51 who estimate that lithium recycling could reach 10-20 % until 2030 and up to 40 % by 2050. To account for this estimated increase we have used an assumption of 20 % over the entire period.
Figure 15: Projected annual demands for cobalt, nickel and lithium (tonnes/a) for five different Li-battery chemistries. (The average annual demand volumes are based on projected outputs averaged over 5-year periods.)
50 Simon, B., Ziemann, S. and Weil, M., 2015. Potential metal requirement of active materials in lithium-ion battery cells of electric vehicles
and its impact on reserves: Focus on Europe. Resources, Conservation and Recycling, 104, pp.300-310. 51 Mohr, S.H., Mudd, G., Giurco, D., 2012. Lithium resources and production: critical assessment and global projections. Minerals 2 (Mar
(1)), 65–84.
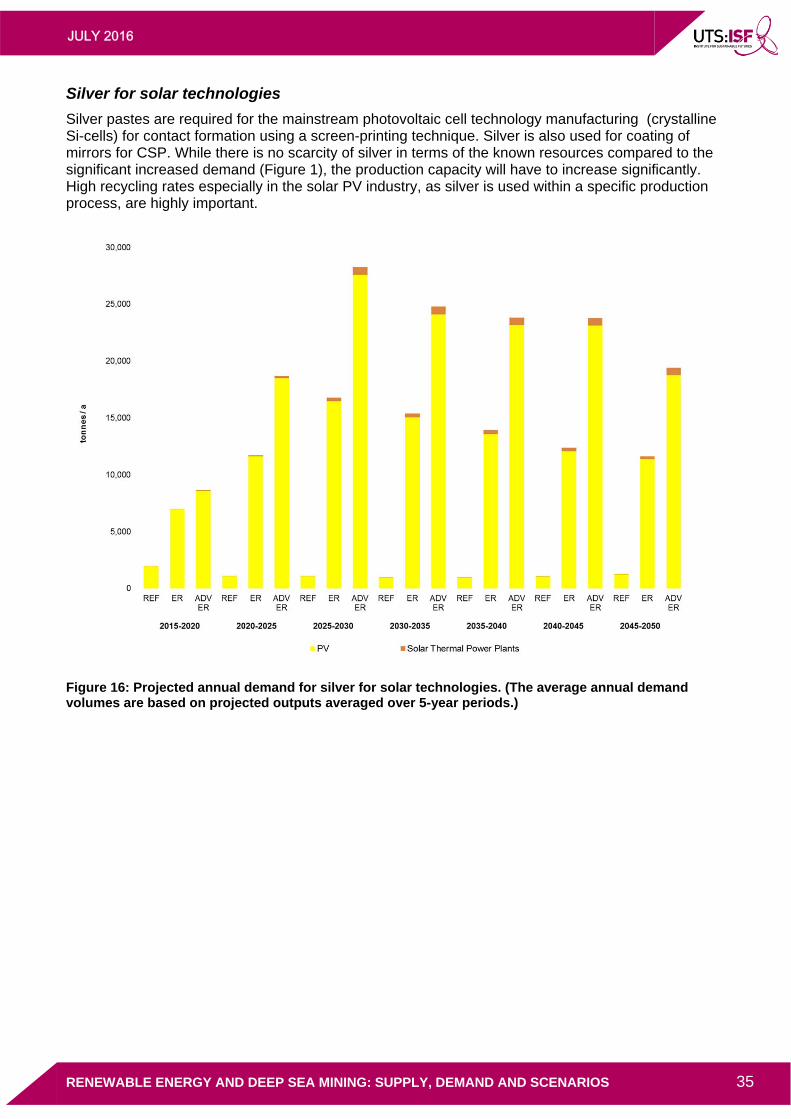
JULY 2016
RENEWABLE ENERGY AND DEEP SEA MINING: SUPPLY, DEMAND AND SCENARIOS 35
Silver for solar technologies
Silver pastes are required for the mainstream photovoltaic cell technology manufacturing (crystalline Si-cells) for contact formation using a screen-printing technique. Silver is also used for coating of mirrors for CSP. While there is no scarcity of silver in terms of the known resources compared to the significant increased demand (Figure 1), the production capacity will have to increase significantly. High recycling rates especially in the solar PV industry, as silver is used within a specific production process, are highly important.
Figure 16: Projected annual demand for silver for solar technologies. (The average annual demand volumes are based on projected outputs averaged over 5-year periods.)
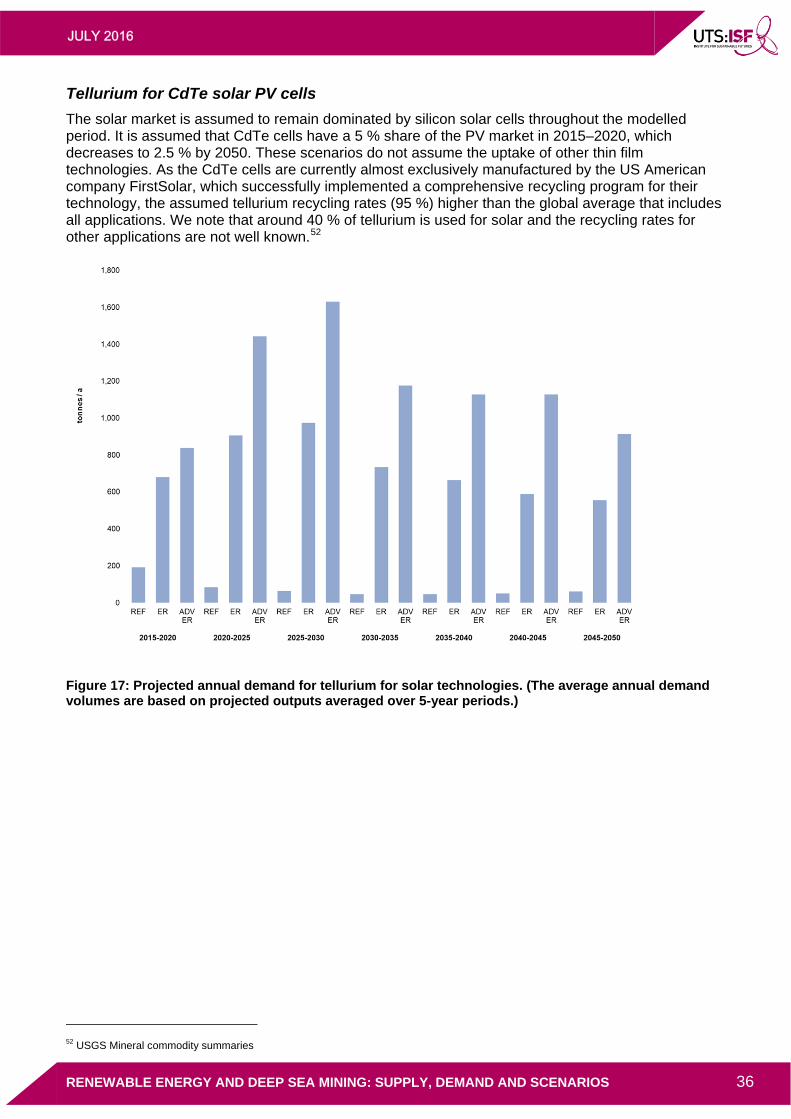
JULY 2016
RENEWABLE ENERGY AND DEEP SEA MINING: SUPPLY, DEMAND AND SCENARIOS 36
Tellurium for CdTe solar PV cells
The solar market is assumed to remain dominated by silicon solar cells throughout the modelled period. It is assumed that CdTe cells have a 5 % share of the PV market in 2015–2020, which decreases to 2.5 % by 2050. These scenarios do not assume the uptake of other thin film technologies. As the CdTe cells are currently almost exclusively manufactured by the US American company FirstSolar, which successfully implemented a comprehensive recycling program for their technology, the assumed tellurium recycling rates (95 %) higher than the global average that includes all applications. We note that around 40 % of tellurium is used for solar and the recycling rates for other applications are not well known. 51F
52
Figure 17: Projected annual demand for tellurium for solar technologies. (The average annual demand volumes are based on projected outputs averaged over 5-year periods.)
52 USGS Mineral commodity summaries
JULY 2016
RENEWABLE ENERGY AND DEEP SEA MINING: SUPPLY, DEMAND AND SCENARIOS 37
5 CONCLUSIONS A transition towards a 100% renewable energy supply can take place without deep-sea mining. Metal demand associated with the dominant renewable technologies evaluated in this report, even assuming very aggressive growth rates under the most ambitious future energy scenarios, do not require deep-sea mining activity. This is combined with the potential to increase recycling rates and sustained research and development into alternative technologies that reduce, or eliminate, the use of supply-constrained metals. The significant increase in production demands for neodymium and dysprosium, and the projected volumes of lithium and silver relative to current reserves suggests these metals require special attention. Increasing recycling rates is a very important part of the solution to securing the supply of metals for renewable power generation technologies and electric vehicle components. That said, estimating how recycling rates may change within the timeframe considered is not straightforward. Future recycling efficiencies will ultimately be impacted by technology design, including ‘design for recycling’, and future investment in efficient collection and sorting systems. Furthermore, the metals and materials used in today’s technologies may be very different to those used even in the next 10-15 years. Owing to these complexities further work is recommended to better understand the potential for recycling to offset primary production. To achieve a truly sustainable energy system, both in terms of emission mitigation and responsible supply of resources, we need to focus on improving material productivity in parallel to the renewable energy market expansion.
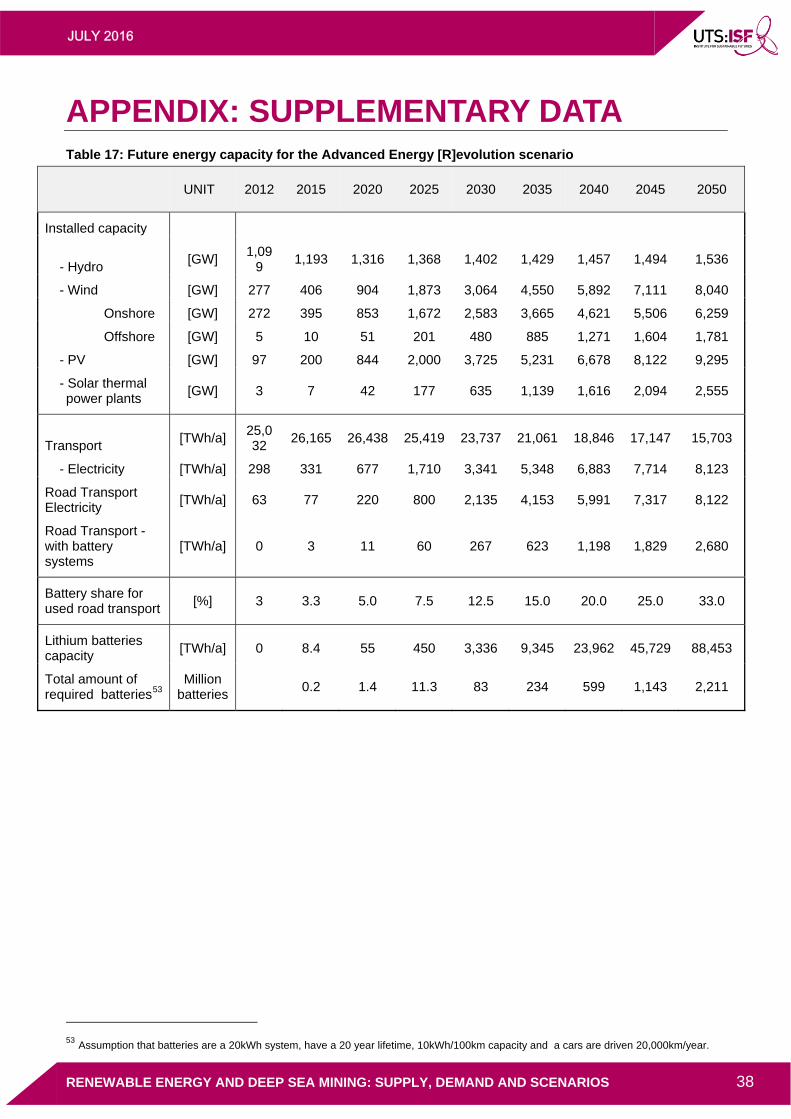
JULY 2016
RENEWABLE ENERGY AND DEEP SEA MINING: SUPPLY, DEMAND AND SCENARIOS 38
APPENDIX: SUPPLEMENTARY DATA Table 17: Future energy capacity for the Advanced Energy [R]evolution scenario
UNIT 2012 2015 2020 2025 2030 2035 2040 2045 2050
Installed capacity
- Hydro [GW]
1,099
1,193 1,316 1,368 1,402 1,429 1,457 1,494 1,536
- Wind [GW] 277 406 904 1,873 3,064 4,550 5,892 7,111 8,040
Onshore [GW] 272 395 853 1,672 2,583 3,665 4,621 5,506 6,259
Offshore [GW] 5 10 51 201 480 885 1,271 1,604 1,781
- PV [GW] 97 200 844 2,000 3,725 5,231 6,678 8,122 9,295
- Solar thermal power plants
[GW] 3 7 42 177 635 1,139 1,616 2,094 2,555
Transport [TWh/a]
25,032
26,165 26,438 25,419 23,737 21,061 18,846 17,147 15,703
- Electricity [TWh/a] 298 331 677 1,710 3,341 5,348 6,883 7,714 8,123
Road Transport Electricity
[TWh/a] 63 77 220 800 2,135 4,153 5,991 7,317 8,122
Road Transport - with battery systems
[TWh/a] 0 3 11 60 267 623 1,198 1,829 2,680
Battery share for used road transport
[%] 3 3.3 5.0 7.5 12.5 15.0 20.0 25.0 33.0
Lithium batteries capacity
[TWh/a] 0 8.4 55 450 3,336 9,345 23,962 45,729 88,453
Total amount of required batteries52F
53 Million
batteries
0.2 1.4 11.3 83 234 599 1,143 2,211
53 Assumption that batteries are a 20kWh system, have a 20 year lifetime, 10kWh/100km capacity and a cars are driven 20,000km/year.
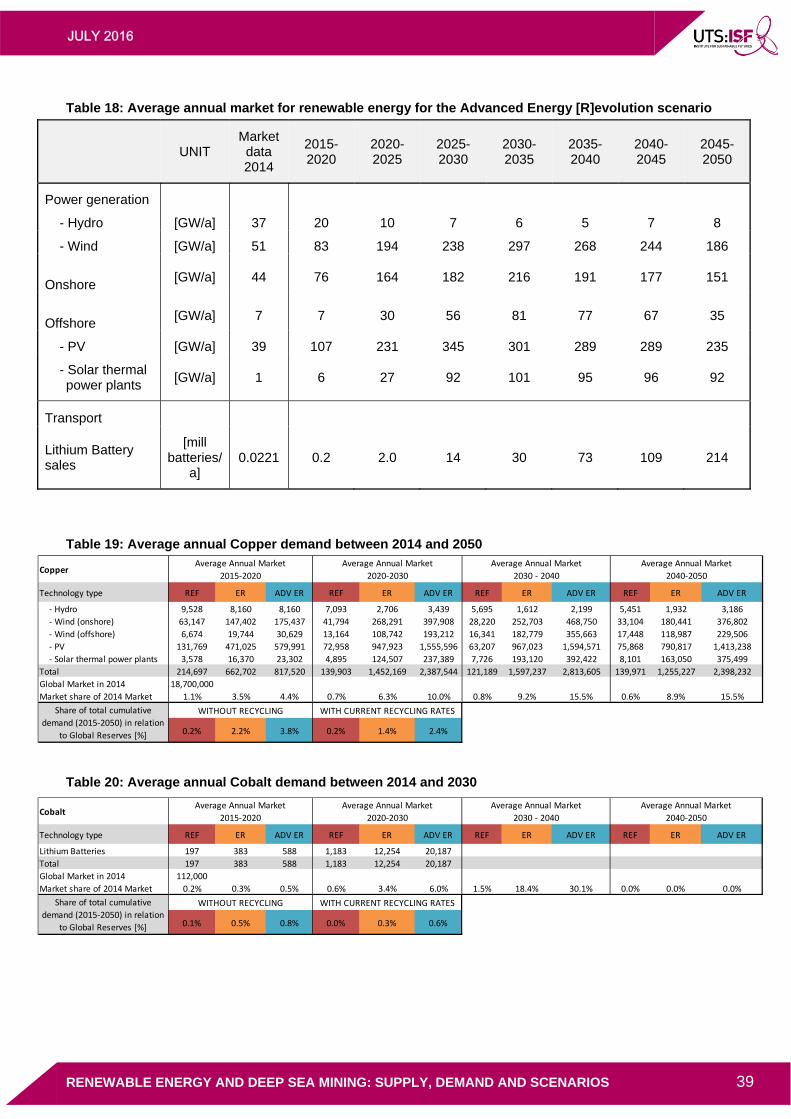
JULY 2016
RENEWABLE ENERGY AND DEEP SEA MINING: SUPPLY, DEMAND AND SCENARIOS 39
Table 18: Average annual market for renewable energy for the Advanced Energy [R]evolution scenario
UNIT
Market data 2014
2015-2020
2020-2025
2025-2030
2030-2035
2035-2040
2040-2045
2045-2050
Power generation
- Hydro [GW/a] 37 20 10 7 6 5 7 8
- Wind [GW/a] 51 83 194 238 297 268 244 186
Onshore
[GW/a] 44 76 164 182 216 191 177 151
Offshore
[GW/a] 7 7 30 56 81 77 67 35
- PV [GW/a] 39 107 231 345 301 289 289 235
- Solar thermal power plants
[GW/a] 1 6 27 92 101 95 96 92
Transport
Lithium Battery sales
[mill batteries/
a] 0.0221 0.2 2.0 14 30 73 109 214
Table 19: Average annual Copper demand between 2014 and 2050
Table 20: Average annual Cobalt demand between 2014 and 2030
Copper
Technology type REF ER ADV ER REF ER ADV ER REF ER ADV ER REF ER ADV ER
‐ Hydro 9,528 8,160 8,160 7,093 2,706 3,439 5,695 1,612 2,199 5,451 1,932 3,186
‐ Wind (onshore) 63,147 147,402 175,437 41,794 268,291 397,908 28,220 252,703 468,750 33,104 180,441 376,802
‐ Wind (offshore) 6,674 19,744 30,629 13,164 108,742 193,212 16,341 182,779 355,663 17,448 118,987 229,506
‐ PV 131,769 471,025 579,991 72,958 947,923 1,555,596 63,207 967,023 1,594,571 75,868 790,817 1,413,238
‐ Solar thermal power plants 3,578 16,370 23,302 4,895 124,507 237,389 7,726 193,120 392,422 8,101 163,050 375,499
Total 214,697 662,702 817,520 139,903 1,452,169 2,387,544 121,189 1,597,237 2,813,605 139,971 1,255,227 2,398,232
Global Market in 2014 18,700,000
Market share of 2014 Market 1.1% 3.5% 4.4% 0.7% 6.3% 10.0% 0.8% 9.2% 15.5% 0.6% 8.9% 15.5%
0.2% 2.2% 3.8% 0.2% 1.4% 2.4%
Average Annual Market
2030 ‐ 2040
Average Annual Market
2040‐2050
WITHOUT RECYCLING WITH CURRENT RECYCLING RATESShare of total cumulative
demand (2015‐2050) in relation
to Global Reserves [%]
Average Annual Market
2015‐2020
Average Annual Market
2020‐2030
Cobalt
Technology type REF ER ADV ER REF ER ADV ER REF ER ADV ER REF ER ADV ER
Lithium Batteries 197 383 588 1,183 12,254 20,187
Total 197 383 588 1,183 12,254 20,187
Global Market in 2014 112,000
Market share of 2014 Market 0.2% 0.3% 0.5% 0.6% 3.4% 6.0% 1.5% 18.4% 30.1% 0.0% 0.0% 0.0%
0.1% 0.5% 0.8% 0.0% 0.3% 0.6%
Average Annual Market
2030 ‐ 2040
Average Annual Market
2040‐2050
Share of total cumulative
demand (2015‐2050) in relation
to Global Reserves [%]
WITHOUT RECYCLING WITH CURRENT RECYCLING RATES
Average Annual Market
2015‐2020
Average Annual Market
2020‐2030
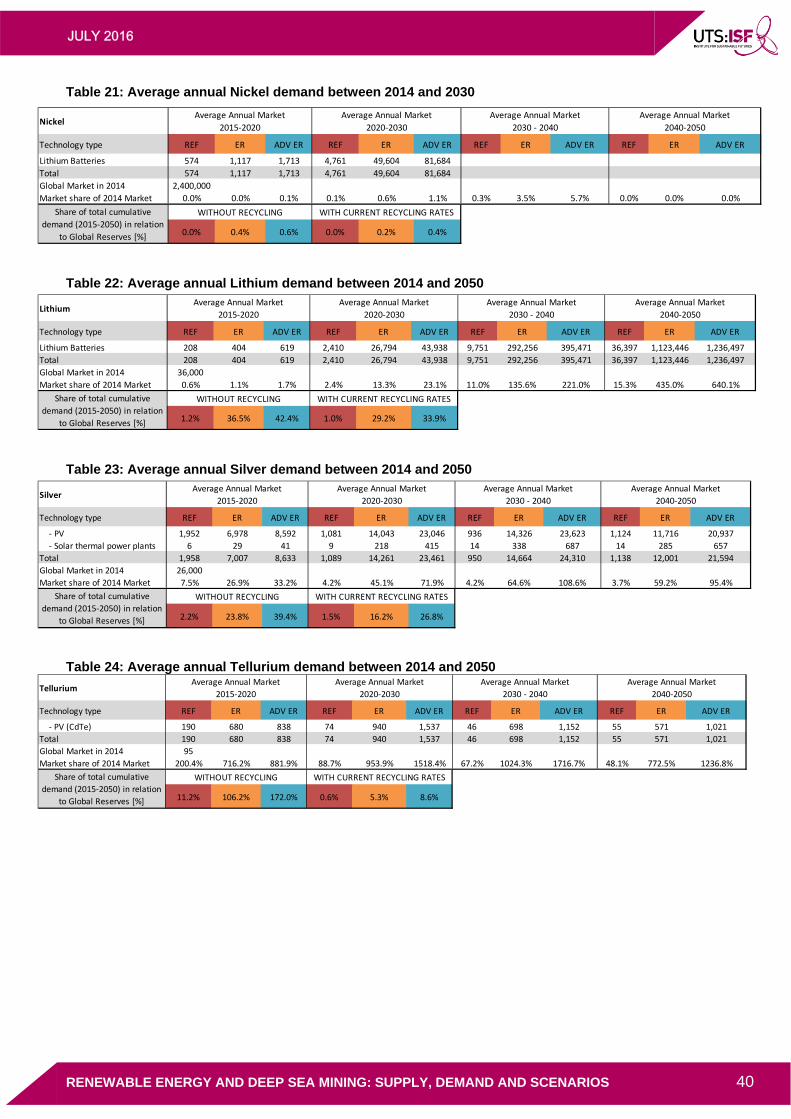
JULY 2016
RENEWABLE ENERGY AND DEEP SEA MINING: SUPPLY, DEMAND AND SCENARIOS 40
Table 21: Average annual Nickel demand between 2014 and 2030
Table 22: Average annual Lithium demand between 2014 and 2050
Table 23: Average annual Silver demand between 2014 and 2050
Table 24: Average annual Tellurium demand between 2014 and 2050
Nickel
Technology type REF ER ADV ER REF ER ADV ER REF ER ADV ER REF ER ADV ER
Lithium Batteries 574 1,117 1,713 4,761 49,604 81,684
Total 574 1,117 1,713 4,761 49,604 81,684
Global Market in 2014 2,400,000
Market share of 2014 Market 0.0% 0.0% 0.1% 0.1% 0.6% 1.1% 0.3% 3.5% 5.7% 0.0% 0.0% 0.0%
0.0% 0.4% 0.6% 0.0% 0.2% 0.4%
Average Annual Market
2030 ‐ 2040
Average Annual Market
2040‐2050
Share of total cumulative
demand (2015‐2050) in relation
to Global Reserves [%]
WITHOUT RECYCLING WITH CURRENT RECYCLING RATES
Average Annual Market
2015‐2020
Average Annual Market
2020‐2030
Lithium
Technology type REF ER ADV ER REF ER ADV ER REF ER ADV ER REF ER ADV ER
Lithium Batteries 208 404 619 2,410 26,794 43,938 9,751 292,256 395,471 36,397 1,123,446 1,236,497
Total 208 404 619 2,410 26,794 43,938 9,751 292,256 395,471 36,397 1,123,446 1,236,497
Global Market in 2014 36,000
Market share of 2014 Market 0.6% 1.1% 1.7% 2.4% 13.3% 23.1% 11.0% 135.6% 221.0% 15.3% 435.0% 640.1%
1.2% 36.5% 42.4% 1.0% 29.2% 33.9%
Average Annual Market
2030 ‐ 2040
Average Annual Market
2040‐2050
Share of total cumulative
demand (2015‐2050) in relation
to Global Reserves [%]
WITHOUT RECYCLING WITH CURRENT RECYCLING RATES
Average Annual Market
2015‐2020
Average Annual Market
2020‐2030
Silver
Technology type REF ER ADV ER REF ER ADV ER REF ER ADV ER REF ER ADV ER
‐ PV 1,952 6,978 8,592 1,081 14,043 23,046 936 14,326 23,623 1,124 11,716 20,937
‐ Solar thermal power plants 6 29 41 9 218 415 14 338 687 14 285 657
Total 1,958 7,007 8,633 1,089 14,261 23,461 950 14,664 24,310 1,138 12,001 21,594
Global Market in 2014 26,000
Market share of 2014 Market 7.5% 26.9% 33.2% 4.2% 45.1% 71.9% 4.2% 64.6% 108.6% 3.7% 59.2% 95.4%
2.2% 23.8% 39.4% 1.5% 16.2% 26.8%
Average Annual Market
2015‐2020
Average Annual Market
2020‐2030
Share of total cumulative
demand (2015‐2050) in relation
to Global Reserves [%]
WITHOUT RECYCLING
Average Annual Market
2030 ‐ 2040
Average Annual Market
2040‐2050
WITH CURRENT RECYCLING RATES
Tellurium
Technology type REF ER ADV ER REF ER ADV ER REF ER ADV ER REF ER ADV ER
‐ PV (CdTe) 190 680 838 74 940 1,537 46 698 1,152 55 571 1,021
Total 190 680 838 74 940 1,537 46 698 1,152 55 571 1,021
Global Market in 2014 95
Market share of 2014 Market 200.4% 716.2% 881.9% 88.7% 953.9% 1518.4% 67.2% 1024.3% 1716.7% 48.1% 772.5% 1236.8%
11.2% 106.2% 172.0% 0.6% 5.3% 8.6%
Average Annual Market
2015‐2020
Average Annual Market
2020‐2030
Average Annual Market
2030 ‐ 2040
Average Annual Market
2040‐2050
Share of total cumulative
demand (2015‐2050) in relation
to Global Reserves [%]
WITHOUT RECYCLING WITH CURRENT RECYCLING RATES

JULY 2016
RENEWABLE ENERGY AND DEEP SEA MINING: SUPPLY, DEMAND AND SCENARIOS 41