Embed Size (px)
Citation preview
DWC-8203
Supply and Cost Prices of RubberProduction
Teck Yew Pee
Division Working Paper No. 1982-3
February 1982
Commodities and Export Projections Division ;,Economic Analysis and Projections Department -
Development Policy StaffThe World Bank
Division Working Papers report on work in progress and arecirculated for Bank staff use to stimulate discussion andcomment. The views and interpretations in a Working Paper arethose of the author(s) and may not be attributed to the WorldBank or its affiliated organizations.
Pub
lic D
iscl
osur
e A
utho
rized
Pub
lic D
iscl
osur
e A
utho
rized
Pub
lic D
iscl
osur
e A
utho
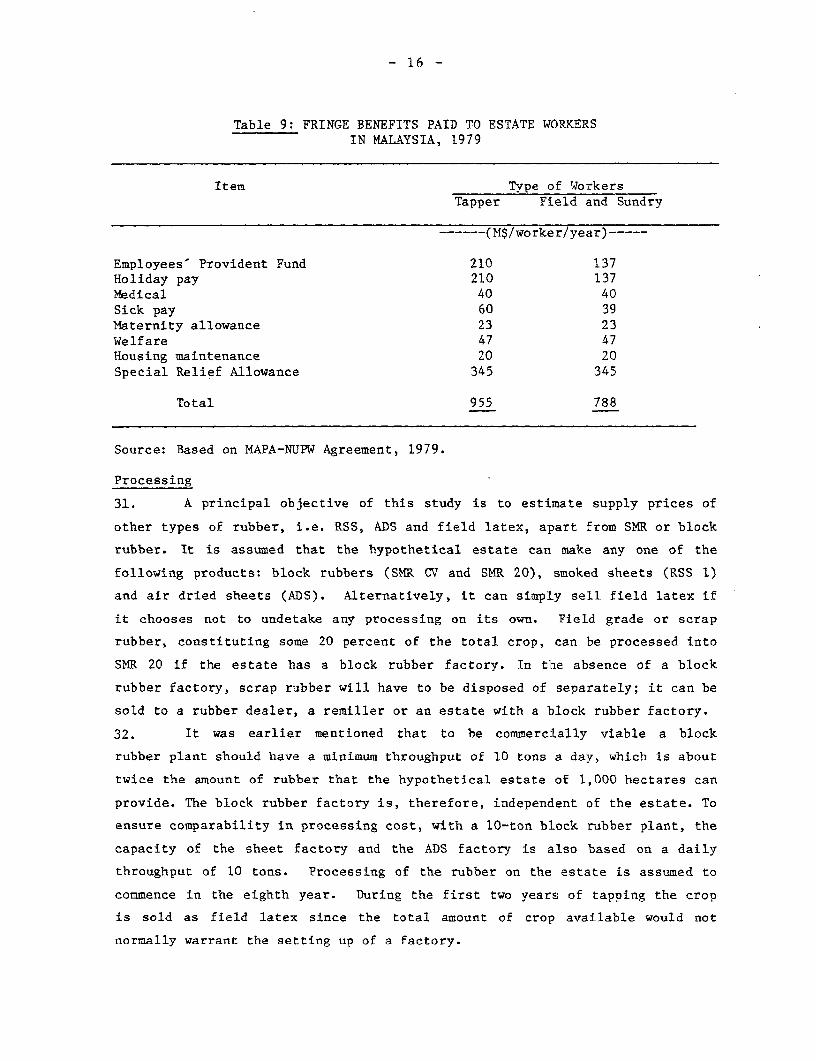
rized
Pub
lic D
iscl
osur
e A
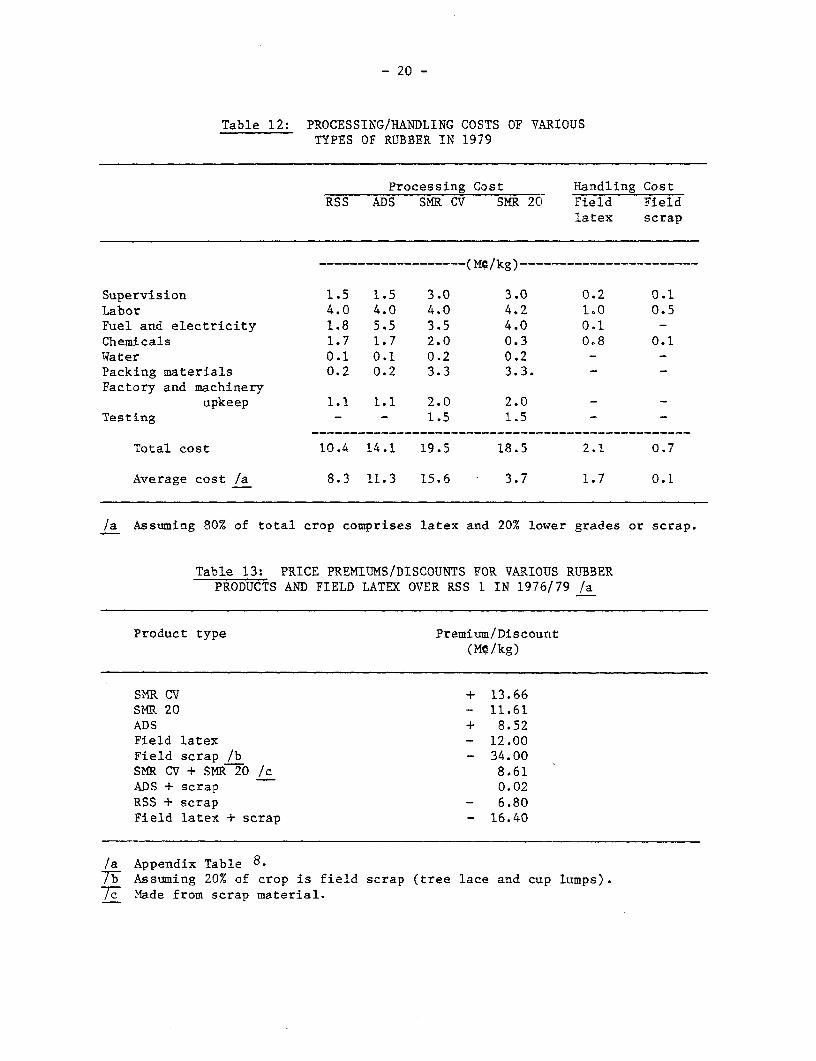
utho
rized

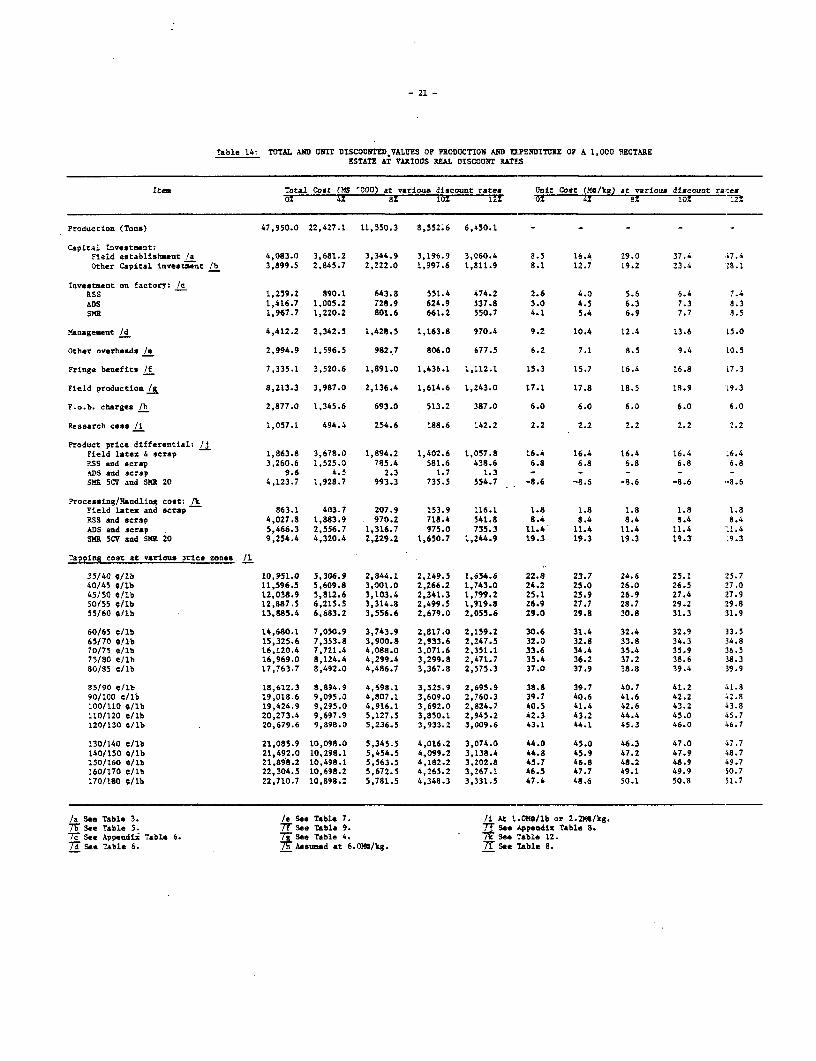
SUPPLY AND COST PRICES OF RUBBER PRODUCTION*
Teck Yew Pee
February 1982
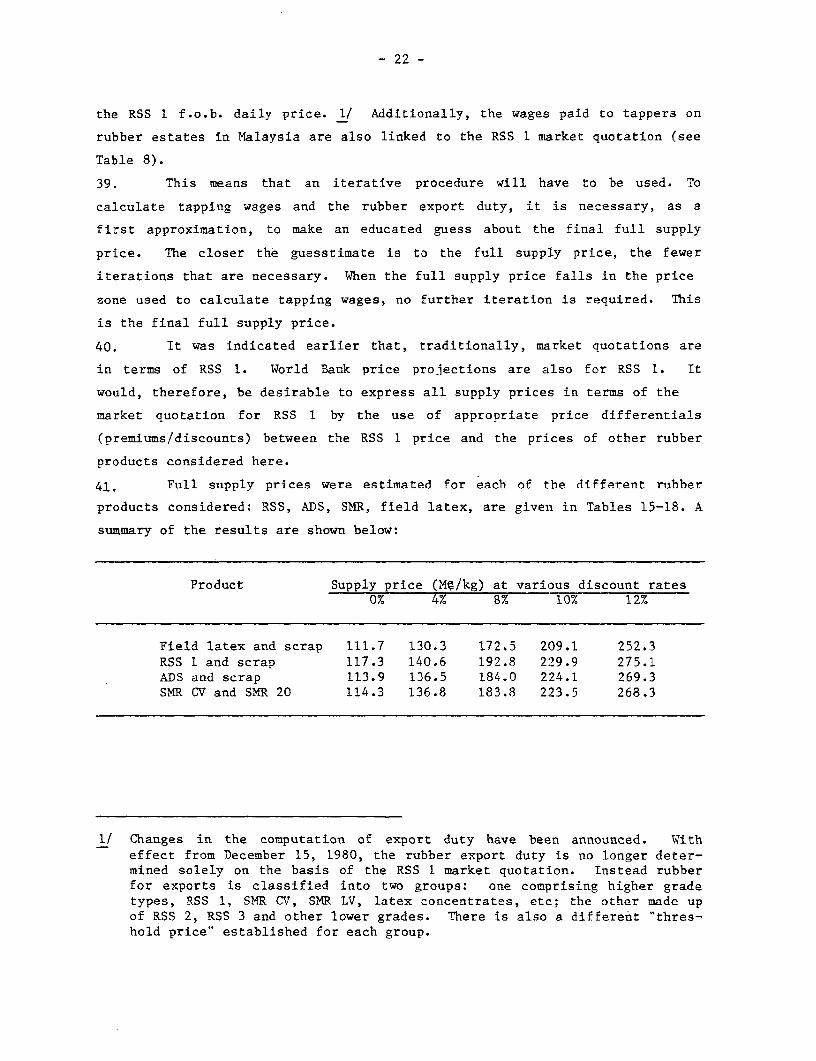
*The assistance of M.H. Lai in the preparation of this reportand the constructive comments of Maria 't Hooft-Welvaars aregratefully acknowledged.

TABLE OF CONTENTS
Page No.
I. INTRODUCTION ................................ 1.............. 1
II. SUPPLY PRICES .................................................... 3
III. NATURAL RUBBER SUPPLY PRICES .................................... 5
IV. RUBBER COST PRICES ............................................... 29
V. CONCLUSIONS AND IMPLICATIONS .............................. 34

I
- ii -
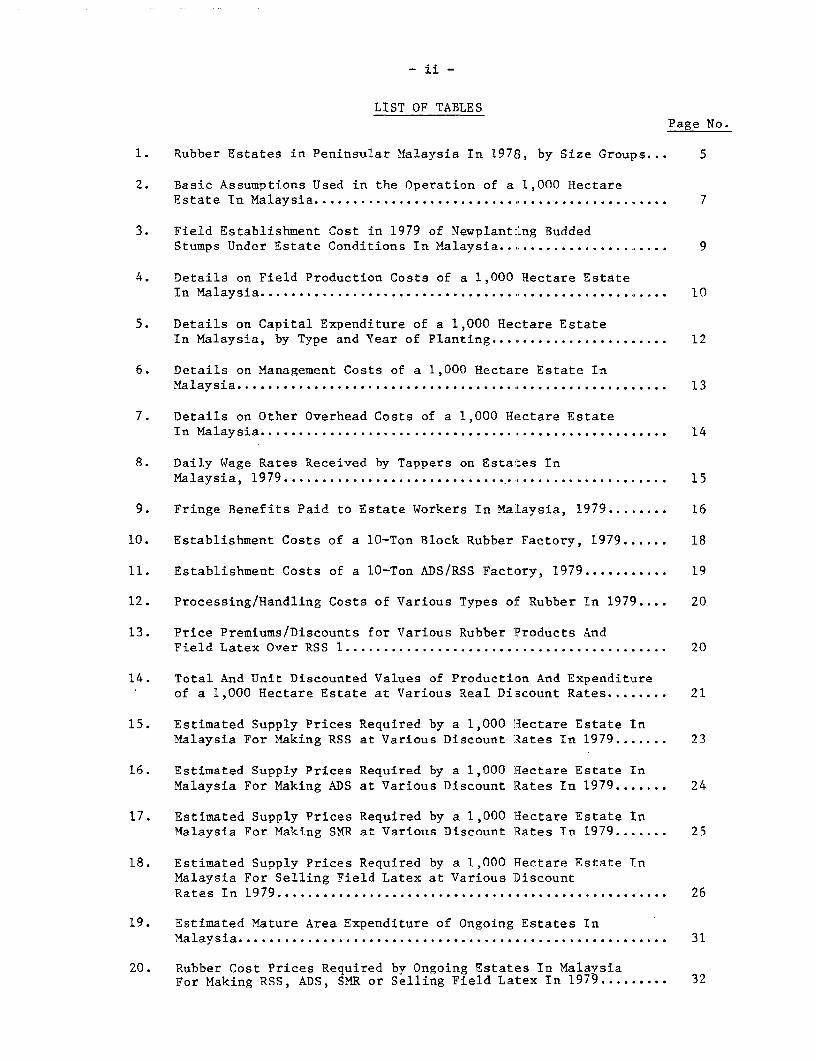
LIST OF TABLESPage No.
1. Rubber Estates in Peninsular Malaysia In 1978, by Size Groups... 5
2. Basic Assumptions Used in the Operation of a 1,000 HectareEstate In Malaysia ............................................... 7
3. Field Establishment Cost in 1979 of Newplant:ing BuddedStumps Under Estate Conditions In Malaysia ....................... 9
4. Details on Field Production Costs of a 1,000 Hectare EstateIn Malaysia .............................................. 10
5. Details on Capital Expenditure of a 1,000 Hectare EstateIn Malaysia, by Type and Year of Planting ........................ 12
6. Details on Management Costs of a 1,000 Hectare Estate InMalaysia ...............................................,,.13
7. Details on Other Overhead Costs of a 1,000 Hectare EstateIn Malaysia .............................................. 14
8. Daily Wage Rates Received by Tappers on Estat:es InMalaysia, 1979 ............................... ............... 15
9. Fringe Benefits Paid to Estate Workers In MaLaysia, 1979 ........ 16
10. Establishment Costs of a 10-Ton Block Rubber Factory, 1979 ...... 18
11. Establishment Costs of a 10-Ton ADS/RSS Factory, 1979 ........... 19
12. Processing/Handling Costs of Various Types o'f Rubber In 1979 .... 20
13. Price Premiums/Discounts for Various Rubber l?roducts AndField Latex Over RSS 1 .20
14. Total And Unit Discounted Values of Production And Expenditureof a 1,000 Hectare Estate at Various Real Discount Rates .21
15. Estimated Supply Prices Required by a 1,000 liectare Estate InMalaysia For Making RSS at Various Discount Rates In 1979 .23
16. Estimated Supply Prices Required by a 1,000 Hlectare Estate InMalaysia For Making ADS at Various Discount Rates In 1979 .24
17. Estimated Supply Prices Required by a 1,000 Hectare Estate InMalaysia For Making SMR at Various Discount Rates In 1979 .25
18. Estimated Supply Prices Required by a 1,000 Hectare Estate InMalaysia For Selling Field Latex at Various 'DiscountRates In 1979 .26
19. Estimated Mature Area Expenditure of Ongoing Estates InMalaysia .31
20. Rubber Cost Prices Required by Ongoing Estates In MalaysiaFor Making RSS, ADS, SMR or Selling Field Latex In 199 .32
- iii -
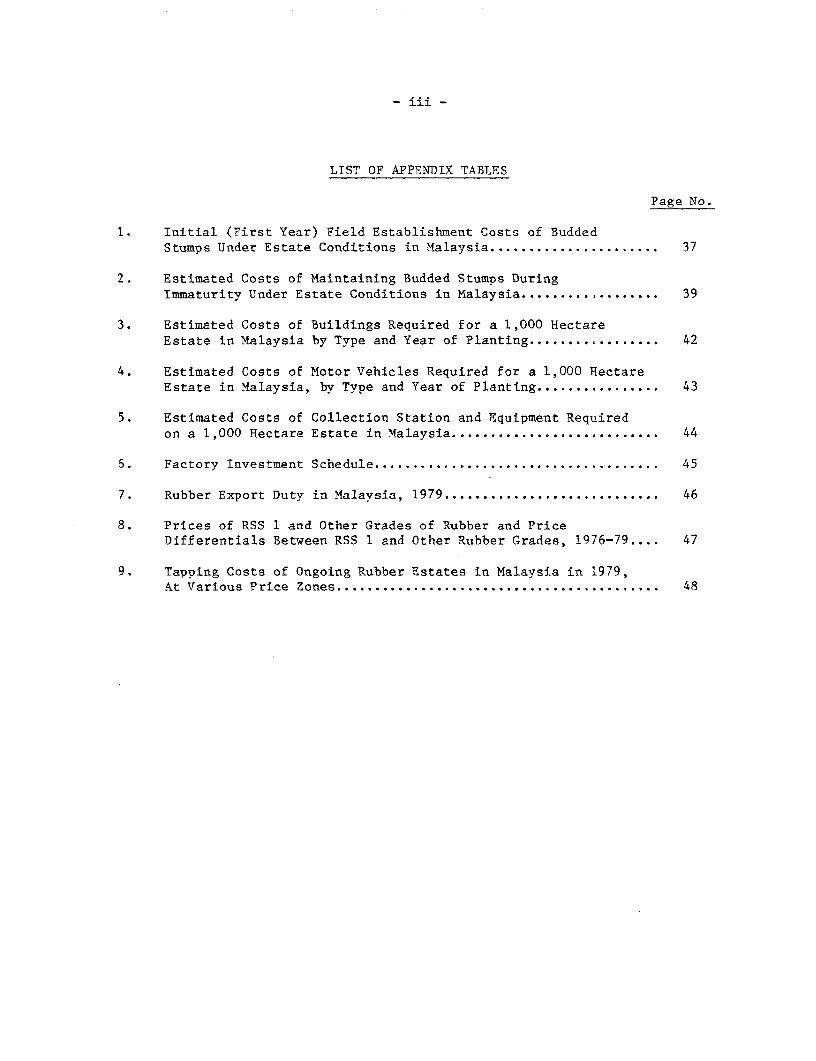
LIST OF APPENDIX TABLES
Page No.
1. Initial (First Year) Field Establishment Costs of BuddedStumps Under Estate Conditions in Malaysia ...................... 37
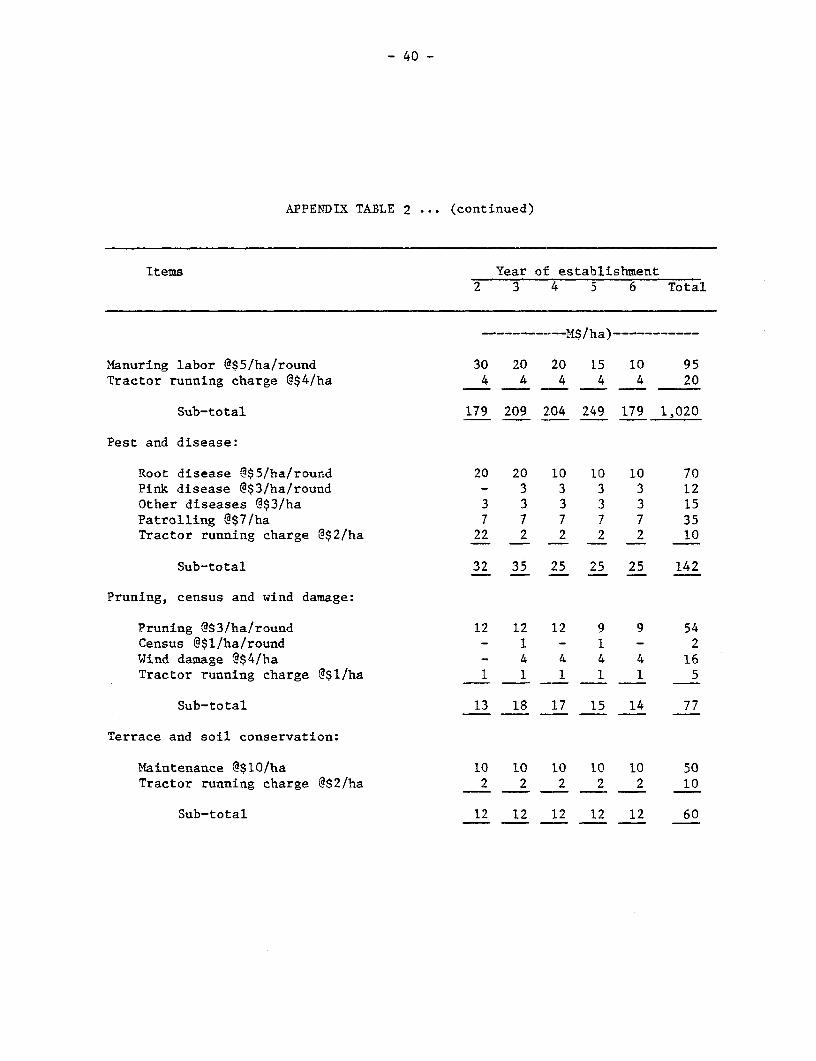
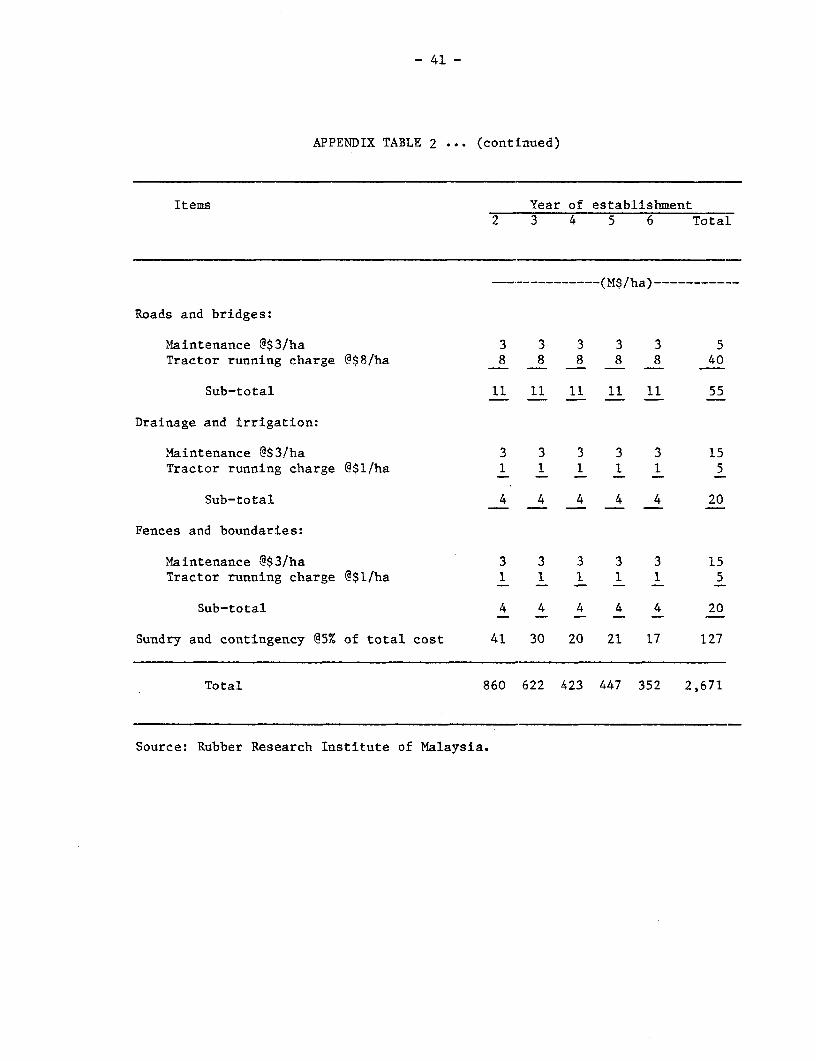
2. Estimated Costs of Maintaining Budded Stumps DuringImmaturity Under Estate Conditions in Malaysia .................. 39
3. Estimated Costs of Buildings Required for a 1,000 HectareEstate in Malaysia by Type and Year of Planting ......... . ....... 42
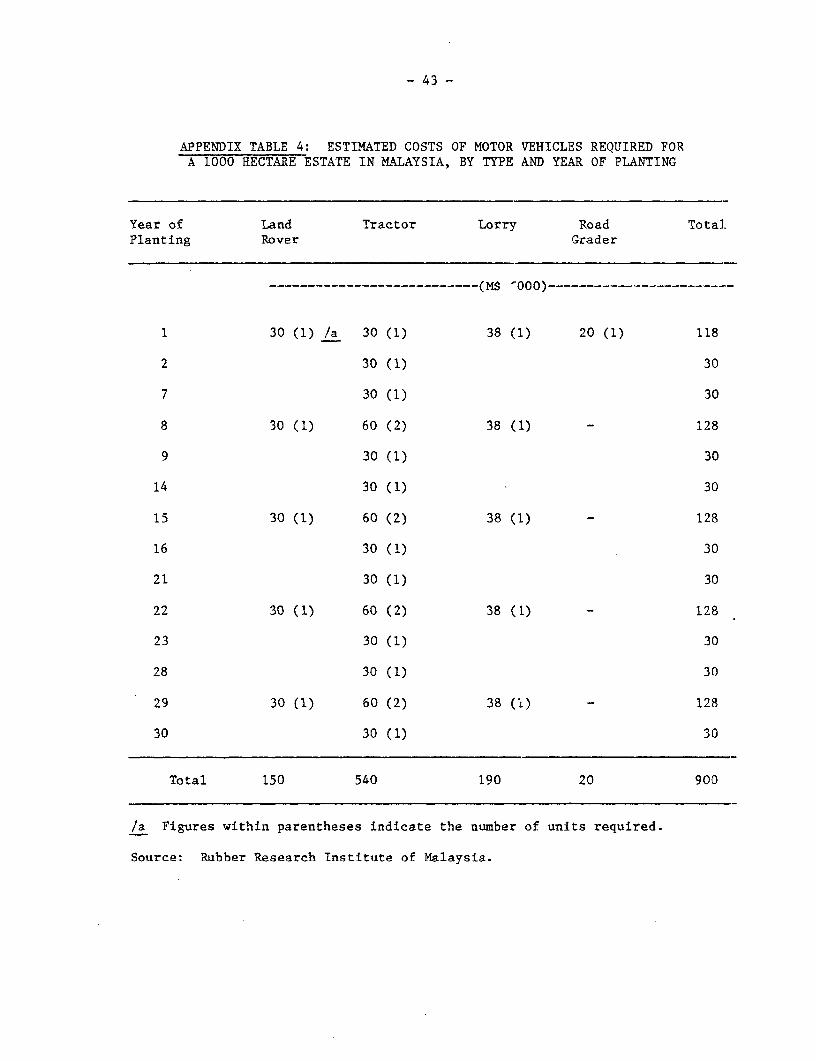
4. Estimated Costs of Motor Vehicles Required for a 1,000 HectareEstate in Malaysia, by Type and Year of Planting ....... 43
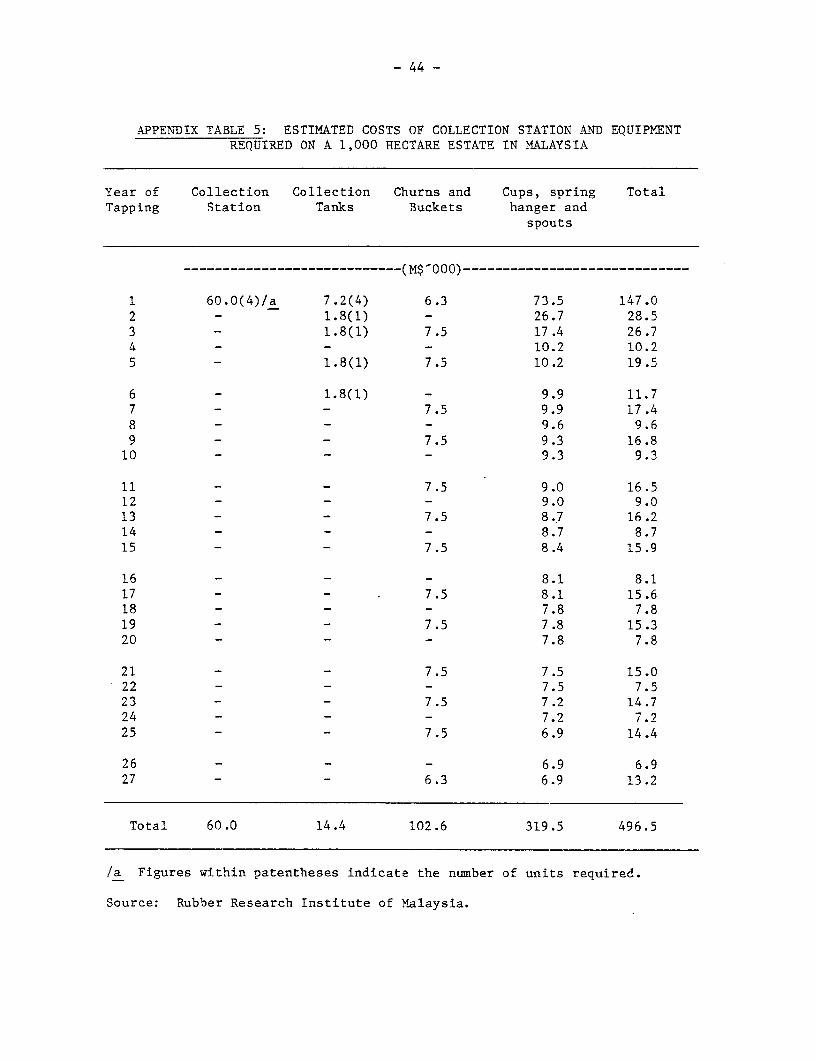
5. Estimated Costs of Collection Station and Equipment Requiredon a 1,000 Hectare Estate in Malaysia ....... 44
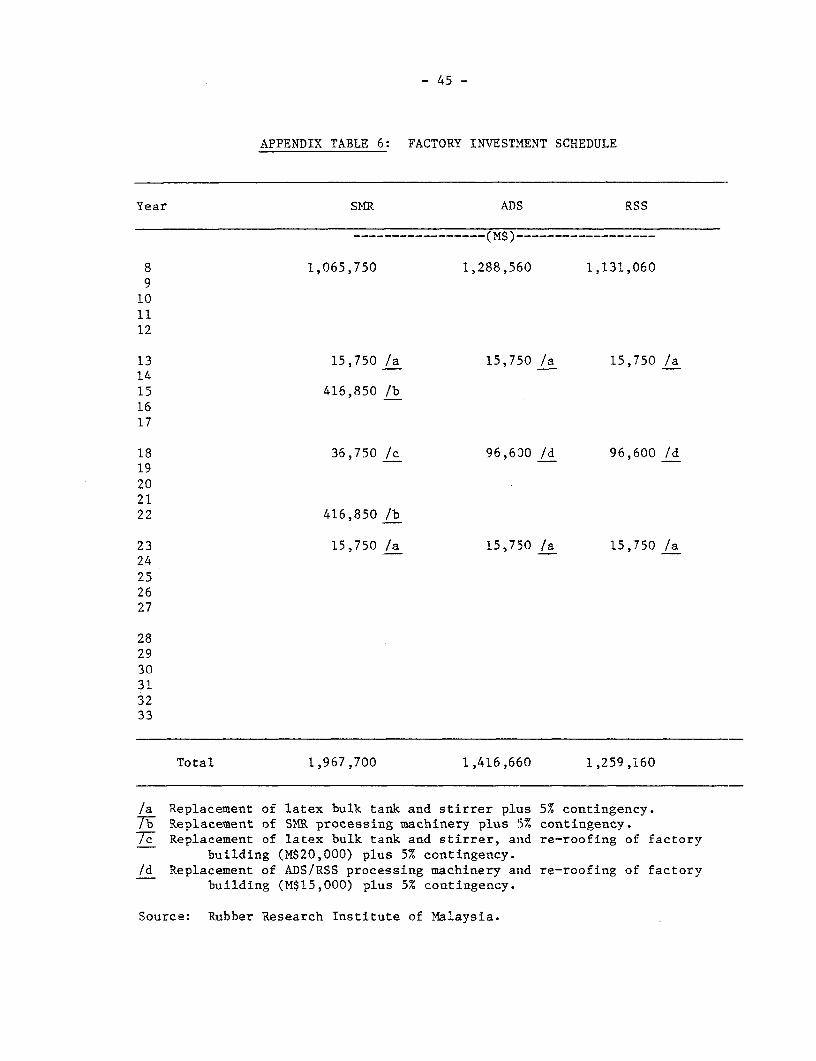
6. Factory Investment Schedule ....... 45
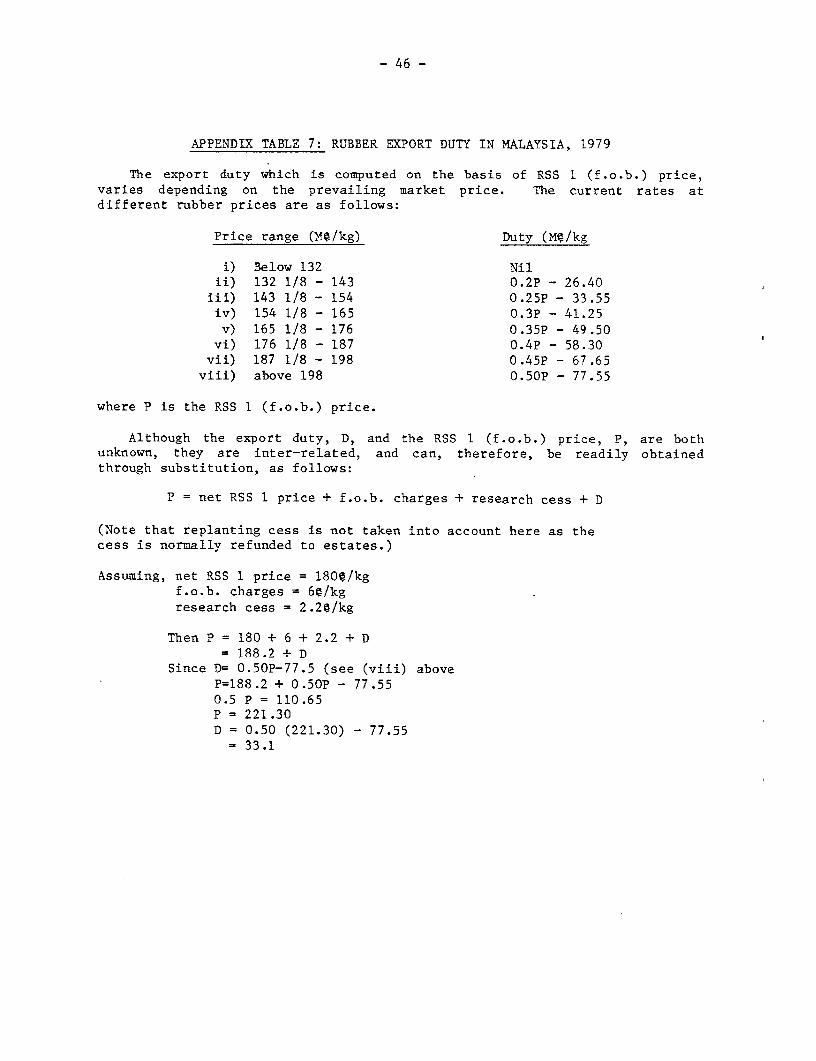
7. Rubber Export Duty in Malaysia, 1979 ....... 46
8. Prices of RSS 1 and Other Grades of Rubber and PriceDifferentials Between RSS 1 and Other Rubber Grades, 1976-79.... 47
9. Tapping Costs of Ongoing Rubber Estates in Malaysia in 1979,At Various Price Zones ....... 48
SUPPLY AND COST PRICES OF RUBBER PRODUCTION
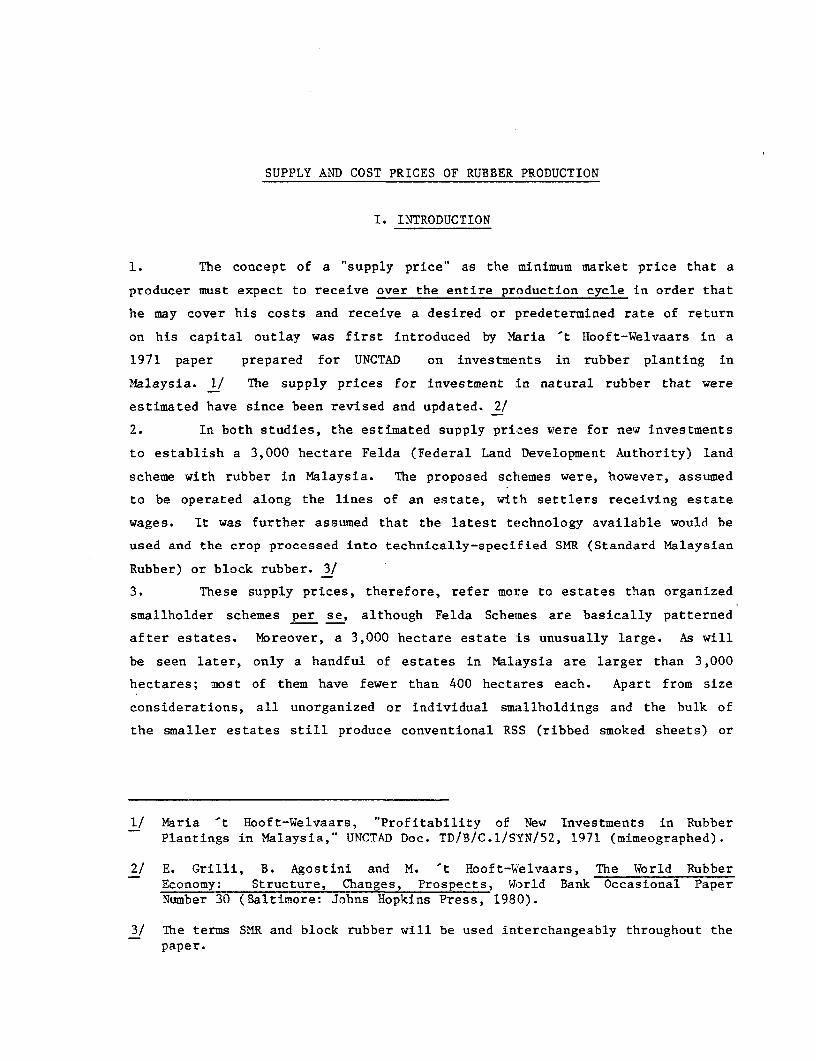
I. INTRODUCTION
1. The concept of a "supply price" as the minimum market price that a
producer must expect to receive over the entire production cycle in order that
he may cover his costs and receive a desired or predetermined rate of return
on his capital outlay was first introduced by Maria 't Hooft-Welvaars in a
1971 paper prepared for UNCTAD on investments in rubber planting in
Malaysia. 1/ The supply prices for investment :Ln natural rubber that were
estimated have since been revised and updated. 2/
2. In both studies, the estimated supply pri,es were for new investments
to establish a 3,000 hectare Felda (Federal Land Development Authority) land
scheme with rubber in Malaysia. The proposed schemes were, however, assumed
to be operated along the lines of an estate, with settlers receiving estate
wages. It was further assumed that the latest technology available would be
used and the crop processed into technically-specified SMR (Standard Malaysian
Rubber) or block rubber. 3/
3. These supply prices, therefore, refer more to estates than organized
smallholder schemes per se, although Felda Schemes are basically patterned
after estates. Moreover, a 3,000 hectare estate is unusually large. As will
be seen later, only a handful of estates in Malaiysia are larger than 3,000
hectares; most of them have fewer than 400 hectares each. Apart from size
considerations, all unorganized or individual smallholdings and the bulk of
the smaller estates still produce conventional RSS (ribbed smoked sheets) or
1/ Maria 't Hooft-Welvaars, "Profitability of New Investments in RubberPlantings in Malaysia," UNCTAD Doc. TD/B/C.1/SYN/52, 1971 (mimeographed).
2/ E. Grilli, B. Agostini and M. 't Hooft-Welvaars, The World RubberEconomy: Structure, Changes, Prospects, World Bank Occasional PaperNumber 30 (Baltimore: Johns Hopkins Press, 1980).
3/ The terms SMR and block rubber will be used interchangeably throughout thepaper.
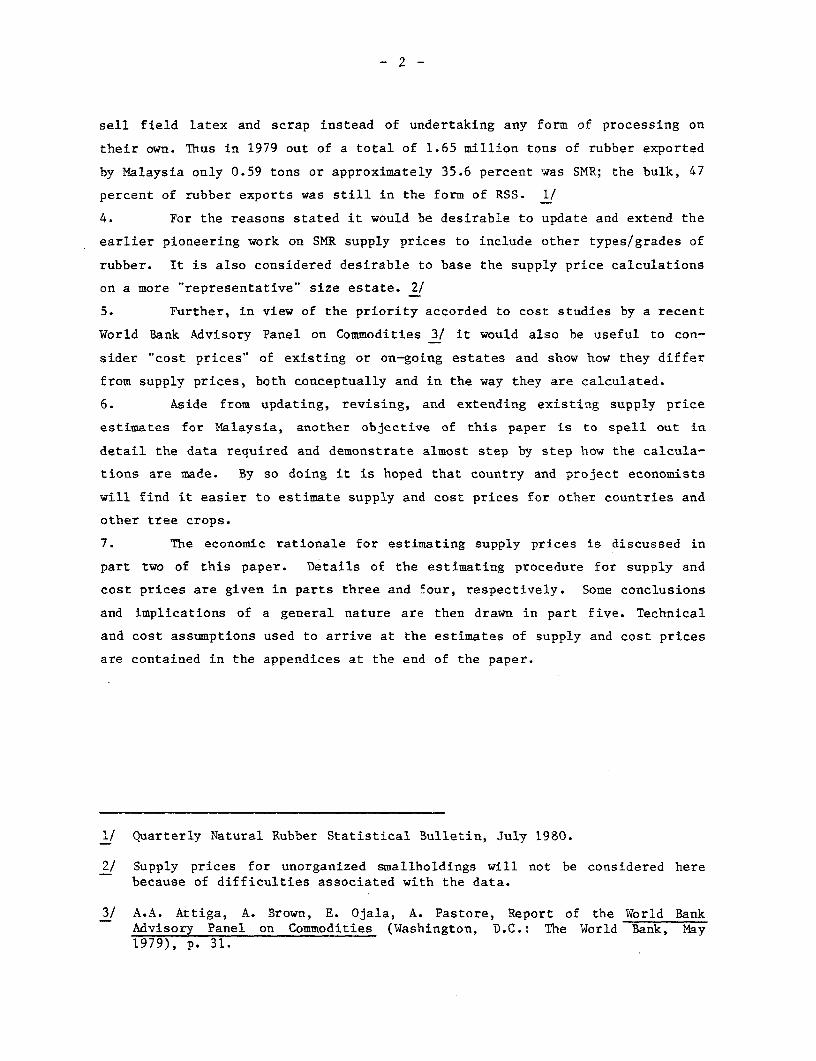
sell field latex and scrap instead of undertaking any form of processing on
their own. Thus in 1979 out of a total of 1.65 million tons of rubber exported
by Malaysia only 0.59 tons or approximately 35.6 percent was SMR; the bulk, 47
percent of rubber exports was still in the form of RSS. 1/
4. For the reasons stated it would be desirable to update and extend the
earlier pioneering work on SMR supply prices to include other types/grades of
rubber. It is also considered desirable to base the supply price calculations
on a more "representative" size estate. 2/
5. Further, in view of the priority accorded to cost: studies by a recent
World Bank Advisory Panel on Commodities 3/ it would also be useful to con-
sider "cost prices" of existing or on-going estates and show how they differ
from supply prices, both conceptually and in the way they are calculated.
6. Aside from updating, revising, and extending existing supply price
estimates for Malaysia, another objective of this paper is to spell out in
detail the data required and demonstrate almost step by step how the calcula-
tions are made. By so doing it is hoped that country and project economists
will find it easier to estimate supply and cost prices for other countries and
other tree crops.
7. The economic rationale for estimating supply prices is discussed in
part two of this paper. Details of the estimating procedure for supply and
cost prices are given in parts three and four, respectively. Some conclusions
and implications of a general nature are then drawn in part five. Technical
and cost assumptions used to arrive at the estimates of supply and cost prices
are contained in the appendices at the end of the paper.
1/ Quarterly Natural Rubber Statistical Bulletin, July 1980.
2/ Supply prices for unorganized smallholdings will not be considered herebecause of difficulties associated with the data.
3/ A.A. Attiga, A. Brown, E. Ojala, A. Pastore, Report of the World BankAdvisory Panel on Commodities (Washington, D.C.: The World Bank, May1979), p. 31.
- 3 -
II SUPPLY PRICES
8. The main objective of a conventional feasibility study is to identify
and evaluate the economic outcome of a proposed project to ensure that avail-
able funds are put to the best possible use. Regardless of the type of pro-
ject involved, the feasibility study requires that estimates be made of dis-
counted cash flows over the economic life of the project. For a tree crop
such as rubber, its relatively long economic life (about 30 years) means that
cash flows must be estimated well into the future. The project yield is deter-
mined by assuming a future sequence of market prices.
9. In view of the fact that the short-run prices of perennial tree crops
tend to be highly unstable because both the supply and demand for them are
relatively price inelastic, it is useful to supplement project yields by cal-
culating a "supply price,"1/ i.e. a price which, if it were received over the
entire life of the project, would cover all costs and yield a desired rate of
return on capital.
10. The supply price, p, is obtained by discounting the cash flow at a
certain discount rate. It is akin to making a calculation for the internal
rate of return (IRR), except that in this procedure the price, p, is substi-
1/ Another way of viewing the supply price concept which is, perhaps, more inaccord with normal useage in economics is to view it as a long-run orinvestment price, i.e. a price high enough to induce investment and/or re-investment. I owe this clarification and that for the cost price (seefootnote in section IV) to G. Baldwin.
- 4 -
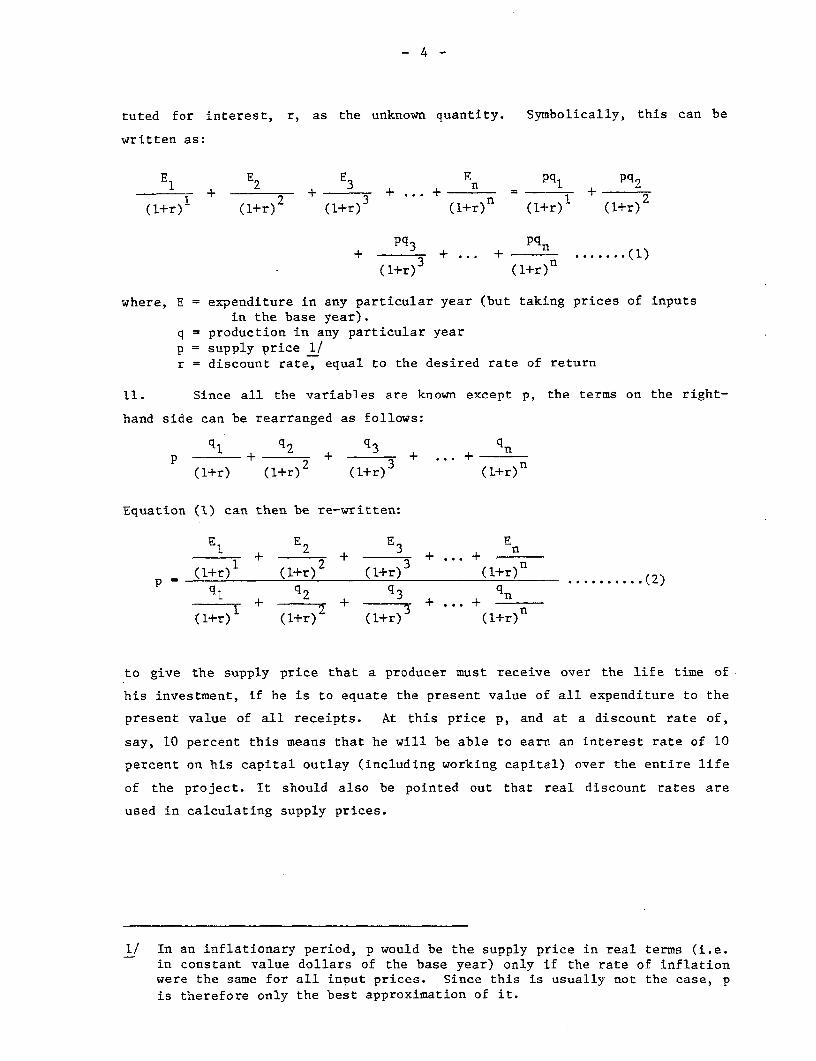
tuted for interest, r, as the unknown quantity. Syrnbolically, this can be
written as:
E1 2 3 En pq I pq2E1 + 2 E3 3 +..+ n _ 1 +q
(l+r) (l+r)2 (l+r) (l+r) (l+r) (l+r)2
Pq3 pqn+ 3 + *-- + ....... (1)
(l+r)3 (l+r)n
where, E = expenditure in any particular year (but taking prices of inputsin the base year).
q = production in any particular yearp = supply price 1/r = discount rate, equal to the desired rate of return
11. Since all the variables are known except p, the terms on the right-
hand side can be rearranged as follows:
q___ q2 q3 q____ql + 2 + 3 + + *-- + n
(1+r) (l+r) (l+r) (L+r)
Equation (1) can then be re-written:
E E 3 Kn1 2 3 n
(l+r) (l+r) (l+r) (l+r).(2)p q . . . ... q... 3 ( 2)
1 + 2+ + (1+r) (l+r) (1+r) (l+r)
to give the supply price that a producer must receive over the life time of
his investment, if he is to equate the present value of all expenditure to the
present value of all receipts. At this price p, and at a discount rate of,
say, 10 percent this means that he will be able to earn an interest rate of 10
percent on his capital outlay (including working capital) over the entire life
of the project. It should also be pointed out that real discount rates are
used in calculating supply prices.
1/ In an inflationary period, p would be the supply price in real terms (i.e.in constant value dollars of the base year) only if the rate of inflationwere the same for all input prices. Since this is usually not the case, pis therefore only the best approximation of it.
- 5 -
III. NATURAL RUBBER SUPPLY' PRICES
12. In the specific case of rubber, when a supply price for a particular
type/grade of rubber, e.g. SMR CV or ADS (air dried sheet) has been cal-
culated, it is advisable to "convert" it into a price for the RSS I grade.
This is because market quotations are traditionally for RSS 1, even though
there exists a rather firm relationship between the RSS 1 quotation and the
market price for other types/grades of rubber.
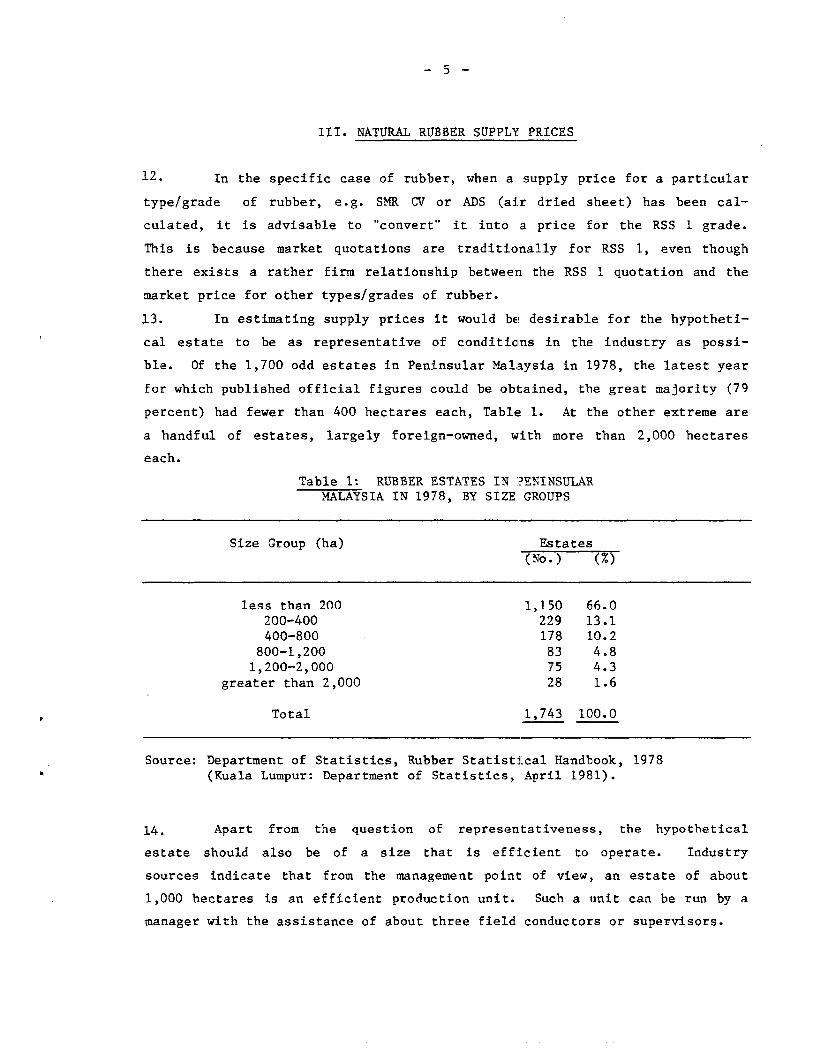
13. In estimating supply prices it would be desirable for the hypotheti-
cal estate to be as representative of conditicns in the industry as possi-
ble. Of the 1,700 odd estates in Peninsular Malaysia in 1978, the latest year
for which published official figures could be obitained, the great majority (79
percent) had fewer than 400 hectares each, Table 1. At the other extreme are
a handful of estates, largely foreign-owned, with more than 2,000 hectares
each.
Table 1: RUBBER ESTATES IN ?ENINSULARMALAYSIA IN 1978, BY SIZE GROUPS
Size Group (ha) Estates(No.) (x)
less than 200 1,150 66.0200-400 229 13.1400-800 178 10.2800-1,200 83 4.81,200-2,000 75 4.3
greater than 2,000 28 1.6
Total 1,743 100.0
Source: Department of Statistics, Rubber StatistiLcal Handbook, 1978(Kuala Lumpur: Department of Statistics, April 1981).
14. Apart from the question of representativeness, the hypothetical
estate should also be of a size that is efficient to operate. Industry
sources indicate that from the management point of view, an estate of about
1,000 hectares is an efficient production unit. Such a unit can be run by a
manager with the assistance of about three field conductors or supervisors.
- 6 -
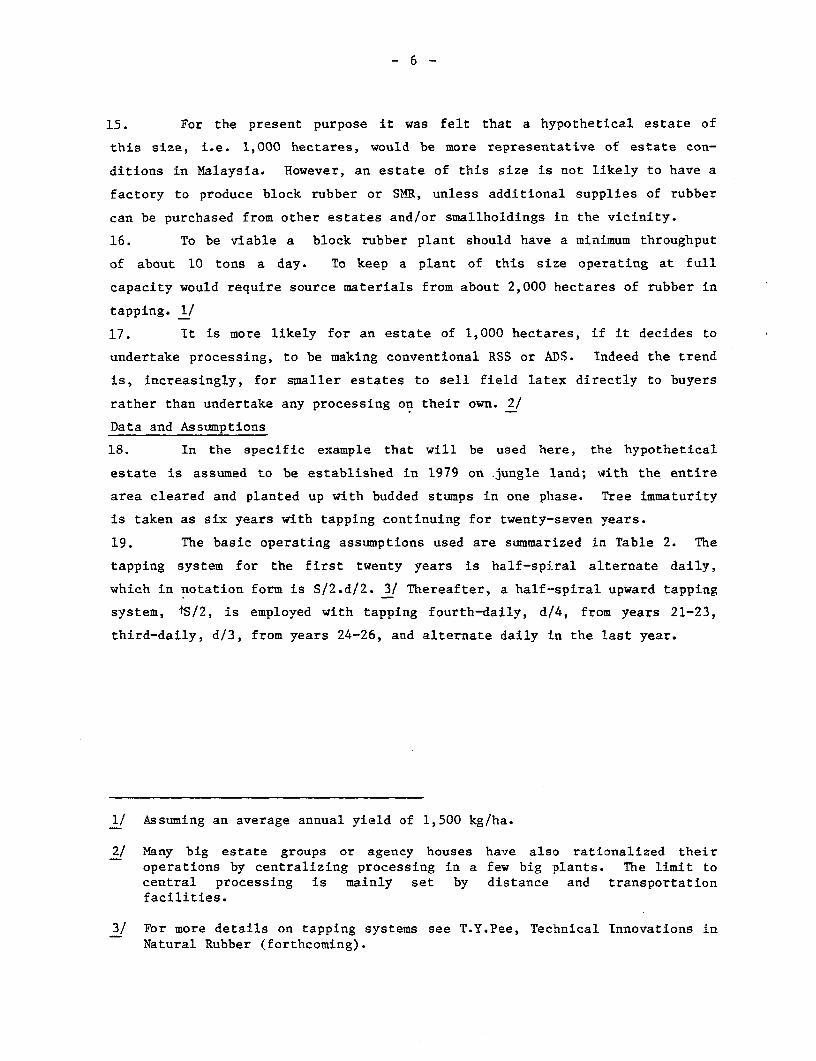
15. For the present purpose it was felt that a hypothetical estate of
this size, i.e. 1,000 hectares, would be more representative of estate con-
ditions in Malaysia. However, an estate of this size is not likely to have a
factory to produce block rubber or SMR, unless additional supplies of rubber
can be purchased from other estates and/or smallholdings in the vicinity.
16. To be viable a block rubber plant should have a minimum throughput
of about 10 tons a day. To keep a plant of this size operating at full
capacity would require source materials from about 2,000 hectares of rubber in
tapping. 1/
17. It is more likely for an estate of 1,000 hectares, if it decides to
undertake processing, to be making conventional RSS or ADS. Indeed the trend
is, increasingly, for smaller estates to sell field latex directly to buyers
rather than undertake any processing on their own. 2/
Data and Assumptions
18. In the specific example that will be used here, the hypothetical
estate is assumed to be established in 1979 on Jungle land; with the entire
area cleared and planted up with budded stumps in one phase. Tree immaturity
is taken as six years with tapping continuing for twenty--seven years.
19. The basic operating assumptions used are summarized in Table 2. The
tapping system for the first twenty years is half-spiral alternate daily,
which in notation form is S/2.d/2. 3/ Thereafter, a half-spiral upward tapping
system, tS/2, is employed with tapping fourth-daily, d/4, from years 21-23,
third-daily, d/3, from years 24-26, and alternate daily in the last year.
1/ Assuming an average annual yield of 1,500 kg/ha.
2/ Many big estate groups or agency houses have also rationalized theiroperations by centralizing processing in a few big plants. The limit tocentral processing is mainly set by distance and transportationfacilities.
3/ For more details on tapping systems see T.Y.Pee, Technical Innovations inNatural Rubber (forthcoming).
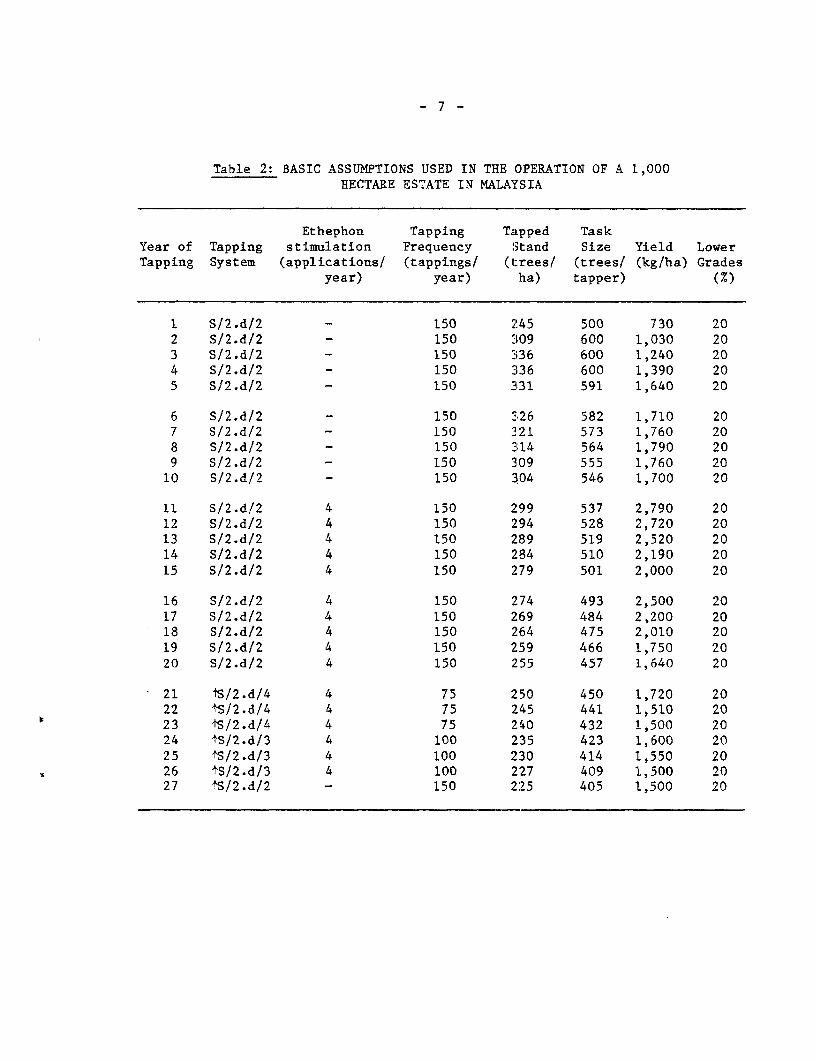
Table 2: BASIC ASSUMPTIONS USED IN THE OPERATION OF A 1,000HECTARE ESTATE IN MALAYSIA
Ethephon Tapping Tapped TaskYear of Tapping stimulation Frequency Stand Size Yield LowerTapping System (applications/ (tappings/ (trees/ (trees! (kg/ha) Grades
year) year) ha) tapper) (%)
1 S/2.d/2 - 150 245 500 730 202 S/2.d/2 - 150 309 600 1,030 203 S12.d/2 - 150 336 600 1,240 204 S/2.d/2 - 150 336 600 1,390 205 S/2.d/2 - 150 331 591 1,640 20
6 S/2.d/2 - 150 326 582 1,710 207 S/2.d/2 - 150 321 573 1,760 208 S/2.d/2 - 150 314 564 1,790 209 S/2.d/2 - 150 309 555 1,760 20
10 S/2.d/2 - 150 304 546 1,700 20
11 S/2.d/2 4 150 299 537 2,790 2012 S/2.d/2 4 150 294 528 2,720 2013 S/2.d/2 4 150 289 519 2,520 2014 S/2.d/2 4 150 284 510 2,190 2015 S/2.d/2 4 150 279 501 2,000 20
16 S/2.d/2 4 150 274 493 2,500 2017 S/2.d/2 4 150 269 484 2,200 2018 S/2.d/2 4 150 264 475 2,010 2019 S/2.d/2 4 150 259 466 1,750 2020 S/2.d/2 4 150 255 457 1,640 20
21 1S/2.d/4 4 75 250 450 1,720 2022 tS/2.d/4 4 75 245 441 1,510 2023 tS/2.d/4 4 75 240 432 1,500 2024 tS/2.d/3 4 100 235 423 1,600 2025 'S/2.d/3 4 100 230 414 1,550 2026 +S/2.d/3 4 100 227 409 1,500 2027 +S/2.d/2 - 150 225 405 1,500 20
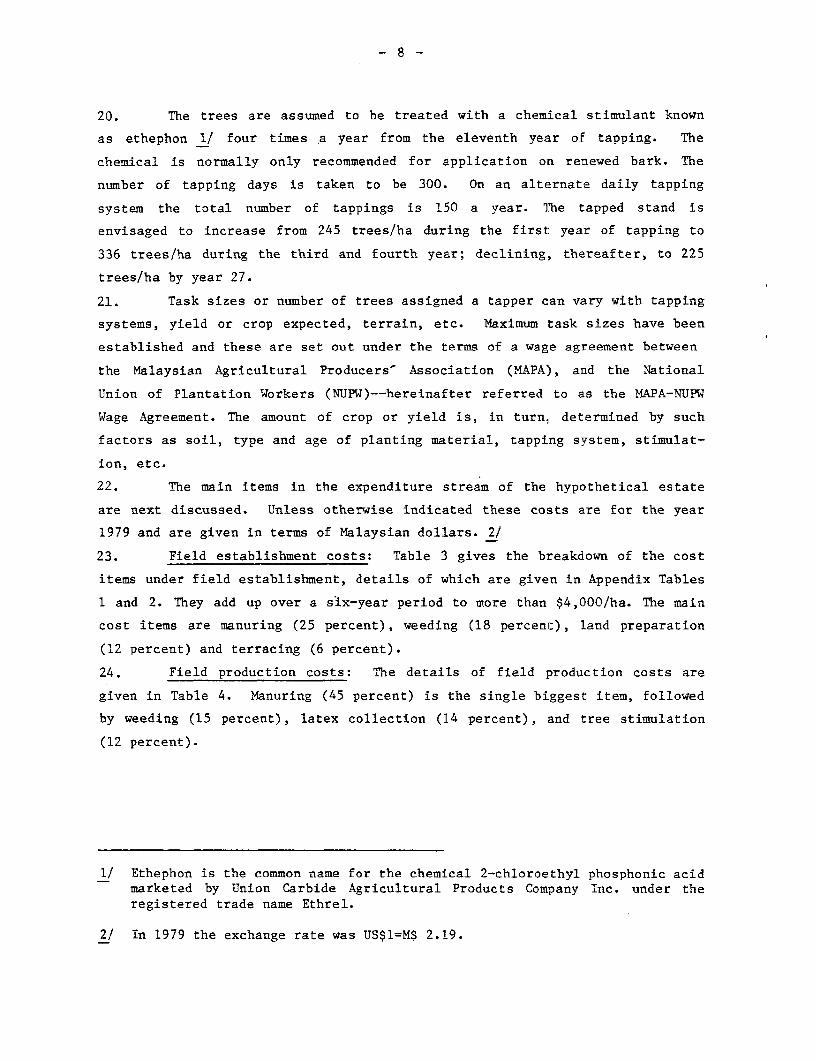
20. The trees are assumed to be treated with a chemical stimulant known
as ethephon 1/ four times a year from the eleventh year of tapping. The
chemical is normally only recommended for application on renewed bark. The
number of tapping days is taken to be 300. On an alternate daily tapping
system the total number of tappings is 150 a year. The tapped stand is
envisaged to increase from 245 trees/ha during the first year of tapping to
336 trees/ha during the third and fourth year; declining, thereafter, to 225
trees/ha by year 27.
21. Task sizes or number of trees assigned a tapper can vary with tapping
systems, yield or crop expected, terrain, etc. Maximum task sizes have been
established and these are set out under the terms of a wage agreement between
the Malaysian Agricultural Producers' Association (MAPA), and the National
Union of Plantation Workers (NUPW)--hereinafter referred to as the MAPA-NUPW
Wage Agreement. The amount of crop or yield is, in turn, determined by such
factors as soil, type and age of planting material, tapping system, stimulat-
ion, etc.
22. The main items in the expenditure stream of the hypothetical estate
are next discussed. Unless otherwise indicated these costs are for the year
1979 and are given in terms of Malaysian dollars. 2/
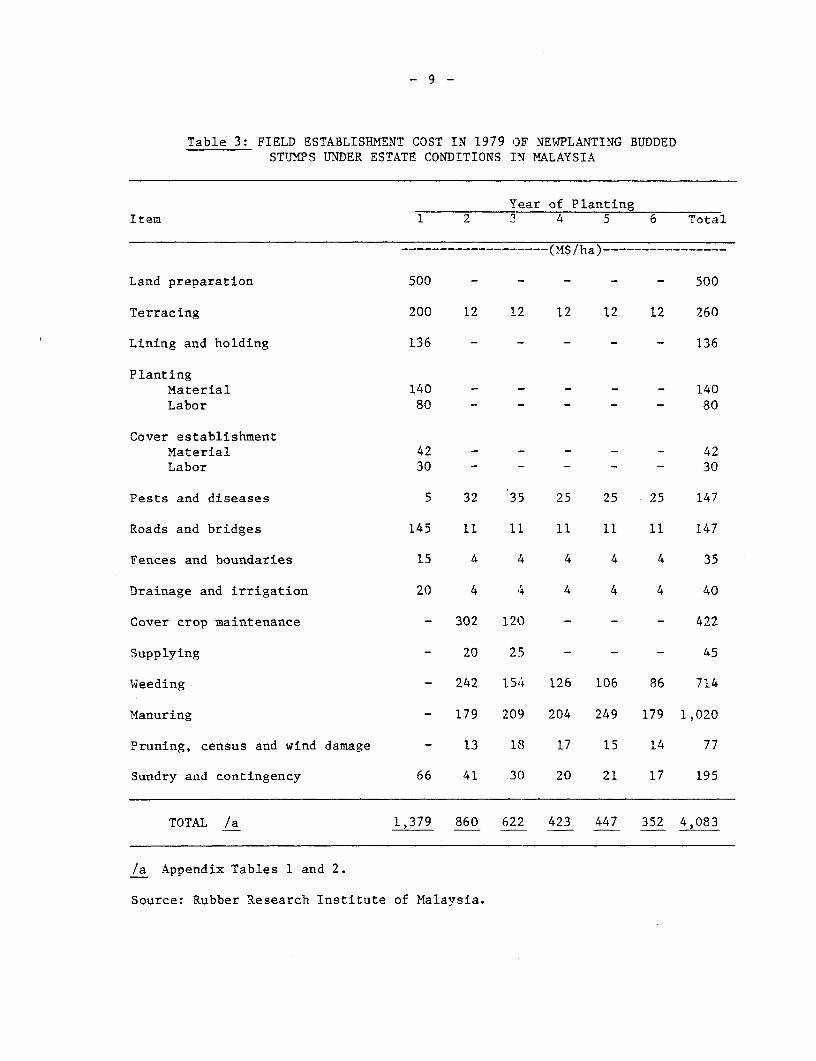
23. Field establishment costs: Table 3 gives the breakdown of the cost
items under field establishment, details of which are given in Appendix Tables
1 and 2. They add up over a six-year period to more than $4,000/ha. The main
cost items are manuring (25 percent), weeding (18 percent), land preparation
(12 percent) and terracing (6 percent).
24. Field production costs: The details of field production costs are
given in Table 4. Manuring (45 percent) is the single biggest item, followed
by weeding (15 percent), latex collection (14 percent), and tree stimulation
(12 percent).
1/ Ethephon is the common name for the chemical 2-chloroethyl phosphonic acidmarketed by Union Carbide Agricultural Products Company Inc. under theregistered trade name Ethrel.
2/ In 1979 the exchange rate was US$1=M$ 2.19.
- 9 -
Table 3: FIELD ESTABLISHMENT COST IN 1979 OF NEWPLANTING BUDDEDSTUMPS UNDER ESTATE CONDITIONS l:N MALAYSIA
Year of PlantingItem 1 2 3 4 5 6 Total
…( M----------------(}f$/ha)-----
Land preparation 500 - - - - - 500
Terracing 200 12 12 12 12 12 260
Lining and holding 136 - - - - - 136
PlantingMaterial 140 - - - - - 140Labor 80 - - - - - 80
Cover establishmentMaterial 42 - - - - - 42Labor 30 - - - - - 30
Pests and diseases 5 32 35 25 25 25 147
Roads and bridges 145 11 11 11 11 11 147
Fences and boundaries 15 4 4 4 4 4 35
Drainage and irrigation 20 4 4 4 4 4 40
Cover crop maintenance - 302 120 - - - 422
Supplying - 20 25 - - - 45
Weeding - 242 154 126 106 86 714
Manuring - 179 209 204 249 179 1,020
Pruning, census and wind damage - 13 18 17 15 14 77
Sundry and contingency 66 41 30 20 21 17 195
TOTAL /a 1,379 860 622 423 447 352 4,083
/a Appendix Tables 1 and 2.
Source: Rubber Research Institute of Malaysia.
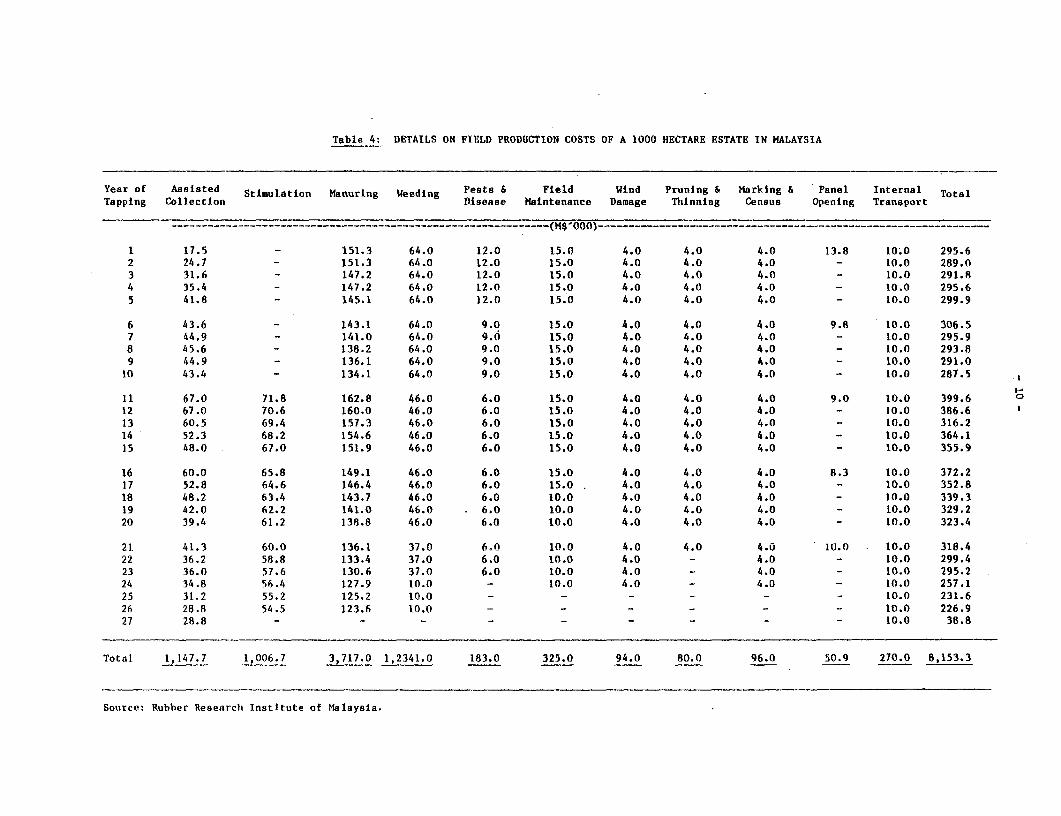
Table 4: DETAILS ON FIELD PRODUCTION COSTS OF A 1000 HECTARE ESTATE IN MALAYSIA
Year of Asslsted Stimulation Manuring Weeding Pests 6 Field Wind Pruning & Marking b Panel Internal TotalTapping Collection Disease Maintenance Damage Thinning Census Opening Transport
--------------------------------------------------------------…(M$ 000)----------------------------------------------------------------
1 17.5 - 151.3 64.0 12.0 15.0 4.0 4.0 4.0 13.8 10.0 295.62 24.7 - 151.3 64.0 12.0 15.0 4.0 4.0 4.0 - 10.0 289.03 31.6 - 147.2 64.0 12.0 15.0 4.0 4.0 4.0 - 10.0 291.84 35.4 - 147.2 64.0 12.0 15.0 4.0 4.0 4.0 - 10.0 295.65 41.8 - 145.1 64.0 12.0 15.0 4.0 4.0 4.0 - 10.0 299.9
6 43.6 - 143.1 64.0 9.0 15.0 4.0 4.0 4.0 9.8 10.0 306.57 44.9 - 141.0 64.0 9.0 15.0 4.0 4.0 4.0 - 10.0 295.98 45.6 - 138.2 64.0 9.0 15.0 4.0 4.0 4.0 - 10.0 293.89 44.9 - 136.1 64.0 9.0 15.0 4.0 4.0 4.0 - 10.0 291.010 43.4 - 134.1 64.0 9.0 15.0 4.0 4.0 4.0 - 10.0 287.5
11 67.0 71.8 162.8 46.0 6.0 15.0 4.0 4.0 4.0 9.0 10.0 399.6 012 67.0 70.6 160.0 46.0 6.0 15.0 4.0 4.0 4.0 - 10.0 386.613 60.5 69.4 157.3 46.0 6.0 15.0 4.0 4.0 4.0 - 10.0 316.214 52.3 68.2 154.6 46.0 6.0 15.0 4.0 4.0 4.0 - 10.0 364.115 48.0 67.0 151.9 46.0 6.0 15.0 4.0 4.0 4.0 - 10.0 355.9
16 60.0 65.8 149.1 46.0 6.0 15.0 4.0 4.0 4.0 8.3 10.0 372.217 52.8 64.6 146.4 46.0 6.0 15.0 4.0 4.0 4.0 - 10.0 352.818 48.2 63.4 143.7 46.0 6.0 10.0 4.0 4.0 4.0 - 10.0 339.319 42.0 62.2 141.0 46.0 6.0 10.0 4.0 4.0 4.0 - 10.0 329.220 39.4 61.2 138.8 46.0 6.0 10.0 4.0 4.0 4.0 - 10.0 323.4
21 41.3 60.0 136.1 37.0 6.0 10.0 4.0 4.0 4.0 10.0 10.0 318.422 36.2 58.8 133.4 37.0 6.0 10.0 4.0 - 4.0 - 10.0 299.423 36.0 57.6 130.6 37.0 6.0 10.0 4.0 - 4.0 - 10.0 295.224 34.8 56.4 127.9 10.0 - 10.0 4.0 - 4.0 - 10.0 257.125 31.2 55.2 125.2 10.0 - - - - - - 10.0 231.6
26 28.8 54.5 123.6 10.0 - - - - - - 10.0 226.927 28.8 - - - - - - - - - 10.0 38.8
Total 1,147.7 1,006.7 3,717.0 1,2341.0 183.0 325.0 94.0 80.0 96.0 50.9 270.0 8,153.3
Source: Rubber Researchi Institute of Malaysia.
- 11 -
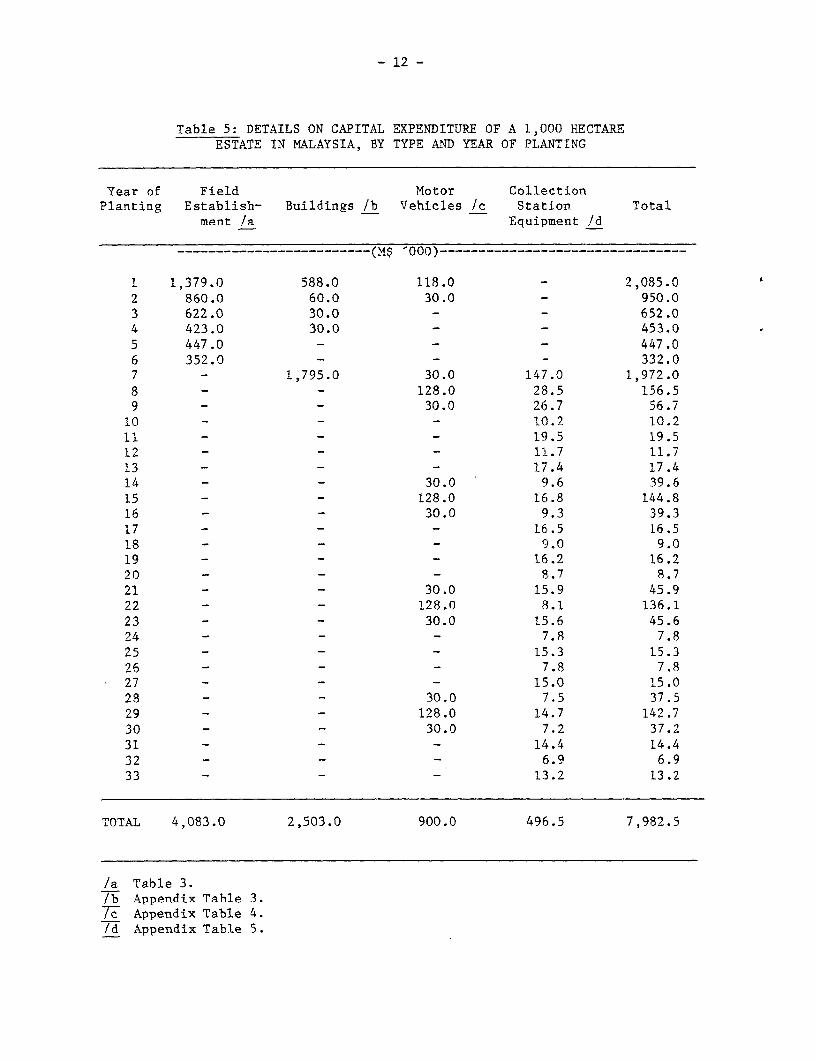
25. Capital investments: Aside from the factory, which is treated
separately, the main items of capital expenditure are for field establishment
(51 percent), buildings (31 percent), and motor veahicles (11 percent), Table
5. Details on the type and number of buildings, vehicles, latex collection
equipment, etc. can be found in Appendices 3-5.
26. Management: The salaries of the estate manager, field conductors,
field supervisors, office staff and agency fees are the main items of manage-
ment cost, Table 6. Staff transport, office expenses and maintenance of staff
buildings make up the rest.
27. Other overheads: The two principal cost items under other overheads
are for transportation (34 percent) and land taxes, quit rent and an item
known as education rate (making up in toto another 34 percent), Table 7.
28. Tapping costs: In Malaysia the payment received by tappers on
estates generally include features of both time and piece rate systems. Des-
pite some variations in non-MAPA estates, the system of payment is basically
patterned after the MAPA-NUPW Wage Agreement.
29. Under the latest (1979) Agreement, a tapper will receive on top of a
basic wage, a price bonus (which is linked to the RSS 1 price) and an incen
tive payment for latex above the basic poundage rate, 1/ details of which are
given later in Table 8.
30. The agreement also provides fringe benefits such as number of paid
holidays, vacation leave, rest days, overtime pay, sick pay, housing allow-
ance, etc. These benefits have been quantified and expressed in terms of
dollars per worker per year, Table 9.
1/ This is the minimum quantity of latex a tapper is required to bring in toqualify for incentive payment.
- 12 -
Table 5: DETAILS ON CAPITAL EXPENDITURE OF A 1,000 HECTAREESTATE IN MALAYSIA, BY TYPE AND YEAR OF PLANTING
Year of Field Motor CollectionPlanting Establish- Buildings /b Vehicles /c Station Total
ment Ja Equipment Id
-------------------------(M$ 000)--------------------------------
1 1,379.0 588.0 118.0 - 2,085.02 860.0 60.0 30.0 - 950.03 622.0 30.0 - - 652.04 423.0 30.0 - 453.05 447.0 - - 447.06 352.0 - - 332.0
7 - 1,795.0 30.0 147.0 1,972.08 - - 128.0 28.5 156.59 - - 30.0 26.7 56.7
10 - - - 10.2 10.2
11 - - - 19.5 19.5
12 - - - 11.7 11.7
13 - - - 17.4 17.414 - - 30.0 9.6 39.615 - - 128.0 16.8 144.816 - - 30.0 9.3 39.317 - - - 16.5 16.5
18 - - - 9.0 9.019 - - - 16.2 16.2
20 - - - 8.7 8.7
21 - - 30.0 15.9 45.922 - - 128.0 8.1 136.1
23 - - 30.0 15.6 45.624 - - - 7.8 7.8
25 - - - 15.3 15.326 - - - 7.8 7.827 - - - 15.0 15.0
28 - - 30.0 7.5 37.529 - - 128.0 14.7 142.730 - - 30.0 7.2 37.231 - - - 14.4 14.4
32 - - - 6.9 6.933 - - - 13.2 13.2
TOTAL 4,083.0 2,503.0 900.0 496.5 7,982.5
/a Table 3./b Appendix Table 3.7& Appendix Table 4./d Appendix Table 5.
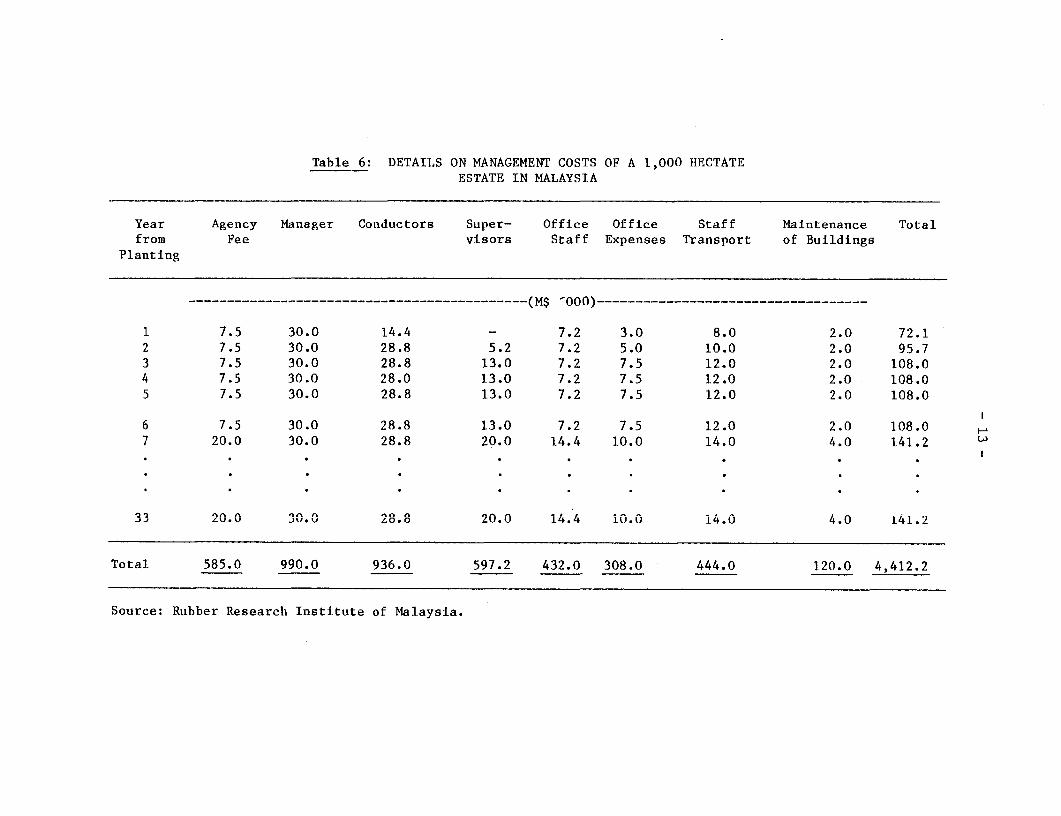
Table 6: DETAILS ON MANAGEMENT COSTS OF A 1,000 HECTATEESTATE IN MALAYSIA
Year Agency Manager Conductors Super- Office Office Staff Maintenance Totalfrom Fee visors Staff Expenses Transport of Buildings
Planting
…-------------------------------------------(M$ -000)…------------------------
1 7.5 30.0 14.4 - 7.2 3.0 8.0 2.0 72.12 7.5 30.0 28.8 5.2 7.2 5.0 10.0 2.0 95.73 7.5 30.0 28.8 13.0 7.2 7.5 12.0 2.0 108.04 7.5 30.0 28.0 13.0 7.2 7.5 12.0 2.0 108.05 7.5 30.0 28.8 13.0 7.2 7.5 12.0 2.0 108.0
6 7.5 30.0 28.8 13.0 7.2 7.5 12.0 2.0 108.07 20.0 30.0 28.8 20.0 14.4 10.0 14.0 4.0 141.2
33 20.0 30.0 28.8 20.0 14.4 10.0 14.0 4.0 141.2
Total 585.0 990.0 936.0 597.2 432.0 308.0 444.0 120.0 4,412.2
Source: Rubber Researclh Institute of Malaysia.
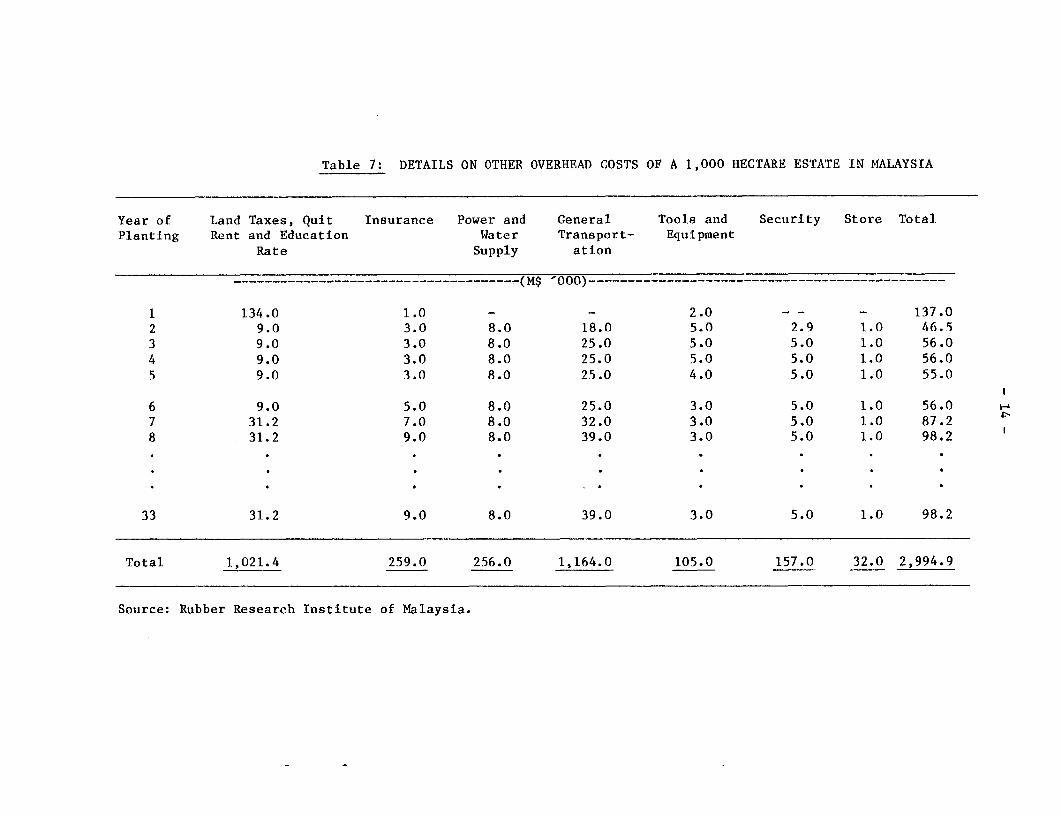
Table 7: DETAILS ON OTHER OVERHEAD COSTS OF A 1,000 HECTARE ESTATE IN MALAYSIA
Year of Land Taxes, Quit Insurance Power and General Tools and Security Store Total.Planting Rent and Education Water Transport- Equipment
Rate Supply ation
…-----------------------------------(Ms 000) --- …__--__________________
1 134.0 1.0 - - 2.0 - - - 137.02 9.0 3.0 8.0 18.0 5.0 2.9 1.0 46.53 9.0 3.0 8.0 25.0 5.0 5.0 1.0 56.04 9.0 3.0 8.0 25.0 5.0 5.0 1.0 56.05 9.0 3.0 8.0 25.0 4.0 5.0 1.0 55.0
6 9.0 5.0 8.0 25.0 3.0 5.0 1.0 56.07 31.2 7.0 8.0 32.0 3.0 5.0 1.0 87.28 31.2 9.0 8.0 39.0 3.0 5.0 1.0 98.2
33 31.2 9.0 8.0 39.0 3.0 5.0 1.0 98.2
Total 1,021.4 259.0 256.0 1,164.0 105.0 157.0 32.0 2,994.9
Source: Rubber Research Institute of Malaysia.
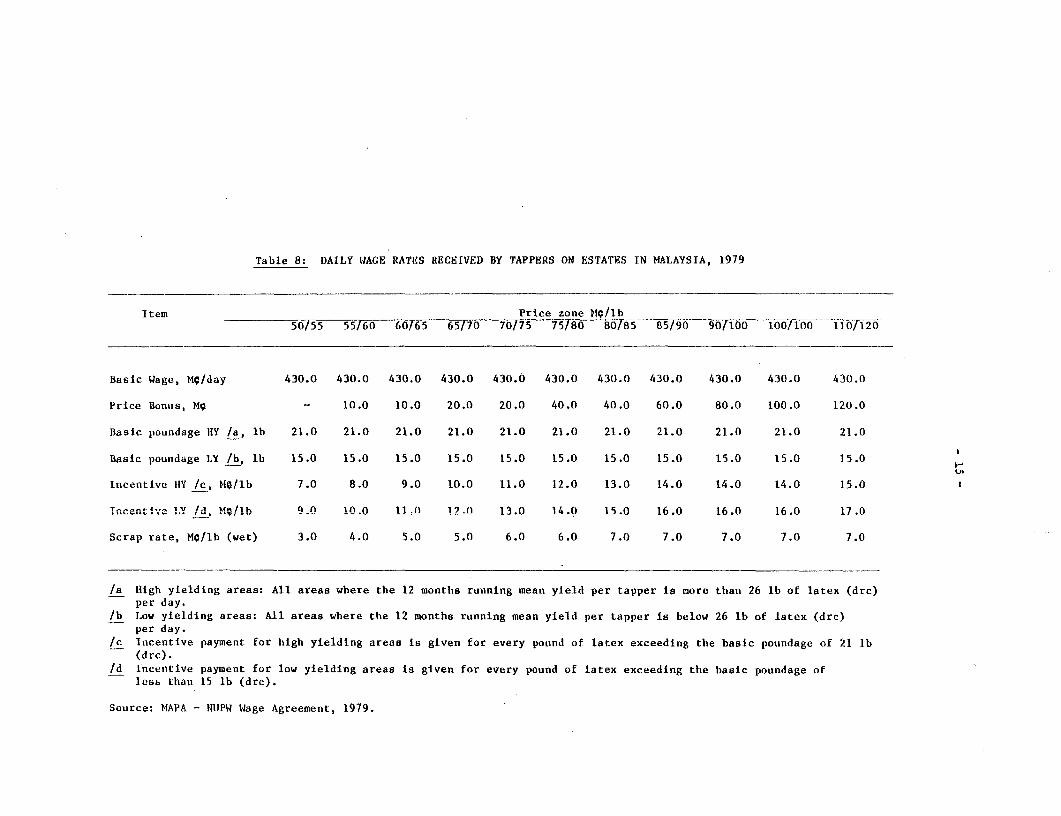
Table 8: DAILY WAGE RATES RECEIVED BY TAPPERS ON ESTATES IN MALAYSIA, 1979
Item Price zone Mi/lb50/55 55/60 60/65 65/70 70/75 75/80 80185 85 /90 9-0/T1 100f100 - 11-0/- i
Basic Wage, MO/day 430.0 430.0 430.0 430.0 430.0 430.0 430.0 430.0 430.0 430.0 430.0
Price Bonus, Mg - 10.0 10.0 20.0 20.0 40.0 40.0 60.0 80.0 100.0 120.0
Basic poundage IIY /a, lb 21.0 21.0 21.0 21.0 21.0 21.0 21.0 21.0 21.0 21.0 21.0
Basic poundage .Y /b, lb 15.0 15.0 15.0 15.0 15.0 15.0 15.0 15.0 15.0 15.0 15.0 H
Incentive IIY /c, Mg/lb 7.0 8.0 9.0 10.0 11.0 12.0 13.0 14.0 14.0 14.0 15.0
Ineeative ILY IA, MQ/lb 9.0 10w 0 lloO 12~ Q l.0 14.0 15.0 16.0 16.0 16.0 17.0
Scrap rate, M;/lb (wet) 3.0 4.0 5.0 5.0 6.0 6.0 7.0 7.o 7.0 7.0 7.0
/a High yielding areas: All areas wbere the 12 months running mean yleld per tapper is more than 26 lb of latex (drc)per day.
/b l.ow yielding areas: A-ll areas where the 12 monthis running mean yield per tapper is below 26 lb of latex (drc)per day.
/c Incentive payment for hiigh yielding areas is given for every pouint1 of latex exceeding the basic pouindage of 21 lb(drc).
/d fncentive payment for low yielding areas is given for every pound of latex exceeding the basic poundage ofless uthat1 15 lb (drc).
Source: 1APA - NUPW Wage Agreement, 1979.
- 16 -
Table 9: FRINGE BENEFITS PAID TO ESTATE WORKERSIN MALAYSIA, 1979
Item Type of WorkersTapper Field and Sundry
------ (M$/worker/year)-----
Employees' Provident Fund 210 137Holiday pay 210 137Medical 40 40Sick pay 60 39Maternity allowance 23 23Welfare 47 47Housing maintenance 20 20Special Relief Allowance 345 345
Total 955 788
Source: Based on MAPA-NUPW Agreement, 1979.
Processing
31. A principal objective of this study is to estimate supply prices of
other types of rubber, i.e. RSS, ADS and field latex, apart from SMR or block
rubber. It is assumed that the hypothetical estate can make any one of the
following products: block rubbers (SMR CV and SMR 20), smoked sheets (RSS 1)
and air dried sheets (ADS). Alternatively, it can simply sell field latex if
it chooses not to undetake any processing on its own. Field grade or scrap
rubber, constituting some 20 percent of the total crop, can be processed into
SMR 20 if the estate has a block rubber factory. In the absence of a block
rubber factory, scrap rubber will have to be disposed of separately; it can be
sold to a rubber dealer, a remiller or an estate with a block rubber factory.
32. It was earlier mentioned that to be commercially viable a block
rubber plant should have a minimum throughput of 10 tons a day, which is about
twice the amount of rubber that the hypothetical estate of 1,000 hectares can
provide. The block rubber factory is, therefore, independent of the estate. To
ensure comparability in processing cost, with a 10-ton block rubber plant, the
capacity of the sheet factory and the ADS factory is also based on a daily
throughput of 10 tons. Processing of the rubber on the estate is assumed to
commence in the eighth year. During the first two years of tapping the crop
is sold as field latex since the total amount of crop available would not
normally warrant the setting up of a factory.
- 17 -
33. The estimated initial capital expenditures (not including replacement
for equipment) for a 10-ton block rubber factory that can make SMR CV and SMR
20 are given in Table 10. Table 11 details the capital expenditures for a
similar sized RSS/ADS factory. The equipment required for making RSS and ADS
are basically similar. The main difference between RSS and ADS production is
in the drying process. Instead of curing rubber sheets in smoke houses to pro-
duce RSS, ADS is produced by curing and drying sheets in air drying tunnels.
34. It will be seen from Tables 10 and 11 that the establishment costs of
a 10-ton block rubber factory, M$1,065,750, are lower than the corresponding
costs of either a RSS factory, M$1,131,060, or an ADS factory, M$1,288,560,
capable of producing the same throughput. However, if costs of replacements
are included (see Appendix Table 6), the total investment costs of the block
rubber factory will amount to M$1,967,700 as compared to M$1,259,160 and
M$1,416,660 for the RSS and ADS factories, respectively.
35. The simplest way of disposing the daily rubber crop is for the estate
to sell field latex. There is hardly any capital investment required of the
estate as latex bulking/storage tanks are normally supplied by the buyers, as
are latex preservatives. The only cost incurred by the estate is on labor for
handling the crop.
36. The processing/handling cost of different types of rubber are pre-
sented in Table 12. Of the three types of dry rubber considered, processing
cost for SMR is the highest while that for RSS is the lowest.
37. Table 13 gives the average premiums/discounts for SMR CV, SMR 20, ADS
and field latex over RSS I in 1976/79.
38. To estimate supply prices the yield and expenditure streams over the
entire economic life of the hypothetical estate are determined at three
assumed real discount rates and brought together in Table 14. The calculation
of supply prices is complicated by the fact that most producing countries
impose a duty on rubber exports. In Malaysia, the export duty on rubber is
levied on a sliding scale above a gazetted price determined on the basis of
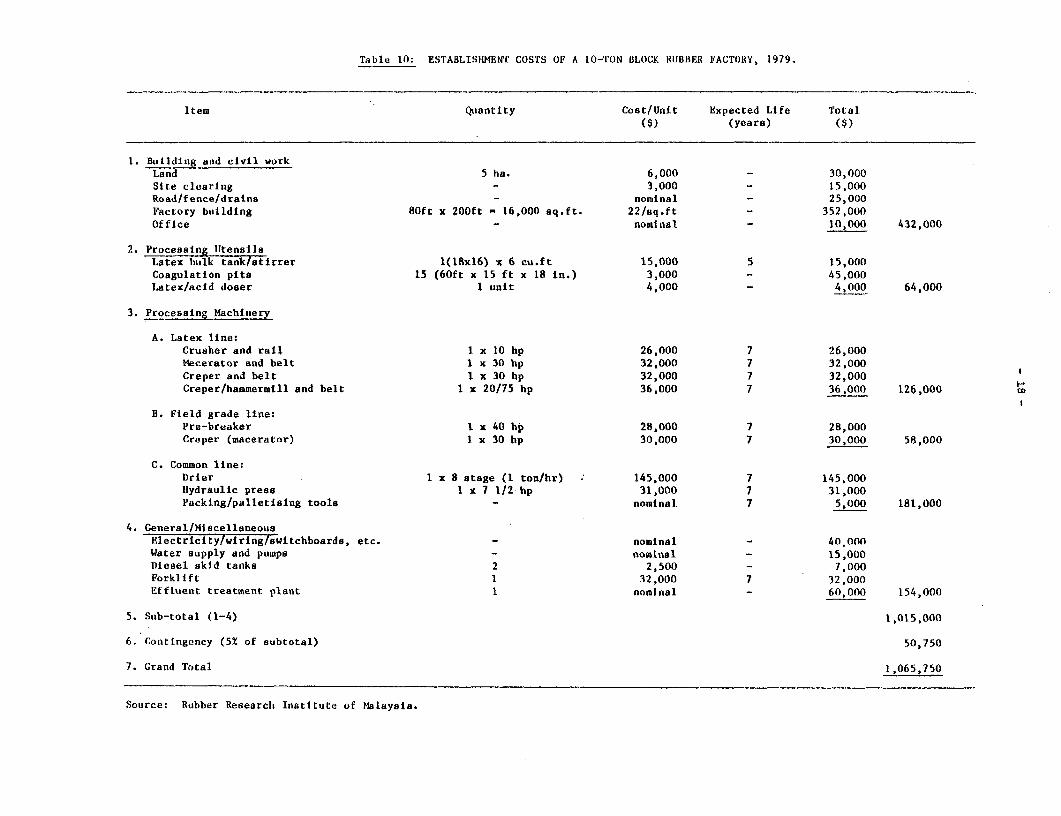
Table 10; ESTABLISIHMENr COSTS OF A 10-TON BLOCK RUBBER FACTORY, 1979.
Item Quantity Cost/Unit Expected Life Total($) (years) ($)
1. Building and civil workLand 5 ha. 6,000 - 30,000Site clearing 3,000 - 15,000Road/fence/drains nominal - 25,000Factory building 80ft x 200ft - 16,000 sq.ft. 22/sq.ft - 352,000Office nominal - 10,000 432,000
2. Processing UtensilsLatex hulk tankt8tirrer l(18x16) x 6 cu.ft 15,000 5 15,000Coagulation pits 15 (60ft x 15 ft x 18 in.) 3,000 - 45,000Latex/acid doser 1 unit 4,000 - 4,000 64,000
3. Processing Machinery
A. Latex line:Crumsher and rail I x 10 hp 26,000 7 26,000Mecerator and belt 1 x 30 hp 32,000 7 32,000Creper and belt 1 x 30 hp 32,000 7 32,000Creper/hammermill and belt 1 x 20/75 hp 36,000 7 36,000 126,000
B. Field grade line:Pre-breaker l x 40 hp 28,000 7 28,000Creper (macerator) I x 30 hp 30,000 7 30,000 58,000
C. Common line:Drier 1 x 8 stage (1 ton/hr) : 145,000 7 145,000Hlydraulic press I x 7 1/2 hp 31,000 7 31,000Packing/palletiaing tools - nominal 7 5,000 181,000
4. General/MiscellaneousElectricity/wiring/switchboards, etc. nominal - 40,000Water supply and pumps - nominal - 15,000Diesel skid tanks 2 2,500 - 7,000Forklift 1 32,000 7 32,000Effluent treatment plant I nominal - 60,000 154,000
5. Sub-total (1-4) 1,015,000
6. Contingency (5t of subtotal) 50,750
7. Grand Total 1,065,750
Source: Rubber Research Institute of Malaysia.
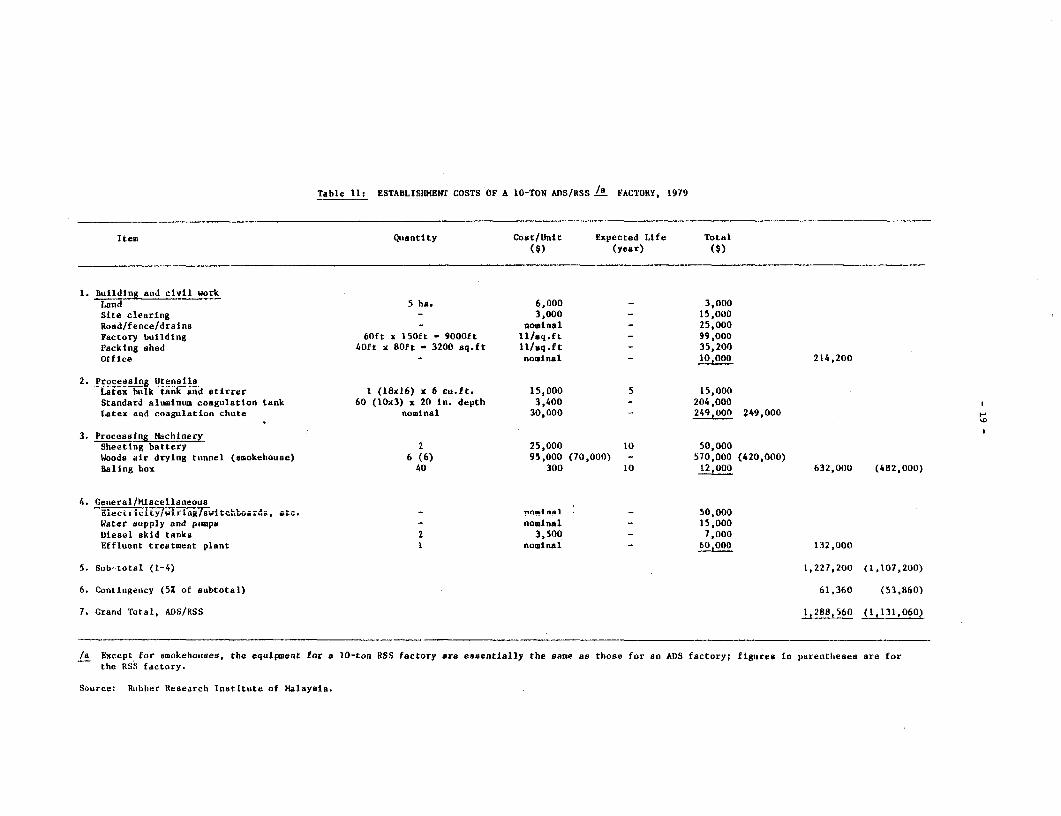
Table 11: ESTABLtSHMENT COSTS OF A 10-TON ADS/RSS /. FACTORY, 1979
Item Quantity Cost/unit Expected Life Total($) (year) ($)
1. Building and civil workLand 5 ha. 6,000 - 3,000Site clearing 3,000 - 15,000Road/fence/drains nominal - 25,000Factory builditng 60ft x 150ft - 9000ft 11/sq.ft - 99,000Packing shed 40ft x 80ft - 3200 sq.ft ll/aq.ft - 35,200Office nominal - 10,000 214,200
2. Processing UtensilsLatex bulk tank and stirrer I (18x16) x 6 cu.ft. 15,000 5 15,000Standard aluminum coagulation tank 60 (lOx3) x 20 in. depth 3,400 - 204,000Latex and coagulation chute nominal 30,000 - 249,000 249,000 F
3. Processlng MachilnerySheeting battery 2 25,000 10 50,000Woods air drying ttnnel (smokehouse) 6 (6) 95,000 (70,000) - 570,000 (420,000)Baling box 40 300 10 12,000 632,000 (482,000)
4. General/MiscellaneousEc cy r s;u d etc. - roegal"1 - 50.000
Water supply and pumps nominal - 15,000Diesel skid tanks 2 3,500 - 7,000Effluent treatment plant I nominal - 0tOOO 132,000
5. Sub-total (1-4) 1,227,200 (1,107,200)
6. Contingency (5% of subtotal) 61,360 (53,860)
7. Grand Total, ADS/RSS 1,288,560 (1,131,060)
/a Except for smokehouses, the equlpment for a 10-ton RSS factory are essentially the same as those for an ADS factory; figures in parentlieses are forthe RSS factory.
Source: Rubber Research Institute of Malaysia.
- 20 -
Table 12: PROCESSING/HANDLING COSTS OF VARIOUSTYPES OF RUBBER IN 1979
Processing Cost Handling CostRSS ADS SMR CV SMR 20 Field Field
latex scrap
------------- …(Mg/kg)…----------------------
Supervision 1.5 1.5 3.0 3.0 0.2 0.1Labor 4.0 4.0 4.0 4.2 1.0 0.5Fuel and electricity 1.8 5.5 3.5 4.0 0.1 -Chemicals 1.7 1.7 2.0 0.3 0.8 0.1Water 0.1 0.1 0.2 0.2 - -Packing materials 0.2 0.2 3.3 3.3. - -Factory and machinery
upkeep 1.1 1.1 2.0 2.0 - -Testing - - 1.5 1.5 - -
------------------------------. _------------------
Total cost 10.4 14.1 19.5 18.5 2.1 0.7
Average cost _a 8.3 11.3 15.6 3.7 1.7 0.1
/a Assuming 80% of total crop comprises latex and 20% lower grades or scrap.
Table 13: PRICE PREMIUMS/DISCOUNTS FOR VARIOUS RUBBERPRODUCTS AND FIELD LATEK OVER RSS 1 IN 1976/79 /a
Product type Premium/Discount(MC/kg)
SMR CV + 13.66SMR 20 - 11.61ADS + 8.52Field latex - 12.00Field scrap /b - 34.00SMR CV + SMR 20 /c 8.61ADS + scrap 0.02RSS + scrap - 6.80Field latex + scrap - 16.40
/a Appendix Table 8.7Wb Assuming 20% of crop is field scrap (tree lace and cup lumps).Ic Made from scrap material.
- 21 -
Table 14: TOTAL AND UNIT DISCOUNTED,VALU`ES OP PRODUCTION AND llPENDITURE OF A 1,000 RECTAREESTATE AT VARIOUS REAL DISCOUNT RAThS
Item Total Cost (MS '000) at vsrlous discount rates Unit Cost (!NC/kg) at various discount ra:es0x 4 ' 8% 10% 12: 0% 4% 8% 10 7
Production (Tons) 47,950.0 22,427.1 11,550.3 8,552.6 6,450.1 - - - - -
Capital Investment:Field establishment /a 4,083.0 3,68l.2 3,344.9i 3,196.9 3,060.4 8.5 16.4 29.0 37.4 .7.4Other Capital investment /b 3,899.5 2,845.7 2,222.0 1,997.6 1,811.9 8.1 12.7 19.2 23.4 '8.1
Investment on factory: tcRSS 1,259.2 890.1 643.8 551.4 474.2 2.6 4.0 5.6 6.4 7.4ADS 1,416.7 1,005.2 728.9 624.9 537.8 3.0 4.5 6.3 7.3 8.3SlR 1,967.7 1,220.2 801.6 661.2 550.7 4.1 5.4 6.9 7.7 8.5
Managesent /d 4,412.2 2,342.5 1,428.5 1,163.8 970.4 9.2 10.4 12.4 13.6 15.0
Other overheads /e 2,994.9 1,596.5 982.7 806.0 677.5 6.2 7.1 8.5 9.4 10.5
Fringe benefits If 7,335.1 3,520.6 1,891.0 1,436.1 1,112.1 15.3 15.7 16.4 16.8 17.3
Field production LS 8,213.3 3,987.0 2,136.4 1,614.6 1,243.0 17.1 17.8 18.5 18.9 L9.3
F.o.b. charges /h 2,877.0 1,345.6 693.0 513.2 387.0 6.0 6.0 6.0 6.0 6.0
Research cess /i 1,057.1 494.4 254.6 188.6 142.2 2.2 2.2 2.2 2.2 2.2
Product price differential: ,Field latex 6 scrap 1,863.8 3,678.0 1,894.2 1,402.6 1,057.8 16.4 16.4 16.4 16.4 L6.4?SS and scrap 3,260.6 1,525.0 785.4 581.6 438.6 6.8 6.8 6.8 6.8 6.8ADS and scrap 9.6 4.5 2.3 1.7 1.3 - - - - -SMR 5CV and SMR 20 4,123.7 1,928.7 993.3 735.5 554.7 -8.6 -8.6 -8.6 -8.6 -8.6
?rocessing/Randling cost: /kField latex and scrap 863.1 403.7 27.9 153.9 116.1 1.8 1.8 1.8 1.8 1.8RSS and scrap 4,027.8 1,883.9 970.2 718.4 541.8 8.4 8.4 8.4 8.4 8.4ADS and scrap 5,466.3 2,556.7 1,316.7 975.0 735.3 11.4 11.4 11.4 11.4 11.4S7m 5CV and SlR 20 9,254.4 4,320.4 2,229.2 1,650.7 1,244.9 19.3 19.3 19.3 19.3' L9.3
Tapping cost at various pric. zones /1
35/40 9/lb 10.951.0 5,306.9 2,844.1 2,149.5 1,654.6 22.8 23.7 24.6 25.1 25.740/45 8/lb 11,596.5 5,609.8 3,001.0 2,266.2 1,743.0 24.2 25.0 26.0 26.5 27.045/50 O/lb 12,038.9 5,812.6 3,103.4 2,341.3 1,799.2 25.1 25.9 26.9 27.4 .17.950/55 C/lb 12,887.5 6,215.5 3,314.8 2,499.5 1,919.8 26.9 27.7 28.7 29.2 :29.855/60 OLlb 13,885.4 6,683.2 3.556.6 2.679.0 2,055.6 29.0 29.8 30.8 31.3 31.9
60/65 9/lb 14,680.1 7,050.9 3,743.9 2,817.0 2,159.2 30.6 31.4 32.4 32.9 33.565/70 0/lb 15,325.6 7,353.8 3,900.8 2,933.6 2,247.5 32.0 32.8 33.8 34.3 34.870/75 C/lb 16,120.4 7,721.4 4,088.0 3,071.6 2,351.1 33.6 34.4 35.4 35.9 36.575/80 e/lb 16,969.0 8,124.4 4,299.4 3,299.8 2,471.7 35.4 36.2 37.2 38.6 38.380/85 9/lb 17,763.7 8,492.0 4,486.7 3,367.8 2,575.3 37.0 37.9 38.8 39.4 39.9
85/90 9/lb 18,612.3 8,894.9 4,698.1 3,525.9 2,695.9 38.8 39.7 40.7 41.2 .1.S90/100 e/li 19,018.6 9,095.0 4,807.1 3,609.0 2,760.3 39.7 40.6 41.6 42.2 ;2.8100/110 9llb 19,424.9 9,295.0 4,916.1 3,692.0 2,824.7 40.5 41.4 42.6 43.2 S3.8110/120 9/lb 20,273.4 9,697.9 5,127.5 3,850.1 2,945.2 42.3 43.2 44.4 45.0 i5.7120/130 C/lb 20,679.6 9,898.0 5,236.5 3,933.2 3,009.6 43.1 44.1 45.3 46.0 ;6.7
130/140 9/lb 21,085.9 10,098.0 5,345.5 4,016.2 3,074.0 44.0 45.0 46.3 47.0 S7.7140/150 8/lb 21,492.0 10,298.1 5,454.5 4,099.2 3,138.4 44.8 45.9 47.2 47.9 48.7150/160 9/lb 21,898.2 10,498.1 5,563.5 4,182.2 3,202.8 45.7 46.8 48.2 48.9 19.7160/170 9/lb 22,304.5 10,698.2 5,672.5 4,265.2 3,267.1 46.5 47.7 49.1 49.9 50.7170/180 9/lb 22,710.7 10,898.2 5,781.5 4,348.3 3,331.5 47.4 48.6 50.1 50.8 51.7
/a See Table 3. /e See Table 7. /i At 1.0Me/lb or 2.2MB/kg.79 See Table 5. 7T See Table 9. T See Appendix Table 8.7- See Appendii Table 6. 7i se Table 4. 7E See Table 12.7-' See Table 6. 7ih Aae,md at 6.ONS/kg. 71 See Table 8.
- 22 -
the RSS 1 f.o.b. daily price. 1/ Additionally, the wages paid to tappers on
rubber estates in Malaysia are also linked to the RSS 1 market quotation (see
Table 8).
39. This means that an iterative procedure will have to be used. To
calculate tapping wages and the rubber export duty, it is necessary, as a
first approximation, to make an educated guess about the final full supply
price. The closer the guesstimate is to the full supply price, the fewer
iterations that are necessary. When the full supply price falls in the price
zone used to calculate tapping wages, no further iteration is required. This
is the final full supply price.
40. It was indicated earlier that, traditionally, market quotations are
in terms of RSS 1. World Bank price projections are also for RSS 1. It
would, therefore, be desirable to express all supply prices in terms of the
market quotation for RSS 1 by the use of appropriate price differentials
(premiums/discounts) between the RSS 1 price and the prices of other rubber
products considered here.
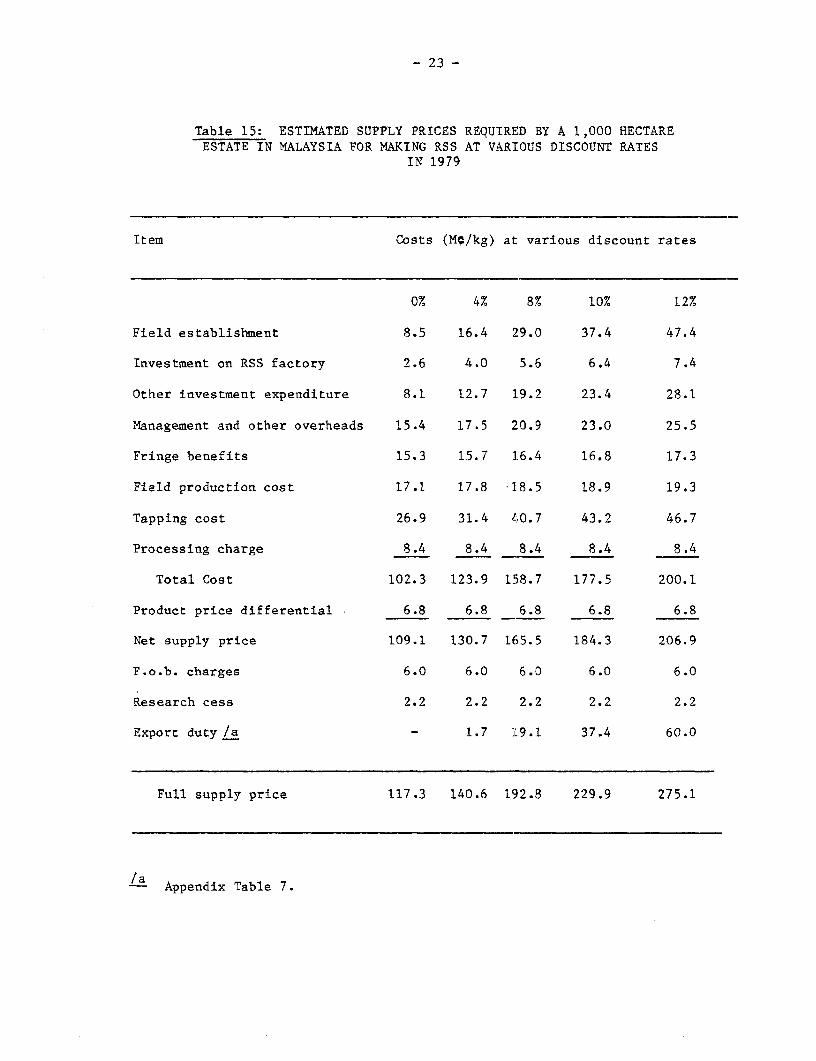
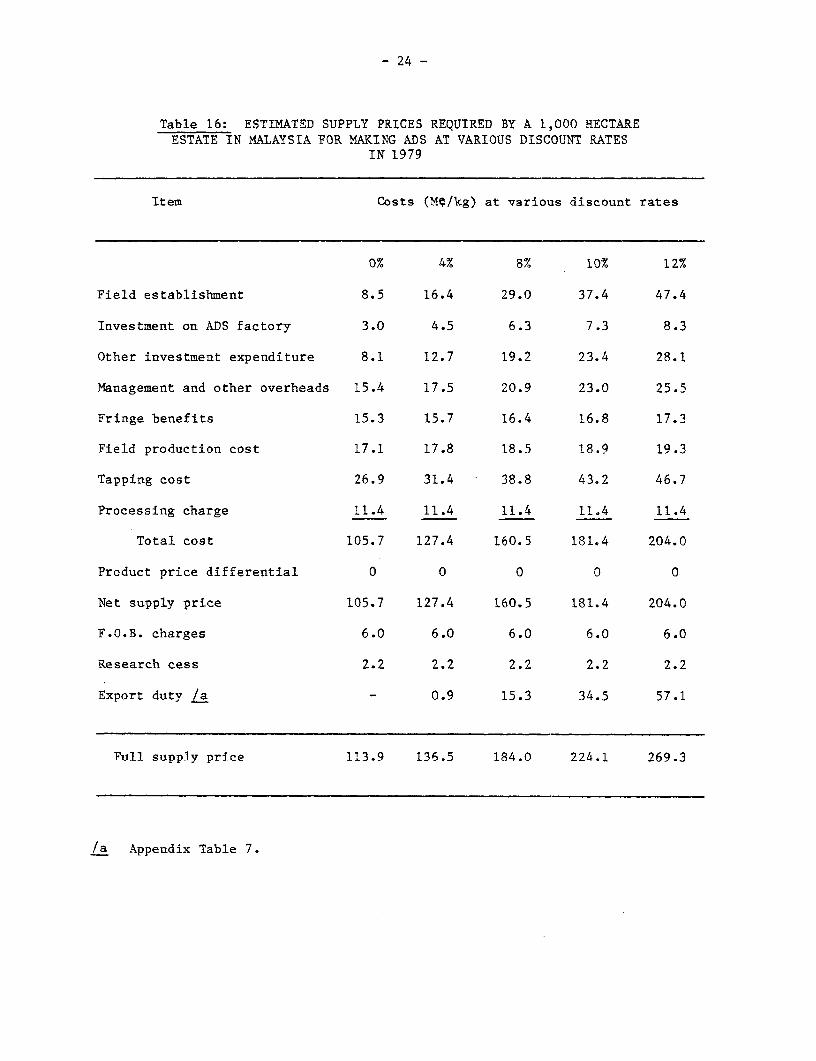
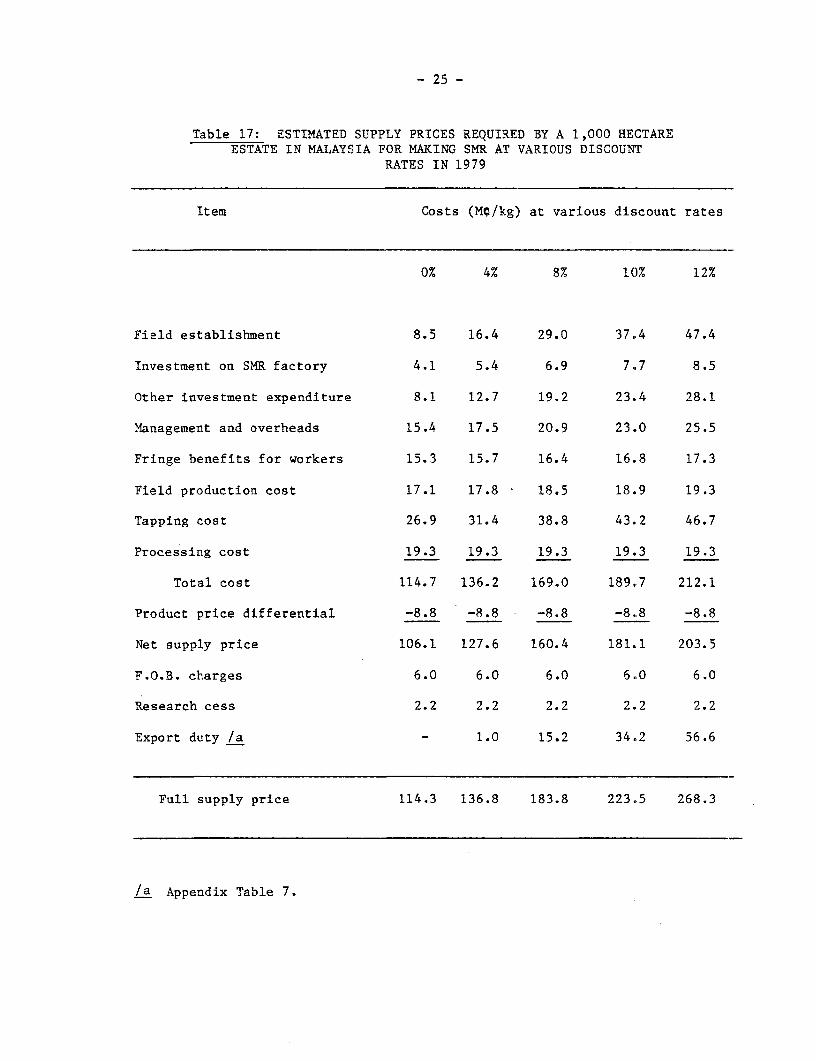
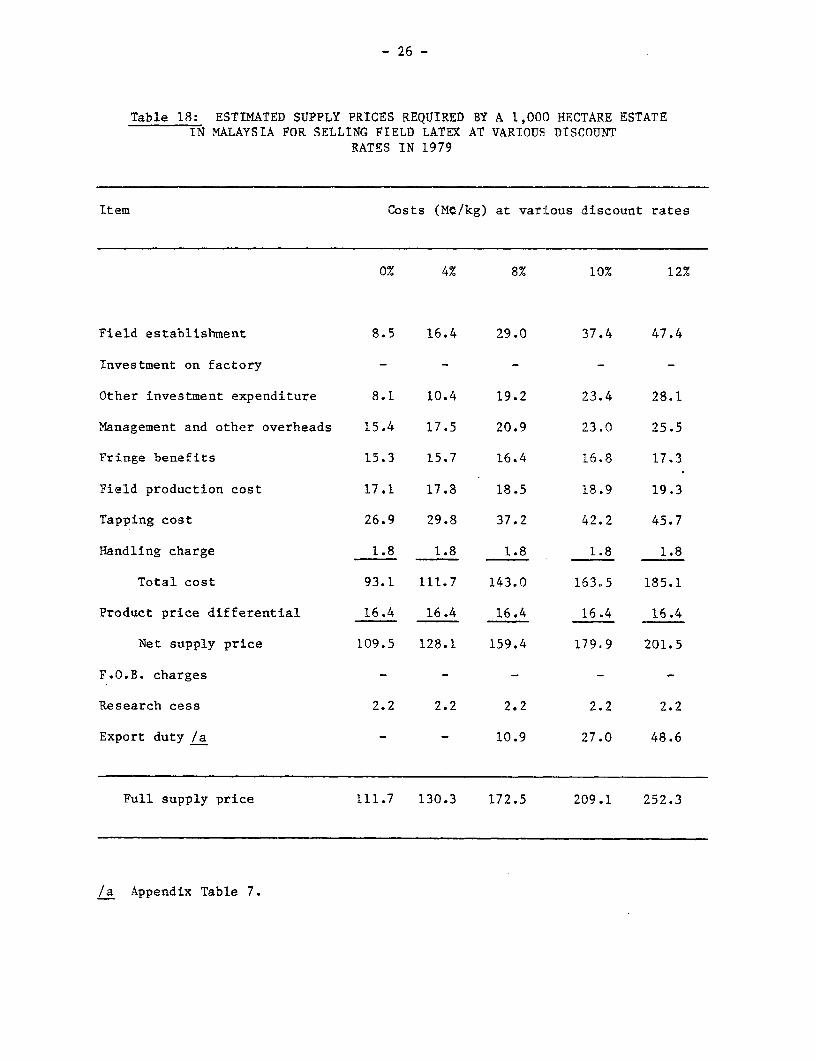
41. Full supply prices were estimated for each of the different rubber
products considered: RSS, ADS, SMR, field latex, are given in Tables 15-18. A
summary of the results are shown below:
Product Supply price (Mg/kg) at various discount rates0% 4% 8% 10% 12%
Field latex and scrap 111.7 130.3 172.5 209.1 252.3RSS 1 and scrap 117.3 140.6 192.8 229.9 275.1ADS and scrap 113.9 136.5 184.0 224.1 269.3SMR CV and SMR 20 114.3 136.8 183.8 223.5 268.3
I/ Changes in the computation of export duty have been announced. Witheffect from December 15, 1980, the rubber export duty is no longer deter-mined solely on the basis of the RSS 1 market quotation. Instead rubberfor exports is classified into two groups: one comprising higher gradetypes, RSS 1, SMR CV, SMR LV, latex concentrates, etc; the other made upof RSS 2, RSS 3 and other lower grades. There is also a different "thres-hold price" established for each group.
- 23 -
Table 15: ESTIMATED SUPPLY PRICES REQUIRED BY A 1,000 HECTAREESTATE IN MALAYSIA FOR MAKING RSS AT VARIOUS DISCOUNT RATES
IN 1979
Item Costs (MO/kg) at various discount rates
0% 4% 8% 10% 12%
Field establishment 8.5 16.4 29.0 37.4 47.4
Investment on RSS factory 2.6 4.0 5.6 6.4 7.4
Other investment expenditure 8.1 12.7 19.2 23.4 28.1
Management and other overheads 15.4 17.5 20.9 23.0 25.5
Fringe benefits 15.3 15.7 16.4 16.8 17.3
Field production cost 17.1 17.8 18.5 18.9 19.3
Tapping cost 26.9 31.4 40.7 43.2 46.7
Processing charge 8.4 8.4 8.4 8.4 8.4
Total Cost 102.3 123.9 158.7 177.5 200.1
Product price differential 6.8 6.8 6.8 6.8 6.8
Net supply price 109.1 130.7 165.5 184.3 206.9
F.o.b. charges 6.0 6.0 6.0 6.0 6.0
Research cess 2.2 2.2 2.2 2.2 2.2
Export duty /a - 1.7 L9.1 37.4 60.0
Full supply price 117.3 140.6 192.8 229.9 275.1
/ Appendix Table 7.
- 24 -
Table 16: ESTIMATED SUPPLY PRICES REQUIRED BY A 1,000 HECTAREESTATE IN MALAYSIA FOR MAKING ADS AT VARIOUS DISCOUNT RATES
IN 1979
Item Costs (Me/kg) at various discount rates
0% 4% 8% 10% 12%
Field establishment 8.5 16.4 29.0 37.4 47.4
Investment on ADS factory 3.0 4.5 6.3 7.3 8.3
Other investment expenditure 8.1 12.7 19.2 23.4 28.1
Management and other overheads 15.4 17.5 20.9 23.0 25.5
Fringe benefits 15.3 15.7 16.4 16.8 17.3
Field production cost 17.1 17.8 18.5 18.9 19.3
Tapping cost 26.9 31.4 38.8 43.2 46.7
Processing charge 11.4 11.4 11.4 11.4 11.4
Total cost 105.7 127.4 160.5 181.4 204.0
Product price differential 0 0 0 0 0
Net supply price 105.7 127.4 160.5 181.4 204.0
F.O.B. charges 6.0 6.0 6.0 6.0 6.0
Research cess 2.2 2.2 2.2 2.2 2.2
Export duty /a - 0.9 15.3 34.5 57.1
Full supply price 113.9 136.5 184.0 224.1 269.3
/a Appendix Table 7.
- 25 -
Table 17: ESTIMATED SUPPLY PRICES REQUIRED BY A 1,000 HECTAREESTATE IN MALAYSIA FOR MAKING SMR AT VARIOUS DISCOUNT
RATES IN 1979
Item Costs (Me/kg') at various discount rates
0% 4% 8% 10% 12%
Field establishment 8.5 16.4 29.0 37.4 47.4
Investment on SMR factory 4.1 5.4 6.9 7.7 8.5
Other investment expenditure 8.1 12.7 19.2 23.4 28.1
Management and overheads 15.4 17.5 20.9 23.0 25.5
Fringe benefits for workers 15.3 15.7 16.4 16.8 17.3
Field production cost 17.1 17.8 18.5 18.9 19.3
Tapping cost 26.9 31.4 38.8 43.2 46.7
Processing cost 19.3 19.3 19.3 19.3 19.3
Total cost 114.7 136.2 169.0 189.7 212.1
Product price differential -8.8 -8.8 -8.8 -8.8 -8.8
Net supply price 106.1 127.6 160.4 181.1 203.5
F.O.B. charges 6.0 6.0 6.0 6.0 6.0
Research cess 2.2 2.2 2.2 2.2 2.2
Export duty /a - 1.0 15.2 34.2 56.6
Full supply price 114.3 136.8 183.8 223.5 268.3
/a Appendix Table 7.
- 26 -
Table 18: ESTIMATED SUPPLY PRICES REQUIRED BY A 1,000 HECTARE ESTATEIN MALAYSIA FOR SELLING FIELD LATEX AT VARIOUS DISCOUNT
RATES IN 1979
Item Costs (Me/kg) at various discount rates
0% 4% 8% 10% 12%
Field establishment 8.5 16.4 29.0 37.4 47.4
Investment on factory - - - - -
Other investment expenditure 8.1 10.4 19.2 23.4 28.1
Management and other overheads 15.4 17.5 20.9 23.0 25.5
Fringe benefits 15.3 15.7 16.4 16.8 17.3
Field production cost 17.1 17.8 18.5 18.9 19.3
Tapping cost 26.9 29.8 37.2 42.2 45.7
Handling charge 1.8 1.8 1.8 1.8 1.8
Total cost 93.1 111.7 143.0 163.5 185.1
Product price differential 16.4 16.4 16.4 16.4 16.4
Net supply price 109.5 128.1 159.4 179.9 201.5
F.O.B. charges - - - - -
Research cess 2.2 2.2 2.2 2.2 2.2
Export duty /a - - 10.9 27.0 48.6
Full supply price 111.7 130.3 172.5 209.1 252.3
/a Appendix Table 7.
- 27 -
42. Before discussing the figures in the table, it may be useful to re-
iterate that, as derived, the supply price is in effect the RSS I market
quotation that (if it prevailed over the life of the estate), would enable it
to cover all expenditures--including f.o.b. charges, export duty and research
cess--and earn a predetermined rate of return on its capital outlay. (The re-
planting cess is not included as an item of expenditure as this cess is nor-
mally refunded to estates.)
43. Taking the figures in the column under a 10 percent discount rate, it
can be seen that, ceteris paribus, the hypothetical estate can make a 10 per-
cent return on total capital outlay by selling field latex and scrap when the
RSS 1 f.o.b. price is 209.1Mf/kg. For the estate to do as well from process-
ing its rubber, the requisite supply prices in terms of the RSS 1 market
quotation would have to be higher: 229.9MP/kg (RSS), 224.lMi/kg (ADS), and
223.5Mq/kg (SNR).
44. The fact that the supply price required for selling field latex is so
much lower than the supply prices required for making dry rubber (RSS, ADS,
SMR) deserves comment. The main reason why the sapply price for selling field
latex is so much lower is due to the highly attractive discount of 12¢/kg
given by latex buyers. In reality, however, the discount for field latex may
be much higher than the 12C/kg reportedly received by a number of estat-s
selling field latex. This is because buyers can and have allegedly given a
lower drc (dry rubber content) for latex purchased. There may also be scope
for underweighing of the latex purchased to the detriment of the seller.
45. Taking the three types of dry rubber that the estate can make, it can
be seen that the lowest supply price was for SMR while the highest was fDr
RSS. This was despite the fact that processing cost per kg was lowest for RSS
and highest for SHR. However the premia for SMN CV and ADS over RSS 1 were
apparently more than enough--at least over the 1976-1979 period considered--to
offset the relatively higher cost of making SMR and ADS (see Appendix Table 3.
- 28 -
46. These results should not, of course, be generalized indiscrimi-
nately. They are meant to be illustrative of Malaysian estate conditions only
and that, too, under a particular set of assumptions. In practice many SMR
plants may have excess capacity 1/ which means in effect that SMR processing
costs are likely to be higher than the figures shown here. Since the premia
for SMR are also variable, the net effect could mean that higher supply prices
are required for making SMR relative to RSS on some existing or ongoing
estates.
1/ A sample survey of 29 SMR plants in Peninsular Malaysia indicated thatmost of them were operating at well below half their maximum rated capa-city. For more details see Pee, Technical Innovations in Natural Rubber.
- 29 -
IV. RUBBER COST PRICES
47. From supply prices of a new investment based on a hypothetical
estate, attention is now turned to cost prices. As used here, a cost price is
analogous to a supply price. It is the market price that a producer of an
ongoing estate should receive to enable him to cover his production costs.
However, unlike a supply price, which is calculated over the entire economic
life of an estate, the cost price is based on production costs incurred by an
estate during a single production year. 1/ The time element and its influence
via interest rates is, therefore, an important distinguishing feature between
a supply price and a cost price.
48. Another difference is in the way depreciation is handled. The cost
price approach requires that the invested capital be distributed or depreci-
ated (on the basis of either historical costs or replacement value of the
investment) over time, usually in a linear fashion. In the supply price
approach this problem is dealt with by entering all expenditures (whether
investment or maintenance) in the year they occur. Although depreciation
poses no difficulty, it is necessary with the supply price approach to assume
that inflation will be identical over time for all input and output prices.
The "error" implicit in this assumption is, however, less serious than from,
say, basing depreciation on historical costs in calculating cost prices.
49. For the two approaches to give the samne result, the necessary and
sufficient conditions are as follows: (a) that the rate of interest is zero,
(b) that the annual output remains the same, and (c) that the annual inputs
also remain the same.
50. It is unlikely under normal practice for the last two conditions to
hold, even at a zero rate of interest (under which a producer need only
recover his capital outlay). This is because, by its nature, yield or output
from a rubber tree and, hence, estate output will vary over time.
Consequently, tapping cost will also vary but not in proportion to output.
Tapping cost in the second year of tapping, for example, will be higher than
lt In other words, the cost price is a short-run price--one that is highenough to induce an existing producer to incur the incremental cashexpenditures to harvest, process, and market his crop.
- 30 -
in year ten when peak yield is obtained. Under these conditions a cost price
based on the second year of tapping will be quite different from one during
the tenth year. However, there is generally an averaging out effect since the
trees in tapping on an estate, particularly a large one, are unlikely to
belong to the same age cohort. Nevertheless, it would be rather unlikely for
the two approaches to give identical results.
Data and Assumptions
51. The basis for deriving estate cost prices here is estate production
costs. The difficulties of obtaining "reasonable" cost of production esti-
mates, 11 particularly for a long lived tree crop such as rubber, are well
known.
52. In this paper use will be made of standardized figures of production
costs (for estates in the 400-1,200 ha size group) collected by the RRIM
(Rubber Research Institute of Malaysia). Differences in production con-
ditions, system of accounting, financial year, etc. among estates make it
necessary for cost data from different estates. to be standardized in order
that valid inter-estate comparisons can be made. However, as it was not possi-
ble to obtain reliable and representative processing cost for the different
types of rubber products considered here, the same figures for processing cost
used in supply price calculations were also used in calculating cost prices.
53. The latest year for which RRIM standardized production cost figures
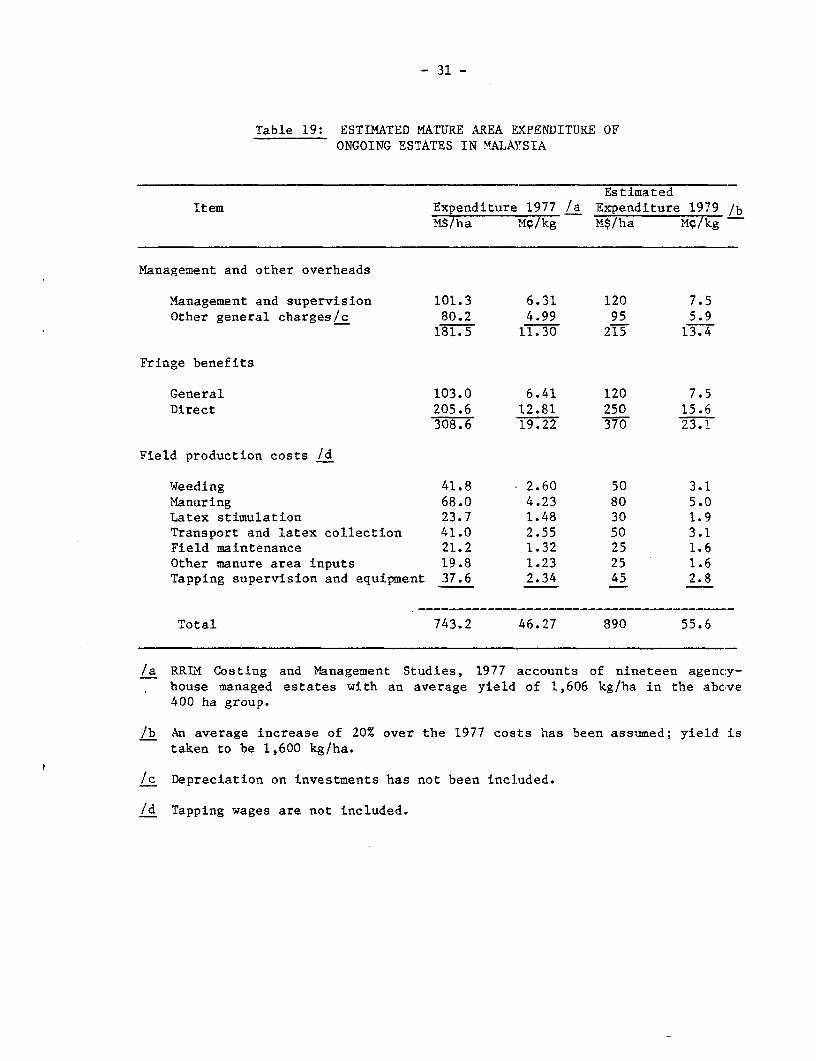
are available is 1977, Table 19. To bring them in line with conditions in
1979, the 1977 costs were adjusted upwards by 20 percent on average. They
were first adjusted to 1979 conditions. An iterative procedure, similar to
that used in estimating supply prices, was then employed in converting pro-
duction costs into cost prices. The cost price figures were not discounted
since they refer to a single calendar year. It is important to remember this
if comparisons with supply prices are attempted.
Results
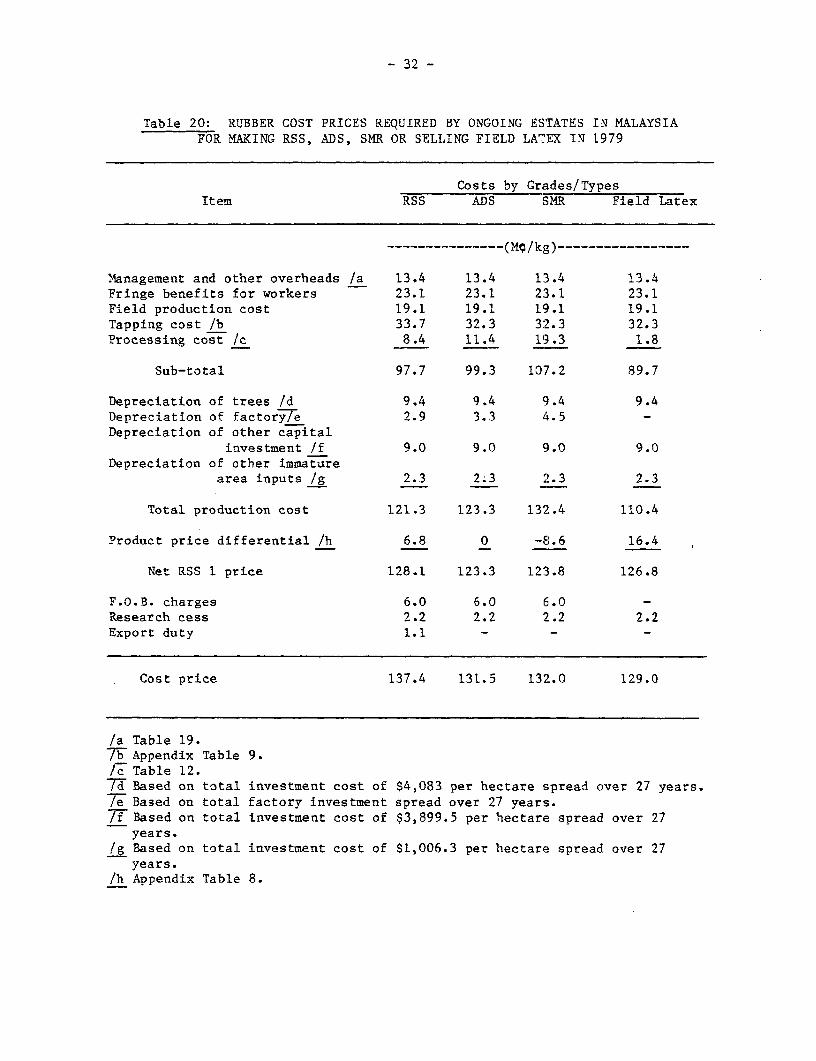
54. Table 20 gives the cost prices (in terms of the RSS 1 f.o.b. market
quotation) that an ongoing estate must receive if it is to be equally well-
off or indifferent between making RSS, ADS, SMR or selling field latex. They
1/ U.S. Department of Agriculture, Estimating Agricultural Costs ofProduction - Workshop Proceedings (Washington, D.C.: ESCS-56, June 1979).
- 31 -
Table 19: ESTIMATED MATURE AREA EXPENDITURE OFONGOING ESTATES IN MALAYSIA
EstimatedItem Expenditure 1977 /a Expenditure 1979 /b
M$/ha M;/kg M$Iha MC/kg
Management and other overheads
Management and supervision 101.3 6.31 120 7.5Other general charges/c 80.2 4.99 95 5.9
181.5 11.30 215 13.4
Fringe benefits
General 103.0 6.41 120 7.5Direct 205.6 12.81 250 15.6
308.6 19.22 370 23.1
Field production costs Id
Weeding 41.8 2.60 50 3.1Manuring 68.0 4.23 80 5.0Latex stimulation 23.7 1.48 30 1.9Transport and latex collection 41.0 2.55 50 3.1Field maintenance 21.2 1.32 25 1.6Other manure area inputs 19.8 1.23 25 1.6Tapping supervision and equipment 37.6 2.34 45 2.8
Total 743.2 46.27 890 55.6
/a RRIM Costing and Management Studies, 1977 accounts of nineteen agency-house managed estates with an average yield of 1,606 kg/ha in the abcove400 ha group.
/b An average increase of 20% over the 1977 costs has been assumed; yield istaken to be 1,600 kg/ha.
/c Depreciation on investments has not been included.
/d Tapping wages are not included.
- 32 -
Table 20: RUBBER COST PRICES REQUIRED BY ONGOING ESTATES IN MALAYSIAFOR MAKING RSS, ADS, SMR OR SELLING FIELD LATEX IN 1979
Costs by Grades/TypesItem RSS ADS SMR Field Latex
-(Me/kg)-----------------
Management and other overheads /a 13.4 13.4 13.4 13.4Fringe benefits for workers 23.1 23.1 23.1 23.1Field production cost 19.1 19.1 19.1 19.1Tapping cost /b 33.7 32.3 32.3 32.3Processing cost Ic 8.4 11.4 19.3 1.8
Sub-total 97.7 99.3 107.2 89.7
Depreciation of trees /d 9.4 9.4 9.4 9.4Depreciation of factoryTe 2.9 3.3 4.5 -Depreciation of other capital
investment /f 9.0 9.0 9.0 9.0Depreciation of other immature
area inputs /g 2.3 2.3 2.3 2.3
Total production cost 121.3 123.3 132.4 110.4
Product price differential /h 6.8 0 -8.6 16.4
Net RSS 1 price 128.1 123.3 123.8 126.8
F.O.B. charges 6.0 6.0 6.0Research cess 2.2 2.2 2.2 2.2Export duty 1.1 - -
Cost price 137.4 131.5 132.0 129.0
/a Table 19.7F7 Appendix Table 9./c Table 12.TT Based on total investment cost of $4,083 per hectare spread over 27 years./e Based on total factory investment spread over 27 years.If Based on total investment cost of $3,899.5 per hectare spread over 27
years.|g Based on total investment cost of $1,006.3 per hectare spread over 27
years./h Appendix Table 8.
- 33 -
are in Me/kg: 137.4 (RSS), 131.5 (ADS), 132.0 (SMR) and 129.0 (field latex),
respectively.
55. While they are not directly comparable with the supply prices it is
interesting to note that (at zero rate of interest), a higher cost price is
also required to make RSS rather than ADS or SMR. As with the supply price,
the cost price was lowest if the estate, instead of processing its crop, had
sold it as field latex instead. This, of course, subsumes that buyers are
readily available. In more remote areas this may not be true, in which case a
higher discount will probably be quoted by the buyer(s). In any case "hidden"
discounts through downward adjusting of the drc by field latex buyers, for
example, are difficult to detect. As such, the cost prices for field latex
are probably understated.
- 34 -
V. CONCLUSIONS AND IMPLICATIONS
56. It was earlier explained that because of temporal and related differ-
ences in the way supply and cost prices are calculated, it is unlikely that
they will take on identical values for each comparable grade/type. However,
one would expect that the supply and cost prices for different grades/types in
terms of the RSS 1 market quotation would be in the same direction.
57. The results indicate that this was true in most cases. If it were
advantageous for a producer to undertake processing, a higher supply or cost
price would be required for him to turn his rubber into RSS 1 instead of SMR
CV, despite the fact that processing cost for RSS was lower than for SMR.
Evidently, the premium for SMR CV over RSS 1 was more than enough to offset
the relatively higher cost of processing into SMR. He would be best off,
however, by simply selling field latex instead of undertaking any processing
on his own.
58. The higher supply and cost prices required for making RSS as compared
to SMR merits further comment since a number of earlier studies 1/ of ongoing
factories have almost invariably found the cost of making RSS to be generally
much lower and profits higher than from making SMR. The divergence between
the earlier findings and the results of this study can probably be explained
in terms of scale economies of rubber processing and actual operating capa-
cities of ongoing RSS and SiMR factories.
59. It appears that most older, existing SMR factories on estates in
Malaysia are not only small by present day standards but there is also con-
siderable excess capacity in many of them. /2 It is generally agreed that to
be commercially viable, the minimum throughput of a SMR plant should be about
10 tons a day, while the optimum throughput for plants in Malaysia has been
estimated to exceed 30 tons. The processing cost of the hypothetical estate
for SMR, ADS and RSS was in fact based on a 10-ton factory to ensure compara-
bility between the different types of rubber. In pracitice, a RSS factory is
likely to be smaller (with a throughput of generally less than 3 tons per day)
1/ The results of some of these studies have been summarized in C. Barlow,The Natural Rubber Industry (Kuala Lumpur: Oxford University Press, 1978).
2/ Pee, Technical Innovations in Natural Rubber.
- 35 -
and the economies of scale are apparently also much more limited. The results
of the present study are, therefore, not comparable to earlier findings on the
subject.
60. The main implications that can be drawn from the results are:
(1) small producers may find it advantageous, where feasible, tosell field latex instead of undertaking processing on their own;
(2) if processing has to be undertaken by small producers ontheir own, they should probably concentrate on making RSS; and
(3) SMR processing should be left to large producers since economiesof scale are apparently important in its production.
61. Although these implications are drawn from Malaysian estate data,
they are probably applicable to the other major rubber producing and exporting
countries, viz., Indonesia, Thailand, and Sri Lan1ka, as well. It is true that
wage rates in Malaysia are much higher than in the other countries but it is
not axiomatic that lower wage rates will lead to lower rubber supply and cost
prices. This is because Malaysian rubber yields are considerably higher than
in other rubber producing countries. The cost per kilogram of rubber produced
in Malaysia is, therefore, likely to be at least as low as in countries where
wage rates are lower but where yields are also inLrerior.
62. While this is a matter for empirical verification it is not expected
that the supply and cost prices of rubber production in the other major
producing countries will be any lower than Malaysian ones.
- 36 -
REFERENCES
1. Attiga, A.A., Brown A., Ajala E., and Pastore, A., Report of the World
Bank Advisory Panel on Commodities (Washington, D.C.: The World Bank,
May 1979).
2. Barlow, C., The Natural Rubber Industry (Kuala Lumpur: Oxford University
Press, 1978).
3. Grilli, E., Agostini, B., and -t Hooft-Welvaars, M., The World Rubber
Economy: Structure, Changes, Prospects, World Bank Occasional Paper
Number 30 (Baltimore: Johns Hopkins Press, 1980).
4. Pee, T.Y., Technical Innovations in Natural Rubber (forthcoming).
5. 't Hooft-Welvaars, M., "Profitability of New Investments in Rubber
Plantings in Malaysia", UNCTAD Doc. TD/B/C. 1/SYN/52, 1971 (mimeo).
6. U.S. Department of Agriculture, Estimating Agricultural Costs of
Production - Workshop Proceedings (Washington, D.C: ESCS-56, June 1979).
- 37 -
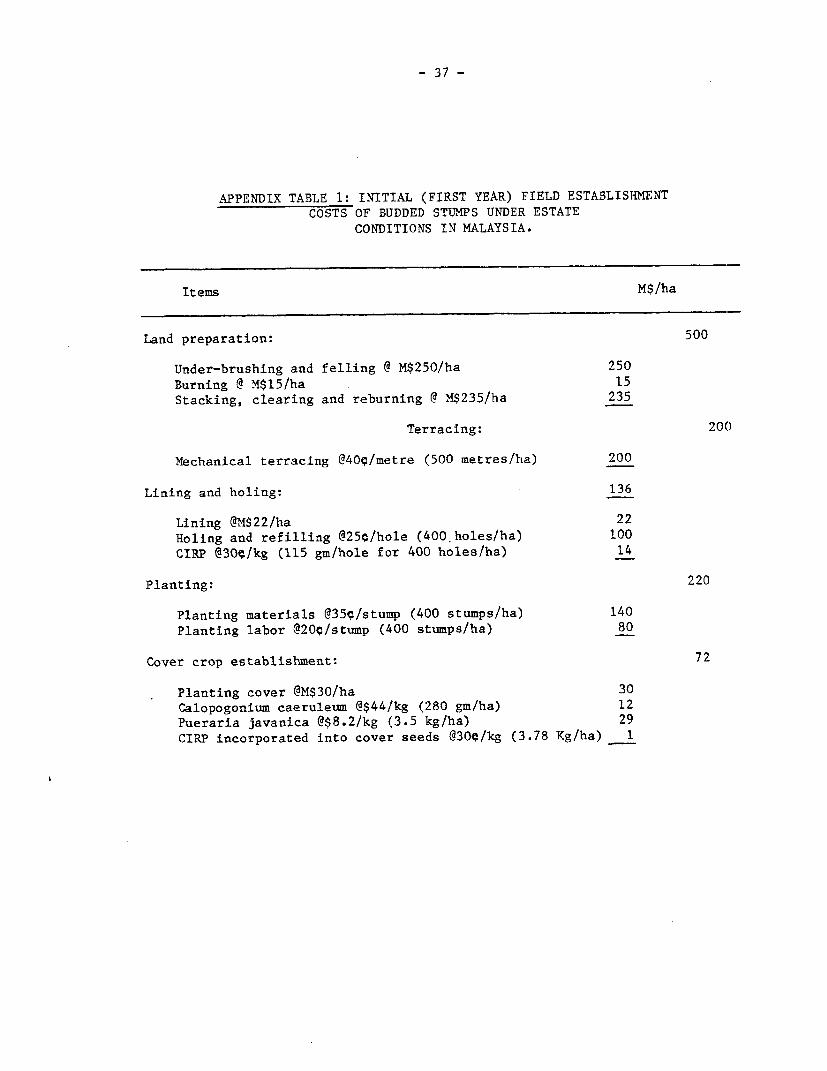
APPENDIX TABLE 1: INITIAL (FIRST YEAR) FIELD ESTABLISHMENTCOSTS OF BUDDED STUMPS UNDER ESTATE
CONDITIONS IN MALAYSIA.
Items M$/ha
Land preparation: 500
Under-brushing and felling @ M$250/ha 250Burning @ M$15/ha 15Stacking, clearing and reburning @ M$235/ha 235
Terracing: 20()
Mechanical terracing @40q/metre (500 metres/ha) 200
Lining and holing: 136
Lining @M$22/ha 22Holing and refilling @250/hole (400 holes/ha) 100CIRP @30q/kg (115 gm/hole for 400 holes/ha) 14
Planting: 220
Planting materials @35q/stump (400 stumps/ha) 140Planting labor @20o/stump (400 stumps/ha) 80
Cover crop establishment: 72
Planting cover @M$30/ha 30Calopogonium caeruleum @$44/kg (280 gm/ha) 12Pueraria javanica @$8.2/kg (3.5 kg/ha) 29CIRP incorporated into cover seeds @300/kg (3.78 Kg/ha) 1
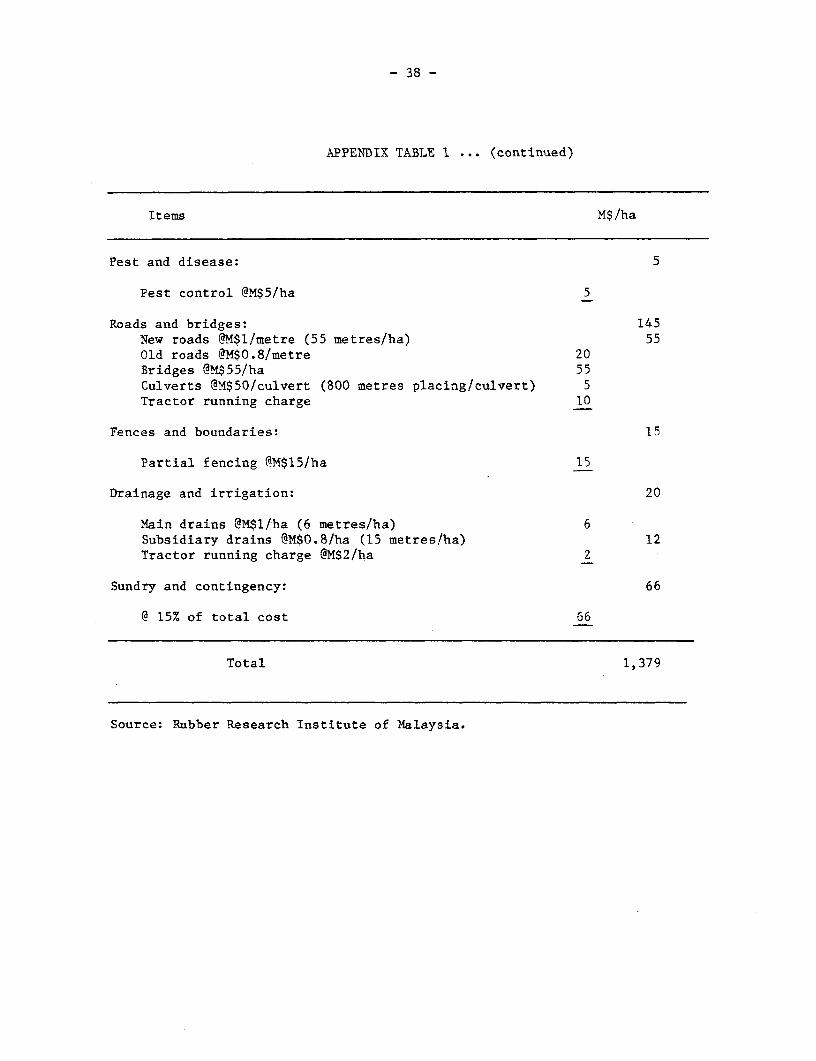
- 38 -
APPENDIX TABLE I ... (continued)
Items M$/ha
Pest and disease: 5
Pest control @M$5/ha 5
Roads and bridges: 145New roads @M$1/metre (55 metres/ha) 55Old roads @M$0.8/metre 20Bridges @M$55/ha 55Culverts @M$50/culvert (800 metres placing/culvert) 5Tractor running charge 10
Fences and boundaries: 15
Partial fencing @M$15/ha 15
Drainage and irrigation: 20
Main drains @M$1/ha (6 metres/ha) 6Subsidiary drains @M$0.8/ha (15 metres/ha) 12Tractor running charge @M$2/ha 2
Sundry and contingency: 66
@ 15% of total cost 66
Total 1,379
Source: Rubber Research Institute of Malaysia.
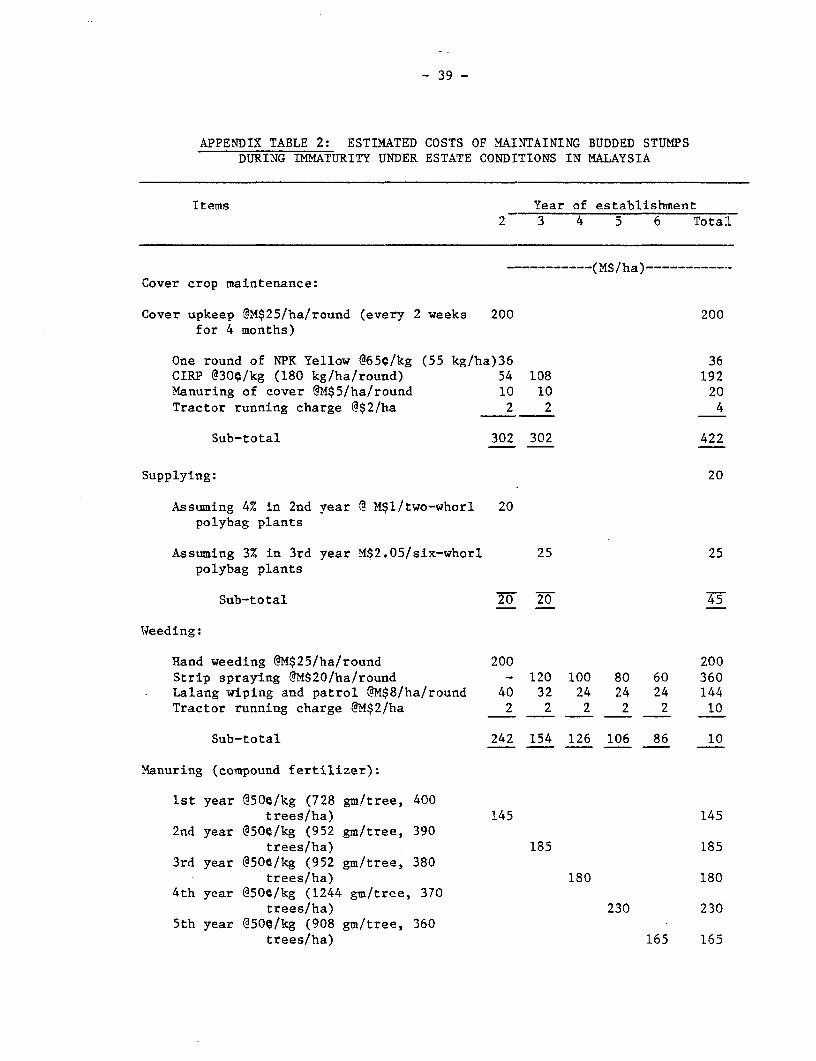
- 39 -
APPENDIX TABLE 2: ESTIMATED COSTS OF MAINTAINING BUDDED STUMPSDURING IMMATURITY UNDER ESTATE CONDITIONS IN MALAYSIA
Items Year of establishment2 3 4 5 6 TotaL
- …~~( M$/ha ) … -_____
Cover crop maintenance:
Cover upkeep @M$25/ha/round (every 2 weeks 200 200for 4 months)
One round of NPK Yellow @65;/kg (55 kg/ha)36 36CIRP @30q/kg (180 kg/ha/round) 54 108 192Manuring of cover @M$5/ha/round 10 10 20Tractor running charge @$2/ha 2 2 4
Sub-total 302 302 422
Supplying: 20
Assuming 4% in 2nd year @ M$1/two-whorl 20polybag plants
Assuming 3% in 3rd year M$2.05/six-whorl 25 25polybag plants
Sub-total 20 20 45
Weeding:
Hand weeding @M$25/ha/round 200 200Strip spraying @M$20/ha/round - 120 100 80 60 360Lalang wiping and patrol @M$8/ha/round 40 32 24 24 24 144Tractor running charge @M$2/ha 2 2 2 2 2 10
Sub-total 242 154 126 106 86 10
Manuring (compound fertilizer):
1st year @50e/kg (728 gm/tree, 400trees/ha) 145 145
2nd year @500/kg (952 gm/tree, 390trees/ha) 185 185
3rd year @500/kg (952 gm/tree, 380trees/ha) 180 180
4th year @500/kg (1244 gm/tree, 370trees/ha) 230 230
5th year @50q/kg (908 gm/tree, 360trees/ha) 165 165
- 40 -
APPENDIX TABLE 2 ... (continued)
Items Year of establishment2 3 4 5 6 Total
M$/ha)-----
Manuring labor @$5/ha/round 30 20 20 15 10 95Tractor running charge @$4/ha 4 4 4 4 4 20
Sub-total 179 209 204 249 179 1,020
Pest and disease:
Root disease @$5/ha/round 20 20 10 10 10 70Pink disease @$3/ha/round - 3 3 3 3 12Other diseases @$3/ha 3 3 3 3 3 15Patrolling @$7/ha 7 7 7 7 7 35Tractor running charge @$2/ha 22 2 2 2 2 10
Sub-total 32 35 25 25 25 142
Pruning, census and wind damage:
Pruning @$3/ha/round 12 12 12 9 9 54Census @$1/ha/round - 1 - 1 - 2Wind damage @$4/ha - 4 4 4 4 16Tractor running charge @$1/ha 1 1 1 1 1 5
Sub-total 13 18 17 15 14 77
Terrace and soil conservation:
Maintenance @$10/ha 10 10 10 10 10 50Tractor running charge @$2/ha 2 2 2 2 2 10
Sub-total 12 12 12 12 12 60
- 41 -
APPENDIX TABLE 2 ... (continued)
Items Year of establishment2 3 4 5 6 Total
…------------…(M$/ha)-----
Roads and bridges:
Maintenance @$3/ha 3 3 3 3 3 5Tractor running charge @$8/ha 8 8 8 8 8 40
Sub-total 11 11 11 11 11 55
Drainage and irrigation:
Maintenance @$3/ha 3 3 3 3 3 15Tractor running charge @$1/ha 1 1 1 1 1 5
Sub-total 4 4 4 4 4 20
Fences and boundaries:
Maintenance @$3Iha 3 3 3 3 3 15Tractor running charge @$I/ha 1 1 1 1 1 5
Sub-total 4 4 4 4 4 20
Sundry and contingency @5% of total cost 41 30 20 21 17 127
Total 860 622 423 447 352 2,671
Source: Rubber Research Institute of Malaysia.
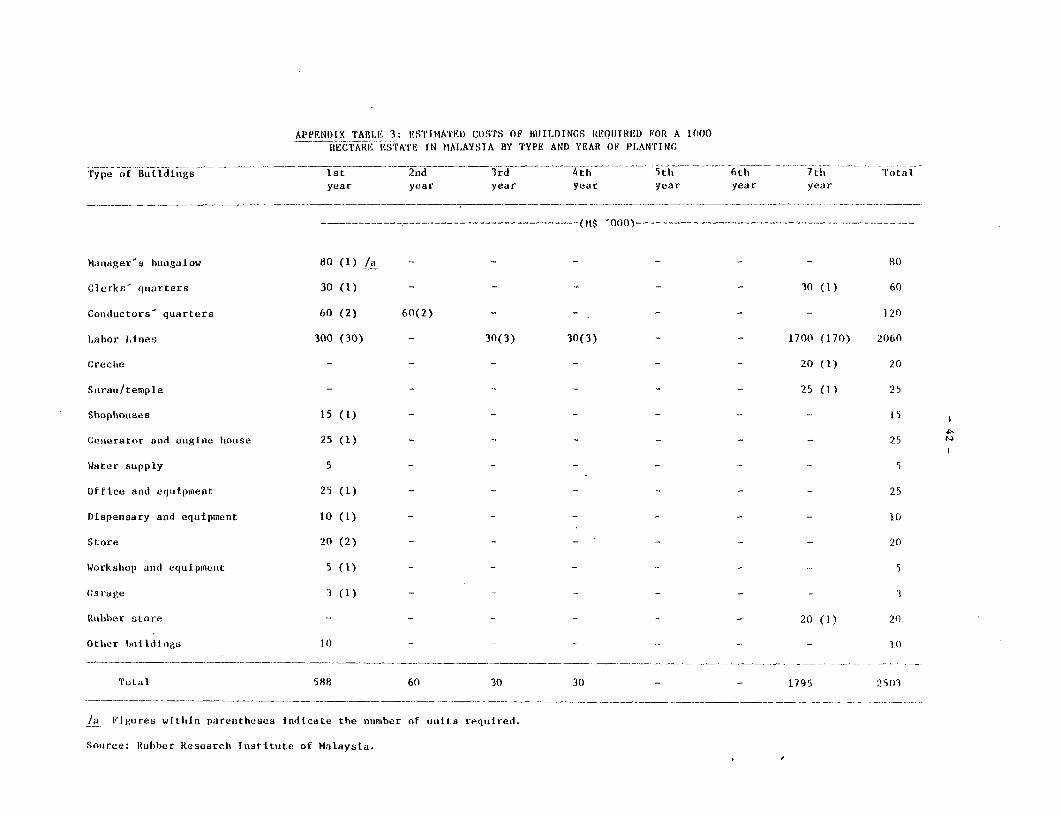
APPENDIX TABLE 3: EsTIMATEU COS'rS OF BiJILDINCS REOIJTRED FOR A 1000llECTARE ESTATE IN MALAYSTA BY TYPE AND YEAR OF PLANTrNm
Type of BuL1dings 1st 2nd 3rd 4th 5th 6th 7th 'rotalyear year year year year year year
…(M---------- --------------------------- t$ '000)…
MaNiager's hblugalow 80 (1) /a .- - - - - - 80
Clerks' quarters 30 (1) - _ _ _ _ 30 (1) 60
Conductors' quarters 60 (2) 60(2) - _- - 120
Labor Lines 300 (30) - 30(3) 30(3) 1700 (170) 2060
Creche - - - - 20 (1) 20
SuraU/templr e - - - - - - 25 (1) 25
Shophouses 15 (1) - - - - -1 - 15
Generator and engine houise 25 (1) - - - - - - 25
Water supply 5 - - - - - - 5
Office and equ1ipment 25 (1) - - - - - - 25
Dispensary and equipment 10 (1) - - - - - - 10
Store 20 (2) - - - - - - 20
Workshop and equipment 5 (1) - - - - 5
Garage 3 (1) - - _ _ - 3
Rubber store - - - - - - 20 (1) 20
Oth.er bulildingo 10 - - - 1J
Total 588 60 30 30 - - 1795 2s03
la Figuires wltitin parenthieses indicate the number of unlits required.
Source: Rubber Researcti Institute of Malaysia.
- 43 -
APPENDIX TABLE 4: ESTIMATED COSTS OF MOTOR VEHICLES REQUIRED FORA 1000 HECTARE ESTATE IN MALAYSIA, BY TYPE AND YEAR OF PLANTING
Year of Land Tractor Lorry Road Total.Planting Rover Grader
…---…(M$ "000)--
1 30 (1) /a 30 (1) 38 (1) 20 (1) 118
2 30 (1) 30
7 30 (1) 30
8 30 (1) 60 (2) 38 (1) - 128
9 30 (1) 30
14 30 (1) 30
15 30 (1) 60 (2) 38 (1) - 128
16 30 (1) 30
21 30 (1) 30
22 30 (1) 60 (2) 38 (1) - 128
23 30 (1) 30
28 30 (1) 30
29 30 (1) 60 (2) 38 (1.) - 128
30 30 (1) 30
Total 150 540 190 20 900
/a Figures within parentheses indicate the number of units required.
Source: Rubber Research Institute of Malaysia.
- 44 -
APPENDIX TABLE 5: ESTIMATED COSTS OF COLLECTION STATION AND EQUIPMENTREQUIRED ON A 1,000 HECTARE ESTATE IN MALAYSIA
Year of Collection Collection Churns and Cups, spring TotalTapping Station Tanks Buckets hanger and
spouts
----------------------------…(M$000)-----------------------------
1 60.0(4)/a 7.2(4) 6.3 73.5 147.02 - 1.8(1) - 26.7 28.53 - 1.8(1) 7.5 17.4 26.74 - - - 10.2 10.25 - 1.8(1) 7.5 10.2 19.5
6 - 1.8(1) - 9.9 11.77 - - 7.5 9.9 17.48 - - - 9.6 9.69 - - 7.5 9.3 16.8
10 - - - 9.3 9.3
11 - - 7.5 9.0 16.512 - - - 9.0 9.013 - - 7.5 8.7 16.214 - - - 8.7 8.715 - - 7.5 8.4 15.9
16 - - - 8.1 8.117 - - 7.5 8.1 15.618 - - - 7.8 7.819 - - 7.5 7.8 15.320 - - - 7.8 7.8
21 - - 7.5 7.5 15.022 - - - 7.5 7.523 - - 7.5 7.2 14.724 - - - 7.2 7.225 - - 7.5 6.9 14.4
26 - - - 6.9 6.927 - - 6.3 6.9 13.2
Total 60.0 14.4 102.6 319.5 496.5
/a Figures within patentheses indicate the number of units required.
Source: Rubber Research Institute of Malaysia.
- 45 -
APPENDIX TABLE 6: FACTORY INVESTMENT SCHEDULE
Year SMR ADS RSS
…--------------- ( M$)…
8 1,065,750 1,288,560 1,131,0609
101112
13 15,750 /a 15,750 /a 15,750 /a1415 416,850 /b1617
18 36,750 /c 96,600 /d 96,600 /d19202122 416,850 /b
23 15,750 /a 15,750 /a 15,750 /a24252627
282930313233
Total 1,967,700 1,416,660 1,259,160
/a Replacement of latex bulk tank and stirrer plus 5% contingency.7H Replacement of SMR processing machinery plus 5% contingency.7TY Replacement of latex bulk tank and stirrer, and re-roofing of factory
building (M$20,000) plus 5% contingency./d Replacement of ADS/RSS processing machinery and re-roofing of factory
building (M$15,000) plus 5% contingency.
Source: Rubber Research Institute of Malaysia.
- 46 -
APPENDIX TABLE 7: RUBBER EXPORT DUTY IN MALAYSIA, 1979
The export duty which is computed on the basis of RSS 1 (f.o.b.) price,varies depending on the prevailing market price. The current rates atdifferent rubber prices are as follows:
Price range (Me/kg) Duty (Me/kg
i) Below 132 Nilii) 132 1/8 - 143 0.2P - 26.40iii) 143 1/8 - 154 0.25P - 33.55iv) 154 1/8 - 165 0.3P - 41.25v) 165 1/8 - 176 0.35P - 49.50vi) 176 1/8 - 187 0.4P - 58.30vii) 187 1/8 - 198 0.45P - 67.65viii) above 198 0.50P - 77.55
where P is the RSS 1 (f.o.b.) price.
Although the export duty, D, and the RSS I (f.o.b.) price, P, are bothunknown, they are inter-related, and can, therefore, be readily obtainedthrough substitution, as follows:
P = net RSS 1 price + f.o.b. charges + research cess + D
(Note that replanting cess is not taken into account here as thecess is normally refunded to estates.)
Assuming, net RSS 1 price = 180¢/kgf.o.b. charges = 6¢/kgresearch cess = 2.20/kg
Then P = 180 + 6 + 2.2 + D= 188.2 + D
Since D= 0.50P-77.5 (see (viii) aboveP=188.2 + 0.50P - 77.550.5 P = 110.65P = 221.30D = 0.50 (221.30) - 77.55
= 33.1
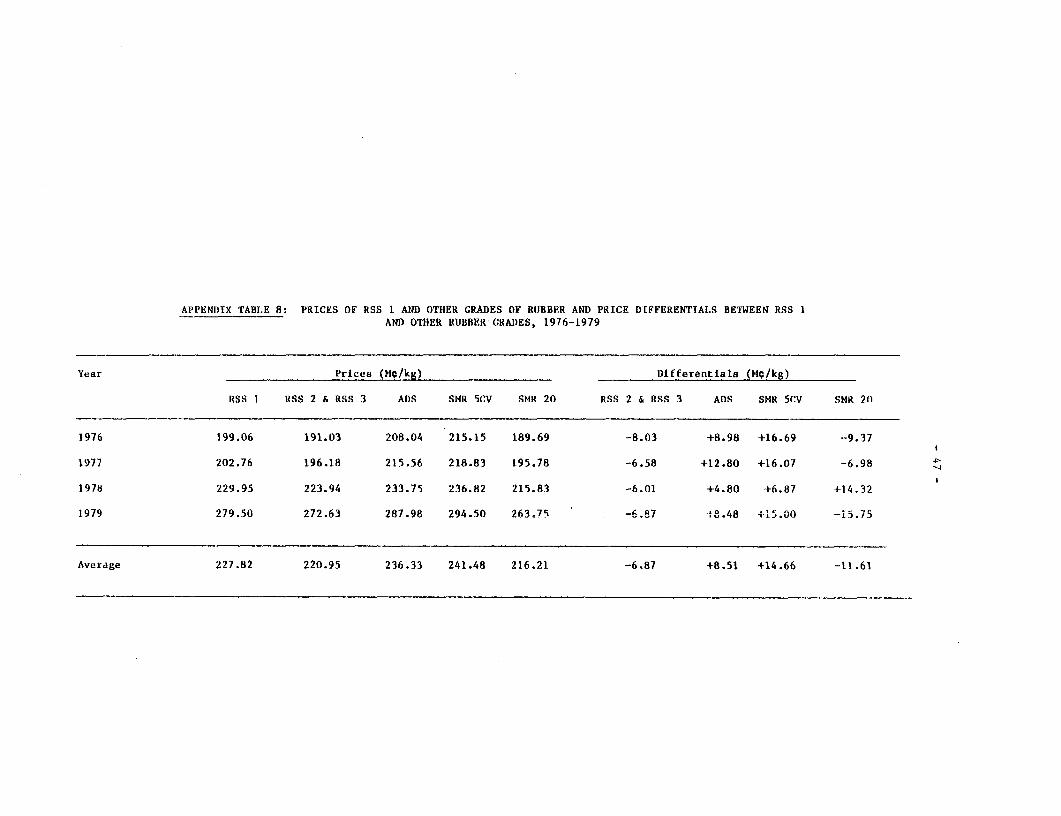
APPENDIX TABLE 8: PRICES OF RSS I AND OTIIER GRADES OF RUBBER AND PRICE D[FFERENTIALS BETWEEN RSS 1AND OTHER RUBBER GRADES, 1976-1979
Year Prices (MC/kg) Differentials (Mc/kg)
RSS 1 RSS 2 & RSS 3 ADS SMR 5CV SHR 20 RSS 2 & RSS 3 ADS SMR 5CV SMR20
1976 199.06 191.03 208.04 215.15 189.69 -8.03 +8.98 +16.69 -9.37
1977 202.76 196.18 215.56 218.83 195.78 -6.58 +12.80 +16.07 -6.98
1978 229.95 223.94 233.75 236.82 215.83 -6.01 +4.80 +6.87 +14.32
1979 279.50 272.63 287.98 294.50 263.75 -6.87 ,.48 +15.00 -15.75
Average 227.82 220.95 236.33 241.48 216.21 -6.87 +8.51 114.66 -11.61
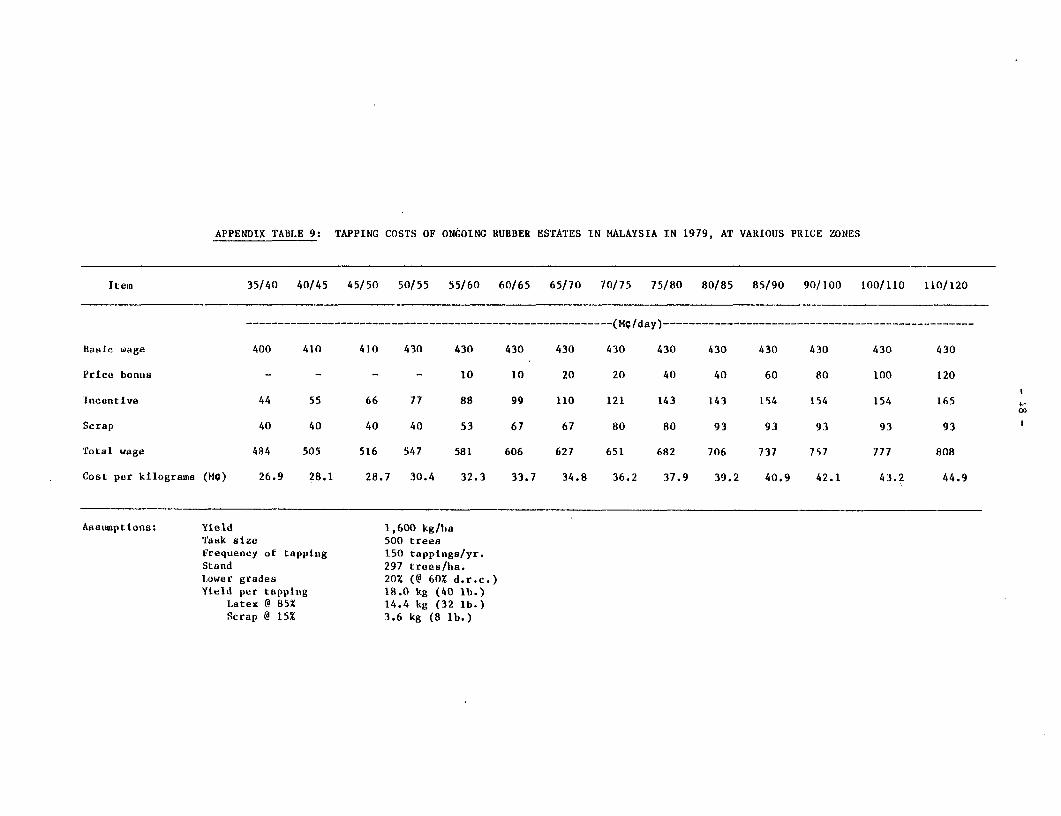
APPENDIX TABLE 9: TAPPING COSTS OF ONGOING RUBBER ESTATES IN MALAYSIA IN 1979, AT VARIOUS PRICE ZONES
Item 35/40 40/45 45/50 50/55 55/60 60/65 65/70 70/75 75/80 80/85 85/90 90/100 100/110 110/120
----------------------------------- ----------------------- (M C/day) ------------ ------------ ----------- -----------
Basic wage 400 410 410 430 430 430 430 430 430 430 430 430 430 430
Price bonus - - - - 10 10 20 20 40 40 60 80 100 120
Incentive 44 55 66 77 88 99 110 121 143 143 154 154 154 165
Scrap 40 40 40 40 53 67 67 80 80 93 93 93 93 93
Total wage 484 505 516 547 581 606 627 651 682 706 737 757 777 808
Cost per kilograms (Me) 26.9 28.1 28.7 30.4 32.3 33.7 34.8 36.2 37.9 39.2 40.9 42.1 43.2 44.9
Assumptions: Yield 1,600 kg/haTask size 500 treesFrequency of tapping 150 tappings/yr.Stand 297 trees/ha.Lower grades 20% (@ 60% d.r.c.)Yield per tapping 18.0 kg (40 lb.)
Latex @ 85% 14.4 kg (32 lb.)Scrap @ 15% 3.6 kg (8 lb.)