Embed Size (px)
Citation preview

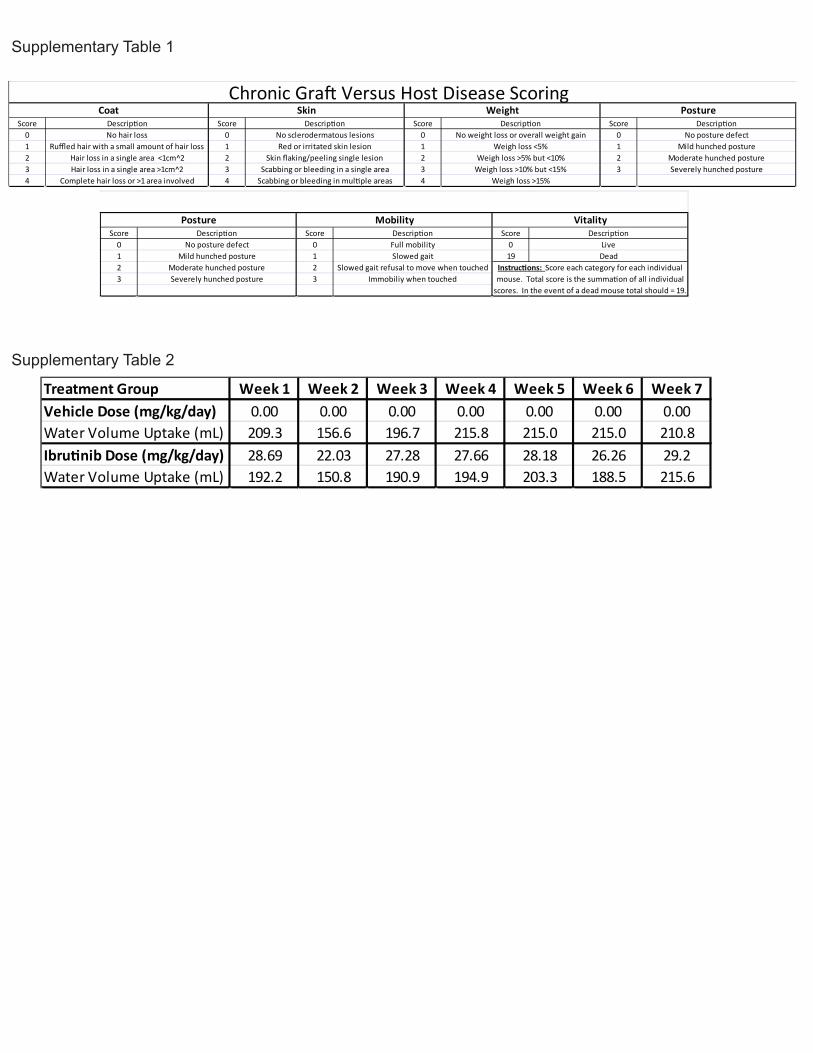
Supplementary Tables
Supplementary Table 1: LP/J→C57BL/6 cGVHD scoring. Each category: coat
condition, skin condition, weight, posture, mobility, and vitality are individually scored
and summed to achieve an overall cGVHD condition score. Scores are taken by a
consistent unbiased observer with no knowledge of treatment cohorts. Scores range
from 0 (healthy mouse) to 19 (mouse which has died due to cGVHD) with 18
representing the maximum score for a living mouse with cGVHD. cGVHD progression
is defined as a >2 point change in overall cGVHD score from treatment baseline.
Supplementary Table 2: Drinking water administration of ibrutinib and vehicle. The
average water uptake per mouse (ml) and the extrapolated daily dose (mg/kg/day) were
calculated over a 7 week test period.
Supplementary Figure Legends
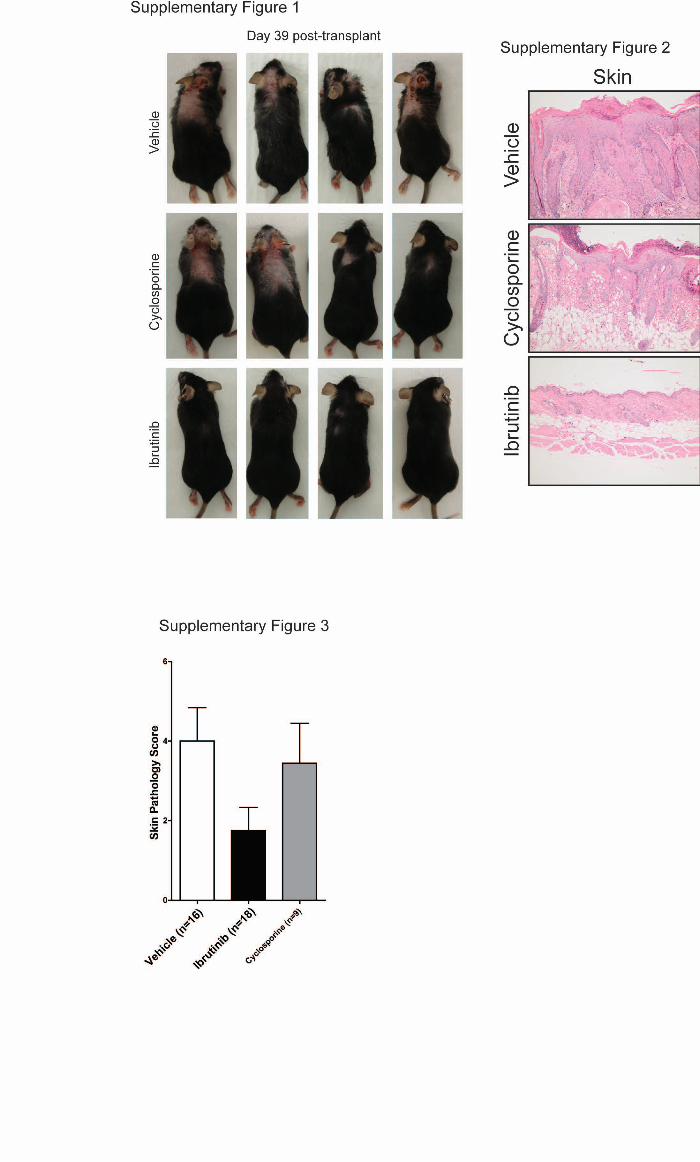
Supplementary Figure 1: At day 25 mice post-HSCT a total of 18 mice (from two
independent experiments) were randomly assigned to ibrutinib (25mg/kg/day), 18 to
vehicle, or 11 to cyclosporine (10mg/kg/day). Sclerodermatous lesions, hair loss,
hunched posture, and gaunt appearance are characteristic visual indicators of cGVHD
in this model. Representative visual analysis of 4 randomly selected mice at day 39
post-HSCT.
Supplementary Figure 2: H&E stained skin preparations of sclerodermatous skin
lesions showing levels of dermal fibrosis, epidermal hyperplasia, serocellular crusting,
erosion, and lymphohistiocytic infiltration, consistent with cGVHD.

Supplementary Figure 3: cGVHD involvement of the skin was assessed by a trained
observer in a blinded fashion on a scale from 0 to 8. Cohort averages are displayed.
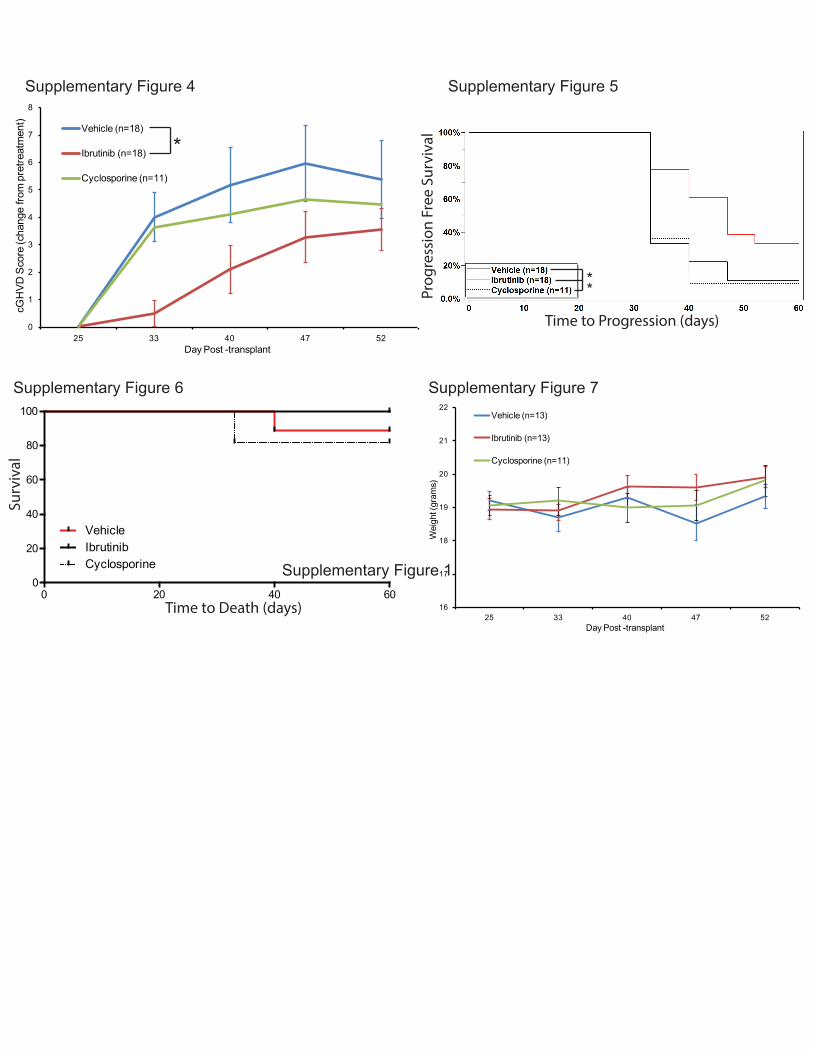
Supplementary Figure 4: Weekly blinded analysis of cGVHD external metrics
including weight, posture, vitality, mobility, coat, and skin in all mice from two
independent experiments (18 vehicle, 18 ibrutinib, and 11 cyclosporine) (Supplementary
Table 1). All cGVHD scores were corrected for individual scores at the beginning of
treatment (day 25). Error bars = s.e.m. *=p<0.01
Supplementary Figure 5: Kaplan Meier plot of cGVHD progression free survival.
Progression is defined a >2 point increase in day 25 cGVHD score (Supplementary
Table 1) *=p<0.01
Supplementary Figure 6: Kaplan Meier plot of overall survival for vehicle, ibrutinib, or
cyclosporine treatment groups.
Supplementary Figure 7: Weekly bodyweight measurements for vehicle, ibrutinib, and
cyclosporine treatment groups. Bodyweight was calculated to the nearest 0.1 gram at a
similar time each day. Error bars = s.e.m., samples derived from two independent
experiments.
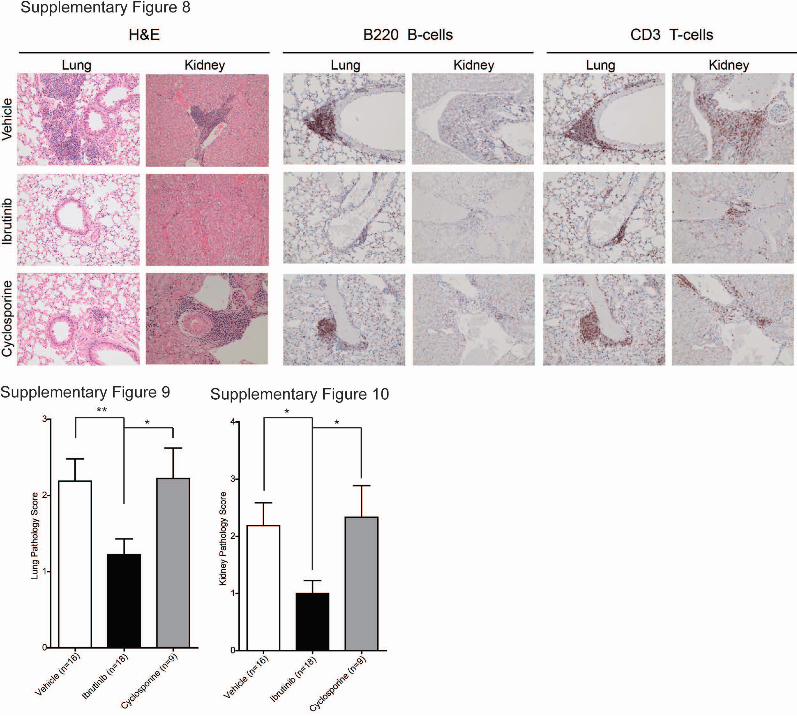
Supplementary Figure 8: Representative 20X images from H&E, B220, or CD3
stained lung and kidney tissues from mice sacrificed at day 125 post-HSCT from 6
mice/group. Images were taken by a trained veterinary pathologist who was blinded to
animal cohorts.
Supplementary Figure 9: Blinded pathologic analysis of H&E stained lung tissues
obtained from cGVHD cohorts (18 vehicle, 18 ibrutinib, and 11 cyclosporine).
Lymphohistiocytic infiltration was graded on a 0-4 scale for each animal. *=p<0.05,
**=p<0.01.
Supplementary Figure 10: Blinded pathologic analysis of H&E stained kidney tissues
obtained from cGVHD cohorts. Portal hepatitis and vasculitis was graded on a 0-4
scale for each animal. *=p<0.05.
Supplementary Figure 11: Weekly blinded analysis of cGVHD external metrics
including weight, posture, vitality, mobility, coat, and skin in all mice from the cGVHD
sustained benefit experiment (16 vehicle, 13 ibrutinib (days 25-60), 9 BM-only, 6
ibrutinib short course (days 60-72), and 7 ibrutinib continuous (days 60-72))
(Supplementary Table 1). All cGVHD scores were corrected for individual scores at the
beginning of treatment (day 25). Error bars = s.e.m.
Supplementary Figure 12: Blinded pathologic analysis of H&E stained tissues
obtained from cGVHD cohorts derived from the sustained benefit experiment on day 75
post HSCT. On day 60 post HSCT the ibrutinib cohort was split and 7 mice continued
to receive 25mg/kg/day ibrutinib (ibrutinib continuous) while 6 mice were withdrawn from
ibrutinib and placed on vehicle for the remainder of the experiment (ibrutinib short
course). A) For lung tissues lymphohistiocytic infiltration was graded on a 0-4 scale for
each animal. *=p<0.05. B) Blinded pathologic analysis of H&E stained kidney tissues.
Portal hepatitis and vasculitis was graded on a 0-4 scale for each animal. *=p<0.05,
**=p<0.01.
Supplementary Figure 13: Prophylactic treatment of cGVHD. 2-days prior to HSCT
mice are randomly assigned to ibrutinib (25mg/kg/day), vehicle, or cyclosporine
(10mg/kg/day) groups. Weekly blinded analysis of cGVHD external metrics including
weight, posture, vitality, mobility, coat, and skin (Supplementary Table 1). All cGVHD
scores were corrected for individual scores at the beginning of treatment (day -2). Error
bars = s.e.m.
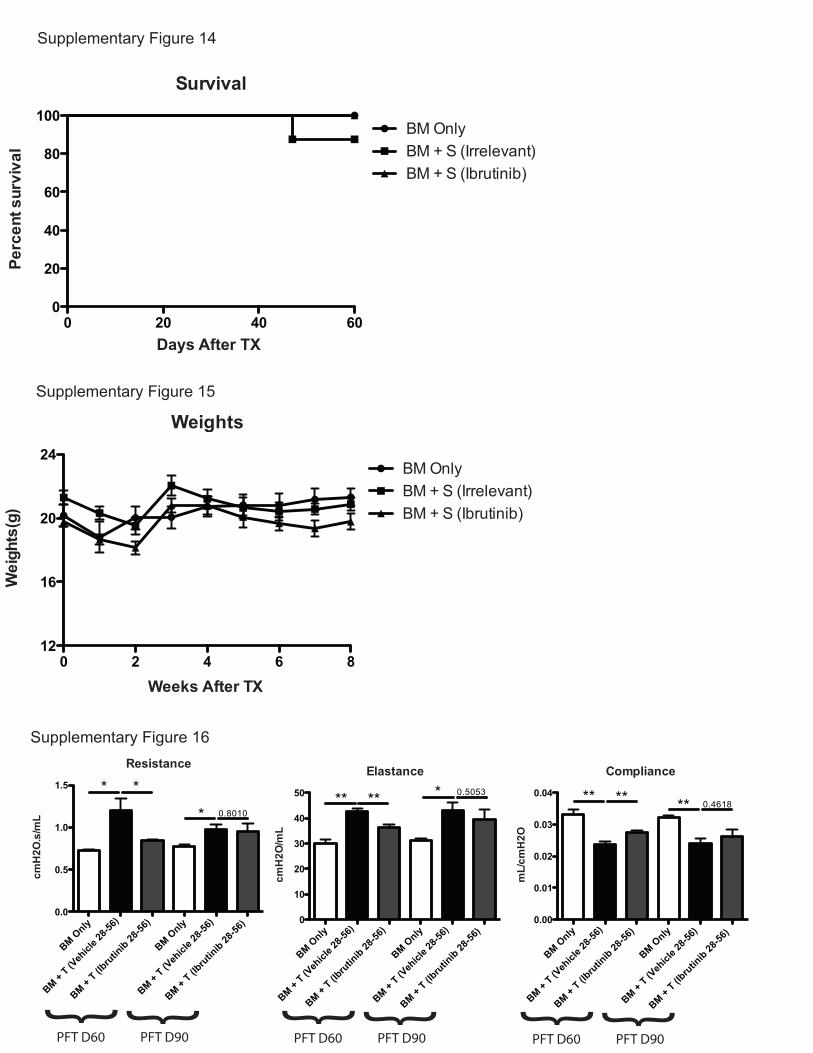
Supplementary Figure 14: Survival of cGVHD mice in C57BL/6→B10.BR model.
Kaplan Meier plot of overall survival for bone marrow (BM) non-cGVHD mice,
BM+splenocyte (S) engrafted cGVHD irrelevant vehicle treated mice, or Ibrutinib treated
BM+S engrafted mice.
Supplementary Figure 15: Bodyweight of cGVHD mice in C57BL/6→B10.BR
model. Bodyweight measurements for for bone marrow (BM) non-cGVHD mice,
BM+splenocyte (S) engrafted cGVHD irrelevant vehicle treated mice, or Ibrutinib treated
BM+S engrafted mice.
Supplementary Figure 16: PFTs were performed at day 60 or day 90 post-transplant
on anesthetized animals to understand sustained benefits. Animals were artificially
ventilated and resistance, elastance, and compliance were measured as parameters of
distress in lung function in animals receiving 5x10⁶ splenocytes (S) in addition to bone
marrow (BM). Treatment cohorts were administered vehicle or ibrutinib starting on day
28 and ending on day 56 post transplant; Error bars = s.e.m.
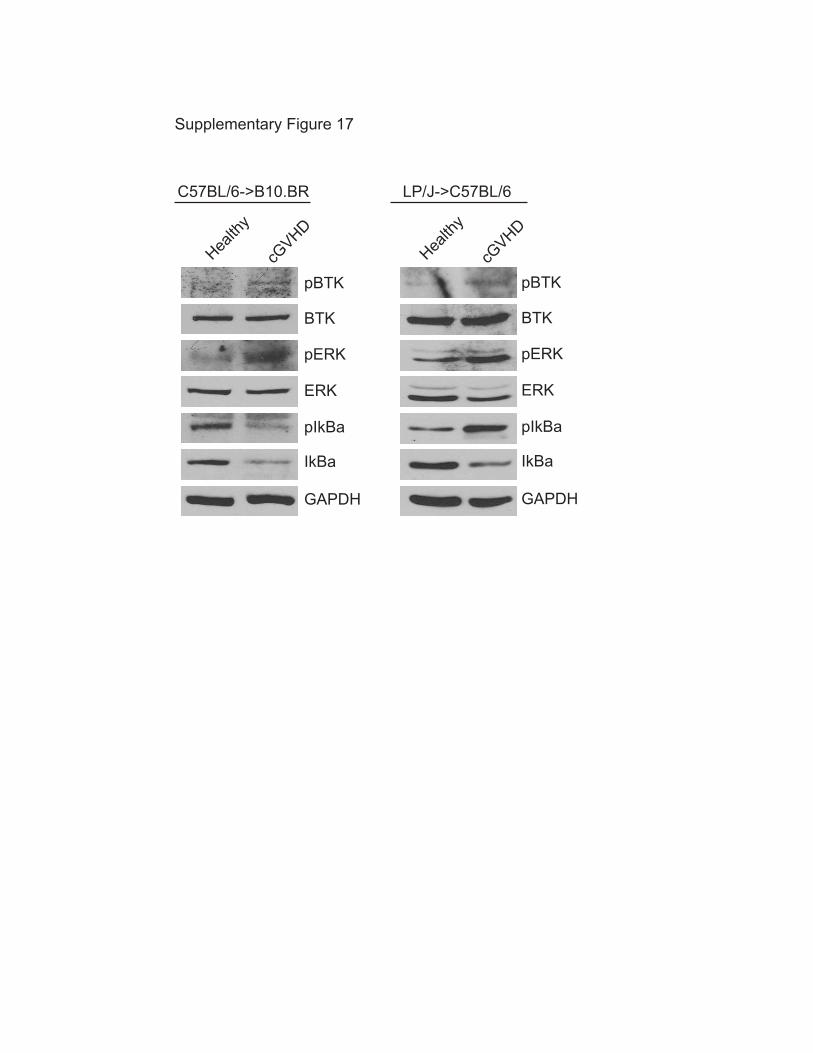
Supplementary Figure 17: Pooled splenic B-cells derived from healthy mice or mice
with active cGVHD in either the C57BL/6->B10.BR model or the LP/J->C57BL/6 model

were interrogated for over-activated BCR pathway constituents including BTK, ERK,
and IkBa.
Supplementary Materials and Methods
Therapeutic allo-HSCT models
The C57BL/6→B10.BR model has been described previously1. In brief, B10.BR
recipients conditioned with 120mg/kg/day I.P. cyclophosphamide (Cy) on days -3 and -2
and 8.3 Gy TBI (using a 137Cesium irradiator) on day -1 were engrafted with 1X10⁷
Thy1.2 depleted C57BL/6 derived bone marrow (BM) cells with (or without) 1X10⁶
allogeneic splenocytes.
Histopathological scoring
For pulmonary tissues coded pathologic analysis was conducted on H&E stained
sections. Scores ranged from 0 to 4 indicating the maximum number of
lymphoplasmacytic and histiocytic cellular cuffs infiltrating the surrounding airways or
vasculature in 2 different 4X microscopic fields and the number of infiltrating
aggregates. 0 cuffs = 0, 1 to 5 cuffs = 1, 6 to 10 cuffs and <6 aggregates = 2, 11 to 15
cuffs and <15 aggregates = 3, and >16 cuffs = 4. Limited foci of alveolar histiocytosis
present with 0 cuffs were considered incidental.
For renal H&E stained sections both perivascular lymphoplasmacytic infiltration and
intratubular protein were quantified by a trained veterinary pathologist on coded
specimens. Scoring ranged from 0 to 4 according to the following guidelines: No
inflammatory infiltrates and hyaline eosinophilic material absent from tubular lumens =
0, Scattered foci lymphocytes and plasma cells surrounding renal vasculature or <6
tubular profiles containing hyaline eosinophilic material = 1, between 1 and 2
aggregates of inflammatory cells <10 cells in diameter or 6 to 10 tubules containing
hyaline eosinophilic material = 3, between 3 and 4 foci of inflammatory cells which are
up to 20 cells in diameter or between 11 and 15 tubules containing hyaline eosinophilic
material = 3, 5 inflammatory cell foci or more or fewer than 5 which are >20 cells in
diameter or >15 tubules containing hyaline eosinophilic material = 4.
Supplementary References
1. Srinivasan M, Flynn R, Price A, et al. Donor B-cell alloantibody deposition and germinal center formation are required for the development of murine chronic GVHD and bronchiolitis obliterans. Blood. 2012;119(6):1570-1580.
0
1
2
3
4
5
6
7
8
25 33 40 47 52
cGH
VD
Sco
re (c
hang
e fro
m p
retre
atm
ent)
Day Post -transplant
Vehicle (n=18)
Ibrutinib (n=18)
Cyclosporine (n=11)
*
Supplementary Figure 4
16
17
18
19
20
21
22
25 33 40 47 52
Wei
ght (
gram
s)
Day Post -transplant
Vehicle (n=13)
Ibrutinib (n=13)
Cyclosporine (n=11)
**Pr
ogre
ssio
n Fr
ee S
urvi
val
Time to Progression (days)
0 20 40 600
20
40
60
80
100
VehicleIbrutinibCyclosporine
Time to Death (days)
Sur
viva
l
Supplementary Figure 5
Supplementary Figure 6 Supplementary Figure 7
Supplementary Figure 1

-1
0
1
2
3
4
5
6
7
8
25 27 30 32 34 37 39 41 44 46 48 51 53 55 58 60 62 65 67 69 72
cGVH
D Sc
ore
(cha
nge
from
pre
treat
men
t)
Days Post Transplant
BM-Only (n=9)Ibrutinib (n=13)Vehicle (n=16)Ibrutinib Short course (n=6)Ibrutinib Continuous (n=7)
Supplementary Figure 11
Supplementary Figure 12
Kid
ney
Path
olog
y Sc
ore
Vehicl
e (n=1
3)
Ibrutin
ib (n=1
1)
BM-Only
(n=9)
Ibrutin
ib Short Course
(n=6
)
Ibrutin
ib Contin
uous (n=7
)0
1
2
3
4
5
*****
Lung
Pat
holo
gy S
core
Vehicl
e (n=1
3)
Ibrutin
ib (n=1
1)
BM-Only
(n=9)
Ibrutin
ib Short Course
(n=6
)
Ibrutin
ib Contin
uous (n=7
)0
1
2
3*
NS
*
0
2
4
6
8
10
12
Day 0 Day 1 Day 8 Day 15 Day 22 Day 29 Day 36 Day 43 Day 50 Day 57 Day 64 Day 71 Day 78 Day 85
cGH
VD
Sco
re (c
hang
e fro
m p
retre
atm
ent)
Day Post -transplant
Vehicle (n=13)
Ibrutinib (n=13)
Cyclosporine (n=11)
Prophylactic treatment window (days -2 to 25)
Supplementary Figure 13
A B
Supplementary Figure 14
Weights
0 2 4 6 812
16
20
24BM OnlyBM + S (Irrelevant)BM + S (Ibrutinib)
Weeks After TX
Wei
ghts
(g)
Days After TX
Survival
0 20 40 600
20
40
60
80
100BM OnlyBM + S (Irrelevant)BM + S (Ibrutinib)
Perc
ent s
urvi
val
Supplementary Figure 15
Resistance
BM Only
BM + T (V
ehicl
e 28-5
6)
BM + T (Ib
rutin
ib 28-56
)
BM Only
0.0
0.5
1.0
1.5
*
**0.8010
cmH
2O.s
/mL
Elastance
BM Only
BM Only
0
10
20
30
40
50 *** ** 0.5053
cmH
2O/m
L
Compliance
BM Only
BM Only
0.00
0.01
0.02
0.03
0.04**** ** 0.4618
mL/
cmH
2O
BM + T (V
ehicl
e 28-5
6)
BM + T (Ib
rutin
ib 28-56
)
BM + T (V
ehicl
e 28-5
6)
BM + T (Ib
rutin
ib 28-56
)
BM + T (V
ehicl
e 28-5
6)
BM + T (Ib
rutin
ib 28-56
)
BM + T (V
ehicl
e 28-5
6)
BM + T (Ib
rutin
ib 28-56
)
BM + T (V
ehicl
e 28-5
6)
BM + T (Ib
rutin
ib 28-56
)
} }
PFT D60 PFT D90
} }
PFT D60 PFT D90
} }
PFT D60 PFT D90
Supplementary Figure 16
pBTK
BTK
pERK
ERK
pIkBa
IkBa
GAPDH
Health
y
cGVHD
C57BL/6->B10.BR
pBTK
BTK
pERK
ERK
pIkBa
IkBa
GAPDH
Health
y
cGVHD
LP/J->C57BL/6
Supplementary Figure 17
Score Description Score Description Score Description Score Description Score0 No hair loss 0 No sclerodermatous lesions 0 No weight loss or overall weight gain 0 No posture defect 01 Ruffled hair with a small amount of hair loss 1 Red or irritated skin lesion 1 Weigh loss <5% 1 Mild hunched posture 12 Hair loss in a single area <1cm^2 2 Skin flaking/peeling single lesion 2 Weigh loss >5% but <10% 2 Moderate hunched posture 23 Hair loss in a single area >1cm^2 3 Scabbing or bleeding in a single area 3 Weigh loss >10% but <15% 3 Severely hunched posture 34 Complete hair loss or >1 area involved 4 Scabbing or bleeding in multiple areas 4 Weigh loss >15%
Chronic Graft Versus Host Disease ScoringCoat Skin Weight Posture
Supplementary Table 1
Description Score Description Score Description Score DescriptionNo weight loss or overall weight gain 0 No posture defect 0 Full mobility 0 Live
Weigh loss <5% 1 Mild hunched posture 1 Slowed gait 19 DeadWeigh loss >5% but <10% 2 Moderate hunched posture 2 Slowed gait refusal to move when touched
Weigh loss >10% but <15% 3 Severely hunched posture 3 Immobiliy when touchedWeigh loss >15%
Instructions: Score each category for each individual mouse. Total score is the summation of all individual
scores. In the event of a dead mouse total should = 19.
Weight Posture VitalityMobility
Treatment Group Week 1 Week 2 Week 3 Week 4 Week 5 Week 6 Week 7Vehicle Dose (mg/kg/day) 0.00 0.00 0.00 0.00 0.00 0.00 0.00Water Volume Uptake (mL) 209.3 156.6 196.7 215.8 215.0 215.0 210.8Ibrutinib Dose (mg/kg/day) 28.69 22.03 27.28 27.66 28.18 26.26 29.2Water Volume Uptake (mL) 192.2 150.8 190.9 194.9 203.3 188.5 215.6
Supplementary Table 2