Embed Size (px)
Citation preview
1
Supplementary Information
Supplementary methods, figures, tables and references for “High-throughput Detection of Clinically Relevant Mutations in Archived Tumor Samples By Multiplexed PCR and Next Generation Sequencing”
Online Methods
Tumor tissue and cell line DNA
In this study, we analyzed 107 tumor tissue samples, including FFPE samples from 73 human endometrial cancer patients, and 17 patient-matched FF and FFPE samples from 4 breast cancer, 4 lung cancer, 4 colon cancer and 5 ovarian cancer patients (Data file S2). All tissue samples were obtained from commercial sources and had appropriate IRB approval. All tumor tissues were subjected to review by a pathologist to confirm diagnosis and tumor content. Macro-dissection was performed on FFPE tumor tissue to enrich tumor percentage to greater than 70%. We also analyzed 69 cancer cell lines (Data file S1) and a Latin square design with dilution series of cell lines containing 8 known somatic mutations (Table S2). Genomic DNA was extracted from FFPE tumor tissue using the QIAamp FFPE kit (Qiagen) after deparaffinization with Envirene; genomic DNA was extracted from cell lines and FF tumors using the QIAamp kit (Qiagen). Process control genomic DNA was from the HapMap Consortium, purchased from the Coriell Institute for Medical Research (NA17317). Genomic DNA from normal human blood (buffy coat) was purchased from Roche (#11691112001). Genomic DNA from all samples was quantified using NanoDrop 2000.
FFPE DNA quality assessment by qPCR based ruler assay
We developed a FFPE DNA quality control ruler assay to quantitate the functional DNA copies in FFPE samples that are suitable for target enrichment by PCR. For this, we leveraged a Taqman copy number assay for the TRAK2 gene, with an amplicon length of 147 bp (Life Technologies, Assay ID: Hs00911853_cn), because 89% of our panels’ amplicons are < 150bp in length. We used standard the curve method for the TaqMan real-time PCR Assay (Life Technologies, protocol PN 4397425 Rev. C) to do absolute quantification of functional copy number, on the ViiA7 real-time PCR system. Human blood genomic DNA from normal controls (Roche, #11691112001) was used to prepare the standard curve. Average Ct from triplicate measurement of each sample was used for calculating functional DNA copy number.
Treatment of FFPE DNA with uracil-DNA glycosylase (UDG)
For UDG treatment, UDG (1 unit/reaction) and UDG buffer (New England BioLabs, Ipswich, MA) were directly added to DNA suspension buffer (TEKNOVA, Hollister, CA) in sample 96-
2
well plates. Reaction plates were incubated at 37ºC for 30 minutes for UDG treatment, followed by 95ºC for 5 minutes, for inactivation. The PCR master mix was then added into the same wells and followed by the standard thermal cycling protocol for the Fluidigm 48.48 Access Array IFC.
Selection of targeted genes and amplicon library design
Gene selection and primer design and pooling strategies are described in the main text. All target-specific primers were created using Fluidigm’s custom primer design service. Multiplex primer pools (10-12 primer pairs per pool) were generated based on in silico analysis of primer compatibility; considerations included partitioning overlapping amplicons into separate primer pools, minimizing the probability of primer dimer formation, and ensuring similarity of GC content with a single pool. All primers were validated by single-plex PCR and assessment of PCR products for expected size, on LabChip GX (Caliper Life Sciences). 98.4% of primer pairs validated at the single-plex level.
Microfluidic multiplex PCR target enrichment and barcoded genomic DNA library construction
The 963 amplicons targeting 88 genes were divided into two panels (480 for panel 1, 483 amplicons for panel 2) for target enrichment by Access Array (Fluidigm). The experiments were performed according to the Multiplex Amplicon Tagging Protocol from the manufacturer. In brief, there are three major steps: (i) thermal cycling of the 48.48 Access Array IFC, (ii) harvesting the 48.48 Access Array IFC and (iii) attaching sequence tags and sample barcodes (by PCR). After barcoding, products were between 200-300bp, with the majority ~250bp. LabChip GX from Caliper Life Sciences was used to examine 1 μl of the PCR products after the barcoding PCR reactions, to ensure expected size and sufficient quantity. For sample pooling, 1 μl of all 48 amplified, barcoded samples was pooled and subjected for further purification. PCR primers and non-specific products smaller than 150bp were removed by using 3x volume of Agencourt AMPure beads; the beads were eluted with 40 ul 0.1x TE buffer. Purified libraries were quantitated with the Quan-iT PicoGreen dsDNA assay kit (Invitrogen), and the size distribution was examined by Agilent Bioanalyzer 2100. The resulting sequencing-ready amplicon libraries were sequenced (2x10⁸bp) on an Illumina GAIIx (one library per lane, Expression Analysis) or MiSeq sequencer.
Pre-amplification and whole-genome amplification prior to target enrichment
For the 480-plex pre-amplification protocol, primer pairs from each panel were pooled. 75 ng of DNA from this pool was pre-amplified for 15 cycles according to the manufacturer’s instruction (Fluidigm, ADP29, PN 100-2988 A1). Products were then digested with ExoSAP-IT to destroy unused primers, diluted 10-fold, and finally submitted for target enrichment PCR on the Access Array IFC. For the whole-genome amplification protocol, the GenomePlex Complete Whole Genome Amplification Kit (Sigma-Aldrich, Cat# WGA2) was used to amplify 75ng genomic DNA. This was followed by QiaQuick column purification. 150ng of post-WGA DNA was for target enrichment PCR on the Access Array IFC.
3
Sequencing data alignment and primary variant calling
Prior to alignment, GAII FASTQs were created for each specimen by demultiplexing (fastq-multx) and then processing with fastq-mcf (ExpressionAnalysis EA-Utils 1.1.2-408, -p 5 -q 7, custom adapter file). Clipped FASTQs were paired-end aligned to the human genome (hg19) using BWA (2) (v. 0.6.2, -n 0.02 -l 12). To better handle indels, unaligned reads and their mate pairs were submitted for a second alignment using BWASW (3) (v. 0.6.2, -q 3 -r 1 -w 24 -s 2). PCR-based target enrichment strongly favors the reference base within the primer region, leading to downward bias in variant read frequency. To account for this, we trimmed sequence from the ends of aligned reads if it perfectly matched primers used for target enrichment. The resulting BAMs were used to create pileup files, using SAMtools (4) mpileup (v. 0.1.18, -d 100000 -B), which were used to call variants. A custom variant-caller, mpileup-variants (ExpressionAnalysis, software available upon request) was used to generate variant calls for each specimen. This caller required a minimum depth and base call quality of 20, ignored variants at the end of homopolymer stretches > 7bp in length, and reported variant with at least 1% variant read frequency. For MiSeq data produced for assessment of UDG treatment on FFPE samples, GSNAP was used for alignment and variant tallying (minimum base call quality score of 23) instead of BWA and mpileup (5). Variants were annotated for impact on RefSeq transcript models using Ensembl’s Variant Effect Predictor (6). All sequence data referenced in this manuscript have been deposited at the European Genome-phenome Archive (EGA, http://www.ebi.ac.uk/ega/), which is hosted by the EBI, under accession number EGAS00001000674.
Variant post-processing and final calls
Given our high average coverage, very low frequency candidate variants were numerous (see, e.g., Fig. 2A). Since these are both more subject to stochastic variability from one sample to the next and also less likely to be functionally relevant, we applied two additional post-processing filters when making final variant calls for paired FF/FFPE or endometrial tumor samples. First, to reduce the impact of a small number of poorly performing amplicons, we required at least 400 total reads. Second, we applied a more stringent minimum variant read frequency cutoff. For the FF/FFPE paired sample analysis, we used 10% (Fig. 2B). For the endometrial panel, we applied two different cutoffs: for the 340 well-characterized hotspot mutations known to have clinical relevance, we applied a high-sensitivity 2% cutoff; for all other candidates, we set a higher bar of 10%. Finally, for the endometrial panel, we restricted analysis to COSMIC-annotated candidates. For fully tiled genes (tumor suppressors and PIK3CA), two additional candidate classes of novel variants were also considered: (i) non-sense, frame shift, or insertion/deletion events which are likely to distrupt the protein; and (ii) mis-sense substitutions predicted to be deleterious by both SIFT (7) and PolyPhen2 (8).
Allele-specific qPCR genotyping
The allele-specific qPCR genotyping was performed as previously described (9).
4
Mass spectrometric genotyping
For assessment of Latin square variants, mass spectrometric genotyping was performed with the OncoCarta Panel v1.0 Kit (Sequenom, Catalog #10225) according to the manufacturer’s user guide. The panel consists of 24 multiplexed wells run on each sample, using 20ng of input DNA per well. Genotype calls were made use the OncoCarta Mutation Analysis Report, generated by Sequenom Typer 4.0 analyzer, and were confirmed by manual review. To validate alterations detected by MMP-Seq that were not included in the commercially available OncoCarta panels, custom primers and probes were designed using the Sequenom online Assay Design Suite 1.0 (https://www.mysequenom.com/Tools). Experiments were performed with the Complete iPLEX Pro Reagent Set (Catalog# 10217). Data were analyzed by Sequenom TyperViewer 4.0 software.
PTEN immunohistochemistry
PTEN IHC was conducted on FFPE tumor samples as previously described (10). The PTEN antibody was obtained from Cell Signaling Technologies (clone 138G6), and the assay was run on the Discovery platform (Ventana). PTEN staining was evaluated using an H-score method, to account for heterogeneity of expression: tumor cells were assigned a score of 0 (no staining), 1 (weak), 2 (moderate), or 3 (strong), and these values were averaged and multiplied by 100. A score of 0 indicates total absence of PTEN in the tumor compartment; a score of 300 indicates PTEN expression in tumor cells equivalent to surrounding normal and stromal cells.
5
Supplementary Figure 1
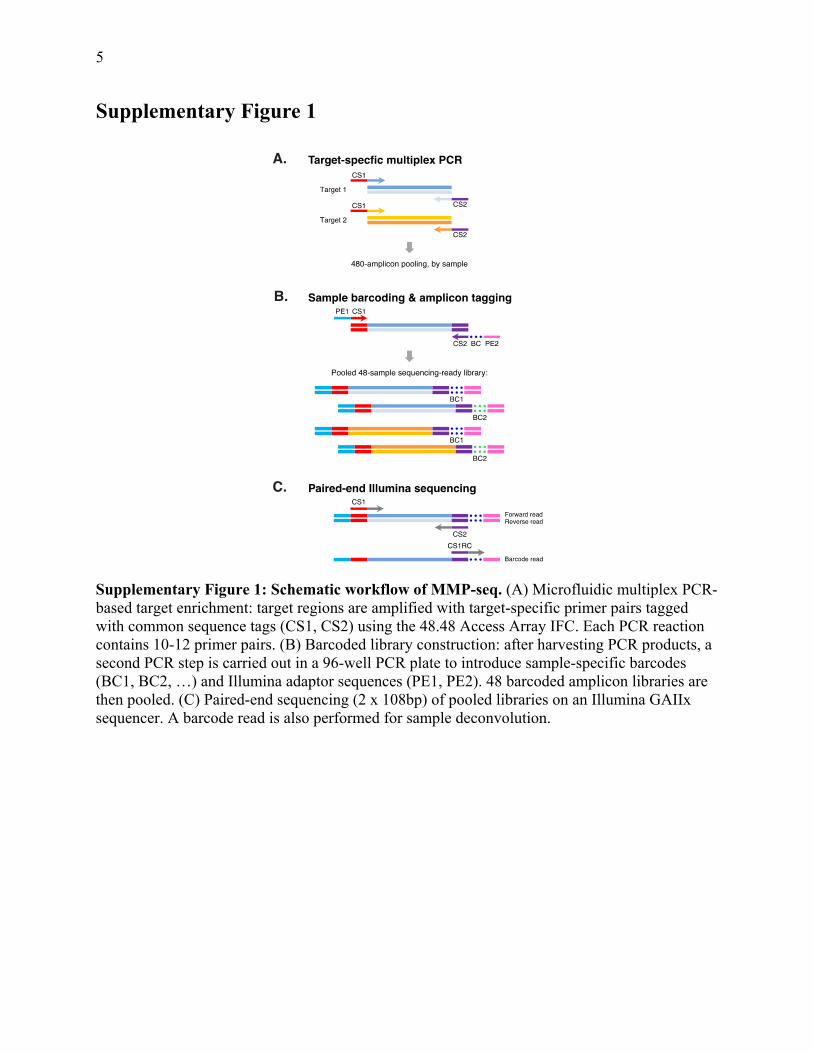
Supplementary Figure 1: Schematic workflow of MMP-seq. (A) Microfluidic multiplex PCR-based target enrichment: target regions are amplified with target-specific primer pairs tagged with common sequence tags (CS1, CS2) using the 48.48 Access Array IFC. Each PCR reaction contains 10-12 primer pairs. (B) Barcoded library construction: after harvesting PCR products, a second PCR step is carried out in a 96-well PCR plate to introduce sample-specific barcodes (BC1, BC2, …) and Illumina adaptor sequences (PE1, PE2). 48 barcoded amplicon libraries are then pooled. (C) Paired-end sequencing (2 x 10⁸bp) of pooled libraries on an Illumina GAIIx sequencer. A barcode read is also performed for sample deconvolution.
6
Supplementary Figure 2
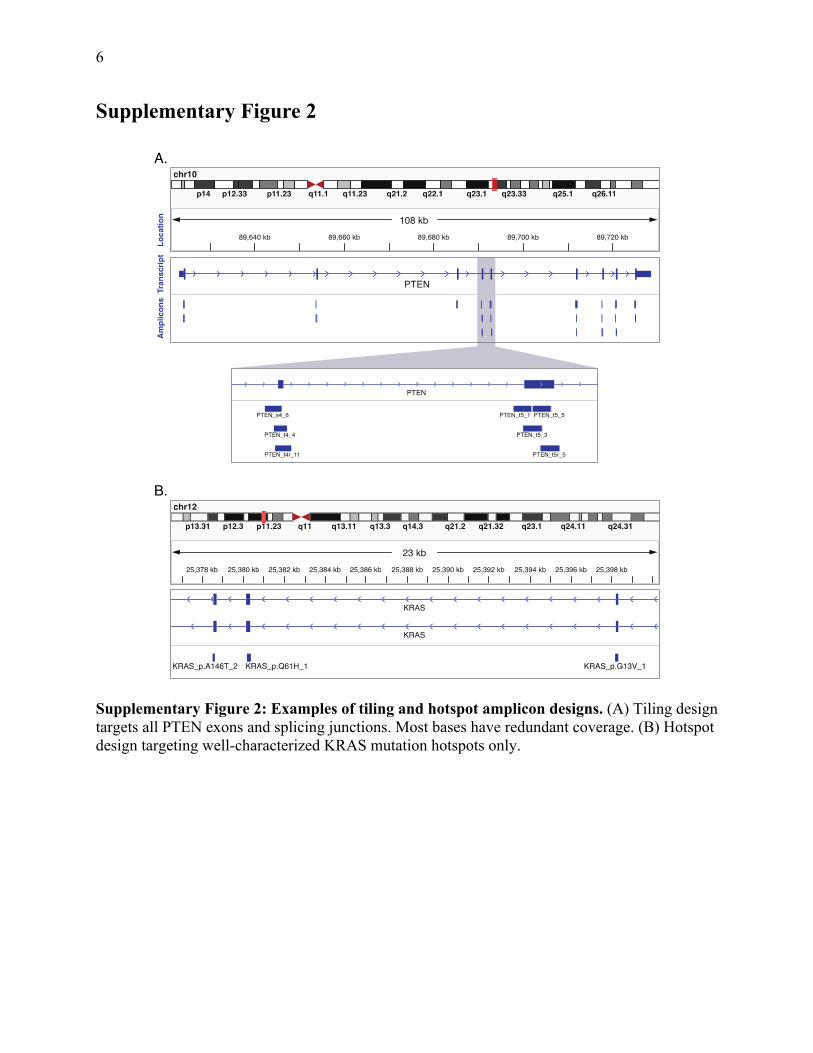
Supplementary Figure 2: Examples of tiling and hotspot amplicon designs. (A) Tiling design targets all PTEN exons and splicing junctions. Most bases have redundant coverage. (B) Hotspot design targeting well-characterized KRAS mutation hotspots only.
7
Supplementary Figure 3
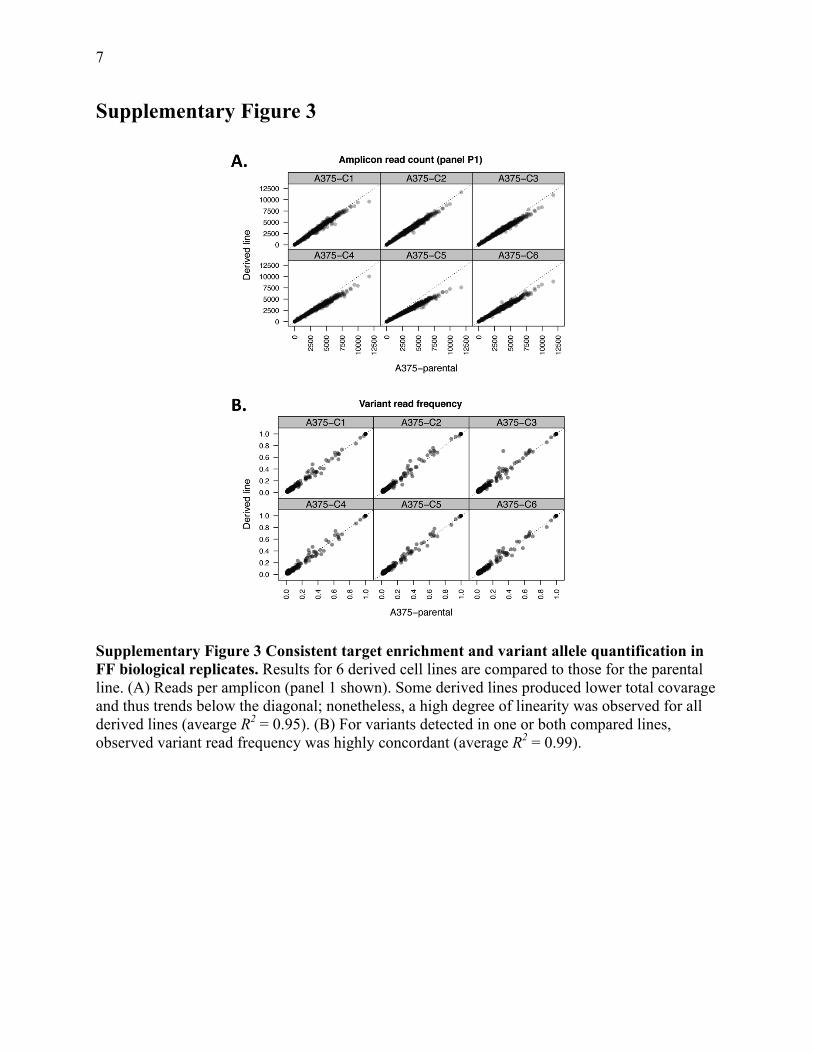
Supplementary Figure 3 Consistent target enrichment and variant allele quantification in FF biological replicates. Results for 6 derived cell lines are compared to those for the parental line. (A) Reads per amplicon (panel 1 shown). Some derived lines produced lower total covarage and thus trends below the diagonal; nonetheless, a high degree of linearity was observed for all derived lines (avearge R2 = 0.95). (B) For variants detected in one or both compared lines, observed variant read frequency was highly concordant (average R2 = 0.99).
8
Supplementary Figure 4
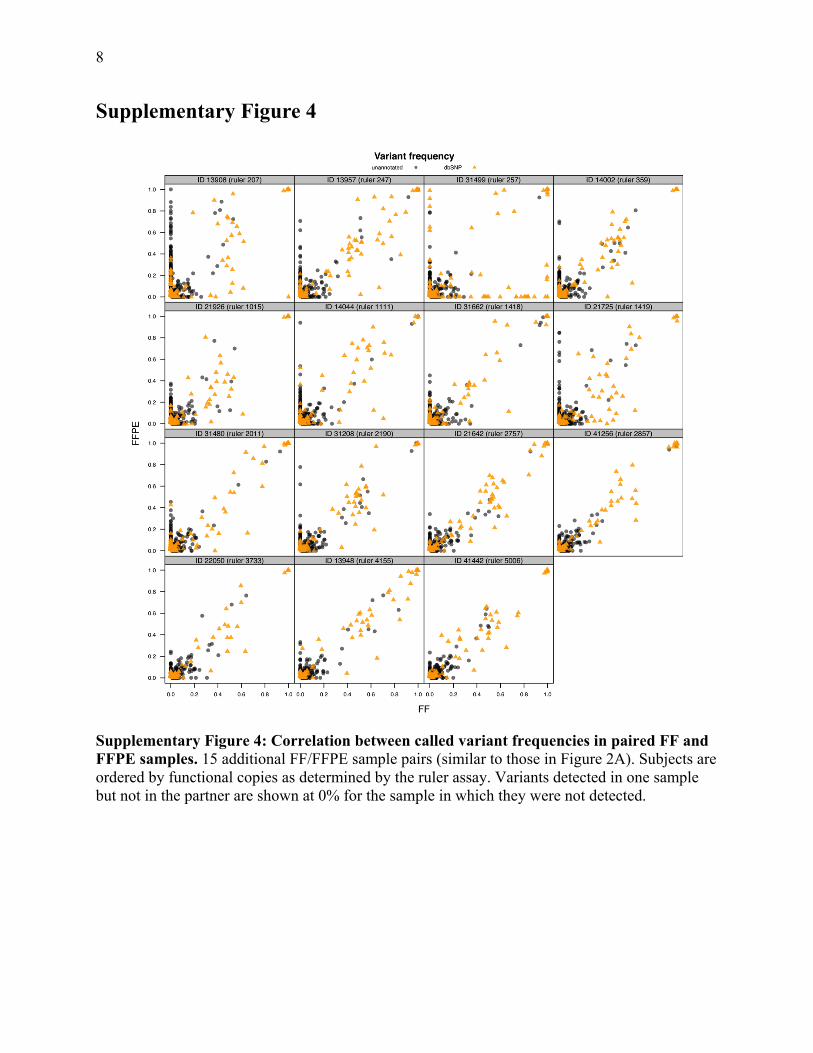
Supplementary Figure 4: Correlation between called variant frequencies in paired FF and FFPE samples. 15 additional FF/FFPE sample pairs (similar to those in Figure 2A). Subjects are ordered by functional copies as determined by the ruler assay. Variants detected in one sample but not in the partner are shown at 0% for the sample in which they were not detected.
9
Supplementary Figure 5
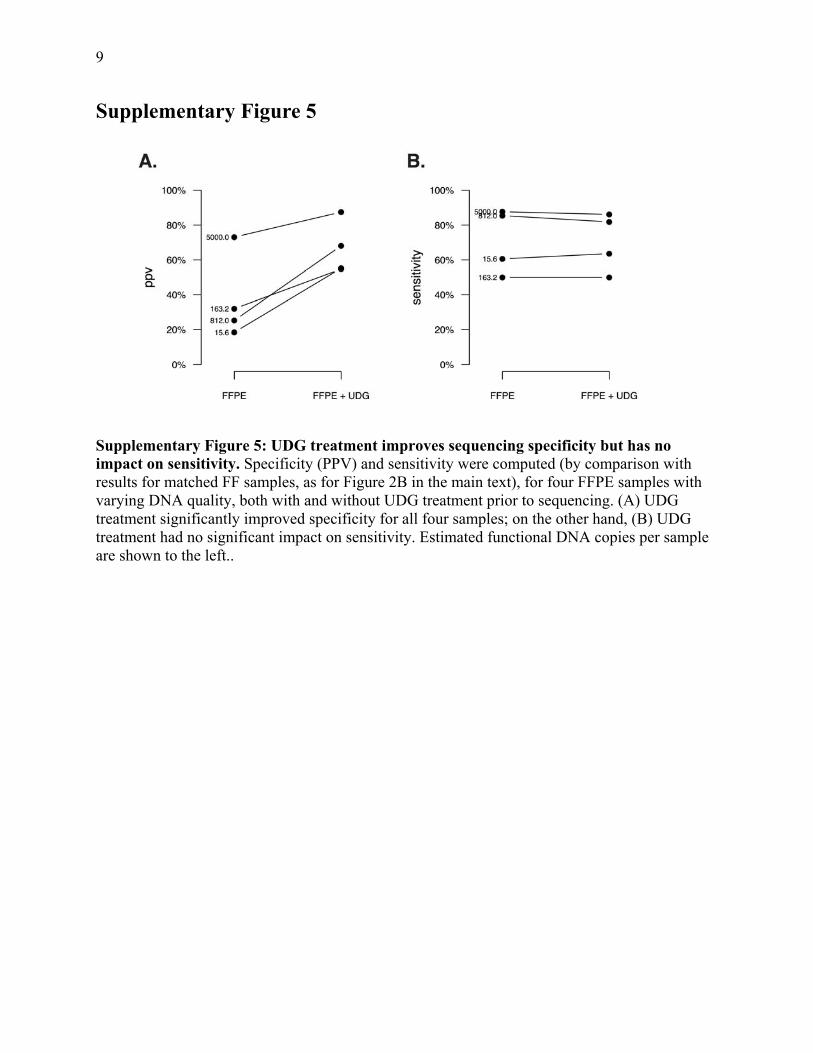
Supplementary Figure 5: UDG treatment improves sequencing specificity but has no impact on sensitivity. Specificity (PPV) and sensitivity were computed (by comparison with results for matched FF samples, as for Figure 2B in the main text), for four FFPE samples with varying DNA quality, both with and without UDG treatment prior to sequencing. (A) UDG treatment significantly improved specificity for all four samples; on the other hand, (B) UDG treatment had no significant impact on sensitivity. Estimated functional DNA copies per sample are shown to the left..
10
Supplementary Figure 6
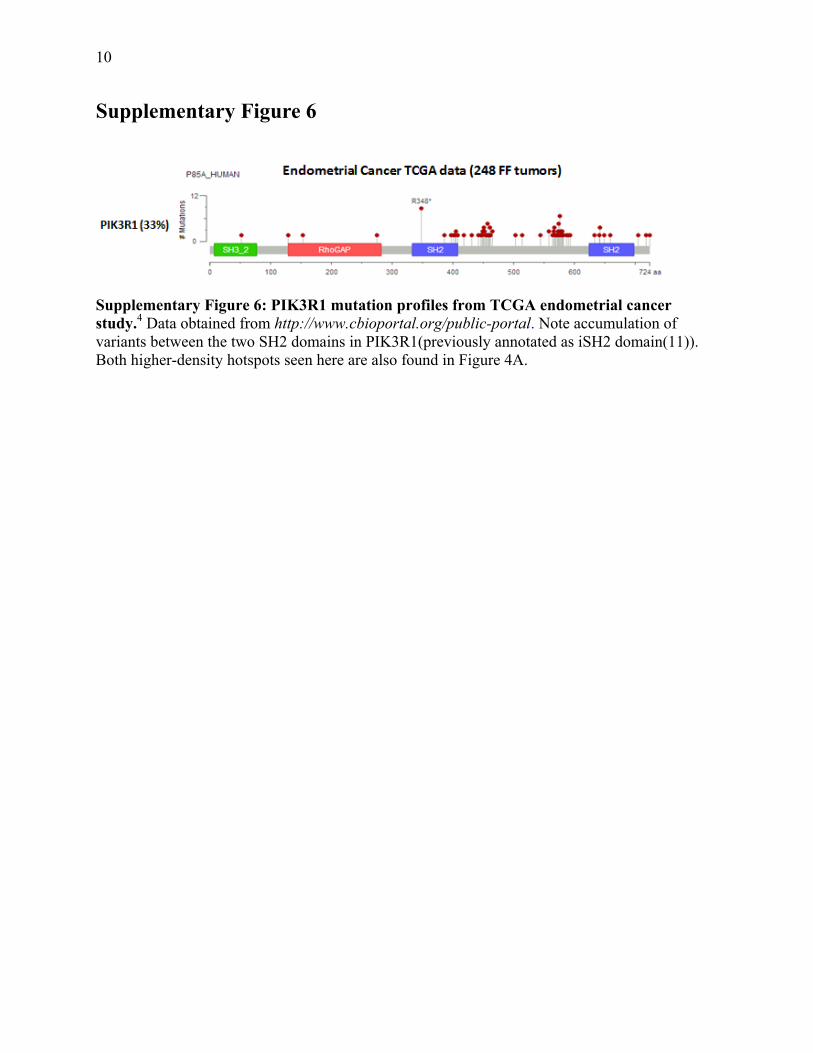
Supplementary Figure 6: PIK3R1 mutation profiles from TCGA endometrial cancer study.4 Data obtained from http://www.cbioportal.org/public-portal. Note accumulation of variants between the two SH2 domains in PIK3R1(previously annotated as iSH2 domain(11)). Both higher-density hotspots seen here are also found in Figure 4A.
11
Supplementary Table 1
A.
Tiled genes
APC BRCA1 CDKN1B CDKN2A NF2 PBRM1 PIK3CA PIK3R1 PIK3R2 PTEN RB1 SMAD4 SMARCA4 STK11 TP53 VHL
B.
Hotspot genes
ABL1 AKT1 AKT2 APOL1 ARFGEF2 BCL2 BRAF BRCA2 C11orf30 CAPN10 CCND2 CCNE1 CDK12 CDKL2 CHEK2 CNTN1 COL3A1 CSMD1 CSNK1D CTNNB1 DTNB EGFL6 EGFR EPHA8 EPHB1 ERBB2 ERCC1 FBXW7 FGFR1 FGFR2 FGFR3 FKBP9 FLT3 GEN1 GNAQ GNAS GUCY2F HRAS IDH1 IDH2 IKBKB JAK2 KIT KRAS MAG MAGEE1 MAP4K1 MAPK13 MET NF1 NOTCH3 NRAS NRK PAK7 PDGFRA PKN1 PRKAA2 PRPF4B PSMA2 RET SMO SORL1 SPO11 TECTA TEK TESK1 TESK2 TRIO TSC22D4 TTN UBR5 WNK1
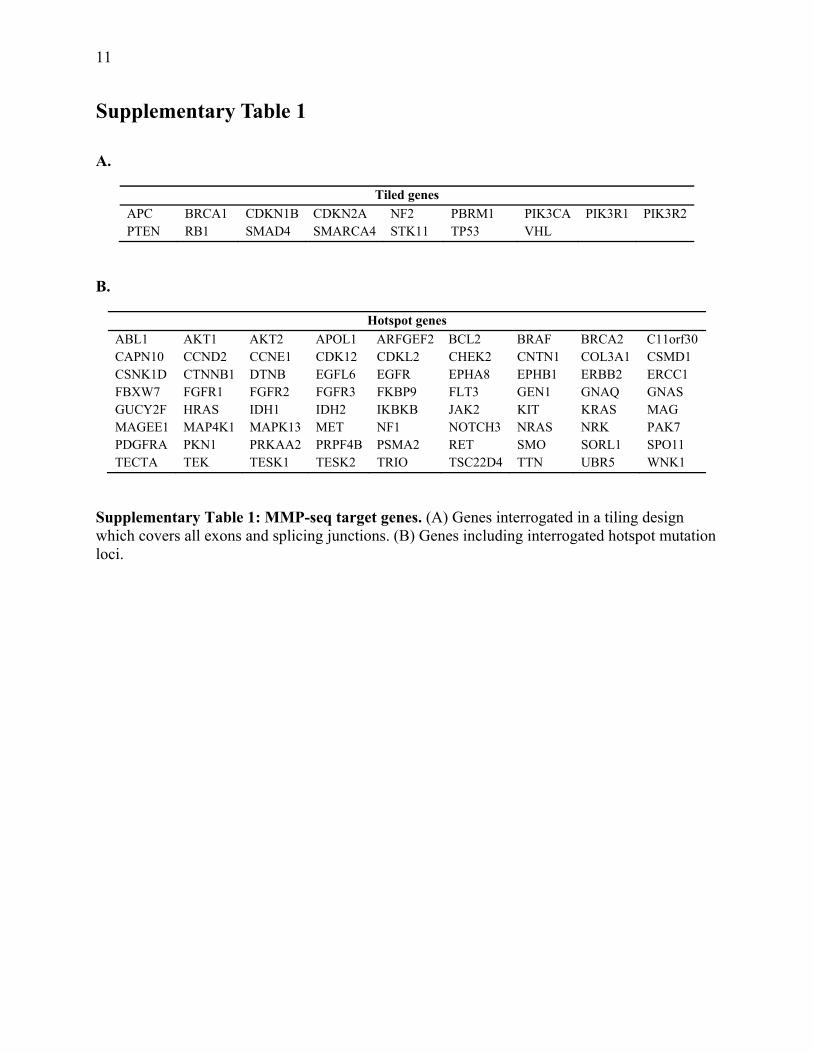
Supplementary Table 1: MMP-seq target genes. (A) Genes interrogated in a tiling design which covers all exons and splicing junctions. (B) Genes including interrogated hotspot mutation loci.
12
Supplementary Table 2
A.
Cell line Mutation LSQ 1 LSQ 2 LSQ 3 LSQ 4 LSQ 5 LSQ 6 LSQ 7 LSQ 8
SK-MEL-28 BRAF V600E 2.5% 1.3% 0.6% 40.0% 20.0% 10.0% 5.0% 12.5%NCI-H1975 EGFR T790M 10.0% 5.0% 2.5% 1.3% 0.6% 40.0% 20.0% 12.5%NCI-H1975 EGFR L858R 10.0% 5.0% 2.5% 1.3% 0.6% 40.0% 20.0% 12.5%NCI-H1650 EGFR E746-A750Δ 20.0% 10.0% 5.0% 2.5% 1.3% 0.6% 40.0% 12.5%AsPC-1 KRAS G12D 40.0% 20.0% 10.0% 5.0% 2.5% 1.3% 0.6% 12.5%MEL-JUSO NRAS Q61L 0.6% 40.0% 20.0% 10.0% 5.0% 2.5% 1.3% 12.5%MCF-7 PIK3CA E545K 5.0% 2.5% 1.3% 0.6% 40.0% 20.0% 10.0% 12.5%MDA-MB-453 PIK3CA H1047R 1.3% 0.6% 40.0% 20.0% 10.0% 5.0% 2.5% 12.5%Normal Wild type 20.6% 20.6% 20.6% 20.6% 20.6% 20.6% 20.6% 20.6%
B.
Cell line Mutation LSQ 1 LSQ 2 LSQ 3 LSQ 4 LSQ 5 LSQ 6 LSQ 7 LSQ 8
SK-MEL-28 BRAF V600E 2.5% 1.2% 0.6% 39.7% 19.8% 9.9% 5.0% 12.4%NCI-H1975 EGFR T790M 4.6% 2.3% 1.1% 0.6% 0.3% 18.2% 9.1% 5.7%NCI-H1975 EGFR L858R 6.6% 3.3% 1.6% 0.8% 0.4% 26.3% 13.1% 8.2%NCI-H1650 EGFR E746-A750Δ 13.9% 6.9% 3.5% 1.7% 0.9% 0.4% 27.8% 8.7%AsPC-1 KRAS G12D 40.0% 20.0% 10.0% 5.0% 2.5% 1.3% 0.6% 12.5%MEL-JUSO NRAS Q61L 0.2% 13.2% 6.6% 3.3% 1.6% 0.8% 0.4% 4.1%MCF-7 PIK3CA E545K 2.9% 1.5% 0.7% 0.4% 23.2% 11.6% 5.8% 7.3%MDA-MB-453 PIK3CA H1047R 0.9% 0.5% 30.2% 15.1% 7.6% 3.8% 1.9% 9.5%
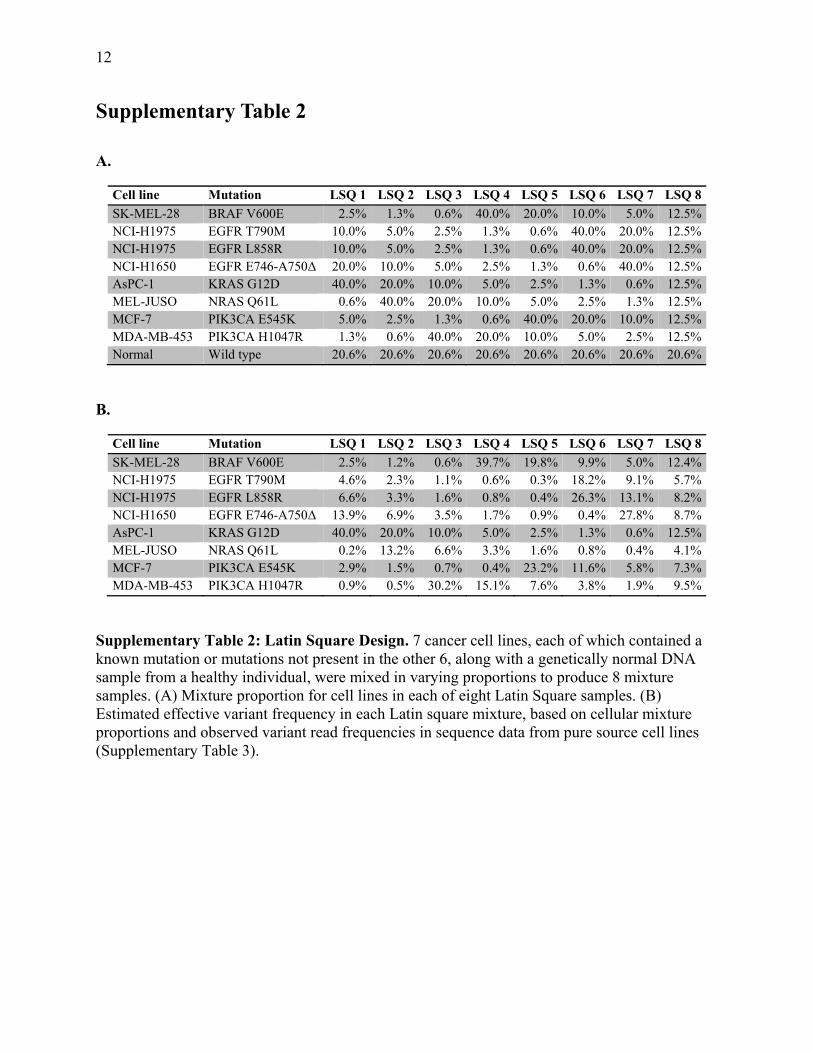
Supplementary Table 2: Latin Square Design. 7 cancer cell lines, each of which contained a known mutation or mutations not present in the other 6, along with a genetically normal DNA sample from a healthy individual, were mixed in varying proportions to produce 8 mixture samples. (A) Mixture proportion for cell lines in each of eight Latin Square samples. (B) Estimated effective variant frequency in each Latin square mixture, based on cellular mixture proportions and observed variant read frequencies in sequence data from pure source cell lines (Supplementary Table 3).
13
Supplementary Table 3
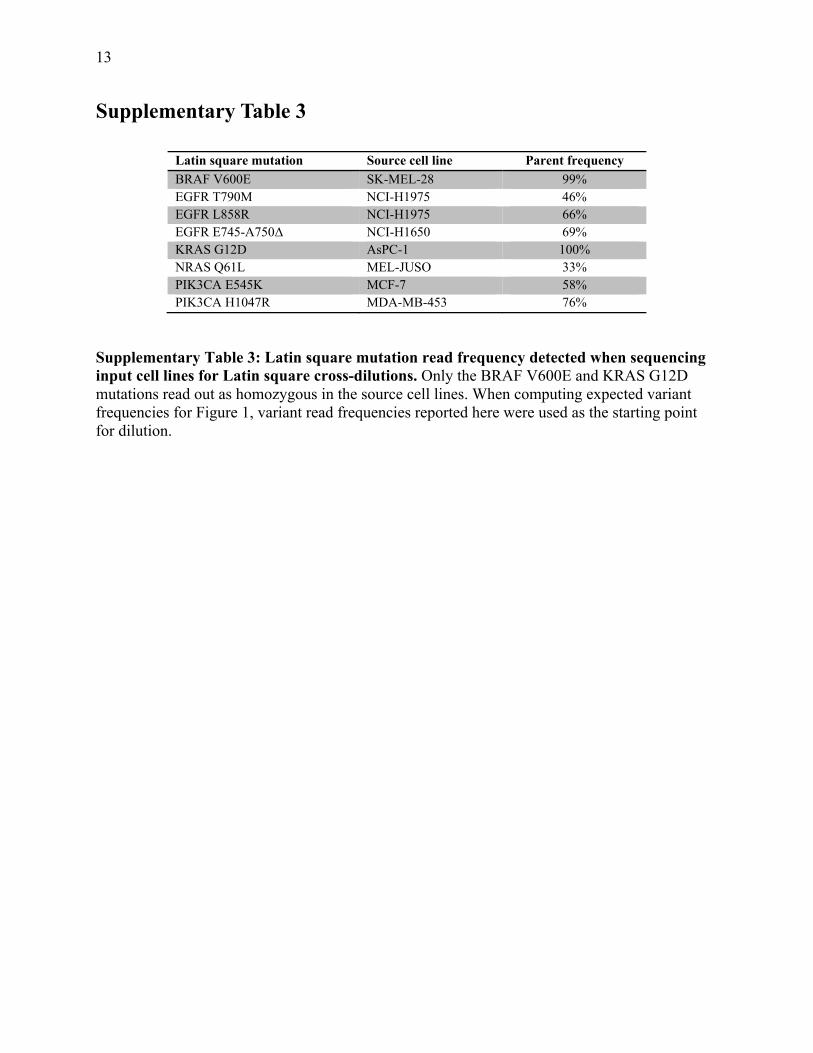
Latin square mutation Source cell line Parent frequency
BRAF V600E SK-MEL-28 99% EGFR T790M NCI-H1975 46% EGFR L858R NCI-H1975 66% EGFR E745-A750Δ NCI-H1650 69% KRAS G12D AsPC-1 100% NRAS Q61L MEL-JUSO 33% PIK3CA E545K MCF-7 58% PIK3CA H1047R MDA-MB-453 76%
Supplementary Table 3: Latin square mutation read frequency detected when sequencing input cell lines for Latin square cross-dilutions. Only the BRAF V600E and KRAS G12D mutations read out as homozygous in the source cell lines. When computing expected variant frequencies for Figure 1, variant read frequencies reported here were used as the starting point for dilution.
14
Supplementary Table 4
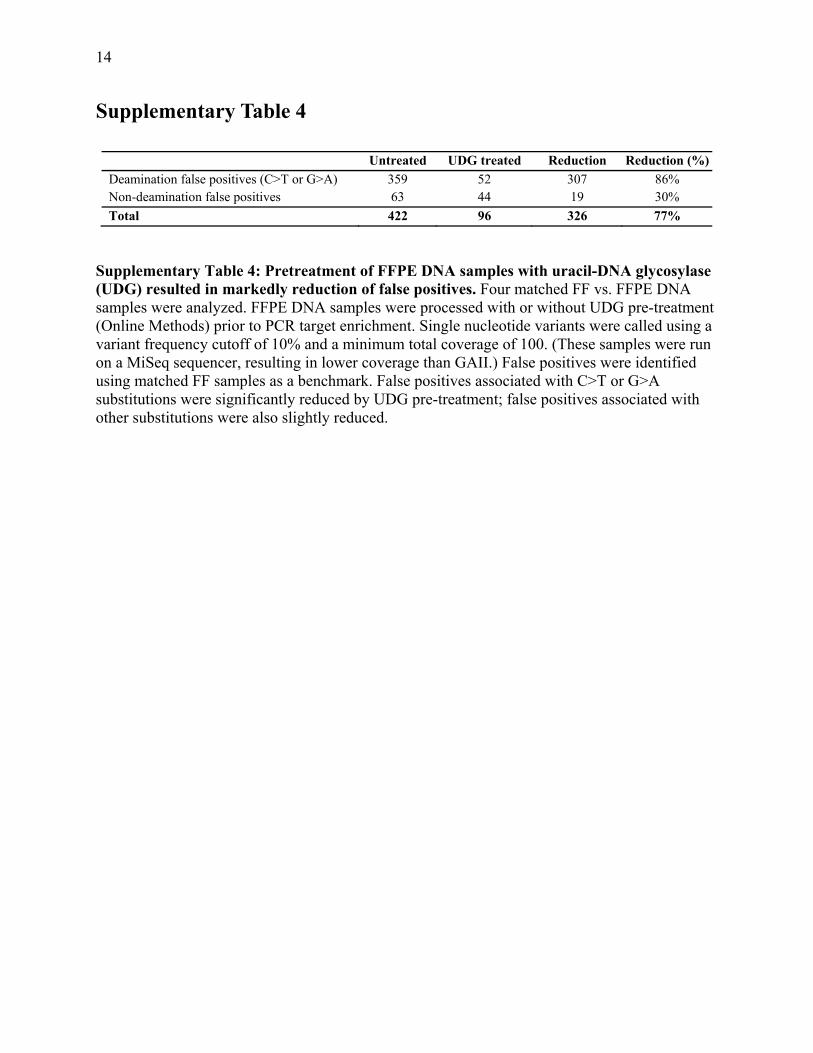
Untreated UDG treated Reduction Reduction (%)
Deamination false positives (C>T or G>A) 359 52 307 86% Non-deamination false positives 63 44 19 30%
Total 422 96 326 77%
Supplementary Table 4: Pretreatment of FFPE DNA samples with uracil-DNA glycosylase (UDG) resulted in markedly reduction of false positives. Four matched FF vs. FFPE DNA samples were analyzed. FFPE DNA samples were processed with or without UDG pre-treatment (Online Methods) prior to PCR target enrichment. Single nucleotide variants were called using a variant frequency cutoff of 10% and a minimum total coverage of 100. (These samples were run on a MiSeq sequencer, resulting in lower coverage than GAII.) False positives were identified using matched FF samples as a benchmark. False positives associated with C>T or G>A substitutions were significantly reduced by UDG pre-treatment; false positives associated with other substitutions were also slightly reduced.

16
References
1. Aronesty E. Comparison of Sequencing Utility Programs. The Open Bioinformatics Journal. 2013;7.
2. Li H, Durbin R. Fast and accurate short read alignment with Burrows-Wheeler transform. Bioinformatics. 2009;25:1754-60.
3. Li H, Durbin R. Fast and accurate long-read alignment with Burrows-Wheeler transform. Bioinformatics. 2010;26:589-95.
4. Li H, Handsaker B, Wysoker A, Fennell T, Ruan J, Homer N, et al. The Sequence Alignment/Map format and SAMtools. Bioinformatics. 2009;25:2078-9.
5. Wu TD, Nacu S. Fast and SNP-tolerant detection of complex variants and splicing in short reads. Bioinformatics. 2010;26:873-81.
6. McLaren W, Pritchard B, Rios D, Chen Y, Flicek P, Cunningham F. Deriving the consequences of genomic variants with the Ensembl API and SNP Effect Predictor. Bioinformatics. 2010;26:2069-70.
7. Ng PC, Henikoff S. SIFT: Predicting amino acid changes that affect protein function. Nucleic acids research. 2003;31:3812-4.
8. Adzhubei IA, Schmidt S, Peshkin L, Ramensky VE, Gerasimova A, Bork P, et al. A method and server for predicting damaging missense mutations. Nature methods. 2010;7:248-9.
9. Patel R, Tsan A, Tam R, Desai R, Schoenbrunner N, Myers TW, et al. Mutation Scanning Using MUT-MAP, a High-Throughput, Microfluidic Chip-Based, Multi-Analyte Panel. PloS one. 2012;7:e51153.
10. Jubb AM, Strickland LA, Liu SD, Mak J, Schmidt M, Koeppen H. Neuropilin-1 expression in cancer and development. The Journal of pathology. 2012;226:50-60.
11. Huang CH, Mandelker D, Schmidt-Kittler O, Samuels Y, Velculescu VE, Kinzler KW, et al. The structure of a human p110alpha/p85alpha complex elucidates the effects of oncogenic PI3Kalpha mutations. Science. 2007;318:1744-8.