Embed Size (px)
Citation preview

www.sciencetranslationalmedicine.org/cgi/content/full/3/93/93ra67/DC1
Supplementary Materials for
Photoactivated Composite Biomaterial for Soft Tissue Restoration in Rodents and in Humans
Alexander T. Hillel, Shimon Unterman, Zayna Nahas, Branden Reid, Jeannine M.
Coburn, Joyce Axelman, Jemin J. Chae, Qiongyu Guo, Robert Trow, Andrew Thomas, Zhipeng Hou, Serge Lichtsteiner, Damon Sutton, Christine Matheson, Patricia Walker,
Nathaniel David, Susumu Mori, Janis M. Taube, Jennifer H. Elisseeff*
*To whom correspondence should be addressed. E-mail: [email protected]
Published 27 July 2011, Sci. Transl. Med. 3, 93ra67 (2011) DOI: 10.1126/scitranslmed.3002331
The PDF file includes:
Materials and Methods Fig. S1. PEG-HA composite materials maintain their shape in vivo. Fig. S2. No bacterial infection was noted in rodent or human implants. Fig. S3. Effect of HA on collagen production by human foreskin fibroblasts. Table S1. Rheological characterization of PEG-HA and soft tissues. Table S2. Swelling ratio and compression modulus of photocrosslinked PEG-HA fillers compared to a PEG-only control. References

SUPPLEMENTARY MATERIALS AND METHODS
Characterization of hydrogel crosslinking density
The crosslinking densities of PEG-HA and PEG hydrogels were measured by swelling
ratio and elastic modulus. Following polymerization, hydrogels were weighed and placed
in PBS. The gels were weighed again after two days of equilibration and swelling. The
ratio between the 48-h wet weight and the post-polymerization wet weight was calculated
to yield a wet-to-wet weight swelling ratio (ww/ww). To separately assess the effects of
PEG concentration on crosslinking density, PEG constructs of various PEG doses
(PEG100, PEG80, PEG60, and PEG40) were frozen, lyophilized, and weighed. The ratio
between the swollen weight and the lyophilized weight yielded a wet-to-dry weight
swelling ratio (ww/dw).
Compression modulus was measured for PEG100, PEG100-HA24, and PEG100-
HA20 hydrogels to correlate swelling data with mechanical properties. Following 2 days
of equilibration in PBS, hydrogels were compressed between two parallel plates using a
Bose EnduraTec Elf 3200 (Bose Corporation, Framingham, MA). Compression was
applied at a constant rate of 1 mm/s to reach 10% of the initial material height. Stress and
strain were calculated from force-displacement data using material geometry.
Compression modulus was obtained from the linear portion of the stress-strain curve.
Implant reversibility in vivo
Reversibility of PEG-HA implants was assessed by varying the amount of PEG (20, 40,
or 100 mg) and concentration of HA formulations. PEG was combined with the

photoinitiator and added to 1 ml of HA5 and compared with control HA5 implants. Two
hundred µl of each formulation were injected (n = 5) into the dorsal subcutaneous space
of a rat. To test reversibility, 150 µl hyaluronidase (30 U dissolved in phosphate buffer,
Vitrase, Ista Pharmaceuticals, Irvine, CA) was injected into implants 1 day after
photocrosslinking. A second 150-µl hyaluronidase injection was performed on day 30.
Change in implant volume was monitored using a caliper and compared with that of
controls, which received an injection of PBS (pH 7.2, 0.01 M; Invitrogen). To assess
longer-term reversibility in vivo of implants with high PEG and high HA content, 200 µl
of PEG100-HA20 (n = 4) and 200 µl of HA20 (n = 4) were injected into rats. After 6
months of measuring persistence, implants were injected with 150 µl hyaluronidase and
followed for another 6 months.
In vitro fibroblast culture
Human foreskin fibroblasts (HS27, ATCC, Manassas, VA) were cultured for 6 days in
standard medium containing Dulbecco’s Modified Eagle’s Medium (DMEM;
Invitrogen), 10% fetal bovine serum (Hyclone, Logan, UT), 1 mM L-glutamine
(Invitrogen), and 1% penicillin/streptomycin (Invitrogen). Medium was supplemented
with either 5 mg/ml chondroitin sulfate (New Zealand Pharmaceuticals, Palmerston
North, New Zealand) or 1 or 5 mg/ml of linear unmodified HA (980 kDa; Lifecore,
Chaska, MN). Medium changes occurred every 2 days. After cells reached confluency on
10 cm tissue culture dishes, expansion medium was aspirated and cells were rinsed with
phosphate-buffered saline. Cells were fixed in 10% formalin for immunostaining or
extracted in Trizol (Sigma) for transcription analysis.

Immunostaining was carried out with antibodies to procollagen I (Fitzgerald) at
1:100 dilution using standard protocols and stained with horseradish peroxidase using the
Histostain SP kit (Invitrogen). Stained cells were imaged using light microscopy.
RNA was extracted and reverse-transcribed using the SuperScript First Strand
Synthesis System (Invitrogen). Real-time PCR was performed using a StepOne Plus
system and the SYBR Green PCR Master Mix (Applied Biosystems, Carlsbad, CA).
mRNA was reverse transcribed and cDNA was amplified for TGF-β1, TGF-β3, and type
I collagen, which were normalized to β-actin levels, and relative expression was
calculated using the 2-∆∆Ct method. Primer sequences for each target were: TGF-β1, 5’-
TGACAAGTTCAAGCAGAGTACACACA-3’ (forward), 5’-AGAGCAACACGGG-
TTCAGGTA-3’ (reverse); TGFβ-3, 5’-ATCACCACAACCCTCATCTAATCCT-3’
(forward), 5’-CCTGGCCCGGGTTGTC-3’ (reverse); type I collagen, 5’-AGGGCCAA-
GACGAAGACATC-3’ (forward), 5’-AGATCACGTCATCGCACAACA-3’ (reverse);
β-actin, 5’-TGGCACCACACCTTCTACAATGAGC-3’ (forward), 5’-GCACAGCTTC-
TCCTTAATGTCACGC-3’ (reverse).

SUPPLEMENTARY FIGURES
Fig. S1. PEG-HA composite materials maintain their shape in vivo. (A) PEG-HA implants produced substantially improved height persistence in a PEG dose-dependent manner. Data are means ± SEM (n = 4). PEG100-HA5, PEG40-HA5, and PEG20-HA5 correspond with the addition of 100, 40, and 20 mg of PEG in the photocrosslinked implants (Table 1). (B to D) Improved height persistence was noted for all three composite PEG100-HA implants compared with HA for at least 210 days. Asterisks (*) denotes first time point of significance between the two groups, with all subsequent points displaying significance. *P < 0.05, **P < 0.01, ***P < 0.001, unpaired Student’s t test. Data are means ± SEM (HA5, n = 4; HA20, n = 5; HA24, n = 20). (E and F) Photocrosslinked PEG-HA5 implants were partially reversible in a PEG-dose–dependent manner by hyaluronidase injections Significance was determined compared to pre-injection volume: *P < 0.05, **P < 0.01, unpaired Student’s t test. Data are means ± SEM (n = 5). (G and H) Decrease in volume (G) and height (H) of implants over time after hyaluronidase injection (marked by arrow).
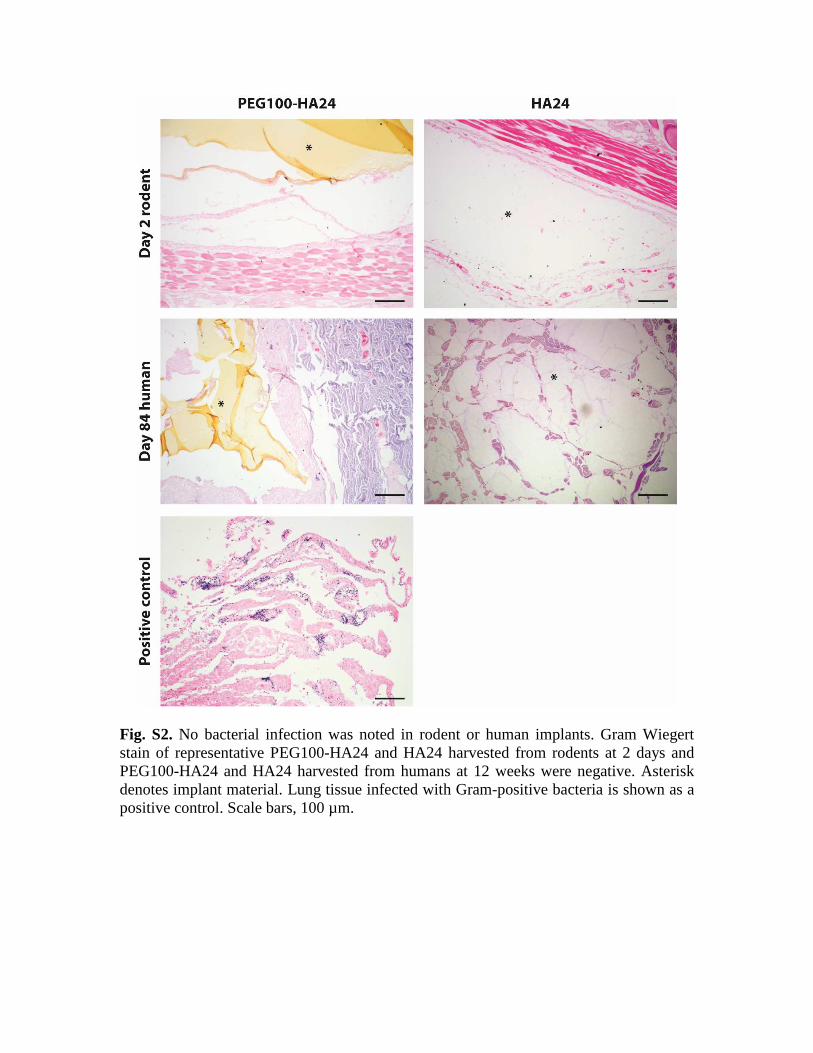
Fig. S2. No bacterial infection was noted in rodent or human implants. Gram Wiegert stain of representative PEG100-HA24 and HA24 harvested from rodents at 2 days and PEG100-HA24 and HA24 harvested from humans at 12 weeks were negative. Asterisk denotes implant material. Lung tissue infected with Gram-positive bacteria is shown as a positive control. Scale bars, 100 µm.

Fig. S3. Effect of HA on collagen production by human foreskin fibroblasts. (A and B) Procollagen staining of human HS27 foreskin fibroblasts cultured for 6 days without (A) or with (B) unmodified linear HA (980 kDa). Scale bars, 100 µm. (C to E) Human fibroblasts were cultured in the presence of medium only (control), HA (1 or 5 mg/ml), or chondroitin sulfate (CS; 5 mg/ml). Expression of type I collagen (C), TGFβ-1 (D), and TGFβ-3 (E) was normalized to β-actin levels and medium-only controls. *P < 0.05, unpaired Student’s t test. Data are means ± SEM (n = 3).

SUPPLEMENTARY TABLES
Table S1. Rheological characterization of PEG-HA and soft tissues. Elastic moduli (G’) of PEG100-HA20, PEG40-HA20, HA20, and human adipose tissue were tested (n = 4) and compared to literature values for other soft tissues. Data are shown as means ± SD, when available. Elastic modulus G' (kPa) Reference
HA20 0.163 ± 0.019 This study
PEG40-HA20 1.12 ± 0.11 This study
PEG100-HA20 11.7 ± 1.4 This study
Human adipose tissue 14.5 ± 0.9 This study
Rat fat pad 1.01 (S1)
Human adipose tissue 11 (S2)
Human skin 0.3619 ± 0.0937 (S3)
Human cartilage 106 (S4)

Table S2. Swelling ratio and compression modulus of photocrosslinked PEG-HA fillers compared to a PEG-only control. Data are means ± SD (n = 4). Sample PEG amount Swelling ratio Swelling ratio
(mg) (ww/dw) (ww/ww)
Compression modulus
(kPa)
PEG 100 10.41 ± 0.07 1.017 ± 0.003 113 ± 8
80 12.74 ± 1.04 1.017 ± 0.005
60 15.15 ± 0.27 0.9989 ± 0.0060
40 21.14 ± 0.46 0.9945 ± 0.0080
PEG-HA5 100 1.087 ± 0.020
40 1.287 ± 0.023
PEG-HA20 100 1.478 ± 0.032 23.3 ± 2.2
40 Not measurable
PEG-HA24 100 1.774 ± 0.033 49.1 ± 5.1
40 Not measurable

SUPPLEMENTARY REFERENCES
S1. A. Borzacchiello, L. Mayol, P. A. Ramires, A. Pastorello, C. Di Bartolo, L. Ambrosio, E. Milella, Structural and rheological characterization of hyaluronic acid-based scaffolds for adipose tissue engineering. Biomaterials 28, 4399 (2007).
S2. P. N. Patel, C. K. Smith, C. W. Patrick, Jr., Rheological and recovery properties of poly(ethylene glycol) diacrylate hydrogels and human adipose tissue. J. Biomed. Mater. Res. Part A 73, 313 (2005).
S3. B. Holt, A. Tripathi, J. Morgan, Viscoelastic response of human skin to low magnitude physiologically relevant shear. J. Biomech. 41, 2689 (2008).
S4. M. Stading, R. Langer, Mechanical shear properties of cell-polymer cartilage constructs. Tissue Eng. 5, 241 (1999).